the determinants of collective action in irrigation...
TRANSCRIPT
Meikai University Discussion Paper 2017-001
The Determinants of Collective Action in Irrigation
Management Systems: Evidence from Rural Communities
in Japan
Taisuke Takayama (Meikai University)
Hirotaka Matsuda
(The University of Tokyo)
Tomoaki Nakatani (Hokkaido University)
April 2017; revised in July 2017

The Determinants of Collective Action in Irrigation
Management Systems: Evidence from Rural Communities
in Japan
Taisuke Takayama1 Hirotaka Matsuda2 Tomoaki Nakatani3
Abstract
We examine the characteristics of WUAs (Water User Associations) that affect the success of irrigation management by using a large panel dataset of rural communities. We introduce an objective indicator to denote different levels of collective action for irrigation management. The result of the econometric analysis verifies the hypotheses of the existing empirical literature and confirms the robustness of the theory of collective action in the context of irrigation management. Our results show that the collective action for irrigation management depends on the distance from the market, area of paddy field, share of non-farmers and elderly farmers, share of paddy field, and social capital. We also find that the number of farm households, diversity of farmer’s landholdings, and diversity among a community’s farmers have a curvilinear effect on the level of collective action for irrigation management. Furthermore, we find an inverted U-shaped relationship with the number of farm households and diversity in farmer’s landholdings, and a U-shaped relationship with the diversity of a community’s farmers. Therefore, policies aimed at suppressing deteriorating collective action for irrigation management need to enhance social ties in a community, as the characteristics of irrigation systems and user groups can hardly change in the short run. Keywords: collective action, irrigation management system, water user association, Japan JEL: O15, Q25
1 Corresponding Author, Meikai University; Email: [email protected] 2 The University of Tokyo 3 Hokkaido University
1. Introduction
� � Irrigation systems are common-pool resources characterized by rivalry of
consumption and difficulty of exclusion. They have been utilized as a typical case for
analyzing collective action in the common-pool resources literature. As a result of the
nature of irrigation systems, a free rider problem occurs in irrigation management as it
is often hard to exclude particular users from irrigation systems. In addition, when
anyone can access the irrigation system, without a proper management, the resources
are overexploited and depleted. Collective action is a way to resolve these problems and
use a resource in a sustainable way (Ostrom, 1990). In particular, the collective action
for irrigation management is based on farmers’ collective effort or cooperation, such as
joint maintenance of canal under customary rules, and the establishment of shared
norms in rural communities or water user associations (WUAs) to restrict open access.
A number of case studies highlighted the success of collective action in the case of
water user associations (WUAs) for irrigation management in developing countries
(Ostrom, 1990; Tang, 1992), although collective action faces some difficulties in term
of organizing resource users, monitoring, and enforcing the rules. An increasing body of
literature discussed the determinants of the success of the management of irrigation
systems and described such systems in detail. The robustness of those results needs to
be confirmed in order to identify the characteristics of WUAs that proved successful in
managing local irrigation systems. However, regardless a large number of case studies,
the small sample size, the specialization of successful case studies, and the use of
different independent variables negatively affected the robustness of the results.
� � � In this study, we examine the characteristics of WUAs that affect the success of
irrigation management by using a large panel dataset of rural communities. Empirical
studies focusing on the irrigation system of different countries identified many factors
affecting irrigation management, such as different governance systems, user group’s
characteristics, and resource system characteristics (Bardhan, 2000; Dayton-Johnson,
2000; Meinzen-dick and Raju, 2002; Fujiie et al., 2005; Araral, 2009; Gorton et al.,
2009; Nakano and Otsuka, 2011; Ito, 2012; Takeda, 2015; Nagrah et al., 2016; Wang et
al., 2016). The literature recognized more than 36 factors as essential (Ostrom, 1993;

Agarwal, 2001), but no consensus has been reached yet about the direction, size, and
significance of their impact on irrigation management. The lack of consensus among
previous studies can be largely attributed to methodological issues, such as the cost and
difficulty of collecting data (Araral, 2009). This study aims to address these issues.
� � � First, most empirical studies on irrigation management rely on cross-sectional
data due to the difficulty of collecting information over the long term. Studies based on
cross-sectional data cannot control for time-invariant unobserved characteristics of a
WUA, such as its history of irrigation management or the quality of the WUA itself, and
they potentially suffer from an omitted variable bias. Analyses based on panel data may
help address this issue by controlling for unobservable characteristic of irrigation
systems and WUAs. One of the main contributions of this study is to provide an
opportunity to test the robustness of the findings regarding the characteristics of WUAs
that proved successful in managing irrigation systems by using a large panel dataset (N
= 209,046; 2 periods). Second, most empirical studies on irrigation management do not
specify, or incorrectly define, the nature of the collective action problem (Poteete and
Ostrom, 2004; Araral, 2009). For instance, most studies use a subjective indicator,
measured by “good” or “bad,” to evaluate the outcome or status of successful collective
action, such as the level of activity of WUAs or the maintenance level of irrigation
channels (Nakano and Otsuka, 2011). Indicators with subjective appraisal cannot
precisely measure the exact levels of collective action in the irrigation management. In
this study, we use an objective indicator of irrigation management systems to denote
different levels of collective action for irrigation management. This indicator is
observable and provides objective information on the status of collective action. Third,
many empirical studies discarded a particular group of observations, such as
non-functional irrigation associations (Araral, 2009), potentially causing a censoring
bias (Meinzen-Dick, 2007; Poteete and Ostrom, 2008). In this study, we included
WUAs in which irrigation management is not carried on or controlled by a community.
� � � We focus on irrigation systems in Japan to overcome the methodological
problems discussed above. The main crop grown in Japan is rice, for which irrigation is
of particular importance. Gravity irrigation is the most popular irrigation system, and it

is managed by WUAs. The country features more than one hundred thousand WUAs,
with different characteristics. We use panel data for two periods and we focus on all
WUAs in Japan. The depth of the dataset allows a fine-grained analysis of the effects of
the characteristic of WUAs and irrigation systems on the level of collective action for
irrigation management. Therefore, Japan seems an appropriate case study to examine
the characteristics of WUAs that affect the success of collective action for irrigation
management and to test the robustness of these success factors. Furthermore, in Japan,
WUAs have experienced a significant change in the irrigation management system due
to rapid depopulation, aging of farmers, and urbanization. The result of this study,
which focuses on irrigation systems in Japan, provides meaningful implications for
other developing countries.
� � � The remainder of this paper is organized as follows. Section 2 provides an
overview of farmer-managed irrigation systems in Japan. Section 3 reviews the
empirical studies on farmer’s collective action in the irrigation management in order to
refine the fundamental indicator of irrigation management systems. The data and
hypotheses are described in Section 4. Section 5 discusses the proposed methodology
and empirical results. The last section summarizes the main findings and provides our
concluding remarks.
2. Irrigation systems in Japan
� � � The cultivation of rice using gravity irrigation is the standard in Japan.
Historically, rural communities (the smallest units of regional society in rural villages)
have been the WUAs responsible for the operation and maintenance (O&M) of
irrigation facilities. After World War�, both the national and local government began
constructing large-scale irrigation facilities, such as dams, headworks, and main canals.
Their management was transferred from the national and local government to Land
Improvement Districts (LIDs), which are farmers’ organizations created in 1949 to
manage large-scale irrigation and drainage facilities. The members of LIDs are farmers
and landowners (non-farmers). However, such members do not manage large-scale
irrigation facilities, which are managed by LIDs’ office staff and experts. In the area of

LIDs, there are some rural communities. Except for large-scale irrigation facilities, the
Japanese government has endorsed a common rule for water use and assigned O&M to
rural communities at the level of main and branch canals. Currently, the O&M of
irrigation has been implemented by rural communities to assure that the water intake
from the river is stably delivered to the paddy field area through irrigation canals and
allocated to various areas efficiently.
� � � Rural communities are responsible for cleaning, weeding, and repairing the main
and branch canals. Participants in those activities are selected by each rural community
and could be both farmers and non-farmers. Traditionally, all households in the rural
community were required to participate in such activities. Most households were
farmers, although even non-farmers use water from irrigation canals for their daily life.
However, the aging, depopulation, and decreasing number of farmers in rural
communities advanced with rapid economic growth in Japan, and the participation’s
rules for those activities have changed significantly over the last 50 years. In particular,
the number of non-farmers and part-time farmers increased with the urbanization,
inducing significant heterogeneity among the members of rural communities. As a
result, the involvement of all households of a rural community in the irrigation
management became more difficult. In the recent years, the participation in the
irrigation management has dynamically changed, shifting from the participation of all
households to the involvement of particular households (e.g., only farm households), or
lack of management by WUAs. Therefore, from 2007, the government has been
providing financial support to the collective irrigation management carried on by rural
communities (through measures to conserve and improve land, water, and the
environment) to sustainably revitalize the irrigation management.
3. Theory and evidence of collective action in the irrigation management
3.1 Factors influencing collective action for irrigation management
� � � In the following sections, we briefly review the literature discussing how
collective action for irrigation management is affected by the characteristics of
irrigation systems and user groups.

3.1.1 The characteristics of irrigation systems
In this study, we assess the impact of the following characteristics of irrigation systems:
(1) Water scarcity
� � � Most existing studies insist on the importance of water scarcity as a determinant
of the cooperation among farmers (Fujiie, 2005; Araral, 2009; Nakano, 2011; Ito, 2012).
Araral (2009) and Agrawal (2001) suggest the presence of a U-shaped relationship
between the degree of water scarcity and the cooperation for irrigation management.
This means that the users of irrigation facilities have difficulties in managing collective
action with other users when water is scarce or extremely abundant. User groups have
no incentive and no need to collectively manage irrigation systems when water is
abundant, and conflicts among water users may become so large as to make collective
action difficult when water shortage is severe (Fujiie et al., 2005). Water scarcity, to
some degree, is ideal for the collective action for irrigation management. In addition,
Araral (2009) found that the governance structure mediates the effects of water scarcity.
(2) Access to the market
� � � The distance to the market has been widely recognized as an important factor for
a successful collective action in the management of common-pool resources
(Meinzen-dick and Raju, 2002). A site close to the market may lead to an increased
opportunity of receiving non-farming income and to more exit options to other sectors.
As a result, an easy access to the market loosens the traditional social ties that bind
farmers into mutual dependencies (Araral, 2009). However, a high degree of penetration
of the market may also increase the returns of irrigated farming. Therefore, the effects
of the access to the market on irrigation management are different across studies
(Dayton-Johnson, 2000; Meinzen-dick and Raju, 2002; Fujiie et al., 2005; Araral, 2009;
Nakano and Otsuka, 2011; Ito, 2012; Mattoussi and Seabright, 2014).
3.1.2 The characteristics of the user group

We assess the impact of the following characteristics of groups using the irrigation
system:
(1) Size of the group
� � � The effect of the number of participants on the sustainability of a self-governing
WUAs is ambiguous (Ostrom, 2002). Olson (1965) points out that acting collectively is
more difficult for large organizations. In particular, as the number of users increases, the
individual marginal contribution to irrigation management will not affect the provision
of water from irrigation, and the incentives to free-ride on the effort of others increase.
In addition, transaction costs, linked to negotiations to create common rules, may be
higher in large groups. However, in the presence of efficient irrigation management
systems, when the scale of the economy adapts to the increasing group size, the cost of
monitoring and management decreases and collective action in the irrigation
management is successful.
� � � Earlier studies, such as Tang (1992) and Lam (1998), did not find a relationship
between the performance of WUAs and the number of users. Several empirical studies
found a negative effect of group size on WUAs (Fujiie et al., 2005; Araral, 2009; Ito,
2012; Mattoussi and Seabright, 2014), while others found no impact (Dayton-Johnson,
2000). The lack of consensus in the previous literature may depend on the curvilinear
effect of group size on collective action. For example, in the case of community forest
management, Agrawal and Goyal (2001) find a curvilinear relationship between group
size and the mobilization of resources to hire guards for shared forest resources.
(2) Heterogeneity of the user group
� � � Heterogeneity means that the different cultural background and asset holdings,
interests, and general norms shared with other group members will differ across users.
This heterogeneity is a significant variable for irrigation management (Baland and
Platteau, 1996; Ostrom, 2002). Social and cultural heterogeneity increase the
coordination cost of forming and enforcing a common rule among members. As a result,
heterogeneity makes collective action more difficult. However, if a member of a group
has abilities and resources that other members do not have and participants to the user

group can cooperate with each other, the existence of community’s heterogeneity may
help promote cooperation (Olson, 1965).
� � � Existing empirical studies show the mixed effects of social and economic
heterogeneity on collective action in the irrigation management (Tang, 1998; Bardhan,
2000; Dayton-Johnson, 2000; Meinzen-dick and Raju, 2002; Nakano and Otsuka, 2011;
Ito, 2012). Poteete and Ostrom (2002) suggest that the relationship between
heterogeneity and collective action is non-linear.
(3) Dependence on irrigation systems
� � � The extent to which a community depends on irrigation systems is recognized as
one of the key factors to succeed in the collective action for irrigation management
(Olson, 1965; Wade, 1988; Ostrom, 1990). When many farmers depend on the
irrigation system, it may be easier to invest time and energy to create new institutions
(Araral, 2009), which results in maintaining successful collective action.
(4) Social capital
� � � Social capital is defined as the shared norms and networks that enable people to
act collectively (Healy, T., Côté, S., 2001). It is considered to play a key role in the
collective action for irrigation management. Communities with a high social capital can
reduce the cost of coordination, monitoring, and enforcement of the rules. Social capital
is a mix of intangible assets, and empirical studies introduced several variables to proxy
social capital. Meinzen-dick and Raju (2002) use the number of temples and
cooperatives as an indicator of social capital. The connections of individuals through
temples have a strong influence on the organization of the irrigation management.
However, the existence of cooperatives, introduced by Meinzen-dick and Raju (2002),
and the age of the resource, as in Araral (2009), also represent reasonable proxies for
social capital; however, they do not seem to have a statistically significant impact on
collective action for irrigation management.
3.2 Outcome of collective action for irrigation management

� � � Using an appropriate measure for the degree of collective action or the
performance of irrigation management is critical for examining the characteristics of
WUAs that affect the success of irrigation management (Wang et al., 2016), Most
empirical studies do not specify, or incorrectly define, the nature of the collective action
problem (Poteete and Ostrom, 2004; Araral, 2009). As we already discussed in the
previous section, several studies use a subjective or qualitative indicator, measured by
“good” or “bad,” to evaluate the performance of irrigation management, such as the
level of activity of WUAs or the maintenance level of the irrigation channels (Nakano
and Otsuka, 2011). However, self-reported maintenance efforts, inputs from household,
or the subjective appraisal of the maintenance status recalled by interviewees might
suffer from exaggeration bias in some circumstances (Wang et al., 2016). In addition,
these indicators cannot precisely identify the different levels of collective action for
irrigation management. In this study, we introduce an objective indicator representing
the level of collective action for irrigation management.
4. Data, hypothesis, and definition of variables
4.1 Unit of analysis and data
� � � In this study, we use the information of community-level data obtained from the
Rural Community Card, World Census of Agriculture and Forestry 2000. These are
comprehensive data collected from a survey implemented once in five years by the
Ministry of Agriculture, Forestry, and Fisheries (MAFF) to collect information on
agriculture and forests in all rural communities. Our unit of analysis is the rural
community, which is the smallest social unit in rural villages since rural communities in
Japan correspond to WUAs. These data report detailed information on 139,176 rural
communities in the year 2000, including data on the agricultural production and the
activities of the rural community, such as the management of irrigation, communal farm
roads, and facilities. Since further information on irrigation management is not available
before 1990, we use the data from 1990 and 2000, including information on the
activities of rural communities for the irrigation management. Following Takahashi
(2012), we excluded 5 out of 47 prefectures, and this study focuses on the data of 42

prefectures. We exclude rural communities in Hokkaido and Okinawa due to differences
in climatic conditions, and in Tokyo, Kanagawa, and Osaka due to the strong effect of
urbanization in these areas. In addition, we exclude rural communities in which no
paddy field and irrigation facilities are present. Therefore, the final dataset used in this
study covers 104,523 communities in 42 prefectures.
4.2 Hypothesis and definition of independent variables
� � � In this subsection, we assess the validity of a set of hypotheses. Table 2 reports
the summary statistics, definition of variables, and expected sign of the hypotheses.
(1) Water scarcity
� � � The existing empirical literature showed that water scarcity has a curvilinear
effect on the collective action for irrigation management. Collective action for irrigation
management can respond to moderate water scarcity. In Japan, water is abundant in
most rural communities except during the season of the rice transplanting. However,
there is a variation in rainfall patterns across prefectures and demand for water across
regions. We add a prefecture dummy to account for fixed effects at the prefecture level
to deal with this phenomenon.
(2) Access to the market
� � � We use the time distance of a densely inhabited district from a community as an
indicator of its access to the market. Density Inhabited Districts (DID) are high
population density areas within municipal boundaries, considered as the basic units in
the National Census in Japan. We introduced three distinct dummy variables: Distance
to DID (more than 1.5 hr.) is equal to 1 if the time distance to a densely inhabited
district (old city/town/village) is more than 1.5 hours, and 0 otherwise. Distance to DID
(less than 1 hr.) is equal to 1 if that distance is less than one hour, and 0 otherwise,
while Distance to DID (1 to 1.5 hr.) is equal to 1 if the time distance is from 1 to 1.5
hours, and 0 otherwise.
(3) Size of the group using the irrigation system

� � � We use the number of farm households in a community as an indicator of the
group size of WUAs and the area of paddy field in a community as an indicator of the
size of WUAs as measured by the irrigation service area. We include both the number of
farm households and its square to capture the possible U-shaped relationship between
the likelihood of collective action and group size. In our sample, the number of farm
households in a community varies from a minimum of 5 to a maximum of 386 in 2000.
The average size of the communities is 25 farm households, with an area of paddy field
of 21 ha in 2000.
(4) Heterogeneity of the user group
� � � We create a diversity indicator to measure the community’s social and economic
heterogeneity. Diversity among community’s farmers captures the degree of social
heterogeneity. Following Alesina et al. (1999), we construct diversity among
community’s farmers as follows:
!"#$%&"'(*+,-./,++0-"'(’&2*%+$%& = 1 − 6*%+$%78
7 ,
where 6*%+$%7 denotes the ratio of farmers " to the total population in the
community and " indicates self-sufficient farm households, full-time farm households,
type-1 part-time farmers (when the income earned from activities other than farming is
higher), and type-2 part-time farmers (the income earned from farming is greater than
other income), respectively. If this index is close to one, the community comprises
various types of farmers. If this index is close to zero, farmers in the community are
homogeneous.
� � � Diversity of farmer’s landholdings indicates the degree of economic
heterogeneity. We use this indicator instead of the distribution of the farming income,
which is not disclosed in the data. We construct diversity of landholdings as follows:
!"#$%&"'(,29*-!ℎ,9!"-.& = 1 − ;-*!ℎ,9!"-.&78
7 ,
where 9*-!ℎ,9!"-.&7 denotes the ratio of operating farmland, " corresponds to the
land (in ha) of the farmer to total farmland in the community, and maycorrespondto
less than 1.0 ha, 1.0~3.0 ha, 3.0~5.0 ha, 5.0~10.0 ha, 10.0~20.0 ha, 20.0~30.0 ha, and
more than 30 ha. We include both these indicators of heterogeneity and their square to

capture the possible U-shaped relationship between the likelihood of collective action
and heterogeneity.
� � � In addition, we use the ratio of non-farm households and the ratio of elderly
farmers to measure heterogeneity. In Japan, irrigation management used to be carried
out collectively by all households residing in the community; most members of a
community were farmers, and non-farmers also received some benefits for their
livelihoods from the irrigation management. As a result of the advancing urbanization,
the number of non-farmers in rural communities increased significantly, making it
harder to maintain a high level of collective action for the irrigation management.
Therefore, we use the ratio of non-farmers to control for the heterogeneity derived from
increasing urbanization. Moreover, communities in rural areas face a population aging
crisis, as much as other areas in the country. Wang et al. (2016) and Li et al. (2012)
found that an elderly group is less interested in participating in collective irrigation.
Therefore, we introduce the ratio of elderly farmers, which is the ratio of the population
engaged in farming above 65 years old over the total population of a community, to
control for the heterogeneity induced by aging. Therefore, we capture several types of
heterogeneity: social, economic, and the heterogeneity caused by the ratios of
non-farmers and elderly farmers.
(5) Dependence on irrigation systems
� � � We use the ratio of paddy field as a proxy indicator of the dependence on
irrigation. The ratio of paddy field measures the area of paddy field divided by the total
area of farmland in a community. The higher the ratio of paddy field, the greater the
dependence on irrigation.
(6) Social capital
� � � Because social capital is intangible, various proxy variables have been used in
the existing studies to capture it. In this study, we use age of community (or user group)
(Fujiie et al., 2005; Araral, 2009), number of meetings (Labonne and Chase, 2011), and
ratio of consolidated farmland as proxies for social capital. Age of community is a

dummy variable that takes value 1 if a community is established before 1975, and 0
otherwise. Ideally, we would use the number of years after the establishment of the
community as a proxy, but this information is not available in our dataset. Number of
meetings refers to the total number of meetings held by farmers in a year. The higher
age of a community and the larger number of meetings are proportionality related to the
accumulation of social capital in that community.
� � � In addition, we introduce the ratio of consolidated farmland. To improve labor
and land productivity, farmland consolidation, including merging and reshaping small
plots of farmland into one large plot, is often carried out. These projects are usually
based on proposals received from farmers in rural communities. If more than two-thirds
of landowners in the project area agree, the project will be implemented by the central
or prefectural government, as a public project. Thus, if the social capital in a community
is low, that community will usually not agree on the implementation of any projects.
The communities in which these projects are implemented have accumulated social
capital, and the coordination among farmers is relatively easy.
(7) Additional Variables
� � � We include three dummy variables (flatland, urban, hilly, and mountainous) for
the location of a community to control for diverse agricultural conditions. We also
include an indicator for farmland use peculiar to the rural area in Japan, accounting for
the ratio of rented-in area and ratio of abandoned farmland (Table 2). In addition, a
year dummy is included to control for the time dimension.
4.3 Measurement of dependent variables
� � � We use an observable objective indicator to denote the different level of
collective action for irrigation management. We focus on how irrigation management,
such as cutting the weeds and removing silt, is implemented. We assign an ordered
dummy variable for different irrigation management systems: “3” indicates
management carried on by all households residing in the community, “2” refers to

management only performed by farm households, “1” indicates management performed
by hired hands, and “0” denotes a non-functionality (non-functional community).
� � � This ranking is based on a direct indicator of collective action. The level of
collective action for irrigation maintenance carried on by all households is the highest:
all members of the community are required to participate in the operations and
maintenance of the irrigation facilities. Next, the irrigation management carried on by
farm households is characterized by a lower level of collective action due to the
exclusion of non-farm households. These two irrigation management systems are
examples of collective action for irrigation management organized by the members of a
community. In the case of irrigation management carried on by fired hands and
non-functionality, the collective action of community members is not required.
Especially, the ranking of non-functionality is the lowest because the collective action
for irrigation management is not carried on or controlled by a community.
� � � We examine the transition of irrigation management systems using the sample
described in the previous subsection. Figure 1 shows the distribution of the different
irrigation management systems adopted by rural communities in 1990 and 2000. The
number of communities adopting each irrigation management systems is 35,695 (all
households), 46,867 (farm households), 796 (hired hands), and 21,165
(non-functionality) in 1990. In 2000, the number of communities adopting each
irrigation management systems are 34,008 (all households), 50,613 (farm households),
421 (hired hands), and 19,481 (non-functionality). Between 1990 and 2000, the number
of communities adopting irrigation management carried on by farm households
increased, while the number communities adopting other irrigation management
systems decreased. As shown in Figure 2, the share of communities adopting an
irrigation system managed by all households or farm households is 79.0% (all
households: 34.2%; farm households: 44.8%) in 1990 and 80.9 % (all households:
32.5%; farm households: 48.4%) in 2000. Furthermore, the share of communities
characterized by non-functionality is 20.2 % in 1990 and 18.6% in 2000. As shown in
Figures 1 and 2, the choice of the irrigation management system by a community seems
stable during the period of analysis.
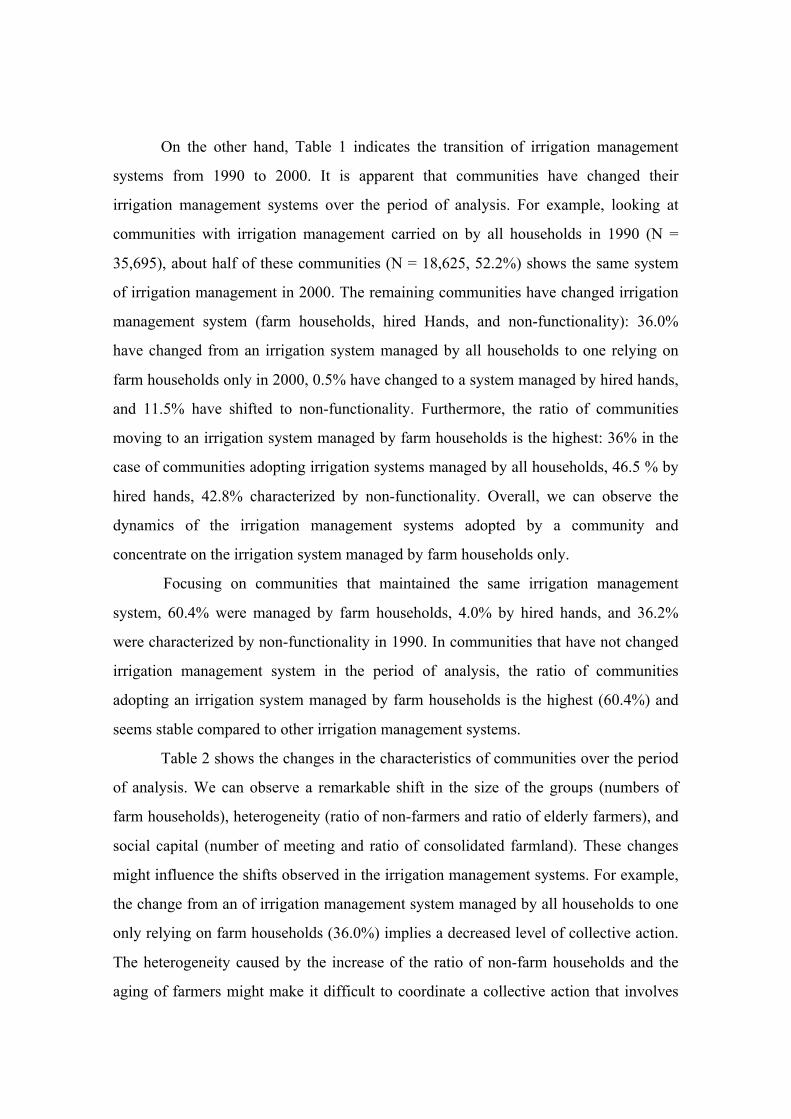
� � � On the other hand, Table 1 indicates the transition of irrigation management
systems from 1990 to 2000. It is apparent that communities have changed their
irrigation management systems over the period of analysis. For example, looking at
communities with irrigation management carried on by all households in 1990 (N =
35,695), about half of these communities (N = 18,625, 52.2%) shows the same system
of irrigation management in 2000. The remaining communities have changed irrigation
management system (farm households, hired Hands, and non-functionality): 36.0%
have changed from an irrigation system managed by all households to one relying on
farm households only in 2000, 0.5% have changed to a system managed by hired hands,
and 11.5% have shifted to non-functionality. Furthermore, the ratio of communities
moving to an irrigation system managed by farm households is the highest: 36% in the
case of communities adopting irrigation systems managed by all households, 46.5 % by
hired hands, 42.8% characterized by non-functionality. Overall, we can observe the
dynamics of the irrigation management systems adopted by a community and
concentrate on the irrigation system managed by farm households only.
� � � Focusing on communities that maintained the same irrigation management
system, 60.4% were managed by farm households, 4.0% by hired hands, and 36.2%
were characterized by non-functionality in 1990. In communities that have not changed
irrigation management system in the period of analysis, the ratio of communities
adopting an irrigation system managed by farm households is the highest (60.4%) and
seems stable compared to other irrigation management systems.
� � � Table 2 shows the changes in the characteristics of communities over the period
of analysis. We can observe a remarkable shift in the size of the groups (numbers of
farm households), heterogeneity (ratio of non-farmers and ratio of elderly farmers), and
social capital (number of meeting and ratio of consolidated farmland). These changes
might influence the shifts observed in the irrigation management systems. For example,
the change from an of irrigation management system managed by all households to one
only relying on farm households (36.0%) implies a decreased level of collective action.
The heterogeneity caused by the increase of the ratio of non-farm households and the
aging of farmers might make it difficult to coordinate a collective action that involves

non-farmers. On the other hand, communities with irrigation management systems
(hired hands and non-functionality) not characterized by the collective action have
remarkably changed to irrigation management systems (all households and farm
households) characterized by collective action. Overall, the level of collective action has
increased. The accumulation of social capital through the implementation of farmland
consolidation and the increasing number of meetings as well as the reduction of
coordination costs obtained decreasing the number of farmers are likely to facilitate the
collective action for irrigation management.
� � � A conventional cross-sectional dataset cannot capture such changes in the
irrigation management system and characteristics of WUAs. Therefore, we use panel
data to capture this transition through an empirical model.
5. Results and discussion
5.1 Estimation models
� � � In the empirical model, we assess level of collective action for irrigation
management on a categorical scale. We estimate the proposed model using panel data.
We introduce random-effects in an ordered probit model, which allows identifying the
actual values of the dependent variables. The model can be written as:
(7,I∗= KL7,I + N7 + O7,I
and
(7,I = P"2PQRS < (7,I∗≤ PQ, P = 1,⋯ ,W,
where(7,I∗ is an indicator of the level of collective action for irrigation management
and captures the unobservable latent continuous response. Only the category chosen by
the community " at each point in time ' can be observed. L7,I is a set of time-varying
independent variables. K is the parameter to be estimated. N7 represents an
individual-specific and time-invariant random component, depending on the unobserved
heterogeneity. The errors, O7,I, have a standard normal distribution with mean equal to
zero and variance equal to one and are assumed to be independent of N7. W is the
number of outcomes. Furthermore, we report the results of the ordered probit model

with and without random effects taking into account the impact of both the observed
and unobserved heterogeneity.
5.2 Determinants of the level of collective action for irrigation management
� � � Table 3 shows the results of the ordered probit model with (column 1) and
without (column 2-4) random effects to address how the effect of the independent
variable change when we add unobserved heterogeneity into model. The estimates from
column (1) to (4) have the expected signs and are statistically significant, except for Age
of community in column (3) and (4). Most coefficients on independent variables are
larger in column (2) – (4), in which the specifications add random effects. Running the
model without random effects may induce the underestimation of the effect of the
independent variables on the level of collective action for irrigation management.
� � � The results in column (2) control for the characteristics of the irrigation systems
and those in column (3) control for the characteristics of the user group. In column (4),
we add both the characteristics of the irrigation systems and the user group to confirm
the specification of the model. The coefficients in column (2) – (3) are stable and less
likely to suffer from specification problems. Based on the results reported in column (4),
in the next section, we discuss the impact of the characteristics of the irrigation systems
and the user group (a community, as a WUA) on the collective action for irrigation
management at the WUA-level.
5.2.1 The characteristics of the irrigation systems
� � � The coefficient on the distance to the market (Distance to DID) is negative and
significant, showing that a community that is far from the market or has no exit options
is characterized by a lower level of collective action for irrigation management. This
finding is consistent with the results of Meinzen-dick and Raju (2002) and Wang et al.
(2016), which use the same indicator for the access to the market. This may be because
there are less profitable commercial opportunities for these communities (Meinzen-dick
and Raju, 2002), and returns to irrigated farming decrease in remote areas. Furthermore,

a community that is further away from the market tends to maintain social ties among
the members of the community.
5.2.2 The characteristics of the user group
(1) Size of the group
� � � The coefficient on the number of farm households is positive and significant,
and the coefficient on its squared term is negative and significant at a 1% level. The
result on group size and the number of farm households implies that group size and
level of collective action are associated through an inverted U-shaped relationship. The
level first increases as the number of farm households increase, up to 106 farm
households, and decreases after this point. The average number of farm households is 25
in 2000. Therefore, in most communities used in this analysis, the level of collective
action for irrigation management increases with the number of farm households. In
Japanese communities, the level in the irrigation management decreased with the
declining number of farm households. Some people are required to maintain the
irrigation systems and to assure that the benefit arising from the economies of scale is
higher than the coordination costs. In this respect, our empirical result is consistent with
the findings of Takeda (2015) for Japan.
� � � The coefficient on the area of paddy field is negative and significant. As the area
of paddy field increases, the cost of organizing a collective action on a vast territory
increases as well (Fujiie et al., 2005). This result is consistent with the findings of case
studies for Indonesia (Fujiie et al., 2005) and India (Bardhan, 2000) and with the
general opinion that collective action is more difficult as group size increases.
(2) Heterogeneity of user group
� � � The coefficient on the diversity of farmer’s landholdings is positive and
significant and the coefficient on its squared term is negative and significant. It means
that economic heterogeneity has an inverted U-shaped relationship with level of
collective action. The level first increases with economic heterogeneity up to 0.35, and,
then, it decreases. The inverted U-shaped relationship between economic heterogeneity

and collective action is consistent with the study of Bardhan (2000) on India and
Dayton-Johnson (2000) on Mexico. A group characterized by heterogeneity of
landholdings will be more successful than a group with an extreme heterogeneity of
asset structure, or with homogeneous assets, in enhancing the cooperation level of
collective action for irrigation management.
� � � The coefficient on the diversity among community’s farmers is negative and
significant and the coefficient on its squared term is positive and significant. Social
heterogeneity and the levels are associated through a U-shaped relationship.
Heterogeneity in the social background makes the collective action for irrigation
management more difficult when the homogeneity of farm households is high. This
finding is consistent with the previous literature (Bardhan, 2000; Dayton-Johnson,
2000; Meinzen-dick and Raju, 2002; Ito, 2012). Social and economic heterogeneity
have non-linear effects on the level of collective action for irrigation management. The
direction of the effect is different at each level of heterogeneity because the impact of
social and economic heterogeneity on the benefit of collective action complements the
effect derived from a variety of farm households. Social heterogeneity has a larger
impact than economic heterogeneity on the collective action for irrigation management
(Baland and Platteau, 1996).
� � � The coefficients on the ratio of non-farmers and ratio of elderly farmers are
negative and statistically significant. These results imply that an elder group is less
interested in irrigation management, which is consistent with the findings of Wang et al.
(2016) for China. In addition, the availability of an exit option to non-farming
employment weakens the incentives for collective action. This finding is in line with the
results of the existing studies (Fujiie et al., 2005; Ito, 2012).
(3) Dependence on irrigation systems
� � � The positive coefficient on the ratio of paddy field confirms the hypothesis that a
community with a high paddy field ratio is more likely to achieve higher level of
collective action for irrigation management. This implies that these communities have
an incentive to agree on collective action requiring a higher cooperation because

irrigation is essential for their livelihood. This finding is consistent with the empirical
results of Gorton et al. (2009) for Mcedonia and Araral (2009) for the Philippines.
(4) Social capital
� � � The coefficients on the number of meetings and ratio of consolidated farmland
are positive and statistically significant, as expected. These variables are used as
indicators of social capital. The implementation of consolidated farmland projects
induces coordination and transaction costs. The accumulation of social capital is crucial
in the implementation of consolidated farmland to decrease such costs. A community
with high social capital is likely to choose a higher cooperation level of collective action
for irrigation management. In addition, holding meetings requires considerable amounts
of social capital. Meetings are expected to increase the likelihood of collective action
for irrigation management by strengthening social interactions or traditional social ties.
5.3 Simulation analysis
� � � In this subsection, we discuss the relationship between the characteristics of
WUAs and the probability of adopting different types of irrigation management systems
(Figure 3). The likelihood of choosing an irrigation system only managed by farm
households is the highest with respect to all explanatory variables and is stable
regarding changes in the characteristics of WUAs. We argue that this management
system is stably selected because irrigation water is essential to paddy farmers. This
result is consistent with the higher ratio of communities maintaining irrigation systems
managed by farm households in the 10 years under analysis, as shown in Figure 1 and
Figure. 2. However, the probability of selecting irrigation system managed by all
households and the absence of an irrigation management carried on by a community
changes according to variations in the characteristics of WUAs. Focusing on irrigation
systems managed by farm households and the absence of irrigation management, we
address the relationship between the probability of selecting different types of irrigation
management systems and the characteristics of WUAs.

� � � First, the relationship between the number of farm households (Fig.3a), area of
paddy field (Fig.3b), diversity of farmer’s landholdings (Fig.3c) and the probability of
selecting an irrigation system managed by all households shows an inverted U-shape.
The relationship between these characteristics of WUAs and the absence of an irrigation
management is U-shaped. Below a certain threshold in the number of farm households,
area of paddy field, and diversity of farmer’s landholdings, the probability of absence of
irrigation management decreases, and the likelihood of irrigation systems managed by
farm household increases. However, beyond a certain threshold, the trend changes in the
opposite direction. Second, the higher the ratio of paddy field (Fig.3g) as a proxy
indicator of the dependence on irrigation systems, number of meetings (Fig.3h) and
ratio of consolidated farmland (Fig.3i) as a proxy indicator of social capital, the higher
the probability of irrigation systems managed by all households. These indicators show
that physical infrastructure, such as the ratio of paddy field, and “soft” measures, such
as social capital, help promote the collective action for irrigation management by
WUAs and seem to play a fundamental role. Third, as the diversity of community’s
farmers, ratio of non-farmers, and ratio of elderly farmers increase, the probability of
irrigation systems managed by all households decreases, while the probability of
non-functionality increases.
6. Conclusions
� � � This study provides empirical evidence on some characteristics of WUAs that
affect the success of collective action for irrigation management. We used panel data
from 100,000 rural communities in Japan observed between 1990 and 2000. The main
contribution of this study is the use of a large-scale panel data set (N = 201,046) to
assess the theory of collective action for irrigation management. Moreover, we try to
address some methodological issues observed in previous empirical studies (Poteete and
Ostrom, 2004, 2008; Araral, 2009), such as the informational limits of cross-sectional
data, the choice of subjective indicators as dependent variables, and the censoring bias.
Although a subjective indicator has been used as a dependent variable to evaluate the
performance of communal irrigation management in existing empirical studies, in this

study, we use an objective indicator of irrigation management system to denote different
levels of collective action for irrigation management.
� � � The result of the econometric analysis verifies the hypotheses of the existing
empirical literature and confirms the robustness of the theory of collective action in the
context of irrigation management. Our findings suggest that the level of collective
action for irrigation management depends on the distance from the market, on the area
and ratio of paddy field, the ratio of non-farmers, the ratio of elderly farmers, the
number of meetings, and the ratio of consolidated farmland—a proxy for social capital.
We also find that the number of farm households, the diversity of farmer’s landholdings,
and the diversity among community’s farmers have a curvilinear effect on the collective
action for irrigation management. The relationship between these variables and
likelihood of collective action is ambiguous in the existing literature. An inverted
U-shaped relationship between collective action for irrigation management and the
number of farm households and the diversity of farmer’s landholdings seems to exist, as
well as a U-shaped relationship between the level and the diversity among community’s
farmers. This means that user groups with a moderate heterogeneity of landholdings
will be more successful than groups with an extreme heterogeneity of asset structure, or
with homogeneous assets, in enhancing the level of collective action for irrigation
management.
� � � These findings have implications for the irrigation management carried on by
WUAs. The rapid depopulation, aging of farmers, and urbanization may help explain
the deteriorating state of the irrigation management. The Japanese case can be seen as
an example for developing countries, which may experience a similar change in their
rural environment due to economic development. To be able to perform collective
irrigation management, it is necessary to maintain both physical infrastructures, such as
the ratio of paddy field, and “soft” measures, such as social capital. In addition, policies
aimed at suppressing deteriorating collective action for irrigation management need to
enhance social ties in a community, as the characteristics of irrigation systems and user
groups can hardly change in the short run.
Acknowledgements
This work was supported by JSPS KAKENHI Grant Number JP26850141.
References
Alesina, A., Baqir, R., Easterly, W., 1999. Public Goods and Ethnic Divisions. Q. J.
Econ. 114(4), 1243-1284.
Agrawal, A., 2001. Common Property Institutions and Sustainable Governance of
Resources. World Dev. 29(10), 1649-1672.
Araral, E., 2009. What Explains Collective Action in the Commons? Theory and
Evidence from the Philippines. World Dev. 37(3), 687-697.
Bardhan, P., 2000. Irrigation and Cooperation: An Empirical Analysis of 48 Irrigation
Communities in South India. Econ. Devel. Cul. Change 48(4), 847-865.
Dayton-Johnson, J., 2000. Determinants of Collective Action on the Local Commons: a
Model with Evidence from Mexico. J. Devel. Econ. 62(1), 181-208.
Fujiie, M., Hayami, Y., Kikuchi, M., 2005. The Conditions of Collective Action for
Local Commons Management: the Case of Irrigation in the Philippines. Agric. Econ.
33(2), 179-189.
Gorton, M., Sauer, J., Peshevski, M., Bosev, D., Shekerinov, D., Quarrie, S., 2009.
Water Communities in the Republic of Macedonia: An Empirical Analysis of
Membership Satisfaction and Payment Behavior. World Dev. 37(12), 1951-1963.
Healy, T., Côté, S., 2001. The Well-Being of Nations: The Role of Human and Social
Capital. Education and Skills. Organisation for Economic Cooperation and
Development, France.
Ito, J., 2012. Collective Action for Local Commons Management in Rural Yunnan,
China: Empirical Evidence and Hypotheses using Evolutionary Game Theory. Land
Econ. 88(1), 181-200.
Labonne, J., Chase, R. S., 2011. Do Community-Driven Development Projects Enhance
Social Capital? Evidence from the Philippines. J. Devel. Econ. 96(2), 348-358.

Li, C., Li, S., Feldman, M. W., Daily, G. C., Li, J., 2012. Does Out-Migration Reshaped
Rural Households' Livelihood Capitals in the Source Communities? Recent Evidence
from Western China. Asian Pac. Migr. J. 21(1), 1-30.
Mattoussi, W., Seabright, P., 2014. Cooperation against Theft: A Test of Incentives for
Water Management in Tunisia. Am. J. Agr. Econ. 96(1), 124-153.
Meinzen-Dick, R., 2007. Beyond Panaceas in Water Institutions. Proc. Natl. Acad.
Sci. 104(39), 15200-15205.
Meinzen-Dick, R., Raju, K. V., Gulati, A., 2002. What Affects Organization and
Collective Action for Managing Resources? Evidence from Canal Irrigation Systems
in India. World Dev. 30(4), 649-666.
Nakano, Y., Otsuka, K., 2011. Determinants of Household Contributions to Collective
Irrigation Management: The Case of the Doho Rice Scheme in Uganda. Environ. Dev.
Econ. 16(05), 527-551.
Nagrah, A., Chaudhry, A. M., Giordano, M., 2016. Collective Action in Decentralized
Irrigation Systems: Evidence from Pakistan. World Dev. 84, 282-298.
Olson, M., 1965. The Logic of Collective Action: Public Goods and the Theory of
Groups. Harvard University Press, Cambridge, UK.
Ostrom, E., 1990. Governing the Commons: The Evolution of Institutions for Collective
Action. Cambridge UP, Cambridge, UK.
Poteete, A. R., Ostrom, E., 2004. Heterogeneity, Group Size and Collective Action: The
Role of Institutions in Forest Management. Dev. Change 35(3), 435-461.
Poteete, A. R., Ostrom, E., 2008. Fifteen Years of Empirical Research on Collective
Action in Natural Resource Management: Struggling to Build Large-N Databases
based on Qualitative Research. World Dev. 36(1), 176-195.� �
Takahashi, D., 2012. Farmland liquidization and transaction costs. Jpn. J. Rural Econ.
14, 1-19.
Takeda, M., 2015. Factors to Influence a Community's Choice for On-farm Irrigation
Facility Management Responsibility Assignment to All Households within the
Community in Japan: Panel Data Analysis using Rural Community Cards. J. Rural
Econ. 87(3), 267-272. (In Japanese)

Tanaka, Y., Sato, Y., 2003. An Institutional Case Study of Japanese Water Users
Association: Towards Successful Participatory Irrigation Management. Paddy Water
Environ. 1(2), 85-90.
Tang, S. Y., 1992. Institutions and collective action: Self-governance in irrigation. ICS
press, San Francisco, USA.
Wade, R., 1988. Village Republics: Economic Conditions for Collective Action in South
India. Cambridge University Press, Cambridge, UK.
Wang, Y., Chen, C., Araral, E., 2016. The Effects of Migration on Collective Action in
the Commons: Evidence from Rural China. World Dev. 88, 79-93.

Allhouseholds
Farmhouseholds
Hiredhands
Non-functionality
18,625 12,863 111 4,096 35,695(52.2) (36.0) (0.3) (11.5) (100.0)
10,792 28,328 196 7,551 46,867(23.0) (60.4) (0.4) (16.1) (100.0)
215 370 32 179 796(27.0) (46.5) (4.0) (22.5) (100.0)
4,376 9,052 82 7,655 21,165(20.7) (42.8) (0.4) (36.2) (100.0)
34,008 50,613 421 19,481 104,523(32.5) (48.4) (0.4) (18.6) (100.0)
All households
Farm households
Hired hands
Non-functionality
Total in 2000
Source: The Rural Community Card, World Census of Agriculture and Forestry, Ministry of Agriculture,Forestry, and Fisheries (MAFF) , 2000.
Table 1 The transition of irrigation management systems
2000 Total in 1990
1990
(Unit: Number, %)

Mean Std. Dev. Mean Std. Dev.Dependent variables
Level of collective action
Ordered dummy variable (3: management carried on by allhouseholds residing in the community; 2: management carried onby only farm households; 1: management carried on by employees;0: non-functionality of the community)
The characteristics of the irrigation systems
Distance to DID (less than 1 hr.) Dummy = 1 if the time distance to DID (densely inhibited district byold city/town/village) is less than 1 hour, and 0 otherwise.
0.725
Distance to DID (1 to 1.5 hr.) Dummy = 1 if the time distance to DID (densely inhibited district byold city/town/village) is between 1 and 1.5 hours, and 0 otherwise.
0.228 �
Distance to DID (more than 1.5 hr.) Dummy = 1 if the time distance to DID (densely inhibited district byold city/town/village) is more than 1.5 hour, and 0 otherwise.
0.047 �
The characteristics of the use groupNumbers of farm households Total number of farm households. 31 23.01 25 19.52 ���
Area of paddy field Area of paddy field (ha). 22.901 27.05 21.287 26.43 ���
Diversity of farmer’s landholdings See text. 0.586 0.14 0.578 0.16 ���
Diversity among community’s farmers See text. 0.515 0.15 0.525 0.14 ���
Ratio of non-farmers Number of non-farm households /total number of farm households. 46.575 27.86 57.047 26.51 �
Ratio of elderly farmers Population engaged in farming above 65 years old / totalpopulation engaged in farming.
20.658 5.66 30.236 8.45 �
Ratio of paddy field Area of paddy field /area of farmland. 74.157 24.00 74.953 24.22 �
Age of community Dummy = 1 if a community is established before 1975, and 0otherwise.
0.996 �
Number of meeting Total number of meetings held by farmers. 6 5.22 9 6.73 �
Ratio of consolidated farmland Area of consolidated farmland/area of farmland. 46.044 44.61 57.220 44.14 �
Additional VariablesRatio of area rented-in Area of farmland rented-in/area of farmland. 9.457 9.06 14.199 12.43Ratio of abandoned farmland Area of abandoned farmland/area of farmland. 5.347 8.09 8.870 10.41
Agricultural area (flatland ) Dummy = 1 if the classification of the agricultural area is flatlandagricultural area, and 0 otherwise.
0.208
Agricultural area (urban) Dummy = 1 if the classification of the agricultural area is urbanagricultural area, and 0 otherwise.
0.294
Agricultural area (hilly and mountainous) Dummy = 1 if the classification of the agricultural area is hilly andmountainous Areas, and 0 otherwise.
0.498
Prefecture dummy Dummy variables of each prefectures.Year dummy Dummy = 1 if data is in 2000, and 0 otherwise.
Observations
Variables
209,046
Expected sign
Table 2 Summary statistics, variables definition and expected sign
1990 2000Definition

z-value z-value z-value z-valueThe characteristics of the irrigation systems
Distance to DID (1 to 1.5 hr.) -0.128***
-18.64 -0.141***
-15.87 -0.153***
-17.14Distance to DID (more than 1.5 hr.) -0.124
***-9.39 -0.146
***-8.53 -0.150
***-8.77
The characteristics of the user groupNumber of farm households 0.004
***13.13 0.005 *** 12.28 0.005
***11.73
Number of farm households (squared) -2.0E-05***
-8.41 -2.3E-05 *** -7.78 -2.2E-05***
-7.58Area of paddy field -0.001
***-10.04 -0.001 *** -8.44 -0.001
***-8.42
Diversity of farmer’s landholdings 0.139 ** 2.22 0.132 * 1.75 0.131 * 1.74Diversity of farmer’s landholdings (squared) -0.193 *** -2.81 -0.182 ** -2.18 -0.188 ** -2.26Diversity among community’s farmers -0.483 *** -5.92 -0.533 *** -5.45 -0.510 *** -5.22Diversity among community’s farmers (squared) 0.472 *** 5.3 0.522 *** 4.89 0.499 *** 4.68Ratio of non-farmers -0.003
***-30.76 -0.004 *** -25.92 -0.004
***-28.13
Ratio of elderly farmers -0.004***
-8.48 -0.004 *** -8.49 -0.003***
-6.54Ratio of paddy field 0.003
***22.72 0.004 *** 21.45 0.004
***20.85
Age of community 0.072*
1.72 0.081 1.54 0.086 1.65Number of meetings 0.007
***15.45 0.007 *** 14.85 0.007
***14.78
Ratio of consolidated farmland 0.000***
7.31 0.001 *** 6.30 0.001***
6.14Additional Variables
Ratio of area rented-in 0.004***
15.4 0.004***
12.28 0.004 *** 12.84 0.004***
13.33Ratio of abandoned farmland -0.003
***-8.58 -0.006
***-15.53 -0.003 *** -8.01 -0.003
***-8.09
Agricultural area (urban) -0.092***
-11.83 -0.222***
-23.00 -0.101 *** -9.93 -0.111***
-10.92Agricultural area (hilly and mountainous) -0.118
***-16.82 -0.143
***-16.12 -0.178 *** -19.99 -0.141
***-15.5
Random effectsPrefecture dummy Year dummycut1 -0.479
***-0.678
*** -0.501 ***-0.545
***
cut2 -0.457***
-0.652*** -0.475 ***
-0.519***
cut3 0.902***
0.944*** 1.121 ***
1.076***
Likelihood-ratio test: χ2(1)Log likelihood
Note: *significant at the 10% level; **significant at the 5% level; ***significant at the 1% level.
YESYES
Ordered Probit Model
NO YES
YES
YES YES
coefficient
YESYES YES
YES
5547.51***
209,046 209,046 209,046-211003.34 -210147.79 -209983.16-212519.52
The reported likelihood-ratio test statistics show that there is enough variability across communities to favor a random-effects ordered probit regression over anordered probit. Z-value is estimated by using robust standard error.
Table 3 Determinants of the cooperation level for the irrigation management
(4)(2) (3)Dependent variable: level of collective action forirrigation management
Random Effects Ordered Probit Model(1)
coefficient coefficient coefficient
209,046
YES
5072.72*** 5134.66***
Observations

35,695
46,867
796
21,165
34,008
50,613
421
19,481
0
10,000
20,000
30,000
40,000
50,000
60,000
All households Farm households Hired hands Non-functionality
1990 2000
Source: The Rural Community Card, World Census of Agriculture and Forestry, Ministry of Agriculture, Forestry, and Fisheries (MAFF) , 2000.
Type of irrigation management system
Number of communities
Figure 1 Irrigation management system in 1990 and 2000

34.2% 32.5%
44.8% 48.4%
0.8% 0.4%
20.2% 18.6%
0%
10%
20%
30%
40%
50%
60%
70%
80%
90%
100%
1990 2000
All households Farm households Hired hands Non-functionality
Source: The Rural Community Card, World Census of Agriculture and Forestry, Ministry of Agriculture, Forestry, and Fisheries (MAFF) , 2000.
Figure 2 Rate of type of irrigation management system in 1990 and 2000

(d)Diversity among community's farmers
Figure 3 Relationship between the choice probability of the irrigation management methodand the characteristics of the user group
(a)Number of farm households
(e)Ratio of non-farmers
(b)Area of paddy field
(c)Diversity of farmer's landholdings

(g)Ratio of paddy field
Figure 3 (continued) Relationship between the choice probability of the irrigation management methodand the characteristics of the user group
(i)Ratio of consolidated farmland(h)Number of meeting
(f)Ratio of elderly farmers