the determinants of capital structure
TRANSCRIPT

i
Mekelle University
College of Business and Economics Department of Accounting and Finance
THE DETERMINANTS OF CAPITAL STRUCTURE Evidence from Commercial Banks in Ethiopia
By
KKiibbrroomm MMeehhaarrii FFiisssseehhaa Reg.No.-CBE/PR0025/01
Research Project Submitted to the Department of Accounting and
Finance, College of Business and Economics, Mekelle University, for the partial fulfillment of the degree of Master of Finance and Investment
Under the Guidance of
AArreeggaawwii GGeebbrreemmiicchhaaeell (Ph.D. Candidate) Assistant Professor
May, 2010 Mekelle, Ethiopia

ii
TTHHEE DDEETTEERRMMIINNAANNTTSS OOFF CCAAPPIITTAALL SSTTRRUUCCTTUURREE
Evidence from Commercial Banks in Ethiopia
By
Kibrom Mehari Fisseha Reg. No. CBE/PR0025/01

iii
DECLARATION
I, Kibrom Mehari Fisseha, hereby declare that the project work entitled “The
Determinants of Capital Structure: Evidence from Commercial Banks in Ethiopia”
submitted by me for the award of the degree of Master of Science in Finance and
Investment of Mekelle University, is original work and it hasn’t been presented
for the award of any other Degree, Diploma, Fellowship or other similar titles of
any other university or institution.
Place: Mekelle Signature:
Date: May, 2010 …………………..
KIBROM MEHARI FISSEHA

iv
CERTIFICATION
I certify that the project work entitled “The Determinants of Capital Structure”
is a bona-fide work of Mr. Kibrom Mehari who carried out the research under
my guidance. Certified further, that to the best of my knowledge the work
reported herein does not form part of any other project report or dissertation on
the bases of which a degree or award was conferred on an earlier occasion on
this or any other candidate.
Place: Mekelle Signature:
Date: May, 2010 …………………..
AREGAWI GEBREMICHAEL Assistant Professor
Department of Accounting & Finance College of Business & Economics
Mekelle University Tigray, Ethiopia

v
ACKNOWLEDGEMENTS
“But Jesus beheld them, and said unto them, With men this is impossible; but with God all thing are possible.”
Matthew 19:26 THANKS TO GOD!
After several months of hard work my research project has been finished. Now it is time to warmly thank everyone who provided his/her kind assistance to me. I would like to express my sincere recognition to my adviser Aregawi Gebremichael, Assistant Professor, without whose high quality and friendly advice would this work not have come to completion. Sincere regards are also due to Dr. Fisseha Girmay, who provided efficient academic advice during my study and helped me in selecting my thesis title. I would also like to convey my gratitude and heartfelt thanks to Dr. Ambassador Adissalem Balema who devoted his valuable time to check-over the paper.
My sincere and special thanks go to my family for their support: my father, Mehari, who supported me emotionally; my wife, Ruth, and my son, Nathan, for their love, encouragement and sacrifice, especially whenever I need their strength to move forward. This work is devoted to them. I am also deeply grateful to my uncle, Ayeya, and friends, Tsehaye, Dani and Bereket for their back-up especially on difficult days.
I am also deeply grateful to Leakemariam Abreha and Gebresilassie Gebremedhin for their full support and courage at my work place before and during my study. I owe also special thanks to my colleagues Gebreigziabher Brhane, Destalem Nigusse and Abadi Afera for their highly important role they did play in editing my paper and providing me with the necessary facilities for the completion of this paper.
Finally, I also wish to extend my gratitude and special thanks to all the academic staffs of Accounting and Finance Department and other departments, Mekelle University, for their valuable coaching and insights throughout my MSc course.
Kibrom Mehari

vi
ABSTRACT
Although there have been many prior studies of the determinants of capital
structure, the question of what determines the best financing mix that maximizes a
firm’s value is still the most debatable issue in corporate finance. Besides, a great
deal of previous studies focused mainly on developed countries’ non-financial firms
paying little attention to developing countries and financial sector. Therefore, this
study attempted to fill the gap by analyzing the capital structure for commercial
banks in Ethiopia. This paper approached the issues of capital structure by
evidencing commercial banks in Ethiopia to uncover the firm level determinant
factors of capital structure. To discover what determines capital structure, six firm
level explanatory variables (Profitability, Tangibility, Size, Growth, Age and Tax-
Shield) were selected and regressed against the appropriate capital structure
measure (Debt to Equity Ratio). A sample of seven commercial banks was taken
and secondary data were collected. Consequently, multivariate regression analysis
was made based on financial statement data of the selected commercial banks over
the study period of 2000 - 2009 E.C. The major findings of the study indicated that
profitability, size, age and tax-shield variables are the significant firm level
determinants of capital structure in Ethiopian commercial banks case. In addition to
this, the two variables (profitability and growth) established negative relationship
and the remaining four variables (tangibility, size, age and tax-shield) showed
positive relationship with capital structure. Far beyond this, it is also revealed that
there is consistency between profitability and Pecking order theory, tangibility and
Static Trade-off theory, Pecking order theory and Agency cost Theory; both
variables size and growth and Static Trade-off theory and Agency cost Theory; and
variables age and tax-shield and Static Trade-off Theory in Ethiopian commercial
banking case.
Keywords: Capital Structure, Determinants, Commercial banks, Ethiopia, STT, POT,
ACT, DER, Profitability, Tangibility, Size, Growth, Age and Tax-Shield

vii
TABLE OF CONTENTS
Contents Pages Declaration ................................................................................................................................................................................... iii Certification ................................................................................................................................................................................. iv Acknowledgement ............................................................................................................................................................... v Abstract ............................................................................................................................................................................................ vi Table of Contents ..................................................................................................................................................................... vii List of Tables .............................................................................................................................................................................. ix List of Graphs ........................................................................................................................................................................... x Abbreviations & Acronyms ...................................................................................................................................... xi
CHAPTER 1: INTRODUCTION ............................................... 1 1.1. Background of the Study ...................................................................................................................................... 1 1.2. Statement of the Problem .................................................................................................................................... 5 1.3. Objective of the Study ............................................................................................................................................ 6
1.3.1 General Objective ........................................................................................................................................ 6 1.3.2 Specific Objectives ...................................................................................................................................... 6
1.4. Hypothesis Development .................................................................................................................................. 6 1.5. Significance of the Study .................................................................................................................................... 10 1.6. Scope of the Study .................................................................................................................................................... 10 1.7. Limitation of the Study ......................................................................................................................................... 11 1.8. Structure of the Research Project ................................................................................................................. 12
CHAPTER 2: REVIEW OF RELATED LITERATURE ................. 13 2.1. General Overview ...................................................................................................................................................... 13 2.2. Definition of Capital Structure ....................................................................................................................... 14 2.3. Capital Structure Theories ................................................................................................................................. 15
2.3.1 Capital Structure Irrelevancy Theory .................................................................................. 15 2.3.2 Capital Structure Relevancy Theories ................................................................................. 17
2.3.2.1 Static Trade-off Theory ..................................................................................................... 17 2.3.2.2 Pecking Order Theory ....................................................................................................... 19 2.3.2.3 Agency Cost Theory ............................................................................................................ 21
2.4. Theoretical Determinants of Bank Capital Structure ................................................................. 22 2.5. Empirical Evidences of Determinants of Capital Structure .................................................. 27
2.5.1 In Developed Countries ......................................................................................................................... 27 2.5.2 In Developing Countries ....................................................................................................................... 28 2.5.3 In Ethiopia ...................................................................................................................................................... 30
2.6. Features of Appropriate Capital Structure ............................................................................................ 31

viii
Table of Contents: Continued
Contents Pages 2.7. Banks’ Capital Structure ..................................................................................................................................... 32 2.8. Overview of Commercial Banks in Ethiopia .................................................................................... 32
CHAPTER 3: RESEARCH METHODOLOGY ………................. 35 3.1. Study Design .................................................................................................................................................................. 35 3.2. Sampling Design ......................................................................................................................................................... 35 3.3. Data Source and Collection ……....................................................................................................................... 36 3.4. Method of Data Analysis ..................................................................................................................................... 36 3.5. Model Specification ................................................................................................................................................. 37 3.6. Definition and Measurement of Variables ......................................................................................... 38
3.6.1. Dependent Variable ............................................................................................................................. 38 3.6.2. Independent Variables ....................................................................................................................... 38
CHAPTER 4: RESULTS AND DISCUSSIONS ………................. 41 4.1. Data Testing …………………………………............................................................................................................................. 41
4.1.1 Test of Normality ................................................................................................................................... 41 4.1.2 Test of Multicollinearity................................................................................................................... 43 4.1.3 Test of Heteroskedasticity ............................................................................................................. 45 4.1.4 Outliers’ Detection .............................................................................................................................. 46 4.1.5 Test of Model Specification .......................................................................................................... 47
4.1.5.1 Ramsey RESET for Omitted Variables ....................................................... 47 4.1.5.2 Link Test for Specification ........................................................................................ 48
4.2. Correlation Analysis ............................................................................................................................................... 49 4.3. Descriptive Statistics ............................................................................................................................................. 50 4.4. Multivariate Regression Analysis .............................................................................................................. 52 4.5. Hypothesis Testing and Discussion of Results .............................................................................. 56
4.5.1 Hypothesis Testing ............................................................................................................................. 58 4.5.2 Test of the Consistency of Capital Structure Theories ......................................... 61
CHAPTER 5: CONCLUSION AND RECOMMENDATION …… 63 5.1. Summary and Conclusion .................................................................................................................................. 63
5.1.1 Summary of Findings ......................................................................................................................... 63 5.1.2 Conclusions ………………………...................................................................................................................... 64
5.2. Recommendations ..................................................................................................................................................... 66
BIBLIOGRAPHY ............................................................................................................................................................... 69
Appendix 1: Tabulated Standardized Residuals ................................................................................................ 72 Appendix 2: Simple Regression Results of DER with each Independent Variable ......... 73 Appendix 3: Financial Statements of the Sampled Commercial Banks ..................................... 75

ix
LIST OF TABLES
TABLE DISCRIPTION PAGE
Table 2.1 Capital and Branch Network of Banking System in Ethiopia 34
Table 3.1 Summary of Variables and Their Measures 40
Table 4.1 Skewness/Kurtosis Tests for Normality 43
Table 4.2 Shapiro-Wilk W Test for Normality 43
Table 4.3 Pair-Wise Correlation Matrix Between Explanatory Variables 44 Table 4.4 The Variance Inflation Factor (VIF) Technique to Detect
Multicollinearity 44 Table 4.5 Breusch-Pagan/ Cook-Weisberg Test for Heteroskedasticity 45
Table 4.6 Cameron and Trivedi's Decomposition of IM-test 45
Table 4.7 Ramsey RESET Test for Omitted Variables 47
Table 4.8 Link Test for Specification of DER Model 48 Table 4.9 Correlation Matrix and their Significance Level of Correlation
for Dependent Variable and Independent Variables 49 Table 4.10 Summary of Descriptive Statistics 50
Table 4.11 Regression Result of DER and the Explanatory Variables 53
Table 4.12 Firm Specific Analysis of Determinants of Capital Structure 56 Table 4.13 The Hypothesized, Expected and Observed Signs of the
Independent Variables 57

x
LIST OF GRAPHS
GRAPH DISCRIPTION PAGE
Graph 2.1 The Static Trade-off Theory of Capital Structure 18
Graph 4.1 Graphical Test of Normality Using Histogram 42
Graph 4.2 Dot Plot Showing Normal Distribution of Data 42
Graph 4.3 Graph of Residuals and Fitted Values 46

xi
ABBREVIATIONS AND ACRONYMS
ACT Agency Cost Theory AG Age CBE Commercial Bank of Ethiopia CBBE Construction and Business Bank of Ethiopia CEO Chief Executive Officer CLRM Classical Linear Regression Model DBE Development Bank of Ethiopia DER Debt to Equity Ratio G7 Group of Seven (Canada, France, Germany, Italy, Japan, United Kingdom
and United States of America) GDP Gross Domestic Product GR Growth H0 Null Hypothesis H1 Alternate Hypothesis IFC International Finance Corporation MM Modigliani and Miller NBE National Bank of Ethiopia OLS Ordinary Least Square POT Pecking Order Theory PR Profitability RESET Regression Specification Error Test STT Static Trade-off Theory SZ Size TN Tangibility TXS Tax-Shield USA United States of America

1
CHAPTER 11
IINNTTRROODDUUCCTTIIOONN
This chapter introduces the research subject briefly and outlines the research background, incorporating the results and problems from past studies. The problem statement is given and research objectives have been clearly described and based on which hypotheses are formed. Apart from this, this chapter also identifies the significance, scope, limitations and structure of the research project.
1.1. Background of the Study Capital structure of a firm describes the way in which a firm raises capital needed to
establish and expand its business activities. It is a mixture of various types of equity and
debt capital a firm maintains resulting from its financing decisions. For example, a firm that
sells Birr 25 million in equity and Birr 75 million in debts is said to be 25 percent equity-
financed and 75 percent debt-financed. The firm's ratio of debt to total financing, the
leverage, is therefore, 75 percent. Exceptionally crucial is for someone to know how a firm
chooses its optimal mix of debt and equity capital. Phrased in another way, what is the
optimal capital structure for a firm? Whether or not an optimal capital structure does exist is
an issue in corporate finance (Myers, 1984).
The capital structure decision is one of the most important decisions made by financial
managers in this modern era. The capital structure decision is at the center of many other
decisions in the area of corporate finance. One of the many objectives of a corporate
financial manager is to ensure low cost of capital and thus maximize the wealth of
shareholders. Hence, capital structure is one of the effective tools of management to manage
the cost of capital. An optimal capital structure is reached at a point where the cost of the
capital is minimal. But, what are the potential determinants of such optimal capital
structure? This is the key question that has been answered by this research in the case of
commercial banks in Ethiopia.
For the past sixty years, after the influential irrelevance theory of Modigliani and Miller
(1958) on capital structure, capital structure choice has inspired and fascinated many
researchers. Therefore, many studies theoretically and empirically investigated and

2
explained firms’ capital structure choices. But, there still remains no clear answer to Myer’s
25 years old question (Myers, 1984, pp575) “How do firms choose their capital structure?”
Different theories answer this question from different points of view. For instance, Static
trade-off theory postulates the existence of an optimal capital structure, which indicates the
optimal choice of capital structure by firms, is a balance of corporate tax-shield against the
bankruptcy cost and agency cost.
Research on the determinants of capital structure was initially directed mainly to firms in the
developed countries specifically in United States. One of the classical researches was carried
out by Titman and Wessels (1988); where they studied the theoretical determinants of
capital structure. The theoretical attributes namely; asset structure, non-debt tax shields,
growth, uniqueness, industry classification, firm size, earnings volatility and profitability
were tested to see how they affect a firm’s choice of debt-equity mix. To broader the
understanding of capital structure models, Rajan and Zingales (1995) have attempted to find
out whether the capital structure choices in other countries are made based on factors that
similar to those capital structure influencing ones in U.S firms. Four factors; tangibility of
assets, growth, firm size and profitability were tested to see their influences on leverage.
However, there were not many researches directed towards developing countries that saw
the applicability of the theories of capital structure developed from the developed nations.
Booth et al. (2001), Maghyereh (2005), Amidu (2007), Abor (2008), and Bas et al. (2009)
were among the scholars who have studied the capital structure issues in the developing
nations. Thus, one of the prominent studies was done by Booth et al. (2001). They have
undertaken an interesting study by taking secondary data from the International Finance
Corporation (IFC) for the largest companies in 10 developing countries. Several variables
were tested and analyzed to explain capital structure determinants by considering the impact
of taxes, agency conflicts, financial distress and the impact of informational asymmetries.
The variables mentioned include tax, business risk, asset tangibility, sales, return on assets
and market-to-book ratio. On the other side, one of the latest studies was conducted by Bas
et al. (2009) in developing countries. This paper examined the determinants of capital
structure decisions of firms in developing countries collecting secondary data for 11,125
firms from World Bank of 25 developing countries. Bas et al. draw the following major
conclusions from the results.

3
Regardless of the fact that how a firm defines capital structure, in accordance with the
capital structure theories, the importance of firm level variables, such as tangibility and
profitability, in determining capital structure decision is confirmed. However, the research
scholars have identified some systematic differences in the way debt ratios were affected by
GDP growth rates, inflation rates and the development of capital markets.
Most capital structure studies made to date are based on data from developed countries.
There are few studies that provide evidence from developing countries. The determinants of
capital structure of Ethiopian firms are still in under-explored areas in the literature of
financing decision. As per the researcher’s access and knowledge, the researches conducted
on determinants of capital structure so far in Ethiopian case are by Ashenafi (2005) and
Mintesinot (2010).
Ashenafi (2005) approached the question of capital structure using data from medium firms
in Ethiopia. He took variables like non-debt tax shield, economic risk, age of firms, size of
firms, tangibility, profitability and growth were regressed against leverage. The results
proved that non-debt tax-shield, economic risk, profitability, growth, tangibility, and age
showed a negative coefficient of correlation with debt to equity ratio. Recently, Mintesinot
(2010) has undertaken an attention-grabbing study on the determinants of capital structure
evidencing manufacturing firms in Tigray, Ethiopia. Mintesinot has used eight explanatory
variables: Tangibility, Profitability, Growth, Age, Uniqueness, Size, Earnings Volatility, and
Non-Debt Tax Shields. After regressing these variables against leverage, he could come up
with the outcomes as following: Tangibility, Growth, Age, Size, Earnings Volatility and
Non Debt Tax-Shield variables are the significant determinants of capital structure in at least
one out of the three models for capital structure employed in his study.
In general, there are a large number of empirical papers on the determinants of capital
structure. Nevertheless, understanding the determinants of capital structure is as important
for banks as for non-banking firms. Diamond and Rajan (2000) found that a bank’s capital
structure affects its stability as well as ability to effectively provide liquidity and credits to
debtors and borrowers, respectively. Given that a well-functioning and well-developing
banking system plays a crucial role in promoting growth of an economy, it is imperative to
understand the factors which drive the capital structure decision of banks. One of the well-
known researches was carried out by Gropp and Heider (2007) evidencing banks from

4
developed countries (US and 15 EU members, for 14 years) to study capital structure
determinants of banks. Their results provided strong support for the relevance of standard
determinants of capital structure on bank capital by testing the significance of size,
profitability, market-to-book ratio and asset tangibility. Another study by Octavia and
Brown (2008) investigated whether the standard determinants of capital structure can be
applied to banks in developing countries. The results of Octavia and Brown suggested that
the standard determinants of capital structure do have power in explaining leverage of banks
in developing countries.
Currently, there is no clear understanding on how commercial banks operating in Ethiopia
choose their capital structure and what internal factors influence their corporate financing
behavior. In this study, the researcher has tried to identify the factors which determine
capital structure decisions by selecting 6 (six) bank relevant firm-specific explanatory
variables such as profitability, collateral value of assets (tangibility), size of the firm,
growth, age of the firm and tax-shield from the empirical studies of Titman and wassels
(1988) in USA, Rijan and Zingales (1995) in G7 countries, Booth et al. (2001) in developing
countries, Ashenafi (2005) in Ethiopia, Gropp and Heider (2007) in banks of developed
countries, Octavia and Brown (2008) in banks of developing countries, Bas et al. (2009) in
developing countries and Mintesinot (2010) in Ethiopia.
Multivariate ordinary least square (OLS) regression method is used to run the analysis of the
pooled cross-sectional data collected from the National Bank of Ethiopia of 10 years
financial statement of 7 commercial banks. The powerful and full-featured statistical
programming language, STATA software, is used to test the reliability of the data, to test
validity of the specified model and to analyze it. As a result, this research presents an
empirical analysis of determinants of capital structure of commercial banking sector in
Ethiopia with most recent available data.
5
1.2. Statement of the Problem
Over the previous years, numerous studies on capital structure theory have appeared.
However, based on the research made by Myers (1984), it is stated that each of the theories
on capital structure applied are based on certain circumstances. As such, the theories are not
designed to be general rather they are conditional theories of capital structure; each of which
emphasizes on certain costs and benefits of alternative financing strategies.
Most capital structure studies to date are based on data from developed countries’ firms and
very few studies provide evidence from developing countries. The capital structure of banks
has not also been investigated; there is no clear understanding on how banks construct their
capital structure and what internal (firm-specific) factors influence their corporate financing
decision. Therefore, given the unique financial features of banks and the environment in
which they operate, there is a strong ground to conduct separate study on capital structure
determinants in banks.
This study, therefore, tried to examine determinants of capital structure of the Ethiopian
commercial banking environment by using its internal (firm-specific) determining factors.
Ethiopia differs from other developing countries previously studied in such a way it has no
secondary capital market which makes things easier for firms to raise funds and choose the
best mix of debt and equity sources. In general, the researcher is fascinated to conduct this
study because of the following motives:
I. There is no clear evidence about the potential determinants of capital structure of
commercial banks operating in Ethiopia.
II. There is no clear evidence whether the financing decisions made by commercial
banks in Ethiopia provide empirical support for the existing capital structure
relevancy theories.
III. As per the access and knowledge of the researcher, no study has been made casing
the Ethiopian Commercial Banks to analyze capital structure and its determinants.
Therefore, this paper fills the stated gap by identifying the factor that determine capital
structure decision and providing additional facts to the theories of capital structure relevancy
evidencing commercial banks in Ethiopia.

6
1.3. Objective of the Study
1.3.1. General Objective
The general objective of this study is to analyze the internal (firm level) factors determining
capital structure decisions of Commercial Banks in Ethiopia.
1.3.2. Specific Objectives
This study attempted to achieve the following specific objectives:
i. To measure the effect of change in profitability on the financing mix (leverage) of
commercial banks in Ethiopia,
ii. To determine the consequence of change in the tangibility of assets held by
commercial banks of Ethiopia on the debt to equity ratio,
iii. To find out the extent to which variations in bank size explain the variations in debt
to equity ratio of commercial banking business in Ethiopia,
iv. To determine the effect of a change in growth of commercial banks on their leverage,
v. To find out the response of capital structure to the age variation of the commercial
banks operating in Ethiopia,
vi. To determine the impact of tax-shield on financing decision of commercial banks in
Ethiopia,
vii. To verify if capital structure decisions that are made in the commercial banks of
Ethiopia provide empirical support for existing theories.
11..44.. HHyyppootthheessiiss DDeevveellooppmmeenntt
A major purpose of this paper is to estimate the factors that determine the choice of capital
structure in Ethiopian commercial banks. Previous capital structure theories and empirical
results identify a number of variables that influence firm's debt position in the context of
firm-specific (Titman and Wessels, 1988; Harris and Raviv, 1991; Rajan and Zingales,
1995; Booth et al., 2001; Benito 2003). To achieve the intended goal, the researcher has
formulated six hypotheses. The developed hypotheses and their rationale are discussed
below.
7
I. PROFITABILITY
Profitability is a strong point of dissent between the two theories of capital structure i.e.
Pecking order theory and Static trade-off Theory. For the Static trade-off theory, the higher
the profitability of the firm, the more are the reasons it will have to issue debt, reducing its
tax burden.
On the other hand, Pecking order theory assumes that larger earnings lead to the increase of
the main source of capital firms choose to cover their financial deficit: retained earnings.
Therefore, the Static trade-off theory expects a positive relationship between profitability
and leverage, whereas the pecking order theory expects exactly the opposite.
Hypothesis 1: Ho = There is a negative relationship between profitability and leverage ratio. H1 = There is a positive relationship between profitability and leverage ratio.
II. TANGIBILITY
A firm having a large amount of fixed assets can easily raise debt at cheaper rates because of
the collateral value of those fixed assets (tangibility). Firms with a higher ratio of tangible
assets have an incentive to borrow more because loans are available to them at a relatively
cheaper rate. Therefore a positive relationship between tangibility of assets and firm’s
leverage is expected.
Titman and Wessels (1988) and Harris and Raviv (1991) argue that tangibility might be the
major factor in determining the firm’s debt levels. If debt is secured against assets, borrower
is restricted to using loaned funds for a specific project, and creditors have an improved
guarantee of repayment. Thus, firms with high level of fixed assets would have higher level
of debt.
Hypothesis 2: Ho = There is a positive relationship between tangibility and leverage ratio. H1 = There is a negative relationship between tangibility and leverage ratio.

8
III. SIZE
Size is one of the most widely accepted determinants in research on capital structure.
Relationship between size and leverage is mixed. For the Static trade-off approach, the
larger the firm, the greater is the possibility that it can issue debt there by resulting in an
existence of a positive relationship between debt and size. One of the reasons for this is
that the larger the firm the lower is the risk of bankruptcy (Titman and Wessels, 1988).
With respect to the Pecking order theory, Rajan and Zingales (1995) argued that this
relationship could be negative. There is less asymmetrical information about the larger
firms, reducing the chances of undervaluation of the new equity issue, encouraging large
firms to use equity financing. This means that there is a negative relationship between size
and leverage of the firm.
Hypothesis 3: Ho = There is a positive relationship between the firm’s size and its leverage ratio. H1 = There is a negative relationship between the firm’s size and its leverage ratio.
IV. GROWTH
The relationship between growth opportunities and the debt ratio is also quite conflicting.
The Static trade-off theory predicts that firms with more growth opportunities will have less
debt as there is less need for the role of debt. Firms that have growth opportunities would
prefer to retain debt capacity as they might need to borrow in the future. Further, growth
opportunities are capital assets that add value to a firm but cannot be collateralized and do
not generate current taxable income (Titman and Wessels, 1988). For this reason, the
arguments put forth suggest a negative relationship between debt and growth opportunities.
However, Benito (2003) proposes the opposite. If firms have growth opportunities, then they
require more funds to grow. Given that internal resources are not sufficient, firms would
then turn to external sources of finance, which would lead to a higher debt level in firms.
Hypothesis 4: Ho = There is a positive relationship between growth and leverage ratio. H1 = There is a negative relationship between growth and leverage ratio.

9
V. AGE
Age of the firm is a standard measure of reputation in capital structure models. As a firm
continues longer in business, it establishes itself as an ongoing business and therefore
increases its capacity to take more on debt; hence age is positively related to debt. Before
granting a loan, banks tend to evaluate the creditworthiness of entrepreneurs as these are
generally believed to pin high hopes on very risky projects promising high profitability
rates. If the investment is profitable, shareholders will collect a significant share of the
earnings, but if the project fails, then the creditors have to bear the consequences (Myers,
1977).
According to Mintesinot (2010), as firms become aged, the long years of track record will
enable them to easily convince creditors and also will expertise in finding alternative credit
source cost effectively or in favorable conditions while going for debt capital.
Hypothesis 5: Ho = There is a positive relationship between a firm’s age and its leverage ratio. H1 = There is a negative relationship between a firm’s age and its leverage ratio.
VI. TAX-SHIELD
Tax-Shield is believed to be important factor that affects the amount of debt that a firm has
to have in its capital structure (Barclay and Smith, 1999). The more profitable a firm is, the
more is the amount of tax it would have to pay on its interest payments. To avoid paying a
lot in tax, firms might prefer to take more debt because interest payments artificially reduce
the profits of the firm and consequently they pay less tax on their profits. Therefore, by
taking more debt in their capital structure, firms benefit from the ‘interest tax-shield’. This
benefit of debt is promoted mainly by the Static trade-off theory which predicts that the
more the tax amount a firm has to pay, the greater is the debt it will have in its capital
structure.
Hypothesis 6: Ho = There is a positive relationship between tax-shield and leverage ratio. H1 = There is a negative relationship between tax-shield and leverage ratio.

10
11..55.. SSiiggnniiffiiccaannccee ooff tthhee SSttuuddyy
Since banking industry is emerging and flourishing in the Ethiopian economy, assessing the
factors determining capital structure decision will help concerned parties innovate actions
that can fortify their competitive position in the industry. This study, therefore, apart being a
step for the researcher’s educational career, has the following immense importance:
First, even though research studies related to the area of capital structure decisions are
plenty, those that are concerned in the financial system of developing countries are few. This
study, therefore, attempts all its best to contribute to the literature by assessing the capital
structure decision determining firm-specific factors of commercial banks in the developing
countries like Ethiopia.
Second, the study will have great importance to external investors and shareholders, bank
managers, lenders and policy makers in making knowledgeable decisions and regulations
considering the financing patterns of the banking sector in Ethiopia.
Last but not least, the study notably contributes to other studies to be made in different
economic sectors by providing the picture of the firm level factors determining capital
structure decisions of commercial banks in Ethiopia by serving as a reference point.
11..66.. SSccooppee ooff tthhee SSttuuddyy
In any study area, it is expected to encounter numerous issues such as the concentration of
field study, data collection and others which are constrained by available resources like
timeframe, financial and availability of information. This study is of no exceptions where
the scope is delimited to the study of determinants of capital structure in the field of
corporate finance, the sample size and lastly the time horizon of the study. The details of the
scope of this study are as follows:
a) For fair and uniform comparison and to obtain valid results, this study is delimited to
select commercial banks in Ethiopia. In other words, the reason why this study is
delimited to commercial banking sector is:
Firstly, commercial banking business is emerging and flourishing in
Ethiopian economy where the literature on determinants of capital structure is
limited.

11
Secondly, the commercial banks share common attributes in accounting
practices, corporate governance and corporate control. As a result,
Development (DBE), Construction and Business (CBBE) and other banks are
not considered due to their specialized business objectives.
b) This research project is limited to the sample of seven commercial banks that are
selected from the population of 11 commercial banks and represents 64 percent of
the existing commercial banks. More specifically, the entire population of
commercial banks that have been operating, at least for the last ten years (2000-
2009), was considered and secondary data was collected from their 10 years’
financial statements.
c) The study considered only firm-specific determinants of capital structure. External
factors such as macroeconomic determinants of capital structure (Inflation, GDP
growth, Interest rate, etc.) which are beyond the control of the firm are not included
the study.
11..77.. LLiimmiittaattiioonnss ooff tthhee SSttuuddyy
There is nothing a study that can be made without constraints. Therefore, there are four main
limitations in this study.
a) Due to insufficiency of the research project time, the researcher could not include
suspected macroeconomic (external) factors in Ethiopia which may have a certain
contribution to the determination of the financing mix of a firm.
b) Due to the unavailability of secondary market, the researcher was limited to take
only determinant factors that can be measured only by taking data from the banks
financial statements.
c) The state owned, namely Commercial Bank of Ethiopia, is not comparable to the
other banks in the sample since it is more than three times as large as each of the
other banks in the sample. Therefore, the analysis, based on the observations from all
the banks, may be subjective to some extent.
d) The researcher didn’t include the primary data such as interview of the banks’ CEOs
and financial managers to analyze their knowledge on capital structure and their
financing decision practices. The study would have been much better had it been
able to encompass the exiting practices of their financing decisions.

12
11..88.. SSttrruuccttuurree ooff tthhee RReesseeaarrcchh PPrroojjeecctt
The research project comprises five chapters as follows:
Chapter 1
Chapter 2
Chapter 3
Chapter 4
Chapter 5
INTRODUCTION
Introduces the research subject briefly and outlines the research background, incorporating the problems and results from past studies. The problem statement is given and research objectives have been clearly described and based on which, hypotheses are formed and model is specified. Apart from this, it also identifies the significance, scope and limitations of the study.
LITERATURE OF RELATED REVIEW
RESEARCH METHODOLOGY
RESULTS &DISCUSSIONS
Presents the results of the multivariate regression model. This chapter analyzes the collected secondary data, the results and explains the determinants of capital structure in the selected case.
Presents the review of related empirical literatures. It is divided into several areas as follows; general overview, definition, theories, theoretical determinants, empirical evidence, features of capital structure, bank capital structure, and overview of commercial banking in Ethiopia.
Highlights the methodology of the study. The chapter comprises study design, sampling design, data source and collection, method of data analysis and model specification. Here, the definitions and measurements of the variables are well defined.
CONCLUSION & RECOMMENDATION
Summarizes the findings of the study, concludes the results and forwards recommendations based on the findings of the study.

13
CHAPTER 22
RREEVVIIEEWW OOFF RREELLAATTEEDD LLIITTEERRAATTUURREE
The literature review helps in generating a framework for the study by identifying the important issues in capital structure and its theories that are relevant to the study. Therefore, this chapter is divided into several areas; general overview, definition of capital structure, theories of capital structure, theoretical determinants of capital structure, bank capital structure, Overview of Commercial Banks in Ethiopia. In this chapter, a review of related empirical literature is also presented.
22..11.. General Overview Corporate sector growth is vital to economic development. The issue of finance has been
identified as an immediate reason why businesses in developing countries fail to start or to
progress. It is imperative for firms to be able to finance their activities and grow over time if
they are ever to play an increasing and predominant role in providing employment as well as
income in terms of profits, dividends and wages to households. So, a path to development
could not be realized without enabling to evaluate the business environmental factors
particularly factors affecting access to finance. Consequently, managerial decisions related
to finance are at the center of the economic or business activities, which are the subject
matter of financial management discipline.
Financial management discipline has three major decision functions/activities:
i. Capital budgeting (Investment) Decision: deal with the efficient utilization of capital
or funds to acquire assets. It is more concerned with the size, type and percentage
composition of assets of a firm.
ii. Capital structure (financing) decisions: emphasize on the proper selection of mix of
capital i.e. debt vs. equity. It deals mainly with the size, type and percentage
composition of capital sources.
iii. Asset management decision: is the other decision area that deal with efficient
utilization of assets, being acquired through investment decision.
Here, the literature focuses on capital structure decisions’ general theories, and particularly
the related determinants of capital structure.

14
22..22.. Definition of Capital Structure There are many definitions given to capital structure of companies. Brealey and Myers
(1991) defined capital structure as comprising of debt, equity or hybrid securities issued by
the firm. VanHorn (1989) defined capital structure as the proportion of debt to the total
capital of the firms. Pandey (2005) defined capital structure as a choice of firms between
internal and external financial instruments.
From the definitions given by many previous researchers, capital structure of a firm
describes the way in which a firm raise capital needed to establish and expand its business
activities. It is a mixture of various types of equity and debt capital a firm maintains,
resulting from the firm’s financing decisions. The amount of debt that a firm uses to finance
its assets is called leverage. A firm with a lot of debt in its capital structure is said to be
highly levered. A firm with no debt is said to be unlevered. For example, a firm that sells
Birr 20 million in equity and Birr 80 million in debts is said to be 20 percent equity-financed
and 80 percent debt-financed. The firm's ratio of debt to total capital is 80 percent and is
referred to as the firm's leverage.
The term capital structure is used to represent the proportionate relationship between debt
and equity. Debt represents the creditors’ claim i.e. liabilities or borrowings. Equity includes
paid-up share capital, share premium, and reserve and surplus (retained earnings).
Managers, in the extent to pursue wealth maximization objective of a firm, should examine
the set of theories and at least major factors affecting the decision that help them choose the
optimal capital structure. Normally firms have option of choosing debt financing, equity
financing, or combination of the two, with the other option of internal financing mainly from
the retained earnings. Such dealings of financing decisions are, in fact, termed as Capital
Structure Decisions.

15
22..33.. Capital Structure Theories Beginning from Modigliani and Miller (1958)’s irrelevance proposition, capital structure
puzzle has drawn a lot of attention. How do firms choose their capital structure? What are
the determinants of firm capital structure decisions? Numerous researches study in these
questions, however, the results are still ambiguous. This Section starts with the capital
structure irrelevancy theory. Following subsections give the overview of theories and
empirical studies that suggest that capital structure affects firm’s value.
2.3.1. Capital Structure Irrelevancy Theory
(Modigliani – Miller Theorem) In the 1950s, two financial economists, Franco Modigliani and Merton Miller, made
significant contribution to the corporate finance and were rewarded decades later with a
Noble Prize in economics. They came up with the new propositions to explain the capital
structure theory and here starts the birth of modern capital structure theory. Their
contribution was to show that, under certain assumptions (known as the MM assumptions
and MM theory), the capital structure, or mix of debt and equity, does not have an impact on
the overall value of the firm. Theory of irrelevancy was presented in an era when research
was dominated by assumption that there is no interaction between a firm’s investment and
financial decisions of the firm.
Modigliani and Miller (1958) demonstrated that the market value of a firm is determined by
its earning power and the risk of its underlying assets, and independent of the way it chooses
to finance its investments or distributes dividends. Moreover, a firm can choose between
three methods of financing: issuing shares, borrowing or spending profits (as opposed to
disbursing them to shareholders as dividends). The theorem gets much more complicated,
but the basic idea is that under certain assumptions, it makes no difference whether a firm
finances itself with debt or equity.
Five years later, Modigliani and Miller (1963) introduced corporate taxes into their earlier
model by setting free the first assumption of no taxes. They argued that optimal capital
structure can be obtained for firms with 100 percent debt financing by having the tax shield
benefits of using debt. With tax introduced the value of levered firm becomes higher. This
was their correction model. Some researchers felt that Modigliani and Miller failed to

16
discuss in their article on the practical applications of their theory to individual firms and on
how well the theory explains observed facts, such as debt ratios, market reactions to security
issues and so on.
Thereafter, several empirical researches were conducted on the concept developed by
Modigliani and Miller. In most of the later studies, researchers like Durand et al. (1989)
accepted the importance of financial leverage in affecting the overall cost of capital, the
return to the shareholders and the value of a firm. They criticized the hypothesis of MM
theory, and maintained that several factors such as existence of imperfectness in the market,
the differences, existence of transaction cost and institutional restrictions and preferences for
the present income over the future to affect the capital structure study. These have relevance
in affecting the value of a firm and were ignored by MM.
Accordingly, if capital structure is irrelevant in a perfect market, then imperfections which
exist in the real world must be the cause of its relevance. In the next section we look at how,
when assumptions in the M&M model are relaxed, imperfections arise and how they are
dealt with. Subsequent literatures placed much emphasis on relaxing the assumptions made
by Modigliani and Miller, in particular considering agency costs (Jensen and Meckling,
1976; Myers, 1977; Harris and Raviv, 1990), signaling (Ross, 1977), asymmetric
information (Myers and Majluf, 1984; Myers, 1984), product/input market interactions
(Brander and Lewis, 1986; Titman, 1984), corporate control considerations (Harris and
Raviv, 1988) and taxes (Bradley et al., 1984).
The current state of capital structure comprises a wide variety of theoretical approaches but
no theory is universally accepted and practically applied (Myers, 2001; Harris and Raviv,
1991). According to Myers 2001 (p.81)
“There is no universal theory of the debt-equity choice, and no reason to
expect one. There are several useful conditional theories however”.
The major reason why financing matters include taxes, differences in information and
agency costs. The different theories of optimal capital structure depend on which economic
aspect and firm characteristic we focus on.

17
2.3.2. Capital Structure Relevancy Theories
According to Buferna et al (2005), in the literature of capital structure, three important and
popular but conflicting capital structure relevancy theories have been developed, which
includes the Static trade-off theory, Pecking order theory and Agency costs theory. These
theories are explained below:
2.3.2.1. Static Trade-off Theory
The Static trade-off theory (STT) came as a reaction on the Miller and Modigliani theory,
presenting the benefits of debt financing via debt related tax shields. Doubts were raised
over the fact that there was no offsetting cost to debt. Therefore, a discussion followed
saying that the optimal leverage should be found where a trade-off between tax shield
benefits of debt and costs of financial distress was found (Shyam-Sunder and Myers, 1999).
Debt enables the possibility to deduct interest charges raising incentive for higher leverage
in order to maximize the tax shield. By doing this the firm value increases with the value of
the tax shield (Graham, 2000). Damodaran (2001) stretches the increased financial discipline
for managers as a consequence of higher debt levels. However there have been raised
concerns on increasing risks of bankruptcy with increasing debt levels and likelihood of
raising agency costs occurring between owners and managers. An underlying reason for this
is a conflict of interests generated by debt (Myers, 1984). Therefore, according to the trade-
off theory, an optimal debt level which maximizes the value of the firm does exist, when
attaining a trade off as balancing the benefits of debt against the cost of financial distress.
As indicated in Graph 2.1, the straight line AB shows the value of a firm under all-equity
financing. When a firm undertakes debt it has to pay interest. Interest payments are
generally tax deductible, thus when a firm takes debt; it is able to increase its value. This is
called the interest tax shield of debt. Debt almost literally shields the firm from paying out
more in taxes. Therefore, as curve AC shows, initially as the firm undertakes more debt, the
value of the firm increases. However, after a certain level (the optimum level) of debt, the
value of the firm starts falling as shown by the falling portion of curve AC. After a certain
level of debt, the costs of debt start outweighing the benefits of debt. This is illustrated by
the curve AD, which shows that the costs of financial distress rise significantly at higher
levels of debt. At higher levels of debt, firms have to pay more interest and if they are
unable to repay the debt and interest, then they are likely to go bankrupt. As costs of

18
financial distress rise, firms would prefer to stick to a ‘reasonable’ level of debt. This is
illustrated in the diagram above where the optimum market value of the firm is achieved
where the present value of the interest tax shield is at a maximum. The trade-off model
assumes that companies have an optimal capital structure and they aim to attain this through
a target debt level. This is the reason why the Trade-off Theory is often referred to as the
‘Static Trade-off Theory’ in the literature.
Graph 2.1: The Static Trade-off Theory of Capital Structure
Source: Myers, 1984 pp 577
Debt has the disadvantage that it increases the probability of firms becoming financially
distressed. The costs of debt include potential bankruptcy costs. Repayment of interest on
debt is an obligation that a firm has to fulfill whatever its financial state. Hence, if a firm is
unable to undertake its debt obligation it will obviously face bankruptcy.
Another cost of debt is the agency conflicts that can arise between stockholders/shareholders
and bondholders/debt holders (Fama and French, 2002). This can be explained by the fact
that if an investment pays off equity holders are the ones to benefit as they are entitled to the
residual profits after interest on debt has been repaid. Risky investments are the ones that
normally have higher returns and therefore equity holders will prefer these types of
investment. Debt holders on the other hand, are only concerned with their interest payments.
They would prefer firms to choose less profitable but safe investments. This explains the
conflict that may arise between stockholders and bondholders.

19
The benefits of debt include the tax deductibility of interest payments (Benito (2003). As
argued by Benito firms use debt as a means of limiting the interest of managers which may
diverge from the interests of shareholders. In fact, debt reduces free cash flow problems as
excess cash is used to repay debt, rather than managers using it to consume bonuses (Fama
and French, 2002; Harris and Raviv, 1991).
2.3.2.2. Pecking Order Theory
Firm managers or insiders are assumed to possess private information about the
characteristics of firm’s returns and the investment opportunities available to them (Harris
and Raviv, 1991). Various theories have been developed that have attempted to explicitly
model this private information which has consequently given rise to theories other than the
Trade-off Theory. The Pecking Order Theory (POT) is one such theory that attempts to
explain capital structure decisions by formally taking into account the inherent information
asymmetry that exists between different parties. The pioneers that have explicitly accounted
for asymmetric information in their work have been Ross (1977) and Leland and Pyle
(1977). However, the first ones to actually take into account asymmetric information in the
area of capital structure have been Myers (1984) and Myers and Majluf (1984). They
showed that the choice of capital structure mitigates inefficiencies in the firm’s investment
decisions that are caused by information symmetry.
According to the Pecking Order theory, firms have a strong preference for internal finance
(Myers, 1984) as it is believed to have a cost advantage over new debt and equity. If external
finance is required, firms first issue debt and when all other “safe” options are exhausted;
they issue equity as a last option. The literature regarding the Pecking Order theory has been
dormant since its inception in the early 1980’s when it was first proposed by Myers (1984)
and Myers and Majluf (1984).
The Pecking Order Theory proposed by Myers (1984), prescribes a strict ordering or
hierarchy of finance: firms use internal finance first then debt and only when such options
are exhausted, equity finance is used. This is explained by the fact that internal and external
finance are not perfect substitutes.

20
Figure 2.1: Pecking Order of Financial Hierarchy
Source: Henrik and Sandra, 2004 pp 5
The Pecking Order Theory is diagrammatically illustrated above. The hierarchy shown in
Figure 2.1 above can be explained by number of factors. These factors include the costs
associated with each form of finance which are related to the degree of information
asymmetry, the “safeness” of each form of finance or the signal that the issuance of some
form of finance gives to the market. Internal finance is believed to be the cheapest source of
finance followed by debt and equity. The availability of internal funds allows firms to
undertake investment without having to resort to external finance which is relatively more
expensive due a number of factors.
Additionally, Myers (1984), explains this hierarchy by the fact that firms follow the rule of
“issue debt when investors undervalue the firm and issue equity or some other security when
they over-value it.” Investors are aware of this and do not buy securities unless they are
convinced that the firm has exhausted its “debt capacity”. Hence, investors typically ensure
that firms follow a pecking order.
Also the issuance of debt or equity can cause agency problems to arise. The issuance of debt
can cause conflicts to arise between managers and debt holders while the issuance of equity
can cause conflicts to arise between debt holders and equity holders. Furthermore, the
issuance of external finance namely debt, involves repayment of capital and interest which
the firm has to pay whatever its financial state. This increases the risk of financial distress.
All these factors explain why a firm would prefer internal finance over external finance.
21
Another explanation for the pecking order is provided by Myers and Majluf (1984) that
draws from an asymmetric information framework. The management is assumed to know
more about the firm’s value than the potential investors. Only insiders know the quality of a
firm or its investment projects. Therefore outsiders require a premium if they are asked to
fund these projects. The degree of information asymmetry regarding equity is higher when
compared to debt. Financial intermediaries are able to monitor the firm and gain access to
information that outside investors cannot get. Outsiders are normally not able to monitor
firms and thus require a much higher premium on equity finance than debt since they are in
the dark regarding the growth prospects of firms.
Asymmetric information increases the cost of debt but, on the other hand, tax advantages
have an opposing effect, which reduce the cost of debt relative to equity issues (Myers,
1984). The most expensive source of finance is believed to be equity finance due to various
costs associated with new equity issues. These costs include underwriting discounts,
registration fees, taxes and selling and administrative expenses. Also, firms tend to issue
‘safe’ securities first, namely in the form of debt rather than equity. Here ‘safe’ implies that
the terms are not affected by managers inside information (Shyam- Sunder and Myers,
1999). Debt cannot be regarded as a ‘safe’ security as there are costs of financial distress
associated with it, but it is still considered ‘safer’ than equity.
2.3.2.3. Agency Costs Theory
The next important theory mentioned in the literature is the agency cost theory. This theory
was developed by Jensen and Meckling in their 1976 publications. This theory considered
debt to be a necessary factor that creates conflict between equity holders and managers. Both
scholars used this theory to argue that the probability distribution of cash flows provided by
the firm is not independent of its ownership structure and that this fact may be used to
explain optimal capital structure. Jensen and Meckling recommended that, given increasing
agency costs with both the equity-holders and debt-holders, there would be an optimum
combination of outside debt and equity to reduce total agency costs.
Ryen et al. (1997) provide a theoretical summary of agency cost theory. According to Ryen
et al., two sets of agency problems were faced by firms, conflict between managers and
22
stockholders and conflict between stockholders and bondholders. For the managers and
stockholders conflict, managers usually overspend or take less leverage and these are seen
not benefiting the stockholders. Managers take lesser leverage in order to avoid total risk,
which comprises of risk of losing job, reputation and wealth. On the other hand,
overspending by managers to make opportunity lost of firms’ cash flow which could be used
on the activities that benefit stockholders.
Therefore, many studies had been diverted to find out the ways to reduce this agency costs
between managers and stockholders. The conflict of shareholders and bondholders is
another area of agency cost problem, whereby shareholders have better incentives to
maximize their wealth at the expense of the bondholders by the increases in dividend rate,
claim dilution, asset substitution and underinvestment. The only way bondholder can limit
the action to benefit shareholders is to draft a bond covenants, an agreement to limit the firm
on investment, financing, production, dividend payout and etc.
22..44.. Theoretical Determinants of Bank Capital Structure
Following from the above theoretical standpoints, a number of empirical studies have
identified firm-level characteristics. As a result of these studies, some broad categories of
capital structure determinants have emerged. Titman and Wessels (1988), and Harris and
Raviv (1991), however, point out that the choice of suitable explanatory variables is
potentially debatable. In this study, to identify the determinant factors and which of the
capital structure theories is applicable in the Ethiopian Commercial Banking context, the
researcher have concentrated on 6(six) key variables as identified in studies by Titman and
Wessels (1988) in USA, Ashenafi (2005) in Ethiopia, Buferna et al (2005) in Libya, Rajan
and Zingales (2006) in G7 countries, Gropp and Heider (2007) in developed countries,
Octavia and Brown (2008) in developing countries, Al-Dohaiman (2008) in Saudi Arabia
and Mintesinot (2010) in Ethiopia (Tigray Region). The selected six variables are
Profitability, Collateral value (Tangibility), Size, Growth, Age of the Firm and Tax.
However, there is significant disagreement among the capital structure theories, in
particular, between the trade-off and the pecking order theories about the influence of some
factors on the firm’s capital structure. In this section, therefore the discussion involves the
viewpoints of the capital structure theories about the effect of these attributes on leverage
ratio from the view of different prior empirical researches.

23
I. PROFITABILITY
One of the main theoretical controversies is the relationship between leverage and
profitability of a firm. Profitability is a measure of earning power of a firm. The earning
power of a firm is the basic concern of its shareholders. The effect of profitability on
leverage was well explained by the “pecking order” theory that was suggested by Myers
(1984). According to this theory, firm has an ordered preference for financing whereby they
prefer retained earnings as their main source of funds for investment which is followed by
debt. The last resort sought by a firm would be external equity financing. The reason for this
ranking was that internal funds were regarded as ‘cheap’ and not subject to any outside
interference. External debt was ranked next as it was seen cheaper and having fewer
restrictions than issuing equity and the issuance of external equity is seen as the most costly
way of financing a firm. Therefore, when firms which was profitable is seen to have more
retained earnings and choose to have lower leverage, hence a negative relationship between
profitability and leverage is expected.
However, according to the static trade-off theory, high profitability level gives high level of
borrowing capacity. This situation promotes the use tax-shield. Firms normally have to pay
taxes on their profits. To avoid this, they prefer to take more debt in their capital structure as
interest payments on debt are generally tax deductible. Agency costs theories also predict
that profitable firms would take more debt in their capital structure to control the activities
of managers. Hence, the more profitable a firm is, the more debt it will have in its capital
structure. Thus, the trade-off theory hypothesizes a positive relationship between
profitability and debt level (Frank and Goyal, 2003).
II. COLLATERAL VALUE OF ASSETS
Collateral value of assets, also known as Asset Composition or Tangibility; are those assets
that creditors can accept as security for issuing the debt. In an uncertain world, with
asymmetric information, the asset structure of a firm has a direct impact on its capital
structure since a firm’s tangible assets are the most widely accepted sources for the bank
borrowing and secured debts. If banks have imperfect information regarding the behavior of
the firm, firms with few tangible assets find it difficult to raise funds via debt financing. The
type of assets the firm holds plays a significant role in determining that firm’s capital
24
structure. The reason can be that when a large fraction of the firm’s assets is tangible, assets
can serve as collateral, which diminishes the risk of the lender suffering agency costs of
debt.
Harris and Raviv (1991) predicts that firm with higher liquidation value will have more debt.
On the other hand, based on the previous research by Titman and Wessels (1988) argue that
the ratio of fixed to total assets (tangibility) should be an important factor for leverage. The
tangibility of assets represents the effect of the collateral value of assets of the firm’s gearing
level. As such, firms with a higher proportion of tangible assets are more likely to be in a
mature industry thus less risky, which affords higher financial leverage.
Findings by Rajan and Zingales (1995) are consistent with the Static trade-off theory saying
that tangible assets are appropriate for the purpose of raising debt since it act as good
collateral. It also seems to reduce the cost of financial distress. Concluding this, firms with
large ratios of tangible assets would be expected to raise more debt. On the other hand, the
pecking order theory stretch that firms with few tangible assets faces larger asymmetric
information problems and will therefore tend to raise more debt over time and become more
levered (Frank and Goyal, 2003).
III. SIZE OF THE FIRM
Size is one of the most widely accepted determinants in research of capital structure.
Relationship between size and leverage is mixed. Researchers who focus on bankruptcy cost
(static trade-off theory), they justify the positive relationship between size and financial
leverage like this: as large firms are more diversified, have low transaction costs for issuing
new equity, and probability of bankruptcy for large firms is less than smaller firms therefore
size positively relate to leverage.
Theories based on asymmetric information, state that large firms have to inform more to
their investors therefore they prefer equity over debt. Therefore size and leverage holds
negative relationship between them. Pecking order theory also agrees on negative
relationship.
Furthermore, in the research made by Rajan and Zingales (1995), indicate that including size
in their cross sectional analysis, they found that the effect of size on equilibrium leverage is
25
more ambiguous. Thus, larger firms tend to be more diversified and because of that, size
may then be inversely related to the probability of bankruptcy.
IV. GROWTH
The relationship between growth opportunities and the debt ratio is also quite conflicting.
The Trade-off theory predicts that firms with more growth opportunities will have less debt
as there is less need for the disciplining role of debt. Firms that have growth opportunities
would prefer to retain debt capacity as they might need to borrow in the future. Further,
growth opportunities are capital assets that add value to a firm but cannot be collateralised
and do not generate current taxable income (Titman and Wessels, 1988). For this reason, the
arguments put forth suggest a negative relationship between debt and growth opportunities.
However, Benito (2003) proposes the opposite. If firms have growth opportunities, then they
require more funds to grow. Given that internal resources are not sufficient, firms would
then turn to external sources of finance, which would lead to a higher debt level in firms.
Generally, according to the trade-off theory, firms experiencing large growth would raise
less debt since the value of their growth opportunities in case of bankruptcy is close to zero.
On the other hand, the pecking order theory stretches that small firms faces larger
information asymmetries and therefore raise more debt. In order to minimize such
asymmetries, firms with high growth will seek to issue debt. Since high growth firms
traditionally have higher market-to-book ratios this measure will be used as a proxy (Frank
and Goyal, 2003).
V. AGE OF THE FIRM
Age of the firm is a standard measure of reputation in capital structure models. As a firm
continues longer in business, it establishes itself as an ongoing business and therefore
increases its capacity to take on more debt; hence age is positively related to debt. Before
granting a loan, banks tend to evaluate the creditworthiness of entrepreneurs as these are
generally believed to pin high hopes on very risky projects promising high profitability
rates. If the investment is profitable, shareholders will collect a significant share of the
earnings, but if the project fails, then the creditors have to bear the consequences (Myers,
1977). To overcome problems associated with the evaluation of creditworthiness, Diamond
(1989) suggests the use of firm reputation. He takes reputation to mean the good name a
26
firm has built up over the years; the name is recognized by the market, which has observed
the firm’s ability to meet its obligations in a timely manner. Directors concerned with a
firm’s reputation tend to act more prudently and avoid riskier projects in favor of safer
projects, even when the latter have not been approved by shareholders, thus reducing debt
agency costs.
Generally, according to Mintesinot (2010), as firms became aged, the long years of track
record will enable them to easily convince creditors and also will expertise in finding
alternative credit source cost effectively or in favorable terms while going for debt capital.
VI. TAX-SHIELD
Numerous empirical studies have explored the impact of tax-shield on corporate financing
decisions in the major industrial countries. Some are concerned directly with tax policy, for
example: DeAngelo and Masulis (1980), MacKie-Mason (1990) and Graham (2000).
DeAngelo and Masulis (1980) show that there are other alternative tax shields such as
depreciation, research and development expenses, investment deductions, etc., that could
substitute the fiscal role of debt. MacKie-Mason (1990) studied the tax effect on corporate
financing decisions and provided evidence of substantial tax effect on the choice between
debt and equity. He concluded that changes in the marginal tax rate for any firm should
affect financing decisions. When already exhausted (with loss carry forwards) or with a high
probability of facing a zero tax rate, a firm with high tax shield is less likely to finance with
debt. The reason is that tax shields lower the effective marginal tax rate on interest
deduction. On the other hand, Graham (1999) concluded that in general, taxes do affect
corporate financial decisions, but the magnitude of the effect is mostly “not large”.
27
22..55.. Empirical Evidences of Determinants of Capital Structure
2.5.1. In Developed Countries
After the influential introductory paper on capital structure by Modigliani and Miller, there
were quite a number of researches directed towards finding the determinants of capital
structure choice. Research on the determinants of capital structure initially was aimed at
mainly in the United States’ firms. One of the classical researches was carried out by Titman
and Wessels (1988); where they studied the theoretical determinants of capital structure by
examining them empirically. The theoretical attributes namely; asset structure, non-debt tax
shields, growth, uniqueness, industry classification, firm size, earnings volatility and
profitability were tested to see how they affect the firm’s debt-equity choice. The results
indicated consistencies with the theories of capital structure for the factors affecting capital
structure choices of firms. One of the few interesting conclusion drawn from the studies in
US include the negative relationship of debt to “uniqueness” of a firm’s line of business.
The short-term debt ratio was negatively related to firm size. Besides that, a strong negative
relationship was noted between debt ratios and past profitability. The study of Titman and
Wessels, however, did not provide strong empirical support on variables like non-debt tax
shields, volatility, collateral value and future growth.
As stated previously, there were many papers written by research scholars on capital
structure choices that are mostly based on empirical data of firms in the United States only.
To broader the understanding of capital structure models, Rajan and Zingales (1995) have
attempted to find out whether the capital structure choices in other countries is based on the
similar factors of those influencing capital structure of U.S firms. For this purpose, the
accounting data and monthly stock prices for five years, from 1987 till 1991 were collected
from the international financial database all the G7 countries; namely the U.S, Japan,
Germany, France, the U.K, Italy and Canada. Banks and insurance companies were
eliminated from the sample collected as their leverages are affected by government
regulations.
Four factors; tangibility of assets, growth, firm size and profitability were tested to see its
influences on leverage. A cross–sectional basic regression model of leverage was developed
with four of the factors mentioned above as independent variables. Rajan and Zingales noted
that across the countries, the asset tangibility was positively correlated with leverage for all

28
the countries as theory supported the notion that firms having more fixed assets in their
assets mix will use that as collateral to get more loans or debt. The market to book ratio
seemed to be negatively correlated with leverage except for Italy. Having high market value
of the stocks would enable firms to issue more stocks and not seeking debt. Size of firm was
positively correlated while profitability was negatively correlated with leverage in all
countries except Germany. As a conclusion, this paper found that at an aggregate level, firm
leverage was fairly similar across the G-7 countries. This study also pointed out some
avenue for future research especially on the unbiased sample selection, the actual
determinants of capital structure and deeper consideration of institutional influences.
After Rajan and Zingales, there were several research papers made on capital structure by
testing the applicability on other countries apart from United States alone. One of the
prominent researches was carried out by Gropp and Heider (2007) approached the issue of
Bank Capital Structure using banks from developed countries (US and 15 EU members, for
14 years). They specifically tested the significance of size, profitability, market-to-book
ratio, asset tangibility, and dividend paying status in determining bank leverage. Their
results provided strong support for the relevance of standard determinants of capital
structure on bank capital.
2.5.2. In Developing Countries
There were many empirical researches undertaken by scholars on capital structure choices in
the developed nations. But, there were not many research directed towards developing
countries that saw the applicability of the theories of capital structure generated from the
developed nations. Booth et al. (2001), Maghyereh (2005), Amidu (2007), Abor (2008), and
Bas et al. (2009) were among the scholars who have studied the capital structure issue in the
developing nations. One of the prominent studies was done by Booth et al. (2001). They
have undertaken an interesting study to see whether the capital structure theory could also be
applicable in the developing countries irrespective of different institutional structures. The
readily available balance sheets and income statements were collected by the researchers
from the International Finance Corporations (IFC) for the largest companies in 10
developing countries, namely; India, Pakistan, Thailand, Malaysia, Turkey, Zimbabwe,
Mexico, Brazil, Jordan and Korea. Several variables were tested and analyzed to explain
capital structure determinants by considering the impact of taxes, agency conflicts, financial

29
distress and the impact of informational asymmetries. The variables mentioned include tax,
business risk, asset tangibility, sales, return on assets and market-to-book ratio. A basic cross
regression model of three different measures of firm’s debt ratio against those variables was
developed.
From their analysis, the authors have concluded that the variables that explained the capital
structures in developed nations were also relevant in the developing countries irrespective of
differences in institutional factors across these developing nations. The same types of
variables, which affect developed nations, were significant in developing nations too. This
research supports the argument of asset tangibility in financing decisions which indicates
that firm’s long-term debt ratio increases while total-debt ratio decreases as more tangible
the asset mix becomes. It is interesting to note that the estimated empirical average tax rate
does not affect the financing decisions except for becoming as a proxy for profitability. The
research also indicated that knowing the nationality of the firm is at least important as
knowing the size of independent variables for both the total and long-term book debt ratios.
The authors have outlined their recommendation for further studies or research in this area
with an increase in the quality international database. They too suggested that a theoretical
model to be developed to study the direct link between profitability and capital structure
choices.
One of the latest studies was conducted by Bas et al. (2009). This paper examined the
determinants of capital structure decisions of firms in developing countries collecting
secondary data for 11,125 firms from World Bank for 25 developing countries. They
discussed about capital structure decisions of firms in developing markets covering countries
from different regions. They analyzed whether the determinants of capital structure show
differences among small, medium and large firms. Bas et al. draw the following major
conclusions from the results. Regardless of how the firm defines, in accordance with the
capital structure theory, the importance of firm level variables, such as tangibility and
profitability is confirmed. According to the results, private, small, medium and large firms
follow the pecking order on their debt financing decisions. But listed firms prefer equity
financing to long term debt financing. Moreover, internal funds do not have an impact on the
debt financing decisions. Another major finding was the size effect. They saw different
responses from small and large firms towards debt financing. As firms become larger, they
become more diversified and risk of failure is reduced as a result of that they can have

30
higher leverage. According to their results, small and large companies have different debt
policies. Due to the information asymmetries, small firms have limited access to finance;
therefore, they face higher interest rate costs. Also, they are financially more risky compared
to large firms. As a result of that, small companies have restricted access to debt financing
which may influence their growth.
2.5.3. In Ethiopia
Most capital structure studies to date are based on data from developed countries. There are
few studies that provide evidence from developing countries. The determinants of capital
structure of Ethiopian firms are still under-explored area in the literature of financing
decision. As per the researcher access and knowledge, the researches on determinants of
capital structure so far done in Ethiopian case are by Ashenafi (2005) and Mintesinot (2010).
Ashenafi (2005) approached the question of capital structure using data from medium firms
in Ethiopia. He take a sample of 50 medium enterprises and made multivariate regression
analysis based on financial data of Ethiopian medium enterprises over the period 1991 to
1996 E.C. Variables like non-debt tax shield, economic risk, age of firms, size of firms,
tangibility, profitability and growth were regressed against leverage. The outcome of the
multivariate regression analysis was consistent with earlier studies for variables like non-
debt tax shield, economic risk, size of firms and profitability.
Mintesinot (2010) has undertaken an attention-grabbing study entitled, “The Determinants
of Capital Structure: Evidence from Selected Manufacturing Private Limited Companies of
Tigray Region, Ethiopia’’. Mintesinot have used eight explanatory variables: Tangibility,
Profitability, Growth, Age, Uniqueness, Size, Earnings Volatility, and Non-Debt Tax
Shields, and were regressed against dependent variables: Total Debt Ratio, Long-Term Debt
Ratio and Short-Term Debt Ratio. He also used secondary data collected from audited
financial statements of selected 14 companies for the period of five years (2004-2008). After
analyzing the data he came up with this result: Tangibility, Firm Growth, Age of the Firm,
Firm Size, Earnings Volatility and Non Debt Tax Shields variables are the significant
determinants of capital structure in at least one out of the three models for capital structure
employed in the study.

31
22..66.. Features of Appropriate Capital Structure
The board of directors or the Chief Financial Officer of any business firm should develop
appropriate capital structure which is most advantageous for the company. This can be done
only when all those factors, discussed above, which are relevant to the capital structure
decision are properly analyzed and balanced. Thus, the capital structure should be planned
generally keeping in view the interest of the equity share holders and the financial
requirements of the company.
As stated by Pandey (2005); an appropriate capital structure should have the following
features:
Return: the capital structure of the company should be most advantageous.
Subject to other considerations, it should generate maximum returns to the
shareholders without additional coat.
Risk: the use of excessive debt threatens the solvency or liquidity of the
company. To the point debt does not add significant risk it should be used as
source of capital; or its use should be avoided.
Flexibility: the capital structure should be flexible. It should be possible for a
company to adapter its capital structure with a minimum cost and delay if
warranted by a changed situation. It should also be possible for the company to
provide funds whenever needed to finance its profitable activities (projects).
Capacity: the capital structure should be determined within the debt capacity of
the company, and this capacity should not be exceeded. The debt capacity of a
company depends on its ability to generate future cash flows.
Control: the capital structure should involve minimum risk of loss to control of
the company. The owners of closely held companies are particularly concerned
about dilution of control.

32
22..77.. Banks Capital Structure
Banks are one of the financial intermediaries that operate in the financial system of the
economic system. They act as intermediaries to transfer and allocate money from the savers
to needy borrowers. Banks are back bone of the economy and to all business activities.
Commercial banks can thus fill the diverse desires of both the ultimate borrowers and
lenders of capital. Capital is a fundamental and vital part of the commercial banking
industry. Bank capital plays important role in the establishment of the banking entity by
providing the necessary funds, and also critical to the perpetuation of the entity in its
capacity as ongoing concern. A commercial bank mainly obtains funds from creditors i.e.
debt (deposits) ownership (equity) sources. As a result, the basic objective of bank
management should be to maximize the value of the owner’s investment in the banks.
The capital structure of banks is, however, still a relatively under-explored area in the
banking literature. Currently, there is no clear understanding on how banks choose their
capital structure and what factors influence their corporate financing behavior. Gropp and
Heider (2007) approached the issue of Bank Capital Structure using banks from developed
countries; they specifically tested the significance of size, profitability, market-to-book ratio,
asset tangibility, and dividend paying status in determining bank leverage. Their results
provided strong support for the relevance of standard determinants of capital structure on
bank capital. Octavia and Brown (2008) investigates whether the standard determinants of
capital structure apply to banks in developing countries, whereas Gropp and Heider examine
banks from the USA and Europe. The results of Octavia and Brown (2008) suggested that
the standard determinants of capital structure do have power in explaining both book capital
and market leverage. In their study, they examined whether the standard determinants of
capital structure are significant factors in determining the level of bank capital in developing
countries. Using a sample of 56 commercial banks from ten developing countries they found
the standard determinants of capital structure do have explanatory power in explaining
variation in bank capital.
22..88.. Overview of Commercial Banks in Ethiopia
According to National Bank of Ethiopia, there are five principal events, which may
conveniently be taken as dividing Ethiopian banking history into periods. The first event
was establishment in 1906 of the Bank of Abyssinia, marking the advent of banking into the

33
country. The second event was Italian occupation in 1936, when, following liquidation of
the Bank of Ethiopia, a broad colonial banking network, extended to encompass all Italian
possessions in the Horn of Africa and closely linked with the metropolitan financial system,
was set up in the country. The third event was, in 1943, establishment of the State Bank of
Ethiopia, marking the rebirth of the Ethiopian independent banking. The fourth event was
the revolution of 1974, nationalized companies, the whole credit system being based on the
central bank and three state-owned financial institutions. The fifth event was the collapse of
socialist regime followed by a financial sector reform and liberalization according to
Monetary and Banking Proclamation of 1994.
Monetary and Banking proclamation of 1994 established the national bank of Ethiopia as a
judicial entity, separated from the government and outlined its main function. Monetary and
Banking proclamation No.83/1994 and the Licensing and Supervision of Banking Business
No.84/1994 laid down the legal basis for investment in the banking sector. Consequently
shortly after the proclamation the first private bank, Awash International Bank was
established in 1994 by 486 shareholders and by 1998 the authorized capital of the Bank
reached Birr 50.0 million. Dashen Bank was established on September 20, 1995 as a share
company with an authorized and subscribed capital of Birr 50.0 million. 131 shareholders
with subscribed and authorized capital of 25.0 million and 50 million founded bank of
Abysinia. Wegagen Bank with an authorized capital of Birr 60.0 million started operation in
1997. The fifth private bank, United Bank was established on 10th September 1998 by 335
shareholders. Nib International Bank that started operation on May 26, 1999 with an
authorized capital of Birr 150.0 million. Cooperative Bank of Oromia was established on
October 29, 2004 with an authorized capital of Birr 22.0 million. Lion International Bank
with an authorized capital of Birr 108 million started operation in October 02,2006. Zemen
Bank that started operation on June 17, 2008 with an authorized capital of Birr 87.0 million.
International Bank Oromia started operation on September 18, 2008 with an authorized
capital of Birr 91 million.
According the National Bank of Ethiopia - Fourth Quarter Report of 2008/09, the number of
banks operating in the country in 2008/09 reached 13, of which nine are private and the
remaining three are state-owned. All the banks, operating in Ethiopia, have 636 branch
banks across the country. The total capital of the banking industry reached Birr 1.1 billion

34
by the end of year 2009. Accordingly, from the total capital of the banking system, the share
of private commercial banks is 36.5 percent.
Table 2.1: Capital and Branch Network of Banking System in Ethiopia
BBaannkkss
BBrraanncchh NNeettwwoorrkk ((iinn NNuummbbeerr)) CCaappiittaall ((iinn mmiilllliioonn ooff BBiirrrr)) Quarter III – 2008/2009 Quarter IV – 2008/2009
Reg
ions
Add
is
Aba
ba
Tota
l
% s
hare
Reg
ions
Add
is
Aba
ba
Tota
l
% sh
are
Quarter III
Quarter IV
1. Public Banks Commercial Bank of Ethiopia 160 49 209 33.9 160 49 209 32.9 4561 5041
Construction & Business Bank 16 13 29 4.7 17 15 32 5.0 196 196
Development Bank of Ethiopia 31 1 32 5.2 31 1 32 5.0 1949 1800
Total Public Banks 207 63 270 43.8 208 68 273 42.9 6706 7037 2. Private Banks Awash International Bank 29 31 60 9.7 29 31 60 9.4 550 555
Dashen Bank 26 26 52 8.4 28 26 54 8.5 676 815
Abyssinia Bank 20 25 45 7.3 22 25 47 7.4 421 421
Wegagen Bank 26 23 49 7.9 26 23 49 7.7 647 656
United Bank 15 24 39 6.3 15 26 41 6.4 425 449
Nib International Bank 16 28 44 7.1 17 28 45 7.1 580 581
Cooperative Bank of Oromiya 22 3 25 4.1 23 3 26 4.1 152 155
Lion International Bank 11 9 20 3.2 11 9 20 3.1 191 192
Zemen Bank 0 1 1 0 1 1 0.2 98 100
Oromiya International Bank 8 4 12 0.0 16 4 20 3.1 112 121
Total Private Banks 173 174 347 56.2 187 176 363 57.1 3852 4045
Grand Total Banks 380 237 617 100 395 241 636 100 10558 11082 Source: National Bank of Ethiopia - Fourth Quarter Report of 2008/09
Although the very few earlier studies have a tremendous contribution to the theory of capital
structure, they were limited to the non-banking institutions of the countries. Among all types
of firms banks in developing countries are working in such not well-developed financial
system, hence they may pay little attention to practice capital structure theory for their
related decision. So that, given the unique financial features of Ethiopian commercial banks
and the environment in which they operate, there is a strong ground for separate study on
capital structure determinants of commercial banks in Ethiopia.
35
CHAPTER 33
RREESSEEAARRCCHH MMEETTHHOODDOOLLOOGGYY
This chapter highlights the methodology of the study and comprises study design, sampling design, data source and collection, data analyzing method and the description of applied regression model. Here, the definitions and measurement of the variables are well defined.
3.1. Study Design
This research presents an empirical analysis of determinants of capital structure of
commercial banking sector in Ethiopia with most recent available data. It is an explanatory
research and has employed a quantitative method. A multivariate regression model was used
to analyze the data collected from the financial statements of commercial banks operating in
Ethiopia which have an age 10 years and above. Based on the regression outputs, test of the
data used and hypotheses; and analysis of the result were made. The analyses are presented
by using descriptive approach.
3.2. Sampling Design
For fair and uniform comparison and to obtain valid results, only commercial banks are
selected. In other words, the reason why commercial banking sector is chosen is: Firstly,
commercial banking business is emerging and also flourishing in Ethiopian economy where
the literature on determinants of capital structure is limited. Secondly, the commercial banks
share common attributes in accounting practices, corporate governance and corporate
control. As a result, Development (DBE), Construction and Business (CBE) and other banks
are not considered due to their specialized business objectives.
Sample of seven commercial banks are selected from the population of 11 commercial
banks. It represents 64 percent of the existing commercial banks. In other words, the entire
population of commercial banks that exists, at least, for the last ten years (2000-2009) is
selected and secondary data was collected from their 10 years’ financial statements.
Therefore, pooling the cross sectional data of 10 years for 7 commercial banks, there are
total 70 (seventy) observations in the regression analysis. For this reason, using purposive

36
sampling, the selected banks are Commercial Bank of Ethiopia, Dashen Bank, Awash
International Bank, Bank of Abysinya, Wegagen Bank, United Bank and Nib International
Bank.
3.3. Data Source and Collection
The researcher has approached exclusively secondary sources of data, audited financial
statements (Balance sheets and income statements), of seven commercial banks aged ten
years and above and have been operating in the Ethiopian economy for the specified time
period.
Though some of the sampled commercial banks have an experience of greater than ten
years, the researcher has taken secondary data from their financial statements that belong or
correspond to only the past ten consecutive years. On top of this, the data gathered is reliable
in that it is collected from a supervisory bank, the National Bank of Ethiopia. Furthermore,
selected explanatory attributes and used regression model have taken from most prominent
and recent research studies in the area of capital structure.
3.4. Method of Data Analysis
Multivariate Ordinary Least Square (OLS) regression is employed to determine whether
there exists a relationship between the multiple independent variables (Determinants =
Profitability, Tangibility, Size, Growth, Age, Tax) and the dependant variable (Leverage =
Debt to Equity Ratio). One regression equation is used to test the hypotheses constructed in
relation to firm-specific determinants (Profitability, Tangibility, Size, Growth, Age and Tax)
and the leverage (Debt-Equity Ratio). Data were regressed using STATA 9 application
software and the resulted (or obtained) regression outputs are analyzed. On top of this, Ms
Excel 2007 was also used to compute and feed convenient data into the STATA employed.
Data used and hypotheses are tested and analysis of the result is made based on the
multivariate regression output. First, data is tested to ensure the validity of classical linear
regression model (CLRM) assumptions. Second, test of the hypotheses that are previously
developed in chapter one were made based on the general estimated model which examined
the relationship between the leverage ratio and its determinants for the commercial banks in
Ethiopia.

37
3.5. Model Specification
Most of the existing empirical studies on capital structure use linear regression techniques
with proxies for the determinant factors used to explain the variation in leverage ratios
across firms. The following multivariate ordinary least square (OLS) regression model is
specified and used to test the relationship between the financial leverage and its determinate
factors in the selected commercial banks.
General Form of the Equation is:
LEVERAGE = Function of (Profitability, Tangibility, Size, Growth, Age, Tax-Shield)
Therefore the Specified Model is:
Leverage = β0 + β1(Prof) + β2(Tang) + β3(Size) + β4(Grow) + β5(Age) + β6(Tax) + ε
DER = β0 + β1(PR) + β2(TN) + β3(SZ) + β4(GR) + β5(AG) + β6(TXS) + ε
Where:
STANDARD COEFFICIENTS AND ERROR TERM
β0 = Coefficient of Intercept (Constant) β4 = Coefficient of Growth
β1 = Coefficient of Profitability β5 = Coefficient of Age
β2 = Coefficient of Tangibility β6 = Coefficient of Tax-shield
β3 = Coefficient of Firm Size ε = the Error Term
DEPENDENT VARIABLE
DER denotes leverage as a measure of Debt to Equity ratio and is computed as total
Liabilities divided by total Stockholders’ Equity
INDEPENDENT VARIABLES
PR denotes profitability which is measured by using the ratio of operating income over total assets,
TN denotes tangibility of assets which is measured by the ratio of fixed assets to total assets,
SZ denotes size which is measured by the natural logarithm of total assets,
GR denotes Growth which is measured by the percentage change of total assets,
AG denotes Age which is measured by the number of years of stay in business operation,
TXS denotes Tax-shield that is measured by the product of interest expenses & corporate tax rate.
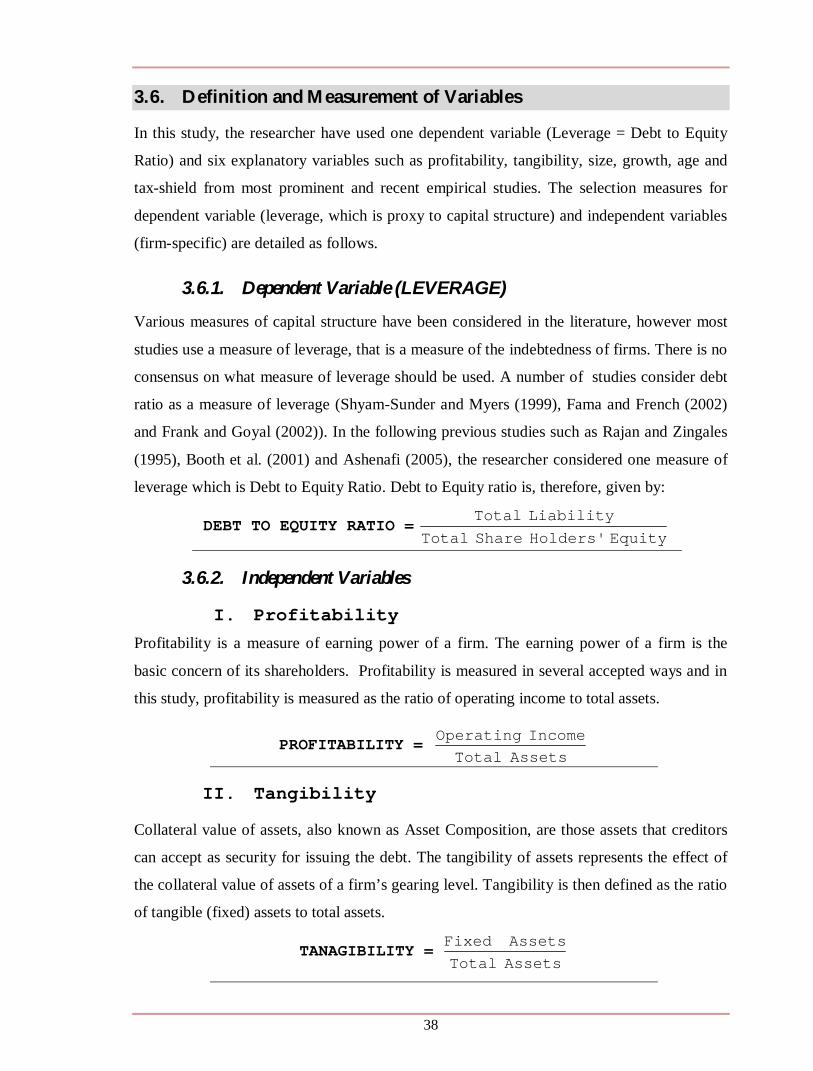
38
3.6. Definition and Measurement of Variables
In this study, the researcher have used one dependent variable (Leverage = Debt to Equity
Ratio) and six explanatory variables such as profitability, tangibility, size, growth, age and
tax-shield from most prominent and recent empirical studies. The selection measures for
dependent variable (leverage, which is proxy to capital structure) and independent variables
(firm-specific) are detailed as follows.
3.6.1. Dependent Variable (LEVERAGE)
Various measures of capital structure have been considered in the literature, however most
studies use a measure of leverage, that is a measure of the indebtedness of firms. There is no
consensus on what measure of leverage should be used. A number of studies consider debt
ratio as a measure of leverage (Shyam-Sunder and Myers (1999), Fama and French (2002)
and Frank and Goyal (2002)). In the following previous studies such as Rajan and Zingales
(1995), Booth et al. (2001) and Ashenafi (2005), the researcher considered one measure of
leverage which is Debt to Equity Ratio. Debt to Equity ratio is, therefore, given by:
DEBT TO EQUITY RATIO = Equity Holders' Share Total
Liability Total
3.6.2. Independent Variables
I. Profitability
Profitability is a measure of earning power of a firm. The earning power of a firm is the
basic concern of its shareholders. Profitability is measured in several accepted ways and in
this study, profitability is measured as the ratio of operating income to total assets.
PROFITABILITY =Assets TotalIncome Operating
II. Tangibility
Collateral value of assets, also known as Asset Composition, are those assets that creditors
can accept as security for issuing the debt. The tangibility of assets represents the effect of
the collateral value of assets of a firm’s gearing level. Tangibility is then defined as the ratio
of tangible (fixed) assets to total assets.
TANAGIBILITY = Assets TotalAssets Fixed
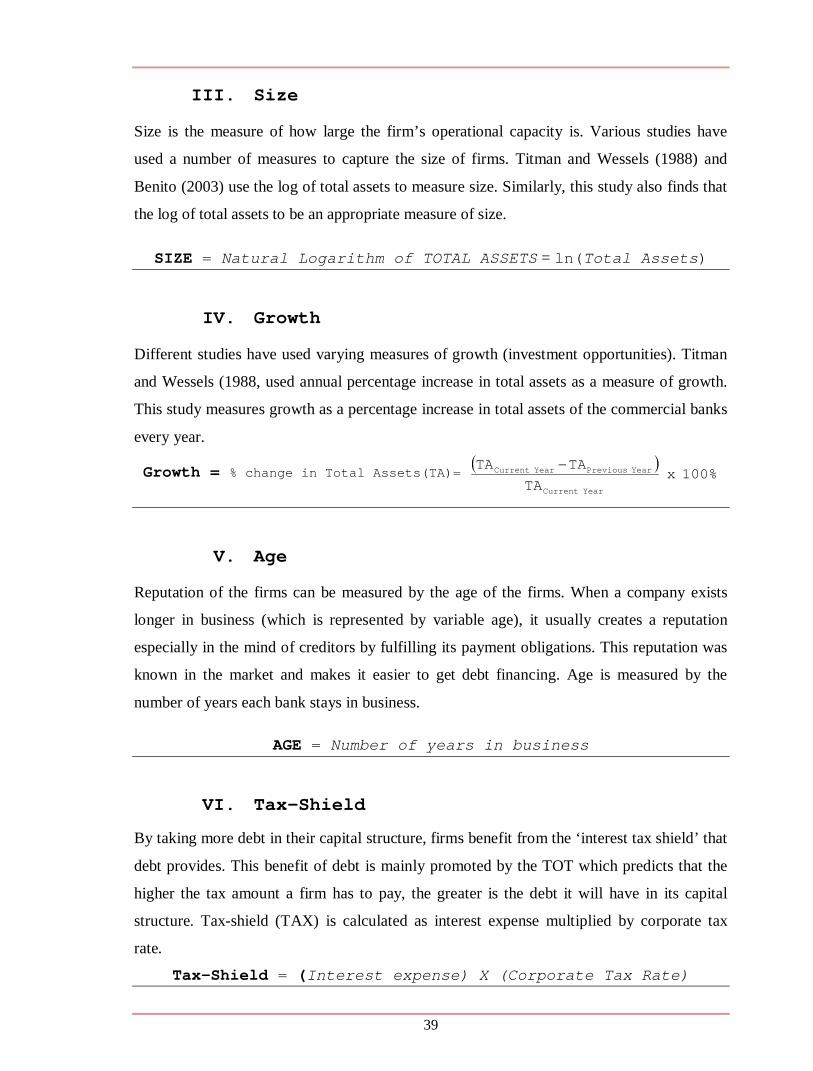
39
III. Size
Size is the measure of how large the firm’s operational capacity is. Various studies have
used a number of measures to capture the size of firms. Titman and Wessels (1988) and
Benito (2003) use the log of total assets to measure size. Similarly, this study also finds that
the log of total assets to be an appropriate measure of size.
SIZE = Natural Logarithm of TOTAL ASSETS = ln(Total Assets)
IV. Growth
Different studies have used varying measures of growth (investment opportunities). Titman
and Wessels (1988, used annual percentage increase in total assets as a measure of growth.
This study measures growth as a percentage increase in total assets of the commercial banks
every year.
Growth = % change in Total Assets(TA)= 100% x
TATATA
Year Current
Year PreviousYear Current
V. Age
Reputation of the firms can be measured by the age of the firms. When a company exists
longer in business (which is represented by variable age), it usually creates a reputation
especially in the mind of creditors by fulfilling its payment obligations. This reputation was
known in the market and makes it easier to get debt financing. Age is measured by the
number of years each bank stays in business.
AGE = Number of years in business
VI. Tax-Shield
By taking more debt in their capital structure, firms benefit from the ‘interest tax shield’ that
debt provides. This benefit of debt is mainly promoted by the TOT which predicts that the
higher the tax amount a firm has to pay, the greater is the debt it will have in its capital
structure. Tax-shield (TAX) is calculated as interest expense multiplied by corporate tax
rate.
Tax-Shield = (Interest expense) X (Corporate Tax Rate)

40
The definition and measurement of variables that the researcher employed in this research
project is summarized in Table 3.1 below.
Table 3.1: Summary of Variables and their Measures
VARIABLES DEFINITION MATHEMATICAL EXPRESSION
Depe
nden
t va
riabl
e
Debt to Equity Ratio
Ratio of Total liability to Total shareholders’ equity Equity Holders' Share Total
Liability Total
Expl
anat
ory
Varia
bles
Profitability Ratio of Operating income to Total assets Assets Total
Income Operating
Tangibility Ratio of Tangible (fixed) assets to Total assets Assets Total
Assets Fixed
Size Natural Logarithm of Total Assets ln(Total Assets)
Growth Percentage increase (change) in total assets
100% x
TATATA
Year Current
Year PreviousYear Current
Age Number of years stay in business Number of years
Tax-Shield Measured with the product of interest expense and corporate tax rate
(Interest expense) X (Corporate Tax Rate)

41
CHAPTER 44
RREESSUULLTTSS AANNDD DDIISSCCUUSSSSIIOONNSS
This Chapter presents the results of the regression model and their corresponding discussions. Prior to the analysis of regression model, test of CLRM assumptions have been made followed by the correlation and descriptive analysis. It also presents the analysis of the collected empirical data, portrays the results, and explains the determinants of capital structure in the cased commercial banks in Ethiopia.
4.1 Data Testing The five most critical assumptions related to CLRM of pooled-cross sectional data are tested
in the following sub-sections. Normality, multicollinearity, heteroskedasticity, outliers’
detection and model specification tests have been made to make the data available give
reliable result and make the model fit the data. These assumptions were required to be tested
because the estimation technique, Multivariate Ordinary Least Squares (OLS), has a number
of desirable properties. Hence, the hypothesis testing regarding the coefficient estimates
could validly be conducted.
4.1.1 Test of Normality
Normality test of data is applied to determine whether a data is well-modeled by a normal
distribution or not, and to compute how likely an underlying random variable is to be
normally distributed. The best way to evaluate how far the used data are from Gaussian
(normal) is to look at a graph and see if the distribution grossly deviates from a bell-shaped
normal distribution. Therefore, graphical (histogram and dot plot) and non-graphical
(skewness/ kurtosis and Shapro-Wilk W ) tests of normality are used to test normality.
The histogram presented in graph 4.1 provides useful graphical representation of the data.
The bell-shaped black line on the histograms represents the "normal" curve. Notice how the
data for fitted values are normal. But also, it can be seen that there are few outliers which
have insignificant difference from the standard normal curve. Therefore, the residuals are
normally distributed and do not have potential problems on the specified model.
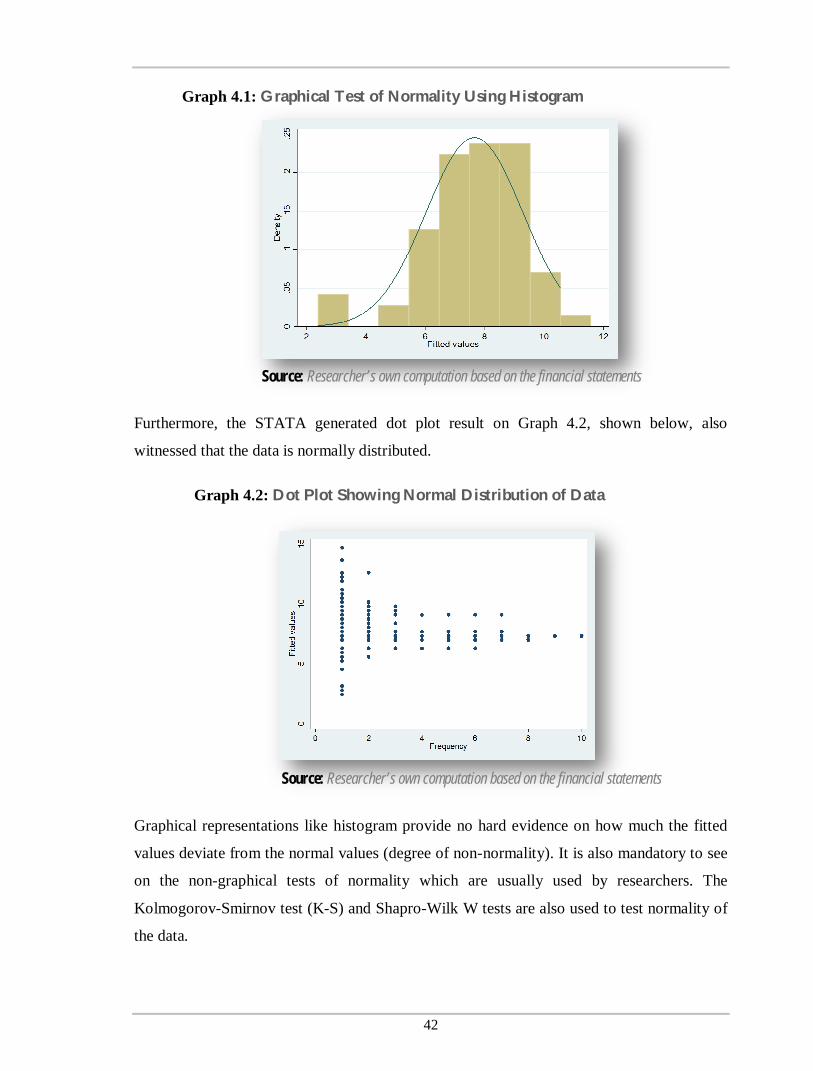
42
Graph 4.1: Graphical Test of Normality Using Histogram
Source: Researcher’s own computation based on the financial statements
Furthermore, the STATA generated dot plot result on Graph 4.2, shown below, also
witnessed that the data is normally distributed.
Graph 4.2: Dot Plot Showing Normal Distribution of Data
Source: Researcher’s own computation based on the financial statements
Graphical representations like histogram provide no hard evidence on how much the fitted
values deviate from the normal values (degree of non-normality). It is also mandatory to see
on the non-graphical tests of normality which are usually used by researchers. The
Kolmogorov-Smirnov test (K-S) and Shapro-Wilk W tests are also used to test normality of
the data.

43
Table 4.1 shows the result of the Kolmogorov-Smirnov test for normality. Theoretically, if
the test is not significant, then the data are normal, so any value above 0.05 indicates
normality. On the other hand, if the test is less than 0.05 which proves significance, then the
data are non-normal.
Table 4.1: Skewness/ Kurtosis Tests for Normality
Skewness/Kurtosis tests for Normality ------ joint ----- Variable | Pr(Skewness) Pr(Kurtosis) adj chi2(2) Prob>chi2 -----------+------------------------------------------------------- resid | 0.223 0.091 4.42 0.1097
Source: Researcher’s own computation based on the financial statements
Practically, in this study Skewness/ Kurtosis test shown in Table 4.1, p-value is found to be
0.1097 (greater than 0.05) accepting the null hypothesis that indicates the residual values are
normally distributed.
Shapiro-Wilk W test was the other test performed to test normality. The result of Shapro-
Wilk W test shown in Table 4.2 also exemplified that the p-value is not less than 0.05 and
thus, the error terms of the model are normally distributed.
Table 4.2: Shapiro-Wilk W Test for Normality
Variable | Obs W V z Prob>z -------------+------------------------------------------------- residual | 70 0.96135 2.379 1.885 0.05973
Source: Researcher’s own computation based on the financial statements
4.1.2 Test of Multicollinearity
Multicollinearity means that there is linear relationship between explanatory variables which
may cause the regression model biased (Gujarati, 2003, pp342). In order to examine the
possible degree of multicollinearity among the explanatory variables, pair-wise correlation
matrixes of the selected variables (STATA output of the multicollinearity) are shown in
Table 4.3. Variable Inflation Factor (VIF) technique is also employed to detect the
multicollinearity problem and strengthen our analysis.
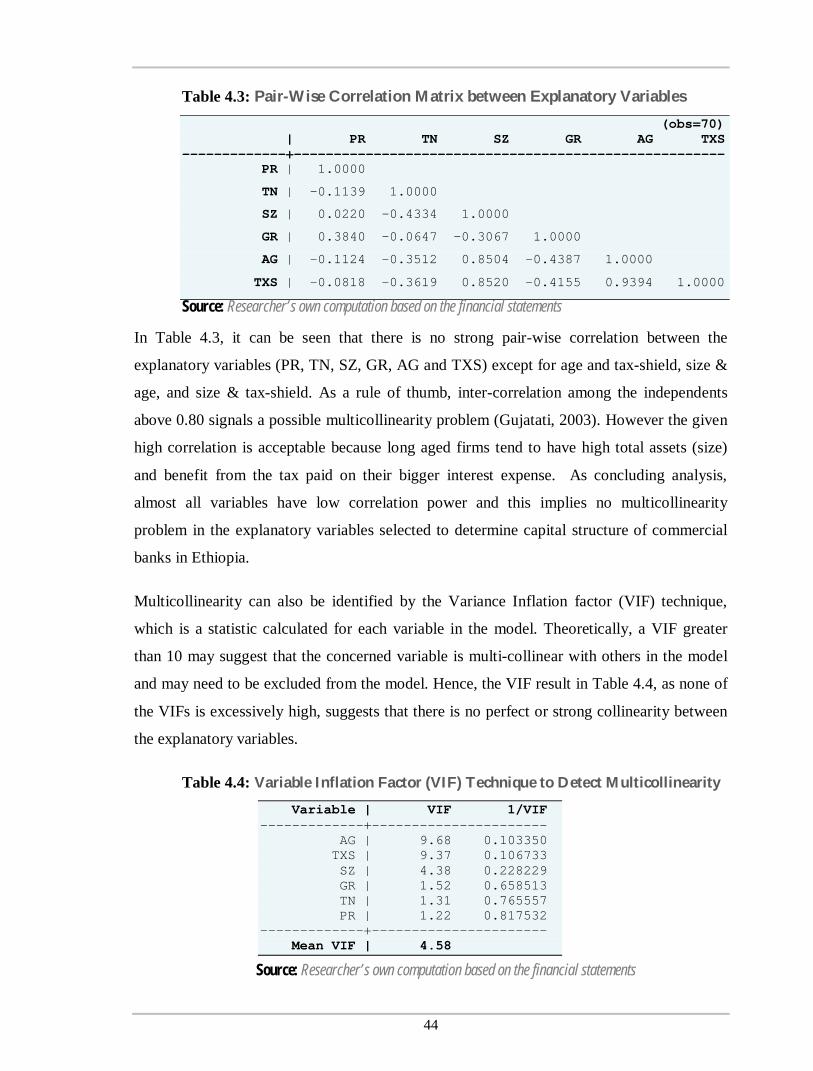
44
Table 4.3: Pair-Wise Correlation Matrix between Explanatory Variables (obs=70) | PR TN SZ GR AG TXS -------------+------------------------------------------------------ PR | 1.0000
TN | -0.1139 1.0000
SZ | 0.0220 -0.4334 1.0000
GR | 0.3840 -0.0647 -0.3067 1.0000
AG | -0.1124 -0.3512 0.8504 -0.4387 1.0000
TXS | -0.0818 -0.3619 0.8520 -0.4155 0.9394 1.0000
Source: Researcher’s own computation based on the financial statements
In Table 4.3, it can be seen that there is no strong pair-wise correlation between the
explanatory variables (PR, TN, SZ, GR, AG and TXS) except for age and tax-shield, size &
age, and size & tax-shield. As a rule of thumb, inter-correlation among the independents
above 0.80 signals a possible multicollinearity problem (Gujatati, 2003). However the given
high correlation is acceptable because long aged firms tend to have high total assets (size)
and benefit from the tax paid on their bigger interest expense. As concluding analysis,
almost all variables have low correlation power and this implies no multicollinearity
problem in the explanatory variables selected to determine capital structure of commercial
banks in Ethiopia.
Multicollinearity can also be identified by the Variance Inflation factor (VIF) technique,
which is a statistic calculated for each variable in the model. Theoretically, a VIF greater
than 10 may suggest that the concerned variable is multi-collinear with others in the model
and may need to be excluded from the model. Hence, the VIF result in Table 4.4, as none of
the VIFs is excessively high, suggests that there is no perfect or strong collinearity between
the explanatory variables.
Table 4.4: Variable Inflation Factor (VIF) Technique to Detect Multicollinearity
Variable | VIF 1/VIF -------------+---------------------- AG | 9.68 0.103350 TXS | 9.37 0.106733 SZ | 4.38 0.228229 GR | 1.52 0.658513 TN | 1.31 0.765557 PR | 1.22 0.817532 -------------+---------------------- Mean VIF | 4.58
Source: Researcher’s own computation based on the financial statements

45
4.1.3 Test of Heteroskedasticity
Heteroskedasticity is a systematic pattern in the errors where the variances of the errors are
not constant (Gujarati, 2003 p387). Heteroskedasticity makes ordinary least square
estimators not efficient because the estimated variances and covariance of the coefficients
(βi) are biased and inconsistent and thus, the tests of hypotheses are no longer valid. In this
study, the non-graphical methods of Cook-Weisberg Test and White’s Test of testing
heteroskedasticity are used and the results obtained are presented in Tables 4.5 and 4.6.
Table 4.5: Breusch-Pagan/ Cook-Weisberg test for Heteroskedasticity Breusch-Pagan / Cook-Weisberg test for heteroskedasticity
Ho: Constant variance
Variables: fitted values of DER
chi2(1) = 0.77
Prob > chi2 = 0.3809 Source: Researcher’s own computation based on the financial statements
The insignificant result from the Cook-Weisburg test, as portrayed in table 4.5, indicates that
the regression of the residuals on the predicted values reveals insignificant
heteroskedasticity.
Furthermore, White’s test was also applied to test the presence of heteroskedasticity.
White’s test tests the null hypothesis that the variance of the residuals is homogenous.
Therefore, if the p-value is very small, we would have to reject the null hypothesis.
Table 4.6: Cameron & Trivedi's Decomposition of IM-Test
Source | chi2 df p ---------------------+----------------------------- Heteroskedasticity | 24.30 27 0.6136 Skewness | 6.73 6 0.3462 Kurtosis | 0.46 1 0.4992 ---------------------+----------------------------- Total | 31.49 34 0.5912
Source: Researcher’s own computation based on the financial statements
The STATA result of white’s test shown in Table 4.6 also illustrates that there is
insignificant heteroskedasticity problem with the dataset.

46
4.1.4 Outliers’ Detection
Heteroskedasticity can also arise as a result of the presence of outliers (Gujarati, 2003 p390).
Outliers are extreme values as compared to the rest of the data and are defined by the size
of the residual in an OLS regression where all of the observations are used. Outlier detection
involves the determination whether the residual value (error = predicted – actual) is an
extreme negative or positive value. The OLS estimates are influenced by one or several
residuals. Plotting the residual versus the fitted values can determine which errors are large,
after running the regression. Here, Graph 4.3 shows the plot of residual versus the fitted
values in the study.
Graph 4.3: Graph of Residuals verses Fitted Values
Source: Researcher’s own computation based on the financial statements
Looking at the plot, residual versus the fitted values graph, it can be concluded that there are
no significant outliers that means the residual values do not have extreme negative or
positive value.
Also by predicting standardized residuals using STATA software, it can be seen whether the
outliers exist and influence the OLS estimates. As Robert (2006) indicated and
recommended the use of standardized residuals, if the standardized residuals have values in
excess of 3.5 and -3.5, they become outliers and affect the regression results. As seen in the
STATA output in Appendix 1, the standardize outliers are calculated, listed and tabulated.
Accordingly, comparing the result with the standard, there are no values greater than 3.5 and
less than -3.5. Therefore, there are no outliers in our dataset which create heteroskedasticity
problem to the model.

47
4.1.5 Test of Model Specification
A typical specification error occurs when the estimated model does not include the correct
set of explanatory variables. This specification error takes two forms omitting one or more
relevant explanatory variables or including one or more irrelevant explanatory variables.
Either form of specification error results in problems with OLS estimates. Therefore, the
model is tested whether it is specified correctly or not, and then after, to estimate the
regression model properly. In this study, two methods (Ramesy RESET test and Link test)
are used to detect specification errors. RESET is used omitted variables and Link test is used
for specification error.
4.1.5.1 Ramsey RESET Test for Omitted Variables
RESET stands for Regression Specification Error Test and was proposed by Ramsey in
1969. This test is made on the basis of null hypothesis that says “model has no omitted
variables”.
Table 4.7: RESET Test for Omitted Variables Ramsey RESET test using powers of the fitted values of DER
Ho: model has no omitted variables
F(3, 60) = 1.52
Prob > F = 0.2174 Source: Researcher’s own computation based on the financial statements
The RESET result, shown in Table 4.7, fails to reject the null hypothesis of no omitted
variables indicating no model specification error. Though the regression result declares that
there are no omitted variables in the model, omitted variable bias is hard to detect. But there
are obvious indications of this specification error. The best way to detect the omitted
variable specification bias is to rely on the theoretical arguments behind the model which
base on the following questions. Which variables does the theory suggest should be
included? What are the expected signs of the coefficients? Are there omitted variables that
most other similar studies include in their model?
Apart from the Ramsey RESET test positive result, the researcher has tried his best to
include all variables that the theories of capital structure suggest, most similar studies
included in their model and relevant determining variables to commercial banks financing
decision.

48
4.1.5.2 Link Test for Specification of DER Model
Link Test performs model specification test for single-equation models. Link test is based on
the null hypothesis that the regression is correctly specified, Link test assumes one should
not be able to find any additional independent variables that are significant except by chance
if the model is correctly specified. In this study, to test the model specification using
STATA, the link test method generated two new variables. These variables are the variable
of prediction (_hat) and the variable of squared prediction (_hatsq). The model was then
refitted (regressed) using these two variables as predictors.
Theoretically, the variable of prediction (_hat) should be significant since it is the predicted
value and the variable of squared Prediction (_hatsq) should not be significant, because if
the model is specified correctly, the squared predictions should not have much explanatory
power. The RESET result is summarized in Table 4.8.
Table 4.8: Link test for Specification of DER model
Source | SS df MS Number of obs = 70
-------------+------------------------------ F( 2, 67) = 54.31
Model | 357.378816 2 178.689408 Prob > F = 0.0000
Residual | 220.42326 67 3.28989941 R-squared = 0.6185
-------------+------------------------------ Adj R-squared = 0.6071
Total | 577.802076 69 8.37394313 Root MSE = 1.8138
------------------------------------------------------------------------------
DER | Coef. Std. Err. t P>|t| [95% Conf. Interval] -------------+----------------------------------------------------------------
_hat | 1.427643 .4427628 3.22 0.002 .5438851 2.311402
_hatsq | -.0252299 .0254955 -0.99 0.326 -.0761191 .0256593
_cons | -1.680898 1.881871 -0.89 0.375 -5.437128 2.075332
Source: Researcher’s own computation based on the financial statements
Practically, our Link test result confirmed that the predicted value, the variable of
prediction(_hat), is significant variable and the variable of squared Prediction(_hatsq) is
not. Hence, the null hypothesis is accepted which reveals our model is specified correctly.

49
4.2 Correlation Analysis
Correlation and regression analyses are related in the sense that both deal with relationships
among variables. The correlation coefficient is a measure of linear association between two
variables. Values of the correlation coefficient are always between -1 and +1. A correlation
coefficient of +1 indicates that two variables are perfectly related in a positive linear sense;
while a correlation coefficient of -1 indicates that two variables are perfectly related in a
negative linear sense. A correlation coefficient of 0, on the other hand, indicates that there is
no linear relationship between the two variables. For simple linear regression, the sample
correlation coefficient is the square root of the coefficient of determination. The correlation
coefficient measures only the degree of linear association between two variables.
The analysis of the relationship between dependent variable (DER) and independent
variables (PR, TN, SZ, GR, AG, TXS) is detailed in Table 4.9 as follows using the
correlation matrices.
Table 4.9: Correlation Matrix and their Significance Level of Correlation for
Dependent Variable and Independent Variables (obs=70)
| DER PR TN SZ GR AG TXS -------------+--------------------------------------------------------------- DER | 1.0000 | PR | -0.4035 1.0000 | (0.0005) | TN | -0.1951 -0.1139 1.0000 | 0.0855 0.3479 | SZ | 0.6090 0.0220 -0.4334 1.0000 | 0.0000 0.8568 0.0002 | GR | -0.3291 0.3840 -0.0647 -0.3067 1.0000 | 0.0054 0.0010 0.5945 0.0098 | AG | 0.5238 -0.1124 -0.3512 0.8504 -0.4387 1.0000 | 0.0000 0.3540 0.0029 0.0000 0.0001 | TXS | 0.4438 -0.0818 -0.3619 0.8520 -0.4155 0.9394 1.0000 | 0.0001 0.5007 0.0021 0.0000 0.0003 0.0000
Source: Researcher’s own computation based on the financial statements
The correlation matrix in Table 4.9 shows that the Debt to Equity Ratio (dependent variable)
is correlated at -0.4035 with profitability at 1 percent significance level, at -0.1951 with
tangibility at 10 percent significance level, at 0.6090 with bank size at 1 percent significance
level, at -0.3291 with growth at 1 percent significance level, at 0.5238 with age at 1 percent
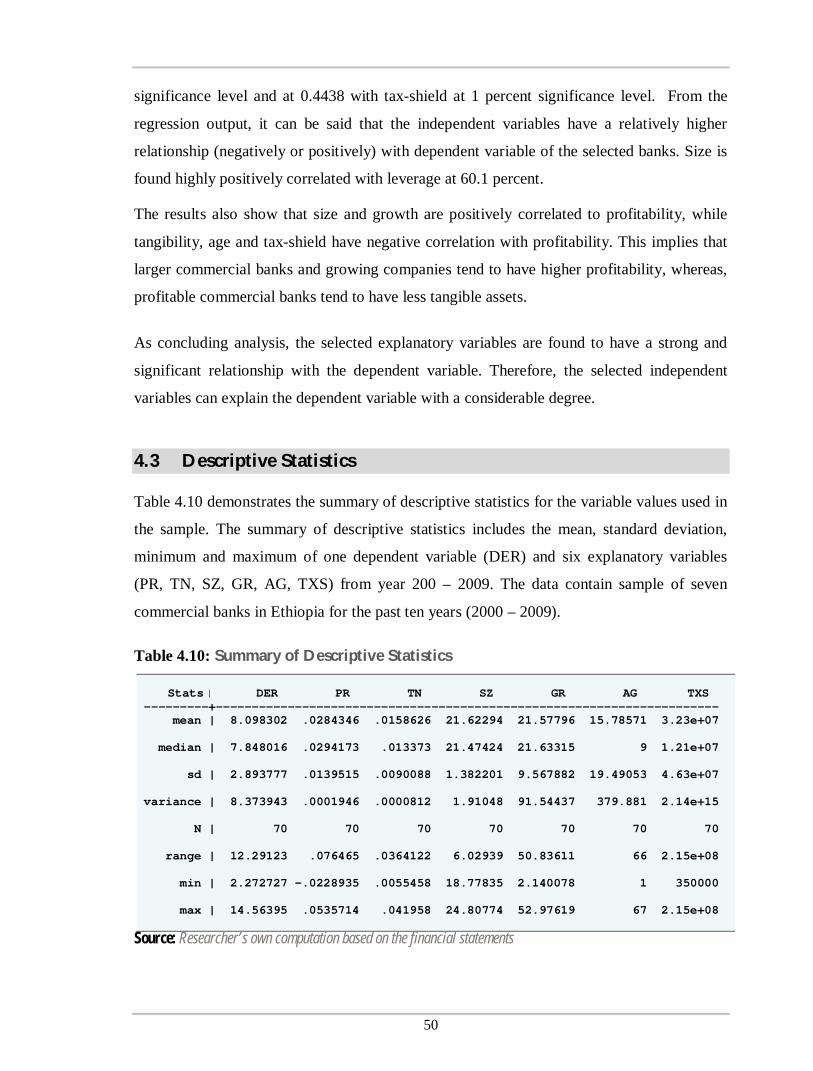
50
significance level and at 0.4438 with tax-shield at 1 percent significance level. From the
regression output, it can be said that the independent variables have a relatively higher
relationship (negatively or positively) with dependent variable of the selected banks. Size is
found highly positively correlated with leverage at 60.1 percent.
The results also show that size and growth are positively correlated to profitability, while
tangibility, age and tax-shield have negative correlation with profitability. This implies that
larger commercial banks and growing companies tend to have higher profitability, whereas,
profitable commercial banks tend to have less tangible assets.
As concluding analysis, the selected explanatory variables are found to have a strong and
significant relationship with the dependent variable. Therefore, the selected independent
variables can explain the dependent variable with a considerable degree.
4.3 Descriptive Statistics Table 4.10 demonstrates the summary of descriptive statistics for the variable values used in
the sample. The summary of descriptive statistics includes the mean, standard deviation,
minimum and maximum of one dependent variable (DER) and six explanatory variables
(PR, TN, SZ, GR, AG, TXS) from year 200 – 2009. The data contain sample of seven
commercial banks in Ethiopia for the past ten years (2000 – 2009).
Table 4.10: Summary of Descriptive Statistics
Stats DER PR TN SZ GR AG TXS ---------+---------------------------------------------------------------------- mean | 8.098302 .0284346 .0158626 21.62294 21.57796 15.78571 3.23e+07
median | 7.848016 .0294173 .013373 21.47424 21.63315 9 1.21e+07
sd | 2.893777 .0139515 .0090088 1.382201 9.567882 19.49053 4.63e+07
variance | 8.373943 .0001946 .0000812 1.91048 91.54437 379.881 2.14e+15
N | 70 70 70 70 70 70 70
range | 12.29123 .076465 .0364122 6.02939 50.83611 66 2.15e+08
min | 2.272727 -.0228935 .0055458 18.77835 2.140078 1 350000
max | 14.56395 .0535714 .041958 24.80774 52.97619 67 2.15e+08
Source: Researcher’s own computation based on the financial statements

51
The descriptive statistics summarized in Table 4.10 are a collection of measurements of two
things: location and variability. Location tells one the central value of the variables (the
mean is the most common measure of this). Variability refers to the spread of the data from
the center value (i.e. variance, standard deviation).
The mean is the sum of the observations divided by the total number of observations. The
median is the middle value of the total observation. The standard deviation is the squared
root of the variance and indicates how close the data is to the mean. The variance measures
the dispersion of the data from the mean. It is the simple mean of the squared distance from
the mean. Count (N in the table) refers to the number of observations per variable. Range is
also another measure of dispersion. It is the difference between the largest and smallest
values, max minus min. Min is the lowest value in the variable. Max is the largest value in
the variable.
Taking a look at table 4.10, the researcher has discussed the following issues:
The average (mean) debt to equity ratio (DER) of Ethiopian commercial banks is
found to be 8.10 and this indicates commercial banks are financed (leveraged) with
debt at approximately eight times greater than equity option. That is the banks
financing decision is inclining to deposit mobilization than to the equity financing.
Even the standard deviation show that the banks have, in the past ten years, focused
more on debt financing than on equity financing.
The average annual profitability of the banks under investigation is found to be 2.8
percent. Since profitability was measured by the ratio of operating income to total
assets, the maximum attained average profitability rate is 5.4 percent whereas the
lowest recorded average profitability rate is -2.2 percent and the dispersion other
values of profitability rate is 0.02 percent which indicates the individual banks have
constant profitability rate every year.
The mean of asset composition is found to be 1.6 percent indicating that the
commercial banks fixed assets represent only 1.6 percent of the total assets. Due to
the nature of the business banks have high current assets, which is equal to
approximately 98.4 percent. Tangibility of the commercial banks operating in
Ethiopia, as measures by the ratio of fixed assets to total assets, ranges from 0.6
percent to 4.2 percent.
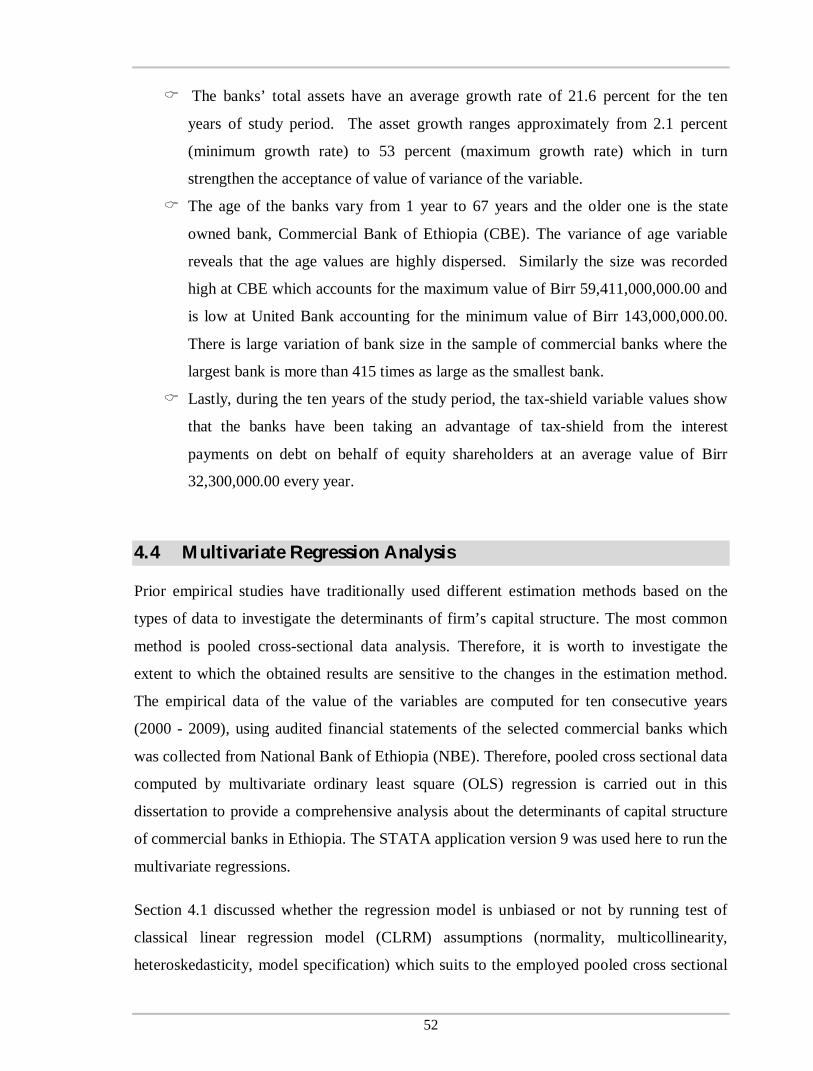
52
The banks’ total assets have an average growth rate of 21.6 percent for the ten
years of study period. The asset growth ranges approximately from 2.1 percent
(minimum growth rate) to 53 percent (maximum growth rate) which in turn
strengthen the acceptance of value of variance of the variable.
The age of the banks vary from 1 year to 67 years and the older one is the state
owned bank, Commercial Bank of Ethiopia (CBE). The variance of age variable
reveals that the age values are highly dispersed. Similarly the size was recorded
high at CBE which accounts for the maximum value of Birr 59,411,000,000.00 and
is low at United Bank accounting for the minimum value of Birr 143,000,000.00.
There is large variation of bank size in the sample of commercial banks where the
largest bank is more than 415 times as large as the smallest bank.
Lastly, during the ten years of the study period, the tax-shield variable values show
that the banks have been taking an advantage of tax-shield from the interest
payments on debt on behalf of equity shareholders at an average value of Birr
32,300,000.00 every year.
4.4 Multivariate Regression Analysis
Prior empirical studies have traditionally used different estimation methods based on the
types of data to investigate the determinants of firm’s capital structure. The most common
method is pooled cross-sectional data analysis. Therefore, it is worth to investigate the
extent to which the obtained results are sensitive to the changes in the estimation method.
The empirical data of the value of the variables are computed for ten consecutive years
(2000 - 2009), using audited financial statements of the selected commercial banks which
was collected from National Bank of Ethiopia (NBE). Therefore, pooled cross sectional data
computed by multivariate ordinary least square (OLS) regression is carried out in this
dissertation to provide a comprehensive analysis about the determinants of capital structure
of commercial banks in Ethiopia. The STATA application version 9 was used here to run the
multivariate regressions.
Section 4.1 discussed whether the regression model is unbiased or not by running test of
classical linear regression model (CLRM) assumptions (normality, multicollinearity,
heteroskedasticity, model specification) which suits to the employed pooled cross sectional

53
data. Though the different tests for heteroskedasticity indicated that there is insignificant
heteroskedasticity problem with the data, the data was made 100 percent free from
heteroskedasticity problem using the “robust” command of STATA in order to make the
model fully unbiased.
The multivariate linear regression model before estimation was:
DER = β0 + β1(PR) + β2(TN) + β3(SZ) + β4(GR) + β5(AG) + β6(TXS) + ε
The dependent variable is leverage measured in terms of debt to equity ratio (DER) and the
explanatory variables are profitability (PR), tangibility (TN), size (SZ), growth (GR), age
(AG) and tax-shield (TXS); measured with the most known proxies used in many related
studies. The beta values (βi) explain how much the variation in the dependent variable is
explained by the estimated linear regression model.
The regression result is generated based on the above specified model. Therefore, results of
the regression analysis are discussed in relation to each of the independent variables in Table
4.11 and forthcoming paragraphs.
Table 4.11: Regression Result of DER and the Explanatory Variables
Linear regression Number of obs = 70
F( 6, 63) = 16.93
Prob > F = 0.0000
R-squared = 0.6129
Root MSE = 1.8841
| Robust DER | Coef. Std. Err. t P>|t| [95% Conf. Interval] -------------+---------------------------------------------------------------- PR | -89.7641 22.63408 -3.97 0.000 -134.9947 -44.5335
TN | 7.575344 17.38885 0.44 0.665 -27.1735 42.32419
SZ | 1.950811 0.3299303 5.91 0.000 1.291497 2.610124
GR | -0.5097882 2.813779 -0.18 0.857 -6.132676 5.1131
AG | 0.0560336 0.0295697 1.89 0.063 -0.0030567 .1151238
TXS | 4.62e-08 1.47e-08 3.14 0.003 7.56e-08 1.68e-08
_cons | -30.93228 7.00783 -4.41 0.000 -44.93631 -16.92825
Source: Researcher’s own computation based on the financial statements Notes:
On the upper right, there are overall summaries of the ‘robust’ regression: the number of
observations, the F-test for the overall significance, R2 and the square root mean squared
error of the residuals.
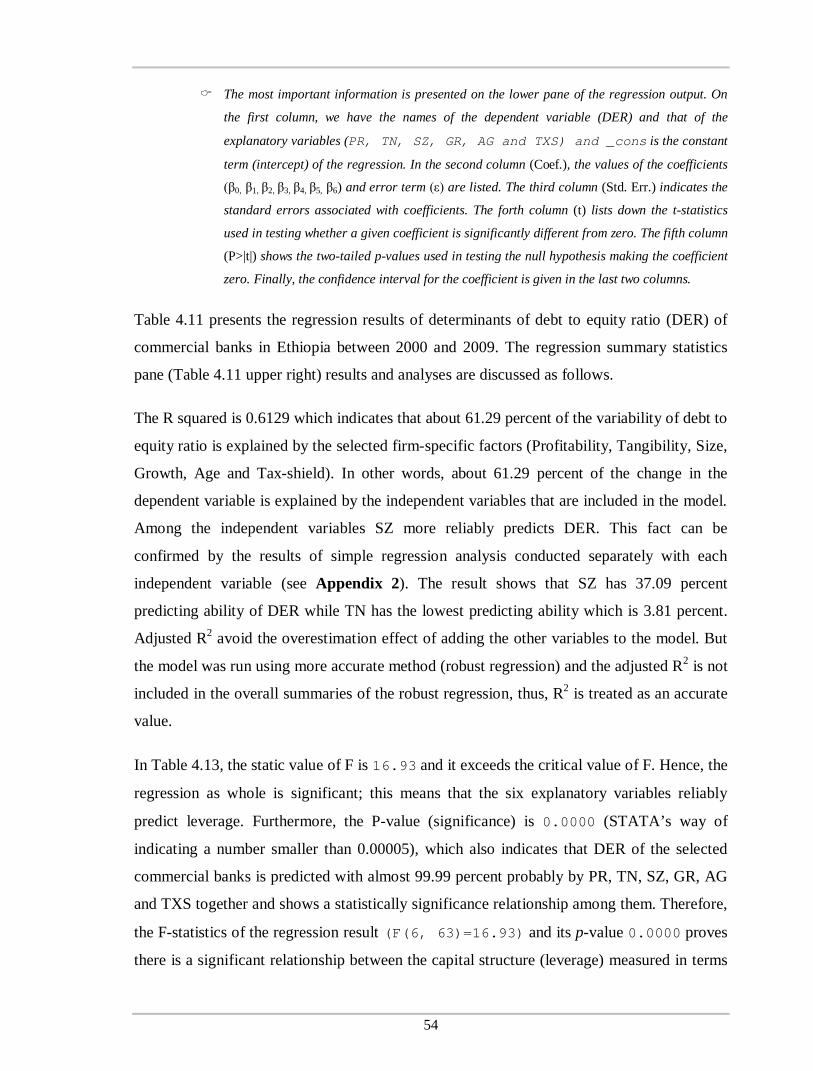
54
The most important information is presented on the lower pane of the regression output. On
the first column, we have the names of the dependent variable (DER) and that of the
explanatory variables (PR, TN, SZ, GR, AG and TXS) and _cons is the constant
term (intercept) of the regression. In the second column (Coef.), the values of the coefficients
(β0, β1, β2, β3, β4, β5, β6) and error term (ε) are listed. The third column (Std. Err.) indicates the
standard errors associated with coefficients. The forth column (t) lists down the t-statistics
used in testing whether a given coefficient is significantly different from zero. The fifth column
(P>|t|) shows the two-tailed p-values used in testing the null hypothesis making the coefficient
zero. Finally, the confidence interval for the coefficient is given in the last two columns.
Table 4.11 presents the regression results of determinants of debt to equity ratio (DER) of
commercial banks in Ethiopia between 2000 and 2009. The regression summary statistics
pane (Table 4.11 upper right) results and analyses are discussed as follows.
The R squared is 0.6129 which indicates that about 61.29 percent of the variability of debt to
equity ratio is explained by the selected firm-specific factors (Profitability, Tangibility, Size,
Growth, Age and Tax-shield). In other words, about 61.29 percent of the change in the
dependent variable is explained by the independent variables that are included in the model.
Among the independent variables SZ more reliably predicts DER. This fact can be
confirmed by the results of simple regression analysis conducted separately with each
independent variable (see Appendix 2). The result shows that SZ has 37.09 percent
predicting ability of DER while TN has the lowest predicting ability which is 3.81 percent.
Adjusted R2 avoid the overestimation effect of adding the other variables to the model. But
the model was run using more accurate method (robust regression) and the adjusted R2 is not
included in the overall summaries of the robust regression, thus, R2 is treated as an accurate
value.
In Table 4.13, the static value of F is 16.93 and it exceeds the critical value of F. Hence, the
regression as whole is significant; this means that the six explanatory variables reliably
predict leverage. Furthermore, the P-value (significance) is 0.0000 (STATA’s way of
indicating a number smaller than 0.00005), which also indicates that DER of the selected
commercial banks is predicted with almost 99.99 percent probably by PR, TN, SZ, GR, AG
and TXS together and shows a statistically significance relationship among them. Therefore,
the F-statistics of the regression result (F(6, 63)=16.93) and its p-value 0.0000 proves
there is a significant relationship between the capital structure (leverage) measured in terms

55
DER and the determinant explanatory variables measured in terms of PR, TN, SZ, GR, AG
and TXS. In simple words, the F-statistic of 16.93 suggests that the model fits the data
significantly.
The Estimated Regression Equation:
DER = -30.93 - 89.76PR + 7.58TN + 1.95SZ - 0.51GR + .06AG + 4.62x10-08TXS - ε
The t-statistics show that the explanatory variables such as profitability, size, age and tax-
shield appear to be significant. Profitability, size and tax-shield are significant at 1 percent
significance level and age is significant at 10 percent significance level.
Profitability and growth are negatively related to debt to equity ratio as indicated by their
respective coefficients of -89.7641 and -0.5098. The negative effect of profitability on DER
is very strong such that a 1 unit increase in profitability (keeping other variables constant)
would decrease the tendency of the commercial banks’ debt taking by 89.76 units. However,
tangibility, size, age and tax-shield proved positive association with the leverage ratio and
are expressed by their coefficients of 7.5753, 1.9508, 0.5098 and 4.62 x 10⁻⁸, respectively.

56
4.5 Hypothesis Testing and Discussion of Results
Table 4.12 presents the summary of the regression results for the equation of Ethiopian
commercial banks leverage using the determinants of capital structure as explanatory
variables. In this section, the hypotheses formulated in chapter 1 are tested followed by
discussion of the results.
Results obtained from analysis, expressed in terms of the signs and statistical significance of
the coefficients for the selected six independent variables, are presented in Tables 4.12 and
4.13. The conducted hypotheses testing and discussed results are categorized on the basis of
these independent variables and focused on their relationships with capital structure theories.
Table 4.12: Firm Specific Analysis of Determinants of Capital Structure
Independent Variables
Dependent variable Debt to Equity Ratio (DER)
values of the coefficients t-statistics Significance level
Profitability (PR) -89.7641 (22.63)
-3.97* (0.000) Significant at 1% level
Tangibility (TN) 7.575344 (17.39)
0.44 (0.665) Insignificant
Size (SZ) 1.950811 (0.33)
5.91* (0.000) Significant at 1% level
Growth (GR) -0.5097882 (2.81)
-0.18 (0.857)
Insignificant
Age (AG) 0.0560336 (0.03)
1.89 (0.063) Significant at 10% level
Tax-Shield (TXS) 4.62 x 10-08
(1.47e-08) 3.14
(0.003) Significant at 1% level
Number of observations = 70 F-Statistics = 16.93 Prob > F = 0.0000 R2 = 0.6129 (61.29%)
Source: Researcher’s own computation based on the financial statements
Notes: Standard errors associated with the coefficients are in parentheses under the values of coefficients. P-value of the t-statistics is shown in parentheses under the t-statistics value. The * symbol indicates highly significant variables
In addition, to verify if capital structure decisions that are made in the commercial banks in
Ethiopia provide empirical support for existing theories, regression results of this study,

57
summarized in Table 4.12, are compared with the following table, Table 4.13, of summary
of hypothesized, expected and observed theoretical signs of independent variables.
Table 4.13: Hypothesized, Expected and Observed Signs of the Independent Variables
Explanatory Variable Definition Hypothesized
signs
Theoretical signs of explanatory variables based on capital
structure theories Observed sign
STT POT ACT
Profitability (PR)
Ratio of Operating income to Total assets - + - ? -
Tangibility (TN)
Ratio of Tangible (fixed) assets to Total assets + + + + +
Size (SZ)
Natural Logarithm of Total Assets + + - + +
Growth (GR)
Percentage increase (change) in total assets + - + - -
Age (AG)
Number of years stay in business + + - ? +
Tax-Shield (TXS)
Product of interest expense and corporate tax
+ + (short term) - (long term) ? ? +
Source: Researcher’s own computation based on the financial statements & summary of capital structure theories
Notes:
The theoretical signs of explanatory variables are presented in summary based on the previous capital structure theories and were used by different researchers such as Titman and Wessels (1988), Haris and Ravive (1991), Buferna et al (2005), Rajan and Zingales (2006), Octavia & Brown (2008), and Mintesinot (2010).
“+” indicates that the specified theory suggests a positive relationship between the explanatory variable and leverage.
“-” indicates that the specified theory proposes a negative relationship between the explanatory variable and leverage.
“?” indicates that there is no clear prediction.

58
4.5.1 Hypothesis Testing
Test of the research hypotheses were made based on the relationship of dependant variable
and the explanatory variables. Therefore, the following subsections deal with hypothesis
testing and the interpretation of the regression results presented above.
I. LEVERAGE WITH PROFITABILITY
Research hypothesis one was formulated for the assessment of the relationship between
leverage and profitability based on pecking order theory. Beta coefficient associated with
profitability (PR) accepted the first null hypothesis.
In this study, profitability is estimated to be negatively related with bank’s leverage ratio and
this relationship is found statistically significant at 1 percent significance level. It implies
that profitable firms in Ethiopian commercial banking sector maintain low debt to equity
ratio. This result is consistent with predictions of Pecking order theory (see Table 4.13)
which states that firms prefer to finance first with internal funds before raising external
financing. Further this outcome is also consistent with the most previous studies (Titman &
Wessels, 1988; Rajan and Zingales, 1995; and Booth et al., 2001). Hence, with highly
significance at 1 percent for inverse relationship between profitability and financial
leverage, it can be concluded that highly profitable commercial banks in Ethiopia maintain
low debt to equity ratio and they utilize more equity source compared to debt for making
their capital structure.
II. LEVERAGE WITH TANGIBILITY
Research hypothesis two was formulated to estimate the relationship between tangibility and
leverage based on static trade-off theory. Beta coefficient associated with Tangibility (TN)
accepted the second null hypothesis and proved that there is a positive relationship between
tangibility and capital structure of commercial banks in Ethiopia.
In this study, the sign of tangibility variable coefficient is found to be positive, but not
statistically significant. This result, tangibility being insignificant variable, contradicts with
various previous research findings. However, the observed sign coincides with Static trade-
off theory, pecking order theory and agency cost theory (see Table 4.13) that theorize
positive relationship between leverage and tangibility. The observed sign implies that firms

59
with high tangibility tend to finance their investments with external financing and they tend
to prefer debt over equity. In general, with exception of the insignificant result, tangibility’s
observed positive relationship with debt to equity ratio is generally consistent with
prediction and assumption that firms with higher ratio of fixed assets serve as collateral for
new loans, favoring debt. Accordingly, it fails to reject the hypothesis that tangibility is
positively related with leverage.
III. LEVERAGE WITH SIZE
Research hypothesis three was formulated to estimate the relationship between size and
leverage based on static trade-off theory. The result of beta coefficient linked with size (SZ)
accepted the third null hypothesis and proved that there a positive relationship between
leverage and size of commercial banks.
This study found size to be highly statistically significant at the 1 percent level and have
positive impact on the commercial bank’s leverage. This suggests that larger commercial
banks in Ethiopia tend to have higher leverage ratios and borrow more capital than smaller
commercial banks do. To express it in figure, assuming other determining factors constant,
for 1 unit increase in size, there is a 1.95 unit positive increase in debt to equity ratio. The
observed result is consistent with the result of static trade-off theory (see Table 4.13). Major
empirical studies also found a positive relationship between size and leverage. For instance:
Titman and Wessels, (1988), Rajan and Zingales, (1995), and Booth et al., (2001) provided
the evidence of significant and direct relationship between size and capital structure
measure. Since the result of size variable indicated a significant statistics, it is estimated that
size does have significant role in making debt ratio and determining the capital structure of
Ethiopian commercial banks.
IV. LEVERAGE WITH GROWTH
Research hypothesis 4 predicted that a positive relationship exists between capital structure
and growth, but the regression result of beta coefficient linked to growth (GR) rejected the
fourth null hypothesis favoring the alternate hypothesis that infer negative relationship
between capital structure and growth variable. The negative result contradicts with POT but
supports STT and ACT. To conclude, growth is found to be insignificant factor for deciding
the capital structure issues in commercial banking sector in Ethiopia.

60
V. LEVERAGE WITH AGE
Research hypothesis five was formulated to estimate the relationship between size and
leverage based on static trade-off theory. The result of beta coefficient linked to age variable
accepted the fifth null hypothesis and proved the positive relationship between capital
structure and age of commercial banks in Ethiopia.
In this study, age is estimated to have significant positive relationship with leverage of
commercial banks. The positive relationship is statistically significant at 10 percent
significance level. This implies that older commercial banks use more debt than younger or
newer ones do. Numerically, the 0.056 coefficient of age variable (making the other
variables constant) implies that every additional 1 year increases the leverage measure
(DER) by 0.056. This result in turn indicates that older banks have a reputation of credit and
build a good relationship with creditors; thus, they have better conditions to obtain debt and
younger commercial banks rely more on equity financing, as they are constrained by debt
financing. The observed sign coincides with Static trade-off theory but opposes pecking
order theory. Accordingly, with 10 percent significance level and direct relationship between
age and leverage, it is expected that aged commercial banks in Ethiopia maintain high debt
to equity ratio and utilize more debt source compared to equity source.
VI. LEVERAGE WITH TAX-SHIELD
The last research hypothesis, hypothesis 6, was developed to assess the relationship between
leverage and tax-shield. The result of beta coefficient associated with tax-shield variable
accepted the sixth null hypothesis and proved that there is a positive relationship between
capital structure and tax-shield of commercial banks in Ethiopia.
In this study, TXS is found to have a positive relationship with leverage and is statistically
significant at 1 percent level of significance. This result is consistent with Static trade-off
theory for short term loan but contradicts with long term loan. Operating in a developing
country, most commercial banks in Ethiopia use short term financing due to macroeconomic
factors, and the characteristics of the firm. Therefore the positive result, not surprisingly
does have consistency only with STT for short term financing because banks are having
more advantage from the tax-shields by using more interest paying deposits. Thus, TXS
does have positive significant influence on leverage ratio or capital structure of commercial
banking sector in Ethiopia.

61
4.5.2 Test of the Consistency of Capital Structure Theories
As presented in chapter two and summarized in Table 4.13, this study followed three capital
structure theories: Static trade-off theory, Pecking order theory and Agency cost theory and
tried to find out which one explain better the financial decision of the sample commercial
banks. All these theories possess different traits to explain the corporate capital structure.
Static trade-off theory suggests that optimal capital structure is a trade-off between net tax
benefit of debt financing and bankruptcy costs. Firms with high tangible assets will be in a
position to provide collateral for debts, so these firms can raise more debt. Larger and high
profitable firms maintain their high debt ratio, while firms with high growth rate use less
debt financing. Pecking order theory states that firms prefer internal financing to external
financing and risky debt to equity due to information asymmetries between insiders and
outsiders of firm. Agency cost theory illustrates the financial behavior of firms in context of
agent and principal relationship.
Consequently, the hypothesized, expected and observed theoretical signs of explanatory
variables are summarized in Table 4.13. As a result, test of the consistency of capital
structure relevancy theories in Ethiopian commercial banks is made based on the expected
and observed signs of the coefficients of the explanatory variables. Therefore, the following
conclusion is made whether capital structure decisions that are made in the commercial
banks provide empirical support for the existing theories.
Profitability is found to be negatively related with bank’s leverage ratio. This result
is consistent with predictions of POT which states that firms prefer to finance first
with internal funds before raising external financing.
The positive coefficient of relation observed, shown in Table 4.13, between the
leverage and tangibility variables provides a realistic evidence for the three theories
given that the theories expected a positive relationship between variables. Therefore,
tangibility variable supports consistency of STT, POT and ACT with the financing
decisions made in Ethiopian commercial banking case.
Size is found to have positive impact on the commercial bank’s financial leverage.
Theoretically, STT and ACT suggested that larger firms tend to have better

62
borrowing capacity relative to smaller firms. Hence, the analyzed result is consistent
with the implementation of STT and ACT in Ethiopian commercial banking case.
The insignificant and positive relationship result of growth with capital structure
contradicts with applicability of POT but supports STT and ACT.
The positive and significant relationship between age and leverage strongly supports
the STT but go up against POT.
As seen in Table 4.13, TXS does have positive significant influence on leverage ratio
of commercial banking sector in Ethiopia. This result is consistent with STT for
short term loan but contradicts with STT for long term loan. Therefore the positive
result, not surprisingly does have consistency only with STT for short term financing
because banks are having more advantage from the tax-shields by using more
interest paying deposits.
In general, looking at Tables 4.12 and 4.13, it can be concluded that all determinant factors
except profitability of capital structure decisions in Ethiopian commercial banks, indicate a
strong compliance to the Static trade-off theory. However, the negative effect of profitability
to capital structure decision indicates a strong compliance to the Pecking order theory of
capital structure. On the other hand, two (tangibility and size) out of six determinants’
association with leverage is consistent with Agency cost theory.

63
CHAPTER 55
CCOONNCCLLUUSSIIOONN AANNDD RREECCOOMMMMEENNDDAATTIIOONN
This chapter comprises summaries and conclusions extracted from research findings along with the recommendations that the researcher has developed.
55..11.. SSuummmmaarryy aanndd CCoonncclluussiioonn
This section discusses the summary of findings and conclusions for the research project.
5.1.1. Summary of Findings
The correlation matrix, as depicted in Table 4.9, defined the linear relationship between the
selected explanatory variables (profitability, tangibility, size, growth, age and tax-shield)
and the leverage measure (debt to equity ratio), the former are found to have strong and
significant relationship with the latter. Therefore, the selected independent variables
explained the dependent variable with a considerable degree.
From the descriptive statistic (Table 5.10), the average (mean) debt to equity ratio (DER) of
the cased commercial banks is found to be 8.10 signifying that they are highly leveraged
with debt at approximately eight times greater than equity option. That is, the banks’
financing decision is inclining to deposit (or debt) mobilization than to the equity financing.
With regard to the regression results (Table 4.11) of the determinants of debt to equity ratio
(DER), R squared is found to be 0.6129 indicating that 61.29 percent of the leverage (debt to
equity ratio) variability of the commercial banks in Ethiopia is well explained by the
selected firm-specific factors. Also, it confirmed that four of the explanatory variables
(profitability, size, age and tax-shield) are the significant firm-specific determinant factors of
capital structure in the banks. On the other hand, both profitability and growth variables are
found to be negatively related to debt to equity ratio. However, tangibility, size, age and tax-
shield variables proved positive relationship with the leverage ratio. Therefore, testing the
hypotheses, the regression results of the coefficients of capital structure determining factors
went for the acceptance of the first, second, third, fifth and sixth null hypotheses.

64
In testing the consistency of the capital structure relevancy theories with the capital structure
decisions made in the sampled banks, the researcher found that all the suspected determinant
factors, except profitability, of capital structure decisions in the commercial banks indicate a
strong compliance to the Static trade-off theory. However, the negative effect of profitability
on capital structure decision confirmed a strong compliance to the pecking order theory of
capital structure. In addition, the signs of tangibility and size are consistent with Agency
cost theory predictions.
5.1.2. Conclusions
Capital structure remains an important and significant issue for academicians and corporate
managers. This area has been researched by many prominent scholars, namely Modigliani
and Miller, Stewart Myers, Stephen Ross, Michael Jensen and William Meckling. However
capital structure has extensively been studied in the developed countries, but only few
researches focus on developing countries like Ethiopia. In this research project, the main
objective is to study the significant firm-specific determinants of capital structure in the
context of commercial banks in Ethiopia.
Scholars in trying to understand and decipher capital structure have come up with many
theories. Among the famous theories are Modigliani and Miller propositions, Static trade-
off, Pecking order and Agency Cost. After reviewing the theories involved in capital
structure, Titman and Wessels (1988), Harris and Raviv (1991) and Frank and Goyal (2003)
also researched the determinants of capital structure. In this study, firm-specific
determinants (internal factors) were examined in the context of Ethiopia.
To achieve the intended goal, the researcher has formulated six hypotheses. To test these
hypotheses, total of six variables; namely profitability, tangibility (collateral value of assets),
size, growth, age and tax-shield; were selected from renowned previous research works on
capital structure. In addition, the researcher has taken ten years (2000-2009) audited annual
financial statements of seven commercial banks in Ethiopia. For analysis, this study
employed multivariate ordinary least square model. The capital structure of the banks is
measured by one aggregate measure of leverage: debt to equity ratio. Therefore, the
dependent variable is regressed against the six mentioned explanatory variables.

65
The regression results of the capital structure model verified that 61.29 percent of the change
in the dependent variable (capital structure measured by debt to equity ratio) is explained by
the independent variables that are selected and included in the model. This implies that the
leverage ratio of commercial banks in Ethiopia is highly explained by the selected firm-
specific variables. The result also showed profitability, size, age and tax-shield variables are
the significant firm-specific determinants of capital structure in Ethiopian commercial banks
case. Among these, profitability, size and tax-shield variables are found highly significant
factors at 1 percent significance level. The result, in contrary to most previous researches,
verified that tangibility of assets and growth variables do not have influence on commercial
bank’s financial decisions.
This research also uncovered the fact that the two variables (profitability and growth)
established negative relationship and the remaining four variables (tangibility, size, age and
tax-shield) showed positive relationship with capital structure. As a result, profitability
variable attained an inverse relationship with capital structure measure that supports Pecking
order theory, but opposes the Static trade-off theory. This suggests that highly profitable
commercial banks in Ethiopia maintain low debt to equity ratio and they utilize more equity
sources as compared to debt sources for making their capital structure. Tangibility variable
has direct relationship with financial leverage but the researcher could not get enough
statistical significance. That is, tangibility variable does not have influence on commercial
banks’ financing decisions but has positive relationship. This relationship is consistent with
the three theories of capital structure.
Size variable displayed a positive relation with financial leverage and is found to be a most
important determinant of commercial banks’ financing pattern. Larger banks in the
Ethiopian commercial banking sector maintain high leverage ratios. Therefore, size’s
relationship with financial leverage supports Static trade-off theory and Agency cost theory
but contradicts with Pecking order theory. Negative relationship between growth and
leverage was also found out as insignificant determinant variable of banks’ financing
decision. The negative relationship between growth and financial leverage supports Static
trade-off and Agency cost theories of capital structure. The positive and significant
relationship between age and leverage strongly supports the Static trade-off theory but go up
against Pecking order theory. Lastly, tax shield variable displays a positive relation with

66
financial leverage. This positive relation verifies that banks with high tax-shield use more
debt than equity. This evidence is consistent with Static trade-off theory for only short term
debts.
From the test of consistency of capital structure relevancy results, the researcher asserted
that all the capital structure relevancy theories: Static trade-off, Pecking order and Agency
cost theory are partially accepted in commercial banking sector of Ethiopia, though there is
more evidence for Static trade-off theory.
As a concluding remark, this research project found that profitability, size, age and tax-
shield are some among the firm-specific factors that determine Ethiopian commercial banks’
capital structure and are also found to be similar to the factors that influence the capital
structure of firms in developed and other developing counties that are studied by different
researchers. However, in acknowledging the influence of other pertinent factors, like
corporate governance, legal framework and institutional environment of the countries; that
are not included in this study, capital structure decision is not only the product of firm’s own
characteristics but also the macroeconomics environment in which the firm operates.
55..22.. RReeccoommmmeennddaattiioonnss
The findings of the study are deemed to benefit investors, professional managers, lenders,
academicians and policy makers in the country. Therefore, the writer has, based on the
major findings discussed above, drawn the following recommendations to investors,
commercial banks, lenders, policy makers in Ethiopia and academicians. Suggestions for
further research are also forwarded.
To Investors and Shareholders
External investors and shareholders should appreciate the discussed variables that
determine the capital structure of a particular commercial bank and observe its
performance before making decisions of whether or not to buy or sell its particular
stock when secondary market begins to operate in Ethiopia.
To Commercial Bankers:
The study has identified the determinants of capital structure of commercial banks of
Ethiopia. Therefore, commercial banks should (constrained by the policies and

67
regulations of the National Bank of Ethiopia) stipulate standards to determine the
proportion of debt to equity ratio. Therefore, CEOs and finance managers of
commercial banks shall consider the findings of this paper to make appropriate
capital structure decisions that best fit their respective banks’ financing needs.
The coefficient of tax-shield is found to be very small compared to the coefficients
of other significant variables. Thus, its degree of influence on financing decision
commercial banks is can be said insignificant. This shows that commercial banks in
Ethiopia are not benefiting from tax advantage of interest expenses, considerably.
Therefore, the financial managers of commercial banks should give substantial
attention for the tax-shield variable.
To Lenders:
Before lenders seek to protect themselves from excessive use of corporate leverage
through the use of protective covenants, they should consider the capital structure
determinant variables studied above to evaluate and predict the risk associated with
lending capital to their respective borrowers.
To Policy Makers at Different Levels:
Ethiopian Commercial banks’ capital is found to rely more on debt financing than on
equity financing. This is an indication of business environment that investors could
buy and sell their stocks and firms in the country could raise capital for their
projects. Capital markets are, therefore, one of the instruments that potentially switch
companies’ financing from short to long-term securities and investors’ attention from
short-term investments to long-term investments in addition they promote the
mobilization of private investment on public debt and equity issues. Therefore, now
is the appropriate time to research the importance and applicability of secondary
market in Ethiopian case.
The lack of high-quality databases might constitute the major barrier on conducting
capital structure research in Ethiopia. Consequently, there is a need, for policy
makers at different levels, to design policies which guide organizations to develop
validated databases as more data becomes available in future. Using such databases
can help examining and identifying additional variables that could influence the
financing behavior of Ethiopian firms and other studies.

68
For Further Research
The limitations of the study provide avenue for the directions for future research. Some of
the recommendations for future research include the following:
1) For the purpose of this study and for the sake of simplicity, the researcher has
focused on a single measure of leverage that is debt to equity ratio. Obviously
factors that affect short-term debt and factors that affect long-term debt might be
different. Hence, further studies should be made incorporating different measures
of leverage. Apart from this, both dependent and independent variables are not
adequately defined owing to time constraints and shortage of data. It is
imperative that these unnoticed variables and other measures of the included
variables to be taken into account in future capital structure studies.
2) Tangibility and growth variables need to be retested under longer-study period
when the data is available.
3) Other important external (macroeconomic) variables such as inflation, GDP
growth, interest rate, corporate governance, legal framework and impact of the
country’s financial system should be added besides the firm-specific factors to
determine capital structure of firms.
4) In this study, the researcher has mainly examined the factors that influence
financing mix of commercial banks in Ethiopia. It might be interesting and
crucial to extend this research to other sectors of the economy in the country.
5) A comparative analysis of capital structure decision of firms across developing
countries can give enhanced picture about what really determines their capital
structure decisions. Therefore, studies should be made across countries on
determinants of capital structure decision in order to obtain vivid understanding
about whether and to what extent macroeconomic conditions influence capital
structure decision of commercial banks.

69
BIBLIOGRAPHY
Abor, J. (2008). Determinants of the Capital Structure of Ghanaian Firms. African Economic Research Consortium, Nairobi, 176, 1-34.
Amidu, M. (2007). Determinants of capital structure of banks in Ghana. Journal of Management, 2, 67-79.
Ashenafi, B. (2005). Determinants of Capital Structure in Medium Enterprises in Ethiopia. Research paper, Submitted to Addis Ababa University, School of Graduates, Ethiopia.
Barclay, M. & C.W. Smith (1999). The Capital Structure Puzzle: Another look at the evidence. Journal of Applied Corporate Finance, 12, 8-20.
Bas, T., Gulnur, M., & Kate, P., (2009). Determinants of Capital Structure in Developing Countries. Research Paper Series. Cass Business School, 106 Bunhill Row, London EC1Y 8TZ, U.K.
Benito, A. (2003). The Capital Structure Decisions of Firms: Is There A Pecking Order? Bank of Spain, Document 0310.
Benton, G. & James, K. (2005). Commercial Banking: The Management of Risk. 3rd Edition, John Wiley & Sons, United States.
Booth, L., Aivazian, V., Demirguc-Kunt, V., & Maksimovic, V. (2001). Capital structures in developing countries. Journal of Finance, 56, 87–130.
Bradley, M., Jarell, G. & Kim, H. (1984). On the Existence of an Optimal Capital Structure: Theory and Evidence. Journal of Finance, 39, 857- 880.
Brander, A. & Lewis, T.R. (1986). Oligopoly and Financial Structure: The Limited Effect. American Economic Review, 76, 956-970.
Brealey, R. & Myers, C. (1991). Principles of Corporate Finance. 4th ed. New York: McGraw-Hill, U.S.A.
Buferna, F., Bangassa, K., & Hodgkinson, L. (2005). Determinants of Capital Structure Evidence from Libya. Research Paper Series, Submitted to Management School University of Liverpool, Liverpool, England.
Damodaran, A. (2001). Corporate Finance: Theory and Practice. United States: John Wiley & Sons.
De Angelo, H. & Masulis, R. (1980). Optimal capital structure under corporate and personal taxation. Journal of Financial Economics, 8, 3 –29.
Diamond, D. & Rajan, R. (2000). A theory of bank capital. Journal of Finance, 55, 2431- 2465.
Diamond, W. (1989). Reputation Acquisition in Debt Markets. Journal of Political Economy, 97, 828-862.
Fama, E. & French, R. (2002). Testing the Tradeoff and Pecking Order Predictions about Dividends and Debt. Review of Financial Studies, 15, 1-33.

70
Frank, M.Z. & Goyal, V.K. (2003). Testing the Pecking Order Theory of Capital Structure. Journal of Financial Economics, 67, 217-248.
Foerster, R. (). Financial Management: A Primer.. 5th Edition, W.W. Norton & Company, London, UK.
Graham, J.R. (2000). How big are the Tax benefits of Debt? Journal of Finance 55, 1901-1941.
Gropp, R. & Florian, H. (2007). What can corporate finance say about banks’ capital structures? Journal of Finance, 21,1-31.
Gujarati, D. N. (2003). Basic Econometrics. 4th Edition, Boston: McGraw-Hill.
Harris, M. & Raviv, A. (1988). Corporate Control Contests and Capital Structure. Journal of Finance, 45, 321-349.
Harris, M. & Raviv, A. (1990). Capital structure and the information role of debt. Journal of Finance, 45, 321–349.
Harris, M., & Raviv, A. (1991). The theory of capital structure. Journal of Finance, 46, 297–355.
Henrik, S. & Sandra, S. (2004).Capital Structure: A Swedish Real Estate Study. Journal of Finance, 95, 1–33.
Jensen, M., & Meckling, W.H. (1976). Theory of the firms: Managerial behavior, agency costs and ownership structure. Journal of Financial Economics, 3, 305–360.
Khan, M. Y. (2008). Financial Management: Text and Problems. 5th Edition, McGraw-Hill Publishing Company Limited, New Delhi, India.
Khan, M. Y. & Jain, P. K. (2006). Management Accounting and Financial Analysis. 2nd Edition, McGraw-Hill Publishing Company Limited, New Delhi, India.
Leland, H. & Pyle, D. (1977). Information Asymmetries, Financial Structure, & Financial Intermediation. Journal of Finance, 62, 371–388.
MacKie-Mason, J. (1990). Do Taxes Effect Corporate Financing Decisions? Journal of Finance, 45, 1471-1493.
Maddalla, G. S. (2005). Introduction to Econometrics. 3rd Edition, John Wiley & Sons(Asia), Neekunji Print Process, New Delhi, India.
Maghyereh, A. (2005). Dynamic Capital Structure: Evidence from the Small Developing Country of Jordan. Journal of Economics and Management 13, 1-26.
Mintesinot, A. (2010). Determinants of Capital Structure, Evidence from Selected Manufacturing Private Limited Companies of Tigray Region. Research Paper, Submitted to College of Business and Economics, Mekelle University, Ethiopia.
Modigliani, F. & Miller, M. (1958). The cost of capital, corporation finance and the theory of investment. American Economic Review, 48, 261– 275.
Modigliani, F. & Miller, M. (1963). Corporate income taxes and the cost of capital. American Economic Review, 53, 433–443.

71
Mohammed, A. (2008). Capital Structure in Saudi Arabian Listed and Unlisted Companies. Research paper, Submitted to University of Stirling, Scotland.
Myers, S. C. (1977). Determinants of Corporate Borrowing. Journal of Financial Economics, 5, 147–175.
Myers, S. C. (1984). The Capital Structure Puzzle. Journal of Finance, 39, 575-92.
Myers, S. C. (2001). Capital Structure. Journal of Economic Perspectives, 15, 81-102.
Myers, S. C. & Majluf, N. S. (1984). Corporate financing and investment decisions when firms have information that investors do not have. Journal of Financial Economics, 13, 187– 221.
National Bank of Ethiopia, http://www.nbe.gov.et, March 04, 2010.
Octavia, M. and Brown, R., (2008). Determinants of Bank Capital Structure in Developing Countries. Research Paper Series, Department of Finance, The University of Melbourne, Victoria 3010, Australia.
Pandy, I. M. (2005). Financial Mangemnt. 9th Edition, Vikas Publishing House Pvt. Ltd., India.
Perrin, R. (2002). Handbook for Collage Research. 2nd Edition, Houghton Miffilin Company, Boston, United States.
Richard, P. & Bill N. (2004). Corporate Finance & Investment: Decisions & Starategies. 2nd Edition, Prentice-Hall of India Private Limited, New Delhi, India.
Rajan, R. and Zingales, L. (1995). What Do We Know about Capital Structure? Some Evidence from International Data. Journal of Finance, 50, 47-81.
Ross, S.A. (1977). The Determination of Financial Structure: The Incentive- Signalling Approach. Journal of Economics, 8, 23-40.
Ross, S. A., Westerfield, R. W. & Jaffe, J. F. (2006). Fundamentals of Corporate Finance. 7th Edition, McGraw-Hill – Irwin, Boston, United States.
Shyam-Sunder, L. and Myers, S. C. (1999). Testing Static Tradeoff against the Pecking Order Models of Capital Structure. Journal of Financial Economics, 51, 219-244.
Tesfaye, M. (2008). Ethiopia Tax Accounting Theory and Practice. 1st Edition, View Grafics, Addis Ababa, Ethiopia.
Titman, S. (1984). The Effect of Capital Structure on the Firm’s Liquidation Decision. Journal of Financial Economics, 13, 137-151.
Titman, S. & Wessels, R. (1988). The determinants of capital structure choice. Journal of Finance, 43, 1 –19.
Van-Horne, J. (1989). Financial Management and Policy. 12th Edition, Upper Saddle River, Prentice-Hall, New Jersey, U.S.A.
Yaregal, A. (2007). Fundamentals of Financial Management. 1st Edition, Accounting Society of Ethiopia, Addis Ababa, Ethiopia.

72
Appendix 1: STATA Output of Tabulated Standardized residuals Source: Researcher’s own computation based on the financial statements
Standardized| Residuals | Freq. Percent Cum. ------------+----------------------------------- -2.144524 | 1 1.43 1.43 -1.748011 | 1 1.43 2.86 -1.639237 | 1 1.43 4.29 -1.496695 | 1 1.43 5.71 -1.330775 | 1 1.43 7.14 -1.31282 | 1 1.43 8.57 -1.29714 | 1 1.43 10.00 -1.274646 | 1 1.43 11.43 -1.196976 | 1 1.43 12.86 -1.188884 | 1 1.43 14.29 -1.046628 | 1 1.43 15.71 -.9898105 | 1 1.43 17.14 -.9847601 | 1 1.43 18.57 -.8649171 | 1 1.43 20.00 -.8249193 | 1 1.43 21.43 -.8173999 | 1 1.43 22.86 -.8139665 | 1 1.43 24.29 -.7968678 | 1 1.43 25.71 -.6668962 | 1 1.43 27.14 -.593833 | 1 1.43 28.57 -.5885032 | 1 1.43 30.00 -.5346012 | 1 1.43 31.43 -.5127237 | 1 1.43 32.86 -.4787374 | 1 1.43 34.29 -.4562592 | 1 1.43 35.71 -.4139114 | 1 1.43 37.14 -.3080939 | 1 1.43 38.57 -.2845356 | 1 1.43 40.00 -.1628767 | 1 1.43 41.43 -.1431026 | 1 1.43 42.86 -.1120213 | 1 1.43 44.29 -.1088298 | 1 1.43 45.71 -.0546226 | 1 1.43 47.14 -.0375416 | 1 1.43 48.57 -.0011958 | 1 1.43 50.00 .0023032 | 1 1.43 51.43 .0248975 | 1 1.43 52.86 .0422904 | 1 1.43 54.29 .0492983 | 1 1.43 55.71 .1177274 | 1 1.43 57.14 .127941 | 1 1.43 58.57 .2088253 | 1 1.43 60.00 .245255 | 1 1.43 61.43 .2668819 | 1 1.43 62.86 .2725789 | 1 1.43 64.29 .3329024 | 1 1.43 65.71 .3418512 | 1 1.43 67.14 .3657711 | 1 1.43 68.57 .3912249 | 1 1.43 70.00 .4037821 | 1 1.43 71.43 .4114315 | 1 1.43 72.86 .5185367 | 1 1.43 74.29 .5204086 | 1 1.43 75.71 .5424289 | 1 1.43 77.14 .5933241 | 1 1.43 78.57 .6008781 | 1 1.43 80.00 .755161 | 1 1.43 81.43 .8304118 | 1 1.43 82.86 .8485079 | 1 1.43 84.29 1.108375 | 1 1.43 85.71 1.124395 | 1 1.43 87.14 1.203148 | 1 1.43 88.57 1.282835 | 1 1.43 90.00 1.382457 | 1 1.43 91.43 1.425275 | 1 1.43 92.86 1.486807 | 1 1.43 94.29 1.807863 | 1 1.43 95.71 2.36517 | 1 1.43 97.14 2.437555 | 1 1.43 98.57 2.84879 | 1 1.43 100.00 ------------+----------------------------------- Total | 70 100.00
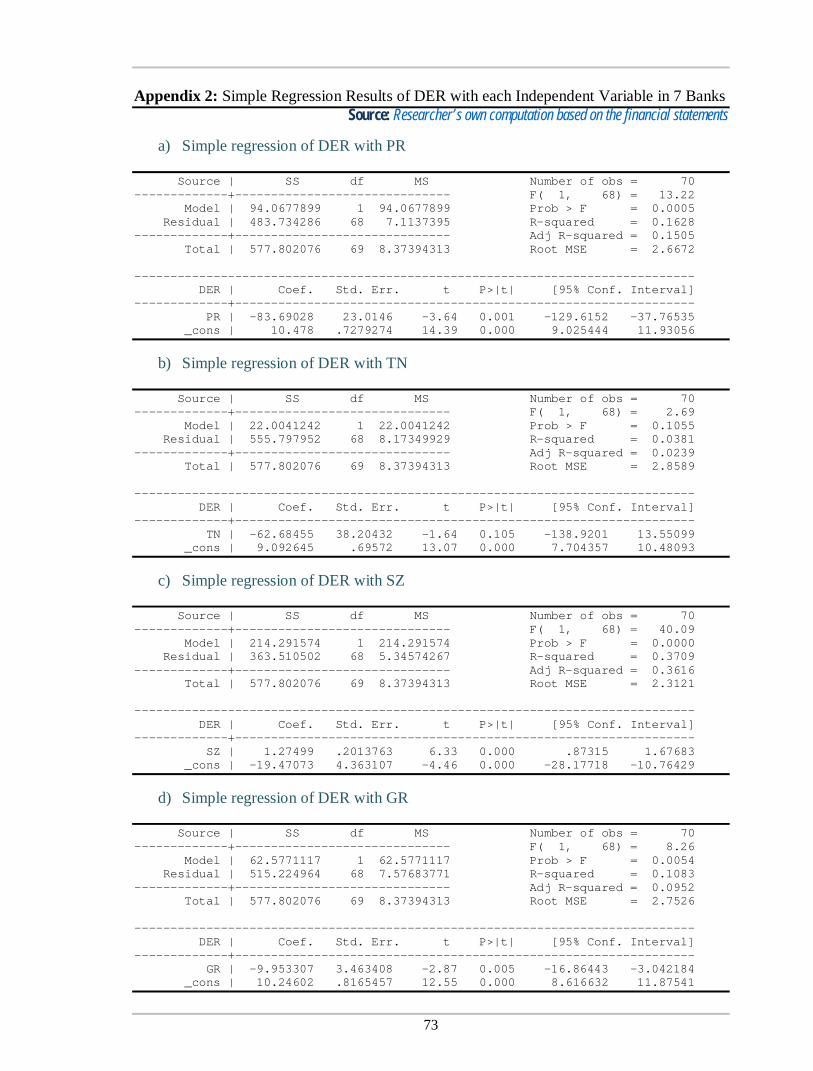
73
Appendix 2: Simple Regression Results of DER with each Independent Variable in 7 Banks Source: Researcher’s own computation based on the financial statements
a) Simple regression of DER with PR
Source | SS df MS Number of obs = 70 -------------+------------------------------ F( 1, 68) = 13.22 Model | 94.0677899 1 94.0677899 Prob > F = 0.0005 Residual | 483.734286 68 7.1137395 R-squared = 0.1628 -------------+------------------------------ Adj R-squared = 0.1505 Total | 577.802076 69 8.37394313 Root MSE = 2.6672 ------------------------------------------------------------------------------ DER | Coef. Std. Err. t P>|t| [95% Conf. Interval] -------------+---------------------------------------------------------------- PR | -83.69028 23.0146 -3.64 0.001 -129.6152 -37.76535 _cons | 10.478 .7279274 14.39 0.000 9.025444 11.93056
b) Simple regression of DER with TN
Source | SS df MS Number of obs = 70 -------------+------------------------------ F( 1, 68) = 2.69 Model | 22.0041242 1 22.0041242 Prob > F = 0.1055 Residual | 555.797952 68 8.17349929 R-squared = 0.0381 -------------+------------------------------ Adj R-squared = 0.0239 Total | 577.802076 69 8.37394313 Root MSE = 2.8589 ------------------------------------------------------------------------------ DER | Coef. Std. Err. t P>|t| [95% Conf. Interval] -------------+---------------------------------------------------------------- TN | -62.68455 38.20432 -1.64 0.105 -138.9201 13.55099 _cons | 9.092645 .69572 13.07 0.000 7.704357 10.48093
c) Simple regression of DER with SZ
Source | SS df MS Number of obs = 70 -------------+------------------------------ F( 1, 68) = 40.09 Model | 214.291574 1 214.291574 Prob > F = 0.0000 Residual | 363.510502 68 5.34574267 R-squared = 0.3709 -------------+------------------------------ Adj R-squared = 0.3616 Total | 577.802076 69 8.37394313 Root MSE = 2.3121 ------------------------------------------------------------------------------ DER | Coef. Std. Err. t P>|t| [95% Conf. Interval] -------------+---------------------------------------------------------------- SZ | 1.27499 .2013763 6.33 0.000 .87315 1.67683 _cons | -19.47073 4.363107 -4.46 0.000 -28.17718 -10.76429
d) Simple regression of DER with GR
Source | SS df MS Number of obs = 70 -------------+------------------------------ F( 1, 68) = 8.26 Model | 62.5771117 1 62.5771117 Prob > F = 0.0054 Residual | 515.224964 68 7.57683771 R-squared = 0.1083 -------------+------------------------------ Adj R-squared = 0.0952 Total | 577.802076 69 8.37394313 Root MSE = 2.7526 ------------------------------------------------------------------------------ DER | Coef. Std. Err. t P>|t| [95% Conf. Interval] -------------+---------------------------------------------------------------- GR | -9.953307 3.463408 -2.87 0.005 -16.86443 -3.042184 _cons | 10.24602 .8165457 12.55 0.000 8.616632 11.87541
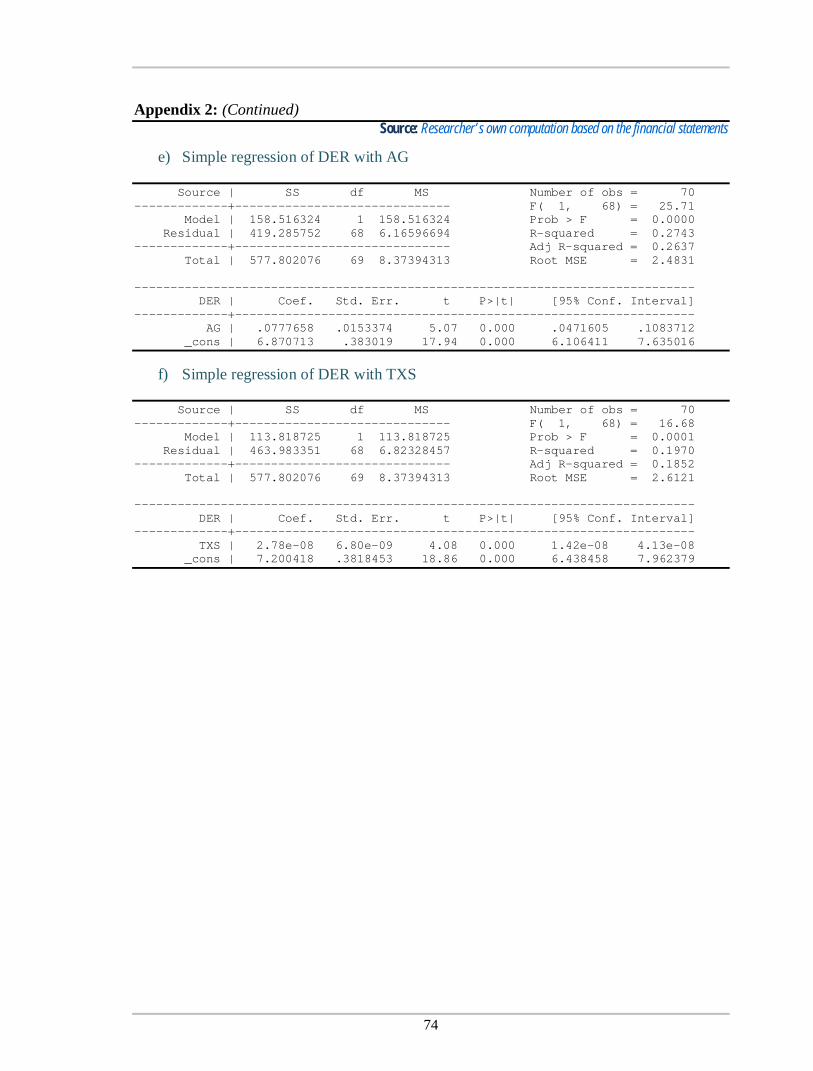
74
Appendix 2: (Continued) Source: Researcher’s own computation based on the financial statements
e) Simple regression of DER with AG
Source | SS df MS Number of obs = 70 -------------+------------------------------ F( 1, 68) = 25.71 Model | 158.516324 1 158.516324 Prob > F = 0.0000 Residual | 419.285752 68 6.16596694 R-squared = 0.2743 -------------+------------------------------ Adj R-squared = 0.2637 Total | 577.802076 69 8.37394313 Root MSE = 2.4831 ------------------------------------------------------------------------------ DER | Coef. Std. Err. t P>|t| [95% Conf. Interval] -------------+---------------------------------------------------------------- AG | .0777658 .0153374 5.07 0.000 .0471605 .1083712 _cons | 6.870713 .383019 17.94 0.000 6.106411 7.635016
f) Simple regression of DER with TXS
Source | SS df MS Number of obs = 70 -------------+------------------------------ F( 1, 68) = 16.68 Model | 113.818725 1 113.818725 Prob > F = 0.0001 Residual | 463.983351 68 6.82328457 R-squared = 0.1970 -------------+------------------------------ Adj R-squared = 0.1852 Total | 577.802076 69 8.37394313 Root MSE = 2.6121 ------------------------------------------------------------------------------ DER | Coef. Std. Err. t P>|t| [95% Conf. Interval] -------------+---------------------------------------------------------------- TXS | 2.78e-08 6.80e-09 4.08 0.000 1.42e-08 4.13e-08 _cons | 7.200418 .3818453 18.86 0.000 6.438458 7.962379

75
Appendix 3: Financial Statements of the Sampled Commercial Banks Source: National Bank of Ethiopia
a) Ten Years Financial Statement of Commercial Banks of Ethiopia
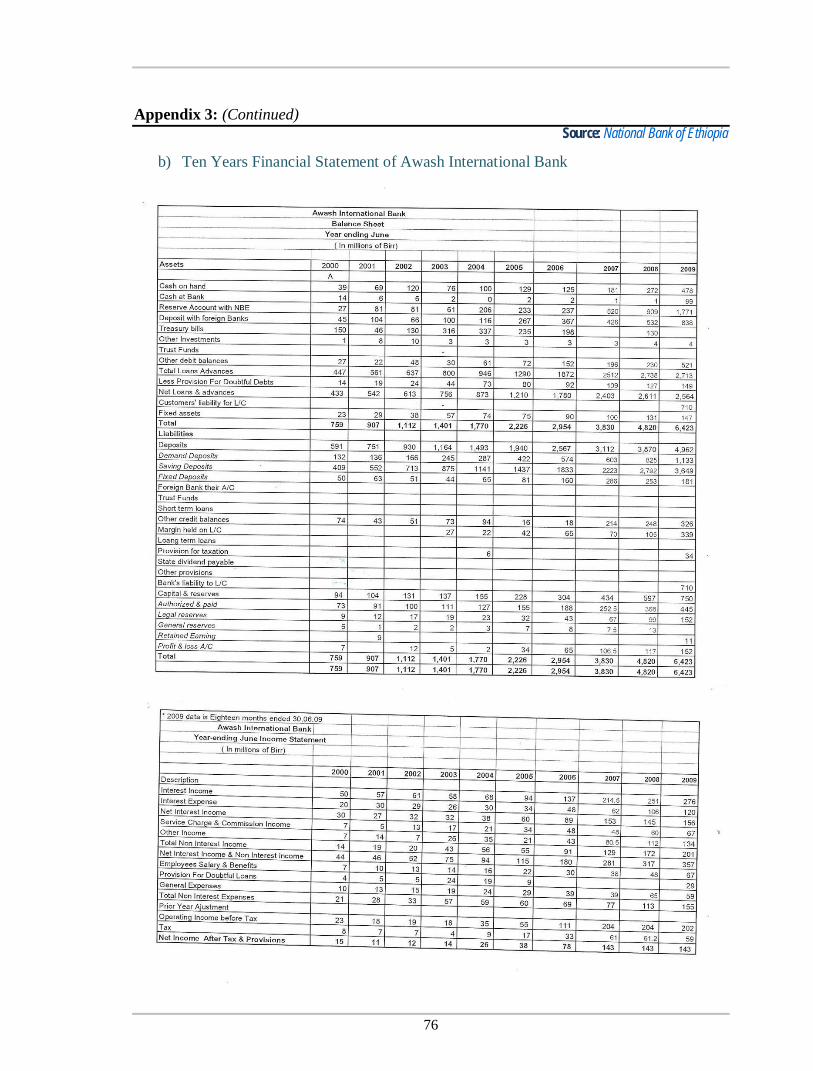
76
Appendix 3: (Continued)
Source: National Bank of Ethiopia
b) Ten Years Financial Statement of Awash International Bank
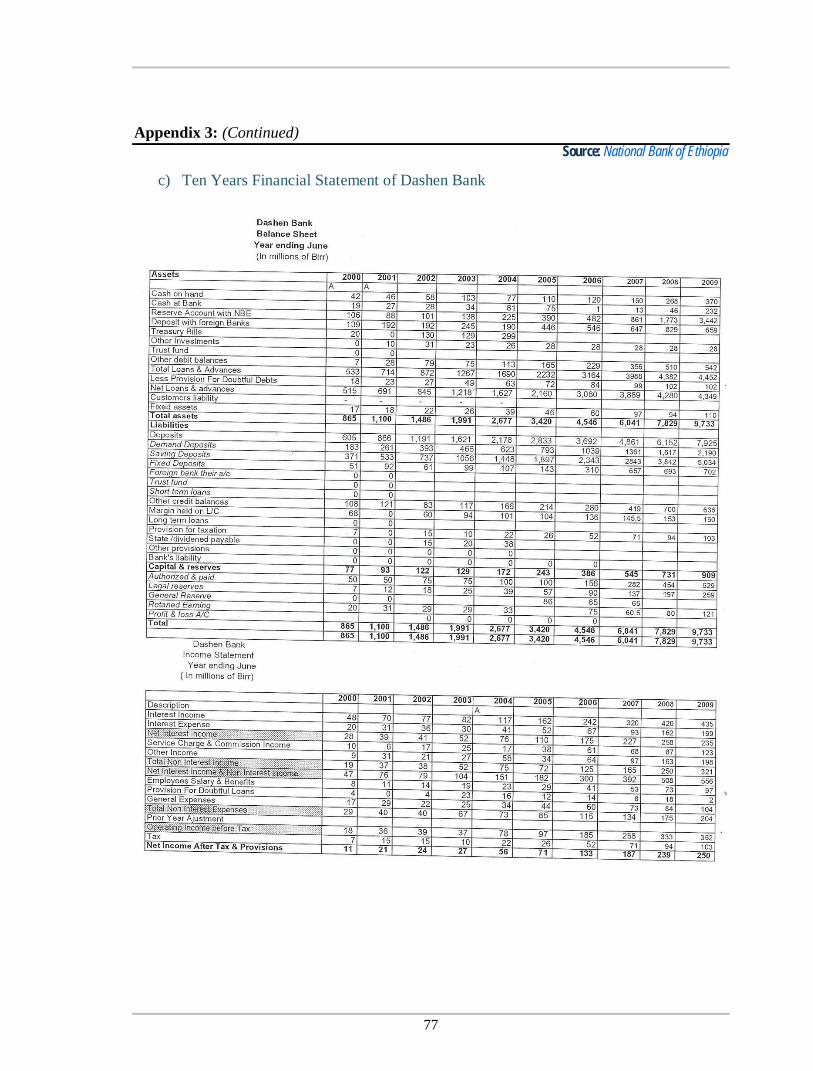
77
Appendix 3: (Continued)
Source: National Bank of Ethiopia
c) Ten Years Financial Statement of Dashen Bank

78
Appendix 3: (Continued)
Source: National Bank of Ethiopia
d) Ten Years Financial Statement of Bank of Abyssinia

79
Appendix 3: (Continued) Source: National Bank of Ethiopia
e) Ten Years Financial Statement of Wegagen Bank

80
Appendix 3: (Continued)
Source: National Bank of Ethiopia
f) Ten Years Financial Statement of United Bank

81
Appendix 3: (Continued)
Source: National Bank of Ethiopia
g) Ten Years Financial Statement of Nib International Bank