the determinants of capital structure bernard ng …
TRANSCRIPT
THE DETERMINANTS OF CAPITAL STRUCTURE FOR FIRMS IN CONSTRUCTION AND MATERIALS
SECTOR IN MALAYSIA
BERNARD NG CHONG YAN KHOR JIA CHYI
TAN WAI YIN YAP SIEW THENG
BACHELOR OF BUSINESS ADMINISTRATION
(HONS) BANKING AND FINANCE
UNIVERSITI TUNKU ABDUL RAHMAN
FACULTY OF BUSINESS AND FINANCE DEPARTMENT OF FINANCE
APRIL 2012

KHOR, NG, TAN, & YAP CAPITAL STRUCTURE BBF (HONS) ARPIL 2012

THE DETERMINANTS OF CAPITAL STRUCTURE FOR
FIRMS IN CONSTRUCTION AND MATERIALS
SECTOR IN MALAYSIA
BY
BERNARD NG CHONG YAN
KHOR JIA CHYI
TAN WAI YIN
YAP SIEW THENG
A research project submitted in partial fulfillment of the
requirement for the degree of
BACHELOR OF BUSINESS ADMINISTRATION (HONS)
BANKING AND FINANCE
UNIVERSITI TUNKU ABDUL RAHMAN
FACULTY OF BUSINESS AND FINANCE
DEPARTMENT OF FINANCE
APRIL 2012

ii
Copyright @ 2012
ALL RIGHTS RESERVED. No part of this paper may be reproduced, stored in a
retrieval system, or transmitted in any form or by any means, graphic, electronic,
mechanical, photocopying, recording, scanning, or otherwise, without the prior
consent of the authors.

iii
DECLARATION
We hereby declare that:
(1) This undergraduate research project is the end result of our own work and that
due acknowledgement has been given in the references to ALL sources of
information be they printed, electronic, or personal.
(2) No portion of this research project has been submitted in support of any
application for any other degree or qualification of this or any other university,
or other institutes of learning.
(3) Equal contribution has been made by each group member in completing the
research project.
(4) The word count of this research report is _________________________.
Name of Student: Student ID: Signature
Bernard Ng Chong Yan 09 ABB 08508 ____________________
KhorJiaChyi 09 ABB 05430 ____________________
Tan Wai Yin 09 ABB 08506 ____________________
Yap SiewTheng 09 ABB 06826 ____________________
Date: 13 April 2012

iv
ACKNOWLEDGEMENT
We would like to give our utmost gratefulness to UTAR for providing this
opportunity for us to pursue the final year project as a partial fulfillment of the
requirement for the Bachelor of Business Administration (Hons) Banking and
Finance. We are truly appreciated for those who have committed their effort, time and
resources by helping us to complete this final year project throughout the process.
We are very fortunate to be blessed with advices, suggestion, guidance and
encouragement from our supervisor, Ms Zuriawati throughout the process. She is
willing to guide us patiently to lead us grow and broaden our views towards the right
direction. Furthermore, we would like to thank our lecturer as well as tutor, Mr Wye
Chung Khain, who conducted the research method that provided us a clear
understanding and direction regarding on this research project.
Lastly, this research project would not be materializing without all the guidance,
support and assistance from those who have contributed effort in helping us to
complete this final year project throughout the process. Thus, we would like to give
our deepest appreciation to them in helping us in completion of this final year project.

v
DEDICATION
We would like to dedicate our final year project work to our family, friends, and
relatives for their unlimited support, help us as well as encouragement and motivation
throughout the completion of this research. A special feeling of gratitude and
appreciation to our loving supervisor, Ms Zuriawati, who spent hours with us over a
one-year period to prepare us for completing this research, whose words of
encouragement and consideration to us throughout the process.

vi
TABLE OF CONTENTS
Pages
Copyright Page…………………………………………………….………….….....ii
Declaration……………………………………………………………………….….iii
Acknowledgement…………………………………………………………………..iv
Dedication…………………………………………………………………………....v
Table of Contents………………………………………………................................vi
List of Tables…………………………………………………………………….…...x
List of Charts………………………………………………………………….…...…xi
List of Abbreviations…………………………………………………………...........xii
List of Appendices………………………………………………………………..…xiii
Preface……………………………………...………………………….....................xiv
Abstract…………………………………………………………………………...….xv
CHAPTER 1 RESEARCH OVERVIEW……………………………..……..1
1.0 Introduction……………………………………………..…......1
1.1 Research Background……………………...…………….........2
1.1.1 Overview of Capital Structure……………....………...2
1.1.2 Capital Structure Development in Asia- Malaysia........5
1.1.3 Overview of Construction and Materials Sector………8
1.1.4 Debt Financing in Malaysia- Construction Sector.…..10
1.2 Problem Statement……………………………………….…..13
1.3 Research Objective………………………………...….……..15
1.4 Research Questions…………………………………….…….15
1.5 Hypothesis of the Study……………………………………...16
1.6 Significance of the Study…………………………………….16
1.7 Chapter Layout…………………………………………...….17
1.8 Conclusion…………………………………………………...19

vii
CHAPTER 2 LITERATURE REVIEW………………………………........20
2.0 Introduction………………………………………………….20
2.1 Theoretical Model…………………………………………....20
2.1.1 Modigliani and Miller (MM) Theory………………...20
2.1.2 Static Trade- Off Theory………………………….....21
2.1.2.1 Benefits of Debt.……………………………. 22
2.1.2.2 Costs of Debt……………………………...… 24
2.1.3 Pecking Order Theory………………………………..26
2.1.4 Market Timing Theory…………………………….....28
2.1.5 Conclusion………………………...………….……...28
2.2 Empirical Review…………………………………………….29
2.2.1 Firm Size and Total Debt…………………….………29
2.2.2 Tangibility and Total Debt…………………….……..30
2.2.3 Profitability and Total Debt…………...……..…..…. 32
2.2.4 Non-Debt Tax Shield and Total Debt………….….... 33
2.2.5 Growth Opportunity and Total Debt………………....34
2.2.6 Liquidity and Total Debt………………………...…...36
2.3 Theoretical Framework………………………………..……..38
2.4 Hypothesis Development……………………………..……...39
2.4.1 Firm Size and Debt………….……………………… 39
2.4.2 Tangibility and Debt……….……………………….. 40
2.4.3 Profitability and Debt……………………………… 40
2.4.4 Non-debt Tax Shield and Debt……………………... 41
2.4.5 Growth Opportunity and Debt……………………… 42
2.4.6 Liquidity and Debt…………………….……………. 42
2.5 Conclusion……………………………...……………..……..43
CHAPTER 3 Methodology…………………………………………………44
3.0 Introduction………………………………………..…….…..44

viii
3.1 Research Design……………………………………….……..44
3.2 Data Collection Methods……………………………….........45
3.3 Sampling Design…………………………………………......46
3.4 Data Processing………………………………………..…......46
3.4.1 Dependent Variables…………………………...…....46
3.4.2 Independent Variables…………………………..…...47
3.4.3 Model Equation…………………………………...…50
3.5 Data Analysis…………………………………………….….51
3.5.1 Descriptive Analysis……………………………..…..51
3.5.2 Inferential Analysis………………………………….52
3.6 Conclusion……………………………………………….…..53
CHAPTER 4 DATA ANALYSIS…………………………………….…...55
4.0 Introduction………………………………………………....55
4.1 Descriptive Analysis………………………………………...56
4.2 Inferential Analysis……………………………………….....60
4.2.1 Correlation Analysis………………………………...60
4.2.2 Regression Analysis……………………….………...63
4.3 Conclusion…………………………………………………..71
CHAPTER 5 DISCUSSION, CONCLUSION AND IMPLICATIONS….72
5.0 Introduction………………………………………………....72
5.1 Summary of Statistical Analyses……………………………72
5.1.1 Descriptive Analysis………………………………...72
5.1.2 Correlation Analysis………………………………...73
5.1.3 Regression Analysis………………………………...74
5.2 Discussion of Major Findings………………………………79
5.2.1 Summary of Hypothesis Testing……………………79
5.2.2 Major Findings……………………………………..85
5.3 Implications of Studies……………………………………...90
5.3.1 Managerial Implications……………………………90

ix
5.4 Limitations of the Research……………………….………..94
5.5 Recommendations for Future Research……………………. 95
5.6 Conclusion……………………………………………….….96
References…………………………………………………………….. 98
Appendices…………………………………………………………….109

x
LIST OF TABLES
Page
Table 1.1: Business Loan of Construction Sector in Malaysia within the Year
2005-2009 …………………………………………………………….… 12
Table 3.1: Sample Panel Data………………………………………………………. 53
Table 3.2: The Measurements of Variables………………………...…………...….. 54
Table 4.1: Descriptive Statistic for Construction and Materials Sector…….…….... 56
Table 4.2: Correlation Analysis of Construction and Materials Sector………...……60
Table 4.3: Panel Data Regression Analysis………………..………………....……...63
Table 5.1: Summary of the Result of Hypothesis Testing (Total Debt)…………..…79
Table 5.2: Summary of the Result of Hypothesis Testing (Short-term Debt)…….....81
Table 5.3: Summary of the Result of Hypothesis Testing (Long-term Debt)…........ 83
Table 5.4: Summary of the Differences between the Results of Short-term
Debt and Long-term Debt………………………………………......….....85
Table 5.5: Comparison between Expected Sign of Independent Variables
Based on Trade-Off Theory and Pecking Order Theory with Actual
Signs of Independent Variables……………………………...............…....89

xi
LIST OF FIGURES
Page
Figure 1.1: Capital Market Overview in Malaysia…………………...........................7
Figure 1.2: Timeline of the Capital Market Development in Malaysia…………..….7
Figure 1.3: Loans Growth of Malaysia from year 2006 to year 2011……….…..….11
Figure 1.4: Loan of Construction Sector………………………………………..…. 12
Figure 1.5: Growth in Construction Sector versus Growth in Federal
Government Development Expenditure and Private Investment…….... 13
Figure 2.1: The Determinants of Capital Structure……………………………..…. 38

xii
LIST OF ABBREAVTIONS
9MP Ninth Malaysia Plan
BNM Bank Negara Malaysia
EBIT Earnings before Income Tax
GRO Growth Opportunity
LDEBT Long-term Debt
LIQ Liquidity
MM Modigliani and Miller
NDTS Non-debt Tax Shield
PRO Profitability
SC Security Commission
SDEBT Short-term Debt
SME Small and Medium Enterprise
TAN Tangibility
TDEBT Total Debt
UK United Kingdom
US United States
xiii
LIST OF APPENDICES
Page
Appendix 3.1: Names of 92 Firms in Our Sample………………………...……... 109
Appendix 4.1: Panel Data Regression Analysis of Short-term Debt from Eview... 113
Appendix 4.2: Panel Data Regression Analysis of Long-term Deb from Eview.... 114
Appendix 4.3: Panel Data Regression Analysis of Total Debt from Eview…...… 115
Appendix 4.4: Descriptive Analysis from Eview…………………………….….. 116
Appendix 4.5: Correlation Analysis from Eview……………………….….……. 117

xiv
PREFACE
Capital structure has become more and more crucial in business planning these days.
It is very necessary that companies should have optimal capital structure that can
maximize the price of the company’s stocks. There are several financing options to
finance its assets but it is necessary to choose the financing options that maximize its
overall value. What is more, in order to survive and prosper in the long run, the need
to plan about the capital structure and determine the characteristics as well as the
relationship with the determinants is a must.
Besides, we notice that construction and materials sector has been one of the leading
sectors in Malaysia. It has high growth but required high capital as well. Therefore,
we are interested in knowing the methods of the companies use to finance their
operating capital and also the purchase of fixed assets.
Lastly, we have put a lot of efforts and time into it in order to produce the best
possible research paper. Last but not least, we are grateful to the people who have
helped us and we hope that this research paper will be useful to others too.

xv
ABSTRACT
Although there has been a great deal of research on the determinants of the capital
structure in Malaysia firms, they are only based on one measurement of debt level
which is the total debt ratio. Hence, our research is analyzing the relationship between
the three different measurements of debt level which are the short-term debt, long-
term debt and total debt with the six determinants which are the profitability,
liquidity, tangibility, non-debt tax shield, growth opportunity and firm size. On top of
that, we uses panel data of 92 firms from construction and materials sector observed
over 5-year period from 2005 to 2009 that are retrieved from data stream provided in
the library of Universiti Tunku Abdul Rahman (UTAR). Our panel data regression
results show that profitability and liquidity are significant and have negative
relationships with short-term debt. However, firm size, tangibility, growth
opportunity and non-debt tax shield are found to be insignificant with short-term debt.
On the other hand, the results show that profitability, liquidity, tangibility and non-
debt tax shield are significant and have negative relationship with long-term debt and
total debt except for tangibility which has a positive relationship with both long-term
and total debt. The remaining two determinants which are the grow opportunity and
firm size are insignificant with long-term debt and total debt. Finally, the results we
concluded are consistent with the combination of both pecking order and the trade-off
theories but market timing theory is found to be inappropriate.

The Determinants of Capital Structure for Firms in Construction and Materials Sector of Malaysia
Page 1 of 117
CHAPTER 1: RESEARCH OVERVIEW
1.0 Introduction
Capital structure is one of the most debated topics in corporate finance. Capital
structure has been broadly defined as “the relationship between company‟s debt and
equity” (Awan et al., 2010). In finance, the term capital structure defined as the mix
of debt and equity financing employed to provide capital needed for the firm (David,
2004). A further definition of capital structure by Eckert and Engelhard (1999) is that
capital structure is the combination of financing contracts, in which a firm has to
choose between debt and equity in order to finance its investments. The financing
contracts in this context refer to the agreements respecting to the nature of returns
paid (whether the returns will be fixed or variable), the time period for which the
financial resources are/ will remain at the firm‟s disposal, and the currency in which
the resources is denominated (Awan et al., 2010).
Since the seminal work by (Modigliani and Miller (1958), which is the origin
researchers of the capital structure, many researchers had extensively conducted the
research on this area mainly in United States, France, Japan, United Kingdom,
Germany and other G-7 countries. Their focal point is to identify the unique
combination of debt and equity, the aspects and the factors that influence on the
optimal capital structure.
The major goal for almost of the firms is to maximize the shareholder wealth and the
firm‟s value. To achieve this, firms need to appropriate determine the capital structure
between debt and equity by taking consideration into the internal and external
conditions. Based on previous researches, six determinants of capital structure were
identified for this study. They are firm size, tangibility, profitability, non-debt tax
shield, firm age, growth opportunity and liquidity.

The Determinants of Capital Structure for Firms in Construction and Materials Sector of Malaysia
Page 2 of 117
1.1 Research Background
1.1.1 Overview of Capital Structure
The paper of Modigliani and Miller on the irrelevance of capital structure in
1958 are one of the most influential papers in the economics literature and
commonly known as the MM theory. It is also the beginning for the
subsequent researchers to broadly debate on this subject. The first versions of
the paper were very simple. It states that based on the assumption of perfect
capital markets, no brokerage, no corporate or personal tax, no bankruptcy
costs, investors can borrow at the same rate as corporations and they would
tend to have the same information as management about the firm‟s future
investment opportunities (Teker et al., 2009). According to MM theory, under
some restrictions, a firm‟s value will not be affected by its capital structure
and assumes that earnings before income tax (EBIT) will not be related to the
use of debt, and thus leads to the inference that capital structure may be
considered as irrelevant. Even though, the fact of the fundamental irrelevance
theory can be assumed unrealistic by the investors, it is generally accepted and
many researchers focus on this subject on relaxing some of the assumptions to
develop more realistic approach. In 1963, there was another amendment paper
published by Modigliani and Miller to improve the limitation on the previous
paper.
The in depth theoretical work and empirical investigation have resulted in two
major theories of optimal capital structure, which is the trade-off theory and
the pecking order theory (Myers, 1984). In the application of trade-off theory,
firms use debt as a source of financing. Based on trade-off theory, the firms
with optimal debt financing can benefits from tax shield against various cost
associated with debt. The various costs could be bankruptcy and agency cost.

The Determinants of Capital Structure for Firms in Construction and Materials Sector of Malaysia
Page 3 of 117
On the other hand, the pecking-order theory by Myers 1984 suggests that
firms are supposed to prefer internal financing (retained earnings) to external
funds. When internal cash-flow is not sufficient to finance capital
expenditures, firms will borrow, rather than issue equity (Bauer, 2004). In
brief, pecking-order theory will follow the sequence of financing from
retained earnings, followed by debt and equity as the last resort.
Firms‟ value is determined by the positive net present value cash flow of
investment. The cash flow is generated through the investment of assets.
Usually, the assets can be financed through three sources of financing,
retained earnings, debt instruments and equities. These three types of
financing generally make up the capital structures of firms. Among these, debt
financing is the cheaper form of financing. However, firms cannot only make
used of it, because when there is high interest rates, earnings of investment
will wiped off the interest cost and it is high possibility that firms will incur
losses. Thus it could be a risky way of financing. Alternatively, firms can also
issue new shares to obtain funds instead of debt but shares cannot always
generate cash when firms need funding. Also not every firms is suitable to
issue new shares, some small and younger firms are at high risk to issue new
shares (Berger and Udell, 1998; Coleman, 2000). It is clear that firms should
not only rely on one type of capital financing but should consider the
combination of three sources of financing in order to obtain optimal capital
structure. A well capital structure combination of debt and equity will attempt
to increase the market value of the firms (Rafiq et al., 2008; Titman and
Wessels, 1988; Harris and Raviv, 1991; Awan et al., 2010).
One of the main objectives of firms is to maximize the shareholders‟ wealth
and business value. Financial managers are the one who obliged to determine
and make the ideal decision on capital financing choices. The decisions they
made are the most crucial and have large impact on the firms overall
performance. Hence, they must equip with powerful capital structure

The Determinants of Capital Structure for Firms in Construction and Materials Sector of Malaysia
Page 4 of 117
knowledge in dealing to the fast-ever changing business world. However, in
response to the uncertainty and risky world, it is tough for firms to achieve the
best capital structures. Furthermore, the empirical work is still lagged behind
the theoretical models (Rajan and Zingales, 1995).
Capital structure style can be differ from country to country, firm to firm,
sector to sector as well as the industry to industry. The differential of these
could be due to country cultures, firm characteristics and industry types. A lot
of researchers have been studied on the countries specific and firms specific.
Based on the paper written by Jong et al. (2008), they found that firms‟
specific factors such as tangibility, firm size, firm risk, growth and
profitability on cross-country could influence on the capital structure choice.
Also, their paper indicate that the country-specific factors on aggregate
leverage such as capital formation, inflation rate, trade openness, GDP growth,
market/ bank-based financial system, shareholder/ creditor right protection
and legal enforcement could significantly affect on the capital structure
decisions. Other researchers such as Rajan and Zingales (1995) conduct the
research on G-7 countries based on the evidence from international data and
also conclude that common firms specific and countries specific factors do
affect the financing decision. Booth et al. (2001) analyze capital structure
choices of firms in ten developing countries, the result shows that the firm‟s
capital structure variables of European countries are also relevant in
developing countries but the country factors is rather different. Hence, it is
obvious that firms must fully understand the structure and objective of their
firms in order to well manage their capital structure and so to increase firms‟
market value.
The Determinants of Capital Structure for Firms in Construction and Materials Sector of Malaysia
Page 5 of 117
1.1.2 Capital Structure Development in Asia- Malaysia
Capital markets in Asia were being researched on an aggregate level with
regard to their unexpected growth and the additional volatility in the
advancement of this growth. For example, the asset price bubbles and the
moral hazard in capital markets indicate one important stand of empirical
finance research on Asia (Getzmann et al., 2010). However, even though the
factors such as over investment and excessive leverage are crucial for Asian
growth, only few empirical studies take this observation as a motivation to
broadly research corporate capital structures in Asia.
Capital market is a physical market place for securities, debt or equity, where
the firms and government can raise the long-term funds. It is a market in
which money is provided for more than one year period. According to article
of Capital Market in Malaysia (2009), emerging markets in Asia, including
Malaysia is largely dependent on foreign capital inflows. Since Malaysian
capital markets are more developed, it has an opportunity for growth as
compared to other Asian countries. Structural changes and intense competition
have been made in order to further increase the development of the capital
market in Malaysia.
The capital market in Malaysia has undergone a tough development since the
late 1980s. Those Malaysian and Singaporean companies which had been
delisted from their stock exchanges was a landmark in the development of
Malaysia‟s equity market. The equity market has contributed to the growth for
private sector with issuances of new shares to enable firms to obtain cheaper
financing of capital. Meanwhile, bond market was starting to develop. The
central bank, bank Negara Malaysia (BNM) plays an important role to
introduce the principal dealer and system to develop the secondary market for
bonds. Since 1995, the government has encouraged firms to raise fund from
issuing bonds. But during the financial crisis, many bonds are defaulted,

The Determinants of Capital Structure for Firms in Construction and Materials Sector of Malaysia
Page 6 of 117
hurting the confidence in the market. Thus, the capital market of Malaysia is
facing many serious challenges during the time. Along with the expansion of
capital markets, other activities such as investment management funds, stock
brokerages and advisory services are also affected. By September 2000,
Malaysia had 62 licensed stock brokerages, 32 futures broking firms and 735
licensed futures brokers‟ representatives (Capital Market in Malaysia, 2009).
According to The Star by Sarif (2011), Tan Sri Zarinah Anwar, chairman of
Securities Commission (SC) said, “Malaysia‟s capital market crossed the
RM2 trillion thresholds for the first time ever as at end 2010.” Malaysia
capital market had achieved annual compounded growth rate of 11% from
RM717 billion in 2000 due to rapid industry expansion and the strong
regulatory supervision that underpinned investor confidence. The equity
market had grown by 27% from RM979 billion in 2009 to RM1.2 trillion in
2010 as the market sentiment improved on the back of the launch of new
economic programmes. The bond market also has a steady growth with the
outstanding debt securities rising 16.2% from RM653.2 billion in 2009 to
RM758.7 billion in 2010. Below is the overview of capital market of Malaysia
in year 2011.

The Determinants of Capital Structure for Firms in Construction and Materials Sector of Malaysia
Page 7 of 117
Figure 1.1: Capital Market Overview in Malaysia
Size (RM billion)
Source : The Star online, March 18, 2011
Figure 1.2: Timeline of the Capital Market development in Malaysia
Source: Developed for the research
Stock Market, 1,246.7
Bond Morket,
758.7
Year 2010
2010 2009 2000 1995 1980
Total: 717.5 Total: 2033.9
It has
undergone a
tough
development.
Government
encourages
firms to raise
fund from
bond
issuances.
Financial
crisis has led
to defaulted
bond.
62 licensed
stock
brokerages.
32 futures
broking firms.
735 licensed
futures brokers
representatives.
Annual growth
rate 11% from
RM 717
billion.
Equity
market to
27% from
RM979
billion.
Bond market
to 16.2%
from
RM653.2
billion.
Equity market
to RM1.2
trillion.
Bond market
to RM758.7
billion.

The Determinants of Capital Structure for Firms in Construction and Materials Sector of Malaysia
Page 8 of 117
1.1.3 Overview of Construction and Materials Sector
Construction sector is a new sector in the market which is not globalized yet
in the nature. Countries involve construction sector in their national industry
include Europe, North America, and Asia, predominantly China. Firms in
construction sector are firms that handling infrastructures and building project
such as shopping mall construction, houses, bridges and office blocks. Based
on article of construction and building materials, the industry is partly related
to Civil Engineering on infrastructure projects such as handling ground works
and ground preparation for site construction. However, some countries such as
Malaysia include Civil Engineering as a sub sector of construction sector
(Bank Negara Malaysia [BNM], 2007) It is difficult for firms to do cross
country project as there are different laws and regulations implemented by
different countries such as building laws, retail laws and building regulations
for residential.
Furthermore, construction is a very materials and skills intensive industry.
Owing to the pre-requisite of huge professions and labors to perform the
project, the development of the sector is slower. According to article of
construction and building materials, a great deal of global infrastructure
expansion is undertaken by emerging countries and most of the western
companies are fighting to obtain the contracts from China and India. It is also
mentioned that in year 2010, India needed to double infrastructure spending
from US$500 billion (£325 billion) to US$1 trillion in the next five year plan.
If the plan is workable, then it would be the biggest and most ambitious
infrastructure in the world. In Malaysia, construction sector is important in
generating better life for Malaysian based on the quality infrastructure
provided by the sector. Referring to Sahudin et al. (2011), construction sector
has shown a positive growth from year 2003 to year 2008 due to the ongoing
Ninth Malaysia Plan (9MP). The authors also mentioned that, there will be a

The Determinants of Capital Structure for Firms in Construction and Materials Sector of Malaysia
Page 9 of 117
greater demand for construction professions and buildings materials in Tenth
Malaysia Plan which was just launched.
Materials sector is a sector which is highly dependent on construction sector
since its role is to provide goods to construction sector those goods are such as
paint and wiring, steel, iron, furniture and so on. One of the biggest
improvements for the sector is the “green building” planning desired by
various nations. Based on the construction and building materials article, in
United States, the “green building” materials market was worth US$60 billion
in year 2009. Another huge and high demand sub sector in materials sector is
the green floor-covering sector. In Malaysia, there is not much development
of materials sector as compared to construction materials such as steel and
iron, and cement (BNM, 2007).
In this research, we choose to use the combination of construction and
materials sector to examine the relationship of firm capital structure
determinants. The reason we choose the combination of these two sectors is
because they are interrelated. Construction sector requires construction
materials such as cements, iron, steel, fabricated metal product such as metal
fixtures and furniture and so on to perform their project. Therefore, both
sectors rely on each other heavily. The growth of construction sectors would
also lead to growth of materials sector. This could be seen in the year 2007 to
2009 of Malaysia construction sector whereby it was doing well due to the
Ninth Malaysia Plan (9MP) and this has led to the expansion of construction
related materials (BNM, 2007).

The Determinants of Capital Structure for Firms in Construction and Materials Sector of Malaysia
Page 10 of 117
1.1.4 Debt financing in Malaysia – Construction Sector
Institutions rely heavily on debt to finance their business. Based on previous
researchers, they used short- term debt, long- term debt and total of both
short- term debt and long- term debt to examine the relationship with the
independent variables for construction and materials sector. Short- term debt
is a debt that borrowers have to repay within 12 months while long- term debt
is a debt that borrowers can repay after one year or more. Debt financing in
Malaysia varies among the sectors. According to BNM, there are 12 sectors in
Malaysia (primary agriculture, mining and quarrying, manufacturing
(including agro-based), electricity, gas and water, wholesale and retail trade,
accommodation and restaurant, construction, real estate, transport, storage and
communication, financing, insurance and business services, education, health
and others, household sector and other sector).
Recently, there are several researches from banks analysts revealed the overall
loan growth from the year 2006 to 2011 that the retail and business-related
loans is expected to increase in December 2012 (The Star, February 7, 2012).
Figure 1.3 shows the loans growth in Malaysia from year 2006 to year 2011.
The overall loan in year 2007 is lower as compared to year 2008, year 2010
and year 2011. However, this overall loan growth is analyzed for the entire
industry of Malaysia, it could be different loans amount based on different
sectors. Table 1.1 and Figure 1.4 show the total business loan of construction
sector in Malaysia. Based on the figure, at year 2006 there was a smaller
amount loan by construction sector because the loan application has declined.
We can also observe that loan of construction sector is higher in year 2007
which is a slightly decrease in year 2008 and year 2009 as compared to other
years. This was because in these three years, the businesses mainly
manufacturing, wholesale trade and construction sectors are supported by
acquiring a larger amount of financing through bank loans (short-term
financing) to fund their working capital (BNM, 2007).

The Determinants of Capital Structure for Firms in Construction and Materials Sector of Malaysia
Page 11 of 117
It was also mentioned that construction sector was doing well was mainly due
to the implementation of Ninth Malaysia Plan (9MP) whereby most of the
financing was used to finance new projects and upgrade existing infrastructure
facilities such as roads, schools, hospitals and government quarters. Therefore,
construction sector from year 2007 to year 2009 is recorded as strong growth
compare to other sectors which is shown in Figure 1.5 below. (Growth in
construction sector versus Growth in Federal Government Development
Expenditure and Private Investment).
Figure 1.3: Loans Growth of Malaysia from year 2006 to year 2011
Source: The Star, February 7, 2012

The Determinants of Capital Structure for Firms in Construction and Materials Sector of Malaysia
Page 12 of 117
Table 1.1: Business loan of Construction Sectors in Malaysia within the year 2005 –
2009
Year Amount of Loan by Construction
Sector (RM millions)
Total Loan
(RM millions)
Percentage of Loan
based on Total Loan
2005 30,000 529,000 6%
2006 29,000 362,500 8%
2007 32,512 406,400 8%
2008 31,995 639,900 5%
2009 30,548 644,980 4.7%
Source: Bank Negara Malaysia year 2005–2009 (www.bnm.gov.my)
Figure 1.4: Loan of Construction Sector
Source: Bank Negara Malaysia year 2005-2009 (www.bnm.gov.my)
30,000
29,000
32,51231,995
30,548
27,000
28,000
29,000
30,000
31,000
32,000
33,000
2005 2006 2007 2008 2009
Loan of Construction Sector
Amount of Loan by
Construction Sector(RM millions)

The Determinants of Capital Structure for Firms in Construction and Materials Sector of Malaysia
Page 13 of 117
Figure 1.5: Growth in Construction Sector versus Growth in Federal Government
Development Expenditure and Private Investment
Source: Bank Negara Malaysia year 2009 (www.bnm.gov.my)
1.2 Problem Statement
It is clearly stated that capital structure refers to the firm's financial framework which
consists of the usage of debt and equity to finance the firm. The best mixture of
capital structure (optimal combination of equity and debt) could lead to best firms‟
performance. Thus, it is essential on how a firm finances its overall operations and
growth by using different sources of funds as the ability of companies to carry out
their stakeholders‟ needs is tightly related to capital structure (Ong and Teh, 2011).
In reality, capital structure of a firm is difficult to determine (Ong and Teh, 2011).
Firms‟ financial managers are difficult to exactly determine the optimal capital
structure because there are a lot of factors that could directly and indirectly affect the
capital structure decision. Therefore, firms must be very clear with various factors
that could affect the capital structure decision. The mentioned factors include form of
equity, form of debt (short-term, long-term, or both short-term and long-term debt),

The Determinants of Capital Structure for Firms in Construction and Materials Sector of Malaysia
Page 14 of 117
and determinants of capital structure such as firm size, firm age, liquidity,
profitability, growth opportunity, tangibility, non-debt tax shield and collateral.
Referring to previous researchers, there are a lot of indicators and theories used to
determine the capital structure; however there is no precise tool or formula to
determine the optimal capital structure. The capital structure indicators could be in
terms of equity, debt or both debt and equity and they are purely based on the
objective of study (Rajan and Zingales, 1995). Some firms in US apply long-term
debt ratio whereas in developing countries such as UK and Malaysia, both short-term
and long-term debt ratio are applied (Bevan and Danbolt, 2002). As regard to the
theories used, there is also no clear way to determine which theories should be
applied. According to previous researchers, the pecking theory is lied on the
fundamental concept of financing hierarchy after considering the transaction and
information asymmetry costs(Myers, 1984). The main focus of pecking theory is it
concentrates on the internal funds, followed by debts and external equities (Myers,
1984). On the contrary, trade-off theory assumes the existence of optimal capital
structure which is determined by substituting debt for equity until the value of firm is
maximized. Even there are lots of researchers include the original founder of capital
structure theories, other factors such as determinants of capital structure should not be
ignored (Modigliani and Miller, 1958).
As for determinants of capital structure lots of studies were carried out based on
different countries and industries. Some researchers such as Abdullah (2011), Patel
(2009), Teker et al. (2009), carried out their research by using tangibility, firm size,
profitability, non-debt tax shield and growth opportunity. Some researchers include
more determinants such as tax, industry classification, liquidity and volatility in their
research (Bauer, 2004). This shows that the effects of determinants on capital
structure have been researched in various industries and countries by different
researchers. Yet, limited research was found on the determinants of capital structure
on various industries. The majority of the Malaysia studies focus on overall firms
value that are influenced by both financing of debt and equity. For example, Pandey
The Determinants of Capital Structure for Firms in Construction and Materials Sector of Malaysia
Page 15 of 117
(2004) conduct the research on the relationship between capital structure and market
structure using data from 2008 Malaysian companies for the period from 1994 to
2004. Pratomo and Ismail (2006) examine the relationship between bank performance
and capital structure based on 15 Malaysia Islamic Banks‟ Annual Report from 1997
to 2004. This shows that there is limited research towards determinants of capital
structure in Malaysia, thus it is important to conduct this research.
Therefore, as regard to the above issues and based on the data availability we
primarily study the determinants of capital structure in construction and materials
sector within the year 2005 to 2009 so that we could work out the lacking of studies
between capital structures behaviors in Malaysia. The indicators of capital structure
we used in this study are short-term debt, long-term debt and total debt. The
determinants that we include in this study are firm size, tangibility, non-debt tax
shield, growth opportunity and liquidity.
1.3 Research Objectives
Our primary objective of this study is to examine the relationship between a number of
potential capital structure determinants and the debt level (short-term debt, long-term
debt and total debt) of the construction and materials sector in Malaysia. Furthermore,
this study also aims to investigate which financing practice is adopted by the sector.
1.4 Research Questions
We probe the following questions in this study:
1. What is the relationship between capital structure determinants and short-term
debt in construction and materials sector?

The Determinants of Capital Structure for Firms in Construction and Materials Sector of Malaysia
Page 16 of 117
2. What is the relationship between capital structure determinants and long-term
debt in construction and materials sector?
3. What is the relationship between capital structure determinants and total debt in
construction and materials sector?
4. What is the preference of financing practices adopted by construction and
materials sector? Short-term debt or long-term debt financing.
1.5 Hypothesis of the Study
Based on the developments of the literature, several hypotheses are developed. The
first hypothesis is about the relationship between six capital structure determinants
and short-term debt of constructions and materials sector in Malaysia. The second
hypothesis is about the relationship between six capital determinants and long-term
debt. The third hypothesis is about the relationship between six determinants and total
debt. The last hypothesis is the differences of preference of financing practices
adopted by constructions and materials sector. Based on the four hypothesis
development, further tested is carried out to find out whether there is a positive or
negative relationship between firm size, tangibility, profitability, non-debt tax shield,
growth opportunity and liquidity with debt as capital structure.
1.6 Significance of the Study
This research topic is chosen with the purpose to identify the determinants that affect
the capital structure decision in Malaysia of construction and materials sector. It is
important to carry out this research since decision making on corporate financing is
still a tough decision for most of the firms due to the uncertainty world no matter in
Malaysia or other countries and once the decision is incorrect, it could highly affect

The Determinants of Capital Structure for Firms in Construction and Materials Sector of Malaysia
Page 17 of 117
the firms‟ performance. Furthermore, there is no specific tool and guidelines on
assisting the firm management to obtain the best capital mixture of debt and equity
(Suhaila et al., 2008). Thus, we hope that the findings would primarily assist the
management of existing firms and new ventures in making capital structure decision.
The contribution of this study also could assist investors for both domestic and
foreign to distinguish the current capital structure trend of construction and materials
sector in Malaysia. Investors need research and information before making decision
on their investment. They can study the result obtained from the research and have a
better picture on the current capital mixture trend in Malaysia and distinguish which
variables will highly affect the capital mixture and also relate it to their investment.
For example, firm size will positively affect the debt level of a firm, thus when small
firms want to finance in huge debt the firm could be in high risk.
Lastly, contribution of this study also could be as a reference or guideline for the
tertiary educational level undergraduate student when they are in the same research
area. It could also help them direct their research in deeper way or carry out research
from the limitations.
1.7 Chapter Layout
Chapter 1: Research Overview
This chapter is the introductory chapter which provides overview of the study context
in which formulates the research background, research problems, research objectives,
hypotheses of the study, significance of the study and conclusion of the chapter.

The Determinants of Capital Structure for Firms in Construction and Materials Sector of Malaysia
Page 18 of 117
Chapter 2: Literature Review
This chapter presents the theoretical model, in which the theories of capital structure
is analyzed and review based on previous researchers. This chapter also provides in-
depth discussion of literature review on both international and domestic view of
capital structure. This is followed by the theoretical framework, hypothesis
development and lastly the conclusion of chapter.
Chapter 3: Methodology
This chapter provides in-depth discussion on how the research is carried out in terms
of research design, data collection methods, sampling design, data processing, and
method of data analysis and conclusion of chapter. With support by previous research,
three dependent variables and six independent variables are identified. Each of these
variables is discussed in detail in this chapter.
Chapter 4: Data Analysis
This chapter presents the discussion of statistical results and the analysis of the results
which are relevant based on the research questions and hypotheses. Both the results of
descriptive and inferential analysis are discussed thoroughly in this chapter. The
chapter is concluded by the conclusion of the chapter.
Chapter 5: Discussion, Conclusion and Implications
This chapter focuses on the broad summary of entire research project in line with
research objective and hypotheses. It consists of the summary of statistical analyses,
discussion of major findings, implications of study, limitations of the study,
recommendations for future research and conclusion of the chapter.
The Determinants of Capital Structure for Firms in Construction and Materials Sector of Malaysia
Page 19 of 117
1.8 Conclusion
In brief, chapter one defines the capital structure and determinants of capital structure
in a broad view and slowly narrow down to the construction and materials sector in
Malaysia. Capital structure could be different in various countries, sectors as well as
firms. It is important for firms to obtain optimal capital structure so that they can
maximize firm value in accordance to the shareholder wealth. However in order to
obtain optimal capital structure, management have to study factors that could directly
and indirectly affect the decision such as form of equity, form of debt (short-term,
long-term, or both short-term and long-term debt), and determinants of capital
structure such as firm size, firm age, liquidity, profitability, growth opportunity,
tangibility, non-debt tax shield and collateral. Even though the factors mentioned
above are the direction for firms to forecast their forms of financing, there are yet no
clear guidelines or tools to precisely measure optimal capital structure due to the
uncertainties of economies. Therefore, the following chapter is to discuss the
empirical studies done by past researchers.
The Determinants of Capital Structure for Firms in Construction and Materials Sector of Malaysia
Page 20 of 117
CHAPTER 2: LITERATURE REVIEW
2.0 Introduction
This chapter presents the literature review in which the previous researchers on the
similar topic are being analyzed, reviewed and consistent with the research objectives.
It focuses on the theoretical framework and research methodology with the research
approach, hypothesis development as well as the use of the types of statistical method.
2.1 Theoretical Model
2.1.1 Modigliani and Miller (MM) Theory
Modern capital structure theory was first created by Professor Franco
Modigliani and Merton Miller (MM) in 1958 (Besley and Brigham,
2012).Modigliani and Miller (1958) produced two propositions based on the
assumptions of a perfect capital market which are without existences of
transaction costs, taxes, bankruptcy costs, information asymmetry and others.
The first MM proposition stated that the choice between debt and equity to
finance a given level of investment does not affect the value of a firm,
implying that there is no optimal leverage ratio. The second MM proposition
showed that firm‟s leverage has no effect on its weighted average cost of
capital.

The Determinants of Capital Structure for Firms in Construction and Materials Sector of Malaysia
Page 21 of 117
2.1.2 Static Trade-off Theory
The MM perfect market assumptions are impractical in real world. Modigliani
and Miller (1963) later extended the basic theory by relaxing the assumptions
and considering the tax deductibility of interest in their research (Besley and
Brigham, 2012).
The static trade-off theory is the idea of the optimal target debt-equity ratio a
company will use in financing through balancing the costs and benefits of
issuing debt (Salami and Mohammed, 2011). In other words, the optimal
target debt ratio can be achieved when the marginal value of the benefits
associated with debt issues exactly compensate the increase in the present
value of the costs related with issuing more debt (Myers, 2001).Modigliani
and Miller (1963) found that the market value of firm increases continuously
as more debt is used due to tax deductibility of interest on debt.
Furthermore, due to the distinctions in firm specific characteristics, target
leverage ratios will be different from firm to firm. Besides institutional
differences such as different financial systems, tax rate, bankruptcy law and
others will also lead the target ratio to differ across countries (Niu, 2008). For
instance, according to the trade-off theory, firms with high profitability level
often have high level of income of tax shield (Marimuthu, 2009). The trade-
off theory also predicts that safe firms with high level of tangibility assets
should have high debt ratios (Kazemi and Ansari, 2012).
A brief discussion of the costs and benefits of debt that derive the optimal
capital structure will be discussed at below.

The Determinants of Capital Structure for Firms in Construction and Materials Sector of Malaysia
Page 22 of 117
2.1.2.1 Benefits of debt
Tax deductibility of debt
The main benefit of debt is tax deductibility of interest
(Marimuthu, 2009). The corporate profit tax allows for the
deduction of interest payments in computing taxable income
(Modigliani and Miller, 1963). Consequently, a debt financing
decrease a firm‟s expected tax liability and increases its after-
tax cash flow. Thus, it made profitable firms employ higher
level of debt in order to increase the value of their debt tax
shield (Rasiah and Peong 2011).
Moreover, the effect of interest tax shield depends on the
nature of the tax system implemented by each country.
According to Ashton (1989) and Adedeji (1998), the tax
system in United Kingdom discourages firms to use debt as
much the classical tax system does in United States. The tax
system of United States allows firms to sustain a loss for the
year to carry back or carry forward such losses. Therefore,
firms in United States are expected to rely more heavily on
debt to finance their investments.
Moreover, the determination of the optimal level of debt would
be affected by the existence of other non-debt tax shields such
as depreciations, depletion, amortization and investment tax
credits (Rasiah and Peong, 2011). DeAngelo and Masulis
(1980) pointed out that firms with tax deductions for
depreciation and investment tax credits can consider these
deductions as a substitution for the tax shield. They concluded
that the positive tax shield substitute suggests that the expected
The Determinants of Capital Structure for Firms in Construction and Materials Sector of Malaysia
Page 23 of 117
marginal corporate tax advantage reduced as leverage is added
to the capital structure. Thus, it implies a negative relationship
between debt and non-debt tax shields as marginal tax savings
from an additional unit of debt decreases with an increasing in
non-debt tax shields.
Reduction of free cash flow agency costs
Another benefit of debt is that it alleviates conflict between
shareholders and managers (Haris and Raviv, 1991). The
conflict between shareholders and managers arise due to the
separation between ownership and control as managers do not
capture 100% gain from their profit enhancement activities
(Jensen and Meckling, 1976). Thus, managers may have the
incentive to maximize their wealth at the expense of
shareholders (Rasiah and Peong, 2011) or misuse free cash
flows on perks and bad investments (Ali, 2011). Debt financing
keeps managers alert and cautious to generate sufficient cash
flows to cover debt obligations thus avoid the managers to
spend based on their own interest. (Ross et al., 2008).
Nevertheless, Jensen (1988) pointed that agency costs will
significantly increase when managers have free cash under
control. Free cash flow is an excess in discretionary cash flow
that available to managers to finance all positive net present
value investment projects. If there is any cash available after all
wealth enhancing investments are made, managers may use the
funds to increase their own wealth rather than distributing the
cash to the shareholders (Mann and Sicherman, 1991). Jensen
(1988) added that managers may have the incentives to hoard

The Determinants of Capital Structure for Firms in Construction and Materials Sector of Malaysia
Page 24 of 117
and misuse free cash flow. On the other hand, conflicts
between shareholders and managers can be resolved through
explicit and implicit remuneration contracts (Zenovia and Anca,
2009). Study of Ang and Cox (1997) also proposed corporate
control mechanisms like bonding mechanisms and monitoring
mechanisms in order to reduce agency conflicts.
2.1.2.2 Costs of debt
Costs of financial distress
Myers (1984) argued that there are costs of issuing debt like
cost of bankruptcy or financial embarrassment (Myers, 1984).
According to Kraus and Litzenberger (1973), debt decreases
the firm's corporate income tax liability and increases its after-
tax operating income. However, a corporate bond is a legal
obligation to pay a fixed amount to investors. If the firm cannot
meet its debt obligation, it is forced into bankruptcy. It is
aligned to the perspective of Nunes and Serrasqueiro (2007)
and Kouki and Said (2012), they also agreed that debt provides
tax shield but increase bankruptcy risk as level of debt rises.
In addition, Warner (1977) and Barclay and Smith (1995)
stated that financial distress consists of both direct and indirect
costs. The direct costs of financial distress are incurred in
bankruptcy and reorganization which included the legal and
administrative costs of liquidation, the costs of selling assets
and the costs of shutting down operations. With respect to the
indirect costs of financial distress, they arise from the
reluctance to do business with a firm that maybe financially
The Determinants of Capital Structure for Firms in Construction and Materials Sector of Malaysia
Page 25 of 117
distressed such as costs of losing or retaining customers and
employees (Brealey and Myers, 2002). Furthermore, another
indirect costs incurred is the distress cost of losing suppliers
when suppliers refused to provide raw materials or services to
firms who suffer bankruptcy as they afraid firms might not be
able to pay them (Rasiah and Peong, 2011).
Agency costs of debt
Even though the application of debt can reduce the agency
costs between managers and shareholders, yet as the amount of
debt increase, it will bring out another cost of debt which is
agency costs between shareholders and bondholders (Jensen
and Meckling, 1976).
According to Rocca et al. (2008), overinvestment in risky
projects or known as assets substitution produces a conflict of
interest between shareholders and bondholders. When a firm
has high debt relative to equity, managers of the firm may have
the incentives to invest in risky projects. Any risk increases
causing a reduction in debt value for bondholders is
accompanied by an equivalent increase in anticipated income
of the shareholders. Shareholders may even prefer the risky
investment with a negative net present value compared to safer
investment with total positive income. (Zenovia and Anca,
2009). According to Harris and Raviv (1991), the incentives
for shareholders engaged in risky investment is due to debt
contracts provides the fact that shareholders have limited
liability that gives them greater value by invest in high risky
projects and the large potential of capturing profits from these
projects at the expense of larger potential losses that will be
The Determinants of Capital Structure for Firms in Construction and Materials Sector of Malaysia
Page 26 of 117
bear by bond holders. By doing so, it increases share value and
decrease debt value and thus provides a chance to transfer
wealth from bondholders to shareholders (Rasiah and Peong,
2011).
Moreover, Fatma and Chichti (2011) stated that
underinvestment is another problem that aggravates conflicts
between shareholders and bondholders. According to Mayers
and Smith (1987), underinvestment occurs when managers
choose to forego a positive net present value investment, in the
absence of bankruptcy risk. Myers (1977) shows that when
there is risky debt, managers who act in shareholder interest
tend to reject profitable investments that could provide positive
net worth to the firm‟s value. It is due to if managers engage in
positive net present value investments during financial distress,
shareholders will receive less benefits than bondholders as they
only have the rights in the claiming of the value of a firm after
the debt is paid (Rasiah and Peong, 2011).
2.1.3 Pecking Order Theory
Pecking order theory was originated from the study of Myers (1984) and
Myers and Majluf (1984). This theory predicts that there is a preference
ranking on financing sources due to information asymmetry between
managers and investors (Leary and Roberts, 2010). Based on Sen and Oruc
(2008), a firm management has more information than investors caused
investors cannot fully value the value of stock that issued by firm. The
discrepancy of information will lead to under pricing of the firm‟s equity in
the market, thus undervalue the wealth of existing shareholders. Therefore,
manager‟s act on interest of shareholders will prefer internal financing without

The Determinants of Capital Structure for Firms in Construction and Materials Sector of Malaysia
Page 27 of 117
any asymmetric information compared to external financing if they perceive
that stocks of firms are undervalued (Fama and French, 2002). If firms require
external financing to finance real investments with positive net present value,
they will issue the safest security first which starts with debt before equity
financing. As the firms seek more external financing, they will follow the
pecking order of securities which is from safe to risky debt and finally to
equity as a last resort (Myers, 1993). In this theory, it does not possess a target
debt ratio but changes in debt ratio occur when there is imbalance internal
cash flow, net of dividends, and real investment opportunities of firms
(Shyam-Sunder and Myers, 1999).
The pecking order theory can also be explained by the existence of
refinancing transaction costs (Donaldson, 1961). According to Bagley and
Yaari (1996), internal equity is used first because it is free of transaction costs.
When the internal funds are not sufficient, financing decision will be followed
by incremental borrowing characterized by low transaction costs and then
costly refinancing through the stock issuing. It is aligned with Fama and
French (2004)‟s point of view that debt is more preferable for firms that tend
to avoid transaction costs due to stock issuing.
In addition, behavior of pecking order theory would also be affected by
agency costs. This problem is arising from the increasing costs of external
funding and consequently forcing firms toward the usage of internal funds in
order to reduce the agency costs. These costs may force the firms to give up
profitable projects, thus reduce their profitability and value. Therefore, firms
with higher agency costs will have greater tendency to rely on internal funds
rather than external (Rasiah and Peong, 2011).

The Determinants of Capital Structure for Firms in Construction and Materials Sector of Malaysia
Page 28 of 117
2.1.4 Market Timing Theory
According to this theory, the behavior of firm‟s debt is affected by the market
and economic conditions of share prices (Kouki and Said, 2012). Besides,
Marsh (1982) said the choice of the financial instrument to be issued for a
publicly traded company over a given period is influenced by market
conditions and the history of its stock price. Baker and Wurgler (2002) stated
that there are two versions of market timing. The first version assumes that
managers and inventors are rational and adverse selection costs vary across
firms or time. The second version involves irrational investors or managers.
Managers issue equity when they believe the cost of equity is low and
repurchase the equity when the cost equity is high. Inside the study of Baker
and Wurgler (2002), they found that firms in United States are more likely to
decrease their debt through issuing equity when their market values are high
relative to book and past market values. In contrary, when market values are
low relative to book and past market values, firms tend to increase their debt
ratio.
2.1.5 Conclusion of Theoretical Model
Based on pecking order theory, agency costs are mitigated if the firm issues
short-term debt rather than long-term debt (Barnea et al., 1980). Therefore,
firms are encouraged to employ more short-term debt compared to long-term
debt in external financing. It is aligned with data that we obtained which the
total of short-term debts for all firms in construction industry is higher than
total of long-term debts.

The Determinants of Capital Structure for Firms in Construction and Materials Sector of Malaysia
Page 29 of 117
2.2 Empirical Review
2.2.1 Firm Size and Total Debt
Baharuddin et al. (2011) had done a study on debt and equity structure for the
construction companies that listed in the Bursa Malaysia market for the period
2001 to 2007. They found that size is positively significant to total debt.
Therefore, construction firm with a larger size will rely more on debt
financing compared to equity financing. This is consistent with the result of
Sahudin et al. (2011) who concluded that size has a significant and positive
relationship with debt. They suggested that as the firm size increases, the
needs for debt financing will increase. Besides, Antoniou et al. (2008) also
discovered that firm size is positively significant to debt on their study on how
firms in capital market oriented (United States and United Kingdom) and bank
oriented (France, Germany and Japan) determine their capital structure.
Moreover, Rafiq et al. (2008) used data from Pakistan chemical sector and
empirically proved that firm size is positively associated with debt. It is due to
large firms in Pakistan tend to borrow more than small firms because small
firms are fearful of larger debt level. Thus, the larger the firms, the higher the
level of debt. This also gives support to the bankruptcy cost theory on debt
that the fixed direct costs of bankruptcy constitutes a smaller portion of total
value of the firms and thus larger firms do not hesitate to utilize more debt
because of fearful of bankruptcy. The positive related impact of firm size with
debt also supported by Pandey (2001) who examined the determinants of
capital structure of Malaysian firms from year 1984 to 1999. The author
suggested that this positive relationship confirmed with the hypothesis that
larger firm tend to be more diversified and less probability to bankruptcy and
the direct cost of issuing debt or equity is lower, and this result is tally with
the trade-off theory. Wan Ismail (2005) and Mohamed Yunos (2002) also

The Determinants of Capital Structure for Firms in Construction and Materials Sector of Malaysia
Page 30 of 117
found that firm size is positively significant with long- term debt in their
studies.
However, Getzmann et al. (2010) conducted a study to examine the
determinants of capital structures in Asian companies by using data of
fourteen listed Asian stock exchanges for the period 1995 to 2009. They
argued that firm size has a negatively impact on debt based on pecking order
theory, because large firms are monitored more closely by analysts and
therefore the information asymmetry is lowered by disclosure duties. It is
aligned with the result obtained by Suhaila et al. (2008) which is firm size is
negative relationship with debt ratio. They stated that larger firms are less
depending on debt financing compared to smaller firms as they prefer to use
equity financing as major source. On the other hand, Wan Mahmoodet
al.(2011) argued that firm size do not have any significant impact on the
capital structure decision and this is supported by the notion that firms with
larger proportion of their value accounted by growth opportunities take less
debt.
2.2.2 Tangibility and Total Debt
There are many evidences suggested that asset tangibility has a positive
relationship with debt. Baharuddin et al. (2011) pointed that assets tangibility
is positively significant to total debt in construction industry in Malaysia.
When the companies have more assets tangibility, they tend to demand for
more debt to finance the assets increase. This result is inconsistent with the
evidence from Antoniou et al. (2008) and Gaud et al. (2003) who carried out a
research on investigating the determinants of the capital structure for a panel
of 106 Swiss companies that listed in the Swiss Stock Exchange for the period
1991 to 2000. Besides, Getzmann et al. (2010) and Teker et al. (2009) found
that the relationship between tangibility of assets with debt is positive.

The Determinants of Capital Structure for Firms in Construction and Materials Sector of Malaysia
Page 31 of 117
In addition, Jensen and Meckling (1976) pointed out that agency cost between
the creditors and shareholders exists because firm may invest in riskier
projects after borrowing and may transfer the wealth from creditors to
shareholder. Companies having more fixed asset can borrow more by
pledging their fixed asset as collateral and mitigating lenders‟ risk of bearing
such agency cost of debt (Ross et al 2008). Therefore firm with low agency
cost can increase the debt it means trade-off theory predicts positive
relationship between tangibility of assets and debt. Teker et al. (2009) also
predicted a positive impact between tangibility and debt based on agency
model.
According to Myers and Majluf (1984), they stated that issuing debt secured
by property can avoid the costs associated with issuing shares. This suggested
that firms with more collateralised assets will be able to issue more debt at an
attractive rate as debt may be more readily available. This results in a positive
association between leverage and tangibility based on pecking order theory.
However, Pandey (2001) argued that tangibility has a significant negative
relationship with book and market value short-term debt and confirmed with
the maturity matching principle. These results are contradicted with the trade-
off theory which stated tangibility and long-term debt should have a positive
relationship since the fixed assets represent as collateral in debt issues.
Moreover, Pandey (2001) also found that there is a negative relationship
between tangibility and debt which indicated that firms with higher fixed
assets would employ lower financial debt. This is consistent with the point of
view of DeAngelo and Masulis (1980) who also suggested that tangibility is
negative related with debt.

The Determinants of Capital Structure for Firms in Construction and Materials Sector of Malaysia
Page 32 of 117
2.2.3 Profitability and Total Debt
Wan Mahmood et al. (2011) studied on the capital structure determinants of
20 property companies that listed in the Bursa Malaysia‟s property sector and
found that property assets intensity and profitability are significant positive
impact to capital structure decisions. Trade-off theory also predicted that
profitable firms have higher level needs to shield income from the corporate
tax thus should borrow more debt compared to less profitable firms (Niu,
2008). Yet, this result contradicted with the study of Pandey (2001) who
discovered that profitability has a negative significant relationship with all
types of debts.
Nevertheless, Mohamed Yunos (2002) had carried out a study to examine the
determinants of capital structure of property companies on both short-term
and long-term debt in year 2002. He found that the both short-term and long-
term debt are inversely related to profitability. This negative relationship
between profitability and debt is consistent with the study of Rafiq et al.
(2008). Rafiq et al. (2008) stated that profitable firms in the Pakistan chemical
sector utilize more equity and less debt. Wan Ismail (2005) also found that
profitability is negative relationship with debt level. It is due to more
profitable companies will retain the earnings for investment project in pecking
order theory. Besides, Baharuddin et al. (2011) conducted a research in
construction industry which showed that profit drops when firms employ more
debt. Based on the findings of the research of Wan Ismail (2005), he
concluded that profitability, non-debt tax shields and size are significant with
debt especially before and after the financial crisis and they are important in
determining the capital structure decisions. According to Titman and Wessels
(1988), high profitable firms usually employ less debt than less profitable
firms due to the reason of high profitable firms are often used their earnings to
pay down the debt.

The Determinants of Capital Structure for Firms in Construction and Materials Sector of Malaysia
Page 33 of 117
On top of that, Getzmann et al. (2010) found that the pecking order theory
cannot be rejected due to its correct prediction of the signs of profitability and
market expectations. According to pecking order theory, profitable firms
finance internally and resulted lower debt level. Getzmann et al. (2010) also
added that debt level of profitable firms is higher because of a lower
bankruptcy probability according to trade-off theory. This is consistent with
the point of view of Gaud et al. (2003) who also suggested that profitability is
negatively related to debt level.
2.2.4 Non-debt Tax Shield and Total Debt
Getzmann et al. (2010) proposed that non-debt tax shield and debt are
positively related in trade off theory. This result is consistent with findings of
Wan Ismail (2005). According to Wan Ismail (2005), non-debt tax shield has
a significant positively impact with the debt level. This indicated that the
higher the level of debt, the more a company can get the tax shields. However,
Mohamed Yunos (2002) suggested that tax rate is inversely related to short-
term debt. In addition, DeAngelo and Masulis (1980) presented a model of
optimal capital structure that included the impact of corporate taxes, personal
taxes, and non-debt related corporate tax shields. They argued that tax
deductions for depreciation and the investment tax credits are substitutes for
the tax benefits of debt financing. Therefore, firms with larger non-debt tax
shield relative to their expected cash flow used less debt in their capital
structures. Moreover, Afza and Hussain (2011) found that the non-debt tax
shield is insignificant negative related with debt which showed that the firms
with high depreciation expenses prefer equity financing than debt, because
depreciation provides tax shield to the firms.
The evidence from the Pakistan chemical sector by Rafiq et al. (2008) showed
that non-debt tax shield is found to be positively related to debt. But according
The Determinants of Capital Structure for Firms in Construction and Materials Sector of Malaysia
Page 34 of 117
to Rafiq et al. (2008), this positive relationship is not supported by theory
which suggested that non-debt tax shield like depreciation will reduce the
need for debt in order to prevent net income from going to a higher level of
tax bracket, thus non-debt tax shield should be negatively related to debt.
While Rafiq et al. (2008) explained that the most appropriate reason for this
positive relationship can be given from the relevance of non-debt tax shield to
capital structure in Pakistan economy. The corporate tax rate in Pakistan is not
varying with the level of income. There are three types of rate which are the
first one is applicable to public limited firms, second is to commercial
organizations in government ownership and the third is to financial sector
organizations. Therefore, the firms in a given group faced a constant rate of
taxation, thus the depreciation do not work as a substitute to debt to prevent
net income from going into I higher level of tax bracket.
2.2.5 Growth Opportunity and Total Debt
Growth opportunity is found that has a positively relationship with debt in
construction industry. This is aligned with the perspective of Baharuddin et al.
(2011) who claimed that constructions firms in Malaysia are depending
heavily on the debt financing for the growth and expansion. According to
pecking order theory, firms with higher growth opportunity are more likely to
raise new funds than the firms that less growth possibilities (Degryse et al.,
2009). This result is conformity consistent with Pandey (2001) who pointed
that Malaysian firms seem to employ more on short-term debt to financing the
growth. This finding supported both the trade-off and pecking order theory.
On the other hand, Sahudin et al. (2011) who examined whether firms size,
growth opportunity, and firm reputation affect the debt level of the
construction sector in Malaysia for the period 2001 until 2008. From the
pooled regression results, it showed that growth opportunity has a significant
negative correlation with debt. This concluded that construction firms rely
The Determinants of Capital Structure for Firms in Construction and Materials Sector of Malaysia
Page 35 of 117
more on its market value in the form of share price appreciation that is equity
financing, over debt financing for their future expansion. Therefore, less debt
is used as for firms in expansion.
Mohamed Yunos (2002) suggested that growth rate is positively related with
long-term debt in property industry in Malaysia. This positive relationship is
consistent with the evidence from Pakistan listed manufacturing corporate
firms on Karachi Stock Exchange for 15 years by Awan et al. (2010). This
positive relationship is highly significant for the firms with low and medium
growth opportunity. The reason behind might be that the firms view the
available growth opportunity as unsustainable and risky, so intend to pass the
risk to the creditors. Moreover, unsustainable growth opportunity, less
developed capital markets, a large number of low growth firms in Pakistan
and their limited goodwill among investors and public may also be the reason
of positive related with debt.
This result also same with Rafiq et al. (2008) who confirmed that growing
firms in Pakistan chemical industry utilized more debt than equity to finance
the new projects. One possible reason might that in order to grow in chemical
industry, larger cash flow are required which is that a growing firms may not
able to meet the internal financing sources, thus have to rely on debt. However,
Gaud et al. (2003) found that growth is negatively relationship with debt level
in Swiss firms, while this result is consistent with Antoniou et al. (2008) result
on the both capital market oriented and bank oriented economies. According
to trade-off theory, growth is inversely related to debt due to the reason of
equity holders will earn less profit from a profitable investment if the interest
payment is high, thus managers may neglect many valuable investment
(Degryse et al., 2009). Goyal et al. (2002) finding is consistent with trade-off
theory which suggested that growth opportunity of firms declines when firms
increase debt financing, due to shareholders who control investment decisions
will bear the whole cost of the projects, but the return is shared with debt

The Determinants of Capital Structure for Firms in Construction and Materials Sector of Malaysia
Page 36 of 117
holders, this mean that they only receive a portion of the increase in value of
the firms. Therefore, firms will prefer equity over debt to finance the future
investment. Besides, high growth firms are being characterized by relatively
more intangible assets compared to low growth firms, so it becomes difficult
for the debt holders to identify any increase in the risk of high growth firms,
therefore, growth is negatively related to debt.
On the other sides, Wan Ismail (2005) argued that growth opportunity and
assets structure have not any significant impact on debt. This might be
because Malaysian firms have more tangible assets than intangible assets.
Wan Mahmood et al. (2011) also argued that growth rate do not suggest any
significant impact on the capital structure decision and this is support by the
notion that firms with larger proportion of their value accounted by growth
opportunities take less debt. Moreover, Suhaila et al. (2008) also suggested
that growth is found that insignificant negatively related with debt. These
results are inconsistent with Baharuddin et al. (2011) and Mohamed Yunos
(2002) results which suggested that growth have a positive relationship in
Malaysian firms.
2.2 .6 Liquidity and Total Debt
Sibilkov (2009) examined the alternatives theories on the effect of asset
liquidity on capital structure that using data from a broad sample of United
States publish firms. Sibilkov (2009) found that asset liquidity is positively
correlation with debt. This positive effect relies on the factor that less liquid
assets sell at higher costs, therefore increase the costs of liquidation,
bankruptcy and debt. The positive relationship between liquidity and debt is
supported by trade-off theory (Janbaz, 2010). Whereas lower asset liquidity
will reduce the probability of costly default by lower down the level of debt.
However, the model also predicts a non-positive impact that argues lower

The Determinants of Capital Structure for Firms in Construction and Materials Sector of Malaysia
Page 37 of 117
asset liquidity more costly for managers to seize value from bondholder.
Therefore, lower asset liquidity decrease the cost of debt and firms will
employ more debt.
Further analysis also reveals that the relation between asset liquidity and
secured debt is positive related. When managers have no discretion over the
disposition of firm assets, liquidity will has a positive impact on debt.
However, the relation between asset liquidity and unsecured debt is
curvilinear. This finding is consistent with Myers and Rajan (1998), who
argude that when managers have the discretion and transformation risk exists,
the relationship between asset liquidity and debt is curvilinear. That means
that asset liquidity has positive related to debt when liquidity is low, but has a
negative impact when liquidity is high. This result is consistent with the view
of Williamson (1988), and Shleifer and Vishny (1992), they pointed that asset
liquidity can increase optimal debt level. The cost of illiquidity and inefficient
liquidation are economically significant and substantial compared with the
benefits of debt. Therefore, managers try to control these costs by adjusting
the debt level and the probability of suffering liquidation costs. Myers and
Rajan (1998) discovered that the impact of asset liquidity on debt depends on
manager‟s decisions to disposition the assets. Asset liquidity has a positively
impact on debt when managers cannot dispose the assets, while it will has a
curvilinear effect on debt when managers managed to dispose the assets.
However, Suhaila et al. (2008) proposed that liquidity had shown that have
negative relationship with debt. Firms that has higher liquidity tend to employ
less debt, and able to generate high cash turnover to finance their operations
and investment activities. Liquidity is predicted inversely related with debt in
pecking order theory (Niu, 2008). Firms prefer internal financing compared to
external financing. Thus, firms will generate liquid reserves from retained
earnings. Therefore, firms will not need to raise external funds if the liquid
assets are sufficient to finance their projects. Afza and Hussain (2011) and

The Determinants of Capital Structure for Firms in Construction and Materials Sector of Malaysia
Page 38 of 117
Najjar and Petrov (2011) also suggested that liquidity is inversely related with
debt which shows that more liquid firms prefer internal financing than
external financing which consistent with pecking order theory. Moreover,
Singhania and Seth (2010) also found the liquidity is inversely related to debt
due to the reason high level of firms liquidity tend to employ less debt. It is
because of higher liquidity firms maintain a higher amount of current assets
which indicated they maintain higher level of cash flow and higher ability to
generate high cash flow.
2.3 Theoretical Framework
Figure 2.1: The Determinants of Capital Structures
Source: Developed for the research
Dependent Variables
Independent Variables
Firm Size (SIZE)
Tangibility (TAN)
Profitability (PRO)
Non-debt Tax Shield (NDTS)
Growth Opportunity (GRO)
Liquidity (LIQ)
Short-term Debt (SDEBT)
Long-term Debt (LDEBT)
Total Debt (TDEBT)

The Determinants of Capital Structure for Firms in Construction and Materials Sector of Malaysia
Page 39 of 117
2.4 Hypothesis Development
1. Capital Structure Determinants and Short-term debt
2. Capital Structure Determinants and Long-term debt
3. Capital Structure Determinants and Total Debt
H0 = There is no relationship between capital structure determinants and debt of
constructions and materials sector in Malaysia
2.4.1 Firm Size and Debt
H1a, 2a, 3a = There is a positive relationship between firm size and short-term,
long-term and total debt.
Pandey (2001), Mohamed Yunos (2002), Gaud et al. (2003), Wan Ismail
(2005), Antoniou et al. (2008), Rafiq et al. (2008), Degryse et al. (2009),
Getzmann et al. (2010), Sahudin et al. (2011), and Baharuddin et al. (2011)
found that firm size have positive significant impact on debt.
Yet Suhaila et al. (2008) argued that firm size is negative relationship with
debt. The larger the firms is less depending on debt financing compared to
smaller firms, due to larger firms used more equity financing as major source.
While Wan Mahmood et al. (2011) argued that the firm size does not suggest
any significant impact on debt in the property sector.
Therefore, we expect that there is a positive relationship between firm size
and debt level. The larger the firm size, the higher the debt level of the firms.

The Determinants of Capital Structure for Firms in Construction and Materials Sector of Malaysia
Page 40 of 117
2.4.1.1 Tangibility and Debt
H1b, 2b, 3b = There is a positive relationship between tangibility and
short-term, long-term and total debt
Gaud et al. (2003), Antoniou et al. (2008), Niu (2008), and Baharuddin
et al. (2011), they found evidence that tangibility is positive impact
with the debt level. Moreover, Teker et al. (2009) and Getzmann et al.
(2010) also suggested that tangibility is positive relationship with debt
level in the trade-off theory.
However, DeAngelo and Masulis (1980) and Pandey (2001) concluded
that tangibility has a negative relationship with debt and stated that
firms which with higher fixed assets would employ lower financial
debt in the traditional view.
Therefore, we expect a positive relationship between tangibility with
the debt level of the firms. The higher level of assets tangibility, the
more debt needed to finance the assets.
2.4.2 Profitability and Debt
H1c, 2c, 3c = There is a negative relationship between profitability and short-
term, long-term and total debt.
Niu (2008) and Wan Mahmood et al. (2011) suggested that profitability is
positive relationship with debt.
Yet Titman and Wessels (1988), Pandey (2001), Mohamed Yunos (2002),
Gaud et al. (2003), Wan Ismail (2005), Rafiq et al. (2008), Getzmann et al.

The Determinants of Capital Structure for Firms in Construction and Materials Sector of Malaysia
Page 41 of 117
(2010) and Baharuddin et al. (2011) suggested that profitability has negative
impact to the debt which can be explained by pecking theory where profitable
firms will finance internally.
Therefore, we expect a negative relationship between profitability and debt.
The higher level of profit of a firm, the lesser the firm to rely on debt.
2.4.2 Non-debt Tax Shield and Debt
H1d, 2d, 3d = There is a negative relationship between non-debt tax shield and
short-term, long-term and total debt.
Wan Ismail (2005) and Getzmann et al. (2010) found that the non-debt tax
shield is positive relationship with debt. This shown that higher debt level will
lead to higher non-debt tax shield.
However, DeAngelo and Masulis (1980), Mohamed Yunos (2002) and Afza
and Hussain (2011) argued that non-debt tax shield is negatively related with
debt. They argued that tax deductions for depreciation and the investment tax
credits are substitutes for the tax benefits of debt financing. Therefore, firms
with larger non-debt tax shield relative to their expected cash flow include less
debt in their capital structures.
Therefore, we expect a negative relationship between non-debt tax shield and
debt level of firms.

The Determinants of Capital Structure for Firms in Construction and Materials Sector of Malaysia
Page 42 of 117
2.4.3 Growth Opportunity and Debt
H1e, 2e, 3e = There is a positive relationship between growth opportunity and
short-term, long-term and total debt.
Pandey (2001), Mohamed Yunos (2002), Rafiq et al. (2008), Awan et al.
(2010) and Baharuddin et al. (2011) found that growth opportunity is positive
relationship with long-term debt level.
Whereas Goyal et al. (2002), Gaud et al. (2003), Antoniou et al. (2008) and
Sahudin et al. (2011) suggested that growth opportunity of the firms have a
negative relationship with debt. Nevertheless, Wan Ismail (2005) and Wan
Mahmood et al. (2011) argued that growth opportunity does not give any
significant impact to the debt level.
Therefore, we expect a positive relationship between growth opportunities
with debt level. The more opportunity a firm to grow, the more debt needed to
finance the activities.
2.4.4 Liquidity and Debt
H1f, 2f, 3f = There is a negative relationship between liquidity and short-term,
long-term and total debt.
Sibilkov (2009) suggested that liquidity has a positive impact on debt due to
the factor of that less liquid assets sell at higher costs, therefore increase the
costs of liquidation, bankruptcy and debt.
Whereas Suhaila et al. (2008), Singhania and Seth (2010), Afza and Hussain
(2011) and Najjar and Petrov (2011) found that liquidity have negative

The Determinants of Capital Structure for Firms in Construction and Materials Sector of Malaysia
Page 43 of 117
relationship with debt. Firms with a higher liquidity tend to employ less debt
and they are able to generate high cash turnover to finance their operations
and investment activities.
Therefore, we expect a negative relationship between liquidity and debt level.
The more liquidity of the firms the less debt used to financing.
4. Differences of Preference of Financing Practices Adopted by Constructions
and Materials Sector
H0 = There is no different between preference of financing practices adopted by
construction and materials sector.
H3 = There is a different between preference of financing practices adopted by
construction and materials sector.
2.5 Conclusion
Overall, this chapter has covered the relevant theoretical model and other related
literature review on the debt and the six determinants of capital structure (firm size,
tangibility, profitability, non-debt tax shield, growth and liquidity). At the same time,
the proposed theoretical framework was formed by the relationship of dependent
variables and independent variables. In particular, this study is to find out the
relationship of the six determinants of capital structure and debt. The related
hypotheses were stated and will be tested in Chapter 3 and Chapter 4 respectively.

The Determinants of Capital Structure for Firms in Construction and Materials Sector of Malaysia
Page 44 of 117
CHAPTER 3: METHODOLOGY
3.0 Introduction
Research methodology is a vital part to ensure our research is conducted in a proper
manner. According to Zikmund (2003), research methodology is defined as a
discussion of body content that explains the research designs, sampling procedures,
operational definitions of constructs, measurement scales, and methods of data
analysis. In this chapter, we will further discuss on the research design, data
collection method, sampling design, data processing and lastly formation of model
equation of our research.
3.1 Research Design
Research design is a master plan that specifies the methods and procedures for
collecting and analyzing the needed information. Besides, it is also a framework for
the research plan of action. Basically, determination of research methods and
procedures depends on the objectives of the study, the available data sources and the
urgency of the decision and the cost of obtaining the data.
In this research, we used quantitative approach which analyzes results in
mathematical way. Quantitative approach provides precise measurement and more
convincing interpretation associated with the result derived from the companies‟
financial ratio. Moreover, the process of conducting quantitative research is relatively
easy if compared to qualitative research and it can provide an exact approach to
measurement.
The Determinants of Capital Structure for Firms in Construction and Materials Sector of Malaysia
Page 45 of 117
The purpose of our research is to examine the determinants of capital structure in
construction and materials sector in Malaysia. As such, the unit of analysis is the
firms in construction and materials sector of Malaysia and Bursa Malaysia is our area
of research. Firms in our sample were selected based on the list of firms in
construction and materials sector from a data storage known as “DATA STREAM”.
Our research period is 5 years which is from year 2005 to 2009. In addition, we
extracted data such as net sales or revenue, property plant and equipment, total asset,
operating income, total depreciation, current asset, current liabilities, long-term debt,
short-term debt and total Debt from company annual financial statement which
consists of balance sheet, profit and loss and company account data in Data Stream
accordingly.
Originally, the total firms in construction and materials sector obtained from Data
Stream are 106. However, we only included 92 firms in our research after removed
firms that do not have sufficient 5 years financial data.
3.2 Data Collection Method
We adopted secondary data collection method instead of primary data collection
method in this research. According to Zikmund (2003), secondary data are those
historical data which is previously collected and gathered to conduct some projects. It
is easier, faster and inexpensive compared to primary data. By using secondary data,
the researcher can provide a good starting point in defining the problem and stating
the research objective. Besides, secondary data serves as a guideline for researchers to
identify variables easily. The secondary data can be obtained through existing
quantitative data, journals, articles, periodicals, books and others. We extracted the
quantitative data from data storage software named as “DATASTREAM”. While the
journals, articles and periodicals are obtained from internet sources such as
university‟s external database like JSTOR, ProQuest and others. We also gathered
some related information from books in the university library.

The Determinants of Capital Structure for Firms in Construction and Materials Sector of Malaysia
Page 46 of 117
3.3 Sampling Design
Sampling refers to any procedures of research engaged in to draw conclusion based
on measurements of a portion of the population or sample (Zikmund et al., 2010).
Sampling is also defined as a process where a sample is selected from a population. It
involves a set of process including define the target population, determine the
sampling location, decide the sampling elements, select the sampling technique,
determine the sample size and execution of the entire sampling process.
Target population is the whole group of individuals to which we are interested in
applying our conclusions (Kazerooni, 2001). In our research, the target population is
all construction and materials firms that are listed in Bursa Malaysia. We obtained
data like net sales or revenue, property plant and equipment, total assets, operating
income, total depreciation, current assets, current liabilities, long-Term debt, short-
Term debt and total debt from Data Stream in order to examine the determinants of
capital structure for firms in construction and materials sector for the period 2005 to
2009. Initially, the population of this study consists of 106 firms from construction
and materials sector. However, some of the firms that lack of 5 years financial data
are disqualified. Therefore, we only included the remaining 92 firms in our research.
3.4 Data Processing
3.4.1 Dependent variables
Capital structure has been defined in different leverage measurements in
previous studies. Suhaila et al., 2008 stated that firms in United States
commonly use long term debt ratio as the measurement of capital structure.
However in developing countries such as Malaysia, firms apply both
measurements of short-term and long-term debt in determining capital

The Determinants of Capital Structure for Firms in Construction and Materials Sector of Malaysia
Page 47 of 117
structure (Suhaila et al., 2008). Besides, Bevan and Danbolt (2002) pointed
that firms in United Kingdom also apply both short-term debt and long-term
debt measurements. In fact various capital structure theories have not
specified which leverage measurement should be used, but it depends on the
objective of the study (Ragan and Zingales, 1995). We use three
measurements as indicators for the capital structure which are short-term debt,
long-term debt and total debt ratio in order to get accurate and precise results.
The short-term debt ratio is short-term debt divided by total assets (Abdullah,
2011; Doan & Nguyen 2011). The long-term debt ratio is long-term debt
divided by total assets(Abdullah, 2011; Doan & Nguyen, 2011). The total debt
ratio is total debt divided by total assets (Abdullah, 2011; Doan & Nguyen
2011; Suhaila et al., 2008).
3.4.2 Independent variables
Firm Size (SIZE):Titman and Wessels (1988) and Rajan and Zingales (1995),
Friend and Lang (1988) and Crutchley and Robert (1989) confirmed that there
is a positive relationship between the firm size and the leverage. Titman and
Wessels (1988) argued that the larger companies are more diversified and
have lower variance of their earnings. Thus it makes them able to tolerate high
debt ratios. Besides, Feri and Jones (1979) suggested that firm size has a

The Determinants of Capital Structure for Firms in Construction and Materials Sector of Malaysia
Page 48 of 117
significant impact on leverage even though the sectorial decisions have been
observed to vary among industries. The measurement of size used in this
paper is the natural logarithm of net sales similar to the approach of Drobetz
and Fix (2003).
Tangibility (TAN): Tangible assets are considered as collateral for the debt at
the event of bankruptcy, they have higher value than the intangible assets
(Jensen and Meckling, 1976; Myers, 1977; Abor, 2008). By pledging the
firm‟s tangibles assets as collateral, the cost associated with adverse selection
and moral hazard are reduced. The tangibility is derived as the ratio of fixed
assets to total assets based on Teker et al. (2009) and Harris and Raviv (1995).
Where:
Fixed Assets = Property Plant and Equipment
Profitability (PRO): The previous literatures provided conflicting evidences
on the relationship between the company‟s profitability and the firm‟s capital
structure. According to Myers and Majluf (1984) and Fama and French (2002),
firms have a pecking order in the choice of their financing activities. The
relationship between the leverage and the profitably is negative since internal
funds are more preferable than debt. However, Peterson and Raghuram (1994)
argued that more profitable firms have higher ability in tolerating high level of
debt since they are in a good position to meet their financial obligations easily.
Besides, Song (2005) suggested that profitability plays an important role in

The Determinants of Capital Structure for Firms in Construction and Materials Sector of Malaysia
Page 49 of 117
leverage decisions and they use measurement of the ratio of operating income
to total assets in order to test the effect of profitability on leverage.
Non-debt Tax Shield (NDTS): According to Teker et al. (2009), although
interest is tax deductible due to default risk, firms may tend to use other tax
shields such as depreciation on tangibles and intangibles. Moreover DeAngelo
and Masulis, (1980) stated that tax deduction for depreciation and investment
tax credits are substitutes for the tax benefits of debt financing. As a result,
firms with large non-debt tax shield include less debt in their capital structure.
In this study we use the ratio of total depreciation to total assets as the
measurement of non-debt tax shield opportunities (Teker et al., 2009; Bauer,
2004).
Growth Opportunity (GRO): Another important variable is growth opportunity.
In growing firm, agency costs related to the debt holder and shareholder
conflict is expected to increase, as they have more choices on future
investments. Song (2005) found that there is a positive relationship between
growth opportunity and debt which is inconsistent with Titman and Wessels
(1988) and Rajan and Zingales (1995) There is three measurements of growth
opportunity in the study of Titman and Wessels (1988) which are capital
expenditures over total assets, growth of total assets measured by the
percentage change in total assets and research and development over sales.

The Determinants of Capital Structure for Firms in Construction and Materials Sector of Malaysia
Page 50 of 117
Due to constraint of data, we choose percentage change in total assets (GTA)
as the measurement of growth opportunity.
Liquidity (LIQ): Liquid assets act as a cushion that allows the firm to survive
in low earning period when the firm is unable to access capital market.
Anderson (2002) found an evidence of a positive relation between leverage
and liquid asset holding. Yet, Morellec (2001) and Myers and Rajan (1998)
argued that the lower asset liquidity more costly to managers to seize value for
bondholder, thus the firm will use more debt. In this research we use current
asset divided by current liabilities as the measurement of liquidity (Ibrahim
&Masron, 2011).
3.4.3 Model Equation
Equation 1:
Equation 2:

The Determinants of Capital Structure for Firms in Construction and Materials Sector of Malaysia
Page 51 of 117
Equation 3:
Where:
SDEBT = Short-term debt
LDEBT = Long-term debt
TDEBT = Total Debt
SIZE = Firm Size
TAN = Tangibility
PRO = Profitability
NDTS = Non-debt Tax Shield
GRO = Growth Opportunity
LIQ = Liquidity
3.5 Data Analysis
3.5.1 Descriptive Analysis
In this research, we will use descriptive statistics to describe and compare
variables numerically (Saunders et al., 2009). Descriptive analysis is
recommended to use in this research because it is much easier to work with,
interpret, and discuss than raw material. Besides, it includes useful techniques
for summarizing and presenting data in visual form in better understanding
manner. Moreover, it is important for the development of the statistical
inference. The descriptive measurements included in this research are mean,
median, maximum, minimum and standard deviation.

The Determinants of Capital Structure for Firms in Construction and Materials Sector of Malaysia
Page 52 of 117
3.5.2 Inferential Analysis
Correlation analysis will be used to measure the strength of linear relationship
between two variables (Saunders et al., 2009). When there is +1 coefficient, it
represents a perfect positive correlation which indicates the two variables are
precisely related as one variables value increase, another variables increase as
well. When there is -1 coefficient, it represents a perfect negative correlation
which means the two variables are precisely related as one variables value
decrease, another variable will also decrease.
Moreover, we also conduct regression analysis by using the method of
Ordinary Least Square (OLS). Three levels of significance were considered in
this research: 1%, 5%, and 10%. Regression analysis can help us to have a
better understanding on the relationship between dependent variables and one
or more independent variables. In a more precise way, regression analysis
helps one to understand how the typical value of the dependent variables vary
when any one of the independent variables changes, while the other
independent variables held fixed. The technique involves the process of
developing the mathematical equation that describes the relationship between
dependent variables (Y) and one or more independent variables (X1 to Xk).
The data set for this research contained balanced panel data which is also
called as longitudinal data. Panel data are repeated measures of one or more
variables on one or more persons (Brϋderl, 2005). It is a single dimension of
cross-sectional data on N units (Individual, Firms, Countries, etc.) and time-
series data on T (Time periods). We found that there are several authors study
the capital structure on panel data analysis such as Teker et al. (2009), Vries
(2010) and Sayιlgan et al. (2006), thus it can be easier for us to refer as a
guideline in our research.

The Determinants of Capital Structure for Firms in Construction and Materials Sector of Malaysia
Page 53 of 117
We choose panel data because it can include variables at different level of
analysis. Besides, it is more informative in the sense of more variability, less
collinearity, more degrees of freedom, thus estimation are more precise and
efficient even though there is a huge data set. It also allows us to control for
unobserved heterogeneity (Brϋderl, 2005). The data set for this study are six
independent variables to be observed over 5 years for 92 firms in construction
and materials sector.
Table 3.1: Sample Panel Data
Company Years Y X1 X2 X3
1 2008 6.0 6.0 2.0 3.0
1 2009 4.0 3.0 3.0 9.0
2 2008 5.0 4.0 6.0 8.0
2 2009 3.0 5.0 8.0 7.0
Source: Developed for the research
3.6 Conclusion
Lastly, chapter three concludes that the research is based on final samples of 92
companies in construction and materials sector. There are three research models
which is derived from three dependent variables and six independent variables. There
are three measurements for dependent variables (short-term debt, long-term debt and
total debt) and six measurements for six independent variables (firm size, tangibility,
profitability, non-debt tax shield, growth opportunity and liquidity). The numerical
data set are arranged in balanced panel form and regression analysis (OLS) is being
carried out to examine the interrelationship between the variables.

The Determinants of Capital Structure for Firms in Construction and Materials Sector of Malaysia
Page 54 of 117
Table 3.2: The Measurement of Variables
Dependent Variables Measurement of Variables
Short-term debt Ratio (SDEBT)
Long-term debt Ratio (LDEBT)
Total Debt Ratio (TDEBT)
Independent Variables Measurement of Variables
Firm Size (SIZE)
Tangibility (TAN)
Profitability (PRO)
Non-debt Tax Shield (NDTS)
Growth Opportunity (GRO)
Liquidity (LIQ)
Source: Developed for the research

The Determinants of Capital Structure for Firms in Construction and Materials Sector of Malaysia
Page 55 of 117
CHAPTER 4: DATA ANALYSIS
4.0 Introduction
This chapter comprises several analysis including descriptive analysis, inferential
analysis and panel data regression analysis. The results are based on the 92 firms
from construction and materials sector in Malaysia. Eview is the software we used to
run all the analysis testing mentioned above. Descriptive analysis is to present the
mean, median, maximum and minimum value as well as the standard deviation of all
the variables in either tables or graphs form. Besides that, inferential analysis is used
to provide an overall conclusion on the characteristic of the analyzed variables as well
as to examine the relationships between each of them. Panel data regression analysis
is used to test the significance of the independent variables.

The Determinants of Capital Structure for Firms in Construction and Materials Sector of Malaysia
Page 56 of 117
4.1 Descriptive Analysis
Table 4.1: Descriptive Statistic for Construction and Materials Sector
Source: Developed for the research
Table 4.1 provides the descriptive statistics for the dependent and independent
variables used in the study over the period 2005 to 2009. Based on our research, the
average short-term debt ratio for 92 companies from the construction and materials
sector is 14.15 percent which is lower than the range of 45 percent - 50 percent, that
was reported by Hall et al. (2004) using the financial data based on four thousands
SMEs from eight countries: Belgium, Germany, Spain, Ireland, Italy, Netherlands,
Portugal, and UK. According to Örtqvist et al. (2006), they found that the mean for
short-term debt ratio for the 20,688 new ventures registered in Sweden during the
year 2000, was approximately 47 percent.
Based on the comparison between our result and the past researches, it shows that the
firms from construction and materials sector in Malaysia rely on lesser short-term
Variables Mean Median Maximum Minimum Standard
Deviation
SDEBT 0.145157 0.115489 1.812475 0.000000 0.156461
LDEBT 0.095119 0.045358 0.981193 0.000000 0.132494
TDEBT 0.240276 0.230888 1.830516 0.000000 0.199355
SIZE 5.224118 5.207883 6.790207 3.810971 0.534461
TAN 0.326354 0.296044 0.873267 0.008795 0.196633
PRO 0.025132 0.028546 0.229855 -0.343013 0.073477
NDTS 0.023991 0.019801 0.126149 -0.000414 0.019161
GRO 0.147522 0.024350 37.85520 -0.973000 1.790311
LIQ 2.346805 1.642328 16.38900 0.151405 2.194470

The Determinants of Capital Structure for Firms in Construction and Materials Sector of Malaysia
Page 57 of 117
debt financing. This might be due to the analyzed firms more likely to adopt less risky
financing during financial crisis.
Furthermore, our research shows an average long-term debt to total assets is 9.51
percent compared to 13.55 percent, the value reported by Hall et al. (2004). However,
our result is lower compared to the value of 36.3 percent for Multinational Companies
and 36.7 percent for Domestic Companies reported by Akhtar (2005) which were
based on all the 4287 firms listed on the Australian Stock Exchange for each year
from 1992 to 2001. What is more, Örtqvist et al. (2006) discovered the average long-
term debt ratio for the new ventures registered in Sweden is about 17 percent which
indicates that the first year mean for the new ventures in Sweden have 47 percent of
their capital drawn from short-term debt and 17 percent from long-term debt
compared to the average of 14 percent of short-term debt and 9.5 percent of long-term
debt acquired by the 92 companies from construction and materials sector in Malaysia.
A study done by Mazur (2007) on 238 non-financial companies traded on the Warsaw
Stock Exchange in years 2000 – 2004, found that the mean value of total debt to total
assets is 53 percent, compared to our result which shows that the analyzed companies
use merely an average of 24 percent of debt financing, which the latter is
considerably low. Skowronski (2002) reported that the average debt ratio was 33
percent for the years between 1991 and 1997 for the Poland companies. However, the
ratio of total debt to assets in 2004 depicts an increased to 52 percent showing signs
that the corporate attitudes towards debt are changing. This might be due to the better
development of the bond market in Poland. We believe that the reason behind the low
average total debt financing is because of the financial crisis that erupted during the
analyzed period which had significantly lowered the demand for debt financing. On
the other hand, Kezemi and Ansari (2012) found that the listed companies in Tehran
Stock Exchange for the periods of 1999-2004 and 2005-2010, on average, employ
high level of total debt. For the first 6-year period 1999 to 2004, the total debt ratio is
about 70 percent whereas for the second period, the total debt ratio is about 66
percent which indicates a 4 percent decrease.

The Determinants of Capital Structure for Firms in Construction and Materials Sector of Malaysia
Page 58 of 117
In conclusion, we found out that the mean values for the short-term debt and long-
term debt ratios in our study are lower than other researches. There are several factors
that might contribute to this. One of them is the bond market is not as developed as
the countries in Australia, Europe countries and others. Next, it could be due to the
high costs of long-term debt compared to the short-term debt.
Based on the study done by Akhtar and Oliver (2009), the average size for the
Japanese Multinational and Domestic Corporations are 12.95 and 12.10 respectively
which are higher than the value of average size of the analyzed companies, 5.22. The
huge difference between our result and their result might be due to the different
measurement used by them, which is the logarithm of the total market value of assets.
The other study done by Crnigoj and Mramor (2009) which tested on non-financial
firms from year 1999 to 2006 showed an increasing pattern of average size from
5.539 (1999) to 5.703 (2006).
Next, our study shows that the average tangibility for the selected companies is 32.64
percent. The average tangibility for Japanese Multinational and Domestics
Corporations respectively are 30 percent and 35 percent which are both relatively
close to our value (Akhtar and Oliver, 2009). Qiu and La (2010) found that the
average tangibility for all firms in the Australian Stock Exchange All Ordinaries
Index excluding banks, financial institutions and insurance firms which were then
pooled into unlevered and the levered groups are 25.1 percent and 37.2 percent
respectively.
Furthermore, the average profitability of the analyzed companies is 2.5 percent which
is lower than 4.5 percent, the value for levered group but higher than -3.3 percent for
unlevered group since levered firms are generally more profitable than unlevered
firms (Qiu and La, 2010). Hall et al. (2004) also found that the profitability for most
of the SME across European countries ranged between 4 percent and 6 percent. The
slender difference between our result and the study by Hall et al. (2004) could be due

The Determinants of Capital Structure for Firms in Construction and Materials Sector of Malaysia
Page 59 of 117
to the different measurement used which is the ratio of the operating income to sales
turnover.
On top of that, the mean for non-debt tax shield (NDTS) in our research is 2.4 percent
compared to 4 percent and 3 percent for Japanese Multinational and Domestic
Corporations respectively (Akhtar and Oliver, 2009). They also explained that
Multinational Corporations have significantly higher NDTS implying that they are in
better positions to exploit tax regulations. In another research conducted by Akhtar
(2005), indicated that the NDTS for the Australian Multinational Corporations and
Domestic Corporations were 3.6 percent and 2.4 percent respectively. The other
researchers‟ results are slightly higher might be due to the corporations in developed
countries such as Australia and Japanese are better equipped with the knowledge in
exploiting tax regulations.
Next, Crnigoj and Mramor (2009) found that the average growth for the Slovenian
firms is ranged between 35 percent and 50 percent which are significantly higher than
the value of 14.75 percent in our research. According to Akhtar and Oliver (2009),
Multinational Corporations have higher growth opportunities than Domestic
Corporations which means that they have better chances to exploit imperfections in
markets than the latter.
Lastly, on average, the liquidity ratio for the chosen companies from construction and
materials sector is 2.35 times which represents that the RM1 of liabilities will be
covered by RM2.35 of assets. As the value is greater than 1.00, it means most of the
companies in this sector have their liabilities fully covered.

The Determinants of Capital Structure for Firms in Construction and Materials Sector of Malaysia
Page 60 of 117
4.2 Inferential Analyses
4.2.1 Correlation Analysis
Table 4.2: Correlation Analysis of Construction and Materials Sector
Source: Developed for the research
Variables Dependent Variables Independent Variables
SDEBT LDEBT TDEBT SIZE TAN PRO NDTS GRO LIQ
SDEBT 1.000000
LDEBT 0.519589 1.000000
TDEBT 0.983200 0.666819 1.000000
SIZE 0.206310 0.464753 0.279231 1.000000
TAN -0.082637 -0.000480 -0.072179 -0.261959 1.000000
PRO -0.008111 0.046103 0.002775 0.475701 -0.189174 1.000000
NDTS -0.077644 -0.127846 -0.095033 -0.195594 0.502059 -0.131563 1.000000
GRO 0.978182 0.457864 0.950983 0.174573 -0.089710 0.048425 -0.062562 1.000000
LIQ -0.061003 -0.110963 -0.076912 -0.127202 -0.106837 0.160116 0.135452 -0.034514 1.000000

The Determinants of Capital Structure for Firms in Construction and Materials Sector of Malaysia
Page 61 of 117
Output of correlation analysis above shows that short-term debt has a positive
relationship with the size as well as the growth of the firms, however, has an
inverse relationship with tangibility, profitability, non-debt tax shield and
liquidity of the firms. Whereas for long-term debt and total debt, there is a
positive relationship with size, profitability and growth of the firms but has a
negative relationship with tangibility, non-debt tax shield and liquidity of the
firms, respectively.
Notably, short-term debt and total debt are both highly correlated with growth
of the firms respectively, which are 0.978 and 0.951. From this, we can
understand that debts especially short-term debt of the firms in construction
and material sector mostly depends on the growth of the firms. When the
growth of the firms increases, total debt and short-term debt will increase too.
This might be due to several reasons, one of them could be due to the cost of
issuing debt is lower than equity and the capital market in Malaysia. Next,
bond market is still underdeveloped compared to the developed countries. On
top of that, Crnigoj and Mramor (2009) also found that there is a positive
relationship between growth and leverage based on the Slovenian firms from
year 1999 to 2006.
The results above show that short-term debt has an inverse relationship with
profitability, tangibility and liquidity respectively which is aligned with the
pecking order theory that firms will first rely on the internal financing then
only turn to increase their debt level when they are exhausted. Therefore, it is
understood that when the firms have low profitability, tangibility and most
importantly liquidity, the firms will issue debt to raise funds and vice versa
(Mazur, 2007).
The size of the firms has a positive correlation with profitability and growth
which are 0.476 and 0.175. In the study done by Kazemi and Ansari (2012),

The Determinants of Capital Structure for Firms in Construction and Materials Sector of Malaysia
Page 62 of 117
the correlation between the size and growth of firms is 0.099. This implies
that larger firms tend to grow faster and with higher profits.
Moreover, tangibility of the firms, measured by fixed assets divided by total
assets has an inverse correlation between all debt levels, profitability, growth
and liquidity, -0.083, -0.0005, -0.072, -0.189, - 0.090 and -0.107. The inverse
relation between tangibility and debt levels proves that higher ratio will lower
the asymmetric information problems and result in lower debt ratios (Mazur,
2007). What is more, Bevan and Danbolt (2002) hypothesize that tangibility is
negatively correlated with short-term debt.
As expected, the profitability of the firms is positively related to growth and
liquidity which are 0.048 and 0.16. Hence, when the profit of the firms
increases, the growth and liquidity of the firms will increase as well. When
firm‟s profit increases, generally most of the firms will use the profit
generated to expand and grow their business as well as increase the liquidity
of the firms too. However, growth and liquidity alone, they have an inverse
relationship. This might be due to firms need to use cash and other liquid
assets to finance the growth of the firms, thus, when the growth is high,
liquidity will be low as well.

The Determinants of Capital Structure for Firms in Construction and Materials Sector of Malaysia
Page 63 of 117
4.2.2 Regression Analysis
Table 4.3: Panel Data Regression Analysis
Independent
Variables Types of Debt SIZE TAN PRO NDTS GRO LIQ C
Regression
Coefficient
Short-Term -0.011409 -0.034184 -0.339097 -0.400961 0.000343 -0.027484 0.298504
Long-Term 0.019240 0.196143 -0.191040 -0.860958 -0.000758 -0.008900 -0.022948
Total 0.007831 0.161958 -0.530140 -1.261899 -0.000415 -0.036384 0.275554
T- Statistic
Short-Term -0.763241 -0.843082 -3.210755 -0.982176 0.091726 -8.506532 3.615969
Long-Term 1.448020 5.442145 -2.034958 -2.372566 -0.228109 -3.098958 -0.312727
Total 0.432145 3.294659 -4.140306 -2.549592 -0.091589 -9.288447 2.753213
Probability
Short-Term 0.4457 0.3996 0.0014 *** 0.3265 0.9270 0.0000 *** 0.0003***
Long-Term 0.1483 0.0000 *** 0.0424 ** 0.0181 ** 0.8197 0.0021 *** 0.7546
Total 0.6658 0.0011 *** 0.0000 *** 0.0111 ** 0.9271 0.0000 *** 0.0061 ***
R- Squared
Short-Term 0.198970
Long-Term 0.117397
Total 0.274751

The Determinants of Capital Structure for Firms in Construction and Materials Sector of Malaysia
Page 64 of 117
Source: Developed for the research
Adjusted R-
Squared
Short-Term 0.188361
Long-Term 0.105707
Total 0.265145
F- Statistic
Short-Term 18.75370
Long-Term 10.04240
Total 28.60218
Probability
(F-Statistic)
Short-Term 0.000000
Long-Term 0.000000
Total 0.000000

The Determinants of Capital Structure for Firms in Construction and Materials Sector of Malaysia
Page 65 of 117
From the results of Eview software, Table 4.3 shows the regression equation
for short-term, long-term and total debt in construction and material sector as
below:
STDEBT = 0.2985*** - 0.3391 PRO*** - 0.0275 LIQ***
(t = -3.2108***) (t = -8.5065***)
LTDEBT = - 0.0229 + 0.1961 TAN*** -0.1910 PRO** -0.8610 NDTS**
- 0.0089LIQ***
(t= 5.4422***) (t= -2.0350**) (t= -2.3726**)
(t= -3.0990***)
TDEBT = 0.2755*** + 0.1620TAN*** - 0.5301PRO*** - 1.2619NDTS**
- 0.0364LIQ***
(t= 3.2947***) (t= -4.1403***) (t= -2.5496**)
(t= -9.2884***)
Whereby,
** = Significant at 0.05 level
*** = Significant at 0.10 level
TAN = Tangibility of assets
PRO = Profitability
NDTS = Non-debt tax shield
LIQ = Liquidity
STDEBT = Short-term debt
LTDEBT = Long-term debt
TDEBT = Total debt

The Determinants of Capital Structure for Firms in Construction and Materials Sector of Malaysia
Page 66 of 117
R-square indicates the percentage of the independent variables can explain the
variations in the dependent variables. According to the results we obtained, R-
square for the three debt measurements are relatively low. The results are
19.90 percent for short-term debt, 11.74 percent for long-term debt and 27.48
percent for total debt. This means that only 19.90 percent, 11.74 percent and
27.84 percent of independent variables can explain in variation of dependent
variables, short-term, long-term and total debt respectively. However, there is
80.10 percent for short-term debt, 88.26 percent for long-term debt and 72.16
percent for total debt are still left unexplained in this study. In other words,
there are other additional variables that are more important in explaining the
three types of debt that have not been considered in our study.
The p-values of the short-term, long-term and total debt are 0.0000, which are
significant at the 1%, 5% and 10% significant level. The results also show that
F-statistic is significant, 18.75, 10.04 and 28.60 respectively. The models are
good descriptors of the relationships between dependent variables and
independent variables.
The probability in the above Table 4.3, indicates the significance of every
each independent variables (firm size, tangibility, profitability, non-debt tax
shield, growth opportunity and liquidity) on dependent variables (short-term,
long-term and total debt). For the short-term debt, result shows that there are
only two independent variables are significant with short-term debt, that is
profitability and liquidity, whereas firm size, tangibility, non-debt tax shield
and growth opportunity are not significant to the short-term debt. Whereas for
the long-term and total debt, shows that the tangibility, profitability, non-debt
tax shield and liquidity are significant, while the firm size and growth
opportunity are not significant to the regression. Profitability and liquidity has
a persistent and consistent negative relationship with all three debt
measurements.

The Determinants of Capital Structure for Firms in Construction and Materials Sector of Malaysia
Page 67 of 117
Firm Size: Our results show that firm size has a consistent and persistent
insignificant negative relationship with all types of debt. This result is same
with Wan Mahmood et al. (2011) result that stated that firm size do not
suggest any significant impact on capital structure decision and this is support
by the notion that firms with larger proportion of their value accounted by
growth opportunities take less debt. While this result was contrary with the
result on construction sector in Malaysia by Baharuddin et al. (2011), whose
explained that they have positive relationship, due to the reason of the larger
the size of firms, the more debt to employ in order to sustain the firms
expenses. As the firm size increases, the need for financing in the form of debt
also increases (Sahudin et al., 2011). In additions, the positive relationship is
aligned with the hypothesis that larger firm tends to be more diversified and
less probability to bankruptcy and the direct cost of issuing debt or equity is
lower, and this result is tally with the trade-off theory (Pandey, 2001).
On top of that, our result shows that there is an insignificant negative
relationship, the negative relationship might be due to the larger firms will
less employ debt compared to small firms, they will rely more on their own
equity financing as their major source (Suhaila et al., 2008). Furthermore,
Getzmann et al. (2010) also argue that firm size has a negative impact on debt
based on pecking order theory, because large firms are monitored more
closely by the analysts, the information asymmetry is lowered by disclosure
duties.
Tangibility: We found that tangibility is insignificant negatively in short-term
debt, but has a positive significant relationship with long-term and total debt.
This may due to the reason that tangibility requires long-term fund to
financing for the longer maturity of assets. This result was supported by
researchers on construction sector (Baharuddin et al., 2011). In additions, the
insignificant negative relationship with short-term debt might be due to
principles of maturity matching (Pandey, 2001). Besides, Antoniou et al.

The Determinants of Capital Structure for Firms in Construction and Materials Sector of Malaysia
Page 68 of 117
(2008) and Getzmann et al. (2010) who carried out researches in United
Kingdom and Asian companies respectively suggested that tangibility is
positively significant with debt. The positive relationship with long-term debt
is being supported by trade-off theory that tangibility and long-term debt
should have a positive relationship (Pandey, 2001). Moreover, Pandey (2001)
also found another argument that there is a negative relationship between
tangibility and debt where firms with higher fixed assets would employ lower
financial debt in the traditional view.
Profitability: Our study shows that there is a consistent but negative
relationship with all debt measurements, which is in line with the evidence
found in construction sector in Malaysia (Baharuddin et al., 2011). According
to Antoniou et al. (2008) and Getzmann et al. (2010), profitability has a
negative impact on the debt due to the pecking order theory, stated that
profitable firms will finance internally instead of acquiring debt. According to
pecking order theory, profitable firms will finance internally. Hence, it will
lower the firms‟ debt level. The negative relationship between debt and
profitability can be result because of transaction costs too. Rafiq et al. (2008)
and Wan Ismail (2005) found that profitability is negatively related with debt
level due to the profitable firms will retain the earnings in order to invest in
future projects in pecking order theory. Moreover, high profitable firms often
used their earnings to pay down the debt (Titman and Wessels, 1988).
In property industry, Mohamed Yunos (2002) found that both short-term and
long-term debts are inversely related to profitability. Yet, there is another
argument stated that property assets intensity and profitability have significant
positive impacts on capital structure decisions. The empirical suggests that the
firms with higher property asset intensity employ more debt (Wan Mahmood,
2011).

The Determinants of Capital Structure for Firms in Construction and Materials Sector of Malaysia
Page 69 of 117
Non-debt Tax Shield: Non-debt tax shield is insignificant and negatively
related to short-term debt. It might due to short-term obligations have no
effect on tax shield. On the other hand, there is a significant but negative
relationship with long-term and total debt. This results are consistent with
Mohamed Yunos (2002) and DeAngelo and Masulis (1980) researches that
suggest tax rate is inversely related to short-term debt. However, studies on
capital structure suggest that non-debt tax shield will reduce the need for debt
in order to prevent net income from going to a higher level of tax bracket, thus
non-debt tax shield should be negatively related to debt (Rafiq et al., 2008).
DeAngelo and Masulis (1980) argue that tax deductions for depreciation and
the investment tax credits are substitutes for the tax benefits of debt financing.
Therefore, firms with larger non-debt tax shield relative to their expected cash
flow will prefer less debt in their capital structures.
Yet, there is a positive relationship between non-debt tax shields with debt in
pecking order theory. Wan Ismail (2005) argues that higher debt level will
lead to higher on tax shield. Therefore, non-debt tax shield is positively
related to debt. While Rafiq et al. (2008) suggest that the most appropriate
reason for this positive relationship can be given from the relevance of non-
debt tax shield to capital structure in Pakistan economy. The corporate tax rate
in Pakistan is not varying with the level of income. There are three types of
rate, which the first one is applicable to public limited firms, second is to
commercial organizations in government ownership and the third is to
financial sector organizations. Therefore, the firms in a given group faced a
constant rate of taxation, thus the depreciation do not work as a substitute to
debt to prevent net income from going into a higher level of tax bracket.
Growth Opportunity: The results obtain show that growth opportunity does
not have any impact on all types of debt. There is an insignificant but positive
relationship with short-term debt and insignificant negative relationship with
long-term and total debts. Malaysian firms tend to acquire more short-term

The Determinants of Capital Structure for Firms in Construction and Materials Sector of Malaysia
Page 70 of 117
debt to financing their growth since Malaysian firms have a higher short-term
debt ratio than long-term debt (Pandey, 2001). This finding supports both the
trade-off and pecking order theory. Contrary with our results, Baharuddin et al.
(2011) reports that growth opportunity has significant positive relationship
with long-term debt which is because of the construction firms in Malaysia are
depending heavily on the debt financing for the growth and expansion.
The insignificant negative relationship with long-term and total debts are
consistent with Rafiq et al. (2008), explained that growing chemical firms in
Pakistan utilize more debt than equity to finance the new investment. The
negative relationship does not support the simple version of pecking order
theory which says that growing firms will first utilize internal funds to fulfill
the financial needs. However, it supports the extended version of pecking
order theory that internal funds may not be sufficient for growing firms and
the next option would be using debt financing. Aside from that, there is
another argument by Awan et al. (2010). He suggests that there should be a
positive relationship between growth and total debt because the firms see
growth opportunity to be unsustainable and risky, so they intend to shift the
risk to the creditors. Whereas the insignificant result is consistent with Suhaila
et al. (2008), which argues that growth opportunity does not give any
significant impact on the debt. Moreover, this result is also consistent with
pecking order theory (Wan Ismail, 2005).
Liquidity: From the results obtained above, liquidity has a persistent and
consistent significant but negative relationship with all debt measurements.
Our results are supported by Suhaila et al. (2008) who suggests that firms with
higher liquidity ratio tend to use less debt, and they are able to generate high
cash turnover to finance their operations and investment activities. Therefore,
liquidity has a negative relationship with debt. In contrast, Sibilkov (2009)
found that asset liquidity has a positive relationship with debt. This is because
less liquid assets sell at higher costs, therefore increase the costs of liquidation,

The Determinants of Capital Structure for Firms in Construction and Materials Sector of Malaysia
Page 71 of 117
bankruptcy and debt. Thus, lower asset liquidity will reduce the probability of
default through low level of debt.
Further analysis also reveals that asset liquidity and secured debt are
positively related (Sibilkov, 2009). When managers have no discretion over
the disposition of firm assets, liquidity will has a positive impact on debt.
However, the relationship between asset liquidity and unsecured debt is
curvilinear. This finding is consistent with Myers and Rajan (1998),
Williamson (1988) as well as Shleifer and Vishny (1992), who argue that
when managers have the discretion and transformation risk exists, the
relationship between asset liquidity and debt is curvilinear that means asset
liquidity is positively related to debt when liquidity is low, but has a negative
impact when liquidity is high. Myers and Rajan (1998) also found that the
impact of asset liquidity on debt depends on manager‟s decisions to
disposition the assets. Asset liquidity has a positively impact on debt when
managers cannot dispose the assets, while it will has a curvilinear effect on
debt when managers managed to dispose the assets.
4.3 Conclusion
In a nutshell, this chapter comprises the detailed analysis of the results obtained after
running the tests. The results shows that firms in construction and materials sector in
Malaysia prefer short-term debt financing than long-term debt financing. Besides,
based on the results showed in Table 4.2, growth opportunity has the strongest
positive correlation with total debt and short-term debt whereas for long-term debt,
firm size has the strongest positive correlation. The results also show other
relationships between dependent variables and independent variables as well as the
relationship among each independent variable. Notably, we found that firm size and
growth opportunity are the only two independent variables which are insignificant to
all measurements of debt.

The Determinants of Capital Structure for Firms in Construction and Materials Sector of Malaysia
Page 72 of 117
CHAPTER 5: DISCUSSION, CONCLUSION AND
IMPLICATIONS
5.0 Introduction
This chapter comprises summary of descriptive analysis, correlation analysis and
regression analysis from previous chapter. Moreover, this chapter will also discuss
about the major findings of this research, implication of the study, limitation of the
research and recommendation for future research. What is more, the entire research
project will be evaluated as the conclusion of this study.
5.1 Summary of Statistical Analyses
5.1.1 Descriptive Analysis
In this section, we summarize the entire descriptive analyses presented and
discussed in the Chapter 4. Our study is based on 92 companies in
construction and materials sector in Malaysia from year 2005 to 2009 after
eliminating 14 companies due to insufficient of data.
Referring to Table 4.1, we discovered that the selected listed companies in
construction and materials sector, on average, prefer short-term debt than
long-term debt. Our results show that the mean of short-term debt ratio is 14.5
percent compared to the latter which is only 9.5 percent. However, the average
for total debt ratio is 24 percent which means that 24 percent of the total assets
of the construction and materials sector companies in Malaysia are financed
by debt.

The Determinants of Capital Structure for Firms in Construction and Materials Sector of Malaysia
Page 73 of 117
Next, the mean for the firm size is 5.224. Whereas for tangibility, it is 32.6
percent which indicates that the selected firms have an average of 32.6 percent
of the total assets are total fixed assets. Apart from that, the average
profitability is relatively low which shows only 2.5 percent. As for growth
opportunity, on average, the firms have a growth of 14.8 percent during the 5-
year period. On top of that, the average value of non-debt tax shield of the
firms in our research is only 2.4 percent. Lastly, the mean liquidity of the
firms is 2.35 which explain that on average, the firms are able to cover the
debt using the firms‟ assets.
5.1.2 Correlation Analysis
Based on Table 4.2, the correlation matrix that we have constructed in Chapter
4 is to measure the relationship between all independent variables and
dependent variables as well as the relationship between one another. The
output shows that firm size and growth opportunity have positive relationships
with short-term debt, one of the dependent variables. However, short-term
debt has an inverse relationship with tangibility, profitability, non-debt tax
shield and liquidity. Whereas for long-term debt and total debt which are the
other two dependent variables, they have positive relationships with the firm
size, profitability and growth opportunity but has a negative relationship with
tangibility, non-debt tax shield and liquidity.
Among all the independent variables, growth has the strongest positive
correlation with short-term debt and total debt with correlation values, r =
0.9782 and 0.9510. But, firm size has the strongest positive relationship with
long-term debt with correlation value, r = 0.4648. On the other hand,
profitability has the weakest positive relationship with total debt and long-
term debt with correlation values, r = 0.0028 and 0.0461. However, firm size

The Determinants of Capital Structure for Firms in Construction and Materials Sector of Malaysia
Page 74 of 117
has the weakest positive relationship with short-term debt with correlation
value, r = 0.2063.
On contrast, tangibility has the strongest negative relationship with short-term
debt with correlation value, r = -0.0826 whereas for profitability has the
weakest negative relationship with short-debt with correlation value, r = -
0.0081. Moreover, non-debt tax shield has the strongest negative relationship
with long-term debt with correlation value, r = -0.1278 whereas tangibility has
the weakest negative relationship with long-term debt with correlation value, r
= -0.00048. Next, non-debt tax shield has the strongest negative relationship
with total debt with correlation value, r = -0.0950 whereas tangibility has the
weakest negative relationship with total debt with correlation value, r = -
0.0722. Last but not least, the correlation value between the rest of
independent variables and the dependent variables are within the range of
0.9782 and -0.1278. Finally, the correlation values between the independent
variables are between the range of 0.5 and -0.3.
5.1.3 Simple Regression Analysis
Referring to Table 4.3, the results of the test on the nature of the relationship
and the significance of variables are formed into the equations as below:
STD = 0.2985*** - 0.3391PRO*** - 0.0275LIQ***
(t = -3.2108***) (t= -8.5065***)

The Determinants of Capital Structure for Firms in Construction and Materials Sector of Malaysia
Page 75 of 117
LTD = - 0.0229 + 0.1961TAN*** - 0.1910PRO** - 0.8610NDTS
- 0.0089LIQ***
(t = 5.4422***) (t = - 2.0350**) (t = - 2.3726**)
(t = - 3.0990***)
TD = 0.2755*** + 0.1620TAN*** - 0.5301PRO***- 1.2619NDTS**
- 0.0364LIQ***
(t= 3.2947***) (t= -4.1403***) (t= -2.5496**)
(t= -9.2884***)
Whereby,
** = Significant at 0.05 level
*** = Significant at 0.10 level
TAN = Tangibility of assets
PRO = Profitability
NDTS = Non-debt tax shield
LIQ = Liquidity
STDEBT = Short-term debt
LTDEBT = Long-term debt
TDEBT = Total debt

The Determinants of Capital Structure for Firms in Construction and Materials Sector of Malaysia
Page 76 of 117
i. Short-term debt
Referring to Table 4.3, the results reported significant relationships between
profitability and liquidity with short term debt. Therefore, the hypothesis of
H2bc and H2f are supported. Profitability is found to be the strongest variable
that appears to have relationship with short-term debt. It means that 1 percent
increase in profitability will lead to a decrease of 33.91 percent in short term
debt, on average, holding other independent variables constant. On the other
hand, liquidity has the lowest regression coefficient which is -0.0275.
The results of the test on the strength of the relationship between independent
variables and short-term debt obtained are as follows:
R2 = 0.1990
Adjusted R2 = 0.1883
Based on the result generated in Table 4.3, the value of R2 is 0.1990 which
means that a change in total debt can be explained by 19.90 percent of the
independent variables which are significant (profitability and liquidity). Firm
size, tangibility, non-debt tax shield and growth opportunity are found to have
insignificant relationship with short-term debt with the coefficient of -0.0114,
-0.0342, -0.4010 and 0.0003.
ii. Long-term debt
Referring to Table 4.3, the results reported there are significant relationships
between tangibility, profitability, non-debt tax shield and liquidity with long-
term debt. Hence, the hypothesis of H3b, H3c, H3d and H3f are supported. Non-
debt tax shield has the highest regression coefficient which is -0.8610.
Therefore, it indicates that 1 percent increase in non-debt tax shield will lead

The Determinants of Capital Structure for Firms in Construction and Materials Sector of Malaysia
Page 77 of 117
to a decrease of 86.1 percent in long-term debt, on average, with other
independent variables held constant. Tangibility is ranked as the second
highest independent variable, 0.19610 and followed by profitability with
coefficient -0.1910. Liquidity appears to have the lowest regression
coefficient with only -0.0089.
The results of the test on the strength of the relationship between independent
variables and long-term debt obtained are as follows:
R2 = 0.1174
Adjusted R2 = 0.1057
Based on the results generated in Table 4.3, the value of R2 is 0.1174 which
means that a change in total debt can be explained by 11.74 percent of the
independent variables involved (tangibility, profitability, non-debt tax shield
and liquidity). Firm size and growth opportunity are found to have
insignificant relationships with total debt with the coefficient value of 0.0192
and -0.0008.
iii. Total debt
Referring to Table 4.3, the results reported there are significant relationships
between tangibility, profitability, non-debt tax shield and liquidity with total
debt. Hence, the hypotheses of H1b, H1c, H1d and H1f are supported which
poses similar results with long-term debt. Non-debt tax shield is the most
powerful variable that appears to have relationship with total debt which has
the highest value of regression coefficient. Therefore, it indicates that 1
percent increase in non-debt tax shield will lead to a decrease of 126.19
percent in total debt, on average, with other independent variables held
constant. Profitability is ranked as the second important independent variable
as it has a regression coefficient of -0.5301 and followed by tangibility with

The Determinants of Capital Structure for Firms in Construction and Materials Sector of Malaysia
Page 78 of 117
coefficient of 0.1620. Liquidity appears to have the lowest regression
coefficient with only -0.0364.
The results of the test on the strength of the relationship between independent
variables and total debt obtained are as follows:
R2 = 0.2748
Adjusted R2 = 0.2651
Based on the results generated in Table 4.3, the value of R2 is 0.275 which
means that a change in total debt can be explained by 27.5% of the
independent variables involved (tangibility, profitability, non-debt tax shield
and liquidity). Firm size and growth opportunity are found to have
insignificant relationship with total debt with the coefficient value of 0.0078
and -0.0004.

The Determinants of Capital Structure for Firms in Construction and Materials Sector of Malaysia
Page 79 of 117
5.2 Discussion of Major Findings
5.2.1 Summary of Hypothesis Testing
Table 5.1: Summary of the Result of Hypothesis Testing (Total Debt)
Hypothesis Coefficient T-value Probability Significant
Level Result
H1a: Firm size has a
positive relationship
with total debt
0.0078 0.4321 0.6658 - Reject
H1b: Tangibility has
a positive
relationship with
total debt
0.1620 3.2947 0.0011 0.10 Accept
H1d: Non-debt tax
shield has a negative
relationship with
total debt
-1.2618 -2.5496 0.0111 0.05 Accept
H1e: Growth
opportunity has a
positive relationship
with total debt
-0.0004 -0.0916 0.9271 - Reject
H1f: Liquidity has a
negative relationship
with total debt
-0.0364 -9.2884 0.0000 0.01 Accept
Source: Developed for the research

The Determinants of Capital Structure for Firms in Construction and Materials Sector of Malaysia
Page 80 of 117
H1b: Tangibility has a positive relationship with total debt
According to Table 5.1, there is a significant relationship between tangibility
and total debt as it has the p-value which is lower than 0.10. Hence, H1b is
accepted in which tangibility has a positive relationship with total debt. This
result is consistent with the findings of past studies of Gaud et al. (2003), Niu
(2008), Baharuddin et al. (2011), Teker et al. (2009) and Getzmann et al.
(2010).
H1c: Profitability has a negative relationship with total debt
Result of the hypothesis testing shows that the relationship between
profitability and total debt is significant since it has the p-value that less than
0.10. Therefore, H1c is accepted in this research and this result is in
accordance with past literatures done by researchers which had proven that
profitability has a negative relationship with total debt. (Titman and Wessels,
1988; Pandey, 2001; Mohamed Yunos, 2002; Gaud et al., 2003; Wan Ismail,
2005; Rafiq et al., 2008; Getzmann et al., 2010; Baharuddin et al., 2011).
H1d: Non-debt tax shield has a negative relationship with total debt
Based on the result shown in Table 5.1, there is a significant relationship
between non-debt tax shield and total debt. The p-value for non-debt tax
shield 0.0111 which is less than 0.10 shows that the proposed hypothesis is
accepted. The findings found are supported by the results of past researches
(DeAngelo and Masulis, 1980; Mohamed Yunos, 2002;Afza and Hussain,
2011).

The Determinants of Capital Structure for Firms in Construction and Materials Sector of Malaysia
Page 81 of 117
H1f: Liquidity has a negative relationship with total debt
There is a direct relationship between liquidity and total debt which can be
proven by the panel data regression analysis. H1f is accepted in this research
since p-value less than 0.10. Hence, proposed hypothesis, H1f is supported and
consistent with the results of past studies (Suhaila et al., 2008; Singhania and
Seth, 2010; Afza and Hussain, 2011; Najjar and Petrov, 2011).
Table 5.2: Summary of the Result of Hypothesis Testing (Short-term Debt)
Hypothesis Coefficient T-value Probability Significant
Level Result
H2a: Firm size has a
positive
relationship with
short-term debt
-0.0114 -0.7632 0.4457 - Reject
H2b: Tangibility has
a positive
relationship with
short-term debt
-0.0342 -0.8431 0.3996 - Reject
H2c: Profitability
has a negative
relationship with
short-term debt
-0.3391 -3.2108 0.0014 0.10 Accept
H2d: Non-debt tax
shield has a
negative
relationship with
short-term debt
-0.4010 -0.9822 0.3265 - Reject

The Determinants of Capital Structure for Firms in Construction and Materials Sector of Malaysia
Page 82 of 117
H2e: Growth
opportunity has a
positive
relationship with
short-term debt
0.0003 0.0917 0.9270 - Reject
H2f: Liquidity has a
negative
relationship with
short-term debt
-0.0275 -0.8507 0.0000 0.10 Accept
Source: Developed for the research
H2c: Profitability has a negative relationship with short-term debt
Based on Table 5.2, there is a significant relationship between profitability
and short-term debt as it has p-value of 0.0014 which is lesser than 0.10.
Therefore, H2c is accepted in this research and this result is aligned with past
literatures (Titman and Wessels, 1988; Pandey, 2001; Mohamed Yunos, 2002;
Gaud et al., 2003; Wan Ismail, 2005; Rafiq et al., 2008; Getzmann et al., 2010;
Baharuddin et al., 2011).
H2f: Liquidity has a negative relationship with short-term debt
Refer to Table 5.2, there is a significant relationship between liquidity and
short-term debt as its p-value is lesser than 0.10. Hence, H2f is accepted in this
research and this result is in line with findings of past studies of Suhaila et al.
(2008), Singhania and Seth (2010), Afza and Hussain (2011) and Najjar and
Petrov (2011).

The Determinants of Capital Structure for Firms in Construction and Materials Sector of Malaysia
Page 83 of 117
Table 5.3: Summary of the Result of Hypothesis Testing (Long-term Debt)
Hypothesis Coefficient T-value Probability Significant
Level Result
H3a: Firm size
has a positive
relationship with
long-term debt
0.0192 1.4480 0.1483 - Reject
H3b: Tangibility
has a positive
relationship with
long-term debt
0.1961 5.4421 0.0000 0.10 Accept
H3c: Profitability
has a negative
relationship with
long-term debt
-0.1910 -2.0350 0.0424 0.05 Accept
H3d: Non-debt
tax shield has a
negative
relationship with
long-term debt
-0.8610 -2.3726 0.0181 0.05 Accept
H3e: Growth
opportunity has
a positive
relationship with
long-term debt
-0.0008 -0.2281 0.8197 - Reject
H3f: Liquidity
has a negative
relationship with
long-term debt
-0.0089 -3.0990 0.0021 0.10 Accept
Source: Developed for the research
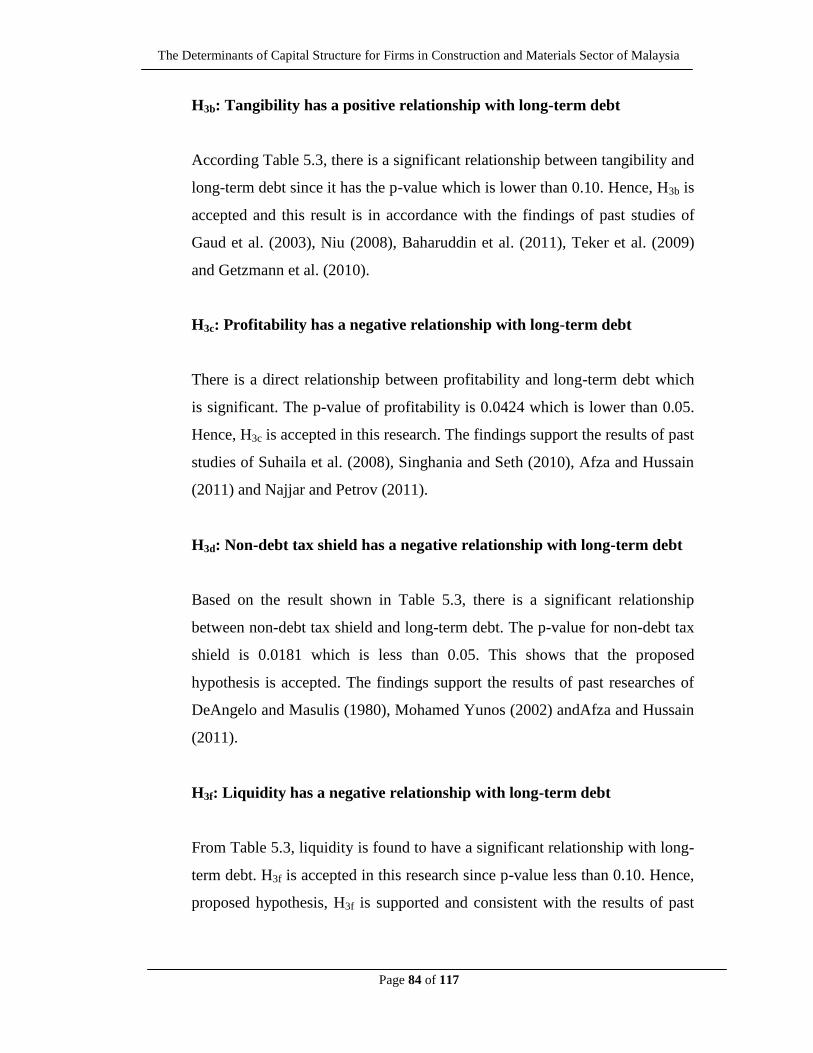
The Determinants of Capital Structure for Firms in Construction and Materials Sector of Malaysia
Page 84 of 117
H3b: Tangibility has a positive relationship with long-term debt
According Table 5.3, there is a significant relationship between tangibility and
long-term debt since it has the p-value which is lower than 0.10. Hence, H3b is
accepted and this result is in accordance with the findings of past studies of
Gaud et al. (2003), Niu (2008), Baharuddin et al. (2011), Teker et al. (2009)
and Getzmann et al. (2010).
H3c: Profitability has a negative relationship with long-term debt
There is a direct relationship between profitability and long-term debt which
is significant. The p-value of profitability is 0.0424 which is lower than 0.05.
Hence, H3c is accepted in this research. The findings support the results of past
studies of Suhaila et al. (2008), Singhania and Seth (2010), Afza and Hussain
(2011) and Najjar and Petrov (2011).
H3d: Non-debt tax shield has a negative relationship with long-term debt
Based on the result shown in Table 5.3, there is a significant relationship
between non-debt tax shield and long-term debt. The p-value for non-debt tax
shield is 0.0181 which is less than 0.05. This shows that the proposed
hypothesis is accepted. The findings support the results of past researches of
DeAngelo and Masulis (1980), Mohamed Yunos (2002) andAfza and Hussain
(2011).
H3f: Liquidity has a negative relationship with long-term debt
From Table 5.3, liquidity is found to have a significant relationship with long-
term debt. H3f is accepted in this research since p-value less than 0.10. Hence,
proposed hypothesis, H3f is supported and consistent with the results of past

The Determinants of Capital Structure for Firms in Construction and Materials Sector of Malaysia
Page 85 of 117
studies (Suhaila et al., 2008; Singhania and Seth, 2010; Afza and Hussain,
2011; Najjar and Petrov, 2011).
5.2.2 Major Findings
Table 5.4: Summary of the Differences between the Results of Short-term Debt and
Long-term Debt
Hypothesis
(Short-term debt)
Result
(Short-term
debt)
Result
(Long-term
debt)
Hypothesis
(Long-term debt)
H2a: Firm size has a
positive relationship with
short-term debt
Reject Reject
H3a: Firm size has a
positive relationship
with long-term debt
H2b: Tangibility has a
positive relationship with
short-term debt
Reject Accept
H3b: Tangibility has
a positive
relationship with
long-term debt
H2c: Profitability has a
negative relationship
with short-term debt
Accept Accept
H3c: Profitability
has a negative
relationship with
long-term debt
H2d: Non-debt tax shield
has a negative
relationship with short-
term debt
Reject Accept
H3d: Non-debt tax
shield has a negative
relationship with
long-term debt
H2e: Growth opportunity
has a positive
relationship with short-
term debt
Reject Reject
H3e: Growth
opportunity has a
positive relationship
with long-term debt

The Determinants of Capital Structure for Firms in Construction and Materials Sector of Malaysia
Page 86 of 117
H2f: Liquidity has a
negative relationship
with short-term debt
Accept Accept
H3f: Liquidity has a
negative relationship
with long-term debt
Source: Developed for the research
In this study, we examine the determinants that influence capital structure of
firms in construction and materials sector in Malaysia. We use the panel data
of 92 construction and materials firms listed in Bursa Malaysia from year
2005 to 2009.
Based on this paper, we discover that tangibility, profitability, non-debt tax
shield and liquidity will influence the total debt and long-term debt of the
firms in construction and materials sector whereas for short-term debt, there
are only two variables which are profitability and liquidity have relationship
with it. Based on our results, firm size and growth opportunity did not show
an impact on total debt, short-term debt and long-term debt level. Firm size
has a positive relationship with total debt, long-term debt and short-term debt
which is aligned with past literatures like Baharuddin et al. (2011) and
Getzmann et al. (2010) but posed an insignificant relationship with total debt
and long-term debt. It might be due to firms do not take firm size as
consideration into their debt financing decisions. Regardless of the size of
firm, they will acquire both short-term debt and long-term debt depending on
other factors such as financial market conditions and firm‟s financial position.
So it is irrelevant and insignificant to include firm size as one of the
determinants to capital structure decision.
Besides, growth opportunity also shows a statistically insignificant to total
debt, short-term debt and long-term debt. The positive coefficient of growth
opportunity in total debt and short-term debt is consistent with the studies of
Baharuddin et al. (2011) but it became inconsistent in long-term debt as it
posted a negative insignificant relationship with short-term debt. It is because

The Determinants of Capital Structure for Firms in Construction and Materials Sector of Malaysia
Page 87 of 117
of firms with greater growth potentials have more flexibility to invest sub
optimally, thus, transferring the wealth from bondholders to shareholders that
could cause agency costs resulted in high costs in issuing debt. Therefore,
high growth potential firms tend to borrow lesser debt. The purpose of growth
opportunity is to expand the business. However, we assumed that with high
growth opportunity, it does not signify the firms should or should not use debt
financing because they have other options such as internal and equity
financing. Needless to say, with low growth opportunity there will be no
financing needed. The insignificant relationship between growth opportunity
with total debt, short-term debt and long-term debt indicate that firms with
higher growth do not signify use of more leverage as firms might use internal
funds partially or fully to finance investments.
Moreover, tangibility and non-debt tax shield has no relationship with short-
term debt. Fixed assets or known as tangible assets are financed by long-term
debt instead of short-term debt. This result is supported by the principle which
long-term debt is used to finance tangible assets whereas intangible assets are
financed by short-term debt (Bevan and Danbolt, 2002). Furthermore, non-
debt tax shield is found to be significant in long-term debt but became
insignificant in short-term debt. Based on our research, a non-debt tax shield
affects short-term debt negatively which is consistent with DeAngelo and
Masulis (1980). Thus, the insignificant result implied that when firms engaged
in tax shelter schemes, they mainly consider long-term debts since non-debt
tax shields are substitutes for the tax benefits of long-term debt financing to
depreciation.
Based on Table 5.4, there are some differences between the results between
six independent variables and both measurements of short-term debt and long-
term debt. First, there is an insignificant and positive relationship between
firm size and long-term debt but it entails an insignificant and negative
relationship with short-term debt. Second, tangibility shows a significant and

The Determinants of Capital Structure for Firms in Construction and Materials Sector of Malaysia
Page 88 of 117
positive relationship with long-term debt whereas a negative and insignificant
relationship with long-term debt. Lastly, growth opportunity has negative
insignificant relationship with long-term debt but a positive insignificant
relationship with short-term debt.
Apart from that, we found that construction and materials sector companies in
Malaysia prefer to use short-term debt more than long-term debt. This finding
is based on the descriptive result in Table 4.1. It shows the average short-term
debt is 14.52% which is higher than average long-term debt, 9.52%. It is due
to few reasons. The determinants of debt maturity can be explained by using
agency conflicts, information asymmetry and taxes. Firstly, the reason of
firms to use short-term debt is to reduce agency costs of debt such as
underinvestment (Myers, 1977) and asset substitution (Barnea et al., 1980).
Myers (1977) suggested that firms can reduce the underinvestment problem
by shortening the effective maturity of their debt. When debt matures before
investment opportunities are exercised, there is an opportunity for debt to be
reprised so that gains from new projects do not benefit to bondholders (Taleb
and Shubiri, 2011). According to Barnea et al. (1980), they proposed that
firms use short-term debt to mitigate the adverse risk incentives in financing
debt or the asset substitution problem. It is due to short-term debt is less
sensitive to changes in the assets risk levels of the firm, thus it will reduce
shareholders‟ incentives to invest in high risk projects leading to a lower
likelihood of loss of value. Secondly, in the presence of asymmetric
information, the debt maturity structure can be used to send signals to the
market about the quality of a firm (Teruel and Solano, 2007).Flannery
(1986),Kale and Noe (1990) showed that firms with high quality investment
projects used short term loans to prevent paying a high market premium on
long-term debt. Lastly, firms who are facing uncertainty in their tax status
prefer to use short-term debt when their tax rate is high. In this setting, short-
term debt will be the least costly and easiest way to adjust debt levels

The Determinants of Capital Structure for Firms in Construction and Materials Sector of Malaysia
Page 89 of 117
temporarily to an optimum level and avoid the potential cost of retiring
outstanding debt in the future (Scholes and Wolfson, 1988).
Table 5.5: Comparison between Expected Signs of Independent Variables
Based On Trade-Off Theory and Pecking Order Theory with Actual Signs of
Independent Variables
Trade-Off
Theory
Pecking
Order Theory Total Debt
Short-term
Debt
Long-term
Debt
Firm size Positive Negative Positive Negative Positive
Tangibility Positive Positive Positive Negative Positive
Profitability Positive Negative Negative Negative Negative
Non-debt Tax
Shield Negative - Negative Negative Negative
Growth
Opportunity Negative Positive Positive Positive Negative
Liquidity Negative Negative Negative Negative Negative
Source: Developed for the research
In a nutshell, the relationship between tangibility, profitability, growth
opportunity and liquidity with total debt are consistent with the prediction of
sign based on pecking order theory except firm size. In addition, the
relationship between firm size, profitability, growth opportunity and liquidity
with short-term debt are in line with the prediction of sign based on pecking
order theory except tangibility. Furthermore, the relationship between
profitability, growth opportunity and liquidity with total debt are in line with
the prediction of sign based on pecking order theory except firm size and
growth opportunity. However, based on past studies of Shyam-Sunder and
Myers (1999), Myers (2001) and Adesola (2009), we discover that the
relationships of independent variables such as firm size, tangibility and
growth opportunity with debt are contradicted with pecking order theory yet

The Determinants of Capital Structure for Firms in Construction and Materials Sector of Malaysia
Page 90 of 117
consistent with trade off theory. Moreover, trade-off theory is able to explain
the relationship between non-debt tax shield and debt level which is not
explained in pecking order theory. According to Afza and Hussain (2011),
firms with high depreciation expenses do not prefer debt financing as
depreciation itself provides tax shield to firms. Thus, the non-debt tax shield is
negatively related to debt according to trade-off theory. Therefore, the results
indicated that it does not fully supported by pecking order theory but rather a
combination of trade-off theory and pecking order theory.
5.3 Implications of Studies
5.3.1 Managerial Implications
This research provides several refined suggestions not only to the top
management of the firms, but also to the external parties such as investors and
students. We strongly believe that the mentioned parties especially the
management of the firms in construction and materials sector will be able to
identify the level of importance of the variables (firm size, tangibility,
profitability, growth opportunity, non-debt tax shield and liquidity) to the
respective debt measurements and the relationship between dependent
variables and independent variables. Following is the proposal made to
determine the priorities and ignore the insignificant determinants in making
the best possible capital structure decisions.
Our research shows that most firms in construction and materials sector
preferred short-term debt rather than long-term debt in Malaysia from year
2005 to 2009. However, Teruel and Solano (2007) found out there is a major
downside of short-term debt which is an increase in risk. The increased of risk

The Determinants of Capital Structure for Firms in Construction and Materials Sector of Malaysia
Page 91 of 117
is due to refinancing and interest rate risks. Refinancing risk refers to the
problems a firm may face at the time of loan renewal. Jun and Jen (2003)
found that the refinancing risk grows exponentially with the short-term debt.
Hence, the firms will be more vulnerable during bad economic condition since
firms will experience more difficulties in renewing their loans (debt). Besides,
interest rate risk is due to the fluctuation of the interest rate. Higher interest
rate will cause the firms to absorb higher cost of debt. However, it has
advantages too. Short-term debt can be used to ensure that there is cash
available to satisfy the short-term operating capital needs. On top of that, it
can assist firms in dealing with emergency situation as well as using it to
initiate an expansion which is a risky move (Broemmel, 2012).
As for long-term debt, there are pros and cons too. It is usually more risky to
the firms as it involves longer payback periods and thus higher credit risks and
higher uncertainties. Besides, it is more costly compared to short-term debt
since charges of interests are higher and the firms with no track records, cash
and asset base will find it hard to obtain long-term financing. These might be
the reasons that push the analyzed firms to take up short-term debt rather than
long-term debt. On top of that, any breach of debt covenants may result in the
firms going into financial distress, secured creditors may also take actions
against the firms if they are not able to make payments and if the interest rate
is based on floating rate, interest rates may move adversely against the firms
during bad economic condition, causing huge unplanned interest expenses and
cash outflows. However, the pro is the long-term debt financing is less prone
to short term shocks as it is secured by contractual terms. Hence, they are
relatively more stable than short-term debt (“Debt Financing,” 2012). All in
all, it is up to the management of the firms which type of debt financing is best
suits the needs of their firms in different economic conditions.
According to the results obtained, as for short-term debt level, only
profitability and liquidity are significant. Profitability appears to have the

The Determinants of Capital Structure for Firms in Construction and Materials Sector of Malaysia
Page 92 of 117
strongest negative influence to the short-term debt level with coefficient value
of -0.3391. 1 percent increase in profitability would decrease the short-term
debt by 33.91 percent. Thus, the management for the firms in this sector
should direct more attention to profitability in order to achieve the targeted
capital structure ratio.
Based on our study, since profitability is inversely related to short-term debt
ratio, management should monitor the staff closely, especially in sales
department to achieve the profits targeted by the management. In addition to
that, procurement department also plays a vital role in increasing profit. It is
undeniable that the cost of procurement is increasing day by day due to
inflation in Malaysia, thus in order to curb this problem, sourcing from other
countries at a lower cost such as China. Subsequently, these steps taken by the
management to increase short-term debt will help to decrease the risks
(refinancing and interest rate risks) created by short-term debt.
Besides that, the management should also concentrate on liquidity which has a
significant negative relationship with the short-term debt with coefficient
value of -0.0275. Although the influence is not as strong as profitability, the
management should also pay heed to increase the liquidity in order to lower
the risk of short-term debt financing. The firms should have ample liquid
assets such as cash or other money market instruments (T-bills) to avoid
facing liquidity issue when financial crisis happens. Hence, this may help
firms to maintain current assets and current liabilities in an optimum range in
order to keep the liquidity ratio in check all the time.
From the research conducted, there are several determinants which are
significant to long-term debt and total debt such as the tangibility, profitability,
non-debt tax shield and liquidity. Tangibility is the only determinant that is
significantly and positively related to long-term debt and total debt with
coefficient of 0.1961 and 0.1620. Since long-term debt financiers would

The Determinants of Capital Structure for Firms in Construction and Materials Sector of Malaysia
Page 93 of 117
normally require the borrowing company to pledge some form of asset
including fixed assets as collateral. For those firms who prefer to finance
through long-term debt, the management should invest more on fixed assets
such as lands and shops, so that they can be used as collateral in long-term
debt financing. Without collateral, financiers are unwilling to take the risk to
approve long-term loan to the firms especially during economy crisis. This
might be also the reason why firms prefer short-term debt financing since
long-term debt financing always require fixed assets as collateral which may
reduce the flexibility of asset management of the firms.
Apart from that, non-debt tax shield has the strongest negative and significant
influence on long-term debt and total debt with coefficient of 0.86 and -1.262.
Therefore, management of the firms should put more attention in this
determinant as the increase/ decrease of non-debt tax shield will significantly
affect the both long-term and total debt. It has become a major trend in most
of the firms by using non-debt tax shield to replace tax advantage of debt
because firms used to borrow debt in order to reduce the tax payment but now
they do not need to do so since with increased depreciation expenses can
create tax shield as well. Therefore, firms are not advisable to take on debt to
create a tax shield which may result failure in paying the obligations during
unexpected financial crisis.
In addition, profitability and liquidity have inversely significant relationship
with both long-term debt and total debt. When liquidity and profitability both
decrease, they would affect the decisions of the management to take more
long-term debt or debt financing. Therefore, firms should maintain a high
level of liquidity to meet unexpected cash outflow due to unexpected financial
events and plan to increase the profitability by decreasing costs and increasing
sales.

The Determinants of Capital Structure for Firms in Construction and Materials Sector of Malaysia
Page 94 of 117
What is more, external parties like investors should always monitor the
significant determinants such as the profitability, liquidity, non-debt tax shield
and tangibility of the firms in order to find out the debt level position of the
firms now as well as for the near future. These ratios can be found through the
annual report or quarterly report released by the firms. Knowing the
relationships between the different debt level measurements and the
significant independent variables, investors can predict the debt financing
decisions of the firms and evaluate whether the firms are still in healthy
financial position. Moreover, the investors can also observe the capabilities
and efficiencies of the management of the firms in keeping the debt ratios at
optimum level.
Finally, students can also use our research as guidelines in doing their future
researches. Based on our results, they will be able to know the relationships
between the analyzed determinants with the three different debt level
measurements for the firms in construction and materials sector. Lastly, it will
also help them to have a better understanding on the pecking order and trade-
off theories which are in line with our results.
5.4 Limitations of the Research
There are several limitations in this research. The first limitation of our research is
that the samples are only focus on construction and materials sector that listed on
Bursa Malaysia. This limitation hampers the generalizability of the results obtained
from this research. This result could not be used to generalize all the sectors in
Malaysia and could not generalize construction and materials sector in Western
countries too. The results could not be generalized to Western countries as there are
cultural differences between Asia and Western.

The Determinants of Capital Structure for Firms in Construction and Materials Sector of Malaysia
Page 95 of 117
The second limitation is regarding the measurements of debt level. Debt level consists
of many types of measurements such as debt to firm value ratio (Kazemi and Ansari,
2012), debt to equity ratio (Ross, Westerfield and Jordan, 2003) but in this research
we only focus mainly on three measurements which are total debt to total assets,
long-term debt to total assets and short-term debt to total assets. Consequently, the
results obtained do not reflect the whole picture of capital structure of a firm such as
effect of equity on debt level.
The third limitation is the various proxy variables used in our research. Although the
proxy variables used were supported by previous studies empirically and theoretically,
they may not perfectly represent the theoretical propositions of our research. It is due
to differences in financial market structures, government policies, economics
conditions and other factors of each country. The limitations mentioned above are
acknowledged but they do not detract from the significance of findings but merely
provide platforms for future research.
5.5 Recommendations for Future Research
Some recommendations are drawn out for future research. First, future researches
should be conducted in other sectors in Malaysia with the same research objectives in
order to check the consistency of results across the various sectors. Besides, future
researches could be conducted in construction and materials sectors in other Western
countries, such as United States, Italy and France.
Second, other measurements of capital structure such as debt to equity ratio should be
used in future research to gain further insights about the association between equity
and debt. In-depth exploration process should be involved in investigating effect of
equity on debt and so there could be some new findings drawn out from future
researches.

The Determinants of Capital Structure for Firms in Construction and Materials Sector of Malaysia
Page 96 of 117
Lastly, additional independent variables should be added into the research framework
to test other relevant variables that constitute a direct relationship with capital
structure which is beneficial for management of the firms for better financing
decisions. As compared with the results of past literatures, firm size is evidenced to
constitute an insignificant relationship with debt level in this research. This result
contradicts with some past studies which tested in different context such as in
financial service sector and different geographical area (Thian, 2012). Even though
the result is inconsistent, it is interesting to discover that firm size is not recognized as
the important variable in Malaysia towards debt level in the context of construction
and materials sector and has to be examined in different context such as automobile
sector for future studies.
5.6 Conclusion
We have come to a conclusion after analyzing 92 firms from construction and
materials sector in Malaysia that the two variables, profitability and liquidity are
proven to have significant negative relationship with short-term debt. However, for
long-term debt and total debt, we have found that they have negative significant
relationships with profitability, non-debt tax shield and liquidity, yet tangibility is the
only variable that is found to have a significant positive relationship with long-term
and total debt. Firm size and growth opportunity are the two variables which have
found to be insignificant towards its relationship with all the three measurement of
debts. Hence to conclude, the results of our studies are aligned with the combination
of both pecking order theory and trade-off theory. On top of that, descriptive analysis
presented that the average of firms in construction and materials sector have a
relatively low profitability and prefer short-term debt than long-term debt. Correlation
analysis shows that growth opportunity has the strongest correlation with both short-
term and total debt which reflects that as long as the growth opportunity of the firms
in this sector increases, the debt financing will increase too. Before concluding,
managerial implication and limitations of our study are discussed and stated clearly

The Determinants of Capital Structure for Firms in Construction and Materials Sector of Malaysia
Page 97 of 117
on the means to achieve the optimum debt level based on the results obtained in our
research above. Lastly, recommendations are stated above to assist future researchers
to achieve higher precision in obtaining results and able to make a better overall
conclusion on capital structure decisions based on the determinants.

The Determinants of Capital Structure for Firms in Construction and Materials Sector of Malaysia
Page 98 of 117
REFERENCES
Abdullah, A. M. (2011). The Determinants of Capital Structure of Jordanian Mining
and Extraction Industries: Empirical Evidence. Journal of Economics,
Finance and Administrative Sciences (29), 156-164.
Abor, J. (2008). Agency theories determinants of debt levels: evidence from Ghana.
Review of Accounting and Finance, 7(2), 183-192.
Adedeji, A. (1998). Does the Pecking Order Hypothesis Explain the Dividend
PayoutRatios of Firms in the UK?Journal of Business Finance & Accounting,
25(9-10), 1127-1155.
Adesola, W. A. (2009). Testing Static Tradeoff Theory Against Pecking Order
Models of Capital Structure in Nigerian Quoted Firms.Journal of Social
Science, 8(1), 61-76.
Afza, T., &Hussain, A. (2011). Determinants of Capital Structure across Selected
Manufacturing Sectors of Pakistan.Journal of Humanities and Social Science,
1(12), 254-262.
Akhtar, S. (2005). The Determinants of Capital Structure for Australian Multinational
and Domestic Corporations. Journal of Management, 30(2), 321-341.
Akhtar, S., & Oliver, B. (2009). Determinants of Capital Structure for Japanese
Multinational and Domestic Corporations.International Review of Finance,
9(1-2), 1-26.
Ali, A. (2011). Testing Static Trade Off Theory (A Case of Manufacturing Industries
in Pakistan). Journal of Contemporary Research In Business, 2(12), 870-876.
Anderson, R. W. (2002). Capital Structure, Firm Liquidity and Growth. National
Bank of Belgium, Working Paper Research No. 27.
Ang, J. S. & Cox, D. R. (1997). Controlling The Agency Cost of Insider Trading.
Journal of Financial and Strategic Decisions, 10(1), 15-26.
Antoniou, A., Guney, G., &Paudyal, K. (2008). The Determinants of Capital
Structure: Capital Market Oriented versus Bank Oriented Institutions. Journal
of Financial and Quantitative Analysis, 43 (1), 59-92.
The Determinants of Capital Structure for Firms in Construction and Materials Sector of Malaysia
Page 99 of 117
Ashton, D. J. (1989).The Cost of Capital and the Imputation Tax System. Journal of
Business Finance & Accounting, 16(1), 75-88.
Awan, H. M., Bhatti, M. I., Ali. R., &Qureshi, A. (2010). How growth opportunities
are related to corporate leverage decisions? Investment Management and
Financial Innovations, 7 (1), 90-97.
Bagley, C. N., &Yaari, U. (1996). Financial leverage strategy with transaction costs.
Applied Mathematical Finance, 3, 191-208.
Baharuddin, N. S., Khamis, Z., Wan Mahmood, W. M., &Dollah, H. (2011).
Determinants of Capital Structure for Listed Construction Companies in
Malaysia.Journalof Applied Finance & Banking, 1(2), 115-132.
Baker, M., &Wurgler, J. (2002).Market Timing and Capital Structure. Journal of
Finance, 57(1), 1-32.
Bank Negara Malaysia.(2005-2009). Annual Report. Kuala Lumpur, Malaysia.
Barclay, M. J., & Smith, C. W. (1995).The Maturity Structure of Corporate Debt.
Journal of Finance, 50(2), 609-631.
Barnea, A., Haugen, R. A., &Senbet, L. W. (1980). A Rationale for Debt Maturity
Structure and Call Provisions in the Agency Theoretic Framework. Journal of
Finance, 35(5), 1223-1234.
Bauer, P. (2004). Determinants of Capital Structure Empirical Evidence from the
Czech Republic. Journal of Economics and Finance, 54, 2-21.
Besley, S., & Brigham, E. F. (2012).Principles of Finance. Ohio, USA:
CengageLearning.
Berger, A. N., &Udell, G. F. (1998). The Economics of Small Business Finance: The
Roles of Private Equity and Debt Markets in the Financial Growth
Cycle.Journal of Banking and Finance, 22, 1-52.
Bevan, A. A., &Danbolt, J. (2002). Capital Structure and its Determinants in the
United Kingdom a Decompositional Analysis. Journal of Financial
Economics, 12(3), 159-170.

The Determinants of Capital Structure for Firms in Construction and Materials Sector of Malaysia
Page 100 of 117
Booth, L., Aivazian, V., Demirguc-Kunt, A., &Maksimovic, V. (2001). Capital
Structures in Developing Countries.Journal of Finance 56(1), 87-130.
Brealey, R. A., & Myers, S. (2002). Principles of Corporate Finance.7 edition. New
York: McGraw-Hill.
Broemmel, M. (n.d.).The Advantages of Short- Term Debt.Demand Media. Retrieved
March 10, 2012, from http://smallbusiness.chron.com/advantages-short-term-
debt-2038.html
Brϋderl, J. (2005). Panel Data Analysis. Retrieved January 2, 2012, from
http://www2.sowi.unimannheim.de/lsssm/veranst/Panelanalyse.pdf
Capital Market in Malaysia. (2009, November). Retrieved September 24, 2011, from
http://www.tradechakra.com/economy/malaysia/capital-market-in-malaysia-1
67.php
Coleman, S. (2000). Small Structure in Small Manufacturing Firms: Evidence from
the Data. Journal of Entrepreneurial Finance & Business Ventures, 11(3),
106-122.
Construction and Building Materials Industry (n.d.). Retrieved January 10, 2012 from
http://www.qfinance.com/sector-profiles/construction-and-building-materials
Črnigoj, M., &Mramor, D. (2009). Determinants of Capital Structure in Emerging
European Economies: Evidence from Slovenian Firms. Emerging Markets
Finance & Trade, 45(1), 72-89.
Crutchley, C. and Robert, H. (1989). A Test of the Agency Theory of Managerial
Ownership, Corporate Leverage, and Corporate Dividends. Financial
Management, 18, 36-46.
David, A (2004). Capital Structure for Entrepreneur. Retrieved July 27, 2011, from
http://www.buildastrongeramerica.com/~/media/Files/Resource%20Center/Co
mmunities/Entrepreneurship/Capital%20Structures%20for%20Entrepreneurs.
DeAngelo, H. and Masulis, R. W. (1980). Optimal Capital Structure Under Corporate
and Personal Taxation. Journal of Financial Economics, 8(1), 3-29.

The Determinants of Capital Structure for Firms in Construction and Materials Sector of Malaysia
Page 101 of 117
Debt Financing (n.d.). Retrieved March 11, 2012, from http://www.dealflow.org.sg/
cms/services/financing_for_smes_debt_financing.asp
Degryse, H., Goeij, P., &Kappert, P. (2009). The Impact of Firm and Industry
Characteristics on Small Firms‟ Capital Structure: Evidence from Dutch Panel
Data. European Banking Center Discussion Paper, No. 2009-03.
Doan, N. P. A., & Nguyen, J. D. K (2011, June).Firm Characteristics, Capital
Structure and Operational Performance: a Vietnamese Study. Paper presented
at the Conference on APEA 2011, Pusan National University, Busan, Korea.
Donaldson, G. (1961). Corporate Debt Capacity: A Study of Corporate Debt Policy
and the Determination of Corporate Debt Capacity. Boston: Division of
Research, Graduate School of Business Administration, Harvard University.
Drobetz, W. and Fix, F. (2003). What are the Determinants of the Capital Structure?
Some Evidence for Switzerland. University of Basel.WWZ/Departament of
Finance, Working Paper No. 4/03.
Eckert, S. & Engelhard, J. (1999). Towards a Capital Structure Theory for the
Multinational Company. Management International Review, 39(2), 105-135.
Fama, E. F., & French, K. R. (2002). Testing Trade-off and Pecking Order
Predictions About Dividends and Debt. Journal of Economics and Social
Sciences, 15(1), 1-33.
Fama, E. F., & French, K. R. (2004). Financing Decisions: Who Issues Stock?
Journal of Financial Economics, 76(3), 549-582.
Fatma, B. M. &Chichti, J. (2011). Interactions between Free Cash Flow, Debt Policy
and Structure of Governance: Three Stage Least Square Simultaneous Model
Approach. Journal of Management Research, 3(2), 1-34.
Feri, M. G. & Jones, W. H. (1979). Determinants of Financial Structures: A New
Methodological Approach. Journal of Finance, 34(3), 631-644.
Flannery, M. J. (1986). Asymmetric Information and Risky Debt Maturity Choice.
Journal of Finance, 41(1), 19-37.
Free stock prices, quotes, stock charts, market news, streaming real- time stock
quotes (2011). Retrieved February 20, 2012, from http://asia.advfn.com/

The Determinants of Capital Structure for Firms in Construction and Materials Sector of Malaysia
Page 102 of 117
Friend, I. and Lang, L. (1988). An Empirical Test of the Impact of Managerial Self-
interest on Corporate Capital Structure. Journal of Finance, 43, 271-281.
Gaud, P., Jani, E., Hoesli, M., & Bender, A. (2003). The Capital Structure of Swiss
Companies: An Empirical Analysis UsingDynamic Panel Data. European
Financial Management, 11 (1), 51-69.
Getzmann, A., Lang, S., &Spremann,.K. (2010). Determinants of the target capital
structure and adjustment speed- evidence from Asian capital markets.
European Financial Management, 14(2), 347-373.
Goyal, V. K., Lehn, K., &Racic, S. (2002). Growth Opportunities and Corporate Debt
Policy: The Case of the US Defense Industry. Journal of Financial Economics,
64(1), 35-59.
Hall, G. C., Hutchinson, P. J., &Michaelas, H. N. (2004). Determinants of the Capital
Structures of European SMEs. Journal of Business Finance & Accounting,
31(5-6), 711-728.
Harris, M., &Raviv, A. (1991).The Theory of Capital Structure. Journal of Finance,
46(1), 297-355.
Ibrahim, H., &Masron, T. A. (2011).Capital Structure and the Firm Determinants:
Evidence from Small and Medium Enterprises (SMEs) in Malaysia. Paper
presented at 2011 International Conference on Economics, Trade and
Development, Singapore.
Janbaz, M. (2010). Capital Structure Decisions in the Iranian Corporate Sector.
International Research Journal of Finance and Economics, (58), 24-31.
Jensen, M. C. (1988). Takeovers: Their Causes and Consequences. Journal of
Economics Perspectives, 2(1), 21-48.
Jensen, M. C., &Meckling, W. H. (1976). Theory of Firm: Managerial Behavior,
Agency Costs and Ownership Structure.Journal of Financial Economics, 3(4),
305-360.
Jong, A., Kabir, R., & Nguyen, T. T. (2008). Capital structure around the world: the
roles of firm- and country –specific determinants. Journal of Banking
&Finanace, 32(9), 1954-1969.

The Determinants of Capital Structure for Firms in Construction and Materials Sector of Malaysia
Page 103 of 117
Jun, S. G. and Jen, F. C. (2003). „Trade-Off Model on Debt Maturity Structure‟.
Review of Quantitative Finance and Accounting, 20(1), 5–34.
Kale, J. R., &Noe, T. H.(1990). Risky Debt Maturity Choice in a Sequential Game
Equilibrium.Journal of Financial Research, 13(2), 155-165.
Kazemi, M., & Ansari, Z. (2012). The Impact of Firm Characteristics on Capital
Structure of Listed Companies in Tehran Stock Exchange. Journal of
Scientific Research, (42), 12-23.
Kazerooni, E. A. (2001). Population and Sample. American Journal of Roentgenology,
(177), 993-999.
Kouki, M., & Said, H. B. (2012). Capital Structure Determinants: New Evidence
from French Panel Data. Journal of Business and Management, 7(1), 214-229.
Kraus, A., &Litzenberger, R. H. (1973). A State- Preference Model of Optimal
Financial Leverage.Journal of Finance, 28(4), 911-922.
Leary, M. T., & Roberts, M. R. (2010). The pecking order, debt capacity, and
information asymmetry. Journal of Financial Economics, 95, 332-355.
Lee, L. (2012, February 7). Improved sentiment seen for major banks. The StarBiz, pp.
4.
Mann, S. V., &Sicherman, N. W. (1991). The Agency Costs of Free Cash Flow:
Acquisition Activity and Equity Issues.Journal of Business, 64(2), 213-227.
Marimuthu, M. (2009).Corporate Restructuring, Firm Characteristics. Journal of
Business and Management, 4(1), 123-131.
Marsh, P. (1982). The Choice Between Equity and Debt: An Empirical Study.
Journal of Finance, 37(1), 121-144.
Mayers, D., & Smith, C. W. (1987). Corporate Insurance and the Underinvestment
Problem.Journal of Risk and Insurance, 54(1), 45-54.
Mazur, K. (2007). The Determinants of Capital Structure Choice: Evidence from
Polish Companies. International Advances in Economic Research, 13(4), 495-
514.

The Determinants of Capital Structure for Firms in Construction and Materials Sector of Malaysia
Page 104 of 117
Modigliani, F. & Miller, M. H. (1958). The Cost of Capital, Corporation Finance and
The Theory of Investment. American Economic Review, 48(3), 261-297.
Modigliani, F. & Miller, M. H. (1963). Corporate Income Taxes and the Cost of
Capital: A Correction. American Economic Review, 53(3), 433-443.
Mohamed Yunos, R. (2002). Determinants of Capital Structure of the Property
Companies in Malaysia.Master‟s Dissertation, University of Technology,
Shah Alam, Malaysia.
Morellec, E. (2001). Asset liquidity, capital structure, and secured debt. Journal of
Financial Economics 61, 173-206.
Myers, S. C. (1977). Determinants of Corporate Borrowing. Journal of Financial
Economics 5, 147-175.
Myers, S. C. (1984). Capital Structure Puzzle. Journal of Finance, 39(3), 575-592.
Myers, S. C. (1993). Still Searching for Optimal Capital Structure. Journal of
Applied Corporate Finance, 1(6), 4-14.
Myers, S. C. (2001). Capital Structure. Journal of Economics Perspectives, 15(2), 81-
102.
Myers, S. C., &Majluf, N. S. (1984). Corporate Financing and Investment Decisions
When Firms Have Informational that Investors Do Not Have. Journal of
Financial Economics, 13(2), 187-221.
Myers, S. C., &Rajan, R. G. (1998).The Paradox of Liquidity.Journal of Economics,
113(3), 733-771.
Najjar, N., &Petrov, K. (2011). Capital Structure of Insurance Companies in Bahrain.
Journal of Business and Management, 6 (11), 138-145.
Niu, X. Y. (2008). Theoretical and Practical Review of Capital Structure and its
Determinants.Journal of Business and Management, 3(3), 133-139.
Nunes, P. J. M., &Serrassqueiro, Z. M. (2007). Capital Structure of Portugese Service
Industries: A Panel Data Analysis. Journal of Service Industry, 27(5), 549-561.

The Determinants of Capital Structure for Firms in Construction and Materials Sector of Malaysia
Page 105 of 117
Ong, T. S., &Teh, B. H. (2011). Capital Structure and Corporate Performance of
Malaysia Construction Sector.Journal of Humanities and Social Science, 1(2),
28-36.
Örtqvist, D., Masli, E. K., Rahman, S. F., &Selvarajah, C. (2006). Determinants of
Capital Structure in New Ventures: Evidence From Swedish Longitudinal
Data. Journal of Developmental Entrepreneurship, 11(4), 277-296.
Pandey, I. M. (2001). Capital Structure and the Firm Characteristics: Evidence from
an Emerging Market. Indian Institute of Management Ahmedabad, Working
Paper Series, No. 2001-10-04.
Pandey, I. M. (2004). Capital Structure, Profitability and Market Structure: Evidence
from Malaysia. Journal of Economics & Business, 8(2), 78-91.
Patel, H. M. (2009). Capital Structure Decisions in Emerging Markets: An Inquiry
into the Capital Structure of Group & Non- Group Affiliated Firms in
India. Partial Fulfillment Undergraduate degree‟s thesis, Leonard N.
Stern School of Business New York University.
Petersen, M. A., and Raghuram G. R. (1994). The benefits of firm-creditor
relationships: Evidence from small-business data. Journal of Finance, 49, 3-
37.
Pratomo, W.A., & Ismail, A. G. (2006). Islamic Bank Performance and Capital
Structure.University Library of Munich, Germany, MPRA Paper No. 6012.
Qiu, M., & La, B. (2010). Firm Characteristics as Determinants of Capital Structures
in Australia. Journal of the Economics of Business, 17(3), 277-287.
Rajan, R. G., &Zingales, L. (1995). What Do We Know about Capital Structure?
Some Evidence from International Data.Journal of Finance 50(5), 1421-1460.
Rafiq, M., Iqbal, A., &Atiq, M. (2008). The Determinants of Capital Structure of the
Chemical Industry in Pakistan.Journal of Economics 13(1), 139-158.
Rasiah, D., &Peong, K. K. (2011). A Theoretical Review on the use of the Static
Trade off Theory, the Pecking Order Theory and the Agency Cost Theory of
Capital Structure.Journal of Finance and Economics, 63, 151-159.

The Determinants of Capital Structure for Firms in Construction and Materials Sector of Malaysia
Page 106 of 117
Rocca, M. L., Rocca, T. L., &Gerace, D. (2008). A survey of the relation between
capital structure and corporate strategy. Journal of Australasian Accounting
Business and Finance, 2(2), 1-18.
Ross, S. A., Westerfield, R. W., & Jordan, B. D. (2003).Fundamental of Corporate
Finance.(6th
edition). New York: McGraw- Hill.
Ross, S. A., Westerfield, R., & Jordan, B. D. (2008).Modern Financial
Management.(8th
edition). New York: McGraw Hill.
Sahudin, Z., Wan Mahmood, W. M., Ismail, F., Pardi, F., Aziz, A., &Sahudin, M. A.
(2011). Debt Structure for Malaysian Construction Companies: Evidence from
Panel Data Analysis. Journal of Economics and Management Sciences, 1(3),
1-7.
Salami, K. A., & Mohammed, I. (2011). An Assessment of the Static Trade-off
Theory of Capital Structure Using Ghana Stock Market Data.Journal of
Management Policy and Practice, 12(6), 81-89.
Sarif, E. (2011, March 18). Malaysia‟s capital market crosses RM2tril .The Star
Business Online. Retrieved September 22, 2011, from
http://biz.thestar.com.my/news/story.asp?file=/2011/3/18/business/8291539&
sec=business
Saunders, M., Lewis, P., &Thornhill, A. (2009).Research methods for business
students (5th
edition). England: Pearson Education Limited.
Sayιlgan, G., Karabacak, H., &Kϋҫϋkkocaoǧlu, G. (2006). The Firm- Specific
Determinants of Corporate Capital Structure: Evidence from Turkish Panel
Data. Investment Management and Financial Innovations, 3(3), 125-139.
Scholes, M. S., &Wolfson, M. A. (1988). The Cost of Capital and Changes in Tax
Regimes, in H. J. Aaron, H. Galper and J. A. Pechman (eds.), Uneasy
Compromise: Problems of Hybrid Income- Consumption Tax,Washinton, DC:
Brookings Institution.
Sen, M., &Oruc, E. (2008). Testing of Pecking Order Theory in ISE (Istanbul Stock
Exchange Market).Journal of Finance and Economics, 21, 20-26.
Shleifer, A. and Vishny, R. W. (1992).Liquidation Values and Debt Capacity: A
Market Equilibrium Approach.Journal of Finance, 47(4), 1343-1366.

The Determinants of Capital Structure for Firms in Construction and Materials Sector of Malaysia
Page 107 of 117
Shyam- Sunder, L., & Myers, S. (1999). Testing static tradeoff against pecking order
models of capital structure. Journal of Financial Economics, 51, 219-224.
Sibilkov, V. (2009).Asset Liquidity and Capital Structure.Journal of Financial and
Quantitative Analysis, 44(5), 1173-1196.
Singhania, M., & Seth, A. (2010). Financial Leverage and Investment Opportunities
in India: An Empirical Study. International Research Journal of Finance and
Economics, 40 (2010), 215-226.
Skowroński, A. (2002). Factors affecting the capital structure of Polish enterprises,
13-73. Poznan: Publisher University of Economics.
Song, H. S. (2005). Capital Structure Determinants: An Empirical Study of Swedish
Companies. The Royal Institute of Technology: Centre of Excellence for
Science and Innovation Studies. Electronic Working Paper Series, Paper No.
25.
Suhaila, Kila, M., Mahmood, W., &Mansor, W. (2008). Capital Structure and Firm
Characteristics: Some Evidence from Malaysian Companies. University
Library of Munich, Germany, MPRA Paper No. 14616.
Taleb, G., &Shubiri, F. N. (2011).Capital Structure Decisions and Debt Maturity
Structure: An Empirical Evidence from Jordan. Journal of Commerce, 3(4),
49-60.
Teker, D., Tasseven O., &Tukel A. (2009). Determinants of Capital Structure for
Turkish Firms: A Panel Data Analysis. Journal of Finance and Economics,
(29), 179-187.
Teruel, P. J., & Solano, P. (2007).Short- Term Debt in Spanish SMEs. Journal of
Small Business, 25(6), 579-602.
Thian, C. L. (2012). Determinants of Capital Structure Empirical Evidence from
Financial Services Listed Firms in China. Journal of Economics and Finance,
4(3), 191-203.
Titman, S., &Wessels, R. (1988).The Determinants of Capital Structure Choice.
Journal of Finance, 43(1), 1-19.

The Determinants of Capital Structure for Firms in Construction and Materials Sector of Malaysia
Page 108 of 117
Vries, A. (2010). The Effect of Firm Charateristics and Economics Factors on the
Capital Structure of South African Listed Industrial Firms. Degree of Master
of Commerce thesis, University of Stellenbosch.
Wan Ismail, W. M. (2005).Capital Structure of Malaysian Listed
Companies.Master‟s Dissertation, Universiti Utara Malaysia.
Wan Mahmood, W. M., Baharuddin, N. S., Mohamad, Z., &Shamsudin, N.
(2011).Capital Structure of Property Companies in Malaysia. Journal of
Finance and Economics, (74), 198-206.
Warner, J. B. (1977). Bankruptcy Costs: Some Evidence. Journal of Finance,
32(2), 337-347.
Williamson, O. E. (1988). Corporate Finance and Corporate Governance.Journal of
Finance, 43(3), 567-591.
Zenovia, G. M., &Anca, B. (2009, November).Theoretical Aspects of Firms
Financing Decisions.Paper presented at The International Conference on
Economics and Administration, University of Bucharest, Romania.
Zikmund, W. G. (2003). Business Research Method.(7th
edition). Ohio: Thomson
Learining: A Skill Building Approach (4th
edition). New York: Wiley.
Zikmund, W.G., Babin, B.J., Carr, J.C., & Griffin M. (2010). Business research
methods. (8th ed.). Canada: South-Western, Cengage Learning

The Determinants of Capital Structure for Firms in Construction and Materials Sector of Malaysia
Page 109 of 117
LIST OF APPENDICES
Appendix 3.1: Names of 92 Firms in Our Sample
92 Firms in Construction and Materials Sector
1. AHMAD ZAKI RES
2. AJIYA BERHAD
3. ASTINO BERHAD
4. ATURMAJU RESRCS BHD
5. B.I.G. INDUSTRIES
6. BINA DARULAMAN BHD
7. BINA GOODYEAR BERHAD
8. BINA PURI HOLDINGS
9. BINTAI KINDEN CORP
10. BREM HOLDING BERHAD
11. BTM RESOURCES BHD
12. CAHYA MATA SARAWAK
13. CHUAN HUAT RESOURCES
14. CONCRETE ENGINEERING
15. CREST BUILDER HLDGS
16. CYMAO HOLDINGS BHD
17. DKLS INDUSTRIES
18. DOLOMITE CORPORATION
19. DOMINANT ENTERPRISE
20. DPS RESOURCES BHD
21. ECOFIRST CONSO BHD
22. EKOVEST BERHAD
23. EKOWOOD INTN'L BHD
24. ENGTEX GROUP BHD
25. EVERGREEN FIBREBOARD
26. FAJARBARU BUILD
27. FUTUTECH BERHAD

The Determinants of Capital Structure for Firms in Construction and Materials Sector of Malaysia
Page 110 of 117
28. GADANG HOLDINGS
29. GAMUDA BERHAD
30. GOH BAN HUAT BERHAD
31. GOLDEN PHAROS BERHAD
32. HEVEABOARD BERHAD
33. HO HUP CONSTRUCTION
34. HOCK SENG LEE BERHAD
35. IJM CORPORATION BHD
36. IREKA CORPORATION
37. JAVA BERHAD
38. KIA LIM BERHAD
39. KIM HIN INDUSTRY BHD
40. KPS CONSORTIUM BHD
41. KUMPULAN EUROPLUS
42. KUMPULAN JETSON BHD
43. LAFARGE MALAYAN
44. LEBAR DAUN BERHAD
45. LEWEKO RESOURCES BHD
46. LIEN HOE CORPORATION
47. MAJOR TEAM HOLDINGS
48. MALAYSIAN RESOURCES
49. MERCURY INDUSTRIES
50. MERGE ENERGY BERHAD
51. MIECO CHIPBOARD
52. MITHRIL BHD
53. MITRAJAYA HOLDINGS
54. MTD ACPI ENG BHD
55. MUDAJAYA GROUP BHD
56. MUHIBBAH ENGINEERING
57. MULTI-USAGE HOLDINGS

The Determinants of Capital Structure for Firms in Construction and Materials Sector of Malaysia
Page 111 of 117
58. NAIM HOLDINGS BERHAD
59. NWP HOLDINGS BERHAD
60. OCTAGON CONSOL
61. OKA CORPORATION BHD
62. PAHANCO CORP BHD
63. PINTARAS JAYA BERHAD
64. PJ DEVELOPMENT HLDGS
65. PJI HOLDINGS BHD
66. PLB ENGINEERING
67. PRICEWORTH INTERNAT
68. PROTASCO BHD
69. QUALITY CONCRETE
70. ROCK CHEMICAL
71. SARAWAK CONSOLIDATED
72. SEACERA TILES BHD
73. SELOGA HOLDINGS BHD
74. SKB SHUTTERS CORP
75. STONE MASTER CORPOR
76. SYCAL VENTURES
77. TASEK CORPORATION
78. TEBRAU TEGUH BHD
79. TRC SYNERGY BHD
80. TRIPLC BHD
81. TSR CAPITAL BHD
82. UAC BERHAD
83. UNITED U-LI CORPOR
84. VTI VINTAGE BERHAD
85. WCT BERHAD
86. WHITE HORSE BERHAD
87. WOODLANDOR HOLDINGS

The Determinants of Capital Structure for Firms in Construction and Materials Sector of Malaysia
Page 112 of 117
88. WTK HOLDINGS BHD
89. YI-LAI BHD
90. YTL CEMENT BERHAD
91. ZECON BERHAD
92. ZELAN BHD
Firms Eliminated
93. BENALEC HOLDING BHD
94. BOILERMECH HOLD
95. GEFUNG HOLDINGS BHD
96. HOCK HENG STONE
97. JMR CONGLOMERATION
98. KIMLUN CORPORATION
99. MALTON BHD
100. MELATI EHSAN HOLD
101. PANSAR BHD
102. RESINTECH BHD
103. SPK-SENTOSA CORP
104. SUPERLON HOLDINGS
105. PRINSIPTEK CORP BHD
106. ARK RESOURCES BHD

The Determinants of Capital Structure for Firms in Construction and Materials Sector of Malaysia
Page 113 of 117
Appendix 4.1 : Panel Data Regression Analysis of Short-term Debt from
Eview
Dependent Variable: SDEBT
Method: Panel Least Squares
Date: 03/09/12 Time: 15:53
Sample: 2005 2009
Periods included: 5
Cross-sections included: 92
Total panel (balanced) observations: 460
Variable Coefficient Std. Error t-Statistic Prob.
SIZE -0.011409 0.014948 -0.763241 0.4457
TAN -0.034184 0.040546 -0.843082 0.3996
PRO -0.339097 0.105613 -3.210755 0.0014
NDTS -0.400961 0.408238 -0.982176 0.3265
GRO 0.000343 0.003740 0.091726 0.9270
LIQ -0.027484 0.003231 -8.506532 0.0000
C 0.298504 0.082552 3.615969 0.0003
R-squared 0.198970 Mean dependent var 0.145157
Adjusted R-squared 0.188361 S.D. dependent var 0.156461
S.E. of regression 0.140957 Akaike info criterion -1.065622
Sum squared resid 9.000609 Schwarz criterion -1.002756
Log likelihood 252.0932 Hannan-Quinn criter. -1.040867
F-statistic 18.75370 Durbin-Watson stat 0.603388
Prob(F-statistic) 0.000000

The Determinants of Capital Structure for Firms in Construction and Materials Sector of Malaysia
Page 114 of 117
Appendix 4.2 : Panel Data Regression Analysis of Long-term Debt from
Eview
Dependent Variable: LDEBT
Method: Panel Least Squares
Date: 03/09/12 Time: 15:53
Sample: 2005 2009
Periods included: 5
Cross-sections included: 92
Total panel (balanced) observations: 460
Variable Coefficient Std. Error t-Statistic Prob.
SIZE 0.019240 0.013287 1.448020 0.1483
TAN 0.196143 0.036042 5.442145 0.0000
PRO -0.191040 0.093879 -2.034958 0.0424
NDTS -0.860958 0.362881 -2.372566 0.0181
GRO -0.000758 0.003325 -0.228109 0.8197
LIQ -0.008900 0.002872 -3.098958 0.0021
C -0.022948 0.073380 -0.312727 0.7546
R-squared 0.117397 Mean dependent var 0.095119
Adjusted R-squared 0.105707 S.D. dependent var 0.132494
S.E. of regression 0.125296 Akaike info criterion -1.301174
Sum squared resid 7.111694 Schwarz criterion -1.238308
Log likelihood 306.2700 Hannan-Quinn criter. -1.276419
F-statistic 10.04240 Durbin-Watson stat 0.615034
Prob(F-statistic) 0.000000

The Determinants of Capital Structure for Firms in Construction and Materials Sector of Malaysia
Page 115 of 117
Appendix 4.3 : Panel Data Regression Analysis of Total Debt from Eview
Dependent Variable: TDEBT
Method: Panel Least Squares
Date: 03/09/12 Time: 15:54
Sample: 2005 2009
Periods included: 5
Cross-sections included: 92
Total panel (balanced) observations: 460
Variable Coefficient Std. Error t-Statistic Prob.
SIZE 0.007831 0.018122 0.432145 0.6658
TAN 0.161958 0.049158 3.294659 0.0011
PRO -0.530140 0.128044 -4.140306 0.0000
NDTS -1.261899 0.494942 -2.549592 0.0111
GRO -0.000415 0.004534 -0.091589 0.9271
LIQ -0.036384 0.003917 -9.288447 0.0000
C 0.275554 0.100084 2.753213 0.0061
R-squared 0.274751 Mean dependent var 0.240276
Adjusted R-squared 0.265145 S.D. dependent var 0.199355
S.E. of regression 0.170894 Akaike info criterion -0.680443
Sum squared resid 13.22979 Schwarz criterion -0.617577
Log likelihood 163.5019 Hannan-Quinn criter. -0.655688
F-statistic 28.60218 Durbin-Watson stat 0.324420
Prob(F-statistic) 0.000000

The Determinants of Capital Structure for Firms in Construction and Materials Sector of Malaysia
Page 116 of 117
Appendix 4.4 : Descriptive Analysis from Eview
SIZE TAN PRO NDTS GRO LIQ SDEBT LDEBT TDEBT
Mean 5.224118 0.326354 0.025132 0.023991 0.147522 2.346805 0.145157 0.095119 0.240276
Median 5.207883 0.296044 0.028546 0.019801 0.024350 1.642328 0.115489 0.045358 0.230888
Maximum 6.790207 0.873267 0.229855 0.126149 37.85520 16.38900 1.812475 0.981193 1.830516
Minimum 3.810971 0.008795 -0.343013 -0.000414 -0.973000 0.151405 0.000000 0.000000 0.000000
Std. Dev. 0.534461 0.196633 0.073477 0.019161 1.790311 2.194470 0.156461 0.132494 0.199355
Skewness 0.081061 0.657344 -0.658529 1.320018 20.42445 2.721763 4.671561 2.771348 2.284857
Kurtosis 3.019211 2.895541 4.846085 5.607850 429.8008 12.06647 44.99897 14.35962 16.22379
Jarque-Bera 0.510837 33.33690 98.56787 263.9380 3523361. 2143.463 35481.48 3062.115 3751.894
Probability 0.774592 0.000000 0.000000 0.000000 0.000000 0.000000 0.000000 0.000000 0.000000
Sum 2403.094 150.1227 11.56087 11.03565 67.86020 1079.530 66.77240 43.75468 110.5270
Sum Sq.
Dev. 131.1128 17.74699 2.478083 0.168518 1471.194 2210.406 11.23630 8.057634 18.24173
Observations 460 460 460 460 460 460 460 460 460

The Determinants of Capital Structure for Firms in Construction and Materials Sector of Malaysia
Page 117 of 117
Appendix 4.5 : Correlation Analysis from Eview
SIZE TAN PRO NDTS GRO LIQ SDEBT LDEBT TDEBT
SIZE 1.000000 -0.261959 0.475701 -0.195594 0.174573 -0.127202 -0.044147 -0.007728 -0.039784
TAN -0.261959 1.000000 -0.189174 0.502059 -0.089710 -0.106837 0.013552 0.244962 0.173442
PRO 0.475701 -0.189174 1.000000 -0.131563 0.048425 0.160116 -0.224730 -0.131811 -0.263980
NDTS -0.195594 0.502059 -0.131563 1.000000 -0.062562 0.135452 -0.094559 0.001069 -0.073501
GRO 0.174573 -0.089710 0.048425 -0.062562 1.000000 -0.034514 0.009641 -0.015066 -0.002446
LIQ -0.127202 -0.106837 0.160116 0.135452 -0.034514 1.000000 -0.408222 -0.221857 -0.467837
SDEBT -0.044147 0.013552 -0.224730 -0.094559 0.009641 -0.408222 1.000000 -0.055290 0.748089
LDEBT -0.007728 0.244962 -0.131811 0.001069 -0.015066 -0.221857 -0.055290 1.000000 0.621222
TDEBT -0.039784 0.173442 -0.263980 -0.073501 -0.002446 -0.467837 0.748089 0.621222 1.000000