the design of international trade agreements: introducing ... · pdf filethe design of...
TRANSCRIPT

The Design of International Trade Agreements:
Introducing a New Dataset1
Andreas Dur, University of Salzburg
Leonardo Baccini, LSE
Manfred Elsig, University of Bern
Forthcoming in the Review of International Organizations, 2014.
Abstract
Preferential trade agreements (PTAs) have been proliferating for the lasttwenty years. A large literature has studied various aspects of this phe-nomenon. Until recently, however, many large-N studies have paid only scantattention to variation across PTAs in terms of content and design. Our contri-bution to this literature is a new dataset on the design of trade agreements thatis the most comprehensive in terms of both variables coded and agreementscovered. We illustrate the dataset’s usefulness in re-visiting the questions ifand to what extent PTAs impact trade flows. The analysis shows that onaverage PTAs increase trade flows, but that this effect is largely driven bydeep agreements. In addition, we provide evidence that provisions that tacklebehind-the-border regulation matter for trade flows. The dataset’s contribu-tion is not limited to the PTA literature, however. Broader debates on topicssuch as institutional design and the legalization of international relations willalso benefit from the novel data.
Keywords: preferential trade agreements, new regionalism, institutional design,
dataset, trade flows, gravity model.
1All authors have contributed equally to the paper. We are grateful to the NCCR Trade Regu-lation (www.nccr-trade.org) for financial support and our research assistants for help in collectingthe data for this paper. Special thanks go to Karolina Milewicz for her support in the largerproject. Todd Allee, Richard Baldwin, Tim Buthe, Jappe Eckhardt, Jeff Kucik, Marcelo Olar-reaga, Ron Rogowski, Michael Zurn and participants of the ECPR Joint Sessions of Workshops atthe University of Antwerp provided helpful comments on previous versions of this paper. We alsowish to thank Raymond Hicks for kindly assembling the gravity model data. For more informationon the DESTA dataset, see www.designoftradeagreements.org.
1

Introduction
Since the early 1990s, countries across the world have signed a large number of pref-
erential trade agreements (PTAs). PTAs thus have become an important instrument
of foreign economic policy-making for nearly all governments. A substantial liter-
ature has emerged that studies various aspects of this phenomenon, known as new
regionalism (Mansfield and Milner, 1999). Until recently, however, much of this
literature failed to take account of the differences in substance and content across
PTAs. Some agreements, such as the European Union (EU) or the North American
Free Trade Agreement (NAFTA), are very broad and contain provisions that lead to
a far-reaching liberalization of markets. By contrast, other agreements are narrow
and exhibit modest commitments. Only over the last few years, have some scholars
started to pay greater attention to the scope and depth of these agreements (Este-
vadeordal et al. 2009; Haftel 2010; Hicks and Kim 2012; Kucik 2012; Mansfield and
Milner 2012).
We contribute to this emerging literature by presenting a new dataset on the de-
sign of trade agreements (DESTA) that to our knowledge is the most comprehensive
in terms of both items coded and number of agreements included. The World Trade
Organization (WTO)’s dataset on the “anatomy” of PTAs, for example, contains
information on 131 agreements with respect to 52 items (World Trade Organization
2011). The chapters in Estevadeordal et al. (2009) rely on an even smaller number
of agreements. For our dataset, by contrast, we coded 587 agreements for more
than 100 items. For instance, our dataset contains twelve variables coding intellec-
2
tual property rights; the WTO dataset one. The scope and coverage of DESTA is
a major asset when tackling questions where looking only at the most prominent
agreements leads to selection bias. This applies to both studies of the formation of
PTAs and analyses of the consequences of PTAs.
To illustrate DESTA’s potential, we revisit the literature on the PTA–trade
nexus, that is, the questions if and to what extent PTAs impact trade flows. Our
analysis produces three major findings: first, we present the so far most sophisti-
cated operationalization of the concept of depth of agreements and show that deep
agreements matter significantly more than shallow ones. Second, we corroborate
findings that PTAs have an anticipatory, short-term and long-term effect on trade
flows. Third, not only tariff cuts, but also other market access and trade-related
provisions in PTAs concerning topics such as investments and intellectual property
rights matter for trade flows. In the conclusion we look beyond the literature on
the PTA–trade nexus and suggest that the dataset is of much broader relevance
for debates in International Relations, including on the effects of legalization in
international politics and the design of international institutions.
The political economy of PTAs
With the surge of the new regionalism in the early 1990s, a vibrant literature on
PTA formation developed (for reviews of this literature, see Mansfield and Milner
1999; World Trade Organization 2011). Broadly, two types of research interests have
dominated the field: first, on why countries negotiate and sign PTAs, and second,
3
more recently, on the potential effects of being party to one or more PTAs.
The political economy literature has offered various explanations for why states
engage in PTAs. Much work has focused on arguments drawing on competition
effects among important trading nations and/or interest group mobilization and
industry and market characteristics (Baldwin 1993; Baccini and Dur 2012; Chase
2003; Dur 2007; Grossman and Helpman 1995; Manger 2009; Milner 1997). Other
prominent arguments stress the role of democratization, the distribution of power
and alliances, ambitions to use international trade institutions as instruments to
lock-in or credibly commit to specific policies, domestic veto players within political
systems, bureaucratic interests, electoral concerns, foreign direct investments, or
forum-shopping as a result of lack of progress in multilateralism (see for example
Buthe and Milner 2008; Gowa and Mansfield 1993; Hollyer and Rosendorff 2012;
Maggi and Rodriguez-Clare 2007; Mansfield and Milner 2012; Mansfield et al. 2002
and 2007; Mansfield and Reinhardt 2003).
Over time, the focus has shifted from formation to effects. PTAs as a type of
trade institution may yield effects on a multitude of economic, political and social
phenomena. For trade economists, the trade flow implications have been the key
concern (Baier and Bergstrand 2007). Political scientists have focused on a broader
set of outcomes ranging from studying trade volatility, inducing and sustaining do-
mestic economic reforms, addressing behind-the-border protectionism, or allowing
for non-trade effects, such as upholding human rights protection in PTA signatories
or reducing conflicts between PTA members (see for example, Hafner-Burton 2005;
Kono and Rickard 2014; Mansfield and Pevehouse 2000; Mansfield and Reinhardt
4

2008).
While there is thus no shortage of explanations for PTA formation and selected
outcomes, so far most of this literature suffers from lack of data on the design
of PTAs. Many studies conceptualize PTAs as a dichotomous variable, namely
whether countries sign an agreement or not, and hence treat PTAs as if they were
all equal in purpose and effect. As a proxy for design differences, some work has
controlled for different levels of trade integration (e.g., Magee 2008, customs union,
free trade agreements, partial scope agreements). Yet, few studies focus on selected
design differences (an exception is Hafner-Burton 2005), study regional specifications
(Hicks and Kim 2012) or explain functional differences in design, for example with
respect to dispute settlement (Smith 2000) and flexibility provisions (Kucik 2012).
The limited attention paid to differences in the design of trade institutions is
problematic given that PTAs clearly vary in terms of overall ambitions and commit-
ments reflected in depth of concessions and flexibility clauses or opt-outs. The logics
of signing deep or shallow agreements will differ, as the former may cause important
losses for some sectors of society. And a very narrow and shallow agreement is un-
likely to have the same consequences as a broad and deep one. Incorporating design
differences in our models should thus assist us in better understanding both why
states sign PTAs and what effects these PTAs can be expected to have. Our goal
in collecting and disseminating systematic data on the design of trade agreements
is to allow the PTA literature to take into account these differences.
5
DESTA: Description of the Dataset
We identified a total of 733 PTAs signed between 1945 and 2009 and that include
concrete steps towards the preferential liberalization of trade in goods and/or ser-
vices. The number of PTAs that we found is substantially larger than the number
of agreements covered by comparable datasets. The list maintained by the WTO
includes 356 of our agreements; 507 form part of a list held at the World Trade
Institute.2 We identified the remaining agreements via systematic searches of the
web pages of foreign ministries and other governmental institutions.3 The number
of initial memberships in these agreements is 3,659 (thus an average of 18 signed
agreements for the 201 countries covered by the dataset); moreover, in 419 instances
countries acceded after the initial signing of the agreements.
Regrettably, we have not been able to find full texts for all of the agreements and
ended up coding 587 agreements with 3,318 (initial) members for a total of 10 broad
sectors of cooperation, encompassing market access, services, investments, intellec-
tual property rights, competition, public procurement, standards, trade remedies,
non-trade issues, and dispute settlement. For each of these sectors, we coded a
significant number of items, meaning that we have well over 100 data points for
each agreement. The coding has been carried out manually by two independent
coders, with any differences resolved by a referee for the final dataset. Inter-rater
2In contrast to these lists, we did not count accession agreements, and services agreements thatare signed at the same time as goods agreements, as separate PTAs. This explains why our countof agreements notified to the WTO is smaller than the one indicated by the WTO itself.
3The additional agreements that we found were not notified to the WTO, and thus have notmade it into many of the datasets on PTAs that are based on the WTO’s PTA inventory.
6

agreement as measured by Cohen’s kappa is higher than 0.75 for nearly all variables
(with any value higher than 0.60 considered as substantial degree of agreement) and
as high as 0.85 for some variables such as those capturing the depth of services pro-
visions. Moreover, cross-checks against other datasets that have been put together
independently from ours have confirmed the reliability of our data.4
The resulting DESTA dataset is, to the best of our knowledge, the most ambi-
tious attempt at measuring the design of PTAs in terms of agreements and sectors
covered. In the following we present selected information from the dataset to illus-
trate both the range of issues covered in DESTA and its potential use and applica-
tion. The discussion also offers a description of the phenomenon of regionalism that
has characterized the international political economy for some time.
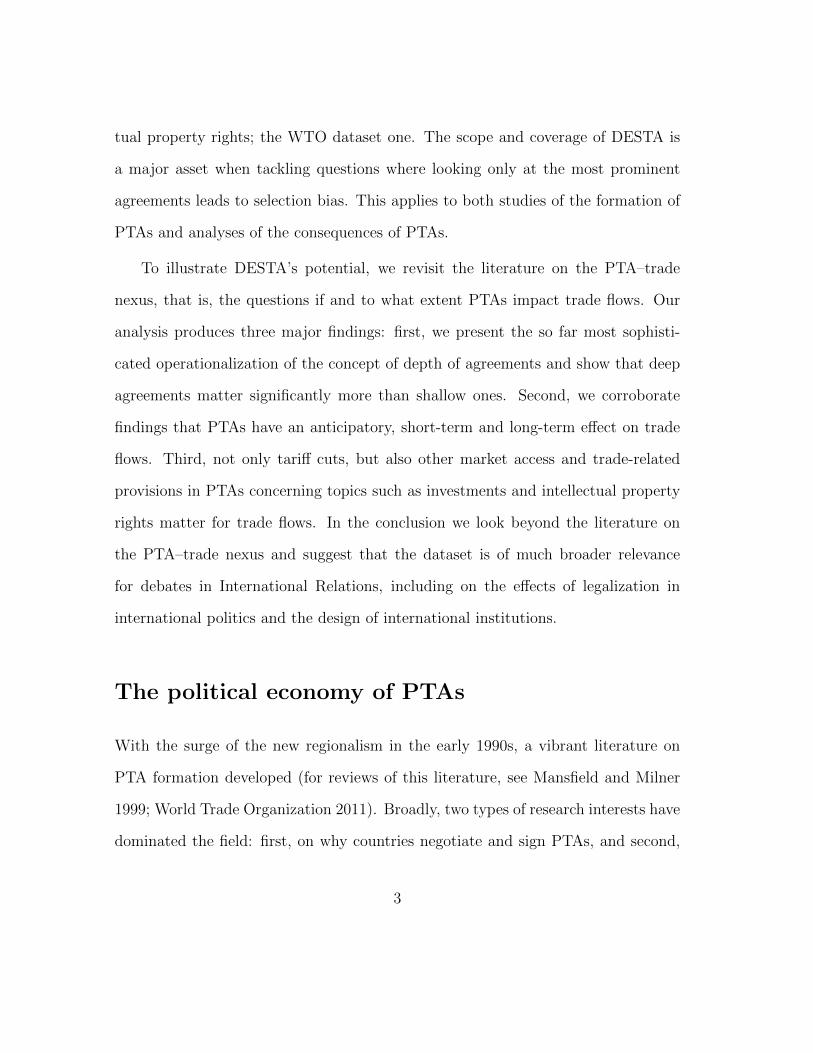
Our dataset confirms the commonly held view that countries have multiplied
their efforts to sign and ratify PTAs in recent years (see Figure 1). The tipping
point was in the early 1990s. This surge of new agreements is in particular related to
the efforts of European Union and European Free Trade Agreement (EFTA) states
to stabilize trade relations with new European democracies after the end of the
Cold War. Competition for market access motivated other countries to follow suit
(Baccini and Dur 2012; Baldwin and Jaimovich 2012) with many of the more recent
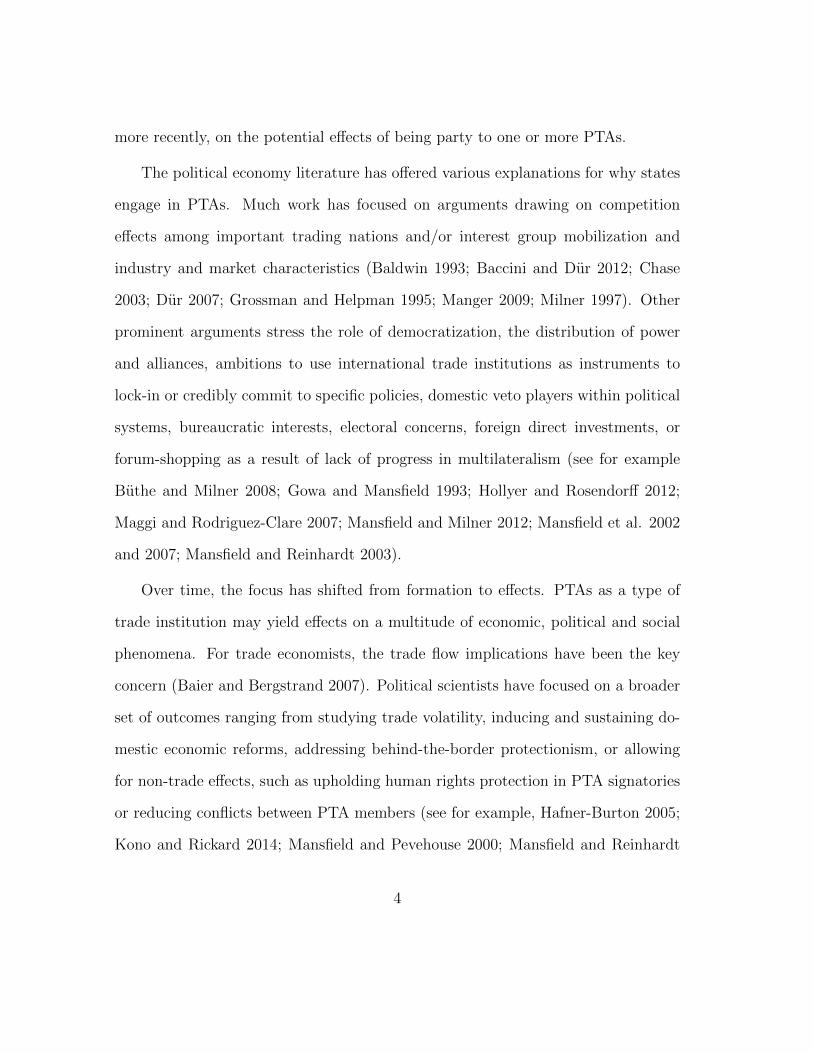
agreements being signed between emerging economies and developing countries. As
a result, while European states are still the top signatories of PTAs, most countries
in the world now are part of several active agreements (see Figure 2). In fact, with
the exception of Mongolia, all but a few tiny (island) countries have signed at least
4For these other datasets, see Estevadeordal et al. (2009) and World Trade Organization (2011).
7
one PTA since World War II. Overall, we count 393 agreements that were in force
as of 2009.
[Figure 1 about here]
[Figure 2 about here]
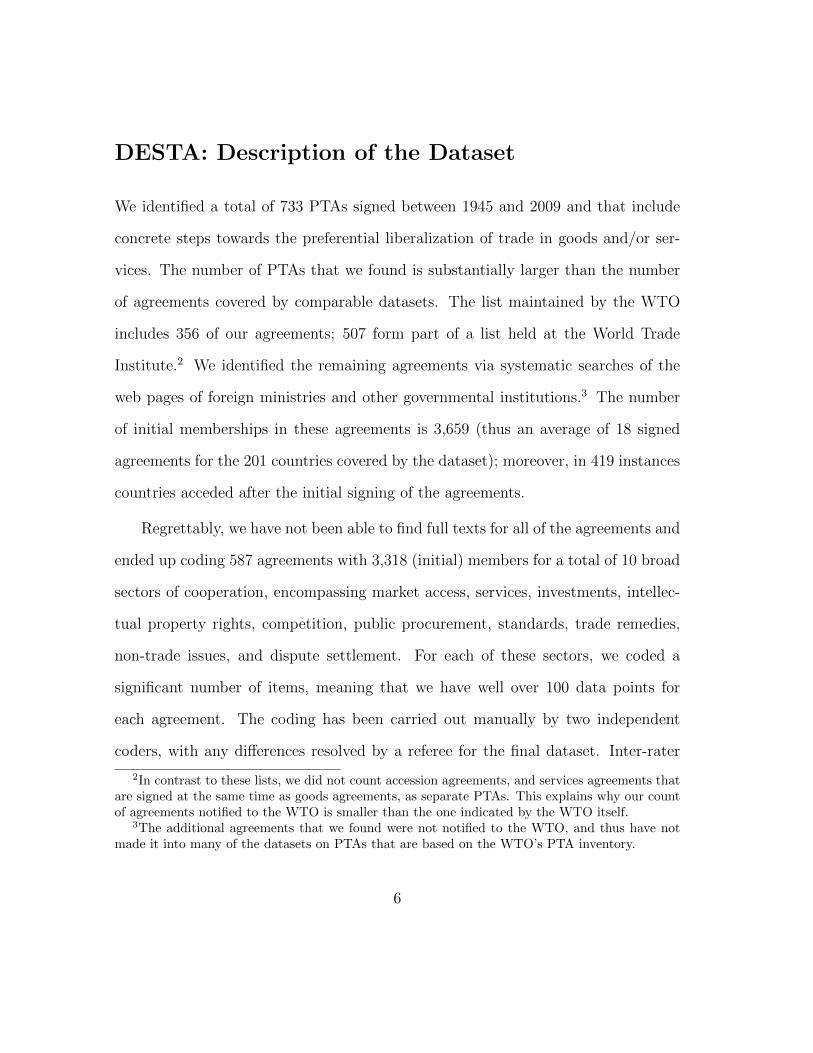
The large majority of agreements (60%) signed since 1945 are free trade agree-
ments that liberalize tariffs on a majority of goods; 29% are partial agreements that
either focus on a sector or a few products or require only limited tariff cuts; 9% are
customs unions that aspire not only to the dismantling of trade barriers and the free
flow of products but also to the establishment of a common external tariff system;
and 1% are pure services agreements (see Figure 3). In terms of actor constellation,
the most common are bilateral agreements (67%, e.g., Australia–New Zealand).
Region–country agreements (e.g., EU–Mexico) account for 17% of the agreements,
plurilateral agreements (e.g., NAFTA) for 14%, and interregional agreements (e.g.,
EFTA–South African Customs Union) for 2%. As to the geographic dimension,
agreements are still predominantly regional. Nevertheless, Figure 3 also indicates
that 27% of treaties are concluded between countries or regions that are located in
different continents (e.g., Singapore–Chile).
[Figure 3 about here]
8
Importantly, DESTA supports its own raison d’etre: the data clearly reveal that
PTAs differ considerably in terms of their contents. In Figure 4, we show the per-
centage of agreements in our dataset that contain a selected number of provisions
that we coded.5 The figure shows that while most agreements foresee safeguard
provisions, only few agreements substantively regulate intellectual property rights,
foreign direct investments, or procurement by public authorities. The differences are
even more pronounced when looking at specific provisions. In competition policy,
for example, 70% of agreements stipulate that member states may not distort com-
petition, but only two percent foresee the establishment of a common competition
authority. No fewer than 87 percent of agreements include some type of dispute
settlement provision; and 6 percent foresee the creation of a standing legal body to
adjudicate cases. Overall, PTAs exhibit major differences in design and contents.
[Figure 4 about here]
The data presented above also suggest that agreements differ in their “depth,”
defined as “the extent to which (an agreement) requires states to depart from what
they would have done in its absence” (Downs et al. 1996: 383). We use two different
measures to operationalize depth.6 On the one hand, we produce an additive index
that combines seven key provisions that can be included in PTAs (see Table 1). The
5In the online appendix, which is available at this journal’s website, we also show variation bylevel of development (Figure A-1) and across time (Figure A-2) in the inclusion in PTAs of a fewkey provisions.
6A third measure, relying on tetrachoric factor analysis and the Thurstone method to calculatefactor scores, is highly and positively correlated with the two measures we present here and producesthe same substantive findings (r=0.64 and r=0.63, respectively).
9

first provision captures whether the agreement foresees that all tariffs (with limited
exceptions) should be reduced to zero (that is, whether the aim is to create a full
free trade area). The other six provisions capture cooperation that goes beyond
tariff reductions, in areas such as services trade, investments, standards, public
procurement, competition and intellectual property rights. For each of these areas,
we code whether the agreement contains any substantive provisions. A substantive
provision, for example, is a national treatment clause in the services chapter. A
statement that the contracting parties desire to open their services markets, by
contrast, does not count as a substantive provision.
[Table 1 about here]
On the other hand, we rely on latent trait analysis on a total of 48 variables
that theoretically are related to the depth of an agreement (these variables pertain
to such aspects as services liberalization, trade-related investment measures, intel-
lectual property rights and standards) to arrive at a measure of depth.7 Latent
trait analysis is a type of factor analysis for binary data (Bartholomew et al. 2011).
Concretely, we apply the Rasch model that assumes that all items capture one un-
derlying latent dimension, but with different discriminatory power.8 Doing so allows
us to deal with highly correlated data and to account for the fact that not all items
are of equal importance in establishing the extent of countries’ commitments.
7We thus leave out all flexibility and enforcement provisions. The online appendix contains alist of all the variables used in the latent trait analysis.
8The online appendix discusses this approach and shows the extent to which each variable isrelated to the latent trait.
10

The two variables are highly correlated (r=0.90, t=48.80) and both show a
similar picture: the depth of PTAs remained relatively stable for half a century
after the end of World War II (with considerable variation across agreements), but
has increased significantly over the last twenty years (see Figure 5).9 In fact, the
thirteen agreements that receive the maximum score of seven on the additive index
measure of depth all have been signed since 2000. At the same time, however,
major variation across agreements exists at any point in time. The 1985 US–Israel
agreement, for example, has a depth index score of four, whereas two agreements that
Venezuela signed with Paraguay and Uruguay as recently as 2008 both score zero.
Our data thus support the common wisdom that agreements have become deeper
over the past twenty years; but this trend only explains a part of the variation in
depth across agreements.
[Figure 5 about here]
Substantial variation also exists in the depth of agreements signed by different
countries. Figure 6 shows the average depth by country of all agreements that were
still active as of 2009. It shows that the United States and Japan sign the deepest
agreements, whereas African countries sign the shallowest.
[Figure 6 about here]
9For the following figures we rescaled the variable resulting from latent trait analysis to have aminimum of 0 (rather than a mean of 0).
11

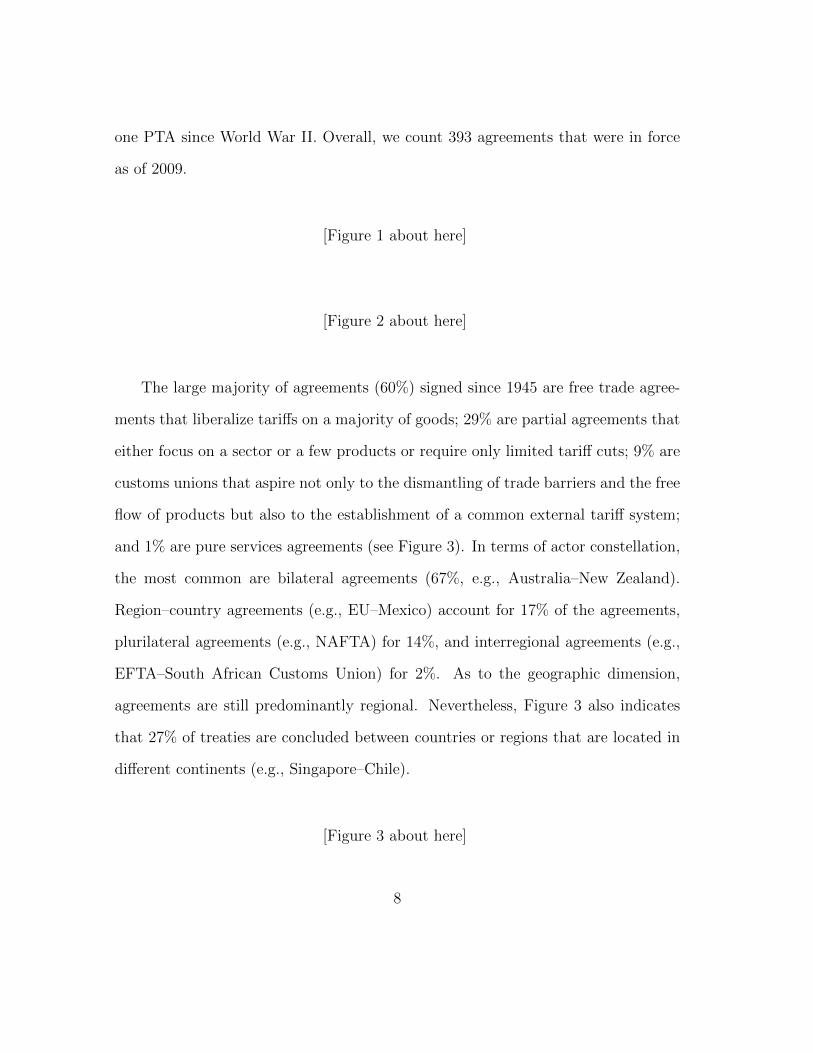
In Figure 7 we offer some more micro-evidence from our dataset. Figure 7a shows
the depth of a selected sample of plurilateral agreements, using the index scores of
depth (left) and the measure based on latent trait analysis (right). The panel shows
only moderate change over time, with most plurilateral agreements being quite shal-
low. In Figure 7b, we plot the depth of all agreements signed by Chile, a country
that has been at the forefront of the new regionalism for the last twenty years. In-
terestingly, for a single country we find large variation in the depth of agreements.
Whereas most of Chile’s agreements with other Latin American countries are shal-
low, the trans-continental agreements signed by Chile include significant obligations
for market opening.
[Figure 7 about here]
Agreement Design and the PTA–Trade Nexus
A large literature addresses the impact of trade agreements on bilateral trade flows.
Going back to Jacob Viner, much of the early research tried to measure the extent
to which individual PTAs create or divert trade (Viner 1950; Frankel 1997). Judith
Goldstein, Michael Tomz and Douglas Rivers find that PTAs tend to increase trade
(concretely, they lead to a 34% increase in trade, with this effect increasing over
time), but also recognize that “A natural extension of the research would be to code
not only the existence but also the strength of PTAs” (Goldstein et al. 2007, 51).
12
Scott Baier and Jeffrey Bergstrand, for their part, stress that PTAs are not
exogenous to trade flows and other variables that may impact trade flows (Baier
and Bergstrand 2007). When controlling for this endogeneity, the trade effect of
PTAs turns out to be much larger than previously estimated. In fact, they conclude
that PTAs double the bilateral trade of two members over a ten-year period. Baier
and Bergstrand confirm this result after using matching to account for the selection
effect of dyads with large trade flows signing PTAs (Baier and Bergstrand 2009).
More recently, attempts have been made to differentiate the effects by types of
trade agreements (partial scope agreements vs. free trade agreements vs. customs
unions, see Baier, Bergstrand and Feng 2011). Relying on WTO-notified agreements,
Magee (2008) shows that the long-run cumulative effects of customs unions (up to
18 years) are around 129%, whereas the cumulative effects for free trade agreements
are around 66%. Partial scope agreements have no statistically significant effects on
trade flows. Similary, Roy (2010) shows that customs unions increased trade by 90%
after five years in existence, whereas free trade agreements increased trade flows on
average by 25%. Magee (2008) further provides evidence that anticipatory effects
are notable in particular in the four years leading up to the actual entry into force
of the agreement.
We build on this literature to show the importance of considering the design of
trade agreements when estimating PTAs’ trade effects. Our analysis, however, relies
on a substantially higher number of agreements and a more refined measurement of
the depth of agreements (beyond simple categorizations). Even within the category
of free trade agreements, there are important differences as to the provisions to allow
13

for new or increased market access. Following from this observation, we conjecture
that various dimensions of design might matter for the PTA–trade nexus. Most
obviously, agreements differ in the extent to which they reduce tariffs. Lower tariffs
make goods cheaper and therefore more competitive in countries that are members
of the same trade agreement. As such, the larger the tariff reduction agreed upon
in a PTA, the greater the expected increase in trade.
Other PTA provisions can have a similar effect. A rule that grants national
treatment to service providers from the other member state(s), for example, should
facilitate trade in services. As much trade in goods depends on the provision of
services, services liberalization may also have a positive effect on trade in goods.
Similarly, the liberalization of government procurement policies, by enabling ex-
porters to compete for public contracts, should increase trade in goods and services.
Some agreements also foresee the mutual recognition of standards or the adoption
of international standards. In the EU–South Korea trade negotiations, for example,
the EU chief negotiator persuaded his counterpart to end the practice of demanding
national and U.S. standards in the production of cars and instead to rely completely
on international standards (Elsig and Dupont 2012). By reducing the costs of trade,
such provisions should lead to an increase in trade.
Some PTAs also liberalize investment policies or offer protection to foreign direct
investments. By doing so, they may allow member countries to attract additional for-
eign direct investments.10 These investments increase vertical intra-industry trade,
that is, trade in similar goods produced by the same industry, but differentiated by
10On the effect of PTAs on investments, see, for example, Buthe and Milner (2008).
14

the unit value of the goods. Moreover, the provisions protecting intellectual property
rights included in some PTAs may stimulate trade to the extent that they curtail
the domestic production of counterfeited goods. Finally, even competition-related
provisions can affect trade if they facilitate foreign direct investments or reduce state
aid to domestic companies. Overall, therefore, the design of an agreement should
matter for the trade effect of PTAs. Stated in the form of a hypothesis, the deeper
a PTA, the larger its positive impact on trade flows between member countries.
Econometric Strategy
The gravity model is the workhorse model to estimate the effect of a series of vari-
ables on trade flows between two countries. In its basic form, this model assumes
the amount of trade between two countries to increase along with economic size,
as measured by gross domestic product (GDP), and decrease in direct proportion
to increases in the cost of transportation between the two countries, as measured
by the geographical distance between them. Over time this basic form has been
enriched by several other variables capturing political characteristics, international
institutions, and cultural factors. We follow many previous studies in relying on
this model to estimate the effect of PTA design on trade flows (Rose 2004; Carrere
2006; Baier and Bergstrand 2007; Goldstein et al. 2007).
The analysis covers the design of 536 PTAs signed between 1945 and 2009 (we
lose some agreements because of missing values for covariates). Our unit of observa-
tion consists of up to 22,690 directed dyads comprising the 179 countries for which
15

we were able to obtain data.11 We disaggregate the EU to the member-state level
to evaluate the effect of the EU’s PTAs on trade flows between each EU member
state and all the other countries in the dataset. Formally, we estimate the following
model:
lnTradeij,t = α + β1PTAij,t−1 + β2Depthij,t−1 + β3Xij,t−1 + γij + θt + ε. (1)
where lnTrade is the dependent variable, PTA is a dummy variable capturing whether
two countries form part of a PTA at t− 1, and Depth is the main independent vari-
able. Xij are vectors of control variables, β1, β2 and β3 are the coefficients. α is
the constant and ε is the error term. γ and θ are respectively directed dyad fixed
effects (which among other things control for distance and contiguity) and year fixed
effects. While in most specifications we use yearly data, we rely on five-yearly data
when including country-year fixed effects, as otherwise the number of right-hand
side variables becomes too large.
lnTrade is measured as the log of the value of exports between two countries in
the dyad. We rely on a combination of two sources for these data, namely the In-
ternational Monetary Fund’s Direction of Trade Statistics (DOTS) and the dataset
put together by Kristian Gleditsch, to minimize the number of missing values (Di-
rection of Trade Statistics 2010; Gleditsch 2002). For Depth, we mainly rely on the
operationalization via the index described above, but also cross-check the results
11Also Baier and Bergstrand (2007) and Goldstein et al. (2007) use directed dyads. The resultsdo not change when using undirected dyads.
16
using the latent trait measure.12 Some dyads form more than one PTA; in these
cases we also analyze the impact on trade flows of the second and any subsequent
PTA. Depth thus is time varying for some dyads.
Our design variable enters the model at the date of signature of an agreement.
Opting for the date of entry into force instead does not affect our results, because
the large majority of agreements enter into force after a relatively short period
where states seek domestic ratification13 As control variables we use those commonly
included in the gravity model. Importantly, we always include the variable Depth
together with the dummy variable PTA, which captures the average effect of PTAs
on trade. Since our unit of analysis is the directed-dyad-year, we include monadic
variables for each country in the dyad. Table A-1 in the online appendix summarizes
the descriptive statistics and sources for these variables.
Baseline Analysis
Table 2 shows six models. The first model only includes the dummy variable PTA,
which does not distinguish among different designs, and a few covariates. The
sign for PTA is positive and statistically significant, confirming that on average
PTAs increase trade between members.14 The second and third models include
12We rescaled the latent trait measure to have positive values for all dyads that signed a PTA.13Of 617 agreements for which we have this information, 459 entered into force within a year of
signature and another 81 within two years of signature. Moreover, some agreements are provision-ally applied immediately after signature.
14If we add five-year and ten-year lags, the coefficients for PTA and the two lags are positiveand statistically significant. The total effect, i.e., the sum of the coefficients of PTA and its lags,is 0.34. Results are reported in Table A-3 (Model A5) in the online appendix. If we add five-yearand ten-year lags without including Depth, the total effect of PTA and its lags is 0.50.
17

Depth, first measured via the index and then via latent trait analysis. The signs
of the coefficients are positive and statistically significant at the 99 percent level,
indicating that, as expected, the design of agreements matters. The deeper a PTA,
the larger its effect on trade flows between member countries. While in the following
we only show results with Depth (index), all substantive findings remain the same
when using Depth (latent) instead. In the online appendix (see Table A-3, Models
A6 and A7), we also report models with five-year and ten-year lags of the treatment
PTA. While the total effect remains positive, the coefficient of PTA turns negative
and statistically significant. This happens because PTA and its lags are highly
collinear with Depth.
[Table 2 about here]
In Model 4 we replace Depth with eight dummy variables. For all dyads with
a value of Depth (index) that is higher than the median across all dyads, these dum-
mies are coded one in the five years prior to the signature of the PTA (Deep anticipatory);
in the five years after the signature of a PTA (Deep short − term); between five
and 15 years after the signature of a PTA (Deep middle− term); and 15 and more
years after the signature of a PTA (Deep long − term). In doing so, we are able
to estimate the effect of Depth at different points in time. Moreover, we include
Deep anticipatory as a test to see if unobserved trends drive our results.15 Simi-
15For a similar approach, see Kuziemko and Werker 2006. We also include other leads to capturean anticipatory effect between six and ten year before the signature of a PTA as well as between11 and 15 years before the signature of a PTA. Whereas our main results do not change, 15-year
18

larly, we replaced Depth (index) with four dummy variables that are operational-
ized as discussed, with the exception that they are coded one for dyads that have
a value of Depth (index) that is lower than or equal to the median across all dyads
(Shallow ...).
Seven of the eight coefficients for these dummies are positive and statistically
significant (at the 99 percent level). The negative and statistically significant co-
efficient for Shallow anticipatory suggests that shallow agreements are signed by
countries that trade with each other less than expected by the gravity model (in-
dicating that non-economic reasons may play a role in countries’ decisions to sign
shallow agreements) and that exporters find it difficult to anticipate these PTAs.
While the signs and levels of significance of control variables are in line with the
results of other studies using the gravity model, the coefficient of PTA is negative,
though it is not statistically significant. Moreover, as for Models 1, 2, and 3, we
report a model with five-year and ten-year lags of the treatment PTA in the online
appendix (Model A8 in Table A-3). Including these lags does not affect our finding
with respect to the depth of agreements. The coefficient for PTA, however, turns
out to be negative and statistically significant, even if the combined effect of PTA
and the two lags is positive. This negative sign for PTA again is best explained as
a result of the collinearity between PTA and Depth.
Table 3, which shows the effects of the main variables in Models 1 and 4 on
trade, presents several interesting results.16 First, the Deep ... dummies clearly
leads are statistically significant. Results are shown in the online appendix (Model A1 in TableA-2).
16Following Goldstein et al. (2007), we use arc elasticity, which is the appropriate way tocalculate the effect of dummies on the response variable. The arc elasticity is defined as the
19

outperform the Shallow ... dummies with the exception of the long-term effects,
which are not statistically distinct one from another. We likely underestimate the
long-term effect of deep PTAs because many of the deepest agreements have only
been signed recently, making it impossible to estimate their long-term effects. We
therefore re-ran Model 4 only considering agreements that are at least 15 years old
(see Model A2 in Table A-2 in the online appendix). In this model specification, as
expected Deep long−term by far outperforms Shallow long−term. Specifically, in
the long term trade increases by 106% for dyads with deep PTAs. Deep agreements
thus increase trade more than shallow ones.
[Table 3 about here]
Second, Model 4 also offers evidence of anticipatory effects for deep agreements.
Third, the estimated effect of the GATT/WTO is small when compared to the effect
of PTAs. We may, however, underestimate the actual effect of the GATT/WTO as
our analysis does not take into account the existence of “nonmember participants”
and formal members that opted out from obligations (Goldstein et al. 2007). Most
importantly, however, the findings show that it is not possible to correctly identify
and estimate the effect of PTAs on trade flows if deep and shallow PTAs are lumped
together.
elasticity of one variable with respect to another between two given points. As the two pointsget closer together, arc elasticity approaches point elasticity. More formally, the arc elasticity is
defined as ∆Trade/Trade∆PTA/PTA (Goldstein et al. 2007, 47).
20

In Models 5 and 6 in Table 2, we follow Baier and Bergstrand (2007) to better
account for the endogeneity coming from omitted variables. In our case, this is
clearly an issue since one of the leads was positive and statistically significant in
Model 4.
First, in Model 5 we estimate a model including Depth, PTA, and a battery
of dummies on the right hand-side of the equation. Specifically, we include time-
varying exporter fixed effects (i.e., it), time-varying importer fixed effects (jt), as
well as dyads fixed effects (i.e., ij) as in the previous models.17 While the coefficient
for PTA remains positive and statistically significant (which confirms Baier and
Bergstrand’s (2007) results), the coefficient forDepth is also positive and statistically
significant, highlighting the importance of agreement design for trade flow effects.18
Second, in Model 6 we estimate a model including the eight dummies of Model 4
as well as it, jt, and ij dummies. We report the arc elasticities for this model in Table
3. In line with Model 4, the Deep ... dummies clearly outperform the Shallow ...
dummies. This is true also for the long-term effect. Moreover, differently from
Model 4, the middle- and long-term effects are larger than the short-term effect. All
in all, there is robust and consistent evidence that deep agreements increase trade
substantially more than shallow agreements.
17We also implement first-differenced panel gravity equation estimates as suggested by Baierand Bergstrand (2007). Specifically, we take the first differences of Trade, PTA, and Depth andregress them on it, jt, and ij dummies. Then, we get the residuals for these estimations. Finally,we run a simple ordinary least squares regression with robust standard errors in which Traderesiduals are the dependent variable and PTA and Depth residuals are the independent variables.The coefficients of both PTA and Depth remain positive and statistically significant. Results arereported in Model A3 in Table A-2 in the online appendix.
18The results (available upon request) do not change if we include one-year and two-year lags ofPTA and Depth in the five-year dataset. Specifically, the coefficient of these lags are positive andstatistically significant.
21
Additional Evidence
Other Model Specifications
As the gravity model suffers from several shortcomings, we implement some checks
to make sure that our results also hold under different specifications. Results are
shown in Table 4. First, we follow Silva and Tenreyro (2006) and estimate a pseudo-
Poisson model to control for the large number of zeros in the outcome variable.19
In this case we do not use the logarithmic transformation of Trade, but its raw
value. We include all the standard covariates of the gravity model, e.g., distance
and contiguity, as well as exporter and importer fixed effects. Our main results are
confirmed, showing that the selection bias coming from a large number of zeros does
not affect our findings (see Model 7 in Table 4).
[Table 4 about here]
Second, Helpman et al. (2008) addressed the selection bias issue relying on a
natural logarithm transformation and using several model specifications. Unfortu-
nately, we are unable to estimate the non-linear estimator developed by Helpman
et al. (2008) because we have too many fixed effects (many more than Helpman
et al. 2008). In particular, the estimation of the second stage regression produces
problematic results in a large sample because of the large number of exporter and
19We use the command PPML, written by Silva and Tenreyro (2006) in STATA 12.
22

importer dummies required. Nevertheless, we estimate another model specification
implemented by Helpman et al. (2008), known as the bins approach.20
Specifically, in the selection equation we predict whether a dyad has no trade
using a probit model whose dependent variable scores one if Trade equals zero.21 In
line with Helpman et al. (2008), we include all the covariates in Model 7 in addition
to a dummy for common religion (across dyads) as the excluded variable.22 Next,
we partitioned the obtained predicted probability (ρij, using Helpman et al.’s (2008)
notation) into a number of bins with equal numbers of observations and assign an
indicator variable to each bin. Finally, we include this set of indicator variables in
the second stage and we report results with 50 bins.23 In this case, too, our main
results hold (see Model 8 in Table 4).24 In models 7 and 8, the coefficients of Depth
are smaller than the ones in models 2 and 5, but the coefficients are not statistically
significant different one from another.
Third, Model 9 reports the results for the subsample of PTAs that have been
notified to the WTO. This reduces the number of PTAs included in our analysis
from 536 to 348. The purpose of doing so is to make sure that our results are not
driven by the inclusion of a large number of shallow PTAs that do not feature in
20This specification does not allow to separate the selection effect from the firm heterogeneityeffect. However, we can “obtain our key results for the intensive-margin contribution of the varioustrade barriers” (Helpman et al. 2008, 465).
21Any cumulative distribution function instead of the normal distribution would work here. Weestimate a probit model following Helpman et al. (2008).
22Data on the variable religion come from the CIA World Factbook. This variable is positiveand statistically significant in the first stage.
23If we use 100 bins, we obtain the same results, which are available upon request.24Differently from Helpman et al. (2008), the coefficient of PTA is positive and statistically
significant. That might be explained by the fact that our sample is much larger than the one ofHelpman et al. (2008).
23

other studies. The reduction in the number of PTAs included, however, does not
affect the main results. Finally, our results are similar if we drop dyads from the
analysis that signed one of the 145 PTAs that we identified but could not code
because we were unable to locate their full texts (or if we control for these dyads by
adding a dummy).25
Trade-Related Sectors vs. Tariff Reduction
Our general argument is that design matters for a PTA’s effect on trade flows be-
tween member countries. Specifically, we argue that not only tariff cuts, but also
trade-related provisions are crucial instruments for boosting trade. Previous results
support this hypothesis. A possible objection to our analysis so far, however, is that
the depth of a PTA captured by looking at trade-related provisions is correlated with
the magnitude of tariff reductions. Deep PTAs that include provisions liberalizing
services, and protecting investments and intellectual property rights are likely to be
the ones that also implement the largest tariff cuts between member countries. If
that is the case, the underlying factor leading to an increase in trade might not be
trade-related provisions, but rather the tariff reductions.
To address this concern, in the absence of a more direct measure of the extent
of tariff cuts, we include a variable capturing the length of tariff transition, that
is, how many years it takes for the tariff cuts to be fully implemented. We label
this variable Transition.26 Tariff transition is correlated with the magnitude of
25Results are reported in Model A4 (Table A-2) in the online appendix.26Tariff transition data might be different for country i and country j. However, since the
correlation between Transitioni and Transitionj is 0.98, we take the minimum of these two
24

tariff reduction, i.e., the larger the tariff reduction, the longer the tariff transition.27
Indeed, if tariff reductions are large, so are adjustment costs, which are spread out
over several years to make cooperation possible. Illustratively, the North American
Free Trade Agreement, which cut tariffs to zero on basically all products, has one
of the longest transition periods in our database, namely 15 years. This variable
should thus effectively control for the magnitude of tariff cuts envisaged by a PTA.
Model 10 in Table 4 shows that Depth remains positive and statistically significant
after including Transition. The coefficient for Transition is negative, though it is
not statistically significant.
Conclusion
We have presented a new dataset on the design and contents of PTAs. DESTA
contains information on a total of 733 PTAs and a detailed analysis of the design of
587 PTAs. To our knowledge, it is the most comprehensive dataset on the design of
trade agreements currently available. We thus expect that DESTA will be a major
asset in addressing several long-standing questions relating to the new regionalism
and international institutions more broadly.
The novel data has allowed us to revisit the literature on the PTA–trade nexus,
with the results corroborating earlier studies that showed that PTAs increase trade.
Our additional insight is that this effect is driven by deep agreements, whereas shal-
values to avoid multicollinearity problems.27In fact, in our dataset full free trade agreements have an average transition period of 5.7 years
as compared to 1.7 years for partial trade agreements. Customs unions also have a relatively longtransition period of 4.5 years.
25
low agreements have a substantially smaller impact on trade flows. Of particular
interest is the result that provisions included in PTAs that do not directly concern
tariffs – such as those liberalizing services trade or protecting investments and intel-
lectual property rights – have a significant impact on trade. We do not claim that
this analysis resolves the question of the PTA–trade nexus once and for all. Future
studies should look more precisely at questions such as which provisions increase
trade by how much; what type of trade – inter-industry or intra-industry – is af-
fected most; and which sectors see the largest increase in trade. The central finding
that design matters, however, is very robust to changes in operationalization and
model choice.
Future research on PTAs thus should further open the black box of trade agree-
ments and concentrate on variation across PTAs in design and content rather than
treat all PTAs as if they were the same. Studies taking PTA design seriously may
address new questions such as, which design elements bring about significant dis-
tributional consequences in participating member states? What type of obligations
coupled with what type of enforcement mechanisms are likely to induce domes-
tic policy change? How do certain design features in isolation or in conjunction
with other variables affect implementation? And do design features travel from one
agreement to another, that is, is there a diffusion of institutional design?
Of course, PTAs are only one among many types of international institutions,
albeit expanding in number and depth over time. Studying the design of PTAs will
allow the PTA literature to better engage with the broader literature on international
cooperation and international organizations, creating possibilities to contribute ac-
26

tively to ongoing debates and advancements in research programmes as diverse as
legalization (Abbott et al. 2001), rational design (Koremenos et al. 2001; Rosendorff
and Milner 2001), diffusion (Simmons and Elkins 2004; Braun and Gilardi 2006), or
overlapping regimes (Drezner 2006; Busch 2007). Many international organizations
have been extensively studied in terms of design. Connecting PTAs more tightly to
non-trade institutions would be beneficial for situating the role of trade institutions
more broadly. The DESTA dataset will be of major use in developing this research
agenda.
Bibliography
Abbott, Kenneth, Robert Keohane, Andrew Moravcsik, Ann-Marie Slaughter, and
Duncan Snidal. 2001. The Concept of Legalization. International Organization
54 (3):401–19.
Baccini, Leonardo, and Andreas Dur. 2012. The New Regionalism and Policy
Interdependence. British Journal of Political Science 42 (1): 57–79.
Baier, Scott, and Jeffrey Bergstrand. 2007. Do Free Trade Agreements Actually
Increase Members’ International Trade? Journal of International Economics 71
(1):72–95.
Baier, Scott, and Jeffrey Bergstrand. 2009. Bonus Vetus OLS: A Simple Method
for Approximating International Trade-Cost Effects Using the Gravity Equation.
Journal of International Economics 77 (1):77–85.
Baier, Scott, Jeffrey Bergstrand, and Michael Feng. 2011. Economic Integration
27
Agreements and the Margins of International Trade. Working Paper
Baldwin, Richard. 1993. A Domino Theory of Regionalism. NBER Working Paper
No. 4465.
Baldwin, Richard, and Dany Jaimovich. 2012. Are Free Trade Agreements Conta-
gious? Journal of International Economics 88 (1):1–16.
Baldwin, Richard, and Daria Taglioni. 2006. Gravity for Dummies and Dummies
for Gravity Equations. NBER Working Paper No. 12516.
Bartholomew, David J., Martin Knott, and Irini Moustaki. 2011. Latent Variable
Models and Factor Analysis: A Unified Approach. Chichester: John Wiley and
Sons.
Braun, Dietmar, and Fabrizio Gilardi. 2006. Taking ‘Galton’s Problem’ Seriously.
Towards a Theory of Policy Diffusion. Journal of Theoretical Politics 18 (3):298–
322.
Busch, Marc. 2007. Overlapping Institutions, Forum Shopping, and Dispute Settle-
ment in International Trade. International Organization 61 (4):735–61.
Buthe, Tim, and Helen Milner. 2008. The Politics of Foreign Direct Investment into
Developing Countries: Increasing FDI through International Trade Agreements?
American Journal of Political Science 52 (4):741–62.
Carrere, Celine. 2006. Revisiting the Effects of Regional Trade Agreements on Trade
Flows with Proper Specification of the Gravity Model. European Economic
Review 50 (2):223–247.
CEPII. Available from <http://www.cepii.fr/anglaisgraph/bdd/distances.htm>.
28

Chase, Kerry. 2003. Economic Interests and Regional Trading Arrangements: The
Case of NAFTA. International Organization 57 (1):137–74.
Cheng, I-Hui, and Howard Wall. 2005. Controlling for Heterogeneity in Gravity
Models of Trade and Integration. Federal Reserve Bank of St. Louis Review 87
(1):49–63.
De Rosa, Dean. 2007. The Trade Effects of Preferential Arrangements: New Evi-
dence from the Australia Productivity Commission. IIE Working Paper 7 (1).
Direction of Trade Statistics. 2010. Global Insight Direction of Trade. In Direction
of Trade. Available: DRI WEFA’s Global Insight.
Downs, George W., David M. Rocke, and Peter N. Barsoom. 1996. Is the Good News
About Compliance Good News About Cooperation? International Organization
50 (3): 379–406.
Drezner, Daniel. 2006. The Viscosity of Global Governance: When is Forum-
Shopping Expensive? Paper presented at the Annual Meeting of the American
Poltitical Science Association, Philadelphia.
Dur, Andreas. 2007. EU Trade Policy as Protection for Exporters: The Agreements
with Mexico and Chile. Journal of Common Market Studies 45 (4): 833–55.
Elsig, Manfred, and Cedric Dupont. 2012. European Union Meets South Korea:
Bureaucratic Interests, Exporter Discrimination and the Negotiations of New
Trade Agreements. Journal of Common Market Studies 50 (3): 492–507.
Estevadeordal, Antoni, Kati Suominen, and Robert Teh, eds. 2009. Regional Rules
in the Global Trading System. Cambridge: Cambridge University Press.
29

Frankel, Jeffrey. 1997. Regional Trading Blocs in the World Economic System.
Washington, D.C.: Institute for International Economics.
Gleditsch, Kristian. 2002. Expanded Trade and GDP Data. Journal of Conflict
Resolution 46 (5):712–24.
Goldstein, Judith, Michael Tomz, and Douglas Rivers. 2007. Institutions in Inter-
national Relations: Understanding the Effects of the GATT and the WTO on
World Trade. International Organization 61 (1): 37–67.
Gowa, Joanne, and Edward Mansfield. 1993. Power Politics and International
Trade. American Political Science Review 87 (2): 408–20.
Grossman, Gene, and Elhanan Helpman. 1995. The Politics of Free-Trade Agree-
ments. American Economic Review 85 (4):667–90.
Hafner-Burton, Emilie. 2005. Trading Human Rights: How Preferential Trade
Agreements Influence Government Repression. International Organization 59
(3):593–629.
Haftel, Yoram. 2010. Ratification Counts: US Investment Treaties and FDI flows
into Developing Countries. Review of International Political Economy 17 (2):348–
377.
Helpman, Elhanan, Marc Melitz, and Yona Rubenstein. 2008. Estimating Trade
Flows: Trading Partners and Trading Volumes. The Quarterly Journal of Eco-
nomics 123 (2):441–487.
Hicks, Raymond, and SooYeon Kim. 2012. Reciprocal Trade Agreements in Asia:
Credible Commitment to Trade Liberalization or Paper Tigers? Journal of East
30

Asian Studies 12 (1):1–29.
Hollyer, James, and Peter Rosendorff. 2012. Leadership Survival, Regime Type, Pol-
icy Uncertainty and PTA Accession. forthcoming International Studies Quar-
terly.
Kono, Daniel, and Stephanie Rickard. 2014. Think Globally, Buy Locally: Inter-
national Agreements and Government Procurement. Review of International
Organizations, forthcoming.
Koremenos, Barbara, Charles Lipson, and Duncan Snidal. 2001. The Rational
Design of International Institutions. International Organization 55 (4):761–99.
Kucik, Jeffrey. 2012. The Domestic Politics of Institutional Design: Producer
Preferences over Trade Agreement Rules. Economics and Politics 24 (2):95–
118.
Kuziemko, Ilyana, and Eric Werker. 2006. How Much Is a Seat on the Security
Council Worth? Foreign Aid and Bribery at the United Nations. Journal of
Political Economy 14 (5):905–930.
Magee, Christopher S.P. 2008. New Measures of Trade Creation and Trade Diver-
sion. Journal of International Economics 75:349–362.
Maggi, Giovanni, and Andres Rodrıguez-Clare. 2007. A Political-Economy Theory
of Trade Agreements. American Economic Review 97 (4):1374–1406.
Manger, Mark. 2009. Investing in Protection: The Politics of Preferential Trade
Agreements Between North and South. Cambridge: Cambridge University Press.
Mansfield, Edward, and Helen Milner. 1999. The New Wave of Regionalism. Inter-
31

national Organization 53 (3):589–627.
Mansfield, Edward, and Helen Milner. 2012. Votes, Vetoes, and the Political Econ-
omy of International Trade Agreements. Princeton: Princeton University Press.
Mansfield, Edward, and Jon Pevehouse. 2000. Trade Blocs, Trade Flows, and
International Conflict. International Organization 54 (4):775–808.
Mansfield, Edward, and Eric Reinhardt. 2003. Multilateral Determinants of Re-
gionalism: The Effects of GATT/WTO on the Formation of Preferential Trading
Arrangements. International Organization 57 (4):829–62.
Mansfield, Edward, and Eric Reinhardt. 2008. International Institutions and the
Volatility of International Trade. International Organization 62 (4):621–52.
Mansfield, Edward, Helen Milner, and Jon Pevehouse. 2007. Vetoing Co-operation:
The Impact of Veto Players on Preferential Trading Arrangements. British
Journal of Political Science 37 (3):403–32.
Mansfield, Edward, Helen Milner, and Peter Rosendorff. 2002. Why Democra-
cies Cooperate More: Electoral Control and International Trade Agreements.
International Organization 56 (3): 477–514.
Milner, Helen. 1997. Industries, Governments, and the Creation of Regional Trade
Blocs. In The Political Economy of Regionalism, edited by Edward Mansfield
and Helen Milner, 77–106. New York: Columbia University Press.
Polity IV. 2010. Country Reports 2010. Available from
<http://www.systemicpeace.org/polity/polity06.htm>.
Rose, Andrew. 2004. Do We Really Know That the WTO Increases Trade? Amer-
32
ican Economic Review 94 (1):98–114.
Rosendorff, Peter, and Helen Milner. 2001. The Optimal Design of International
Trade Institutions: Uncertainty and Escape. International Organization 55
(4):829–58.
Roy, Jayjit. 2010. Do Customs Union Members Engage in More Bilateral Trade
Than Free-Trade Agreement Members. In Review of International Economics
18(4): 663–81.
Silva, J. M. C. Santos, and Silvana Tenreyro. 2006. The Log of Gravity. Review of
Economics and Statistics, 88: 641-658.
Simmons, Beth, and Zachary Elkins. 2004. The Globalization of Liberalization:
Policy Diffusion in the International Political Economy. American Political Sci-
ence Review 98 (1):171–189.
Smith, James McCall. 2000. The Politics of Dispute Settlement Design: Explaining
Legalism in Regional Trade Pacts. International Organization 54 (1):137–80.
Stock, James, and Motohiro Yogo. 2002. Testing for Weak Instruments in Linear IV
Regression. National Bureau of Economic Research Technical Working Paper
Series 284.
Viner, Jacob. 1950. The Customs Union Issue. New York: Carnegie Endowment
for International Peace.
World Bank. 2011. World Development Indicators. online. Accessed 3 November
2011.
World Trade Organization. 2011. World Trade Report 2011: The WTO and Pref-
33
erential Trade Agreements: From Co-existence to Coherence. Geneva: WTO.
World Trade Organization. 2012. WTO Membership. Available from
<http://www.wto.org/english/thewto e/gattmem e.htm>. Accessed 10 Jan-
uary 2012.
34

Table 1: Operationalization of depth (additive index).
Variable Value
More than a partial scope agreement? 0/1Substantive provision on services? 0/1Substantive provision on investments? 0/1Substantive provision on standards? 0/1Substantive provision on public procurement? 0/1Substantive provision on competition? 0/1Substantive provision on intellectual property rights? 0/1Total range 0/7
35
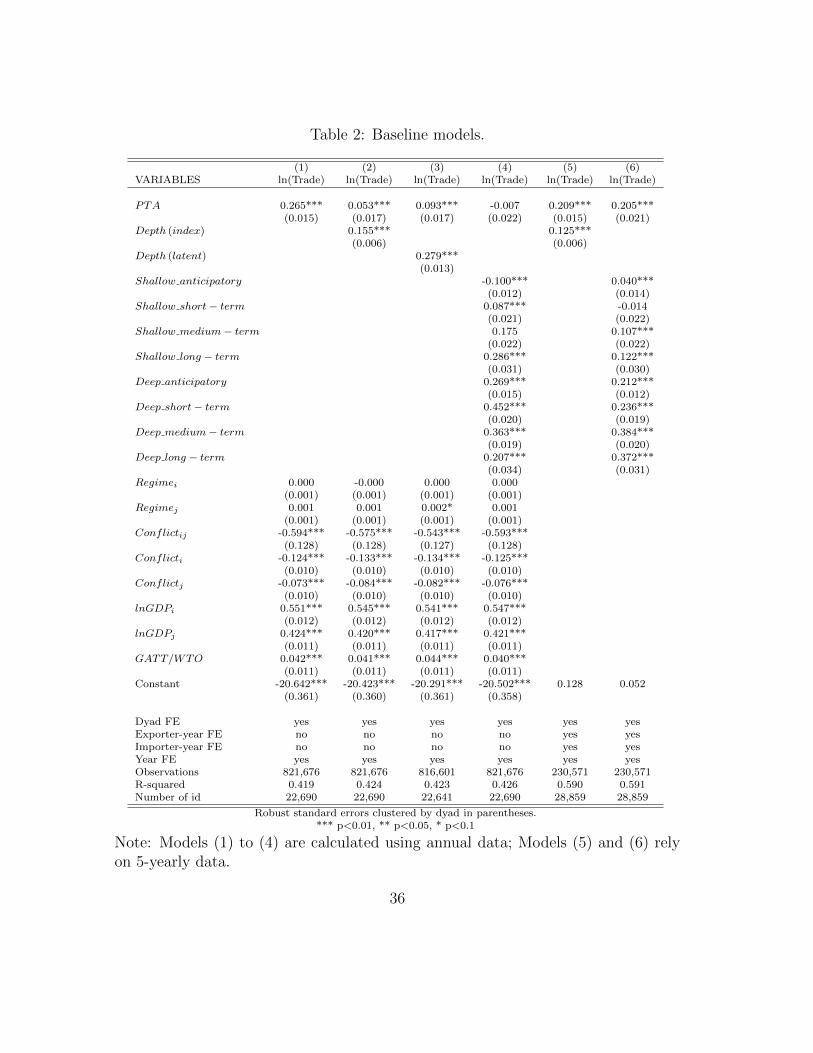
Table 2: Baseline models.
(1) (2) (3) (4) (5) (6)VARIABLES ln(Trade) ln(Trade) ln(Trade) ln(Trade) ln(Trade) ln(Trade)
PTA 0.265*** 0.053*** 0.093*** -0.007 0.209*** 0.205***(0.015) (0.017) (0.017) (0.022) (0.015) (0.021)
Depth (index) 0.155*** 0.125***(0.006) (0.006)
Depth (latent) 0.279***(0.013)
Shallow anticipatory -0.100*** 0.040***(0.012) (0.014)
Shallow short− term 0.087*** -0.014(0.021) (0.022)
Shallow medium− term 0.175 0.107***(0.022) (0.022)
Shallow long − term 0.286*** 0.122***(0.031) (0.030)
Deep anticipatory 0.269*** 0.212***(0.015) (0.012)
Deep short− term 0.452*** 0.236***(0.020) (0.019)
Deep medium− term 0.363*** 0.384***(0.019) (0.020)
Deep long − term 0.207*** 0.372***(0.034) (0.031)
Regimei 0.000 -0.000 0.000 0.000(0.001) (0.001) (0.001) (0.001)
Regimej 0.001 0.001 0.002* 0.001(0.001) (0.001) (0.001) (0.001)
Conflictij -0.594*** -0.575*** -0.543*** -0.593***(0.128) (0.128) (0.127) (0.128)
Conflicti -0.124*** -0.133*** -0.134*** -0.125***(0.010) (0.010) (0.010) (0.010)
Conflictj -0.073*** -0.084*** -0.082*** -0.076***(0.010) (0.010) (0.010) (0.010)
lnGDPi 0.551*** 0.545*** 0.541*** 0.547***(0.012) (0.012) (0.012) (0.012)
lnGDPj 0.424*** 0.420*** 0.417*** 0.421***(0.011) (0.011) (0.011) (0.011)
GATT/WTO 0.042*** 0.041*** 0.044*** 0.040***(0.011) (0.011) (0.011) (0.011)
Constant -20.642*** -20.423*** -20.291*** -20.502*** 0.128 0.052(0.361) (0.360) (0.361) (0.358)
Dyad FE yes yes yes yes yes yesExporter-year FE no no no no yes yesImporter-year FE no no no no yes yesYear FE yes yes yes yes yes yesObservations 821,676 821,676 816,601 821,676 230,571 230,571R-squared 0.419 0.424 0.423 0.426 0.590 0.591Number of id 22,690 22,690 22,641 22,690 28,859 28,859
Robust standard errors clustered by dyad in parentheses.*** p<0.01, ** p<0.05, * p<0.1
Note: Models (1) to (4) are calculated using annual data; Models (5) and (6) relyon 5-yearly data.
36

Table 3: The effect of PTAs on trade
Main variables Increase in trade (%) C.I.Model 1 & Model 4
Deep anticipatory 31 [27, 35]Deep short− term 57 [51, 63]Deep middle− term 44 [39, 49]Deep long − term 23 [15, 32
Shallow anticipatory -10 [-12, -7]Shallow short− term 9 [5, 14]Shallow middle− term 19 [14, 24]Shallow long − term 33 [25, 41]
PTA 31 [27, 34]GATT/WTO 4 [2, 7]
Model 6Deep anticipatory 24 [21, 27]Deep short− term 27 [22, 31]Deep middle− term 47 [41, 53]Deep long − term 45 [36, 54]
Shallow anticipatory 4 [1, 7]Shallow short− term -1 [-5, 3]Shallow middle− term 11 [7, 16]Shallow long − term 13 [7, 20]
PTA 23 [18, 28]
Note: the table reports the estimated percentage increase in trade for a dyad, relativeto when neither country participates in a PTA or in the GATT/WTO. Each effect is
calculated as an arc elasticity, eβ−1, where β is the appropriate parameter estimatefrom Model 1 (for PTA and GATT/WTO), Model 4, and Model 6 (for Deep ... andShallow ...). 95% confidence interval in parentheses.
37

Table 4: Additional models.
(7) (8) (9) (10)VARIABLES ln(Trade) ln(Trade) ln(Trade) ln(Trade)
PTA 0.119*** 0.327*** 0.231***(0.019) (0.024) (0.017)
Depth (index) 0.115*** 0.077*** 0.124***(0.0075) (0.009) (0.006)
PTA−WTO only 0.236***(0.018)
Depth (index)−WTO only 0.121***(0.006)
Distance -0.614*** -0.704***(0.009) (0.025)
Contiguity 0.404*** 0.439***(0.020) (0.057)
CommonLanguage 0.000 0.227***(0.018) (0.024)
CommonColony 0.213*** 0.320***(0.047) (0.031)
CommonLegalSystem 0.288*** 0.147***(0.012) (0.015)
CommonCurrency 0.256*** 0.141***(0.024) (0.041)
Regimei 0.026*** 0.023***(0.002) (0.002)
Regimej 0.024*** 0.002(0.002) (0.002)
Conflictij -1.764*** -0.841***(0.147) (0.219)
Conflicti 0.010 -0.083***(0.019) (0.017)
Conflictj 0.005 -0.359***(0.020) (0.045)
lnGDPi 1.010*** 0.526***(0.018) (0.016)
lnGDPj 0.929*** 0.460***(0.016) (0.017)
GATT/WTO 0.313*** 0.218***(0.022) (0.016)
Transition -0.001(0.001)
Constant -36.486***(0.360)
Exporter FE yes yes no noImporter FE yes yes no noExporter-year FE no no yes yesImporter-year FE no no yes yesYear FE yes yes yes yesObservations 749,763 615,152 230,571 227,282R-squared 0.878 0.669 0.590 0.590Number of id 21,295 21,295 28,859 28,755
Robust standard errors clustered by dyad in parentheses.*** p<0.01, ** p<0.05, * p<0.1
Note: Model (7) is a pseudo-Poisson model. Models (9) and (10) rely on 5-yearlydata.
38

Figure 1: PTAs over time.
merged$Var1
mer
ged$
cum
1950 1960 1970 1980 1990 2000 2010Year
0
100
200
300
400
Cum
ulat
ive
num
ber
of P
TAs
in fo
rce
0
10
20
30
40
Agr
eem
ents
sig
ned
by y
ear
39
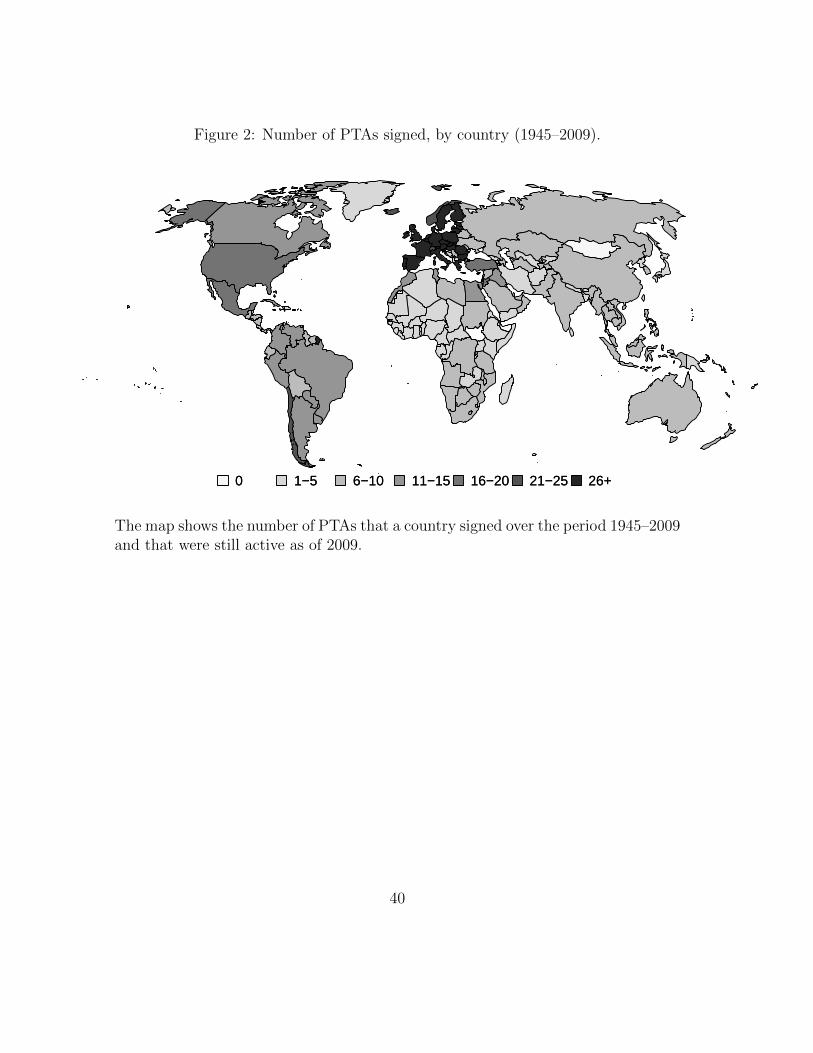
Figure 2: Number of PTAs signed, by country (1945–2009).
0 1−5 6−10 11−15 16−20 21−25 26+0 1−5 6−10 11−15 16−20 21−25 26+
The map shows the number of PTAs that a country signed over the period 1945–2009and that were still active as of 2009.
40

Figure 3: Types and regional composition of PTAs.
●
●
●
●
●
●
●
●
●
●
●
●
●
●
1063
112172180196
17101123492
655
173353
OceaniaAfricaAsiaAmericaEuropeIntercontinental
InterregionalPlurilateralRegion−countryBilateral
ServicesCustoms unionPartial FTAFTA
Integration level:
Membership:
Region:
0 10 20 30 40 50 60 70Percentage
We show absolute frequencies to the right. We only coded the level of integrationfor PTAs for which we have a full text.
41

Figure 4: Variation in agreement design.
●
●
●
●
●
●
●
●
●
●
●
●
●
●
●
●
●
●
●
●
●
●
●
●
●
●
●
●
●
●
●
●
●
●
●
●
●
●
●
●
●
●
4079
153191193238299333
5166
120230
1934354870768789
115261
61776767880858686878893
218
517980
102120190285
SPS harmionization provisionTBTs least trade distortingCooperation on SPSGATT/WTO reference on SPSGATT/WTO reference on TBTsCooperation on TBTsTBT mentionedSPS mentioned
Transparency provisionNational treatmentGATT/WTO referenceRegulation at least aimed for
References to pharmaceuticalsWIPO phonograms treatyWIPO copyright treatyReferences to geographical indicationsRome conventionProvisions related to enforcement Bern conventionParis conventionMFN treatmentAt least general reference
Only in services chapterBased on BITInvestor−Country DSMBeyond servicesMFN treatmentCompensation in case of expropriationNon−discrimination (mergers)Non−discrimination (pre−establishment)Non−discrimination (post−establishment)National treatmentNon−discrimination (operation)Restrictions to transfers and paymentsProtection aimed for
Positive list approachNegative list approachMFN treatmentNational treatmentMovement of natural personsGATS referenceService liberalization mentioned
SPS/TBT
Procurement
IPRs
Investments
Services
0 20 40 60 80Percentage
●
●
●
●
●
●
●
●
●
●
●
●
●
●
●
●
●
●
●
●
●
●
●
●
●
●
●
●
●
●
●
●
●
●
●
●
●
●
●
●
●
203583859799
102108110124210278297463487
14405861
137170176188266331354356378404475
13162267
101155252284302329408
Monetary sanctionsCreation of standing bodySanctions cross−sectorSanctions within sectorMediation provisionDefendant chooses amountRestriction to one forumProvision on forum shoppingDelegation to external bodyThird party chooses amountArbitration provisionComplainant chooses amountProvision on sanctionsConsultation provisionSome type of dispute settlement
AD ruled outLimited safeguard ceilingSafeguard during transition periodCommon subsidy policiesLimited safeguard durationAD allowed with specific provisionsGATT/WTO reference on safeguardsAllowing structural adjustment programsGATT/WTO reference on subsidiesGATT/WTO reference on ADEscape to address BOPs issuesAllowing countervailing measuresSubsidy provisionAntidumping (AD) provisionsSafeguard provisions
Create common authoritySet up national authorityMergers and acquisitionsCoordinate among authoritiesChapter on competitionProvision to exchange informationState trading enterprisesMonopolies and cartelsCreate joint committeeState aidNot distort competition
Dispute settlement
Trade remedies
Competition
0 20 40 60 80Percentage
The figure shows the percentage of agreements that contain the various provisions.To the right, we show the absolute frequencies. Note that the denominator forcalculating the percentages slightly varies as a result of missing values for traderemedies and dispute settlement variables.
42

Figure 5: Depth over time.
01
23
45
6
1945
−194
9
1950
−195
4
1955
−195
9
1960
−196
4
1965
−196
9
1970
−197
4
1975
−197
9
1980
−198
4
1985
−198
9
1990
−199
4
1995
−199
9
2000
−200
4
2005
−200
9
Mea
n
01
23
1945
−194
9
1950
−195
4
1955
−195
9
1960
−196
4
1965
−196
9
1970
−197
4
1975
−197
9
1980
−198
4
1985
−198
9
1990
−199
4
1995
−199
9
2000
−200
4
2005
−200
9
Mea
nThe vertical bars show the standard errors of the means.
43
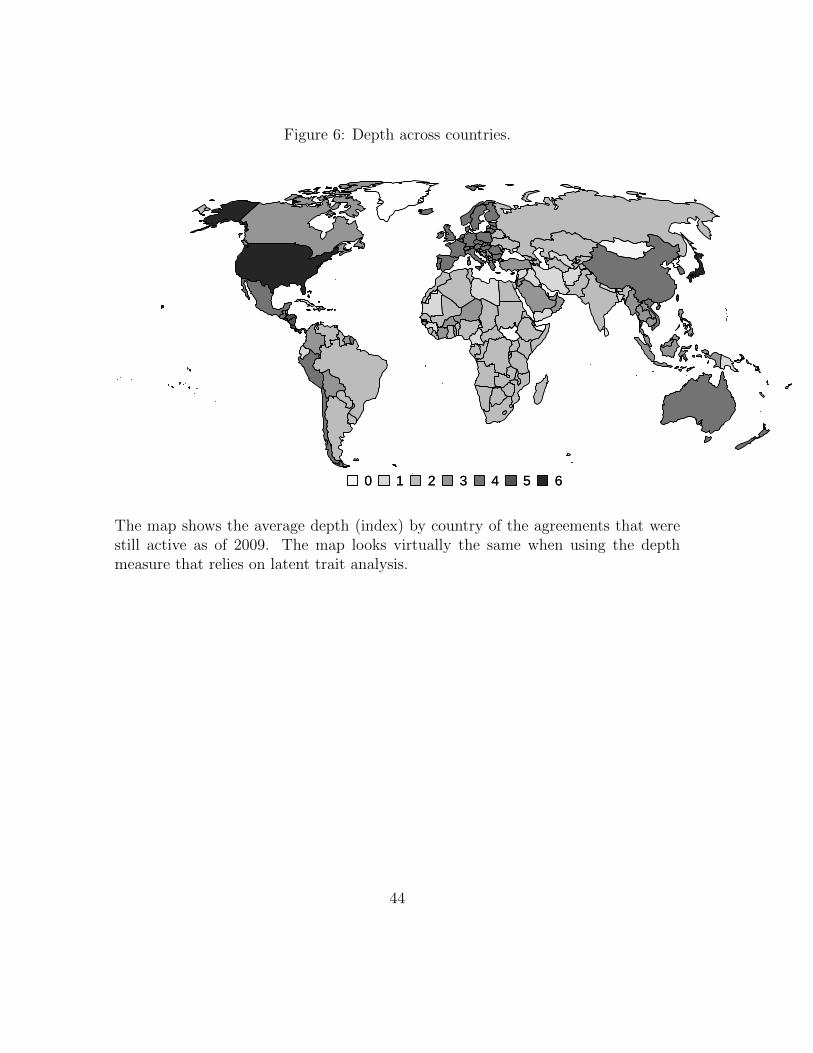
Figure 6: Depth across countries.
0 1 2 3 4 5 60 1 2 3 4 5 6
The map shows the average depth (index) by country of the agreements that werestill active as of 2009. The map looks virtually the same when using the depthmeasure that relies on latent trait analysis.
44

Figure 7: The depth of selected agreements.
1950 1970 1990 2010
02
46
●
●●
●●●●●●
●
●
●●
● ●●●
●
●
●●ACM
AEC
And
ACM
AMU
APTA
ACS
ASEAN
ASEAN
BAFTA
Bangkok
CARICOM
CARICOM
CARIFTAUDEAC
CACM
CAFTA
CAFTACEFTA
COMESA
CIS
EU
CEMAC
ECOWASEFTA
EAEC
ECSC
GAFTA
GCC
LAFTA
MERCOSUR
NAFTA
OECS
SACU SACU
BENELUX
WAEC
Year
Dep
th (
Inde
x)
1950 1970 1990 2010
01
23
● ●●
●
●
●
●●
●
●
●
●
●
●
●
●
●
ACM AEC
AndACM
AMU
APTA
ACS
ASEAN
ASEAN
BAFTA
Bangkok
CARICOM
CARICOM
CARIFTA
UDEAC
CACM
CAFTA
CAFTA
CEFTA
COMESA
CIS
EU
CEMAC
ECOWAS
EFTA
EAEC
ECSC
GAFTAGCC
LAFTA
MERCOSUR
NAFTA
OECS
SACU
SACU
BENELUXWAEC
YearD
epth
(La
tent
trai
t)
1985 1990 1995 2000 2005 2010
02
46
●●
●●
●
●
●● ●
●
JapanKorea
ECEFTA
Mexico US
ColombiaPeru
MERCOSUR Panama
China
Peru TurkeyChina Hong Kong
China MacaoColombia
Ecuador EcuadorIndia
Mexico
VenezuelaCuba
Uruguay
Year
Dep
th (
Inde
x)
1985 1990 1995 2000 2005 2010
01
23
●
●
●
●
JapanKoreaECEFTA
MexicoUS
ColombiaPeru
MERCOSUR Panama
ChinaPeruTurkey
China Hong KongChina Macao
Colombia
Ecuador Ecuador
IndiaMexicoVenezuela
Cuba
Uruguay
Year
Dep
th (
Late
nt tr
ait)
a.) Sample of plurilateral agreements
b.) Chilean agreements
45