the desalination process driven by wave energy: a
TRANSCRIPT

energies
Article
The Desalination Process Driven by Wave Energy:A Challenge for the Future
Vincenzo Franzitta 1,*, Domenico Curto 1, Daniele Milone 1 and Alessia Viola 2
1 Department of Energy, Information engineering and Mathematical models, University of Palermo (UNIPA),90128 Palermo, Italy; [email protected] (D.C.); [email protected] (D.M.)
2 Departament of Ciências Exatas e da Terra, Universidade Federal de São Paulo (UNIFESP),San Paulo 09910-720, Brazil; [email protected]
* Correspondence: [email protected]; Tel.: +39-091-2386-1941
Academic Editor: Francesco AsdrubaliReceived: 24 September 2016; Accepted: 25 November 2016; Published: 7 December 2016
Abstract: The correlation between water and energy is currently the focus of several investigations.In particular, desalination is a technological process characterized by high energy consumption;nevertheless, desalination represents the only practicable solution in several areas, where theavailability of fresh water is limited but brackish water or seawater are present. These naturalresources (energy and water) are essential for each other; energy system conversion needs water,and electrical energy is necessary for water treatment or transport. Several interesting aspects includethe study of saline desalination as an answer to freshwater needs and the application of renewableenergy (RE) devices to satisfy electrical energy requirement for the desalination process. A mergebetween renewable energy and desalination is beneficial in that it is a sustainable and challengingoption for the future. This work investigates the possibility of using renewable energy sources tosupply the desalination process. In particular, as a case study, we analyze the application of waveenergy sources in the Sicilian context.
Keywords: desalination; water; renewable energy; wave
1. Introduction
In recent years, the correlation between energy and water has been investigated. These naturalresources (energy and water) are essential for each other, for example, energy system conversionneeds water, and electrical energy is necessary for water treatment or transport. This tie is named theenergy–water nexus [1–4].
As is known, all natural resources (including water) are limited and are distributed in anon-uniform way around the world. For these reasons, the continuous growth of population andeconomic prosperity, if not carefully controlled, could be causes of conflicts and political instabilities inthe future.
The latest FAO’s (Food and Agriculture Organization) report estimates that population increasewill cause a proportional demand for food; in particular, the agricultural sector will withdraw morewater [5]. However, regarding the energy sector, over 1.3 billion people that live in Africa and EastAsia do not use electricity [6], World Energy Council said that BRICS country, as China and Brazil,will double energy consumption and underlined another interesting aspect that is Africa’s energyproduction will increase seven times the current value. The main concern is that developing countrieswill use conventional sources (oil, gas, or coal) to generate electricity, so the demand for water willrapidly increase [7].
Energies 2016, 9, 1032; doi:10.3390/en9121032 www.mdpi.com/journal/energies
Energies 2016, 9, 1032 2 of 16
These studies underline that water is fundamental in every energy sector, for example, in theelectrical power production, the cultivation of biomass, the processing of mineral resources, and theextraction of fossil fuels.
Water is a basic source for the irrigation of biofuels crops, and it is necessary for cooling and othersystems connected to thermal power plants.
Accordingly, energy usage requires considerable amounts of water, with the risk that industrialprocesses could contaminate or damage the environment through the loss of pollutants and the releaseof large amounts of waste heat that alters the temperature in the surrounding environment.
The global water demand is expected to grow significantly in every water-dependent sector,proportionally with population growth. Hence, we shall consider possible future concerns related tothe demand of water: pumping and treatment. If we analyze the cleaning and sanitizing processes,desalination represents the technological water process with the greatest energy consumption.
To desalinize in general means to remove salt [8] from seawater or saline water, and the nearlyinexhaustible sources are the oceans. The cost of seawater desalination is ten times that of other watertreatment methods, so it is important to underline that desalination is a good choice if we do not haveother possibilities. The International Desalination Association is studying possible innovative waysto reduce energy costs. Initially, their goal was a 20% energy reduction by last year, but the currenteconomic conditions delayed the achievement of this goal.
The desalination process can be considered a valid solution in those areas characterized by limitedfresh water and a significant availability of brackish water or seawater. Several works describe apossible integration of renewable energy systems and desalination plants. In particular, Rodrígues [9]described the technologies currently used: multistage flash distillation (MSF), multieffect distillation(MED), thermal vapor compressors (TVC), mechanical vapor compression (MVC), reverse osmosis(RO), and electrodialysis reversal (EDR).
The operating parameters of MSF and MED are temperature and pressure, which decrease invarious steps [9].
RO uses a semipermeable membrane to separate water from the dissolved salts, thanks to thepressure gradient applied to the two sides of the membrane. In this way, only the electrical or shaftpower is needed by the pumps to pressurize the hydraulic desalinating circuit.
The main technologies currently used in desalination are MSF and RO, which representrespectively 44% and 42% of worldwide installed capacity. If we consider the technologies separatelybased on thermal processes and semipermeable membranes, the MSF is used more than 93% of thethermal production, while RO is used more than 88% of the membrane production [9].
Recent research has investigated a possible integration between renewable energy sources anddesalination technologies in order to produce fresh water in those arid areas where renewable energyresources are present. In this way, the environmental impact can be reduced. Among the renewableenergy resources evaluated, we find wind, solar thermal, photovoltaic, and wave energy.
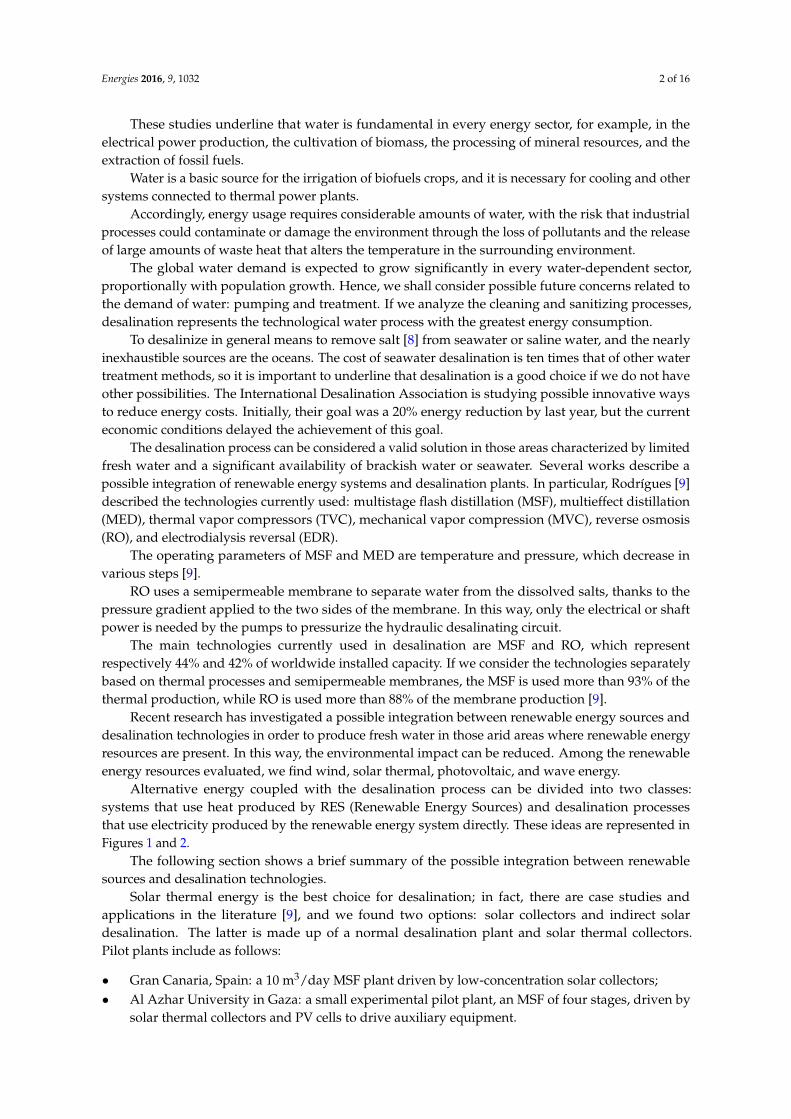
Alternative energy coupled with the desalination process can be divided into two classes:systems that use heat produced by RES (Renewable Energy Sources) and desalination processesthat use electricity produced by the renewable energy system directly. These ideas are represented inFigures 1 and 2.
The following section shows a brief summary of the possible integration between renewablesources and desalination technologies.
Solar thermal energy is the best choice for desalination; in fact, there are case studies andapplications in the literature [9], and we found two options: solar collectors and indirect solardesalination. The latter is made up of a normal desalination plant and solar thermal collectors.Pilot plants include as follows:
• Gran Canaria, Spain: a 10 m3/day MSF plant driven by low-concentration solar collectors;• Al Azhar University in Gaza: a small experimental pilot plant, an MSF of four stages, driven by
solar thermal collectors and PV cells to drive auxiliary equipment.
Energies 2016, 9, 1032 3 of 16Energies 2016, 9, 1032 3 of 16
Figure 1. Combinations technologies of RES (Renewable Energy Sources) and desalination methods, adapted from Etawil [10], with permission license number 4000740930381 from Renew. Sustain. Energy Rev (Elsevier). 2009.
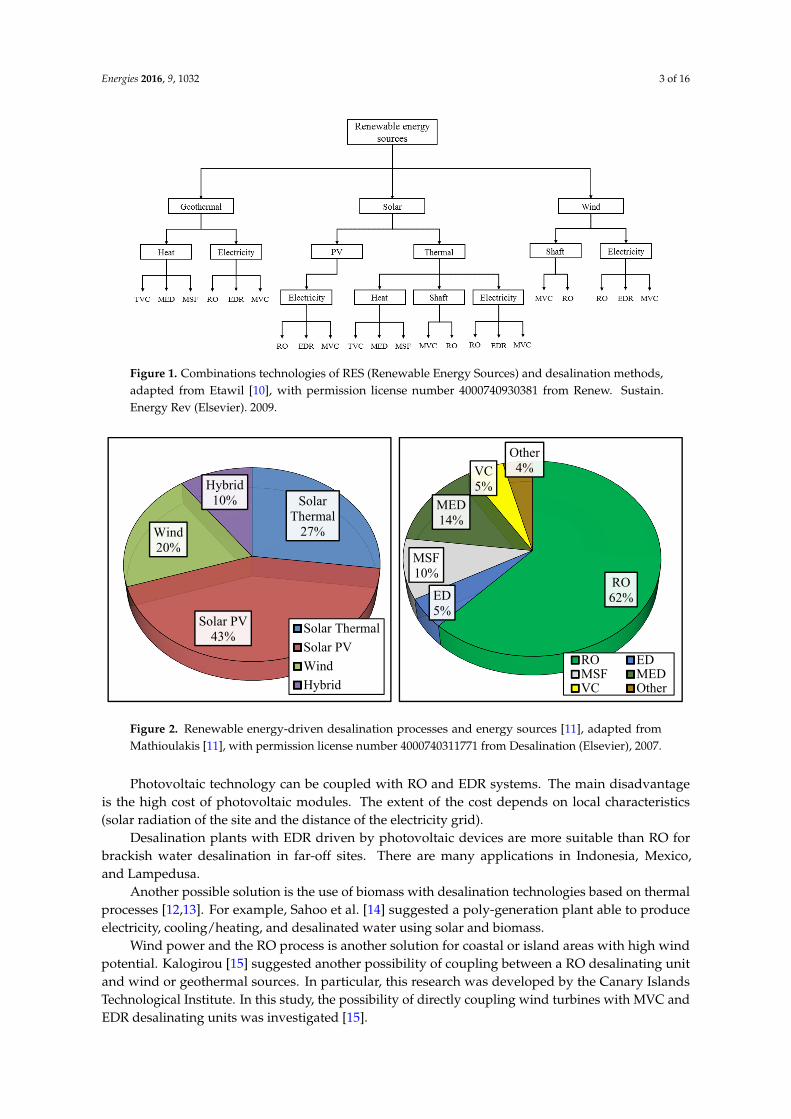
Figure 2. Renewable energy-driven desalination processes and energy sources [11], adapted from Mathioulakis [11], with permission license number 4000740311771 from Desalination (Elsevier), 2007.
The following section shows a brief summary of the possible integration between renewable sources and desalination technologies.
Solar thermal energy is the best choice for desalination; in fact, there are case studies and applications in the literature [9], and we found two options: solar collectors and indirect solar desalination. The latter is made up of a normal desalination plant and solar thermal collectors. Pilot plants include as follows:
• Gran Canaria, Spain: a 10 m3/day MSF plant driven by low-concentration solar collectors; • Al Azhar University in Gaza: a small experimental pilot plant, an MSF of four stages, driven by
solar thermal collectors and PV cells to drive auxiliary equipment.
Photovoltaic technology can be coupled with RO and EDR systems. The main disadvantage is the high cost of photovoltaic modules. The extent of the cost depends on local characteristics (solar radiation of the site and the distance of the electricity grid).
Desalination plants with EDR driven by photovoltaic devices are more suitable than RO for brackish water desalination in far-off sites. There are many applications in Indonesia, Mexico, and Lampedusa.
Solar Thermal
27%
Solar PV43%
Wind20%
Hybrid10%
Solar Thermal
Solar PV
Wind
Hybrid
RO62%ED
5%
MSF10%
MED14%
VC5%
Other4%
RO EDMSF MEDVC Other
Figure 1. Combinations technologies of RES (Renewable Energy Sources) and desalination methods,adapted from Etawil [10], with permission license number 4000740930381 from Renew. Sustain.Energy Rev (Elsevier). 2009.
Energies 2016, 9, 1032 3 of 16
Figure 1. Combinations technologies of RES (Renewable Energy Sources) and desalination methods, adapted from Etawil [10], with permission license number 4000740930381 from Renew. Sustain. Energy Rev (Elsevier). 2009.
Figure 2. Renewable energy-driven desalination processes and energy sources [11], adapted from Mathioulakis [11], with permission license number 4000740311771 from Desalination (Elsevier), 2007.
The following section shows a brief summary of the possible integration between renewable sources and desalination technologies.
Solar thermal energy is the best choice for desalination; in fact, there are case studies and applications in the literature [9], and we found two options: solar collectors and indirect solar desalination. The latter is made up of a normal desalination plant and solar thermal collectors. Pilot plants include as follows:
• Gran Canaria, Spain: a 10 m3/day MSF plant driven by low-concentration solar collectors; • Al Azhar University in Gaza: a small experimental pilot plant, an MSF of four stages, driven by
solar thermal collectors and PV cells to drive auxiliary equipment.
Photovoltaic technology can be coupled with RO and EDR systems. The main disadvantage is the high cost of photovoltaic modules. The extent of the cost depends on local characteristics (solar radiation of the site and the distance of the electricity grid).
Desalination plants with EDR driven by photovoltaic devices are more suitable than RO for brackish water desalination in far-off sites. There are many applications in Indonesia, Mexico, and Lampedusa.
Solar Thermal
27%
Solar PV43%
Wind20%
Hybrid10%
Solar Thermal
Solar PV
Wind
Hybrid
RO62%ED
5%
MSF10%
MED14%
VC5%
Other4%
RO EDMSF MEDVC Other
Figure 2. Renewable energy-driven desalination processes and energy sources [11], adapted fromMathioulakis [11], with permission license number 4000740311771 from Desalination (Elsevier), 2007.
Photovoltaic technology can be coupled with RO and EDR systems. The main disadvantageis the high cost of photovoltaic modules. The extent of the cost depends on local characteristics(solar radiation of the site and the distance of the electricity grid).
Desalination plants with EDR driven by photovoltaic devices are more suitable than RO forbrackish water desalination in far-off sites. There are many applications in Indonesia, Mexico,and Lampedusa.
Another possible solution is the use of biomass with desalination technologies based on thermalprocesses [12,13]. For example, Sahoo et al. [14] suggested a poly-generation plant able to produceelectricity, cooling/heating, and desalinated water using solar and biomass.
Wind power and the RO process is another solution for coastal or island areas with high windpotential. Kalogirou [15] suggested another possibility of coupling between a RO desalinating unitand wind or geothermal sources. In particular, this research was developed by the Canary IslandsTechnological Institute. In this study, the possibility of directly coupling wind turbines with MVC andEDR desalinating units was investigated [15].
Energies 2016, 9, 1032 4 of 16
As regards the geothermal source, this kind of energy can be exploited according to thetemperature of the local geothermal source. The underground heat is usually extracted by usingheat exchangers, realized with a special alloy in order to ensure a long durability and allow heattransfer. Low temperature geothermal resources (within a 100 m depth) can be used as a heat sourcefor desalination technologies based on thermal processes. In the case of high temperature resources,a geothermal power plant can be realized, producing the mechanical power required by pumps inRO desalination units. Furthermore, special membranes have been developed to use the geothermalbrines directly for desalination, with a working temperature of about 60 ◦C [15].
Finally, sea wave is another interesting renewable resource usable in the desalination sector.As is known in the literature, oceans have several types of energy: thermal gradient, saline gradient,tides, and waves. Several systems, able to use waves or tides to produce electrical energy, arecurrently in development. In this way, it is possible to use the energy enclosed in the oceans inthe desalination process. This source presents several advantages, including the availability of amore regular production compared to wind, the absence of soil consumption for energy converterinstallation, and the great energy potential, especially on small islands.
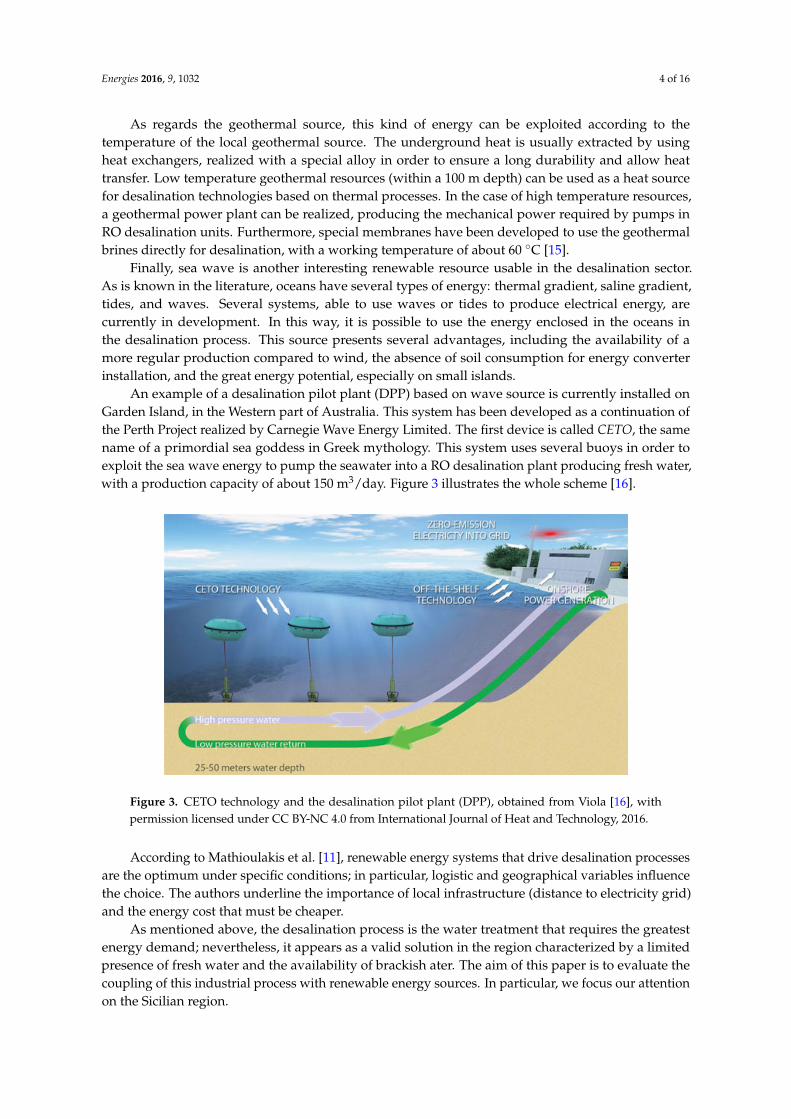
An example of a desalination pilot plant (DPP) based on wave source is currently installed onGarden Island, in the Western part of Australia. This system has been developed as a continuation ofthe Perth Project realized by Carnegie Wave Energy Limited. The first device is called CETO, the samename of a primordial sea goddess in Greek mythology. This system uses several buoys in order toexploit the sea wave energy to pump the seawater into a RO desalination plant producing fresh water,with a production capacity of about 150 m3/day. Figure 3 illustrates the whole scheme [16].
Energies 2016, 9, 1032 4 of 16
Another possible solution is the use of biomass with desalination technologies based on thermal processes [12,13]. For example, Sahoo et al. [14] suggested a poly-generation plant able to produce electricity, cooling/heating, and desalinated water using solar and biomass.
Wind power and the RO process is another solution for coastal or island areas with high wind potential. Kalogirou [15] suggested another possibility of coupling between a RO desalinating unit and wind or geothermal sources. In particular, this research was developed by the Canary Islands Technological Institute. In this study, the possibility of directly coupling wind turbines with MVC and EDR desalinating units was investigated [15].
As regards the geothermal source, this kind of energy can be exploited according to the temperature of the local geothermal source. The underground heat is usually extracted by using heat exchangers, realized with a special alloy in order to ensure a long durability and allow heat transfer. Low temperature geothermal resources (within a 100 m depth) can be used as a heat source for desalination technologies based on thermal processes. In the case of high temperature resources, a geothermal power plant can be realized, producing the mechanical power required by pumps in RO desalination units. Furthermore, special membranes have been developed to use the geothermal brines directly for desalination, with a working temperature of about 60 °C [15].
Finally, sea wave is another interesting renewable resource usable in the desalination sector. As is known in the literature, oceans have several types of energy: thermal gradient, saline gradient, tides, and waves. Several systems, able to use waves or tides to produce electrical energy, are currently in development. In this way, it is possible to use the energy enclosed in the oceans in the desalination process. This source presents several advantages, including the availability of a more regular production compared to wind, the absence of soil consumption for energy converter installation, and the great energy potential, especially on small islands.
An example of a desalination pilot plant (DPP) based on wave source is currently installed on Garden Island, in the Western part of Australia. This system has been developed as a continuation of the Perth Project realized by Carnegie Wave Energy Limited. The first device is called CETO, the same name of a primordial sea goddess in Greek mythology. This system uses several buoys in order to exploit the sea wave energy to pump the seawater into a RO desalination plant producing fresh water, with a production capacity of about 150 m3/day. Figure 3 illustrates the whole scheme [16].
Figure 3. CETO technology and the desalination pilot plant (DPP), obtained from Viola [16], with permission licensed under CC BY-NC 4.0 from International Journal of Heat and Technology, 2016.
According to Mathioulakis et al. [11], renewable energy systems that drive desalination processes are the optimum under specific conditions; in particular, logistic and geographical variables influence the choice. The authors underline the importance of local infrastructure (distance to electricity grid) and the energy cost that must be cheaper.
Figure 3. CETO technology and the desalination pilot plant (DPP), obtained from Viola [16], withpermission licensed under CC BY-NC 4.0 from International Journal of Heat and Technology, 2016.
According to Mathioulakis et al. [11], renewable energy systems that drive desalination processesare the optimum under specific conditions; in particular, logistic and geographical variables influencethe choice. The authors underline the importance of local infrastructure (distance to electricity grid)and the energy cost that must be cheaper.
As mentioned above, the desalination process is the water treatment that requires the greatestenergy demand; nevertheless, it appears as a valid solution in the region characterized by a limitedpresence of fresh water and the availability of brackish ater. The aim of this paper is to evaluate thecoupling of this industrial process with renewable energy sources. In particular, we focus our attentionon the Sicilian region.

Energies 2016, 9, 1032 5 of 16
Rizzuti et al. [9] and Beccali et al. [10] studied a possible application in Sicily. In fact, at the endof the twentieth century, the problem of drought had significantly affected Sicily, giving rise to theconstruction of a number of desalination plants for civil, agricultural, and industrial uses.
The problem of a limited presence of water affected the southern part of Sicily in particular due tothe main direction of winds and mountain chains in the internal part of the island [9]. In order to combatthe reduction of fresh water, eight desalination plants were installed in Sicily and smaller islands.The first two plants started in Gela and Porto Empedocle in 1974. Other plants are currently installedin Trapani and on the smaller islands of Lampedusa, Linosa, Pantelleria, Ustica, and Lipari [10].
The main aim of this paper is the presentation of a new sustainable application of wave energy tothe desalination process. Firstly, we evaluate the sea wave energy potential in the Mediterranean Seaand fresh water production of desalination plants installed in Sicily and smaller islands. As a case study,we evaluate the installation of a wave farm, based on a prototype realized by Department of Energyof Palermo University, in order to satisfy the energetic demand of the desalination plants installed inPantelleria, a small Sicilian island. An economic and environmental evaluation is then presented.
2. Sea Wave Energy Potential and Desalination Plant in Sicily
Sea waves are considered one of the most interesting renewable sources related to the oceans [17].It is believed that the wave energy sector will show significant development. Several studies haveinvestigated the realization of wave energy converters (WECs), i.e., devices able to convert sea waveenergy to a useful output. Different kinds of technologies have been investigated and tested [18],but full scale devices, ready for commercialization, have not yet been realized [19].
The research about wave energy systems started in countries surrounded by oceans, due totheir higher energy potential. In Europe, several studies and installations of pilot plants havebeen concentrated along the Atlantic coasts, in countries such as the UK, Ireland, Norway, Spain,and Portugal [20].
Obviously, the availability of the wave source is the first parameter used to choose the bestsites useful for the development of WEC technology. However, higher sea wave energy potential isusually related to the presence of extreme wave conditions, which pose serious problems in designand development WEC systems, with an inevitable increase in cost. Considering that wave energyproduction is mainly related to the average wave climate at the site of installation, the oversizing ofthese WECs cannot be compensated by effective energy conversion.
On the other hand, accepting the lower energy potential of a calmer and semi-closed sea, suchas the Mediterranean Sea, the design and development processes are simplified, thanks to the lesspowerful sea states during storms. In this way, the building and operative costs of WECs can bereduced [21].
Several studies investigated sea wave energy potential in the Mediterranean Sea. For example,Iglesias et al. evaluated the energy potential along the Spanish coasts [22], Guillou and Chapalainalong the French coasts [23], and Vicinanza et al. along the Italian coasts [24].
Wave energy production can be a great opportunity for countries such as Italy that have along coastline. Before the installation of a wave farm, a complete study of feasibility is required.These analyses are based on the temporal and spatial variability of the energy source, in order toproperly size the wave converter and choose the best positioning for the wave farm, maximizing theenergy production.
In the last decade, a large amount of information was collected by installing measuring buoysalong the Italian coasts. In this way, wave atlases have been created, showing the distribution of thewave energy potential along the Italian coastline [25].
However, time series obtained from wave buoys describe wave climate only locally and oftenpresent large data gaps caused by temporary malfunctions of the buoy or by maintenance operations.The main properties that characterize the sea states are the significant wave height, Hs, and the peak

Energies 2016, 9, 1032 6 of 16
period, Tp. These parameters generally do not show significantly steep spatial gradients in the openocean, but substantial spatial variations are observed in the enclosed sea.
The sea wave phenomenon is deeply related to the bathymetry in the area where the measuringbuoy is installed: typically, a deeper seabed reduces the friction force between waves and seabed, thuspreserving the wave energy. Conversely, in shallow water, the wave energy is strongly dissipated.For this reason, the measuring buoy is generally located offshore, several kilometers from the coast.
The fetch is another important parameter that deeply influences wave energy potential.This parameter represents the distance over which the wind mainly blows. Clearly, a large fetchis related to a more intense and regular wave climate, due to the greater distance over which the windenergy is transferred to sea wave.
Focusing our attention on Sicily, Figure 4 shows the wave energy potential along the Siciliancoasts. The red flags represent the measuring buoy.
Energies 2016, 9, 1032 6 of 16
In the last decade, a large amount of information was collected by installing measuring buoys along the Italian coasts. In this way, wave atlases have been created, showing the distribution of the wave energy potential along the Italian coastline [25].
However, time series obtained from wave buoys describe wave climate only locally and often present large data gaps caused by temporary malfunctions of the buoy or by maintenance operations. The main properties that characterize the sea states are the significant wave height, , and the peak period, . These parameters generally do not show significantly steep spatial gradients in the open ocean, but substantial spatial variations are observed in the enclosed sea.
The sea wave phenomenon is deeply related to the bathymetry in the area where the measuring buoy is installed: typically, a deeper seabed reduces the friction force between waves and seabed, thus preserving the wave energy. Conversely, in shallow water, the wave energy is strongly dissipated. For this reason, the measuring buoy is generally located offshore, several kilometers from the coast.
The fetch is another important parameter that deeply influences wave energy potential. This parameter represents the distance over which the wind mainly blows. Clearly, a large fetch is related to a more intense and regular wave climate, due to the greater distance over which the wind energy is transferred to sea wave.
Focusing our attention on Sicily, Figure 4 shows the wave energy potential along the Sicilian coasts. The red flags represent the measuring buoy.
Figure 4. Measuring buoys installed along the Sicilian coasts.
In the figure, we can identify three main areas, each one characterized by a mean value of wave energy potential. In the northern part (Palermo), the wave energy potential ranges from 3.1 kW/m to 4 kW/m; in the eastern part (Catania), it ranges from 2.1 kW/m to 3 kW/m; finally, in the southwestern part (Mazara del Vallo), the wave potential is higher than 5.1 kW/m.
Using these data and applying a third generation wave model, wave power maps can be made. These charts are useful in determining the wave climate with great accuracy along the coasts. In this way, the individuation of the best sites for the wave exploitation is simplified, allowing the evaluation of electrical energy production after the sea wave energy converter is chosen.
A further instrument is the development of GIS technology (Geographic Information System), useful for the installation of a wave farm. In fact, this system overlaps with different kinds of data in a geographic map, such that all suitable sites for the installation of a wave farm, excluding protected areas, shipping lanes, fishing areas, etc., are individuated.
Figure 4. Measuring buoys installed along the Sicilian coasts.
In the figure, we can identify three main areas, each one characterized by a mean value of waveenergy potential. In the northern part (Palermo), the wave energy potential ranges from 3.1 kW/m to4 kW/m; in the eastern part (Catania), it ranges from 2.1 kW/m to 3 kW/m; finally, in the southwesternpart (Mazara del Vallo), the wave potential is higher than 5.1 kW/m.
Using these data and applying a third generation wave model, wave power maps can be made.These charts are useful in determining the wave climate with great accuracy along the coasts. In thisway, the individuation of the best sites for the wave exploitation is simplified, allowing the evaluationof electrical energy production after the sea wave energy converter is chosen.
A further instrument is the development of GIS technology (Geographic Information System),useful for the installation of a wave farm. In fact, this system overlaps with different kinds of data in ageographic map, such that all suitable sites for the installation of a wave farm, excluding protectedareas, shipping lanes, fishing areas, etc., are individuated.
2.1. Methodology and Sicilian Wave Power Evaluation
In this paper, an in-depth analysis of the sea wave potential along the Sicilian coastline is carriedout using a third generation ocean wave model and wave climate data, collected by measuring buoyssimilar to the DEIM Buoy [26]. In particular, the wave atlas (the map that shows the wave energypotential) was produced from the enormous amount of data measured over a long period by severalbuoys of the “Rete Ondametrica Nazionale” (RON—National Wave Measuring Network). This project

Energies 2016, 9, 1032 7 of 16
started in 1989 and at the beginning was composed of eight pitch-roll buoys, performing samplingevery 3 h. In 2007, the measuring buoys were changed and other measuring points were added,bringing the number of measuring stations to 15 and performing the sampling every 30 min. In thisway, the time resolution is improved, but the spatial resolution is still limited. The RON measures thetypical wave parameters: significant wave height, Hs [m], average period, Tm [s], peak period, Tp [s],and average wave direction, Φm. Using some of the previous parameters, the wave power flux P indeep water can be evaluated using the following Equation (1) [27]:
P =ρg2
64πH2
s Te (1)
in which ρ is seawater density (equals to 1025 kg/m3), and Te represents the energetic period [s],equal to the peak period multiplied by a constant that depends on the shape of the wave spectrum(equal to 0.86 for a Pierson–Moskovitz spectrum and tending to 1 with the decrease in spectralwidth) [28]. Finally, the average wave energy can be obtained by summarizing all sea state waveenergy (see Figure 5).
Energies 2016, 9, 1032 7 of 16
2.1. Methodology and Sicilian Wave Power Evaluation
In this paper, an in-depth analysis of the sea wave potential along the Sicilian coastline is carried out using a third generation ocean wave model and wave climate data, collected by measuring buoys similar to the DEIM Buoy [26]. In particular, the wave atlas (the map that shows the wave energy potential) was produced from the enormous amount of data measured over a long period by several buoys of the “Rete Ondametrica Nazionale” (RON—National Wave Measuring Network). This project started in 1989 and at the beginning was composed of eight pitch-roll buoys, performing sampling every 3 h. In 2007, the measuring buoys were changed and other measuring points were added, bringing the number of measuring stations to 15 and performing the sampling every 30 min. In this way, the time resolution is improved, but the spatial resolution is still limited. The RON measures the typical wave parameters: significant wave height, [m], average period, [s], peak period, [s], and average wave direction, . Using some of the previous parameters, the wave power flux in deep water can be evaluated using the following Equation (1) [27]: = 64 (1)
in which is seawater density (equals to 1025 kg/m3), and represents the energetic period [s], equal to the peak period multiplied by a constant that depends on the shape of the wave spectrum (equal to 0.86 for a Pierson–Moskovitz spectrum and tending to 1 with the decrease in spectral width) [28]. Finally, the average wave energy can be obtained by summarizing all sea state wave energy (see Figure 5).
Figure 5. Evaluation of sea wave energy in Sicily for the year 2013.
2.2. Wave Energy Converter
Here, we present an innovative system able to produce electrical energy from sea waves. The device is currently in the development stage at the Department of Energy, Information Engineering and Mathematical Models (DEIM) of the University of Palermo [29]. This system can be classified as the point absorber (shown in Figure 6), i.e., the device able to convert wave energy to electrical energy independently by the sea wave direction. The innovative aspect is linked to the use of linear generators that directly convert the mechanical energy of waves into electrical, without the use of intermediate devices or polluting fluids [30]. Every point absorber is characterized by a rated power of 80 kW, consisting of eight linear generators of 10 kW each. All electrical devices are installed inside the central buoy, except for a photovoltaic panel (with a rated power of 8.8 kW), which is installed in the upper part of the external buoy.
0
50
100
150
200
250
Jan Feb Mar Apr May Jun Jul Aug Sep Oct Nov Dec
Ave
rage
Wav
e E
nerg
y [k
Wh/
(m*d
ay)]
Figure 5. Evaluation of sea wave energy in Sicily for the year 2013.
2.2. Wave Energy Converter
Here, we present an innovative system able to produce electrical energy from sea waves.The device is currently in the development stage at the Department of Energy, Information Engineeringand Mathematical Models (DEIM) of the University of Palermo [29]. This system can be classifiedas the point absorber (shown in Figure 6), i.e., the device able to convert wave energy to electricalenergy independently by the sea wave direction. The innovative aspect is linked to the use of lineargenerators that directly convert the mechanical energy of waves into electrical, without the use ofintermediate devices or polluting fluids [30]. Every point absorber is characterized by a rated power of80 kW, consisting of eight linear generators of 10 kW each. All electrical devices are installed inside thecentral buoy, except for a photovoltaic panel (with a rated power of 8.8 kW), which is installed in theupper part of the external buoy.

Energies 2016, 9, 1032 8 of 16
Energies 2016, 9, 1032 8 of 16
Figure 6. Model design of the wave energy converter.
The working stroke of the translators is about 4 m; in this way, the WEC will be able to exploit the most energetic sea states in the Mediterranean Sea. The wave motion is captured by the external buoy (yellow in the picture), which has an external diameter of 10 m.
The permanent magnet generator (PMG) is defined as a bilateral generator with two stators. The material used is iron, and it is made by overlapping 126 sheets with thicknesses of 0.5 mm in order to minimize the eddy currents. The geometric dimensions of each single stator are 60 × 1945 × 65 mm. The PMG consists of 75 slots and 16 holes with a diameter of 10.5 mm. In particular, the slots have a width of about 12 mm, except for the first and last three slots, which have a width of about 8 mm. There are two tables of bakelite, each used for assembling the stator block. Figure 7 shows the linear generators installed inside the central buoy.
Figure 7. Internal view of the Department of Energy, Information Engineering and Mathematical Models (DEIM) point absorber.
Figure 6. Model design of the wave energy converter.
The working stroke of the translators is about 4 m; in this way, the WEC will be able to exploit themost energetic sea states in the Mediterranean Sea. The wave motion is captured by the external buoy(yellow in the picture), which has an external diameter of 10 m.
The permanent magnet generator (PMG) is defined as a bilateral generator with two stators.The material used is iron, and it is made by overlapping 126 sheets with thicknesses of 0.5 mmin order to minimize the eddy currents. The geometric dimensions of each single stator are60 mm × 1945 mm × 65 mm. The PMG consists of 75 slots and 16 holes with a diameter of 10.5 mm.In particular, the slots have a width of about 12 mm, except for the first and last three slots, which havea width of about 8 mm. There are two tables of bakelite, each used for assembling the stator block.Figure 7 shows the linear generators installed inside the central buoy.
Energies 2016, 9, 1032 8 of 16
Figure 6. Model design of the wave energy converter.
The working stroke of the translators is about 4 m; in this way, the WEC will be able to exploit the most energetic sea states in the Mediterranean Sea. The wave motion is captured by the external buoy (yellow in the picture), which has an external diameter of 10 m.
The permanent magnet generator (PMG) is defined as a bilateral generator with two stators. The material used is iron, and it is made by overlapping 126 sheets with thicknesses of 0.5 mm in order to minimize the eddy currents. The geometric dimensions of each single stator are 60 × 1945 × 65 mm. The PMG consists of 75 slots and 16 holes with a diameter of 10.5 mm. In particular, the slots have a width of about 12 mm, except for the first and last three slots, which have a width of about 8 mm. There are two tables of bakelite, each used for assembling the stator block. Figure 7 shows the linear generators installed inside the central buoy.
Figure 7. Internal view of the Department of Energy, Information Engineering and Mathematical Models (DEIM) point absorber. Figure 7. Internal view of the Department of Energy, Information Engineering and Mathematical
Models (DEIM) point absorber.
Energies 2016, 9, 1032 9 of 16
Considering a single electrical machine, the translator has a length of about 6 m and iscomposed by a bakelite sheet, where the permanent magnets are installed. On each translator,150 neodymium-iron-boron (Nd-Fe-B) permanent magnets are installed in pairs, alternating themagnetic poles along the motion’s direction of the translator. Each magnet has dimensions of60 mm × 30 mm × 15 mm with a weight of 205 g and is covered by a protective nickel coating.
The coils, installed in the stators, are realized in enameled copper, with a diameter of about 1 mm.Each coil has a rectangular shape, with an average area of about 85 mm × 135 mm and a weight ofabout 2.2 kg. Each linear generator presents 144 coils, divided in two groups in the relative armature.
According to several tests on a small-scale prototype in the DEIM laboratory, in order to simplythe following evaluation, the overall efficiency of this WEC was fixed to 50%.
2.3. Water Resource and Desalination Plant in Sicily
Since the end of the twentieth century, Sicily has suffered a chronic shortage of water. Severaldesalination plants have been installed in order to produce fresh water for agricultural, industrial, andcivil uses [31]. The problem of water scarcity is mitigated in the northern part of Sicily, thanks to thepresence of mountain chains in the hinterland, but is emphasized in the southern part, where rainfallshave amounted to less than 400 mm/year [32].
In Sicily, several problems in water provision are caused by inefficient and incomplete aqueductnetworks connecting the water reserves to users.
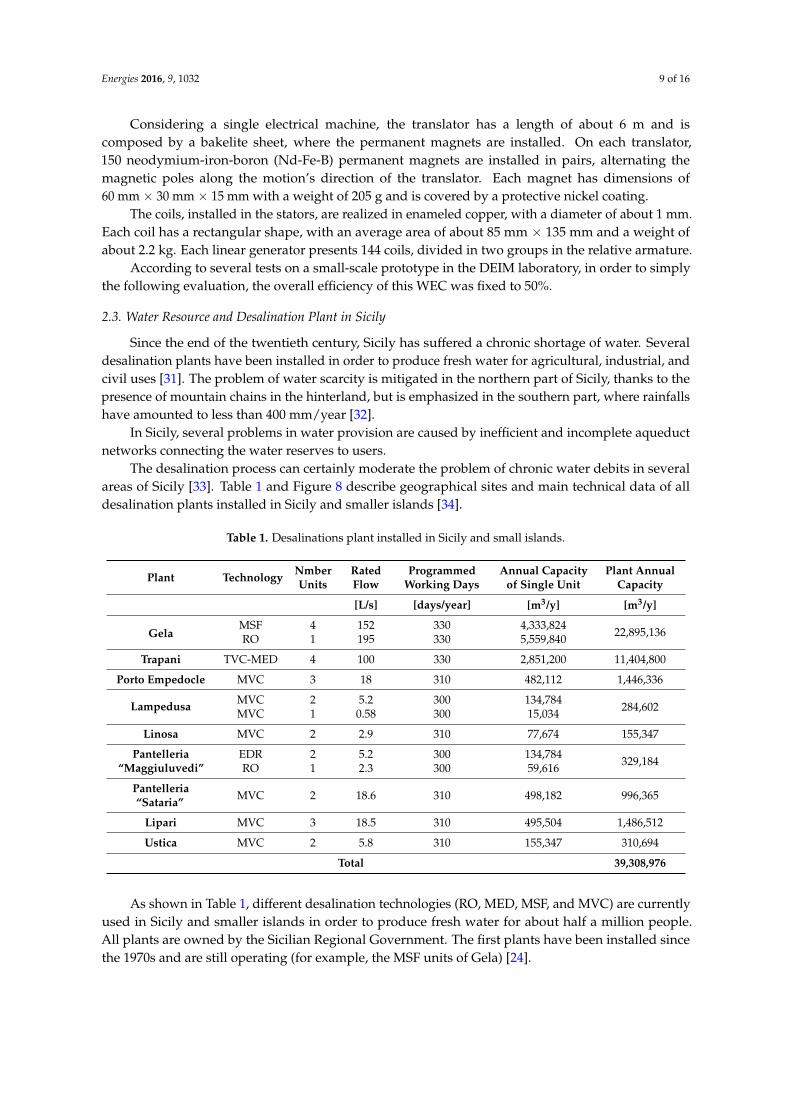
The desalination process can certainly moderate the problem of chronic water debits in severalareas of Sicily [33]. Table 1 and Figure 8 describe geographical sites and main technical data of alldesalination plants installed in Sicily and smaller islands [34].
Table 1. Desalinations plant installed in Sicily and small islands.
Plant Technology NmberUnits
RatedFlow
ProgrammedWorking Days
Annual Capacityof Single Unit
Plant AnnualCapacity
[L/s] [days/year] [m3/y] [m3/y]
GelaMSF 4 152 330 4,333,824
22,895,136RO 1 195 330 5,559,840
Trapani TVC-MED 4 100 330 2,851,200 11,404,800
Porto Empedocle MVC 3 18 310 482,112 1,446,336
Lampedusa MVC 2 5.2 300 134,784284,602MVC 1 0.58 300 15,034
Linosa MVC 2 2.9 310 77,674 155,347
Pantelleria“Maggiuluvedi”
EDR 2 5.2 300 134,784329,184RO 1 2.3 300 59,616
Pantelleria“Sataria” MVC 2 18.6 310 498,182 996,365
Lipari MVC 3 18.5 310 495,504 1,486,512
Ustica MVC 2 5.8 310 155,347 310,694
Total 39,308,976
As shown in Table 1, different desalination technologies (RO, MED, MSF, and MVC) are currentlyused in Sicily and smaller islands in order to produce fresh water for about half a million people.All plants are owned by the Sicilian Regional Government. The first plants have been installed sincethe 1970s and are still operating (for example, the MSF units of Gela) [24].

Energies 2016, 9, 1032 10 of 16
Energies 2016, 9, 1032 9 of 16
Considering a single electrical machine, the translator has a length of about 6 m and is composed by a bakelite sheet, where the permanent magnets are installed. On each translator, 150 neodymium-iron-boron (Nd-Fe-B) permanent magnets are installed in pairs, alternating the magnetic poles along the motion’s direction of the translator. Each magnet has dimensions of 60 × 30 × 15 mm with a weight of 205 g and is covered by a protective nickel coating.
The coils, installed in the stators, are realized in enameled copper, with a diameter of about 1 mm. Each coil has a rectangular shape, with an average area of about 85 × 135 mm and a weight of about 2.2 kg. Each linear generator presents 144 coils, divided in two groups in the relative armature.
According to several tests on a small-scale prototype in the DEIM laboratory, in order to simply the following evaluation, the overall efficiency of this WEC was fixed to 50%.
2.3. Water Resource and Desalination Plant in Sicily
Since the end of the twentieth century, Sicily has suffered a chronic shortage of water. Several desalination plants have been installed in order to produce fresh water for agricultural, industrial, and civil uses [31]. The problem of water scarcity is mitigated in the northern part of Sicily, thanks to the presence of mountain chains in the hinterland, but is emphasized in the southern part, where rainfalls have amounted to less than 400 mm/year [32].
In Sicily, several problems in water provision are caused by inefficient and incomplete aqueduct networks connecting the water reserves to users.
The desalination process can certainly moderate the problem of chronic water debits in several areas of Sicily [33]. Table 1 and Figure 8 describe geographical sites and main technical data of all desalination plants installed in Sicily and smaller islands [34].
As shown in Table 1, different desalination technologies (RO, MED, MSF, and MVC) are currently used in Sicily and smaller islands in order to produce fresh water for about half a million people. All plants are owned by the Sicilian Regional Government. The first plants have been installed since the 1970s and are still operating (for example, the MSF units of Gela) [24].
Figure 8. Distribution of desalination plants in Sicily
Figure 8. Distribution of desalination plants in Sicily.
3. Case Study in Pantelleria: An Application of Wave Energy to Supply the Desalination Plants
The following case study considers the installation of a wave farm with the integration of solarphotovoltaic in order to produce the electrical energy demanded by desalination plants installed inPantelleria. An economic and environmental evaluation is presented.
In Pantelleria, the population usually ranges from a minimal value of about 7700 inhabitantsduring the winter season to 14,000 during the summer due to tourism. As mentioned above,in Pantelleria, the availability of fresh water is limited. In order to mitigate this problem,two desalination plants are installed. The first, located in Maggiuluvedi, is composed of twoelectrodialysis reversal (EDR) units (each one having a capacity of 135,000 m3/year) and a reverseosmosis (RO) unit (with a capacity of 60,000 m3/year). In particular, the EDR units were installed in1975, with changes and developments over the years. The RO unit was installed in 1991. The plant issupplied with brackish water from the Valencia well, located in the middle of the town [34]. The annualplant capacity is about 330,000 m3/year of fresh water.
The second desalination plant is located in Sataria. It was installed in 1992 and is composed bytwo mechanical vapor compressor (MVC) units, each one with a capacity of 496,000 m3/y. The totalcapacity of plant is equal to 992,000 m3/y. The plant is supplied with seawater. Table 2 reports maindata about the desalination plants installed in Pantelleria.
Table 2. Main data of desalination plants installed in Pantelleria.
Data Maggiuluvedi Sataria
Pump power 20 kW 120 kWDesalination power 300 kW 1680 kW
Technologies 2 EDR units (5.2 L/s) 1 RO unit (2.3 L/s) 2 MVC units (209 L/s)Water source brackish water from the Valencia well Seawater
Annual capacity 329,184 m3/year 996,365 m3/yearProgrammed working days 300 [82%] 310 [85%]Annual electrical consume 2304 MWh/year 13,392 MWh/year
In Pantelleria, like other small islands in the Mediterranean Sea, electrical energy production isalmost completely based on fossil fuels [35] and is usually supplied through ship or mainland. In orderto reduce the emissions and dependence on fossil fuels, usually imported by countries characterizedby political instability and conflicts, several projects have investigated the possibility of combiningdesalination processes with renewable energy sources.

Energies 2016, 9, 1032 11 of 16
For example, the MEDIRAS project (see Figure 9) uses membrane distillation technology.The prototype has a rated capacity of about 5 m3/day. The heat required in the distillation processis obtained by using solar thermal panels (about 30%) and recovering the waste heat of the dieselgenerator plant (about 70%) [36,37].
Energies 2016, 9, 1032 11 of 16
For example, the MEDIRAS project (see Figure 9) uses membrane distillation technology. The prototype has a rated capacity of about 5 m3/day. The heat required in the distillation process is obtained by using solar thermal panels (about 30%) and recovering the waste heat of the diesel generator plant (about 70%) [36,37].
Figure 9. MEDIRAS project MD pilot plant installed in Pantelleria, (a) PV systems; (b) desalination plant pilot obtained from Viola [16], with permission Licensed under CC BY-NC 4.0 from International Journal of Heat and Technology, 2016.
Another pilot plant has been realized by PROTECNO S.r.l. and is based on four RO units. The plant has a rated capacity of about 11,100 m3/day (462.5 m3/h) and uses the seawater directly to produce fresh water. Three treatments have been realized: pretreatment in ultrafiltration, desalination in RO units, and re-mineralization.
These projects certainly allow for a reduction in fossil fuel consumption in the desalination process thanks to the integration of renewable sources. Another interesting solution is the coupling of the desalination process and sea wave sources. This system can be installed in several small islands in the Mediterranean Sea. In particular, as a case study, we focus our attention on Pantelleria Island.
Several studies have evaluated the wave energy potential around Pantelleria. In particular, according to ENEA (Ente per le Nuove tecnologie l’Energia e l’Ambiente) research, based on their own simulating software, the average annual wave potential is about 7 kW/m, a considerable value for the Mediterranean Sea. The theoretical annual energy production is estimated at about 60 MWh/m. The main direction of the wave front is northwest, with a significant height of about 4 m [38].
The “Politecnico di Torino” [39] conducted an important study measuring the average power along Pantelleria’s coasts using a Nortek AWAC buoy installed 800 m from North-West Pantelleria Island. Figure 10 shows the results of the Politecnico study. The maximum annual energy is connected to a significant wave height from 1 m to 3 m and a peak period from 5.5 s to 8.5 s. The Politecnico study confirms that the average annual wave power is equal to 7 kW/m [39].
Figure 10. Hourly recurrence and scattering table of extractable energy, measured by Nortek AWAC. obtained from Viola [16], with permission Licensed under CC BY-NC 4.0 from International Journal of Heat and Technology, 2016.
Figure 9. MEDIRAS project MD pilot plant installed in Pantelleria, (a) PV systems; (b) desalinationplant pilot obtained from Viola [16], with permission Licensed under CC BY-NC 4.0 from InternationalJournal of Heat and Technology, 2016.
Another pilot plant has been realized by PROTECNO S.r.l. and is based on four RO units.The plant has a rated capacity of about 11,100 m3/day (462.5 m3/h) and uses the seawater directly toproduce fresh water. Three treatments have been realized: pretreatment in ultrafiltration, desalinationin RO units, and re-mineralization.
These projects certainly allow for a reduction in fossil fuel consumption in the desalination processthanks to the integration of renewable sources. Another interesting solution is the coupling of thedesalination process and sea wave sources. This system can be installed in several small islands in theMediterranean Sea. In particular, as a case study, we focus our attention on Pantelleria Island.
Several studies have evaluated the wave energy potential around Pantelleria. In particular,according to ENEA (Ente per le Nuove tecnologie l’Energia e l’Ambiente) research, based on their ownsimulating software, the average annual wave potential is about 7 kW/m, a considerable value forthe Mediterranean Sea. The theoretical annual energy production is estimated at about 60 MWh/m.The main direction of the wave front is northwest, with a significant height of about 4 m [38].
The “Politecnico di Torino” [39] conducted an important study measuring the average poweralong Pantelleria’s coasts using a Nortek AWAC buoy installed 800 m from North-West PantelleriaIsland. Figure 10 shows the results of the Politecnico study. The maximum annual energy is connectedto a significant wave height from 1 m to 3 m and a peak period from 5.5 s to 8.5 s. The Politecnicostudy confirms that the average annual wave power is equal to 7 kW/m [39].
Energies 2016, 9, 1032 11 of 16
For example, the MEDIRAS project (see Figure 9) uses membrane distillation technology. The prototype has a rated capacity of about 5 m3/day. The heat required in the distillation process is obtained by using solar thermal panels (about 30%) and recovering the waste heat of the diesel generator plant (about 70%) [36,37].
Figure 9. MEDIRAS project MD pilot plant installed in Pantelleria, (a) PV systems; (b) desalination plant pilot obtained from Viola [16], with permission Licensed under CC BY-NC 4.0 from International Journal of Heat and Technology, 2016.
Another pilot plant has been realized by PROTECNO S.r.l. and is based on four RO units. The plant has a rated capacity of about 11,100 m3/day (462.5 m3/h) and uses the seawater directly to produce fresh water. Three treatments have been realized: pretreatment in ultrafiltration, desalination in RO units, and re-mineralization.
These projects certainly allow for a reduction in fossil fuel consumption in the desalination process thanks to the integration of renewable sources. Another interesting solution is the coupling of the desalination process and sea wave sources. This system can be installed in several small islands in the Mediterranean Sea. In particular, as a case study, we focus our attention on Pantelleria Island.
Several studies have evaluated the wave energy potential around Pantelleria. In particular, according to ENEA (Ente per le Nuove tecnologie l’Energia e l’Ambiente) research, based on their own simulating software, the average annual wave potential is about 7 kW/m, a considerable value for the Mediterranean Sea. The theoretical annual energy production is estimated at about 60 MWh/m. The main direction of the wave front is northwest, with a significant height of about 4 m [38].
The “Politecnico di Torino” [39] conducted an important study measuring the average power along Pantelleria’s coasts using a Nortek AWAC buoy installed 800 m from North-West Pantelleria Island. Figure 10 shows the results of the Politecnico study. The maximum annual energy is connected to a significant wave height from 1 m to 3 m and a peak period from 5.5 s to 8.5 s. The Politecnico study confirms that the average annual wave power is equal to 7 kW/m [39].
Figure 10. Hourly recurrence and scattering table of extractable energy, measured by Nortek AWAC. obtained from Viola [16], with permission Licensed under CC BY-NC 4.0 from International Journal of Heat and Technology, 2016.
Figure 10. Hourly recurrence and scattering table of extractable energy, measured by Nortek AWAC.obtained from Viola [16], with permission Licensed under CC BY-NC 4.0 from International Journal ofHeat and Technology, 2016.
Energies 2016, 9, 1032 12 of 16
The Sea Wave Farm Based on DEIM Converter
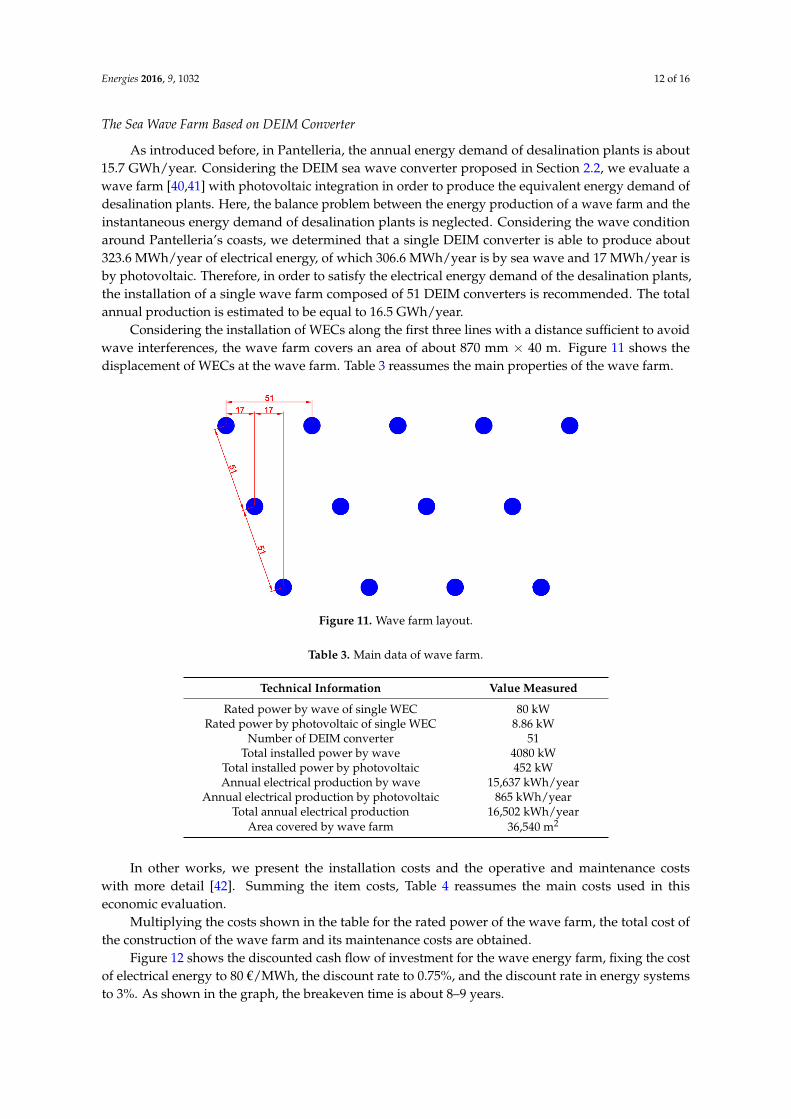
As introduced before, in Pantelleria, the annual energy demand of desalination plants is about15.7 GWh/year. Considering the DEIM sea wave converter proposed in Section 2.2, we evaluate awave farm [40,41] with photovoltaic integration in order to produce the equivalent energy demand ofdesalination plants. Here, the balance problem between the energy production of a wave farm and theinstantaneous energy demand of desalination plants is neglected. Considering the wave conditionaround Pantelleria’s coasts, we determined that a single DEIM converter is able to produce about323.6 MWh/year of electrical energy, of which 306.6 MWh/year is by sea wave and 17 MWh/year isby photovoltaic. Therefore, in order to satisfy the electrical energy demand of the desalination plants,the installation of a single wave farm composed of 51 DEIM converters is recommended. The totalannual production is estimated to be equal to 16.5 GWh/year.
Considering the installation of WECs along the first three lines with a distance sufficient to avoidwave interferences, the wave farm covers an area of about 870 mm × 40 m. Figure 11 shows thedisplacement of WECs at the wave farm. Table 3 reassumes the main properties of the wave farm.
Energies 2016, 9, 1032 12 of 16
3.1. The Sea Wave Farm Based on DEIM Converter
As introduced before, in Pantelleria, the annual energy demand of desalination plants is about 15.7 GWh/year. Considering the DEIM sea wave converter proposed in Section 2.2, we evaluate a wave farm [40,41] with photovoltaic integration in order to produce the equivalent energy demand of desalination plants. Here, the balance problem between the energy production of a wave farm and the instantaneous energy demand of desalination plants is neglected. Considering the wave condition around Pantelleria’s coasts, we determined that a single DEIM converter is able to produce about 323.6 MWh/year of electrical energy, of which 306.6 MWh/year is by sea wave and 17 MWh/year is by photovoltaic. Therefore, in order to satisfy the electrical energy demand of the desalination plants, the installation of a single wave farm composed of 51 DEIM converters is recommended. The total annual production is estimated to be equal to 16.5 GWh/year.
Considering the installation of WECs along the first three lines with a distance sufficient to avoid wave interferences, the wave farm covers an area of about 870 × 40 m. Figure 11 shows the displacement of WECs at the wave farm. Table 3 reassumes the main properties of the wave farm.
Figure 11. Wave farm layout.
Table 3. Main data of wave farm.
Technical Information Value Measured Rated power by wave of single WEC 80 kW
Rated power by photovoltaic of single WEC 8.86 kW Number of DEIM converter 51
Total installed power by wave 4080 kW Total installed power by photovoltaic 452 kW Annual electrical production by wave 15,637 kWh/year
Annual electrical production by photovoltaic 865 kWh/year Total annual electrical production 16,502 kWh/year
Area covered by wave farm 36,540 m2
In other works, we present the installation costs and the operative and maintenance costs with more detail [42]. Summing the item costs, Table 4 reassumes the main costs used in this economic evaluation.
Figure 11. Wave farm layout.
Table 3. Main data of wave farm.
Technical Information Value Measured
Rated power by wave of single WEC 80 kWRated power by photovoltaic of single WEC 8.86 kW
Number of DEIM converter 51Total installed power by wave 4080 kW
Total installed power by photovoltaic 452 kWAnnual electrical production by wave 15,637 kWh/year
Annual electrical production by photovoltaic 865 kWh/yearTotal annual electrical production 16,502 kWh/year
Area covered by wave farm 36,540 m2
In other works, we present the installation costs and the operative and maintenance costswith more detail [42]. Summing the item costs, Table 4 reassumes the main costs used in thiseconomic evaluation.
Multiplying the costs shown in the table for the rated power of the wave farm, the total cost ofthe construction of the wave farm and its maintenance costs are obtained.
Figure 12 shows the discounted cash flow of investment for the wave energy farm, fixing the costof electrical energy to 80 €/MWh, the discount rate to 0.75%, and the discount rate in energy systemsto 3%. As shown in the graph, the breakeven time is about 8–9 years.

Energies 2016, 9, 1032 13 of 16
Table 4. Initial cost items, operative, and maintenance costs of the wave farm.
Initial Costs
Item costs [€/kW] [€]WEC installation 290 1,183,200WEC assembling 2500 10,200,000
Additional PV purchase and assembling 1650 894,300
Total 12,277,500
Operative and Maintenance Costs
Item costs [€/(kW year)] [€]WEC maintenance 5.25 21,420PV maintenance 3.00 12,240
Total 33,660
Energies 2016, 9, 1032 13 of 16
Table 4. Initial cost items, operative, and maintenance costs of the wave farm.
Initial CostsItem costs [€/kW] [€]
WEC installation 290 1,183,200 WEC assembling 2500 10,200,000
Additional PV purchase and assembling 1650 894,300 Total 12,277,500
Operative and Maintenance CostsItem costs [€/(kW year)] [€]
WEC maintenance 5.25 21,420 PV maintenance 3.00 12,240
Total 33,660
Multiplying the costs shown in the table for the rated power of the wave farm, the total cost of the construction of the wave farm and its maintenance costs are obtained.
Figure 12 shows the discounted cash flow of investment for the wave energy farm, fixing the cost of electrical energy to 80 €/MWh, the discount rate to 0.75%, and the discount rate in energy systems to 3%. As shown in the graph, the breakeven time is about 8–9 years.
Figure 12. Discounted flow cash of wave farm investments.
As regards the environmental aspects, in Pantelleria, the electrical energy is currently produced by diesel generators owned by the company SMEDE. According to the data reported in [43], this power plant presents a fuel (diesel) consumption equal to 0.0843 kg/kWh; therefore, the installation of the wave farm was able to avoid the consumption of 1391 tons of diesel. Finally, considering the CO2 emission factor of the SMEDE power plant (0.267 tons CO2/MWh) [43], 4406 tons/year of CO2 emissions are avoided.
4. Conclusions
The paper shows the relation between water and energy, focusing attention on the desalination process, a method of water treatment with the greatest energy consumption. In order to reduce energy dependence on fossil fuels, the integration of renewable sources in the desalination process is evaluated. In particular, as a case study, the sea wave resource is investigated in order to produce the electrical energy demand of the desalination plants installed on Pantelleria. Considering the wave energy potential around the island (7 kW/m), the installation of a single wave farm, based on the DEIM converter, is able to produce enough electrical energy to supply the desalination plants in
-15
-10
-5
0
5
10
15
20
25
30
35
year
0ye
ar 1
year
2ye
ar 3
year
4ye
ar 5
year
6ye
ar 7
year
8ye
ar 9
year
10
year
11
year
12
year
13
year
14
year
15
year
16
year
17
year
18
year
19
year
20
year
21
year
22
year
23
year
24
year
25
Mill
ion
€
Figure 12. Discounted flow cash of wave farm investments.
As regards the environmental aspects, in Pantelleria, the electrical energy is currently producedby diesel generators owned by the company SMEDE. According to the data reported in [43], this powerplant presents a fuel (diesel) consumption equal to 0.0843 kg/kWh; therefore, the installation ofthe wave farm was able to avoid the consumption of 1391 tons of diesel. Finally, considering theCO2 emission factor of the SMEDE power plant (0.267 tons CO2/MWh) [43], 4406 tons/year of CO2
emissions are avoided.
4. Conclusions
The paper shows the relation between water and energy, focusing attention on the desalinationprocess, a method of water treatment with the greatest energy consumption. In order to reduceenergy dependence on fossil fuels, the integration of renewable sources in the desalination process isevaluated. In particular, as a case study, the sea wave resource is investigated in order to produce theelectrical energy demand of the desalination plants installed on Pantelleria. Considering the waveenergy potential around the island (7 kW/m), the installation of a single wave farm, based on theDEIM converter, is able to produce enough electrical energy to supply the desalination plants inPantelleria. In this way, every year, the emission of 1391 tons of diesel and, consequently, 4406 tons ofCO2 is avoided every year, reducing the environmental impact of Pantelleria.

Energies 2016, 9, 1032 14 of 16
Author Contributions: All authors contributed equally but in fact, Domenico Curto designed WEC prototype,Daniele Milone developed the economic analysis of the system adopted, Alessia Viola studied a possibleintegration among RES and desalination processes (specifically in Sicily) and Vincenzo Franzitta wrote the paper.
Conflicts of Interest: The authors declare no conflict of interest.
References
1. Franzitta, V.; Milone, A.; Milone, D.; Trapanese, M.; Viola, A. A Procedure to Evaluate the Indoor GlobalQuality by a Sub Objective-Objective Procedure. Adv. Mater. Res. 2013, 734, 3065–3070. [CrossRef]
2. Franzitta, V.; Milone, D.; Trapanese, M.; Viola, A.; Di Dio, V.; Pitruzzella, S. Energy and Economic Comparisonof Different Conditioning System among Traditional and Eco-Sustainable Building. Appl. Mech. Mater. 2013,394, 289–295. [CrossRef]
3. Milone, D.; Pitruzzella, S.; Franzitta, V.; Viola, A.; Trapanese, M. Energy Savings through Integration of theIllumination Natural and Artificial, Using a System of Automatic Dimming: Case Study. Appl. Mech. Mater.2013, 372, 253–258. [CrossRef]
4. Franzitta, V.; Milone, A.; Milone, D.; Pitruzzella, S.; Trapanese, M.; Viola, A. Experimental Evidence on theThermal Performance of Opaque Surfaces in Mediterranean Climate. Adv. Mater. Res. 2013, 860, 1227–1231.[CrossRef]
5. Fao, W.F.P. The State of Food Insecurity in the World 2012; Food and Agriculture Organization of the UnitedNations (FAO): Rome, Italy, 2012.
6. International Energy Agency (IEA). Water for Energy: Is Energy Becoming a Thirstier Resource? World EnergyOutlook: Paris, France, 2012; pp. 1–33.
7. UN Water. The United Nations World Water Development Report 2014; United Nations Educational, Scientificand Cultural Organization: Paris, France, 2014.
8. Kalogirou, S.A. Seawater desalination using renewable energy sources. Prog. Energy Combust. Sci. 2005, 31,242–281. [CrossRef]
9. García-Rodríguez, L. Renewable energy applications in desalination: State of the art. Sol. Energy 2003, 75,381–393. [CrossRef]
10. Eltawil, M.A.; Zhao, Z.M.; Yuan, L.Q. A review of renewable energy technologies integrated with desalinationsystems. Renew. Sustain. Energy Rev. 2009, 13, 2245–2262. [CrossRef]
11. Mathioulakis, E.; Belessiotis, V.; Delyannis, E. Desalination by using alternative energy: Review andstate-of-the-art. Desalination 2007, 203, 346–365. [CrossRef]
12. Volpe, M.; Panno, D.; Volpe, R.; Messineo, A. Upgrade of citrus waste as a biofuel via slow pyrolysis. J. Anal.Appl. Pyrolysis 2015, 115, 66–76. [CrossRef]
13. Volpe, R.; Messineo, A.; Millan, M.; Volpe, M.; Kandiyoti, R. Assessment of olive wastes as energy source:Pyrolysis, torrefaction and the key role of H loss in thermal breakdown. Energy 2015, 82, 119–127. [CrossRef]
14. Sahoo, U.; Kumar, R.; Pant, P.C.; Chaudhury, R. Scope and sustainability of hybrid solar-biomass powerplant with cooling, desalination in polygeneration process in India. Renew. Sustain. Energy Rev. 2015, 51,304–316. [CrossRef]
15. Kalogirou, S. Solar Energy Engineering: Processes and Systems; Elsevier/Academic Press: Burlington, MA,USA, 2009.
16. Viola, A.; Franzitta, V.; Trapanese, M.; Curto, D. Nexus Water & Energy: A Case Study of Wave EnergyConverters (WECs) to Desalination Applications in Sicily. Int. J. Heat Technol. 2016, 34, S379–S386.
17. Rousseau, N. Oceans of Energy—European Ocean Energy Roadmap 2010–2050. Available online:https://www.icoe-conference.com/publication/oceans_of_energy_european_ocean_energy_roadmap_2010_2050/ (accessed on 10 November 2016).
18. Falcão, A.F.D.O. Wave energy utilization: A review of the technologies. Renew. Sustain. Energy Rev. 2010, 14,899–918. [CrossRef]
19. Colucci, A.; Boscaino, V.; Cipriani, G.; Curto, D.; di Dio, V.; Franzitta, V.; Trapanese, M.; Viola, A. An inertialsystem for the production of electricity and hydrogen from sea wave energy. In Proceedings of the Oceans2015 MTS/IEEE Washington, Washington, DC, USA, 19–22 October 2015.
20. Annual Report 2014: Implementig Agreement on Ocean Energy Systems; Ocean Energy Systems (OES) andInternational Energy Agency (IEA): Lisbon, Portugal, 2014.

Energies 2016, 9, 1032 15 of 16
21. Franzitta, V.; Curto, D.; Rao, D.; Viola, A. Hydrogen Production from Sea Wave for Alternative EnergyVehicles for Public Transport in Trapani (Italy). Energies 2016, 9. [CrossRef]
22. Iglesias, G.; Carballo, R. Wave energy and nearshore hot spots: The case of the SE Bay of Biscay. Renew. Energy2010, 35, 2490–2500. [CrossRef]
23. Guillou, N.; Chapalain, G. Numerical modelling of nearshore wave energy resource in the Sea of Iroise.Renew. Energy 2015, 83, 942–953. [CrossRef]
24. Vicinanza, D.; Cappietti, L.; Ferrante, V.; Contestabile, P. Estimation of the wave energy in the Italian offshore.J. Coast. Res. 2011, 64, 613–617.
25. Vicinanza, D.; Cappietti, L.; Contestabile, P. Assessment of Wave Energy around Italy. In Proceedings of the8th European Wave Tidal Energy Conference, Uppsala, Sweden, 7–10 September 2009; pp. 256–262.
26. Franzitta, V.; Trapanese, M.; Giaconia, C.; Ferrara, P.; Viola, A. Design and experimental test of a lowcostweather buoy. In Proceedings of the 2013 MTS/IEEE Conference on OCEANS—Bergen, Bergen, Norway,10–14 June 2013; pp. 1–5.
27. Sannino, G.; Bargagli, A.; Carillo, A.; Caiaffa, E.; Lombardi, E.; Monti, P.; Leuzzi, G. Valutazione del PotenzialeEnergetico del Moto Ondoso Lungo le Coste Italiane. Availble online: http://www.enea.it/it/Ricerca_sviluppo/documenti/ricerca-di-sistema-elettrico/correnti-marine/rds-151.pdf (accessed on 3 August 2016).
28. Cornett, A. A global wave energy resource assessment. In Proceedings of the Eighteenth InternationalOffshore and Polar Engineering Conference, Vancouver, BC, Canada, 6–11 July 2008.
29. Di Dio, V.; Franzitta, V.; Milone, D.; Pitruzzella, S.; Trapanese, M.; Viola, A. Design of Bilateral SwitchedReluctance Linear Generator to Convert Wave Energy: Case Study in Sicily. Adv. Mater. Res. 2013, 860,1694–1698. [CrossRef]
30. Viola, A.; Franzitta, V.; Curto, D.; di Dio, V.; Milone, D.; Rodono, G. Environmental Impact Assessment(EIA) of Wave Energy Converter (WEC). In Proceedings of the OCEANS 2015—Genova, Genova, Italy,18–21 May 2015; pp. 1–4.
31. Francipane, A.; Pumo, D.; Viola, F.; Noto, L.V. Long Term Analysis of Small Desalination Plant for PotableWater Supply of Tourist Areas (In Sicily). Available online: https://www.researchgate.net/publication/257116870_Long_term_analysis_of_small_desalination_plant_for_potable_water_supply_of_tourist_areas_in_Sicily (accessed on 3 August 2016).
32. Beccali, M.; Sorge, M.; Galletto, J. The Potential of Renewable Energies in Sicily for Water DesalinationApplications. In Solar Desalination for the 21st Century; Rizzuti, L., Ettouney, H.M., Cipollina, A., Eds.;Springer: Dordrecht, The Netherlands, 2007; pp. 179–194.
33. Cipollina, A.; Micale, G.; Rizzuti, L. A critical assessment of desalination operations in Sicily. Desalination2005, 182, 1–12. [CrossRef]
34. Curto, G.; Napoli, E.; Rizzuti, L. Desalination—The Matured Experience in Sicily in DesalinationField. Available online: http://www.depuratorenosedo.eu/en/images/stories/ia_5_2009.pdf (accessed on3 August 2016).
35. Franzitta, V.; Curto, D.; Rao, D.; Milone, D. Near zero energy island with sea wave energy: The case studyof Pantelleria in Mediterranean Sea. In Proceedings of the OCEANS 2016—Shanghai, Shangai, China,10–13 April 2016; pp. 1–5.
36. Bundschuh, J.; Hoinkis, J. Renewable Energy Applications for Freshwater Production; CRC Press: London,UK, 2012.
37. Basile, A.; Cassano, A.; Rastogi, N.K. Advances in Membrane Technologies for Water Treatment; Elsevier: Boston,MA, USA, 2015.
38. Carillo, A.; Bargagli, A.; Caiaffa, E.; Iacono, R.; Sannino, G. Stima del Potenziale Energetico Associato al MotoOndoso in Regioni Campione della Costa Italiana. Available online: http://openarchive.enea.it/handle/10840/4525 (accessed on 3 August 2016).
39. Mattiazzo, G.; Giorcelli, E.; Poggi, D.; Sannino, G.; Carillo, A. Progettazione di un Sistema di Produzionedi Energia da Moto Ondoso in Scala Reale. Available online: http://editors.enea.it/it/Ricerca_sviluppo/documenti/ricerca-di-sistema-elettrico/energia-dal-mare/2012/rds-2013-084.pdf (accessed on3 Febrary 2016).
40. Trapanese, M.; Franzitta, V.; Viola, A. A dynamic model for hysteresis in magnetostrictive devices.J. Appl. Phys. 2014, 115, 1–4. [CrossRef]

Energies 2016, 9, 1032 16 of 16
41. Franzitta, V.; Viola, A.; Trapanese, M. Design of a transverse flux machine for power generation fromseawaves. J. Appl. Phys. 2014, 115, 17E712. [CrossRef]
42. Franzitta, V.; Curto, D.; Rao, D. Energetic Sustainability Using Renewable Energies in the Mediterranean Sea.Sustainability 2016, 8. [CrossRef]
43. Ambiente Italia S.R.L. Piano D’azione per L’energia Sostenibile del COMUNE di Pantelleria—2015.Available online: http://www.smartisland.eu/images/documenti_report/Pantelleria_Paes.pdf (accessedon 3 August 2016).
© 2016 by the authors; licensee MDPI, Basel, Switzerland. This article is an open accessarticle distributed under the terms and conditions of the Creative Commons Attribution(CC-BY) license (http://creativecommons.org/licenses/by/4.0/).