the deepwater horizon catastrophe: explanation on the
TRANSCRIPT

Université Libre de Bruxelles Institut de Gestion de l'Environnement et d'Aménagement du Territoire
Faculté des SciencesMaster en Sciences et Gestion de l'environnement
The DeepWater Horizon Catastrophe: Explanation on the Causes and Management of a Regional Disaster and How Such an Event Can Influence Further North American Offshore Oil Development
Mémoire de fin d'étude présenté par BLERET Elizabeth
en vue de l'obtention du grade académique deMaster en sciences et gestion de l'environnementFinalité Gestion de l'Environnement ENVI5G-M
Année académique 2011-2012
Promoteur : Prof. Edwin Zaccai
Page 1 from 101

Remerciements
Ce travail a été réalisé grâce à la disponibilité et à la collaboration d' Edwin Zaccai, qui m'a aiguillée et
conseillée.
Je remercie également Alain Préat, géologue à l'ULB, qui m'a accordé de son temps précieux et m'a
permis par ses remarques avisées de considérer des aspects de l'industrie pétrolière qui m'auraient
peut-être échappés.
Je remercie aussi tout particulièrement Stephanie Bequet, géologue chez Total, pour son aide et sa gen-
tillesse.
J'exprime en outre toute ma gratitude à toutes les personnes que je n'ai pas citées ici et qui ont permis
que ce travail se concrétise.
Page 2 from 101

Résumé
Le 20 avril 2010, une explosion et un incendie dévastèrent la plateforme de forage 'Deepawater Hori-
zon' située dans le Golfe du Mexique à 50 miles au sud-est de Venice, près de la Louisiane. L'explo-
sion tua onze travailleurs et en blessa 16 autres. Il s'ensuivit une marée noire provenant du puits Ma -
condo que cette plateforme n'avait pas eu le temps de sceller. Pendant 87 jours, 780 000 m³ de pétrole
ont jaillit de cet orifice pour se déverser sans interruption dans le Golfe du Mexique.
Cet évènement dramatique représente un tournant dans la politique américaine en matière de forage
offshore. La catastrophe est, par son ampleur et sa durée, la plus grande catastrophe pétrolière que les
Etats-Unis aient connue jusqu'à présent. Les activités offshore revêtent un aspect cruciale dans le poli-
tique énergétique américaine car elle contribue significativement à la production nationale. Le cadre
juridique a fortement évolué depuis les années 70. Néanmoins, il ne fut pas assez robuste pour éviter
une catastrophe d'une ampleur telle que celle du Golfe du Mexique. Les causes de ce désastre ne sont
pas seulement imputable a BP et ses contractants, il s'agit d'un ensemble d'erreurs et de lacunes égale-
ment imputables à l'industrie pétrolière dans son ensemble et à un État américain trop laxiste en ma-
tière de sécurité. Les méthodes utilisées, tant pendant la durée de la crise (le déversement du pétrole)
qu'après le scellage du puits afin de réduire l'impact du pétrole sur le Golfe du Mexique, sont sans pré-
cédents. Cela va de moyens purement techniques comme la collecte du pétrole et le nettoyage des oi -
seaux jusqu'au déversement de grandes quantités de dispersant à la surface et à 5000 pieds, au point de
jaillissement du pétrole.
Les décisions prises le furent dans l'urgence et reflètent un manque de préparation criant face à ce
genre d'accidents pourtant prévisibles. Les conséquences de la marée noire sont multiples et
concernent évidement les écosystèmes locaux (voire éloignés), l'économie régionale supportée par les
industries pétrolières (déstabilisées par le moratoire et les nouvelles normes), de la pêche (impactée
par la fermeture des zones de pêches et les craintes subséquentes liés à la contamination possible des
produit issus du golfe) et du tourisme. L'aspect sanitaire est l'un des autres problèmes qui surgit avec la
marée noire et l'usage de dispersant. Les habitants de la région ainsi que les volontaires ayant participé
aux actions de nettoyage ont été exposé à des substances dangereuses dont l'impact réel n'a pas encore
été identifié avec précision. La marée noire ayant suivi l'explosion a ébranlé l'économie d'une région
toute entière mais a également déstabilisé la nation américaine fortement dépendante du golfe en ma-
tière énergétique.
Des modifications majeures, tant au niveau légal que technique, ont fort heureusement été instaurées
suite à la catastrophe. Néanmoins, les projets de forage offshore continuent de se multiplier, et ce avec
le support du gouvernement américain, qui en retire un profit non négligeable.
Page 3 from 101

Table of ContentList of Acronyms and Abbreviations......................................................................................................6
List of Figures........................................................................................................................................7
Introduction............................................................................................................................................8
1 Oil and Offshore Drilling in the USA.................................................................................................9 1.1 Oil..........................................................................................................................................................9 1.2 Origins of Oil Pollution in the Marine Environment..........................................................................10
1.2.1 Spills from Tanker Incidents.........................................................................................................10 1.2.2 Operational Discharges ................................................................................................................10 1.2.3 Marine Blowouts...........................................................................................................................11 1.2.4 Oil Seepage: a Natural Pollution?.................................................................................................11
1.3 Oil Exploration and Drilling in North America..................................................................................12 1.3.1 Offshore Drilling: Overview.........................................................................................................13 1.3.2 The Gulf of Mexico ......................................................................................................................14
1.4 Legal Framework for Offshore Drilling in the US..............................................................................15 1.4.1 The US Outer Continental Shelf (OCS)........................................................................................16 1.4.2 Offshore Legislation: Evolution....................................................................................................17 1.4.3 Liability Regime............................................................................................................................18 1.4.4 Interactions with Other Uses of Coastal Land and Waters...........................................................19
2 The Deep Water Horizon Catastrophe...............................................................................................21 2.1 The Macondo Well : Acquisition and Exploitation.............................................................................22 2.2 Immediate Reason of the Explosion....................................................................................................24 2.3 Causes and Origins..............................................................................................................................25
2.3.1 Acts of Negligence and Missteps .................................................................................................25 2.3.2 Industry Management and Self-policing Failures.........................................................................26
2.3.2.1 The Offshore Oil and Gas Industry................................................................................................27 2.3.2.2 BP's Safety Culture........................................................................................................................28
2.3.3 Laxity of the Federal Regulation..................................................................................................29 2.4 Liability for the Accident....................................................................................................................31 2.5 Crisis Management..............................................................................................................................32
2.5.1 Response : Sealing the Well..........................................................................................................32 2.5.2 Political Shortcomings..................................................................................................................35 2.5.3 Mitigation and Remediation Measures ........................................................................................36
2.5.3.1 Booms and Skimmers....................................................................................................................36 2.5.3.2 Burning Oil and Bioremediation....................................................................................................37 2.5.3.3 Cleanup Workers............................................................................................................................38 2.5.3.4 Use of Dispersant...........................................................................................................................38 2.5.3.5 Ecological Engineering or the Relevance of Taking Actions........................................................39
2.5.4 Safety and Economical Measures.................................................................................................40 2.5.4.1 Seafood Safety...............................................................................................................................40 2.5.4.2 Participation of the Fishing Sector.................................................................................................41 2.5.4.3 Voluntary Responders' Safety........................................................................................................41
Page 4 from 101

2.5.4.4 Offshore Drilling Moratorium.......................................................................................................42 2.5.5 Wildlife's Protection......................................................................................................................43 2.5.6 Where is the Oil?...........................................................................................................................43 2.5.7 Communication and Information..................................................................................................45
2.5.7.1 BP's Decoupling Strategy..............................................................................................................45 2.5.7.2 BP Image Preservation and Restoration.........................................................................................45
3 Consequences of the Rig Explosion in the Gulf of Mexico..............................................................48 3.1 Human and Social Impacts..................................................................................................................48
3.1.1 Health............................................................................................................................................49 3.1.1.1 Cleaning-up Teams and Residents.................................................................................................49 3.1.1.2 Tar balls..........................................................................................................................................50 3.1.1.3 Oily Debris.....................................................................................................................................51
3.1.2 Seafood..........................................................................................................................................51 3.1.3 Psychological Impact....................................................................................................................52
3.2 Environmental Impact.........................................................................................................................53 3.2.1 The Gulf of Mexico : a Complex Ecosystem ..............................................................................54
3.2.1.1 About the Impact of the Oil Slick on Fauna and Flora..................................................................54 3.2.1.2 Protection Concerns.......................................................................................................................55 3.2.1.3 Plumes............................................................................................................................................56
3.2.2 Wet Zones......................................................................................................................................57 3.2.3 Environmental Impacts on Distant Ecosystems: the Case of Migratory Shorebirds...................58 3.2.4 Ecosystem Damage Evaluation: a Positive Outcome of the Disaster?.........................................60
3.3 Economic Impacts...............................................................................................................................61 3.3.1 Tourism..........................................................................................................................................62 3.3.2 Fishing and Maritime Industry......................................................................................................63 3.3.3 The Energy Sector.........................................................................................................................64 3.3.4 The Case of the Gulf Coast Shrimp Supply Chain.......................................................................65
4 After the DeepWater Horizon Blowout.............................................................................................67 4.1 Recommendations for Future Oil Development ................................................................................68 4.2 New Measures and Changes................................................................................................................69
4.2.1 Changes within the DOI................................................................................................................70 4.2.2 Changes within the Oil Industry...................................................................................................71 4.2.3 Legal Evolutions and Landmarks.................................................................................................72 4.2.4 Restoration....................................................................................................................................74 4.2.5 Scientific Funding.........................................................................................................................74
4.3 Economic Impacts of the Regulatory Measures..................................................................................75 4.4 Drilling is on the Roll in the GoM......................................................................................................76 4.5 What Can Impacted Parties Expect from BP?....................................................................................76 4.6 Probable Evolution of Offshore Drilling in the US............................................................................77
4.6.1 The Gulf of Mexico.......................................................................................................................78 4.6.2 The Alaskan Region......................................................................................................................79
Conclusion............................................................................................................................................81
Bibliography.........................................................................................................................................83
Annexes................................................................................................................................................94
Page 5 from 101

List of Acronyms and Abbreviations
AK: API: BOEM: BOP : BSEE: Ca:CAA :CEO : CG : Co:Corp:COS: CS : CWA : DOI : DWH: EIS : EPA : ESA : FWS:GoM : ICP: La : MARPOL: MBTA:MMPA: MMS :MODU: MSFCMA: MWCC: NCP : NEPA: NIC: NMFS: NOAA: NIOSH: NRC: OCS :OCSLA: ONRR: OPA : OSHA: plc: ROV: SA : SEMS: SONS : Tx : UAC :UN :US : VoO: WCD:
AlaskaAmerican Petroleum InstituteBureau of Ocean Energy ManagementBlowout-preventerBureau of Safety and Environmental Enforcement CaliforniaClean Air ActChief Executive OfficerCoast GuardCompanyCorporationCenter for Offshore SafetyContinental ShelfClean Water ActDepartment of InteriorDeep Water HorizonEnvironmental Impact StatementEnvironmental Protection AgencyEndangered Species ActFish and Wildlife ServiceGulf of MexicoIncident Command PostLouisianaInternational Convention for the Prevention of Pollution from ShipsMigratory Bird Treaty ActMarine Mammal Protection ActMinerals Management ServiceMobile Offshore Drilling UnitThe Magnuson-Stevens Fishery Conservation and Management ActMarine Well Containment CorporationNational Contingency PlanNational Environmental Policy ActNational Incident CommanderNational Marine fisheries ServiceNational Oceanic and Atmospheric AdministrationNational Institute for Occupational Safety and HealthNational Research CouncilOuter-Continental ShelfOuter continental Shelf Lands ActOffice of Natural Resources RevenueOil Pollution ActOccupational Safety and Health Administrationpublic limited companyRemote Operated SystemStafford ActSafety Environmental Management SystemSpill of National SignificanceTexasUnit Area CommandUnited NationsUnited States (of America)Vessels of OpportunityWorst Case Discharge
Page 6 from 101

List of Figures
Figure 1 : Jackup..................................................................................................................................14
Figure 2: Semi-submersible..................................................................................................................14
Figure 3: Drill-ship...............................................................................................................................14
Figure 4: Oil and Gas Platforms in the GoM........................................................................................14
Figure 5: The Continental Shelf, including the State CS and the Federal OCS.....................................16
Figure 6: The 2010 Oil Spill in the GoM..............................................................................................21
Figure 7: A BOP (Blowout-Preventer or Christmas Tree).....................................................................24
Figure 8: The BOP's Constitutive Devices............................................................................................24
Figure 9: A ROV (Remote Operated Vehicle) System..........................................................................24
Figure 10: Booms.................................................................................................................................38
Figure 11: Skimmer Ships in the GoM.................................................................................................38
Figure 12: Clean-up Workers in Houston.............................................................................................39
Figure 13: The DeepWater Horizon Oil Budget....................................................................................45
Figure 14: Comparison Between the Two Oil Budgets.........................................................................45
Figure 15: BP's Former Logo...............................................................................................................47
Figure 16: BP's New Logo....................................................................................................................47
Figure 17: Repartition of the Oil Pollution in the GoM........................................................................49
Figure 18: Annual Tourism and Fishing Revenue: Economic Activity by County................................63
Figure 19: % of County Employment -Tourism and Recreation in the Gulf Coast Region ..................63
Figure 20: Employment Generated by Tourism and Recreation in the Gulf Coast Region...................63
Figure 21: Leading US Ports in 2006 by Tonnage................................................................................65
Figure 22: Actors of Gulf Coast Shrimp Supply Chain.........................................................................66
Figure 23: Description of Relationships Between the Stakeholders of the Gulf Coast Supply Chain...66
Figure 24: Categories of Recommendations - Grades...........................................................................70
Figure 25: The New Agencies Overseeing the Offshore Activities ......................................................72
Page 7 from 101

Introduction
The 20th century has unquestionably been an oil century. Oil is synonymous with industrialization,
comfort's improvement, -and of the generalization of transportation. Oil is furthermore crucial for na-
tions given its strategic importance and the richness it can arouse (Copinschi, 2010: 5). Indeed, within
a century, oil has become the most important strategic natural resource of our civilization, providing us
with the necessary energy. The choice of using oil is driven by different intrinsic characteristic of this
resource: its concentration of energy (before gas and coal) and its liquidity, making of this resource an
easy product to deal with. (Wingert, 2005: 22-23)
Offshore oil production is crucial to meet American domestic consumption and is therefore encour-
aged by the government. Because of the price our society is inclined to pay for the black gold, oil
companies always take more risks and go in difficult zones to exploit oil (and gas). Our addiction to
oil provokes indirectly oil spills, resulting in major damages for exposed people and ecosystems.
This work will attempt to present a state of art of the incident of the BP Macondo well blowout in the
Gulf of Mexico (GoM) in April 2010, which caused an unprecedented economic, human and environ-
mental disaster in the USA. We shall focus on its causes, its management, impacts and what has been
learned from it. First of all, before getting to the heart of the matter, a first chapter (1. Oil and Offshore
Drilling in the USA) will aim at giving the reader the necessary tools to understand this thesis by of-
fering a general overview of oil, the importance of offshore activities in the US and their evolution
across time as well as the legal framework within which offshore exploitation operates. From the
second chapter onward, we shall focus on the catastrophe of the BP oil rig in the GoM. Indeed, the
second chapter (2. The DeepWater Horizon Catastrophe) will concentrate on the origins of the blowout
by identifying its legal and political causes but also by underlining the internal failures (negligence,
mechanical failures) of BP and the oil industry that led to the concrete explosion. The management of
this social; economic and environmental crisis will also be broached in this chapter. A third chapter (3.
Consequences of the Oil Rig Explosion in the GoM) will concentrate on the various impacts generated
by the spill and the pressure the event exerted on the GoM's human populations (economy and health)
and ecosystems. Finally in the fourth and last chapter (4. After the DeepWater Horizon Blowout), we
shall attempt to detect and identify any significant changes directly resulting from the destructive
event as far as prospects, practices, legislation and safety are concerned. In this last chapter the future
prospects of the oil industry and the orientation of the American energy policy regarding offshore
activities will also be discussed. Before beginning we wish to remind the reader that the catastrophe
only occurred two years ago, in April 2010, this means that the scope of the economic and environ-
mental damages and the costs that it represents are not yet clearly identified, since the longer-term ef -
fects will only unveil over years and decades.
Page 8 from 101
1 Oil and Offshore Drilling in the USA
In this first part we shall provide the reader with a synthesized definition of oil (1.1), and shall also try
to sketch a more balanced image of the relative importance of man-made oil spills impacting the mar-
ine environment (1.2). Further sections will be devoted to the evolution of offshore activities, as well
as to the importance of offshore drilling in the Gulf of Mexico (GoM) for the North American oil in -
dustry (1.3). Finally, a last section will deal with the legal framework of offshore oil exploitation in the
US, and the liability regime relevant in the case of oil spills (1.4). This first chapter appears to be cru -
cial in order to seize the proper context in which the DWH oil spill occurred. Moreover, it will also
gives the reader the opportunity to understand the extent to which American legislation was able or not
to cope with this predicament.
1.1 Oil
Oil (and natural gas) results from the degradation of organic material of diverse origin: plankton, ve-
getation, animals...When these organic substances fall on the bottom of the sea, they progressively dis -
appear, eaten by bacterias, except if specific conditions are met. Indeed, in waters (lake, sea, ocean,
marshes...) with a low-level of oxygen, this organic material is protected and forms blackish sludge
that can progressively accumulate over a very long period of time (thousand or millions of years) to
reach several dozens or hundreds meters deep. Buried under sediments the sludge undergoes a trans -
formation caused by the action of anaerobic microorganisms. This process produces macromolecular
structures consisting of carbonaceous products, called kerogen. The new sediments piling up on the
ground compact the layers buried deeper and provoke the expulsion of water from the kerogen. The
weight of the sediments is so important that subsidence of the earth's crust can occur. Consequently
this mass moves downward into the depth where temperatures and pressures are higher. This phe-
nomenon provokes the elimination of nitrogen and oxygen from the kerogen, and creates shorter mo-
lecular chains, transforming the kerogen into hydrocarbons, the blending of these hydrocarbons is
what we call oil. Molecules are smaller when temperature is higher and the period of formation longer.
Very deep in the ground where the temperatures reach between 120°C and 140°C, we find the shortest
chains of hydrocarbon molecules, known as methane, this is the extreme stage where oil completely
disappears to transform into natural gas. Depending on the depth, the oil will be different and the gas'
proportion will vary. (Boy de la Tour, 2004: 36-38)
The rocks in which oil is found (reservoir rock) are generally not the place where it was formed. In-
deed, oil forms itself in porous rocks (Boy de la Tour, 2004: 37-38) and then under the influence of
pressure, due to the depth, is excreted from the source rocks and migrates to the surface. If during its
Page 9 from 101

journey, oil encounters an impermeable geological layer (clay or salt), it accumulates to form an oil-
field situated in what is called a reservoir rock. But if no impermeable layer (cap rock) is on the way to
stop the migration, the petrol reaches the surface where lighter molecules evaporate. The remaining
elements are heavier and transform in bitumen such as the Athabasca tar sands in Canada or the
Orinoco heavy oil belt in Venezuela. (Copinschi, 2010: 76) Roughly 90% of oil formed in the soil
slowly leaks to the surface. According to some estimations, seeping oil would represent 60% of hydro-
carbons “pollution” found in the oceans surrounding North America. (Burroughs, 2011: 43)
1.2 Origins of Oil Pollution in the Marine Environment
In this section we shall identify the various origins of oil pollution in the marine environment, with a
evident focus on the marine blowouts (1.2.3). This interest for other types of marine pollution, such as
spills from tankers (1.2.1), and operational discharges (1.2.2), is relevant because we think that a glob-
al overview of the relative importance of different types of oil pollutions, is necessary to understand
the reach of a catastrophe like the BP1 blowout in the GoM. Furthermore, it seems relevant to mention
in this work that not all oil spills are caused by human actions, indeed natural oil seepage is also very
present and can even produce effects that we would not expect (1.2.4).
1.2.1 Spills from Tanker Incidents
Oil tanker accidents have long been in the limelight as regards oil spills. The number of this type of
accidents and the quantities of oil released have significantly decreased since the 1970's, notably be-
cause certain measures have been adopted. The average yearly amount of oil that spilled reached 314
000 tons in the 1970's and 21 000 tons in the 2000's. The year 2009 was even characterized by figures
as low as 100 tons. This positive development is mainly due to the double hull of modern tankers,
lowering spill risks after minor impacts, and to the compartmentalization of these vessels so that in
case of leakage, only a part of the cargo flows into the sea. Furthermore sea lanes with unidirectional
traffic have been established, and the GPS (Global Positioning System) has been generalized, reducing
drastically the risk of collisions. (Jernelöv, 2010: 354)
1.2.2 Operational Discharges2
As was underlined by Alain Préat (Alain Préat, personal interview, March 23, 2012), Professor of geo-
logy at the Free University of Brussels, tankers along with various other types of ships, such as con-
1 BP p.l.c (public limited company) (formerly called British Petroleum and later BPAmoco) is a British multinational oil and gas company, founded in 1909. This is the third-largest energy company in the world. (Techno Science. s. d.)
2 As opposed to accidental discharges. Accidental discharges are oil spills resulting from (1) tankers breaking open at sea following collisions or distress, (2) blowouts of offshore oil wells, or (3) broken pipelines (Global Marine Oil Pollution. s. d. ).
Page 10 from 101

tainer ships and fishing vessels, are responsible for another type of pollution, much more important
than most people think. Indeed, vessels also cause pollution by discharging illegally oil into the marine
environment. This phenomenon, called “operational discharge”, includes degassing3 and deballasting4
out at sea (and not in treatment plants) (Jernelöv, 2010: 354). The majority of deliberate discharges is
caused by hydrocarbon residues unfit for propulsion, and concerns all types of vessels (Black Tides. s.
d.). Between 1988 and 1997, the operational releases amounted to over 200 000 tons per year but have
since been reduced to about 100 000 tons per year and this especially in territorial and near-shore wa-
ters of developed countries. Nevertheless the activity is expected to continue and will be difficult to re-
duce more. (Jernelöv, 2010: 354)
1.2.3 Marine Blowouts
To find a clear trend is much more difficult in the case of marine blowouts. One can usually consider
that blowouts on land and in shallow waters can be controlled quickly. In deeper waters, blowouts are
much less frequent but when they occurred they cause major pollutions and are hard to cap. The pro-
cess of sealing a well can easily take months and the amount of oil gushing into the water can reach
astronomical quantities. (Jernelöv, 2010: 354) The Santa Barbara (Ca) Spill of 1969 is known as the
first major oil spill disaster in the US. It was caused by a blowout into a submarine oil reservoir. It
took technicians eleven days to contain the spill, approximately 3 million gallons5 of oil were released.
The media coverage of the event stoked the public resentment against oil companies and played an im-
portant role in initiating the American environmental movement culminating in the first Earth Day cel-
ebration and the adoption of laws (see further 1.4.) to strengthen environmental protection. (Shi-
genaka, 2011: 989-990) This Californian blowout remained the largest offshore drilling accident in
American waters until the Macondo blowout (National Commission, 2011: 28-29).
1.2.4 Oil Seepage: a Natural Pollution?
Besides human oil spills, there also exist natural oil spills, known as “natural seepage” of oil into the
ocean. Seepage occurs at thousands different places and is thus what we could call a diffuse pollution
(unlike the punctual pollution of oil slicks and blowouts) (Jernelöv, 2010: 363). Oil in its raw form, is
a natural substance present in many parts of the world above ground or on the water. The National Re-
3 Degassing involves freeing fuel tanks and crude oil tanks of the gases which remain after the tanks have been emptied (Black Tides. s. d.).
4 Deballasting consists in emptying out the contents of a ballast tank (a reservoir that can be filled, or partially filled, with water to improve the stability of a vessel). Empty fuel tanks (crude oil tanks on an oil tanker), constitute natural ballasts. Ballasting (filling of ballast tanks) with water rinses out the oil and to get rid of their contain in the open sea . (“Black Tides. s. d.)
5 3 million gallons represent 11356.24 m3. Conversions can be made on the website of Unit Juggler <http://www.unitjuggler.com>. Moreover, the reader can find a table of conversion, giving an idea of the proportions in the annexes.
Page 11 from 101

search Council (NRC)6 estimates that 45% of the oil entering the world's oceans is of “natural” origins,
deriving from natural seepage. (Shigenaka, 2011: 989) In 2003, it was estimated that the annual
amount of oil resulting from natural seepage was equal to 600 000 tons. Quite surprisingly the natural
seepage in some parts of the GoM seems to represent 70 000 tons annually. (Jernelöv, 2010: 363) A
certain level of exposure to oil can be tolerated by the marine environment. Unexpectedly, the proxim-
ity to natural oil and gas seeps seems to increase productivity and stimulate fecundity, especially for
species like copepods, crustaceans generally considered to be sensitive to hydrocarbons exposure (Shi-
genaka, 2011: 989-990). However, quantities released by a well blowout such as the Macondo well are
definitely disastrous for local ecosystems, unable to tolerate such an exposition.
1.3 Oil Exploration and Drilling in North America7
Possibilities of offshore drilling have rapidly been attractive for the oil industry. This fact is mainly
due to the importance of oil for the American nation, and the increasing domestic demand that has
pushed toward more exploitation. Indeed, following World War 2, American domestic consumption of
petroleum has increased drastically, due to the popularization of automobiles. US oil production
peaked the in 1970's. This phenomenon along with the 1973 OPEC embargo have triggered the quest
to develop new offshore reserves. This exploration was strengthened by “Project Independence,”
launched by the Nixon Administration in 19738 (National Commission, 2011: 31), and the creation of
the Department of Energy by President Jimmy Carter in 19779 (National Commission, 2011:59), an-
nouncing a dramatic increase in the pace of leasing in the Gulf and a resumption of sales off the At-
lantic, Pacific, and Alaskan coasts. (National Commission, 2011: 31) Consequently, the oil present un-
der marine waters has led to intense prospecting. The Energy policy in the USA has been deeply influ-
enced by the possibility of finding oil along the coasts. The offshore production planned by the US
government did not compensate for the decline. As a consequence, the US began to import increas -
ingly more oil from overseas, still increasing its dependence on foreign oil production countries. (Bur-
roughs, 2011: 45) In such a context every single well present on the American territory, onshore or off-
shore is essential (Sèbille-lopez, 2006: 99).
Oil and gas extracted from offshore fields contribute significantly to the American domestic energy
supply, as will be exemplified further. As a result, since the 1940's, the American coastal policy and
the national energy policy have been intermingled (see 1.4.) (Burroughs, 2011: 43). The sector has de-
6 The NRC is an organism whose goals are to improve government decision making and public policy, increase public un-derstanding, and promote the acquisition and dissemination of knowledge in various fields such as science, engineering, technology, and health (National Academy of Science. s. d.).
7 For an overview of the major landmarks of the oil and gas offshore history, please see annex 2.8 It refers to energy independence. President Richard Nixon proposed a considerable expansion of offshore oil and gas de-
velopment (National Commission, 2011:59).9 President Jimmy Carter also secured the passage of the National Energy Act of 1978, designed to promote development
of domestic energy supplies (National Commission, 2011:59).
Page 12 from 101

veloped different technical devices in order to drill in areas that were before inaccessible (1.3.1) The
oil industry and Federal government have especially targeted the GoM, known for its important oil re-
sources (1.3.2). (Patzek and Tainter, s.d.: 9)
1.3.1 Offshore Drilling: Overview
As early as the 1920's, the oil industry has been interested by the oilfields potentially present under
water. According to estimates, more than 70 million km² sedimentary basins would be located under
water among which 30 million km² under less than 500 m deep10. The real exploitation began in the
1960's and 1970's in two operational zones: the GoM and the North Sea which have ever since been
major exploitation provinces. Thanks to recent technologies two new regions have acquired a major
importance: the Gulf of Guinea and Brazilian offshore. Additionally these recent scientific progresses
have also led to new discoveries in the GoM. (Boy de la Tour, 2004: 55-57)
As far as exploration is concerned, offshore prospecting bases itself on geophysics11 whose techniques
are twice or thrice less expensive than on the continent. Regarding exploration, there is almost no dif-
ference between a terrestrial and offshore drilling. However, the material necessary for offshore activ -
ities is quite different. At sea, the drilling facilities must be maintained above water by a metallic rig
especially dedicated to this use and capable of moving quickly from one drilling place to the other.
(Boy de la Tour, 2004: 57-58)
In this thesis, the topic being the BP DWH drilling rig blowout in the GoM, we shall briefly detail the
evolution of drilling platforms, whereas production platforms will only be mentioned. There are many
different types of facilities from which offshore drilling operations take place. Jackups (see figure 1)
are the most popular type of mobile offshore drilling unit (MODU) for offshore exploration and devel -
opment purposes. Jackup rigs rest on the sea floor rather than float. A jackup rig is self-elevating, the
legs are stationed on ocean floor and the drilling equipment is jacked up above the water's surface.
Jackups can drill in waters up to about 350 feet deep12. When drilling is performed in waters that are
deeper, 'deep-water MODU' become a more logical choice for exploration and development opera-
tions. Deep-water MODU include semi-submersibles (see figure 2) and drill-ships (see figure 3) that
are capable of operating in water depths up to 10 000 feet13. In shallower waters the deep-water
MODU are anchored to the seabed, however in deeper water (>5000 feet14), the semi-submersibles or
drill-ships are maintained at the required drilling location by using dynamic positioning. (Rigzone. s.
10 30 million km² also corresponds to the totality of sedimentary basins located on the continents (Boy de la Tour, 2004: 55-57).
11 Geophysical methods can be used at sea or on earth and provide the geologist with interesting data concerning the geolo -gical organization of the underground, and the possible localization of hydrocarbon fields (Boy de la Tour, 2004: 42-44).
12 350 feet represent 106.68 meters.13 10,000 feet represent 3048 meters.14 5,000 represent 1524 meters.
Page 13 from 101

d.)
Source: (Mudblogger (Admin.). 2008.) Source: (Fish Safe. 2009.) Source: (“Drillship”. 2012.)
Just like on earth, offshore drilling implies several development wells in order to drain properly the
oilfield. Drilling a well is very expensive, consequently, to reduce the costs, the oil industry uses in -
creasingly directional drilling carried out from several rigs (as few as possible to cut the costs). The
production rigs that are settled on the well after drilling must be capable of treating extracted oil and to
storage it before the evacuation. (Boy de la Tour, 2004: 58-59) As for drilling, there exist different
types of production platforms15 but we will not describe them.
1.3.2 The Gulf of Mexico
American oil reserves are unevenly located on the territory, indeed 82 % of these reserves are located
in fours states: 22% in Texas, 22% in Louisiana, 20% in Alaska and 18% in California. The remaining
18% are to be found in about twenty other states. The American offshore reserves are mainly concen-
trated off California and in the GoM (see figure 4) where the states of Texas and Louisiana largely
dominate. The GoM represent 25% of the American oil production and 45% of its refining capacity.
(Sèbille-lopez, 2006: 97-98)
Source:(NOAA. (Lead Author), 2012)
15 For more information on this topic, please read (Boy de la Tour, 2004: 58-59) and 'Production Platforms' on <http://www.oilandgasuk.co.uk/publications/Production/Production_Platforms.cfm>.
Page 14 from 101
Figure 1 : Jackup Figure 2: Semi-submersible Figure 3: Drill-ship
Figure 4: Oil and Gas Platforms in the GoM

On top of that, the gulf region is also crucial as far as oil and gas import and export with other coun -
tries are concerned. The coastal region is furthermore essential regarding the transport of crude oil to -
ward the North American continent thanks to important pipelines, such as the famous “Colonial
pipeline” delivering hydrocarbons from Houston to New York (most US eastern coast states). In spite
of their huge oil production potential, the US are increasingly dependent on oil importation. This unfa-
vorable situation is mainly due to their over-consumption. (Sèbille-lopez, 2006:97-98)
The developments of the GoM have been essentially platform-based unlike the increasing number of
floaters being used in the North Sea. This is probably due to the fact that oil fields in the GOM, even
in deep water, are relatively close to the shore. Short pipelines of the shallower-water facilities can be
easily tied and used to reach the extensions from deeper-water developments. From a geographical
perspective, the US GoM is informally divided into two areas: “shallow water” and “deep water” (>
300 m)16. Additionally, there are two geological features characterizing the GoM region. The first is
known as the Flexure Trend or Flex Trend17 that generally runs through the intermediate depth zones.
A second geological peculiarity is the presence of giant salt formations. About half of the Gulf contin-
ental shelf is thought to be underlain with these thick horizontal sheets of salt. (International Energy
Agency. 1996: 84-85)
This geological area is governed by a series of rules concerning offshore drilling. In the following sec-
tion, we shall discuss the legislative framework in which offshore drilling and its development articu-
late as well as the emergence of an environmental insight.
1.4 Legal Framework for Offshore Drilling in the US18
In order to understand American legislation regarding offshore activities, it is crucial to gain insight
into the basic concepts of Continental Shelf (CS) and Outer Continental Shelf (OCS) (1.4.1). Next, we
shall underline the regulatory evolution of offshore activities (1.4.2) and the liability regime de-
veloped in the US in order to respond to potential accidents(1.4.3). In a final part (1.4.4), we shall de -
scribe the various intersections between the offshore drilling regulation and other coastal legislative
pieces. Because of the potential damage done by oil spills, a significant body of law has emerged in
order to prevent large oil spills, to restore impacted zones, and to financially punish the spillers (Birk-
land and DeYoung, 2011: 473).
16 According to federal agencies, the dividing line is over 200 meters whereas industry often uses 304, 8 meters (1000 ft) as the turning point (International Energy Agency. 1996: 85).
17 The Flex Trend is an area in the Gulf reaching just beyond the edge of the continental shelf, this is a place where there is a flex in the seafloor (National Commission, 2011: 31).
18 For an overview of the different pieces of legislation related to oil and offshore drilling, please see annex 3.
Page 15 from 101

1.4.1 The US Outer Continental Shelf (OCS)
The American offshore oil policy and strategy has been strongly conditioned by the legal notions of
CS (Continental Shelf) and OCS. The CS (see figure 5) is an extension of the continental landmass (in
the US, the width of the CS varies from 20km to 400 km) under the ocean (OCS Energy. s.d.), situated
between the continent and the deep ocean (Patzek and Tainter, s.d.: 9). The CS waters are rarely deeper
than 200 m (OCS Energy. s.d). As far as the OCS is concerned, it is a particularity of the US political
geography. This is the part of the US CS, not falling under the jurisdictions of the individual American
states (“Outer Continental Shelf”. s. d. ). According to the definition of the American Federal govern-
ment, the US OCS consists of “the submerged lands, subsoil, and seabed, lying between the seaward
extent of the States' jurisdiction and the seaward extent of Federal jurisdiction” (Patzek and Tainter,
s.d.: 9). The US OCS is divided into four leasing regions: (1) the GoM OCS Region, (2) the Atlantic
OCS Region, (3) the Pacific OCS Region, and (4) the Alaska OCS Region (MMS, 2009: i). Usually
the OCS begins approximately 3 – 9 nautical miles19 from shore (depending on the state) and extends
200 nautical miles20 outward (OCS Energy. s.d.).
Source: (OCS Energy. s.d)
In 1953, the Congress designated the Secretary of the Interior to administer mineral exploration and
development of the entire OCS through the Outer continental Shelf Lands Act (OCSLA 1953) (Patzek
and Tainter, s.d.: 9). The legal framework for OCS development not only defines jurisdiction, governs
leasing procedures, and assesses responsibility for spill and cleanup, but also establishes the relation-
ship that oil developments will have with other coastal activities (see 1.4.4). The resources hidden in
marine waters surrounding the country have often led to tensions between the states and the federal
jurisdictions. Indeed, the resources were not limited to the state waters and this implied conflicts. Ori-
ginally, California and Louisiana claimed the revenues generated by drilling oil under marine waters
adjacent to their states. The Submerged Land Act of 1953 settled the problem; and defined the bound-
ary between the two areas. (Burroughs, 2011: 56 -57)
The OCSLA 1953, revised in 1978, defines how federal OCS oil may be exploited by private corpora -
tions. The crucial element in the procedure is the leasing of 4.8 km by 4.8 km tracts of seafloor to a
19 3 and 9 nautical miles represent 5.556 kilometers and 16.668 kilometers.20 200 nautical miles represent 370.4 kilometers.
Page 16 from 101
Figure 5: The Continental Shelf, including the State CS and the Federal OCS

private corporation. This tract is governed by a variety of rules. The company pays a small fee in order
to hold the land and as soon as oil is produced the corporation also pays a royalty to the government
that often amounts to 16.66 % of the value of the oil produced. Initially, the revenues generated by
OCS leasing (fees and royalties) filled almost exclusively the federal treasury, in spite of the fact that
coastal states were the ones to invest in onshore infrastructures supporting offshore activities (more
about that further) (Burroughs, 2011: 56 -57).
1.4.2 Offshore Legislation: Evolution
No legal regime existed before the 1970's to force oil spillers to be liable for and support cleanup costs
and damages resulting from oil spills (Birkland and DeYoung, 2011: 480). A large number of oil spills
in the 1960's, including the Santa Barbara (Ca) well blowout of 1969 (see 1.2.3), led to the apparition
of a series of environmental laws and acts. The National Environmental Policy Act (NEPA) enacted by
Congress in December 1969 and signed by President Nixon in January 1970, represents the first major
environmental law in the US and is also known as the “Magna Carta” of environmental laws. NEPA
rely on agencies, such as the Environmental Protection Agency (EPA), to implement its policies. These
agencies are charged with assessing the environmental effects thanks to environmental impacts state-
ment (EISs) of proposed actions before their potential implementation. (Council on Environmental
Quality Executive Office of the President. 2007: 7) Besides environmental considerations, the NEPA
also takes into account the socio-economic effects of the potential impacts (National Commission,
2011: 80).
Two year later, under the enactment of section 311 of the Federal Water Pollution Control Act Amend-
ments of 197221 (Clean Water Act or CWA), liabilities were established for owners of oil facilities and
for ship owners, at $8 million for fixed facilities and $100 per gross ton or $14 million for ships.
Amended in 1978 the owner's' liability raised to $150 per gross ton for ships and $125 per ton for
barges. The same act section also mandated a National oil spill Contingency Plan (NCP) and included
the creation of a revolving fund to cover costs of potential future cleaning up after oil spills. (Birkland
and DeYoung, 2011: 480) Furthermore, the Department of Interior (DOI) established the “Environ-
mental Studies Program” in 1973, aiming at providing information regarding the geological, physical,
biological, and chemical characteristics of offshore oil and gas leasing areas, but its focus slowly shif -
ted to the assessment of resource management decisions (National Commission, 2011: 59).
As previously mentioned (see section 1.4.1, OCSLA 1953), the Congress passed the OCSLA Amend-
ments in 1978 (revision of OCSLA 1953). This act created another oil spill fund providing for $200
21 Under the federal CWA, there exist requirements regarding any discharge of pollutants into navigable waters resulting from offshore activities (National Commission, 2011: 80).
Page 17 from 101

million for cleanup and $25 millions liability limit for damages, the novelty is the unlimited liability
for cleanup from spills resulting from offshore oil production. (Birkland and DeYoung, 2011: 480) On
top of that, the 1978 revision incorporates several environmental considerations, including a schedule
for the anticipated lease sales and the possibility for states to identify tracts or sales that would likely
cause environmental damage, if developed by the oil industry. Furthermore the revision of OCSLA of-
ficialized the “Environmental Studies Program” of 1973, enforced the ability of states to determine if
the development of a tract would harmonize with their local plans, and established the means to favor
safer working conditions. (Burroughs, 2011: 58 -60)
In spite of these various environmental laws, the conflicting goals of environmental protection, energy
independence, and revenue generation were not reconciled. Oil drilling was banned in some offshore
regions due to environmental concerns, whereas elsewhere, such as in the GoM, some environmental
protections and safety oversight were sometimes diminished (formally or unofficially) in order to sup-
port a dramatic expansion of offshore oil and gas production. (National Commission, 2011: 55)
From that time onwards (1978), there have been a number of significant changes or additions (positive
or negative) to OCS law, such as the OCS Deep Water Royalty Relief Act of 1995. This act, by redu-
cing the amount of royalty due to the government, was an attempt to encourage oil firms to invest fin-
ancially more in costly deep-water (> 200 meters) oil development. The financial involvement and
support of coastal federal states in the GoM for offshore oil production, as well as the costs they bear
in case of environmental damages were recognized in the the Gulf of Mexico Energy Security Act of
2006. The act stipulates that coastal sates should receive some of the revenue generated by the OCS oil
exploitation. Accordingly, 37,5% of offshore oil revenues must be apportioned to adjacent coastal
states. Another piece of legislation awarded the states a share of 27% of the royalties due to the Feder-
al Treasury and generated in waters 4,8 km seaward of the state-federal line . Until recently most OCS
laws were implemented trough the DOI (Burroughs, 2011: 58 -60), but the catastrophe of the DWH, as
we shall see further (chapter 4), has implied some changes in the legal and federal oversight organiza-
tion of offshore drilling.
1.4.3 Liability Regime
The oil pollution liability regime has been developed on the basis of a series of various conventions,
codes and resolutions that have been enacted by the United Nations (UN) International Maritime Or-
ganization (IMO). The 1973/78 International Convention for the Prevention of Pollution from Ships
(Marpol) is the central treaty in this field. Marpol appeared as one of the measure that followed the
Page 18 from 101

Torrey Canyon oil disaster in 196722. Nevertheless, the 1989 Exxon Valdez oil spill23 in Alaska re-
quired in the US further regulations which took the form of the Oil Pollution Act of 1990 (OPA) and
imposed stronger studies of care on ship-owners and also included a right of action against operators.
However, the current terms of application of claims for compensation within contracting states contin-
ues to be set by the International Convention on Civil Liability for Oil Pollution 1992 (CLC), and the
International Convention on the establishment of an International Fund for compensation for Oil Pol-
lution Damage 1992 (FUND), in force as of 1996. (Noussia, s.d.:138 -140)
The OPA is the most important law concerning pollution in the American legislation. The Act imposes
a series of oil-spill planning, preparedness, and response requirements on fixed and floating facilities
engaged in oil and gas exploration, development, and production on the OCS (National Commission,
2011: 80). OPA empowers natural resource trustees in governmental entities which have as objective
to represent the public and ensure that the responsible parties take measures in order to restore the sys -
tem damaged by the oil spill. To some extent, the responsible parties are liable for cleanup costs and
damages consequent to the spill. The measures include removal costs and compensation for damages
to or loss of resources, destruction of private property, loss of earning capacity, (R. Burroughs, 2011:
60), subsistence use, federal, state and local tax revenues, lost profits and the cost of providing addi -
tional public services (Noussia, s.d.: 146). The liability regime applicable in the case of the DWH blo-
wout (2.4) as well as the financial compensations that can be expected from BP (4.3) will be discussed
further in this work.
1.4.4 Interactions with Other Uses of Coastal Land and Waters
The body of law related to offshore oil development also encompasses specific provisions about pos-
sible interactions with other uses of the American coastal regions. As stated above, Environmental im-
pact statements (EISs) are required by the NEPA (1969) in order to clearly identify the potential con-
sequences of offshore oil activities. Carrying out an EIS gives the DOI (Department of Interior) the
opportunity to compare different alternatives to leasing and to evaluate their respective effects on the
surrounding environment. Indeed, offshore oil development impacts navigation, environmental quality,
and natural organisms. (Burroughs, 2010: 60-61) An eloquent example of the interactions of offshore
activities with other pieces of legislation appears in the relation between offshore exploitation and nav-
igation. Through the River and Harbor Act, the Corps of Engineers influences the location of offshore
platforms and activities because it has the responsibility to limit obstructions to navigation. Addition-
ally, the US Coast Guard (CG) determines the various luminous signals used on platforms. (Bur-
22 The Torrey Canyon was a supertanker that wrecked while it was trying to take a short cut between Cornwall and Scilly. It resulted in the spilling of 36 million gallons of crude oil in the sea. (B.B.C. 2010.)
23 In 1989, the tanker Exxon Valdez ran aground in Prince William Sound (AK) and spilled approximately 10.9 million gal-lons of its 53 million gallon (about 163 million liters) cargo of Prudhoe Bay crude oil. It impacted over 1,100 miles of non-continuous coastline. It is the largest oil spill to date in U.S. waters. (Cleveland, Cutler J. 2010)
Page 19 from 101

roughs, 2010: 60-61)
As far as environmental quality is concerned, the issue is addressed in the Clean Air Act (CAA) of
1990. This act regulates OCS air emissions and empowers the US EPA to impose to offshore facilities
located within 40 km of the seaward boundary of a state, rules applicable onshore. On top of that, an -
other act, the CWA (Clean Water Act) has a role in regulating the discharge generated by the separa-
tion of saltwater and oil/gas produced from wells in offshore areas. Three other significant laws focus
on the biological variety of coastal areas and influence offshore oil activities. Firstly, the Endangered
Species Act (ESA) requires from federal agencies that they consult the National Marine fisheries Ser-
vice (NMFS) and/ or the US Fish and Wildlife Service (FWS) before undertaking any action. This pro -
vision is based on the assumption that oil development could harm a listed species. Moreover, the
NMFS and FWS can issue a biological opinion about the reasonable and prudent characters of the
activities pursued before development may go forward. Secondly, in case of potential negative impact
on a mammal, the Marine Mammal Protection Act (MMPA) applies. (Burroughs, 2010: 60-61) The
MMPA restricts activities injuring or harassing marine mammals. Besides, the National Marine Sanc-
tuaries Act calls on consultations in order protect the marine sanctuary resources from potential negat-
ive impacts related to oil and gas leasing activities. (National Commission, 2011: 80) Thirdly, the
(Magnuson-Stevens) Fishery Conservation and Management Act24 (MSFCMA) requires agencies to
analyze the potentially adverse impacts of oil and gas activities on fish habitat and populations, and
provide conservation measures to mitigate those impacts (National Commission, 2011: 80). In spite of
these various regulations environmental considerations are not always taken into account. Indeed, the
OCSLA is above any other rules. The Act expressly singles out the GoM for less rigorous environ-
mental oversight under NEPA. (National Commission, 2011:80-81)
After this general overview25 (chapter 1) of the American offshore drilling industry and legislation, we
shall presently deal with the core of this work, namely the analysis of the DWH catastrophe.
24 The MSFCMA is the primary law governing marine fisheries management in US federal waters (NOAA., s.d.).25 The important acts can be found in annex 3.
Page 20 from 101

2 The Deep Water Horizon Catastrophe
On April 20, 2010, an explosion and a fire devastated the DeepWater Horizon (DWH) drilling rig
which was located in the GoM, 50 miles26 (on the OCS) southeast of the town of Venice, near the
Louisiana (Narayan, 2010: 58). This explosion killed 11 platform workers (Kleinnijenhuis, Schultz et
alii, 2011: 97), and injured 16 others (National Commission, 2011: 17).
Figure 6: The 2010 Oil Spill in the GoMSource: (Mitsch, 2010: 1608)
The explosion occurred while the DWH rig was drilling a well, called Macondo, owned by the BP oil
company27, under 5000 feet28 water, and then over 13.000 feet29 under the seafloor in order to reach the
hydrocarbon reservoir below (National Commission, 2011: vi). A short while after the explosion, the
rig sank to reach the bottom of the Gulf. Unfortunately, this happened just before the well on which
the BP company was working could be sealed with a containment cap. As a result, crude oil began to
leak from the blown-out well at an incredible rate. Approximately 60.000 barrels30 are estimated to
have entered the GoM each day. (Narayan, 2010: 58) During the gushing and after the sealing, the spill
evolved as an ever-changing footprint, expanding to an area of over several hundred kilometers square
(Mitsch, 2010: 1607). In total an estimated 780 000 m³ of oil has flown into the gulf during 87 days
before the well was sealed (Tao et alii, 2011: 6 ).
This particular event exceeds from far the other oil disasters with which the US have had to cope in
26 50 miles represent 80.7 kilometers.27 BP (plc UK) is a powerful oil company, and is one of the six largest Oil companies in the world (non-state owned com -
panies) with Exxon Mobil (USA) Royal Dutch Shell (UK/Netherlands), Chevron Corp. (USA) ConocoPhillips (USA), and Total S.A (France). These companies are also known as supermajors or IOC (International Oil Companies). BP was founded in 1908 and has built its business thanks to Middle-East crude oil. After several misadventures, the company emerged in the 1990's with a greatly expanded portfolio of Gulf leases and assets and became the Gulf ’s largest oil pro-ducer. (National Commission, 2011: 45)
28 5000 feet represent 1524 meters.29 13 000 feet represent 3962.4 meters.30 60.000 barrels represent 9 539 238 liters.
Page 21 from 101

the past, such as the the Santa Barbara (Ca) Spill of 1969 (first major oil spill in the US, releasing 3
million gallons31) (Shigenaka, 2011: 989-990), the 1979 oil spill of Ixtoc well32 (in Mexican waters, 3
million barrels33), and the 1989 Exxon Valdez oil spill (250 000 barrels34) (Narayan, 2010: 58). It be-
came rapidly clear that the impact of the DWH blowout on the coastal inhabitants and ecosystems
would be enormous and that the the economic sector would suffer losses reaching ten thousand of dol-
lars (National Commission, 2011: vi).
We shall know attempt to understand what exactly happened. A first section (2.1) will focus on the ac-
quisition of the well and its exploitation before the blowout (National Commission, 2011:89-90).
Moreover, the company, industry and management failures, as well the legislative shortcomings result-
ing from a lack of active environmental and safety regulations will be discussed. If the drilling actors
are undoubtedly responsible for the Macondo blowout, the government has also its share into it,
through unsatisfactory legislation and risky non-regulation (2.3). Another section will be devoted to
the identification of the liable parties (by using the theory presented in the first chapter, section 1.4)
that will have to pay in order to compensate and restore what has been damaged (2.4). Furthermore,
the crisis itself and how it was managed, as well as the problems encountered while mitigation efforts
were deployed, will also be the focus of this second chapter (2.5).
2.1 The Macondo Well : Acquisition and Exploitation
The Macondo well was purchased by BP in March 2008, the company paid a little over $34 million to the Minerals Management Service (MMS) for an exclusive lease in order to drill in Missis-
sippi Canyon Block 252, a lease area of 9 miles² 35 plot in the GoM (National Commission, 2011:89).
Following the logic of the American oil industry, BP was not alone to manage and exploit the well. In-
deed, the British giant worked on Macondo in close collaboration with Anadarko Petroleum and
MOEX USA. BP and its partners had foreseen $96.2 million and 51 days of work for the completion
of the well. However, the well had been challenging and the work had dawdled. As of April 20, the
drilling of the well was nearly six weeks behind schedule and more than $58 million over budget. (Na-
tional Commission, 2011:2)
Originally, the Macondo well had to be drilled by another giant rig, the Marianas. The drilling process
31 3 million gallons represent 11 356.23 m3.
32 The Ixtoc blowout is a blowout that occurred in the Mexican GoM, three decades ago (Jernelöv, 2010,353-354). The pressure in the well was far too high and the crew on the drilling rigs has neglected warning signals and proceeded as usual. In the case of the Ixtoc blowout, the solution was found after 9 months by the drilling of relief wells. The area af-fected by the Ixtoc slick was far less vulnerable than the wetlands of Louisiana. ( Jernelöv, 2010, 363-365)
33 3 million barrels represent 476 961.9 m³34 250 000 barrels represent 39 746.825 m³35 9 miles² represent 14.49 kilometers square.
Page 22 from 101

had reached more than 9,000 feet36 below the ocean surface (4,000 feet37 under the seafloor) when
Hurricane Ida struck the GoM and damaged the rig. The rig needed to be repaired, consequently, an-
other rig was called to complete the drilling and sealing. The platform that took over was the DWH.
Both Marianas and DWH were semisubmersible rigs possessed by Transocean38. The DWH ($350 mil-
lion) was considered as the best rig of the Transocean’s fleet. Since 2001 the platform was working in
the GoM and had been under contract to London-based BP. (National Commission, 2011:2)
DWH arrived at the Macondo lease site on January 31, the crew was composed of about 126 people,
including Transocean employees, BP men, cafeteria and laundry workers and workers contracted for
specialized jobs39 (National Commission, 2011: 3). After its arrival, the first task of the rig was to
lower its giant blowout-preventer (BOP)40 (see figure 7 and 8) onto the wellhead put in place by the
Marianas. Once the BOP is put in place, every material needed in the well, such as drilling pipe, bits,
casing, and mud, passes through the BOP. The DWH's BOP was composed of various features de-
signed to seal the well if necessary. (National Commission, 2011: 92-93)
Source: (Cavnar, 2010 )
Source: (M. Steve, 2010.)
Source: (“Sub-Atlantic - Electric ROV Systems and ROV System Components”, s.d.)
36 9 000 feet represent 2743.2 meters.37 4000 feet represent 1219.2 meters. 38 The company was founded in Louisiana in 1919 and is currently the world’s largest contractor of offshore drilling rigs
(National Commission, 2011:2).39 ie. Halliburton cementers, mud loggers from Sperry Sun (a Halliburton subsidiary), mud engineers from M-I SWACO, a
subsidiary of Schlumberger (international oilfield service provider), remote operated vehicle (ROV) technicians from Oceaneering, or tank cleaners and technicians from the OCS Group. (National Commission, 2011:3)
40 The Blowout preventer (BOP) is a stack of enormous valves that rig crews use both as a drilling tool and as an emergency safety device (National Commission, 2011: 92)
Page 23 from 101
Figure 7: A BOP (Blowout-Preventer or Christmas Tree)
Figure 8: The BOP's Constitutive Devices
Figure 9: A ROV (Remote Operated Vehicle) System

2.2 Immediate Reason of the Explosion
The blowout of the Macondo well took place on April 20, 2010 during one of the most sensible step
related to drilling activity. Indeed, the drilling of the well had been completed and the platform was
preparing to move. During the drilling process, well-safety is assured thanks to a heavy fluid, called
mud (nearly twice the weight of sea water) injected continuously (Hopkins, 2011: 1422). The objective
of a drilling platform is to drill a path to the hydrocarbon reservoir by simultaneously controlling the
enormous pressures (very high in deepwaters), and avoiding any fracture in the geologic formation
containing the reservoir. Consequently, the counter-pressure generated by the drillers inside the well-
bore must be adapted to the reservoir pressure (pore pressure) that pushes hydrocarbons into the well.
To obtain equilibrium, drillers use drill pipe, casing, mud, and cement in a series of calibrated steps.
The drilling mud simultaneously lubricates and cools the drill bit during the drilling process but is also
the key element for controlling the hydrocarbon pressure in the well. If the mud is too light, it can gen-
erate a kick, when fluids such as oil and gas enter the well. These fluids can potentially trigger a blo-
wout if the problem is not controlled in a timely fashion. In contrast, if the mud weights too strongly
on the formation, it can fracture the surrounding rock, potentially leading to a leakage of the mud into
the formation. (National Commission, 2011: 90) Before leaving the location, the column of mud rais-
ing from the sea bottom must be replaced by sea water. Safety is ensured if the casing that has been in -
serted into the well to shut it, is completely sealed in order to prevent any influx of oil or gas into the
bottom of the well. Once the casing is inserted, the effectiveness of the seal must be tested. This is
realized by reducing temporarily the pressure inside the well. Observers are supposed to check the pro-
cess and verify whether there are signs revealing that fluids flow out of the top of the well or that the
pressure increases. If one of these two signals is noticed, it means that the well is flowing, implying
that if the mud is completely removed the well risks to blow. (Hopkins, 2011: 1422)41
In the case of the DWH, the rig staff misinterpreted the results of the testing, what provoked the ter-
rible disaster. Indeed modifying the pressure in the column is a crucial step in the sealing of a well.
When mud is replaced by water the weight of the fluid exerted in the well becomes lighter. The
volume of fluid going into the well should be compensated by what is coming out. If more is coming
out than is going in, the well is flowing and needs to be shut immediately so that the situation can be
analyzed and rectified. The catastrophe occurred because the staff members proved to be incompetent
or inattentive42 to the alarming signals. (Hopkins, 2011: 1422)
41 Usually, after sealing a well, the drilling rig must secure the well through a process called “temporary abandonment. This operation is followed by the removal of the riser (piping that connects the drilling rig at the surface with the BOP at the wellhead on the seafloor.) and BOP. Afterward the job of “completing” the well is given to a smaller (and less costly) rig, which installs hydrocarbon-collection and -production equipment in order to make way for the production rig. (National Commission, 2011: 103)
42 Accidents caused by human failure seem to represent the majority. Indeed, 80% of high-consequences accidents fall in the category of human-factor uncertainties (hubris, arrogance, greed, ignorance and laziness). 60% of them are due to trouble in operations and maintenance. (Bea, 2010)
Page 24 from 101
Furthermore as we shall see in the following section, the quality of the products and mechanical ele-
ments used during the drilling, including the cement and BOP were dubious. Indeed, the BOP com-
pletely failed to function as a result of poor maintenance. Moreover, the quality of the cement that was
used in the well to strengthen the borehole and to prepare the well for production was questioned.
From the tests, it seems that the cement used was not as strong as needed, and was incapable of pre-
venting the gas from moving up the well. In addition to that, MMS whose laxity and corrupted attitude
is explicitly broached in the following section, knew of a study that the BOP was not strong enough to
shear and plug the deep-water pipes used at the well's depth. (Birkland and and DeYoung, 2011: 475)
2.3 Causes and Origins
Now we shall focus on the various failures that have led to the explosion. As we shall see, there exist a
multitudes of causes explaining the blowout, including legal, human, practical and mechanical short-
comings. Immediate failures (2.3.1), an inefficient internal safety culture, a negligent oil sector man-
agement (2.3.2), and regulatory inconsistency (2.3.3) are at the core of the tragedy. Indeed, the Ma-
condo blowout has resulted from as series of individual missteps and oversights by BP, Halliburton,
and Transocean, which government regulators failed to anticipate and prevent from occurring because
of a lack of authority, necessary resources, and technical expertise. (National Commission, 2011: 115)
Before going further it is worth mentioning that a specific commission called “the National Commis-
sion on the BP Deepwater Horizon Oil Spill and Offshore Drilling” has been created by President
Obama on May 21, 2010. The Commission's objectives were to analyze the causes and impacts of the
disaster but also to formulate recommendations for the US government to prevent and mitigate the im-
pact of any future spills resulting from offshore drilling (Encyclopedia of Earth, 2011).The final report
of this commission has been crucial in our understanding of the DWH event (and for the redaction of
this paper).
2.3.1 Acts of Negligence and Missteps
Negligence was at the core of the failures that occurred on the rig. Three elements ensure a better con-
trol of pressure and could have prevented the blowout and the following explosion and spill from hap-
pening: the cement at the bottom of the well, the mud in the well and in the riser, and the BOP. But
these safety devices were compromised (National Commission, 2011: 114-115). In the days following
the blowout, BP has been accused by a US congressional committee of ignoring warnings, violating its
own safety guidelines and choosing risky procedures with as first objective to cut cost and save time.
Negligence mainly concerned technical and mechanical elements that have certainly prevented the
safety automatic mechanism from being successful. According to this committee, BP made five fatal
Page 25 from 101

decisions, illustrating the oil company's desire to put profit before safety. (Pilkington, 2010) Here are
the accusations:
(1) BP used a cheap design for the well, preferring a single casing rather than the more sophistic-
ated design recommended by its own analysis;
(2) the company only used six centralizers despite being advised to use 21 by its contractor Hal -
liburton;
(3) the acoustic tests designed to measure the efficacy of the cementing in the well to blog off gas
flow was not carried out on a decision of BP, the process would have cost $128,000 and lasted
an extra 12 hours;
(4) the proper working of the new well system implying the circulation of drilling mud from its
bottom to the surface was not controlled; and
(5) the firm made the choice not to install a primordial piece of equipment: a “lockdown sleeve”.
It has as function to lock the wellhead and the casing at the level of the sea floor. The absence
of this device could explain the blowout. (Pilkington, 2010)
These five accusations clearly illustrate the carelessness and complacency that BP has shown in the
hours preceding the fatal blowout (Pilkington, 2010). Despite the obvious responsibility of the oil cor-
poration, BP will nevertheless managed to save partly its image and to manipulate the public opinion
thanks to a well-thought communication strategy (see 2.5.7). The missteps mentioned here above re-
flect the failures inherent to oil industry management in the US and extend beyond BP, to its contract -
ors also serving many other corporations of the oil sector (2.3.2). Nevertheless this systemic negli -
gence also results from the government's incapacity to provide effective regulatory oversight of off -
shore drilling (2.3.3). (National Commission, 2011:122) These two elements are going to be discussed
in the two following sections.
2.3.2 Industry Management and Self-policing Failures
Exploration and production of offshore oil and gas are risky. But these risks can be reduced, with prop-
er incentives and disciplined systems, sustained by committed leadership and effective training (Na-
tional Commission, 2011: 218). In this section, we shall first shed light on the shortcomings of the oil
and gas industry by identifying management failures (2.3.2.1). Then, we shall scrutinize BP's safety
culture in order to understand the inherent attitude of the corporation toward its offshore activities
(2.3.2.2).
Page 26 from 101

2.3.2.1 The Offshore Oil and Gas Industry
Offshore activities especially oil and gas exploration and exploitation are risky enterprises. Drilling a
well and the risks that it represents are not negligible. Furthermore, drilling platforms constitute dan-
gerous environments with their heavy equipment, hazardous substances (chemicals and flammable oil
and gas), and distant location from shore, in contexts where weather and water conditions are unpre-
dictable. In the US, safety standards of the oil and gas industry were until recently mainly developed
by the American Petroleum Institute (API). This organism relies on a serious and longstanding tech-
nical expertise and produces standards, recommended practices, specifications, codes, and so on, that
had most of the time been adopted by the US DOI. But it is obvious that API's reliability to set stand-
ards for drilling safety is compromised by its role as the industry’s principal lobbyist. Indeed, API reg-
ularly disapproved of and resisted agency rule-makings, favoring only decisions promoting an
autonomous industry free from governmental oversight. In some ways, API’s shortfalls have under-
mined the entire federal regulatory system. (National Commission, 2011:.224-225)
Quite surprisingly, risks and safety appear to be approached differently according to the part of the
globe where companies operate. Indeed, from 2004 to 2009, fatalities in the offshore oil and gas in-
dustry were significantly higher (more than four times) per person-hours worked in US waters than in
European waters, even though companies operating in these waters are frequently the same. This strik-
ing discrepancy strengthens the point of view suggesting that the problem is not so much dependent on
the business itself, but is rather determined by specific cultures and regulatory systems under which
the numerous members of the industry operate. (National Commission, 2011:224-225)
The most significant problem at Macondo is to find in industry management. Indeed, most shortcom-
ings can be identified as typical management (in the decision-making process) and communication
(between BP and contractors) failures. These two elements along with effective training of key engin-
eering and rig personnel would have prevented the incident. (National Commission, 2011:122-126)
Here is a list of the main mistakes made before the blowout and resulting from failures in industry
management:
(1) “BP’s management process did not adequately identify or address risks created by late
changes to well design and procedures”. Every change to well design is subject to a manage-
ment of change (MOC) process, except when they occur in the weeks and days before imple-
mentation. (National Commission, 2011:122-123)
(2) “Halliburton and BP’s management processes did not ensure that cement was adequately
tested.” Halliburton was not in control of the situation regarding laboratory testing and could
not make sure that the test results were rigorously analyzed or communicated (National Com-
mission, 2011:123).
Page 27 from 101

(3) BP, Transocean, and Halliburton failed to communicate adequately. Information was compart-
mentalized. BP did not share important information with its contractors, or sometimes intern-
ally. Consequently, people involved were driven to make critical decisions without a full un-
derstanding of the context. (National Commission, 2011:123-124)
(4) “Decision-making processes at Macondo did not adequately ensure that personnel fully con-
sidered the risks created by time- and money-saving decisions”. Most decisions made by BP
and its contractors resulting in higher risks were motivated by consideration of time and
money (National Commission, 2011:125-126).
Another major failure of the oil industry management and culture is illustrated by the inefficient VIP's
visit (an advocated practice of the oil industry ) seven hours before the blowout. Indeed in the hours
preceding the disaster, the platform was visited by a group of four company VIPs (from BP and
Transocean) whose role was to supervise and evaluate safety on the rig. The objective of the visit was
management visibility, they were still touring the rig when the explosion took place and were among
the survivors. During their visit, indications that the well was not sealed and was at risk of blowing
were clear. Nevertheless the signs were missed, or misinterpreted by the staff. What is surprising is
that the four VIPs had all experience as drilling engineers but did not notice the sign of the impeding
disaster. Ironically the main object of the visit next to management visibility was to emphasize the im-
portance of safety. A strong focus on safety issues would have been expected from the VIP's since four
months earlier, Transocean had experienced a near disastrous blowout in the North Sea, off the Scot -
tish coast. After this misadventure, Transocean management wrote a advisory report for every member
of the company about the incident reaffirming the importance of staying focused and alert to any signi-
ficant unusual incident. In this context it would have been appropriate to ascertain that the communic-
ation concerning the lessons from the North Sea incident had reached the Macondo well crew. (Hop-
kins, 2011: 1421-1423)
2.3.2.2 BP's Safety Culture
Safety Culture is “the set of enduring values and attitudes regarding safety issues, shared by every
member of every level of an organization. The term refers to the extent to which every individual and
every group of the organization is aware of the risks and unknown hazards induced by its activities; is
continuously behaving so as to preserve and enhance safety; is willing and able to adapt itself when fa-
cing safety issues; is willing to communicate safety issues; and consistently evaluates safety related
behavior” (European Aviation Safety Agency, 2011). BP has often insisted on the importance of safety
in its worldwide corporation. But safety culture does not seem to be a crucial element for the company
in spite appearances. Indeed, BP's safety shortcomings have been chronic. The oil company has pro-
voked several disastrous incidents revealing an approach toward safety management lacking serious-
Page 28 from 101

ness and focusing on occupational safety (National Commission, 2011: 218) rather than on process
safety. Occupational safety or personal safety concerns the protection of the safety, health and welfare
of people at work whereas process safety concentrates on major accident hazards associated with re-
leases of energy, chemicals, and other hazardous substances (Energy Institute, 2011). By focusing on
personal safety, the company has not succeeded in building up consistent and reliable risk-manage-
ment processes and has been unable to provide enough commitment to safety (National Commission,
2011:218). BP's lack of safety is illustrated by the following recent accidents in the company's installa-
tions:
the refinery accident in 2000 in BP’s Grangemouth Complex in Scotland, caused by failure in
safety management resulting in a succession of mistakes leading to a power distribution failure,
(National Commission, 2011:218)
the rupture of a gas line on BP Forties Alpha platform in the North Sea in 2003, causing the
flooding of the platform with methane (fortunately, no explosion occurred thanks to the wind
and the absence of spark) (National Commission, 2011:219),
the explosion of a refinery in Texas in 2005 killed several workers (Dillistone et alii, 2011:
227),
the Prudhoe Bay (AK) pipeline leak in 2006. BP had been aware of the problem for several
years, but had taken no significant measure. (Kirsh, 2010: 296)
After the catastrophe of the Texas refinery, BP changed its approach toward safety and became a re -
cognized corporation as far as safety management is concerned. But the incident of Prudhoe Bay dis-
appointed the public and the stakeholders, understanding that the company did not meet its environ-
mental promises. BP's image was temporally tarnished. (Dillistone et alii, 2011: 227) Recently, BP's
safety records in the GoM were considered excellent (National Commission, 2011:222), at least until
the night of April 20, 2010. This is probably due, to a progressive slackening of BP's vigilance result -
ing from its good records and the belief that no accident could occur. This combined with industry
management failure and the government laxity (subject of the following section) caused the blowout.
However, in the wake of the explosion, BP ordered an internal investigation. 26 recommendations spe-
cific to drilling were issued that BP accepted and is currently implementing across its worldwide
drilling operations. (BP. s. d.)
2.3.3 Laxity of the Federal Regulation
According to Robert Bea, engineer at the University of Berkeley (Ca), the crucial responsibility of the
disaster is incumbent on the government. The engineer uses the metaphor of the pares and the children
to make his point. Indeed, says he, government is the parent and industry the children. (Bea, 2010) In-
Page 29 from 101

deed, the legal oversight provided by the American government failed to prevent the mistakes made by
the oil industry.
MMS (now reorganized, see further43) which until recently was the US authority responsible for col-
lecting the billions44 of dollars of revenues generated by offshore drilling activities and promoting off-
shore drilling safety as well as environmental protection (National Commission, 2011: 55), was inef-
fective in adopting structuring regulations to address the risks of deepwater drilling. Most crucial as-
pects regarding safety were left to industry to decide without agency review. MMS is not the only fed-
eral agency responsible for these failures. The unsatisfactory situation was the result of a combination
of factors, among other things, the resistance of the oil industry (including API), members of Congress
(especially Conservatives), and several administrations to take strong actions. Consequently, no ad-
equate legal framework was in place to prevent the disaster, deal with the crisis or restore afterward.
(National Commission, 2011: 126-127)
After the rig staff of the DWH failed to notice the danger signals, the BOP should have worked and
shut the well automatically. Nevertheless the process failed for several reasons, among which the lax
inspection and enforcement regime under which offshore wells and drilling were proceeded. Indeed,
MMS (agency of the DOI) is under the OPA responsible for oil spill planning and preparedness, and
for select response activities regarding oil and gas industry. (National Commission, 2011: 83-84) But
the agency, rather than carrying out serious surveys, relied on, and accepted inspection reports written
by the oil industry and signed by inspectors (Birkland and DeYoung, 2011: 474).
The weakness of MMS' control is mainly due to its ambivalent role. Indeed, MMS had several mis -
sions, such as selling oil leases, collecting revenues, and regulating the safety of offshore exploration
and production. The agency gained its revenue from actual quantities of oil and gas transferred to the
federal government for resale on the oil and gas markets. Logically, this represented a powerful incent -
ive to promote oil production and to forget safety. In addition, MMS's pro-industry orientation gener-
ated some significant instances of corruption. The CWA requires that oil companies have regional and
facility spill response plans. However, it was widely known that BP's regional plan was riddled with
inconsistencies. (Birkland and DeYoung, 2011: 474), but the response plan was nevertheless approved
by MMS without further investigation. (National Commission, 2011: 83-84)
Besides being incompetent and partially corrupted, over time, MMS increasingly showed incompetent
to oversee the offshore oil industry. Indeed, because of a lack of resources, the agency was unable to
keep pace with industry expansion and increasing reliance on more demanding technologies (National
Commission, 2011: 68) The shortage of financial resources also extended to the US Coast Guard, re-43 Following the incident, some reorganizations have taken place inside the DOI see further, chapter 4.44 1 billion = 1,000,000,000 in the Anglo-Saxon world but 1 000 000 000 000 in other countries such as Belgium.
Page 30 from 101

sponsible for regulating vessels45, and other units engaged in OCS activities. (National Commission,
2011:75) This lack of financial resources also contributed to the failure of a whole regulatory system.
2.4 Liability for the Accident
Now with the help of what we have learned earlier (section 1.4: Legal Framework for Offshore
Drilling in the US), we shall now discuss the liability in the blowout of the DWH. In order to do so, it
seems crucial to identify all the stakeholders directly and indirectly involved in the Macondo well
drilling and sealing. The Macondo well tract was acquired in 2008 by BP Plc along with its partners
Anadarko Petroleum Corp. and Mitsui Oil Exploration Co. (MOEX). BP, being the majority stake-
holder, the company has largely been identified with the spill. The two other corporations, Anadarko
Petroleum Corp. and Mitsui Oil Exploration Co. own respectively 25% and 10% stakes and could con-
sequently also be considered responsible and forced to share in the cost of responding to the oil spill.
Furthermore, the oil platform was being leased by Transocean Ltd. to BP Plc, and just before the ex-
plosion on April 20, 2010, Halliburton Co. had been engaged in cementing operations on the well. Ad-
ditionally, the platform's BOP (technological device preventing blowouts), manufactured by Cameron
International Corp. did not prevent the explosion and fire from occurring. From all this we can con-
clude that no single actor and factors caused the Macondo well tragedy, but rather a sequence of fail-
ures attributable to several actors. (Noussia, s.d.: 141-143)
Each of these actor could be prosecuted for the damage or financial losses even if until now BP has
been the one to pay the bill (more about financial compensations in the final chapter). But prosecution
is not always obvious because a baseline is necessary. Indeed, claims concerning natural resources
damages can be brought by the government if a baseline of pre-spill conditions can be established.
This is particularly difficult in areas such as ports and commercial areas that were already partly pol -
luted before the spill. As previously mentioned, the USA has an explicit oil spill liability mechanism to
address events like the DWH incident. Under the OPA, a system of 'financial liability' has been created
which limits the extent of liability. As far as offshore facility is concerned liability limitation are based
on calculations of a worst-case oil spill discharge. As lessee of the drilling area, BP Plc is responsible
for removal and government response costs, property and natural resource damages and economic
losses resulting from the oil spill. However, even if a corporation is responsible for all removal costs,
offshore facility's liability for economic and natural resources damages is limited to $75 million per in-
cident. Expenses exceeding the cap could be paid by the Oil Spill Liability Trust Fund, which is fin-
anced through a fee on domestic and imported crude oil. In the case of BP, the liability has not been
limited to $ 75 million (removal costs) and is subjected to an exception due to its gross negligence or
45 The definition of vessels applies to most drilling rigs and some production platforms. This imply that CG are partly re-sponsible for regulating their safe operation. (National Commission, 2011:75)
Page 31 from 101

willful misconduct. Regarding the subcontractors: Transocean Ltd., Halliburton Co. or Cameron Inter-
national Crop, the OPA does not limit their liability. Similarly, OPA does not limit actions for contribu-
tion or contractual indemnification. (Noussia, s.d.: 147) Furthermore, the responsible parties will also
pay fines if the violation of federal laws (such CWA, CAA, ESA...) is recognized. Under CWA, these
penalties could amount to $4.5 billion - $21 billion. The sum owed will moreover depend upon find-
ings of negligence and the calculation of barrels discharged. (National Commission, 2011:211)
Let us now have a closer look at the crisis management in itself.
2.5 Crisis Management
The crisis management that followed the DWH explosion, covers a wide range of issues, and goes
from sealing the well (2.5.1) to communication strategies by BP in order to reduce the negative im-
pact of the spill on the corporation's image (2.5.7). Political shortcomings (2.5.2), mitigation efforts
(2.5.3), safety, economy (2.5.4), wildlife protection (2.5.5), and the fate of Macondo oil (2.5.6) are
also among the elements that will be discussed in the following sections.
2.5.1 Response : Sealing the Well46
The response began just after the explosion on April 20, 2010 when the Coast Guards (CG) arrived in
the neighborhood of the rig to extinguish the fire and search for survivors, none among the eleven
missing people was found. Joseph Paradis who was the Captain of the Marine Safety, became the first
Federal On-Scene Coordinator under the National Contingency Plan (NCP). This plan (under NEPA)
is a set of federal regulations prescribing the government’s response to spills and and other hazardous
materials. Accordingly, the CG is the authority responsible for responding when a spill occurs in
coastal waters. On April 21, an oily sheen became visible around the area of the explosion and grew
progressively. Consequently the number of CG personnel and resources directly involved increased
significantly and Rear Admiral Mary Landry took over as Federal On-Scene Coordinator. Despite the
various efforts, the rig sank, on April 22, with 700 000 gallons47 of diesel fuel still on board. Mean-
while, the CG established an Incident Command Post (ICP) in a BP facility in Houma (La), and in
Houston (Tx) where BP had also formed a command post in its corporate headquarters. These ICPs,
along with others established later, rapidly became the nerve center of the various response operations
directed by the Federal On-Scene Coordinator in the framework of the government’s Unified Com-
mand. Under the NCP, the Unified Command integrates BP, federal and state officials in order to
46 In order to realize this part of the work, we have heavily relied on the report of the National Commission's investigation on the blowout and subsequent spill. Indeed, the commission has provided the most complete document as far as the suc -cession of events is concerned.
47 700 000 gallons represent 3182.26 m³.
Page 32 from 101

provide an efficient response. On April 23, the CG also established a Unified Area Command (UAC)
in Robert (La) including representatives of the federal government and of the various coastal states
(Louisiana, Alabama, Mississippi) susceptible to be impacted by the spill. Federal agencies such as the
National Oceanic and Atmospheric Administration48 (NOAA) and MMS also took part in response ef-
fort by sending emergency responders to the UAC and the ICPs. (National Commission, 2011:130-
131)
Even before the rig sank, BP and Transocean directed their attention to the BOP stack of the well. On
April 21, BP and Transocean began using a ROV in an attempt to close the BOP and stop the flow of
oil and gas. On April 23 and 24, two leaks were discovered on the broken riser. Following this discov-
eries, BP considered other ways of controlling the well. A primary option was to drill a relief well and
enable a drilling rig to pump in cement to stop the flow of oil. But this operation would take more than
three months. In spite of this consequent laps of time, the oil company, started drilling a relief well on
May 2, and on top of that a back-up well advised by Interior Secretary Salazar on May 17. (National
Commission, 2011: 131-132)
In the meantime, responders began to focus exclusively on the large amounts of oil gushing from the
well. Under the NCP, CG are supposed to supervise the oil-spill response in coastal waters by using re-
sponse equipment that must be provided by private oil-spill removal organizations working for the oil
company responsible for the catastrophe (here BP). At the peak of the response effort, roughly 45,000
people participated including active-duty members of the Gulf, reservists and responders sent to the
Gulf region by federal agencies, such as EPA and NOAA. (National Commission, 2011: 132- 133)
The disaster became a “Spill of National Significance” (SONS) on April 29. This term refers to a spill
“that due to its severity, size, location, actual or potential impact on the public health and welfare or
the environment, or the necessary response effort, is so complex that it requires extraordinary coordin-
ation of federal, state, local, and responsible party resources to contain and clean up the discharge.”
Following this designation, Admiral Thad Allen49 was chosen to become National Incident Command-
er (NIC) and took over the role of the Federal On-Scene Coordinator regarding communication with
impacted parties, and coordination between federal, state, local, and international resources at the na-
tional level. He consequently became the face of the federal response, whereas the Federal On-Scene
Coordinator kept overseeing day-today operations. (National Commission, 2011: 136-137)
48 NOAA is a federal agency within the Department of Commerce, advancing the understanding of and ability to anticipate changes in the Earth's environment, thanks to an improved ability to make scientifically informed decisions, and the con-servation and management of ocean, coastal, and Great Lakes’ resources (Lubchenco, 2011).
49 Admiral Allen, the outgoing Commandant of the Coast Guard is famous in the GoM thanks to his oversight of the federal response to Hurricanes Katrina and Rita. Indeed, his leadership had widely been considered a success. (National Com-mission, 2011: 136-137)
Page 33 from 101

In spite of BP's willingness to stop the oil from gushing into the GoM, the oil company had no avail-
able, tested technique to operate at such a depth. Indeed, BP had to find other solutions to contain the
blowout by adapting shallow-water technology to the deepwater environment, or by creating new tech-
nological devices. (National Commission, 2011: 135) In early May, BP’s initial efforts to stop the flow
of oil ceased to focus on the BOP (first attempt) that until then had seemed to be the best option (Na-
tional Commission, 2011: 137-138) BP engineers simultaneously worked to contain the flow, drill a
relief well and recover oil until they could eventually cap the well (87 days after the blowout). Within
days, BP proposed a second solution by considering the use of a large containment dome. It consisted
in placing a dome or cofferdam over the largest leak, channeling oil and gas to a ship on the surface
thanks to a a pipe. This first alternative failed mainly because of the inaccurate assessments of the
quantity of oil flowing from the well. On May 16, BP deployed during 9 days a new collection device:
the Riser Insertion Tube Tool (third attempt), composed of a tube fitting into the end of the riser, carry-
ing oil and gas up to a ship. This tool was able to recover about 22,000 barrels50 of oil. (National Com-
mission, 2011:145-146)
Subsequently, BP tried a new strategy consisting in killing the well completely, thanks to a “top kill”
and a “junk shot.” (fourth attempt) A top kill implies pumping heavy drilling mud into the top of the
well to force the flowing oil back down the well. The top kill is complemented by a junk shot that in -
volves pumping material (ie. tire rubber and golf balls) into the well in order to slow or stop the flow
before using the top kill. After the third unsuccessful attempt, this strategy was abandoned. (National
Commission, 2011:149-150) BP's next step was an attempt to install a second BOP (a capping stack)
on top of the existing one (fifth attempt) (National Commission, 2011:158). In the meantime, in order
to collect a portion of the gushing oil, BP cut off the portion of the riser still attached to the BOP and
install a “top hat”, a collection device connected by a pipe to a ship. By June 8, the latter was collect -
ing approximately 15,000 barrels51 of oil per day. BP also designed a system to collect oil and gas
through the choke line of the BOP which collected about 10,000 barrels52 of oil per day. (National
Commission, 2011:159)
By late June, BP was deploying a “capping stack,”that would enable them to shut in the well. (Nation-
al Commission, 2011:161-162). Its installation was completed by July 12. On July 15, for the first time
in 87 days, no oil flowed into the GoM thanks to the closure of the capping stack. However, keeping
the stack shut and eventually stop the flow of oil had to be balanced with the possibility to cause an
underground blowout because of the high pressure in the well. After some discussions between BP, the
government and other actors, the decision was made to keep it shut. Four days later, on July 19, BP
raised the possibility of killing the well before the completion of the relief well, thanks to a strategy
50 22 000 barrels of oil represent 3497.72 m³.51 15 000 barrels represent 2384.81 m³.52 10 000 barrels represent 1589.87 m³.
Page 34 from 101

called the static kill and involving to pump heavy drilling mud into the well to push oil and gas back
into the reservoir. The process would not be too difficult given the relative immobility of oil and gas
thanks to the capping stack. Both the static kill and following cementing of the well were a success.
BP finished its first relief well, in mid-September, and intercepted the Macondo well, where it pumped
cement in order to permanently seal the reservoir. On September 19, 152 days after the blowout, the
Macondo 252 well was effectively dead. (National Commission, 2011: 169)
2.5.2 Political Shortcomings
An intergovernmental conflict became quickly observable during the crisis. This conflict stemmed
from state-level misunderstandings. According to the National Oil Spill Commission , the conflict res-
ulted from the fact that the states assumed that response would proceed under a much more familiar
model: the Stafford Act (SA). This act is the framework according to which the federal government
operates when response and assistance are needed at the state-level and in localities impacted by natur -
al disasters or industrial accidents. However, in the case of oil spill response, most federal authorities
proceed under the NCP which implements the CWA (as amended by the OPA 90), and implies a feder-
al response to oil spill quite different from the federal response to natural disasters. Apparently the
states were confused by the two different regimes. Nevertheless, the confusion was not quite logical
since the federal government had refused to invoke the SA in the Exxon Valdez oi spill in 1989. (Birk-
land and DeYoung, 2011: 475-476) The choice to act through NCP was furthermore strategical since
under this regime people can seek compensation from oil companies and their contractors whereas this
does not exist in the case of natural disasters. (Birkland and deYoung, 2011: 476-477) Four majors
complaints were made by state and local governments concerning the DWH crisis management in the
GoM:
(1) firstly, several governors among whom Governor Jindal (La) complained that the federal co-
ordination was insufficient and that the consultation of state governments was unsatisfactory,
(2) the second criticism targeted the federal government's bureaucracy and red tape slowing down
local self-help efforts,
(3) thirdly, there was the general perception that no one was actually in charge of the oil response.
The effort was mainly led by the US CG, particularly after the spill was declared to be a SONS.
For a SONS, the response actions are supervised by a NIC whereas the technical initiatives are
supposed to be undertaken by the spiller and its contractors (as defined in the CWA). BP took
responsibility and invested millions of dollars in order to response the most adequately pos-
sible. The oil company's efforts were so central to stop the leak that many felt that the federal
government had delegated response leadership to BP. This was absolutely not the case since
most actions that BP implemented, were undertaken with the approval of the NIC.
Page 35 from 101

(4) A fourth complaint concerned the amount as well as the speed of federal aid to localities im-
pacted by the slick. (Birkland and deYoung, 2011: 476-477)
This lack of understanding between the state and federal levels has certainly not favored the adequacy
of the oil response that will be the subject of the following section.
2.5.3 Mitigation and Remediation Measures
The DOI with other State, Tribal and Federal partners act as trustees for 'American' resources. Trustees
are responsible for the identification of the natural resources injured and for determining the extent of
the injuries, recovering damages and planning and carrying out natural resource restoration activities.
These different activities are managed under the Natural Resource Damage Assessment (NRDA) and
Restoration Program whose main objective is to restore injured ecosystems. The authority to carry out
these activities is provided by three important laws: the “Environmental Response, Compensation, and
Liability Act of 1980”, the CWA and the OPA. Other federal agencies are also responsible for the
American Nation's natural resources, among which the NOAA, US Forest Service, Department of De-
fense, and Department of Energy. In the case of oil pollution in marine environment, the source of the
discharge is at the very beginning contained by the CG, the EPA, State agencies and the responsible
party, here BP. (US Fish and Wildlife service,“The Natural Resource Damage Assessment and Restor-
ation Program” 2010: 1)
Strikingly contrasting with the technology developed in the oil industry for deep-water oil drilling, oil
spill recovery techniques have stagnated over the years whereas sea surface conditions inherent to high
sea drilling explorations are much rougher. In open waters, it is estimated that only 10% of released
oiled can be recovered. Thus, prevention remains the best solution. (Burroughs, 2011: 50) Various con-
ventional methods have been used by BP and the US CG in order to mitigate the impact of the leaking
oil, including deploying floating booms, utilizing skimmers (2.5.3.1) bioremediation, burning oil on
the water (2.5.3.2), the manual work of cleanup workers (2.5.3.3) and releasing chemical dispersant
(2.5.3.4). (see annex 4 for a scheme of the different techniques) (Narayan, 2010: 58). The various pro-
cesses lying at the heart of the different techniques used to mitigate the impacts of the spill will shortly
be explained A final section will consider the relevance of taking action (2.5.3.5).
2.5.3.1 Booms and Skimmers
Booms and skimmers constitute the first techniques used in order to recover or control oil floating on
the surface of the sea. Constituted of a floatation element riding on the surface and a weighted skirt ex-
tending beneath it, booms (see figure 10) can stop oil moving at the surface when the currents and
Page 36 from 101

winds allow it. Booms can be used in several situations, like shorelines protectors or towed by a ves-
sel. Skimmers (see figure 11) are more elaborate oil recovery systems, they are special vessels collect-
ing oil thanks to physical separation from saltwater, either by pumping the oil/water mixture aboard
the boat or by moving an oil-absorbing material through the oil and often squeezing the oil/water mix-
ture into a container on the vessel. (Burroughs, 2011: 49-50)
Source: (US Department of Commerce, s.d.) Source (Ottar Grundvig, James, 2010)
Local communities were particularly attentive to the use of booms in their neighborhood, in spite of
their relative effectiveness (see oil budget, section 2.5.6). Residents not being able to see source con-
trol efforts on the ocean floor or skimming far out in the Gulf, focused on the visible floating booms
protecting their shorelines (National Commission, 2011:151). Initially, responders used the data
provided by NOAA scientists on oil trajectory, as well as their knowledge of the region’s geography,
in order to place booms adequately. But progressively, CG responders distributed many miles of
booms according to political rather than operational imperatives, risking by the same occasion that
storms would blow them into delicate marsh habitats.53 (National Commission, 2011:153-154)
2.5.3.2 Burning Oil and Bioremediation
A controversial alternative aiming at recovering oil is to burn it on the surface of the ocean. Neverthe-
less, less easy than it seems, it requires several conditions: oil must be freshly spilled and in a layer of
sufficient thickness. A specific thickness can be obtained by towing fireproof booms in the spill area
and igniting the oil captured. (Richard Burroughs, 2011: 50)
Bioremediation has also been attempted in the case of the DWH oil spill. The objective of this process
is to use specialized microbes and nutrients in order to create conditions accelerating the degradation
and oxidation of oil molecules. (Duhon et alii, 2011: 226-227)
53 The same problem was encountered with the use of berms, an unreliable project that should have supposedly protected the shores and allow to recover oil, but that was never carried over and revealed to be a failure (National Commission, 2011: 154-157).
Page 37 from 101
Figure 10: Booms Figure 11: Skimmer Ships in the GoM

2.5.3.3 Cleanup Workers
Furthermore in order to mitigate the impact of the oil slick, professionals but also many volunteers
have swung into action (see figure 12). While cleaning-up the beaches and saving birds or other anim-
als suffering from the spill, they have been exposed to oil and dispersant. These substance represent a
danger for human health. (Weinhold, 2010: A347). More than 40 100 emergency responders have been
active in the zone reached by the oil slick (Weinhold, 2010, P. A348- A350). The health question of
these clean-up workers will be discussed in the third chapter of this work devoted to the human and
social impacts of the spill (3.1).
Source (Atlas and Hazen, 2011: 3)
2.5.3.4 Use of Dispersant
When oil spills on water under the form of thin layers, the lighter components gradually evaporate,
and some soluble ones dissolve. Oil will furthermore be broken up by the wave action, creating oil
droplets in the water and water droplets in the oil. Along with this process the oil changes into a
brownish emulsion. As long as oil remains on the surface, the UV radiation contribute to break down
the oil components. When one choose to use dispersant, it is in order to speed up the emulsification
process. (Jernelöv, 2010: 356)
In the GoM, dispersant was wielded during 12 weeks, novel methods and unprecedented volumes
were used. The advantage of this technique is that the substance can be used when responders are pre-
vented from skimming and burning because of bad weather. (National Commission, 2011:143) When
dispersant was first spread on the oiled water surface (April 22), the interagency “Regional Response
Teams” had not yet evaluated and preauthorized their use. However, one could not wait for an thor-
ough analysis because timing matters with dispersant. Indeed, the chemicals are most effective when
oil is fresh. As a result, BP and its contractors applied huge quantities of the dispersant Corexit on the
surface of the GoM. (National Commission, 2011:143-144)
Page 38 from 101
Figure 12: Clean-up Workers in Houston

If dispersing oil may be positive and help protect birds, marshes and beaches, it is quite damaging for
fishes, crustaceans, molluscs and all other organisms living and breathing in water (Jernelöv, 2010:
356). Furthermore, Gulf residents became worried of the huge quantity of oil dispersed. Their anxiety
was heightened because Nalco, the company that manufactures Corexit, refused to disclose its formula
publicly. (National Commission, 2011:143-144)
In the meantime, BP raised the unprecedented idea of applying dispersant directly at the well. Some
scientists were optimistic, believing that dispersant would be more effective in the turbulent deep wa-
ters. As a result, a protocol was created by NOAA and BP scientists and adopted by EPA on May 10,
that limited subsea application to 15,000 gallons54 per day and required monitoring and compliance
with established environmental toxicity guidelines. (National Commission, 2011: 143-145) As we
shall see in the following chapter (3) the use of dispersant revealed to be very damageable for the
GoM ecosystems, residents and responders.
2.5.3.5 Ecological Engineering or the Relevance of Taking Actions
The techniques mentioned above, such as burning, skimming, 'booming', and so on have thus been
used to mitigate the negative effects of the spill, but we could wonder whether we should not have let
the oil disappear naturally. Some people promoting ecological engineering55 claim that so-called
cleanup efforts often lead to worse conditions than leaving the oil disappear 'naturally'. In the GoM,
the use of chemicals to protect marsh and soils has created other pollution problems on the long term.
According to H.T. Odum56, a famous ecologist of the 20th century, nature has the ability to self-organ-
ize, adapt and form new ecosystems as conditions change. In his classification of US coastal ecosys-
tems, Odum proposed a class of coastal ecosystems that have developed in response to human-caused
pollution. He calls this specific category of ecosystems “emerging new systems”. (Mitsch, 2010: 1608)
According to Mitsch, through natural process, the oil in the Gulf will ultimately dissipate, evaporate or
be consumed by oil-degrading microbes. The phenomenon is stimulated every year by the warm water
summer temperatures (especially in 2010, just after the spill) in the Gulf and the abundance of nutri-
ents coming down from the Mississippi river. Consequently, according to ecological engineers, there is
no need to import 'oil-eating microbes' to clean up the Gulf. However, more problematic according to
Mitsch is the accumulation of oil in anaerobic marsh soils (see section 3.2). This could preserve oil for
decades, preventing its degradation. An efficient ecological engineering method was used in the GoM
during the spill : diversion structures were opened to spread water flow of the Mississippi through the
54 15 000 gallons represent 56781,18 liters.55 Ecological Engineering is the design of sustainable ecosystems that integrate society within its natural environment for
the benefit of both (Royal Haskoning, 2010 ).56 Howard T. Odum (1924 – 2002) was an American ecologist, famous for his pioneering studies of energy flows in ecosys-
tems, and for the application of those same principles to energy use in society (Cleveland, 2008).
Page 39 from 101

delta so that oil was prevented from penetrating deeply into estuaries and marshes. (Mitsch, 2010:
1608)
The choice of acting is often crucial. A major problem preventing the wide use of ecological engineer-
ing methods is the public opinion. Indeed, if the state and federal governments had not used controver-
sial method such as dispersant, there would have been criticized for doing nothing to reduce the spill,
or at least not enough. The multiple mitigation techniques would have removed up to 19 000 barrels57
of oil per day from the Gulf water. Nevertheless, major threats for the wildlife and human health did
not disappear. (Narayan, 2010: 58)
2.5.4 Safety and Economical Measures
During the oil spill, some hard measures impacting directly local populations had to be made. Indeed,
prohibiting seafood (2.5.4.1) or imposing a moratorium (2.5.4.4) was a heat blow for the coast in-
dustry (this point will be developed in the third chapter), but were necessary in order to prevent any
other blowout of the same kind from happening and to protect people against the possible contamina-
tion of seafood. Furthermore, specific measures were also needed for emergency volunteers that were
exposed to pollutants (2.5.4.3). In this section we shall focus on these different sanitary and safety
measures and the mitigation processes put in place in order to reduce the negative impacts on people
involved in sectors affected by these measures (2.5.4.2 and 2.5.4.4).
2.5.4.1 Seafood Safety
The GoM is a very rich fishing ecosystems, indeed, there are plenty of crabs, shrimps, oysters, and fin-
fish fisheries. All this fishing diversity has of course been affected by the oil spill. In order to protect
people against potential contamination, fishing zones were closed. The Louisiana Department of Wild-
life and Fisheries and the Department of Health and Hospitals were the first entities beginning closing
fisheries and oyster grounds in state waters (3 miles58 or less from shore) on April 30, because of the
geographical proximity of the disaster. (National Commission, 2011:140) Similarly, due to the issue
raised by seafood safety, on 2 May 2010, the NOAA, decided the closures of federal waters to com-
mercial and recreational fishing (Doke et alii, 2011: 1062). NOAA’s NMFS first closed an area span-
ning approximately 6.817 square miles59 (3 % of the Gulf federal fishing zone). On May 7, NOAA in-
creased the closed area to 4.5 % of that zone. At their maximum, the closures covered about 37% of
the GoM (225,290 km²). Following the federal and Louisiana examples state fishery closures progress-
57 19 000 barrels represent 86.36 m³.58 3 miles represent 5.556 kilometers.59 6.817 square miles represent 12.625084 km².
Page 40 from 101

ively extended to Alabama (June 2), Mississippi (June 4), and Florida (June 14). (National Commis-
sion, 2011:140)
Reopening began on June 23. On 24 November 2010 the NOAA re-closed 10,911 km² to deep-water
fishing for royal red shrimp northwest of the wellhead. However on 21 January 2011, only 0,4%
(2697 km²) of the federal waters located in the immediate surrounding of the well were still closed. All
GoM federal waters were accessible for fisheries on 19 April 2011. (Doke et alii, 2011: 1062)
2.5.4.2 Participation of the Fishing Sector
The fishing industry and local workers being severely impacted by the fisheries closures, local de-
cision-makers convinced BP and the Unified Command to include fishermen as well as residents in the
clean-up job. Out-of-work fishermen were considered to be useful thanks to their experience in the
GoM and knowledge of the shoreline. (National Commission, 2011:140) Consequently, BP resorted to
local commercial and charter fishing vessels and crews of the Gulf Coast through a program called the
Vessels of Opportunity (VoO), providing some indirect income to affected residents and fishermen of
the GoM (B.P. 2010. “Factsheet on BP Vessels of Opportunity Program”: 1). The program resorted on
private vessels to conduct response efforts such as skimming, booming, and transporting supplies (Na-
tional Commission, 2011:140-141). Depending on the size of the boat, the program provided between
$1200 and $3000 per day whereas individual crew members made $200 for an eight-hour day (B.P.
2010. “Factsheet on BP Vessels of Opportunity Program”: 4). Despite its crucial role, for local fisher-
men and residents prevented from working, the program was slow to develop eligibility requirements.
However, in spite of the numerous efforts, these hundreds of vessels looking for oil did not contribute
significantly to the response (see 2.5.6). Indeed, aircraft were more effective at locating oil and placing
booms requires skill and training. (National Commission, 2011:140-141)
2.5.4.3 Voluntary Responders' Safety
The human toll generated by the 20 April 2010 BP disaster in the GoM was quite heavy. Indeed, be-
sides the eleven people who died on the rig, tens of thousand of workers, especially volunteers, have
worked in difficult unsafe conditions in order to stop the leak and mitigate the impact of the oil spill on
the coastal environment and wildlife. By doing so a lot of them were exposed to serious health and
safety risks. This situation was due to a lack of existing regulatory measures to deal with cleanup
workers' safety and health in the aftermath of an oil spill. Despite the lack of safety, thousands of
cleanup responders joined the cleanup efforts without adequate training and guidance. Oil is toxic but
it is also the case of the tons of dispersant that have been used. In order to cope with this problem, the
Occupational Safety and Health Administration (OSHA) and the National Institute for Occupational
Page 41 from 101

Safety and Health (NIOSH) tried to settle on policies concerning training for cleanup workers and ap-
propriate equipment gear. Fortunately, OSHA and NIOSH were able to respond quickly enough to mit-
igate the negative impact of cleanup activities on volunteers. Indeed, OSHA sent extra personnel to the
region to look after the volunteers and was able to overcome a series of significant jurisdictional prob-
lems, such as extending the reach of the safety authority beyond the 3 nautical mile60 limit from the
shoreline to protect volunteers working offshore. From the very beginning of the crisis, OSHA and
NIOSH developed a matrix of the various tasks performed by the workers in order to better plan pos-
sible workers response in the future. Additionally the data concerning the workers were compiled in
order to study possible health effects on the long term. These efforts were characterized by a series of
failures. Too many workers were given inadequate training on the use of personal protective equip -
ment. Still more problematic for safety and health monitoring was the insufficient understanding of the
risks linked to chemical exposure, given the fact that the formula of the dispersant was kept hidden.
(Bratspies et alii. 2010: 1-2)
Besides volunteers, residents of the Gulf region were also affected (burning oil, seafood...). But the
Centers for Disease Control and Prevention had not planned that an oil spill could affect the health of
the broader neighboring population and hesitated on the role health agencies might play in such an
event. Moreover, the Department was concerned that neither the Oil Spill Liability Trust Fund nor BP
would pay for the cost that would be generated by activities such as long-term health surveillance. In
order to organize the health response, a Senior Health Policy Advisor was sent in June to support the
NIC. (National Commission, 2011:141)
2.5.4.4 Offshore Drilling Moratorium
On May 27, a six-month moratorium was established, on the order of Secretary Salazar, on all drilling
at a water depth of more than 500 feet61 in the GoM and the Pacific Ocean (National Commission,
2011: 152). The Secretary said that the moratorium would provide the necessary time to make sure
similar accidents would not occur, and that rig operators were prepared to deal with worst-case scen-
arios. Furthermore according to Department officials, it would also give time for the National Com-
mission to begin its investigation and for MMS to undertake needed safety reforms. Criticisms regard-
ing the moratorium were issued by Republican leaders, Gulf state officials and Gulf Coast residents,
arguing that this measure would aggravate the Gulf economic situation. (Cohen Tom, 2010) The
moratorium took effect on May 30 and was lifted on October 12. A few weeks before lifting the ban,
new regulations were promulgated by the Department on topics such as well casing and cementing,
BOP, safety certification, emergency response, and worker training. From that time onwards, compli-
60 3 nautical miles represent 5,56 kilometers.61 500 feet represent 152.4 meters.
Page 42 from 101

ance with the new rules is a conditional requirement for obtaining offshore drilling permits. (National
Commission, 2011: 152)
In order to support the rig workers of the GoM directly impacted by the moratorium, a charitable fund
of $100 million was established by BP on July 30, 2010. This measure was encouraged by the federal
government that considered that the ban could temporarily result in up to 8,000 to 12,000 fewer jobs in
the GoM, especially in small businesses. (National Commission, 2011: 152)
2.5.5 Wildlife's Protection
Besides the damages cause to the human component of the Gulf; the spill has also affected wildlife
health. The first oiled bird was discovered on April 30 (National Commission, 2011:141). Animal re-
sponse and rehabilitation efforts were supervised by the US FWS, NOAA’s Fisheries Service, state
wildlife agencies, and academic organizations. (US Fish & Wildlife Service and the NOAA, s. d: 1)
Animals found by wildlife responders were taken to one of several treatment centers, where they were
washed, monitored, and then released. (US Fish & Wildlife Service.“Oil Spill Response” 2010: 1)
Many volunteers were eager to help and according to the Audubon Society62, more than 12,000 people,
volunteering for wildlife rescue, signed up to help with these efforts during a single week in early May
(National Commission, 2011:141).
2.5.6 Where is the Oil?
On August 4, 2010, the federal government released a report focusing on the fate of the Macondo well
oil that had gushed into the Gulf. The “Oil Budget” was the first public estimate of the total volume of
oil released during the 87 days. It amounts to roughly 4.9 million barrels63. The government obtained
this number thanks to its current flow-rate estimate, ranging from 62,200 barrels 64 per day on April 22
to 52,700 barrels65 per day on July 14, just before the oil flow was stopped. According to this oil
budget, approximately 50% of the oil is gone ( evaporated, dispersed, burned, skimmed or recovered
from the wellhead, see figure 13). (National Commission, 2011:167- 169)
62 The National Audubon Society (Audubon) is an American, non-profit, environmental organization. The entity is active in conservation and restoration of natural ecosystems and focuses especially on birds, other wildlife, and their habitats. He society further considers the benefit of these ecosystems for humanity and the earth's biological diversity. (Audubon. “About us”)
63 4,9 million barrel represent 77903777 m³.64 62 200 barrels represent 98890,1006 m³.65 52 500 barrels represent 8378.63071 m³.
Page 43 from 101

Source: (National Commission, 2011:168)
On November 23, 2010, the Federal Interagency Solutions Group (part of NOAA), released a peer-re-
viewed report entitled “Oil Budget Calculator”66 revising the government’s oil budget. This report
largely corresponds to the previous results (see figure 14). The most striking change is a significant in-
crease of the amount of oil classified as “chemically dispersed”. (US Department of Commerce
(NOAA), 2010) These changes bring the “residual” oil down from 26% to 23 % (National Commis-
sion, 2011:167- 169).
Figure 14 : Comparison Between the Two Oil Budgets
Source: (US Department of Commerce (NOAA), 2010)
Oil Budget (Released Aug. 4) Oil Budget Technical Report (November) Results
CategoryDirect RecoveryBurnedSkimmedChemically DispersedNaturally DispersedEvaporated / DissolvedOther
% of Total17%5%3%8%16%25%26%
CategoryDirect RecoveryBurnedSkimmedChemically DispersedNaturally DispersedEvaporated / DissolvedOther
% of Total17%5%3%16%13%23%23%
ChangeNoneNoneNone+8%-3%-2%-3%
In the reviewed version, chemical dispersant has broken down 16%. Response technology such as
skimming and burning removed only 8 % of the oil. In spite of the only 5% of oil removed thanks to
the burning method, responders considered burning an important success because it had never before
been attempted on this scale. Additionally, burning techniques were progressing during the spill. Skim-
ming was not very successful (only 3%) in spite of the participation of hundreds of ships and thou-
sands of people in the framework of the VoO program (see 2.5.4.2). (National Commission, 2011:167-
169)
66 The full 217-page report, including appendices and peer-review team comments is available online at <http://www.noaanews.noaa.gov/stories2010/PDFs/OilBudgetCalc_Full_HQ-Print_111110.pdf >.
Page 44 from 101
Figure 13: The DeepWater Horizon Oil Budget

2.5.7 Communication and Information
In this last part of the crisis management section, we shall focus in particular on the various strategies
used by BP to restore and conserve its image and to distance itself from the disaster. The explosion of
the BP DWH oil rig in the GoM on April 20, 2010, has been presented in the media as an unpreceden-
ted event. The disaster has indeed become the second most publicized environmental catastrophe in
decades after Chernobyl nuclear meltdown. The belief in the extraordinary character of the disaster has
also been reinforced by the politicians' attitudes, President Obama has himself referred to the DWH
blowout as “potentially the worst environmental disaster in American history”. (Jernelöv, 2010: 353) If
some people expected that BP's image would be completely destroyed by the catastrophe, they were
mistaking, BP has successfully managed to deal with the crisis as to appear almost as a victim. How
BP did this, is the topic of the two following sections.
2.5.7.1 BP's Decoupling Strategy
BP successfully applied a decoupling strategy. Indeed the petroleum corporation dissociated itself
from being responsible for the cause of the accident and presented itself simultaneously as the savior.
This was not the case of the political actors, not perceived by the population as providers of solution in
this crisis. A crisis as the Macondo blowout, threatens the priority of a corporation and causes a huge
amount of media attention. After the explosion and sinking of the rig, BP proposed and tried various
techniques to stop the gush of oil (see 2.5.1), until finally the leak was permanently closed on Septem-
ber 19, 2010. (Kleinnijenhuis, Schultz et alii, 2011: 97) In order to restore the narrative of control, BP
tried to communicate mainly about the solutions of the crisis. Indeed the petroleum company focused
on the solutions and the compensations for the victims, but at the same time took indirectly the re-
sponsibility for the damages. BP paid a lot of attention to the oil spill itself but very little to the causes.
(Kleinnijenhuis, Schultz et alii, 2011: 98-99) Consequently, the crisis was presented by BP as an event
with external origins. The strategy was surely chosen to avoid responsibility in the press and in judi-
ciary procedures. BP brought new technological solutions with symbolic and impressive names:'top
hat' 'to kill', 'static kill' and so on. By not relating in the media other actors such as the White House to
the resolution of the predicament, the company prevented the government and other state entities to be
considered as solution providers. (Kleinnijenhuis, Schultz et alii, 2011: 103-104)
In addition to the immediate interaction with the media, BP was from the very beginning planning its
image preservation and restoration during the whole process of sealing and mitigating.
2.5.7.2 BP Image Preservation and Restoration
The corporate image of British Petroleum has been tremendously challenged since the spill. The giant
Page 45 from 101
has resorted to many strategies in order to preserve and restore its image. One strategical method
chosen by BP to restore its image was interaction with individuals and interest groups through social
media channels, such as Facebook , Twitter, YouTube and Flicker. (Dillistone et alii, 2011: 226)
BP has taken the responsibility for the disaster and spent billion of dollars in compensation and clean-
up efforts but has nevertheless not stopped to blame its subcontractors (Transocean, Halliburton,
Cameron, and so on). As soon as the news of the spill was released, the corporate was severely criti-
cized by the federal and state governments, activists and environmental groups, and ordinary citizens
(in particular inhabitants of the Gulf Coast). Criticisms issued concentrated on the damages caused by
the spill and the failure to respect the safety measures and environmental laws. As a result,BP decided
to engage in image restoration discourse. (Dillistone et alii, 2011: 226).
One should never forget that audience perception is crucial in defining a company's identity and im-
age. Corporations are responsible for their actions through public reactions. (Dillistone et alii, 2011:
230) BP has always had a poor environmental track record (see BP safety culture, section 2.3.2.2).
Consequently, in order to distance itself from its previous misadventure, the company has created a
new logo (see figures 15 and 16). (Dillistone et alii, 2011: 227) As a result, before the 2000's, BP en-
joyed a highly successful reputation as international oil conglomerate. (Dillistone et alii, 2011: 230)
Source: (Loewy, 2009) Source: (B.P.’s Official Website)
The biggest challenge for the image corporation was without any doubt the oil spill in the GoM. The
wave of attacks resulting from the rig blowout was unprecedented for BP. Tony Hawyard (BP's CEO)
first adopted a defensive posture, the company used around $50 million on advertisements defending
its record. Another campaign launched by BP's CEO aimed at apologizing but did not resonate with
the pubic. The brand of BP once famous for green energy (see figure 16) was then assimilated to 'dis -
aster' and shame'. (Dillistone et alii, 2011: 227) In period of crisis, communication becomes crucial for
a corporation. Image restoration is the strategy used by a company or individual at fault or accused to
restore their image. Five major sub-strategies can be used: (1) denial, (2) evasion of responsibility, (3)
reducing offensiveness, (4) corrective action, (5) mortification. (Dillistone et alii, 2011: 228)
Corrective action and compensation were the two most dominant techniques in BP's image restoration
Page 46 from 101
Figure 15: BP's Former Logo
Figure 16: BP's New Logo

strategy. The other technique also promoted was mortification. The social network helped to initiate a
dialogue between BP and its 'members'. (Dillistone et alii, 2011: 230) The company did not respond
immediately to the public concern by using the social networks. Indeed, the first exchange on the web
occurred on April 27. The corporation began using them after having realized that the spill had already
affected their image. In order to create an image of transparency the corporation opted for an update
taking place through social media, to inform people of BP's efforts in cleaning-up the gulf. Providing
immediate information helps to reduce uncertainties, anger and fear. Nevertheless and despite all these
efforts BP's corporate image is still tremendously damaged. BP has taken responsibility for the spill,
has compensated affected individual and businesses and continues to pay for the clean-up efforts. The
effectiveness of the three major techniques used by BP (corrective action, compensation and mortifica-
tion) cannot yet be considered to have worked effectively. (Dillistone et alii, 2011: 231) However, BP
has regained momentum in the Gulf since the spill, as we shall see in the fourth and last chapter of this
thesis. Before dealing with the 'after BP', let us first of all, in the third chapter, identify and discuss the
impacts that have been generated by the blowout and how it affected the Gulf Coast region.
Page 47 from 101

3 Consequences of the Rig Explosion in the Gulf of Mexico
Source: (National Commission, 2011: 198)
The chronic crises generated by the explosion of the BP oil rig and the spill that followed will be dis-
cussed in this chapter. These impacts will require not months but decades of national effort to address
and repair (National Commission, 2011:173-174). The consequences resulting from the DWH blowout
are multiple and involves all life aspects related to the GoM, such as business, fisheries (3.3), environ-
ment (3.2), and health (3.1). Some of them, like environmental and human health damages might take
decades to unveil (Tao et alii, 2011). As far as ecological and human impacts are concerned, they may
differ from other blowouts or oil slick because of the depth of the blowout, the large volume of oiled
that has gushed into the Gulf, the size of the region impacted by the pollution (see figure 17), and the
unprecedented quantity of dispersant used next to the well and on the surface. (Doke et alii, 2011:
1062)
3.1 Human and Social Impacts
The spill of the GoM lasted 5 months and released approximately 5 million barrels 67 of oil into the
67 5 million barrels represent 79,4936,500 liters.
Page 48 from 101
Figure 17 : Repartition of the Oil Pollution in the GoM

GoM, soiling more than 600 miles68 of shoreline in Florida, Alabama, Louisiana and Texas, and im-
pacting a considerable amount of individuals. Indeed, residents and tourists have been affected by
wandering on the beaches or by breathing the smoke produced by the mitigation burning technique.
Moreover, a lot of volunteers and official responders have joined the clean-up teams in order to protect
their regions, and have consequently been exposed to oil and dispersant. The consequences on the
long-term of such an exposition are not yet well-known, but are already a real concern. On top of that,
the spill has destabilized the region's fishing industry by threatening seafood safety. Resulting from
these observations, major questions concerning potential impacts on human health (physical and psy-
chological) have been raised. (Grattan et alii, 2011: 838).
Concerns regarding health and safety persisted even after the well was sealed (July 15). Furthermore,
as we shall see, besides physical impacts, the local populations have also been psychologically af-
fected by the spill. In the following sections, we shall pay attention to three main problems that have
appeared in the wake of the blowout: health concerns (3.1.1), seafood safety (3.1.2) and psychological
troubles (3.1.3).
3.1.1 Health
The residents, tourists and volunteers ' health state will be discussed in this section. We shall first of all
pay attention to the pollution risk to which responders were exposed (3.1.1.1), secondly the exposition
of residents and tourists to dangerous substances through tar balls will also be considered (3.1.1.2),
and finally, we shall deal with the issue of oily debris (3.1.1.3).
3.1.1.1 Cleaning-up Teams and Residents
As previously mentioned a lot of volunteers have participated to the cleaning-up of the beaches and
other areas, such as marshes impacted by the oil slick. Health risks are already high for professionals
but tend to be higher for the many non-professional emergency responders. The latter do not have the
training and equipment of professional responders. Following the explosion of the BP platform in the
GoM, a relative high amount of acute health problems have been reported. More than 40 100 emer-
gency responders have been active in the zone reached by the oil slick. Health concerns are due to the
oil itself but also to its constituents such as benzene, toluene, ethylbenzene and xylene, gases and sub-
stances produced by intentional oil burning. Furthermore, the use of dispersant is a major concern rais-
ing consequential health questions. The particularity of the BP disaster is its unprecedented scale and
length. Both responders and the public will probably suffer from short- and long term health effects.
But it is very difficult for the NIOSH to evaluate the amount of symptoms such as dizziness, fainting,
68 600 miles represent 965.61 kilometers.
Page 49 from 101

and headaches that might have resulted from too long an exposition. Furthermore health effects have
not been limited to people in contact with oil or living next to soiled beaches. Indeed, residents living
as far as 50 miles69 inland have reported strong odors, others have had to double their asthma medica-
tion, and some people could hardly breathe. (Weinhold, 2010: A348- A350)
In order to learn more about the medical impacts of the BP pollution in the GoM on the emergency re -
sponders and clean-up workers, the National Institute of Environmental Health Sciences (NIEHS) has
launched the most complete study ever organized on the health consequences of an oil spill. The study
entitled the Gulf Long-Term Follow-Up (GuLF) has as objective to enroll 55,000 workers and volun-
teers who were involved in the BP oil spill response and will include 5000 controls. The NIEHS has
already obtained the fund allowing the study to be in function during five years, but the researchers
hope to make it last at least twenty years. This length is the minimum scientific period that will allow
the organization to assess links between oil spill response and rare cancers. The GuLF study distin-
guishes itself from previous health investigation by its size and prospective design which strongly con-
trast with the short-term analysis that have already been organized. The GuLF study will concentrate
on respiratory, neurological, and hematological outcomes that are due to oil constituents. Besides
health problem, the study will also investigate psychological outcomes relating to cleanup and living
in the gulf. (Schmidt, 2011)
3.1.1.2 Tar balls
Volunteers, professionals and near-inhabitants of the spilled beaches, as well as tourists have been ex-
posed to oil and dangerous bacteria through contact with tar balls that have appeared on the Gulf states
coasts, shortly after the beginning of the spill. The identification of higher levels in these balls of Vi-
brio Vulnificus, a human pathogen abundant on the Gulf coasts and causing severe wound infections
by contact with contaminated surface, is quite appalling and requires more investigation in order to in-
form and protect the local population and other citizens. The Vibrio are among marine gamma-proteo-
bacteria and include human pathogens. These are abundant in coastal system and are also crucial in the
carbon cycle. They are really effective at degrading different carbon sources including some polycyc-
lic aromatic hydrocarbons constitutive of crude oil. (Arias et alii, 2011)
The Vibrio Vulnificus is a concern for public health authorities in coastal areas of the southern US be-
cause it is the prime cause of seafood-borne fatalities nationwide. Ingestion of contaminated seafood
can lead to septicemia, while exposure to contaminated seawater, fish, shellfish, or fishing gear cab
cause severe wound infections. Between 20% and 30% of people infected will succumb. The major
problem is that since the oil slick many inhabitants of the Gulf coast have encountered tar balls by
69 50 miles represent 80,4672 km.
Page 50 from 101

stepping on them or inspecting them on the beaches. Very few information is available concerning oil
pollution as source of bacterial contamination. It is furthermore very probable that the bacteria has be-
nefited from byproducts of the microbes that degrade weathered oil. The pathogen counted in the tar
ball is really significant while the quantity in seawater and sand are similar to the sample previous to
the oil slick. During the warmer months, tar balls are especially sticky and difficult to get rid of. It is
particularly dangerous for vulnerable people that should avoid any contact with them. (Arias et alii,
2011)
Another risk of contamination for residents of the Gulf is related to oily debris and their storage, that
we shall discuss in the next section.
3.1.1.3 Oily Debris
After the well was capped and most of the oil removed or disappeared (invisible), the different types
of material used during the mitigation period, such as booms or the typical spill-responder uniform of
rubber gloves and protective coverall, had to be stored somewhere in order to be destroyed or buried.
The plan of BP was to send the thousands of tons of oily debris to ordinary municipal landfills. This
was allowed because oil exploration and production debris are classified as non-hazardous by law.
This signifies that they do not require specialized disposal. Nevertheless, on June 29, 2010, a directive
was issued by the CG and EPA requiring BP to test its waste for hazardous elements, to publicize the
results, and to consult with the communities where oily debris were to be stored. Additionally, EPA
would conduct its own testing and would post the results online. (National Commission, 2011:170)
Besides exposition of people to polluted and toxic substances the risk of contamination through the
food chain by ingestion of contaminated fishes or crustaceans is also very present.
3.1.2 Seafood
Seafood contamination in the Gulf has been, since the spill, a major concern for government agencies,
fishing business and consumers. The Institutes of Medicine and the Oil Spill National Commission re-
commend continued analysis of the seafood in the GoM in order to determine potential long-term
health impacts and restore the confidence of consumers in the fisheries. Seafood contamination is de-
pendent on a variety of factors such as the type and quality of the oil, the proximity of the spill to fish-
ing grounds, the temperature and weather conditions, as well as species and ecosystemic parameters.
PAHs (organic pollutants, responsible for cancers) originating from oil, tend to accumulate in fishes
and shellfish. In important quantities, they can be considered unsafe. Furthermore, metals concentra -
tion in seafood is also problematic. Indeed, metals are normal constituents of crude oil and drilling flu-
Page 51 from 101

ids injected in the wells. Metallic bioaccumaltion on the long term is a real concern for the competent
authorities. Accumulation of different metals (Zn, Mn, Cr, Se, Cu, V, Ni, Sb, V, As, Hg, Cd, Sn..) have
already been detected in sediments and marine organisms harvested from oil spill zones. The dispers -
ant (mix of solvents and sulfactants) used to break up oil into droplets, also raises major questions. In -
deed, if dispersant may benefit wildlife during a surface oil spill, little is known about their long-tern
effect in deep water. (Doke et alii, 2011: 1062-1068)
Peter Roopmarine, curator of geology at the California Academy of sciences has launched since the
spill a study concerning crude oil's impact on organisms in the Gulf. The challenge is to identify which
substance and contaminants found in the mollusk are directly due to the DWH oil spill. The research-
ers concentrate on several organisms, such as the Eastern oyster, the clam, the marsh mussel and the
marsh periwinkle. Roopmarine and his colleagues seek to determine if any components from the crude
oil are incorporated into the shells and tissues of several organisms. Thanks to that, we could have an
idea of how these substances might be distributed throughout the food web. Preliminary results turn
out to indicate a significantly higher concentration of vanadium, lead and chromium in the shells of
the oysters collected after the oil slick whereas the tissue contained higher levels of vanadium, lead
and cobalt. Hydrocarbon trace in tissue are also scrutinized. It is generally known that heavy metals
are not harmful to oysters, but they endanger the life and health of other animals throughout the food
web, including human beings. (Baker, 2012)
The various health concerns as well as environmental damages (3.2) and economic impacts (3.3) have
generated a lot of stress and anxiety within the Gulf population, as we shall see in the next section.
3.1.3 Psychological Impact
A survey has been led by the university of Florida to assess the acute environmental and health im-
pacts (especially psychological effects) of the spill among the fishing communities living on the Flor-
ida and Alabama coasts. The investigators worked with community agencies and leaders from two
Gulf Coast fishing communities. The inhabitants of the Gulf Coast have become acquainted with
daily media reports about the spill and have for some been involved in cleaning-up efforts or prevent-
ing oil from reaching the coast. Fear concerning the quality of seafood caused a drastic reduction of
seafood harvesting and a lack of products. The psychological sequels resulting from indirect exposure
to oil spills and other environmental catastrophes are already well-known but the very impact of the
BP blowout in the gulf has hardly been studied from a psychological point of view. This survey has fo-
cused on two types of people:
(1) a group whose members were directly exposed to the pollution and lived in a community
whose shoreline had been reached by the oil spill, and
Page 52 from 101

(2) a group of inhabitants indirectly exposed to oil, living in a community where oil did not
reach the coastline, but who were impacted through economies, fishing recreation and tourism.
The exposed group was mainly composed of professional male fishermen while the indirect exposed
group was constituted of retired professionals who were active in tourism industry. (Grattan et alii,
2011: 839-842)
From this study were drawn several general observations concerning the psychological impact of the
BP blowout in the GoM. Inhabitants with direct impacts had higher level of anxiety and depression,
similar to people living in communities whose shores had been soiled. People suffering from income
losses resulting from the spill also reported more tensions and anxiety. Mechanisms of adjustment
(coping with tragedy and resilience capacity) were lacking for people suffering from income loss. In-
come decline is thus assimilated to a reduced resilience and leads more straightforwardly to depres-
sion. Participants to the study considered television and newspaper to be the most reliable source of
human information during the event. Broken people tended to believe also local fishermen (directly
impacted) and the department of health. This study highlights the importance of also targeting popula-
tion not living in the direct spill areas. People risking income loss are a particularly vulnerable section
of the population. (Grattan et alii, 2011: 842)
Unfortunately, OPA 1990 and related policies do not provide efficient tools and means for addressing
mental and physical effects resulting from a spill (National Commission, 2011:191 ). The Gulf Coast
Compensation Fund has announced that damages for mental illness caused by the spill would not be
paid. According to the organism, financial support has been awarded to other competent organisms to
deal with this issue. Indeed, the health departments of affected Gulf coast states (excluding Texas)
have already received $42 million for mental health from BP. Similarly the Substance Abuse and Men-
tal Health Administration has also benefited from $10 million from the oil company. (National Com-
mission, 2011:194)
Besides providing fisheries and recreational activities for residents and tourists, the GoM is also a very
rich ecosystem that has been severely impacted by the spill (3.2). A damaged ecosystem especially in
the Gulf means severe consequences for tourism and fishing industries, as will become clear later
(3.3).
3.2 Environmental Impact
The DWH oil spill has also had significant negative effects on the Gulf ecosystems. Indeed, some sig -
nificant recreational and wildlife areas were lying within the spill trajectory. These areas included the
Gulf Islands National Seashore (Alabama, Florida and Mississippi), the Padre Islands National Sea-
Page 53 from 101

shore (Texas) and the Jean Lafitte National Historical Park (Louisiana) (Narayan, 2010: 58). Further-
more, kilometers of beaches and various aquatic ecosystems have been polluted by the spill (National
Commission, 2011: 174). On top of that Louisiana’s fragile delta habitats have been heavily affected.
(National Commission, 2011: 178).
The GoM is characterized by an exceptional marine biodiversity with 15,419 recorded species among
which 10% are endemic. The lushness of fauna and flora is mainly due to the geographical localization
of the GoM, within a transition area benefiting from temperate and tropical waters. (Campagna et alii,
2011: 394-395) Contrary to oil spills usually witnessed and appearing on the surface, the DWH spill
spewed from the depths of the ocean (between 3,30070–13,000 feet71 deep) and affected a multitudes of
organisms living in the depth, swimming next to the surface or flying and wandering along the coasts.
(National Commission, 2011:174) In this section, we shall try to identify the various ecological dam-
ages that have been caused not only by the oil slick but also by the mitigation measures that have been
used to reduce the impacts of the tragedy
3.2.1 The Gulf of Mexico : a Complex Ecosystem 72
The GoM is inhabited by a multitudes of species (fauna and flora) living in various ecosystems. Con-
trary to what most people think, the cold, constantly dark areas of the GoM characterized by high pres-
sure are inhabited by an abundant and diverse marine life, with organisms such as cold-water corals,
fish, worms, bacteria, mussels, and tubeworms. (National Commission, 2011:174) Higher, where light
and temperature gradually increase, different species are observable: sharks, hundreds of fish species,
shrimp, jellyfish, sea turtles, sperm whales and dolphins. Just beneath the surface, there is a multitude
of plankton, fish larvae, floating seaweed beds (sargassum), and schools of fish drifting with surface
currents and winds. The seaweed beds covering the surface are habitats, lure sea turtles, tuna, dol -
phins, and numerous game fish and represent the basic food for snails, shrimp, crabs, and juvenile spe-
cies seeking shelter in this environment. (National Commission, 2011:175) Above the water a multi-
tudes of seabirds (migratory or sedentary) feeding in the ocean and coastal estuaries are also present.
(Ribic et alii, 1997: 1). The spill following the Macondo blowout impacted all these organisms as oil
spread from the bottom of the sea to the surface and then to the shoreline.
3.2.1.1 About the Impact of the Oil Slick on Fauna and Flora
When the oil gushing from the Macondo well spread under water or reached the surface, it came into
contact with this multitude of organisms, living in the marine and coastal environments, as well as
70 3 300 feet represent 1005.84 meters.71 13 000 feet represent 3962.4 meters72 See annex 5 for a scheme of the coastal and marine environment.
Page 54 from 101

those living into the salt marshes, mudflats, mangroves, and sandy beaches (see 3.2.1 and annex 5).
(National Commission, 2011:175) The interdependency between species is so developed that a signi-
ficant effect on any of them can affect others (Biello, 2010). During the spill, organisms were exposed
to oil through ingestion, filtration, inhalation, absorption, and fouling (Ober Holly K, 2010: 1-4). In-
deed, predators may ingest oiled organisms or mistaking oil particles for food whereas filter feeders
(ie. some fish, oysters, shrimp, krill, jellyfish, corals, sponges, and whale sharks) may consume oil
particles floating in the water (National Commission, 2011:176). Additionally, oil droplet functions as
flypaper for numerous small creatures, causing entrapment and death. Some bigger organisms can in-
hale or ingest the oil that sticks on their membranes as they swim through the emulsion. The propor-
tion and concentration of oil to which they are exposed will affect or killed them. (Jernelöv, 2010: 356)
Surface-breathing mammals and reptiles were also deeply affected by the spill, because of the possible
inhalation of oily water or fumes. Furthermore oiled animals can be prevented from walking, flying,
swimming, and eating. Regarding plants, oil can impede transpiration and photosynthesis, and smother
coastal sediments in which they anchor, as well as organisms living below. ((National Commission,
2011:176)
Oil has also impacted animals floating and living above the surface, such as seabirds. These are very
sensible to oil because it reduces the natural insulation of their feathers and leads to hypothermia (Jer-
nelöv, 2010: 356). Through November 1, 2010, 8,183 birds, 1,144 sea turtles, and 109 marine mam-
mals affected by the spill (alive or dead) were collected by wildlife responders (“Deepwater Horizon
Response Consolidated Fish and Wildlife Collection Report, 2010) but these figures are only the tip of
the iceberg, many more specimens were not intercepted because of the scavenging, sinking, decom-
position, and the reduced size of the search area (Hampton, 2012). On top of that, one hundred mam-
mals, among which a majority of bottlenose dolphins, (NOAA, 2011), and more than 600 sea turtles
(National Commission, 2011:181) were found dead.
Another major problem linked to the spill is the the massive development of green algae, months or
years after the spill. The oil having poisoned snails and other algae grazers, the green algae have
grown up and developped without any predator. Still more problematic is that when the former organ-
isms want to re-settle, they find it difficult because the algae now occupy the place. A long time is con -
sequently needed for the original balance to re-establish. (Jernelöv, 2010: 356)
3.2.1.2 Protection Concerns
A major issue raised by the DWH oil spill concerns the list of species that benefits from a protection or
restoration program. Indeed, 14 marine species are protected in the GoM by the US ESA, the MMPA,
and the Migratory Bird Treaty Act (MBTA). Besides, 40 other marine species living in the gulf area,
Page 55 from 101
not mentioned in any American federal law, are listed as threatened on the International Union for
Conservation of Nature73 (IUCN) Red List. (Campagna et alii, 2011: 393 )
The oil spill of 2010 has modified the threat status of some of these species. In the US, restoration is
supervised by the Natural Resource Damage Assessment (NRDA), department of the NOAA. NRDA
(under OPA) is the primary legal authority capable of assessing damages and providing for recovery of
coastal and marine species. The NRDA is also the organ determining the injury to public trust re-
sources and the methods of restoration that will be applied. (Campagna et alii, 2011: 393) The IUCN
has listed 322 species in the Gulf (53 are in the threatened categories and 29 are considered as 'near
threatened'). Threatened species include species such as the bluefin tuna, seagrasses, the whale shark,
the Kemp’s Ridley sea turtle74, and the West Indian manatee (see annex 6 for more information). Prior-
ity must be given to species with high commercial value, species critical to the integrity of coastal and
marine ecosystems, species of population in decline before the disaster and species now in greater
danger of extinction. (Campagna et alii, 2011: 394-395) The real number of endangered species is un-
derestimated by the ESA, for this reason the NRDA now active in the GoM should include data made
available by the IUCN regrouping a more extensive and complete list of endangered species living in
the gulf waters (the whole year or on a seasonal basis). As appears from the list of the IUCN (see an-
nex 6), a large amount of species that deserves protection are not even included by the federal organiz-
ations. The non -listed species should nevertheless be part of the damage, monitoring and restoration
assessments and actions. (Campagna et alii, 2011: 396)
3.2.1.3 Plumes
In addition to these visible threats, researchers have found out that huge clouds of nearly invisible
droplets are hovering deep below the surface. These clouds located more than 1,5 km under the water
surface could substantially increase estimates of the total amount of oil that has been spilled in the wa-
ters of the Gulf. Moreover these hydrocarbon clouds could poison deep-welling critters that form the
base of the marine food web. The question concerns how this oil will end up since the major part of it
is still lurking under water and has not floated to the surface where it could progressively disappear.
According to some scientists, if the droplets are very small or that water is cold, they could mix, form-
ing a mixture that could naturally be buoyant and hover below the surface. It is not yet clear to what
extent the use of dispersant has aggravated this phenomenon. Fortunately, plumes and methane con-
centration diminished with distance from the Macondo well. Nevertheless, the oil clouds are probably
directly influenced by bottom currents, driven by different water densities, due to temperature and sa-
linity and by the varying seafloor topography. Contrary to big fishes and cetaceans that could fly the 73 The red-list assessment process is a scientific evaluation of species global status, providing mechanisms for trans-bound-
ary impact assessments and a forum of coordination of international conservation action. (Campagna et alii, 2011: 394)74 The Kemp’s ridley is a turtle whose only nesting beaches in the world are in the western GoM (National Commission,
2011: 181).
Page 56 from 101

contaminated regions, small and larval fish probably succumbed to the hydrocarbon clouds. Plankton
and other tiny plants and animals (base of marine food) floating with the current were and will still be
killed by the pollution. (Raloff, july 2010: 5)
A scientific debate surrounding the evolution of these clouds is still raging between the scientific con-
sidering that the plumes in the Gulf are stable and those convinced that hydrocarbon clouds are de-
grading quickly. The plumes located 1100 m below the surface could be 2 kilometers wide and 200
meters high and could travel at about 6,7 kilometers each day. If some molecule disappear rather
quickly other constituting the plumes are rather persistent, lasting years even decades. Depending on
the tools used to measure pollutants' concentration, plumes seem to be apparent or not but reason
seems to suggest that chemical substances and oil cannot disappear as quickly as some seem to be-
lieve. (Raloff, September 2010: 5) Some specialists advance that even if oil has disappeared the tox-
icity of dissolved oil would last much longer. Finding out regions were oxygen is abnormally low
could also indicate that the oil has been broken down. Even if oil has disappeared it has certainly
changed the fabric of the ecosystems: generations of fish could have been wiped out, marsh erosion
could accelerate and the microbial population of the Gulf could already be changing. (Gupta, 2010)
On top of that, disquieting observations have lately been made. Indeed, recent surveys report dead or
dying deepwater corals living on rock outcrops. These could have been killed by the deep plumes.
(National Commission, 2011: 182)
3.2.2 Wet Zones
Other vulnerable areas, that have been impacted by the oil spill and that are still suffering, are coastal
wetlands. These productive zones are really sensitive to oil contamination. Furthermore, traditional
mechanical cleanup practices are efficiently limited and can even involve more damages than the oil
itself. (Tao et alii, 2011) Salt marshes cover almost the entire coast of Lousiana (over 4500 km²) and
are a habitat dominated by smooth cord-grass, salt meadow cor grass and black needle-rush. The spe-
cific nature (salinity, anaeoroby) of the soil is viable for only a tiny number of plants. The marshes
serves as buffers against strong winds and tidal waves on the coast. Moreover, salt marshes are the
shelter and the nursery of species like shrimps, crabs, fishes and birds having a commercial value. For
this reason, the region is also among the most vulnerable coastal environment from a social, and eco-
nomic perspective. (Cho et alii, 2011: 176-177) To some extent, marsh grasses tolerate surface coating
by weathered oil fairly well75 (National Commission, 2011: 177). Indeed, we should not forget that the
coastal salt marsh sediments are used to a certain petroleum exposure, since there exist more than
1000 natural oil seepage sites (see section 1.2.4) reported in the Gulf (Tao et alii, 2011). Nevertheless,
salt marshes will not survive if oil penetrates the saturated sediments and is absorbed by the root sys -
75 For more information on the tolerance of some ecosystems to petroleum, please consult the work of Howard T. Odum.
Page 57 from 101

tem. When the plants’ root systems degrade, the marsh erodes, consequently threatening the habitat on
which a wide variety of animals depend. (National Commission, 2011: 177) Furthermore, besides the
coating of the plant and soil surface provoking temperature stress, oil reduces the plants' capacity to
photosynthesize, and the ability of salt marsh vegetation to tolerate salinity because the stomata tran-
spiration pathways are blocked. (Cho et alii, 2011: 176-177)
On top of that, the mitigation means deployed to protect the various ecosystems are susceptible to
damage the marsh. As previously mentioned, summer storms pushed booms deep into the marshes,
and these could only be removed by intrusive methods, causing additional harm to the marshland (Na-
tional Commission, 2011: 177). Indeed, post-spill damages were also due to cleaning-up activities
such as skimming, oil collection, burning, flushing use of dispersant, and plant cutting. The first quant-
itative assessment focusing on the ecological impact of the spill in the salt marsh habitats was carried
out more than one year after the blowout. The researchers have reported major transformations. Com-
bining data coming from satellite and ground analysis, the objective was to quantify the impact of the
oil and dispersant on the salt marshes as far as photosynthetic capacity and physiological status are
concerned. The two main variables that were monitored are the distribution of canopy chlorophyl con-
tent and the above ground green biomass during the growing season (May October) of 2009 (pre-spill)
and of 2010 (post-spill). The result of such a survey allow to delineate the critical hotspots of marsh
stress in order to prioritize the areas needing immediate restoration.(Cho et alii, 2011: 176-177) The
data confirmed considerable loss of productivity in salt marsh habitat during the 2010 growing season
(Cho et alii, 2011: 181-182). The lingering residual oil will involve long-term impacts on the health
and productivity of the Gulf Coast salt marsh. Recently, BP has committed $1 billion to contribute to
the environmental restoration (see further in chapter 4) (Cho et alii, 2011:184)
3.2.3 Environmental Impacts on Distant Ecosystems: the Case of Mi-gratory Shorebirds
Hundred of isles of the US northern GoM coastline were affected by the 2010 DWH oil spill. These
areas represent crucial habitat for migratory shorebirds. During the 2010-2011 non-breeding season,
more than one million migratory shorebirds were exposed to the oil spill. More than 650 miles 76of the
northern GoM coastline constituted of beaches, mudflats and wetlands were soiled by a mixture of
crude oil and chemical dispersant. The risk of oil contamination are very high for shorebirds because
they rely on subsurface probe-foraging behavior and on intertidal habitats to survive. The northern
GoM are important habitats for 34 species of shorebirds among which 6 species are considered resid-
ent and 28 are migratory species. The breeding location of the nonresident species extends on a very
large territory, going from the temperate prairie and wetlands of North America to high Arctic. During
76 650 miles represent 1046.07 kilometers.
Page 58 from 101

the non-breeding season, the American GoM hosts more than 5 % of the total north American avian
population, welcoming 12 of the 28 American migratory species. Shorebirds can be affected by oil in a
variety of ways: oil exposure is not necessarily fatal and repeated exposure within and between sea-
sons may cause sub-lethal effects potentially leading to population decline, resulting from diminished
health and reproductive fitness. (Henkel et alii, 2012: 676-678)
Through migration the effects of the spill may be transported to ecosystems far removed from the im-
mediate contaminated area (Henkel et alii, 2012: 679-680). Shorebirds affected by oil can suffer from
reduced fraying success and be weakened (weight loss and diminished health) by the lesser quality of
their environment (lesser food abundance). These factors are delaying the birds' departure, reducing
the number of individuals that will survive during the migratory journey. Furthermore, oil contamin-
ants such as PHA's (carcinogenic) can remain in the environment for decades and be incorporated into
the food chain. This could be problematic for avian predators such as peregrine falcons and merlins
not directly in contact with the spill but consuming contaminated preys. (Henkel et alii, 2012: 681-
682)
The situation of waterfowls in upland prairies and the disturbance of the food chain in the Arctic re-
gions are two eloquent examples illustrating the potential impact of contaminated shorebirds in far re-
moved breeding areas. Several species of shorebirds concerned by the DWH oil spill breed in the
mixed-grass prairie habitat of North America. Prairie food webs are very complex, so that a potential
decline in shorebird abundance could have considerable impact on the prairie ecosystems. Both shore-
bird and waterfowl nests are important resources for predators in the prairie. Consequently, it is quite
probable that a decline in shorebirds abundance increases the predation pressure on waterfowls, threat-
ening their very survival. Similar phenomena are observable in Arctic and subarctic regions. Accord-
ing to estimations, 30 million shorebirds breed in the high Arctic and another 7 million breed in the
Taiga (boreal forest of North America). The annual abundance of shorebirds into these ecosystems rep-
resents a crucial food source for predators such as the snowy owl or the Arctic fox (eggs). Just like in
the prairie ecosystem, any significant decrease in shorebirds productivity could severally impact local
predators. These regions are even more vulnerable given the low diversity of Arctic terrestrial verteb-
rate communities, that would hardly succeed in adapting themselves. These two examples give the
reader the opportunity to seize the potential negative impacts generated by the DWH blowout and fol-
lowing spill in the GoM on distant ecosystems. (Henkel et alii, 2012: 683)
Besides the negative impacts discussed above, the BP DWH oil blowout will probably have a positive
impact as far as ecosystem damage valuation is concerned. This interesting and very active scientific
field is going to be discussed in the following section.
Page 59 from 101

3.2.4 Ecosystem Damage Evaluation: a Positive Outcome of the Dis-aster?
According to some economists and ecologists the DWH oil spill will most probably sharpen the tools
of ecosystem damage valuation. The techniques used in order to estimate and calculate direct losses to
fishers, boaters, tourists sunbathers or scuba divers and the business in which there are incorporated
are complex. But applying this technique to tally ecosystem damage, not directly impacting what hu-
man buy, consume or earn, make it still more difficult to evaluate. Indeed, how can we evaluate the
worth of a brown pelican, sea turtle or marsh section? Or what is the value of the resilience of the gulf
ecosystem? The challenge is to valuate nature and the costs of restoration that will be needed to recre -
ate the ecosystems that have been lost in the tragedy. (Nash, 2011: 259)
To realize an accurate quantification of damages, well-established baseline conditions are necessary.
However, scientists lack of sufficient information regarding the pre-spill state. It is particularly import -
ant in the GoM, where many coastal habitats have been progressively degraded over decades. (Nation-
al Commission, 2011: 184). Evaluating ecosystems is a long-term enterprise and the fund needed to do
so will appear as the researches progress. According to some, it will never be possible to provide an
accurate natural resource damage assessment, it is for this reason very difficult to evaluate the some of
money BP should give in total to restore ecosystems. Consequently, the best the government can do is
to negotiate for a sum that is large enough to cover all possibilities (Goldenberg, 2012: 1-2). Accord-
ing to temporary estimations, 1500 kilometers of coastal salt marshes, beaches, mud flats, and man-
groves would still be oiled. The efforts that have been made to mitigate and limit the extent of the pol -
lution represent stressing factors for the Gulf ecosystem. Furthermore, some effects may not be appar -
ent for several years. (Nash, 2011: 260)
The valuation process in the GoM can be addressed through the OPA that explicitly describes the pro-
cess for assessing the damages caused by an oil spill and then the sum of money needed to address
those damages. Under the Act “natural resource trustees,” are designated to be responsible for assess-
ing the “natural resources damages” of the spill. (National Commission, 2011: 183) Unfortunately, cer-
tain zones are beyond any restoring, for this reason, the NOAA uses a 'device' allowed by the OPA:
substitution. A marsh somewhere else could be considered as of equivalent value and could be protec-
ted in order to compensate the loss of another marsh area. (Nash, 2011: 260 )
Identifying the services rendered to human beings by ecosystems is quite challenging. However, it is
undeniable that marshes and mangroves provide storm surge protection, water filtration, or fish nurs-
ery habitat. Moreover it offers oyster habitat and allows carbon sequestration in plants. These different
factors can be monetized and evaluated in terms of jobs or other impacts on humans. This method of
giving a monetary value to ecosystem services is called 'Ecosystem Service Economics'. A recent re-
Page 60 from 101
port has evaluated that the Mississippi River Delta ecosystem provides at east $12 billion to $47 bil-
lion of benefits per year to humans and have an asset value of about $1,3 trillion. This is a way of bol-
stering environmental protection on the basis of economic self interest and to integrate scientific
knowledge into policy. Some detractors of this approach advocate that considering ecosystem services
as the foundation of our conservation strategies would imply that nature is only worth conserving
when it can be made profitable to humans. (Nash, 2011: 260-261 ) Proponents of legal rights for
nature argue that their approach offers ecosystems far higher level of protection and a stronger founda-
tion for sustainability. Besides, a group of international plaintiffs has brought a suit against BP in the
constitutional court of Ecuador on the basis of the survival rights granted to ecosystems in that country
's 2008 Constitution. Unlike the Latin American country, US law and the NRDA consider the Gulf's
ecosystem as property owned by the citizenry. Every damage occasioned to the ecosystem is in this
way a violation of the property rights of the American citizens as a whole. Under US law, corporations
as BP enjoy constitutional rights, whereas natural systems do not. (Nash, 2011: 263)
The various environmental degradations have of course strongly impacted local population through
economic instability and financial losses. As mentioned in the previous section, ecosystems provide
services allowing the GoM inhabitants to be safe, happy and run businesses. Consequently the disap-
pearance of these services or their qualitative alteration is negative for the communities relying on
them. The following section will investigate the kaleidoscopic consequences of the spill on local busi-
ness and on the US as a whole. One eloquent example of the crisis, namely the Gulf Coast Shrimp
supply chain, will also be discussed.
3.3 Economic Impacts
Besides being an ecological and social disaster, the BP blowout and subsequent spill have also already
proved to be a regional economic tragedy. (Birkland and DeYoung, 2011: 471). In this section we shall
describe the importance of the Gulf region from an economic point of view and discuss how the vari-
ous economic sectors have been impacted by the spill. The Gulf coast’s economy depends heavily on
commercial fisheries, tourism, and energy production (National Commission, 2011: 185). Indeed,
tourism and fishing generate more than $40 billion of economic activity annually in the five Gulf
States (see figure 18) (National Commission, 2011: 187). These sectors are furthermore particularly
sensitive to both direct ecosystem harm, and public perceptions and fears of contaminated seafood and
soiled beaches (National Commission, 2011: 185).
Page 61 from 101

Source: (National Commission, 2011: 186)
3.3.1 Tourism
The Gulf Coast region with its marshes, mangroves, swamp forests, and beaches is one of the favorite
recreational and touristic location in America (Brent et alii, 2008: 12). The region generates roughly
$19.7 billion of tourism activity annually (National Commission, 2011: 191), and employ 620,000
workers (see figures 19 and 20) (Brent et alii, 2008: 2). The State of Florida represent more than 50 %
of the total (National Commission, 2011: 191). The Recreational fishery sector is also very productive
in the GoM. In 2010, marine recreational participants took more than 20.7 million trips catching 145.4
million fish from the GoM and surrounding waters (representing over 59.3 million pounds) (U. S. En-
vironmental Protection Agency,“General Facts about the Gulf of Mexico”, 2011).
Source: . (NOAA. (Lead Author, 2012) Source: (NOAA. (Lead Author, 2012)
The Gulf tourism was severely impacted by the spill. Indeed, public perception that beaches were
oiled led to declines in hotel bookings, restaurant seatings, and a wide array of coastal activities, gen-
Page 62 from 101
Figure 18 : Annual Tourism and Fishing Revenue: Economic Activity by County
Figure 19: % of County Employment -Tourism and Recre-ation in the Gulf Coast Region
Figure 20: Employment Generated by Tourism and Recre-ation in the Gulf Coast Region

erating a considerable amount of professional activities (National Commission, 2011: 185).
3.3.2 Fishing and Maritime Industry
The fishing industry is also crucial for the economy of the Gulf Coast, the seafood sector produces in
the GoM more than one-third of the nation’s domestic seafood supply (Baltimore and Simao, 2010).
Indeed, gulf fishermen catch 73 % of the nation’s shrimps (half from Louisiana waters). Louisiana ac-
counts for 67 % of the nation’s oyster production and 26 % of the blue crab production. (National
Commission, 2011: 187) According to the NMFS, the commercial fish and shellfish harvested from
the five US Gulf states in 2010 represented approximately $639 million (U. S. Environmental Protec-
tion Agency,“General Facts about the Gulf of Mexico”, 2011).
Much of the fishing and processing industry were suspended by Federal and state closures of commer-
cial fisheries. Public concern raised nationwide regarding seafood safety. (National Commission,
2011:185) When the US government reopened fisheries areas in the federal waters to fishing and
claimed that all seafood caught in the newly opened areas was safe to eat, it did not prove to be partic -
ularly efficient and the commercial fishing industry keeps on suffering from an acute image problem.
(Noussia, s.d.: 175) Continued testing, improvements, and a coordinated marketing campaign are ne-
cessary to improve the image of the GoM seafood. To reduce the adverse impact resulting from the
spill, in November 2010, BP accepted to give Louisiana $48 million and Florida $20 million for sea-
food testing and marketing. The oil company was recently considering a similar request from
Alabama. (National Commission, 2011:188)
Due to its strategical location and the richness of its fisheries, the Gulf also harbors four of the top sev -
en fishing ports in the nation by weight, and eight of the top twenty fishing ports in the nation by dol-
lar value (US Environmental Protection Agency,“General Facts about the Gulf of Mexico”, 2011). On
top of that, the Port of South Louisiana (New Orleans) and the Port of Houston are two of the ten
busiest ports in the world by cargo volume (US Environmental Protection Agency,“General Facts
about the Gulf of Mexico”, 2011). Consequently when the region is suffering, this is the whole nation
that is affected. The following table (see figure 21) shows the various tonnage of the different import-
ant American ports and underlines the importance of the Gulf ports in the American economy. (Nation-
al Commission, 2011: 197)
Page 63 from 101

77 Source:(NOAA. (Lead Author, 2012)
3.3.3 The Energy Sector
Besides its fishing and recreational aspects, the region is also essential for the American oil supply. In-
deed, the Gulf region produces one-third of all domestic oil. (Institute Of Energy Research, s. d.: 2).
According to MMS, offshore operations in the Gulf produce 2% of the US domestic natural gas and
12,5% of its oil and would employ more than 55,000 US Workers (U. S. Environmental Protection
Agency,“General Facts about the Gulf of Mexico”, 2011). Consequently, the moratorium imposed on
deepwater drilling heavily affected the regional economy.
At President Obama’s urging, BP agreed to place in escrow a $20 billion fund78 to help address finan-
cial losses. As of November 23, 2010, more than $2 billion administered by the Gulf Coast Claims Fa-
cility have been distributed to roughly 127,000 claimants. (National Commission, 2011 185)
As far as BP is concerned and even despite the different strategies adopted (see 2.5.7: Communication
and Informational Aspect), the supermajor has lost in 2010 almost half of its market capitalization.
This situation was probably due to growing public anger toward BP and multiple risks of prosecution.
(Beloff, 2010: 331-332) Nevertheless, as we shall see further, on the long term, BP has not done a bad
job and most people have already forgotten the disaster, except maybe the people still directly im-
pacted and some scientists.
Furthermore, municipalities could also have to cope with decreased tax revenues directly or indirectly
related to business closures. Because of the spill short- and long-term uncertainties, residents as well
as business along the coast do not feel secure to invest or consume (Noussia, s.d.: 140).
77 A short ton is a unit of mass equal to exactly 2,000 pounds, or 907.18 kilograms (“Short Ton”, s.d.).78 BP has established a $20 billion trust for payment of a number of types of claims arising from the DWH incident and res-
ulting oil spill, and for costs related to the restoration of natural resources.
Page 64 from 101
Figure 21: Leading US Ports in 2006 by Tonnage

3.3.4 The Case of the Gulf Coast Shrimp Supply Chain
To illustrate how the spill has impacted sectoral businesses and especially small and medium ones,
along the coast, we are going to take a closer look at the Gulf Coast Shrimp supply chain which has
been disrupted by the gulf spill (Duhon et alii, 2011: 223-224).
Source: (Duhon et alii, 2011: 226)
The DWH BP oil spill in 2010 disrupted the supply of shrimps that were harvested in the GOM. The
perturbations continued even after the well was under control and capped. On November 24, 2010 the
NOAA announced the closure of approximately 4200 miles²79 of gulf waters to Royal red Shrimping,
as of January 9, 2011. (Duhon et alii, 2011: 223-224) The saltwater brown shrimp season constitutes a
crucial business time for the stakeholders of the gulf coast shrimp supply chain. All the actors of the
chain: shrimp fishermen of the oil spill impact zone, fresh shrimp processors, seafood wholesalers,
fresh shrimp retail markets and restaurants were directly impacted by the disruption (see figure 23 for
details of their respective roles in the chain). From an organizational point of view, many of the busi-
nesses in the shrimp supply chain are family businesses. Consequently these businesses are small and
have limited resources. It is still currently difficult to assess to what extent these small businesses can
endure, the BP oil spill of 2010. (Duhon et alii, 2011: 226-227)
79 4200 square miles represent 10877.95 km².
Page 65 from 101
Figure 22: Actors of Gulf Coast Shrimp Supply Chain

Figure 23 : Description of Relationships Between the Stakeholders of the Gulf Coast Supply Chain
Source: (Duhon et alii, 2011: 236)
Entity Shrimpers Processors Wholesalers Retail outlets Restaurants Local region consumers
Description Small family operators to corporate fleets
Fully dependent upon local shrimpers to provide them with shrimp to prepare and package for wholesale mar-kets
Dependent upon local markets, plus outside the region domestic and imported product
Dependent upon local markets, plus outside-the-region domestic and im-ported product. Driven to meet consumer demand.
Not as dependent upon local demand; local consumers not as choosy in restaur-ant setting; some substitution for other than- local product
Strongly faithful to Gulf Coast Shrimp, but in-creasingly open to impor-ted shrimp; concerns about seafood safety.
Supply Chain Connections
Sells directly to pro-cessors, wholesalers, re-tail outlets, restaurants, and to local region con-sumers.
Obtains shrimp dir-ectly from shrimpers
Obtains shrimp from shrimpers and from pro-cessors as well as others in the wholesale supply chain.
Obtains shrimp from shrimpers, from processors, from wholesalers.
Obtains shrimp from shrimpers, from pro-cessors, from whole-salers.
Obtains shrimp directly from the water when en-gaged in fishing, from shrimpers, from pro-cessors, from retail out-lets and from restaurants
Alternative busi-ness function when supply chain is inter-rupted
During BP oil spill, many shrimpers were engaged in spotting for oil, oil cleanup, or were out of business when fishing waters were closed
During BP oil spill, many were shut down
During BP oil spill, many struggled to find alternative sources of fresh gulf shrimp as well as acceptable substitute fresh gulf shrimp. Many shrimp were transferred into LA and MS from TX. Imported shrimp introduced as an alternative.
During BP oil spill, many bought fewer shrimp then were purchased in previ-ous years, substituted im-ported shrimp when local shrimp not available.
Today, the shrimp supply chain is still struggling with the aftereffects of the BP oil spill. Some stake -
holders have quit the industry. The 2010 oil spill has significantly deteriorated the supply side of the
gulf coast shrimp supply chain. All the stakeholders (known and unknown) rely for their survival on
their dexterity and flexibility (Duhon et alii, 2011: 232-233), except if they are able to obtain com-
pensation for their financial losses from BP. Image gap is now the major concern in the Gulf. Indeed,
even if all of the private and governmental entities assert the safety of gulf coast shrimps for harvest-
ing and consumption, consumers remain skeptical. (Duhon et alii, 2011:237-238)
Page 66 from 101

4 After the DeepWater Horizon Blowout
In this last chapter, we shall attempt to identify the improvements and changes brought about by the
DWH catastrophe in the GoM. In a first section, we shall shortly present the recommendations issued
by the National spill Commission (4.1) that the government has promised to take into account when
revising the regulatory system overseeing offshore oil exploitation. A second section will be devoted to
the new measures that have been taken and changes that have been operated at various levels (4.2).
The third section of this last chapter will furthermore discuss the impacts of the regulatory measures
on small-and medium-size businesses of the GoM energy sector (4.3). On top of that, we shall sketch
the current drilling situation in the Gulf characterized by an intensification of drilling activities (4.4).
The two last sections of this fourth chapter will be more prospective since they will focus on financial
compensations that one could expect from BP and other subcontractors (4.4), as well as on the prob-
able evolution of offshore drilling in the US (4.5).
The measures adopted during and after the spill were not to everybody' taste, the oil industry and the
vast majority of Republicans did not appreciate at all the moratorium and the tightening of safety
measures regarding offshore drilling. The Conservatives and Mitt Romney have tirelessly accused
President Obama of not acting in the interest of the nation, as far as energy is concerned. Representat-
ive Doc Hastings, chairman of the House Natural Resources Committee, criticized the Obama plan
and described it as “a giant step backward for American offshore energy production.” Republican
wrongly continue to believe that a country with only 2 % of the world’s oil reserves can become ener-
getically independent while Mr. Obama, like most democrats rightly considers drilling as one element
among others in the American energy policy. (The New York Times, 2012)
In the electoral context, the polemic is still raging. Republican are still criticizing the drilling moratori-
um that was imposed by the Obama Administration after the DWH spill. (Walsh, “Nearly Two Years
On, Did the BP Oil Spill Have to Happen to BP?”, 2012) Furthermore, Rep. Ed Markey, a Massachu-
setts Democrat, issued a statement in April 2012 underlining the Republican refusal to pass critical re-
forms to protect the workers, environment and economy of the Gulf. Similarly, Drew Hammill, a
spokesman for California Democrat and minority leader Nancy Pelosi, also blamed Republicans for
lack of action. (Zeller, 2011) The American energy policy and more specifically the fate of offshore
drilling seem to be the favorite topic of the Republicans during this election campaign. America's ad-
diction to oil is real but the necessity to be responsible and plan on the long-term regarding resources,
environment and social justice also need be taken into account.
Page 67 from 101

4.1 Recommendations for Future Oil Development
On May 22, 2010, President Barack Obama established the National Commission on the BP DWH Oil
Spill and Offshore Drilling. This independent organism's mission was to provide the American nation
with a detailed analysis on the BP blowout including its causes, management and consequences as
well as a series of recommendations in order to make offshore drilling safer. (National commission,
2011: vi) The recommendations issued by this commission have been made public in January 2011.
This series of recommendations should be taken into account when revising the offshore oil regulation
in the US. Here below are the main themes targeted by the recommendations:80
✗ “improving the Safety of Offshore Operations”,
✗ “safeguarding the Environment”,
✗ “strengthening Oil Spill Response, Planning, and Capacity”,
✗ “advancing Well-Containment Capabilities”,
✗ “overcoming the Impacts of the DWH Spill and Restoring the Gulf”,
✗ “ensuring Financial Responsibility”, and
✗ “promoting Congressional Engagement to Ensure Responsible Offshore Drilling”. (National Com-
mission, 2011: 250 288)
The above recommendations (more detailed in annex 7) were not always welcomed by the oil industry
as was mentioned in the introductory section of this chapter. Consequently, the sector issued several
critiques. Indeed, they argue that companies with good safety records should not follow costly new
rules and warned that a major new set of regulations would slow production and drive up prices.
(Vick, 2012)
Last April, two years after the spill, a report has been released by Oceana81 in order to grade the im-
provement or failure of the US government and the oil and gas industry as far as these recommenda-
tions are concerned. In this report, the government and industry received “F” grades in most of the cat-
egories, but in three instances the government earned “D” grades (see figure 24). (Rprokop, 2012)
This underlines the lack of proactive attitude of the federal actors in implementing the various prom-
ises made after the spill.
80 For further information, please see annex 7 or the Final report of the National Commission at <http://www.oilspillcommission.gov/sites/default/files/documents/DEEPWATER_ReporttothePresident_FINAL.pdf >)
81 Oceana is international organization that was founded in 2001. It is the largest entity focusing on ocean conservation. (Oceana, s. d.)
Page 68 from 101

Figure 24 : Categories of Recommendations - Grades
Source: (Oceana, 2012)
Improving the safety of offshore operations: government’s role D
Improving the safety of offshore operations: industry’s role F
Safeguarding the environment D
Strengthening oil spill response, planning and capacity F
Advancing well-containment capabilities F
Overcoming the impacts of the Deepwater Horizon spill and restoring the Gulf D
Ensuring financial responsibility F
Promoting Congressional engagement to ensure responsible offshore drilling F
Moving to frontier regions F
On top of that, a group of former members of that National Commission, now calling itself Oil Spill
Commission Action, assessed the government's implementation of those suggestions. According to this
group; the Administration and industry have made significant progresses but this is not the case of the
Congress. Republican members have even introduced a variety of bills aiming at speeding offshore
drilling and loosening regulations. (Zeller, 2011)
In spite of these negative observations made by Oceana and the Oil Spill Commission Action, several
changes have taken place within the government (4.2.1), the industry (4.2.2) and the American legisla-
tion (4.2.3) since the spill, as will be exemplified in the following sections. Unfortunately, the current
political climate characterized by the coming federal elections in November 2012 are no favorable
time to pass new rules. The beginning of the new legislature will be crucial to either strengthen the
regulations and further compensate people, or to loose them and favor the oil industry. The outcome of
these recommendations will depend on the orientations and attitude of the new president and its ad-
ministration. Indeed, Republicans and Democrats do not approach the issue of offshore drilling and oil
production from the same angle.
4.2 New Measures and Changes
Two years after the spill, the impact are still being felt, tar balls are still washing up along the Gulf
beaches, and an unusually high number of dolphins are dying. (Walsh, “Nearly Two Years On, Did the
BP Oil Spill Have to Happen to BP?”, 2012) The DWH disaster has by its impacts and scope certainly
had an influence on how Americans now consider offshore drilling and oil exploitation in general.
Lessons have been learned from the disaster, as will be demonstrated further. According to Adam
Fetcher, a spokesman for the DOI, "the Obama administration undertook the most aggressive and
comprehensive reforms to offshore oil and gas regulation and oversight in US history." (Zeller, 2011)
After the blowout, a moratorium suspended drilling activities and several studies were realized by or-
Page 69 from 101

ganisms such as the National Commission on the BP Deepwater Horizon Oil Spill, the Safety Over-
sight Board, the National Academy of Engineering (“Two years after Macondo”, 2012), and the Sec-
retary Mabus' Commission (“Global Conference of Ocean, Climate and Security”, 2012). These re-
views and reports were considered in order to correct the damages, restore and improve safety for fu-
ture offshore drilling. (“Two years after Macondo”, 2012) Additionally, the NOAA and EPA have de-
cided to plan for 10 years from now in order to be better prepared if such an accident should occur
again (Bea, 2010).
4.2.1 Changes within the DOI
As was made clear above (see section 2.3.3), MMS has failed to properly oversee both safety and re -
sponse planning in the DWH oil spill. Consequently, in April 2011, MMS was remade (Vick, 2012). In
its place Interior Secretary Ken Salazar created on June 18, 2010 (Birkland and DeYoung, 2011: 474-
475) the Bureau of Ocean Energy Management, Regulation and Enforcement (BOEMRE) (Burroughs,
2011: 60), that was charged with overseeing the safety and environmental consideration regarding the
development of energy and mineral resources on the OCS. The creation of this new agency and the ad-
option of a new name were positive signals. (Birkland and DeYoung, 2011: 474-475). In October
2011, the duties of BOEMRE were divided between the Bureau of Ocean Energy Management
(BOEM), and the Bureau of Safety and Environmental Enforcement (BSEE) (Bureau of Ocean Energy
Management, Regulation and Enforcement, s. d). Resulting from further reorganization, the regulatory
framework is now being administered by three different agencies within the US DOI: the BOEM, the
BSEE, and the Office of Natural Resources Revenue (ONRR)82.
The BOEM oversees resource development of the US OCS and is charged with offshore leasing, re-
view and implementation of new development plans, and environmental studies. Regarding the BSEE,
it is responsible for implementing and enforcing new regulations, issuing new permits, oil spill re -
sponse, and training as well as controlling environmental compliance83. As far as ONRR is concerned,
the office collects revenue from offshore drilling for the Federal Treasury. (“Two years after
82 Formerly, MMS was constituted of two operational programs: the Offshore Energy and Minerals Management, and the Minerals Revenue Management (MRM) program. In October, 2010, the functions of MRM were officially transferred to ONRR. (Office of Natural Resources Revenue, 2012)
83 BSEE's proposed fiscal year 2013 includes a budget increase to "support BSEE's efforts to ensure that drilling permit ap -plications are judiciously and efficiently processed (Greenberg Jerry. s.d.).
Page 70 from 101
Figure 25: The New Agencies Oversee-ing the Offshore Activities

Macondo”, 2012)
The separation of BOEM and BSEE has several purposes. Indeed, it separates resource management
from safety oversight, permitting a greater independence, more budgetary autonomy and clearer senior
leadership focus. This dichotomy further provides a structure that ensures robust environmental ana-
lyzes and gives appropriate weight to resource management in BOEM during decision-making. On top
of that, the separation strengthens the role of environmental review and analysis in both organizations.
(Bureau of Ocean Energy Management, Regulation and Enforcement, 2010) However the new agen-
cies still lack the resources (insufficient financing), personnel, training, technology, enforcement tools,
regulations and legislation they need to do their job properly (Vick, 2012).
Many oil industry officials worry that the new environmental and safety requirements will discourage
future exploratory investments because of the slowing down of the development of new wells and
higher costs (Vick, 2012). In spite of its anxiety, the oil industry has been active to update and adapt to
the new requirements imposed by the legislation and the public opinion.
4.2.2 Changes within the Oil Industry
The correction of the industry shortcomings was rapidly implemented in the operational infrastructure.
Indeed, joint industry task-forces were created in order to address safety, containment, and area spill
responses. Furthermore the oil industry had to adapt to the new measures issued by BOEM and BSEE,
imposing new well designs based upon a concept called Worst Case Discharge (WCD). WCD implies
an increased complexity of well designs as well as a reevaluation of drill pipe, landing strings, casing,
casing hangers, and well heads. (“Two years after Macondo”, 2012)
The major obstacle (after the spill) to obtain drilling permits was until fairly recently the requirement
for a well containment response system providing rapid containment capabilities in the event of an un-
derwater problem. As a result, industry had to wait until a containment system was developed and ap -
proved by the regulatory agencies. Two such systems were developed by two containment companies:
the Marine Well Containment Corporation (MWCC)84 and the Helix Systems Containment Group. Fol-
lowing the availability of these containment systems, several deepwater drilling permits began to be
granted in late February 2011. (Greenberg, s.d.) Besides containment technologies, guidelines have
been established to ensure safety and the compliance with regulations. Indeed, the Center for Offshore
Safety (COS)85 has begun training and certifying third party inspectors to evaluate the COS Safety En-84 MWCC is a non-profit company formed by a partnership including ExxonMobil, Chevron, ConocoPhillips, Shell and BP.
The MWCC interim containment system includes a subsea capping stack with the ability to shut in oil flow or flow the oil to surface vessels. An expanded containment system is being developed and will be available to the GoM offshore in -dustry this year. (Greenberg, s.d.)
85 COS is an industry organization created to implement best practices in the area of safety and learning processes ( “Two
Page 71 from 101

vironmental Management System (SEMS) programs. VAM USA86 has also participated in its imple-
mentation. Furthermore,the API began in June 2010, a new working group called API RP 96 'Deepwa-
ter Well Design Considerations' in conjunction with member companies. API RP 96 serves as a deep
well design consideration tool that can be used by drilling and completion engineers in order to plan or
drill deep wells. Resulting from the WCD requirements and the techniques developed in the API RP
96, the industry is coping with the emergence of new sizes, connections, and connection verification.
Consequently, new rigs and company with expertise will be necessary to fulfill the new requirements
and higher standards. (“Two years after Macondo”, 2012)
4.2.3 Legal Evolutions and Landmarks
Besides internal restructuring of the DOI and “self-improvement” of the oil industry, the federal gov-
ernment has also taken measures at the legal level in order to prevent any similar event to occur again.
After the moratorium on deep-water oil and gas drilling imposed by the Obama administration, ex-
tending from July 2010 to 12 October 2010, the US government considered it as appropriate that off-
shore activities resume. Nevertheless, operators must now certify compliance with all existing rules
and requirements, even those recently adopted. The recent safety rules include the Drilling Safety
Rule, issued on 30 September 2010, strengthening requirements for safety equipment, well control
systems, and blowout-out prevention practices on offshore oil and gas operations. (Noussia, s.d.: 148)
Furthermore, in order to cope with the health issues raised by the action of emergency cleanup work-
ers, a piece of legislation entitled the Oil Spill Accountability and Environmental Protection Act of
2010, has been passed. This recent act includes provisions requiring that the party liable for an incid-
ent or pollution pay for the personal injuries caused by the incident in question. This legislation will
complete the OPA of 1990 under which this type of payment was not taken into account 87. (Weinhold,
August 2010: A 350)
Another major issue raised by the recent crisis is the liability limit of the liable party (this was one of
the Commission's recommendations). Under the existing OPA, responsible parties are strictly liable for
removal costs and certain damages (detailed in the Act) resulting from a spill (see 1.4 and 2.4). It be -
came rapidly clear that the damages from the DWH oil spill were greater than the existing cap. Con-
sequently, Congress began to consider raising that cap significantly (to as much as $10 billion) or
eliminating it. (National Commission, 2011: 245) This initiative is motivated by the fact that one can-
not assume that a future responsible party would, like BP, have sufficient resources to fully com-
years after macondo”, 2012).86 VAM USA is the world leader for premium connection solutions for the oil and gas industry (V.A.M.. s.d.).87 In this respect, a guideline document entitled The 'National Response Framework' (NRF) existed before the DWH epis -
ode but was frequently ignored. (Weinhold, August 2010: A 350)
Page 72 from 101

pensate for the damages. Furthermore, an increased cap would also serve as a powerful incentive for
companies to pay closer attention to safety. However, a substantial portion of the offshore industry in
the Gulf is made up of smaller, independent operators (see 4.3), for whom higher insurance premiums
could be disadvantageous and even harmful. Consequently, Congress and industry are considering a
series of more nuanced measures to mitigate adverse impact on weaker businesses. (National Commis-
sion, 2011: 246)
Also worth mentioning is the Restore Act88 (introduced by 9 Gulf Senators and recommended by the
National Commission) that was passed in June of 2012 and signed into law by the President on July 6,
2012. Thanks to this Act, at least 80% of the fines (under CWA) owed by BP and other liable parties
will be returned to the Gulf in order to restore the region’s communities, economies and environments.
(“The Restore Act”, s. d.) Without this piece of legislation, the penalties potentially ranging from $5 to
$21 billion will go into the US treasury. (Audubon, s.d. “Restore Act”) This Act will be really benefi-
cial to the region's wildlife and habitats. Furthermore, according to a recent study conducted by Duke
University, the penalties could provide a long-term investment in ecosystem restoration and create jobs
benefiting to more than 140 businesses across 37 states. (“The Restore Act”, s. d.)
4.2.4 Restoration
Estimations suggest that 22% (see oil budget, section 2.5.6) of the spilled oil could still be existing in
the Gulf basin: as surface oil, shorelines tar balls, as sediment oil or as submerged 'oil mats' associated
with the benthos (Arias et alii, 2011). The spill itself is a regional issue, but the slow-motion decima-
tion of the GoM’s coastal and marine environment was already underway before the spill (National
Commission, 2011:197-198). After the spill, Secretary of the Navy and former Governor of Missis-
sippi Ray Mabus was commissioned by President Obama in June, to study Gulf coast recovery and
propose ways to address chronic Gulf marine and coastal issues as well as problems related to ecosys-
tem restoration, human health, economic recovery, and the nonprofit sector. Furthermore, in October
2010, President Obama also created a Gulf Coast Ecosystem Restoration Task Force constituted of
federal agency and state representatives whose objectives are to coordinate intergovernmental respons-
ibilities, planning, and exchange of information in the framework of a broad restoration process. The
sum of money needed for a full restoration of the Gulf would range between $15 billion and $20 bil -
lion, implying: a minimum of $500 million annually for 30 years. (National Commission, 2011:210)
The restoration of the GoM is even more important for the region because the economies, such as fish-
eries, and tourism are strongly conditioned by the environment quality (National Commission,
2011:212- 213). On July 6th 2012, President Obama signed into law a bill that included the critically
88 The Act is also entitled the Resources and Ecosystems Sustainability, Tourist Opportunities and Revived Economy of the Gulf Coast Act of 2011 (“The Restore Act”, s. d.).
Page 73 from 101
important Restore Act, (see legal measures, section 4.2.3) (Audubon, s.d.). This act is a great oppor-
tunity for the federal and state governments to undertake a major and comprehensive restoration pro-
gram in the GoM.
4.2.5 Scientific Funding
A more positive element related to the catastrophe are the funding injections by BP initiated in Sum-
mer 2010. The money, fueling studies in the Gulf Coast, is raising hopes that the DWH event could
provide answers to long-standing questions on the nature of cellular toxicity. While oil was still gush-
ing into the Gulf, BP made the announcement of plans for their $500 million research program and es-
tablished the Gulf of Mexico Research Initiative (GoMRI)89 to administer the funds. This sum will
support independent research on ecosystem assessment, impacts, and recovery efforts, research pro-
gram designed to study the impact of the oil spill and its associated response on the environment and
public health in the GoM. The funding will be level-loaded over a period of ten years In June 2010,
The GoMRI administered $40 million that were divided between several Gulf State universities, re -
search consortia, and the National Institute of Health. Similarly, the National Science Foundation
provided rapid financial response so that researchers were able to start collecting data immediately
after the blowout. In April 2011, the GoMRI announced the financial plan according to which the re-
maining BP funds would be administered over the next 10 years. (Alvania, 2011: 343-344)
4.3 Economic Impacts of the Regulatory Measures
The moratorium and other measures taken by the Obama administration to increase safety, have also
impacted negatively the oil sector. Due to the moratorium and new safety regulations, leasing activities
were halted officially during six months, but in the fact during more than a year. Major development
projects were stopped. Major service companies had to change strategies, either moving more to on-
shore operations or into international areas when possible. Equipment manufacturers, repair, and main-
tenance companies were in harsh conditions, left with little work. Similarly, rig catering companies
were out of work. The deepwater drilling moratorium was officially lifted on October 12, 2010, and
many in the industry thought deepwater drilling and production activity would quickly return to pre-
Macondo levels. However, it was another few months until the BOEMRE (now BSEE and BOEM)
began granting drilling permits because of the new requirements (developed by the industry, see 4.2.2)
including containment systems. Following their availability, several deep-water drilling permits began
to be granted in late February 2011. (Greenberg, s.d.)
89 The GoMRI's mission is to improve society’s ability to understand and mitigate the impacts of hydrocarbon pollution and stressors of the marine environment in the GoM (Gulf of Mexico Alliance, s. d.).
Page 74 from 101

As mentioned and illustrated here above the oil industry, has suffered from the moratorium and regu-
latory measures resulting from the spill. But the victims of these measures were frequently local and
smaller-size businesses of the GoM, not the targeted international companies. Indeed, small- and me-
dium-size businesses are still suffering. These have had to shed employees, dip into personal savings
or move elsewhere to stay afloat. According to a study released by an economic development agency
Greater New Orleans Inc.(GNO)90, as a result of the permit slowdown and insecurity about the future
of the GoM, businesses are laying off workers, reducing hours and salaries and limiting new hires. 91
(Investor’s Business Daily, 2012)
Eloquent of what has just been exemplified is the evolution of the distribution of companies, currently
active in the Gulf. Indeed, the proportion has significantly changed. In 2008, the 6 major operators had
55% of the permits granted. As of February, 2012, three major operators have almost 70% of the total
permits issued. (“Two years after Macondo”, 2012) We have thus witnessed the creation of new mono-
poles that are intensifying their activity in the Gulf (see next section) to the detriment of small- and
medium-size businesses.
4.4 Drilling is on the Roll in the GoM
In 2012, two years after the 2010 explosion, exploration and production in the Gulf will soon surpass
the pre-Macondo levels. Indeed BP and other oil companies are intensifying their offshore activities in
the region. The reason of this phenomena is to be found in the continuing high demand for energy
worldwide. In early 2012, five drilling rigs (just like before the blowout) belonging to BP were active
in the gulf and the oil company plans to have three more platforms drilling in the gulf by the end of
this year thanks to the resumed auctions of December 2011. Indeed, in December 2011, the first off-
shore auction since the spill was held and BP successfully bid for 11 of the 191 available drilling
blocks. (Vick, 2012) BP does not seem to suffer that much two years after the dramatic event, the same
cannot be said for impacted populations and ecosystems. Moreover, nearly two dozen deepwater and
ultra deepwater development projects are scheduled for the period from 2012 to 2014 in the GoM, in-
cluding 14 projects during 2012, three during 2013 and six in 2014, in water depths from about 2,700
ft92 to more than 9,000 ft93. (Greenberg, s.d.)
Everything seems to be back to normal for big companies, did the Macondo blowout really occurred?
Yes of course, the regulation has changed, safety has been improved but more wells are drilled into
90 About 100 business owners or company executives from fields associated with the oil and gas industry responded to the GNO Inc. Survey (Investor’s Business Daily, 2012).
91 9% of the companies in the survey have laid off employees as a result of the moratorium. 52.5% surveyed have not hired new employees since the moratoria. Some 41% of the companies surveyed are not making a profit, a statistic that does not bode well. About 76% of the businesses have lost cash reserves. (Investor’s Business Daily, 2012)
92 2700 feet represent 822.96 meters.93 9000 feet represent (2,743 m)
Page 75 from 101

ever more dangerous areas. Consequently, other oil spill will happen, the question is just to know
when. BP will have to compensate for the damages it has caused. The company will pay high fines and
will probably have to do so for several decades since most damages are going to unveil progressivelly.
In the next section we shall attempt to understand what the company could be forced to pay and say a
few words about the expectations of the public and specialists.
4.5 What Can Impacted Parties Expect from BP?
In this section we shall try to understand and to evaluate what claimants can expect from the oil com-
pany and its contractors; it is not always easy since the federal trial has not taken place yet (January
2013). However, we nevertheless try to evaluate what the compensations could represent.
Last March, BP has been in talks with the Department of Justice to settle pollution claims. These
claims could reach $17.6 billion. The company has already set up a $20 billion trust and agreed on
March 2 to a $7.8 billion settlement with residents and businesses (from fishermen to Gulf hotel own -
ers.). The oil company has also announced that it would pay additional funds directly if the fund was
exhausted. (Bloomberg. 2012) According to Wes Kungel, regional representative for Louisiana Senat-
or Mary Landrieu, CWA penalties against BP should total between $5 billion and $21.5 billion. These
amounts of money are based on fines of $1,100 (simple negligence) to $4,300 (gross negligence) per
barrel and an estimated 4.9 million barrels94 spilled. (Buchanan, 2010) The government wants to in-
crease the penalties that BP has to pay and will try to prove BP's gross negligence. (Bloomberg. 2012)
Louisiana is expected to receive a greater share of BP's CWA penalty money because the state has re-
ceived 60 % to 90 % of the spill pollution. Worth mentioning is also the possibility that BP will have
to cough up fines, resulting from violations of the ESA, MMPA and the MBTA. In total, along with
compensation from the NRDA (under OPA), as much as $130 billion in money can be expected from
BP. Moreover BP might also have to pay for methane gas that leaked from its well (under CAA)
(Buchanan, 2010).
The federal trial starting in New Orleans in January will clarify the situation for all the stakeholders in-
volved in the case. This trial will not be the last, since states, business and individuals can seek to pro-
secute BP. Unfortunately the scope of this thesis is too narrow to deal in details with the judiciary pro-
secutions.
The DWH blowout in the GoM as well as the multiple prosecutions against BP have slowed down off -
shore drilling but did not stop it forever, the activity is already regaining momentum in the Gulf as was
explained above (4.4). Furthermore, the Obama administration has planned to support offshore drilling
94 4.9 million barrels represent 77,9037.77 m³.
Page 76 from 101

in new OCS areas. The prospect of the oil industry as well as the future leasing plan of the government
will be presented in the following section. We shall see that even if the regulation is stricter, areas of
offshore drilling are extending and risks are increasing.
4.6 Probable Evolution of Offshore Drilling in the US
Offshore wells representing 33% of current US oil production, are a the heart of the US energy policy.
The proportion of American oil production originating from offshore drilling will most probably in-
crease in the next decades. Indeed, the OCS contains an estimated 85 billion barrels of oil, considered
as technically recoverable. (National Commission, 2011: 294) In spite of the BP disaster and the evid-
ence of high risks linked to this type of activity, the US government has decided to open vast areas of
its territory to offshore drilling, especially in the GoM and in the Alaskan region as we shall see in a
moment.
Since the spill, the plans on offshore drilling have been modified but continue to expand. On March
31, 2010, President Obama proposed to open vast expanses of American coastlines to oil and natural
gas drilling. However, that idea was postponed by the GoM blowout of April 2010. In December 2010,
the administration abandoned the decision to expand offshore oil exploration into the eastern GoM and
along the Atlantic Coast. Drilling in these areas will remain under a moratorium for at least the next
seven years, in order to give time to the government and industry to adopt stronger safety and environ-
mental standards. However, drilling, will continue under a new set of standards in the central and
western parts of the GoM. In November 2011,the five-year plan for offshore oil drilling was an-
nounced, it includes the opening of new areas in the GoM and Alaska but bars development along the
East and West Coasts. (Vick, 2012) The administration’s drilling plan covering the years 2012 to 2017
is quite similar to the one of March 2010, and authorizes 12 large lease sales in the GoM and three
smaller in the Beaufort and Chukchi seas and the Cook Inlet (AK) (see map on annex 8). (The New
York Times, 2012)
4.6.1 The Gulf of Mexico
Offshore drilling will venture into deeper areas situated in the GoM to find oil. Obama's plan expands
the areas in the GoM, including some near Florida that were off limits. (Vick, 2012) Thanks to new
technologies such as TLP (tension leg platform), semi-submersibles, spar, FPSO (floating production,
storage and offloading), production costs have practically become independent from the depth of the
well. Nevertheless the costs are so high that only the big companies are able to afford them. Besides
Page 77 from 101

deep water drilling, companies are already focusing on ultra-deep drilling, between 1500 and and 3000
m water depth. The wells located at these depths will require the creation of new technologies. In con-
trast with deep drilling, the technologies for ultra-deep wells cannot be extrapolated from shallow wa-
ters techniques. (Boy de la Tour, 2004: 139-143) Indeed, drilling in extreme water depths represents
challenging obstacles. Risers that connect a drilling vessel to the BOP on the bottom of the sea, need
to be lengthened. Moreover, these will be exposed to stronger currents characteristic of the central
GoM. Additionally, higher volumes of mud and drilling fluid will be required, complicating the
drilling process. Another major problem will be raised by the lack of existing infrastructure due to the
greater distance from the coast. (National Commission, 2011: 51-52) Today, technology enables the oil
industry to drill in waters twice as deep as Macondo (5000 feet or 1524 meters). This implies that the
safety standards will need to be continuously adapted. (National Commission, 2011:. 299)
Moreover, we should keep in mind that drilling in the GoM is not solely a matter for US consideration.
Both Mexico and Cuba have expressed interest in deep-water (> 500m) drilling in the Gulf in the near
future. (National Commission, 2011: 300) In February 2012, the Transboundary Agreement was
signed between the US and Mexico. This agreement concerns the exploration and development (by the
US and Mexico's national oil company, Pemex) of oil and natural gas resources along the ultra deep-
water maritime boundary of the two countries. It would concern about 1.5 million acres95 on the US
OCS, estimated to hold approximately 172 million oil barrels96 and 304 billion cubic feet (bcf)97 of
natural gas. The targeted transboundary reservoirs, called the Western gap were off limits to both
countries under a previous treaty that imposed a moratorium along the boundary through 2014.
(Greenberg, s.d.)
Besides the GoM, the Alaskan region is also part of the new leasing program of the Obama administra-
tion. This region poses conditions quite challenging as well.
4.6.2 The Alaskan Region
In the 1980s, companies had already their sights set on the Arctic region. Since the 1960s, major firms
had produced oil from Alaska’s Kenai Peninsula and Cook Inlet. In 1977, the massive onshore Prud-
hoe Bay field on the North Slope was already pumping oil through the Trans- Alaska Pipeline. (see
the map of Alaska on annex 8). The industry temporarily lost its craving for the Arctic after disappoin-
ted drilling and congressional and presidential moratoriums on leasing in Bristol Bay (site of the
world’s largest commercial salmon fishery) following the Exxon Valdez oil spill in 1989. However the
95 1.5 million acres represent 607028.46 ha.96 172 millions bbl represent 27345815.6 m³.97 304 billion cubic feet represent 8608321363.97 m³.
Page 78 from 101

industry gained access to the Beaufort and Chukchi Seas. (National Commission, 2011:35-36) addi-
tionally, as we have seen, the government has decided to extend the leasing areas in the Alaskan region
(see 4.5). On August 4, 2011, Royal Dutch Shell was granted conditional approval to begin drilling ex-
ploratory wells in the Arctic Ocean in summer 2012. (Vick, 2012)
Finding and producing those potentially important supplies of oil offshore of Arctic Alaska require the
utmost care, given the special challenges and risks (Vick, 2012). Indeed, access and working condi-
tions in the Alaskan Arctic are affected by extreme cold, extended seasons of darkness and ice, hur-
ricane-strength storms, and pervasive fog. These conditions limit exploratory drilling and many other
activities to the summer months. (National Commission, 2011: 302) Additionally, depending on the
environment in which oil is released its toxicity and disappearance will occur more or less rapidly.
Tropical habitats have warm temperatures accelerating the processes of weathering and disappearance
of oil. In contrast, Arctic habitats are characterized by cold temperatures and unique physical features
generated by ice and seasonally restricted or unrestricted access to light. Oil spilled off Alaska is likely
to degrade more slowly. Moreover, biodegradation occurs more rapidly in warm waters (< 10°C), sug-
gesting that bioremediation, a mitigation technique using the biodegradtion (see chapter 2) would not
be really useful in arctic or antarctic spill situations. (Shigenaka, 2011: 1010-1014)
The stakes for drilling in the US Arctic are also raised by the richness and rarity of its ecosystems. The
Macondo blowout of April 2010 has shed light on the human and environmental risks associated with
deep-water drilling. (Larry and Jacinda, 2011: 226-228) The marine mammals (ie. seals, cetaceans,
whales, walruses) in the Chukchi and Beaufort Seas are among the most diverse in the world. On top
of that, the Chukchi Sea harbors about 50% of America’s and 10% of the world’s polar bears. This re-
gion also supports millions of shorebirds, seabirds, and waterfowl, as well as abundant fish popula-
tions. Additionally, the Inupiat Eskimos of Alaska rely heavily for their subsistence on resources from
the marine environment, playing moreover a decisive role in their cultural customs and heritage. (Na-
tional Commission, 2011: 303)
Page 79 from 101
Conclusion
The present work has tried to provide the reader with an overview (absolutely not exhaustive) of the
DWH blowout tragedy. The ins and outs of the issue are relatively complex as we have seen. In the
first chapter we have sketched the context of offshore drilling in the US by discussing its origin and
evolution from historical and legal perspectives. In the second chapter; we have tried to understand
what happened on April 20, 2010, and to identify the causes of the blowout from a punctual and sys -
temic point of view. Indeed, if the oil companies and contractors are obviously responsible, the oil in-
dustry in its whole as well as the lax federal government have also their share into it. Another section
of this chapter has also focused on the crisis management process and the various mitigation means
used during and after the spill. In a third chapter, we have also had the occasion to discuss the human,
economic and environmental impacts that have been generated by the spill. The consequences result -
ing from the spill have also been broached. As we have seen some of them will unveil progressively,
over years and even decades. However, everything is far from being negative. Indeed something seems
to have changed in the US as was made clear in the last chapter. Measures have been adopted, restora-
tion is operated on scales never reached before. Things have changed as we have seen but maybe not
sufficiently, given the future prospects of the oil industry and federal government.
The natural capital assets, such as the natural richness of the GoM, and other public goods cannot be
systematically ranked after private interests. Better regulations and stronger incentives regarding off-
shore drilling should be adopted in order to protect an environment that supports most (not to say all)
human activities. No country is shielded from a similar natural catastrophe impacting environment,
people and industry. (Noussia, s.d.: 174-176) The oil sector and the lax American government are not
the only ones to blame in this tragedy. Indeed, every single people bear some personal responsibility.
The offshore activities of oil companies and the negative effects that they generate on the neighboring
communities and environment are initially motivated by greed and supported by our addiction to oil.
In order to satisfy our unsustainable demands, they explore farther, faster and deeper, frequently going
beyond the possibilities of safe technology. (Beth Beloff, 2010: 331-332)
Ceaseless efforts to dig deeper and go further out to sea for oil resources will inevitably lead to other
oil disasters. The DWH spill was not the first one to occur in the US (there was 1969 Santa Barbara
blowout, the Exxon Valdez oil spill in Prince William Sound Alaska, in 1989), and will probably not
be the last. Some pretend that the DWH spill by its scope and impacts have aroused awareness, in con-
trast more pessimist people maintain that the BP blowout will not change drastically the American ap-
proach toward oil. (Mitsch, 2010: 1610) However, Obama's approach and discourse are encouraging as
his speech reflects: “If we refuse to take into account the full cost of our fossil fuel-addiction- if we
Page 80 from 101

don't factor in the environmental costs and national security costs and true economic costs – we will
have missed our best chance to seize a clean energy future”. (Lee, 2010) This type of discourse com-
forts environmentalists, strongly hoping that Obama will be re-elected, if not, safety and environment-
al measures could never be implemented by the Conservatives, blindly supporting the American oil in-
dustry. However, in spite of this type of discourse, the Obama administration has lately opened vast
areas of the American territory in the GoM and the Alaskan region to offshore drilling. This growing
exploitation will inevitably lead to other accidents and major pollutions. It is now time that the Amer-
ican nation begins a transition to a cleaner, more energy-efficient future. (National Commission, 2011:
294) We must find more rational comprehensive clean energy and climate policies. The BP blowout in
the GoM is only some further tragic evidence of the cost of our addiction to oil. (Beth Beloff, 2010:
331-332)
Let us hope that the comment from Sheik Ahmed Zaki Yamani, Saudi oil minister during the 1970's:
''The Stone Age didn't end for lack of stone, and the oil age will end long before the world runs out of
oil” (Maass, 2005), will soon become true, and that people will move toward safer and cleaner energy
resources, more respectful of people and of our natural environment. The DWH blowout was a wake-
up call the question is whether we will answer to it and response or whether we will continue to turn a
deaf ear to that crucial issue.
Page 81 from 101

Bibliography
Alvania Rebecca. 2011. “Slick Science: Will New BP Funds Keep Gulf Genomics Afloat?”. Cell. On-line. Vol. 146, Issue 3, August 5, pp. 343-345. in Science Direct <http://www.sciencedirect.com.ezproxy.ulb.ac.be/science> (Accessed Aug. 8, 2012).
Arias Covadonga, Bullard Stephen, Tao Zhen. 2011 (November). “High Numbers of 'Vibrio vulnificus' in Tar Balls Collected from Oiled Areas of the North-Central Gulf of Mexico Following the 2010 BP 'Deepwater Horizon Oil Spill'”. EcoHealth. Online. Vol. 8, n° 4, pp. 507-511. in Springerlink <http://www.springerlink.com.ezproxy.ulb.ac.be> (Accessed Aug. 8, 2012).
Atlas Ronald and Hazen Terry C. 2011. “Oil biodegradation and bioremediation: A tale of the two worst spills in U. S. history”. In Environmental Science Technology. Online PDF, 17 pages. June 23, <http://esd.lbl.gov/files/about/staff/terryhazen/2011Atlas_Hazen_EST.pdf> (Accessed Aug. 7, 2012).
Audubon. “About us”. Audubon Magazine. Online. <http://www.audubon.org/about-us> (Accessed Aug. 7, 2012).
Audubon. s. d. “Oil and Birds: Too Close for Comfort” . Audubon Magazine. Online. <http://gulfoilspill.audubon.org/oil-and-birds-too-close-comfort> (Accessed Aug. 7, 2012).
Audubon. s.d. “Restore Act ”. Audubon Magazine. Online. <http://conservation.audubon.org/restore-act-0> (Accessed Aug. 7, 2012).
Baker Beth. 2012. “Of Oyster Shells and Oil Spills”. BioScience. Online.Vol. 62, n° 2, February, p. 212. in Jstor <http://www.jstor.org.ezproxy.ulb.ac.be/> (Accessed Aug. 8, 2012).
Baltimore Chris and Simao Paul. 2010. “Gulf Coast oil spill chills seafood industry”. Reuters. Online. May 12, <http://www.reuters.com/article/2010/05/12/oil-rig-seafood-idUSN1220584420100512> (Ac-cessed Aug. 7, 2012).
Bea Robert. 2010 (July 3). “Explaining the equation behind the oil spill disaster”. Science News. On-line. Vol. 178, n°1, p. 32. in Jstor <http://www.jstor.org.ezproxy.ulb.ac.be/> (Accessed Aug. 8, 2012).
BBC. 2010. “Torrey Canyon disaster revisited”. BBC Website. Online. (Page last updated June 22), <http://news.bbc.co.uk/local/cornwall/hi/people_and_places/nature/newsid_8753000/8753329.stm> (Accessed Aug. 7, 2012).
Beloff Beth. 2010. “Lessons from the DeepWater Horizon debacle: a precautionary tale”. Clean Tech-nologies and Environmental Policy. Online. Vol. 12, n° 4, pp. 331-333. in Springerlink <http://www.springerlink.com.ezproxy.ulb.ac.be> (Accessed Aug. 8, 2012).
Biello David. 2010. “The BP Spill’s Growing Toll On the Sea Life of the Gulf”. Yale School of Forestry & Environmental Studies, Yale Environment 60. Online. June 09, <http://e360.yale.edu/feature/the_bp_spills_growing_toll_on_the_sea_life_of_the_gulf/2284/> (Ac-cessed Aug. 7, 2012).
Birkland Thomas A., DeYoung Sarah E. 2011. “Emergency Response, Doctrinal Confusion, and Fed-eralisms in the Deepwater Horizon Oil Spill”. The Journal of Federalism, Published by Oxford Uni-versity. Online. Vol. 41, n° 3, pp. 471-493. in SwetSize <http://www.swetswise.com.ezproxy.ulb.ac.be/titleBank/getAtoZList.do> (Accessed Aug. 8, 2012).
Black Tides. s. d. “Degassing, deballasting and operational discharge”. Black Tides Website, Online <http://www.black-tides.com/uk/source/operational-discharge/degassing-deballasting-discharge.php> (Accessed Aug. 7, 2012).
Page 82 from 101

Bloomberg. 2012. “BP Has Ability to Pay More For Spill With Oil Over $120”.Bloomberg.com. On-line. March 15, <http://www.bloomberg.com/news/2012-03-15/bp-has-ability-to-pay-more-for-spill-with-oil-over-120.html> (Accessed Aug. 14, 2012).
Boy de la Tour Xavier. 2004. Le pétrole. Au-delà du mythe. Editions Technip, Paris, 169 p.
BP. 2010. “Deepwater Horizon Accident Investigation Report. Executive Summary”. BP’s Website. Online PDF, 6 pages. September 8, <http://www.bp.com/liveassets/bp_internet/globalbp/globalbp_uk_english/incident_response/STAGING/local_assets/downloads_pdfs/Deepwater_Horizon_Accident_Investigation_Report_Executive_summary.pdf> (Accessed Aug. 7, 2012).
BP. 2010. “Factsheet on BP Vessels of Opportunity Program”. Online PDF, 5 pages. July 7, <http://www.bp.com/liveassets/bp_internet/globalbp/globalbp_uk_english/incident_response/STAGING/local_assets/downloads_pdfs/factsheet_bp_vessels_of_opportunity_program.pdf> (Accessed Aug. 7, 2012).
BP. 2011. “BP Announces Settlement with Anadarko Petroleum Company of Claims Related to Deep-water Horizon Accident”. BP Website. Online. October 17, <http://www.bp.com/genericarticle.do?categoryId=2012968&contentId=7071823> (Accessed Aug. 14, 2012).
BP. 2011. “BP Announces Settlement with Cameron International Corporation of Claims Related to the Deepwater Horizon Accident”. BP Website. Online. December 16, <http://www.bp.com/genericarticle.do?categoryId=2012968&contentId=7072608> (Accessed Aug. 14, 2012).
BP’s Official Website. Image. Online. <http://www.bp.com> (Accessed Aug. 7, 2012).
BP. s. d. “Investigations into the Deepwater Horizon accident have played and will play an important role in understanding its causes, preventing future accidents and improving the safety of deepwater drilling”. BP Website. Online. <http://www.bp.com/sectiongenericarticle800.do?categoryId=9040063&contentId=7067594> (Accessed Aug. 14, 2012).
Bratspies Rebecca, Flournoy Alyson et alii. 2010. “From Ship to Shore : Reforming the Nation “Con-tingency Plan to Improve Protection from Oil Spill Cleanup Workers”. Online PDF, 22 pages. August, <http://digitalcommons.law.umaryland.edu/cgi/viewcontent.cgi?article=2013&context=fac_pubs> (Accessed Aug. 7, 2012).
Brent Ache, Bylsma David et alii. 2008. “Gulf of Mexico at a Glance. Washington”, National Oceanic and Atmospheric Administration, D.C.: U.S. Department of Commerce. Online PDF, 34 pages. <http://gulfofmexicoalliance.org/pdfs/gulf_glance_1008.pdf > (Accessed Aug. 7, 2012).
Buchanan Susan. 2010. “Louisiana Coastal Director Say BP Must Pay to the Max”. The Huffington Post Website. Online. July 22, <http://www.huffingtonpost.com/susan-buchanan/louisiana-coastal-directo_b_1693778.html> (Accessed Aug. 14, 2012).
Bureau of Ocean Energy Management, Regulation and Enforcement. 2010. “The Reorganization of the Former MMS”. The Department of the Interior’s, U.S.A. Online. May 19, <http://www.boemre.gov/reorganization.htm> (Accessed Aug. 7, 2012).
Bureau of Ocean Energy Management, Regulation and Enforcement. s. d. “Reorganization of The Bureau of Ocean Energy Management, Regulation and Enforcement”. Online. <http://www.boemre.gov/> (Accessed Aug. 7, 2012).
Page 83 from 101
Burroughs Richard. 2011. “Oil”. Coastal Governance,Foundations of Contemporary Environmental Studies, Coastal Governance, Chapter 4, pp. 43-65. in Springerlink, <http://www.springerlink.com.ezproxy.ulb.ac.be> (Accessed Aug. 8, 2012).
Campagna Claudi, Carpenter Kent E.,et alii. 2011. “Gulf of Mexico Oil Blowout Increases Risks to globally Threatened Species”. BioScience, Vol. 61, n° 5, May, pp. 393-397. in Jstor <http://www.jstor.org.ezproxy.ulb.ac.be/> (Accessed Aug. 8, 2012).
Cavnar Bob. 2010. “False Hope: BP Exec Claims BOP Closing - Company Says No”. Photography. Online. (May 3), <http://dailyhurricane.com/2010/05/false-hope-bp-exec-claims-bop-closing---company-says-no.html> (Accessed Aug. 7, 2012).
Cho Hyun J., Downs Christopher et alii. 2012. “Post-spill State of the Marsh: Remote Estimation of the Ecological Impact of the Gulf of Mexico Oil Spill on Louisiana Salt Marshes”. Remote Sensing of Environment. Online. Vol. 118, March 15, pp. 176-185. in Science Direct <http://www.sciencedirect.com.ezproxy.ulb.ac.be/science> (Accessed Aug. 8, 2012).
Cleveland, Cutler J.. 2008. “Odum, Howard T.”(Bibliography). in The encyclopedia of Earth. Online. (August 22), <http://www.eoearth.org/article/Odum,_Howard_T.> (Accessed Aug. 7, 2012).
Cleveland, Cutler J. 2010. “Water Pollution: Exxon Valdez oil spill”. in Encyclopedia of earth. Online.(Last revised Date December 20), <http://www.eoearth.org/article/Exxon_Valdez_oil_spill?topic=58075> (Accessed Aug. 7, 2012).
Cohen Tom. 2010. “Obama administration lifts deep-water drilling moratorium”. In CNN Website. On-line. October 12, <http://articles.cnn.com/2010-10-12/us/drilling.moratorium_1_deep-water-drilling-drilling-rig-oil-drilling?_s=PM:US> (Accessed Aug. 7, 2012).
Copinschi Philippe. 2010. Le pétrole, quel avenir ? Analyse géopolitique et économique. Bruxelles : de Boeck, 141 p.
Council on Environmental Quality Executive Office of the President. 2007. “A Citizen’s Guide to the NEPA Having Your Voice Heard”. Online PDF, 55 pages. December, <http://ceq.hss.doe.gov/nepa/Citizens_Guide_Dec07.pdf> (Accessed Aug. 7, 2012).
“Deepwater Horizon Response Consolidated Fish and Wildlife Collection Report”. 2010. Online PDF, 1 pages. November 1, <http://www.restorethegulf.gov/sites/default/files/documents/pdf/Consolidated%20Wildlife%20Table%20110110.pdf> (Accessed Aug. 7, 2012).
Dillistone, Kristie, Shin Jae-Hwa, Muralidharan Sdharth. 2011. “The Gulf Coast oil spill: Extending the Theory of Image Restoration Discourse to the Realm of Social Media and Beyond Petroleum”. Public Relations Review. Online. Vol. 37, Issue 3, September, pp. 226-232. in Science Direct <http://www.sciencedirect.com.ezproxy.ulb.ac.be/science> (Accessed Aug. 8, 2012).
Dineen Joseph. 2010. “TIDAL FLAT HABITATS”. Smithsonian Marine Station At Fort Pierce. On-line. (Last Updated 10 May, 2010), <http://www.sms.si.edu/irlspec/Tidal_Flats.htm> (Accessed Aug. 7, 2012).
Doke Dzigbodi, Gohlke Julia M et alii. 2011. “A Review of Seafood Safety after the 'Deepwaer Hori-zon' blowout”. Environmental Health Perspectives. Online. Vol. 119, n° 8, August, pp. 1062-1069. in Jstor <http://www.jstor.org.ezproxy.ulb.ac.be/> (Accessed Aug. 8, 2012).
“Drillship”. 2012. 2be1 st Consulting. Photography. Online. April 16, <http://www.2b1stconsulting.com/drillship/> (Accessed Aug. 7, 2012).
Page 84 from 101

Duhon David, Lambert John, Peyrefitte Joseph. 2012. “2010 BP Oil Spill and the Systemic Construct of the Gulf Coast Shrimp Supply Chain”. Systemic Practice and Action Research. Online.Vol. 25, n° 3, pp. 223-240. in Springerlink <http://www.springerlink.com.ezproxy.ulb.ac.be> (Accessed Aug. 8, 2012).
Enchanted Learning. s.d. “Alaska. Facts, Map and State Symbol”. Image. Online, <http://www.enchantedlearning.com/usa/states/alaska/ > (Accessed Aug. 15, 2012).
Encyclopedia of Earth. 2011. “National Commission on the BP Deepwater : Horizon Oil Spill and Off-shore Drilling”. Encyclopedia of Earth. Online. Update February 23, <http://www.eoearth.org/article/National_Commission_on_the_BP_Deepwater_Horizon_Oil_Spill_and_Offs hore_Drilling?topic=50364 > (Accessed Aug. 7, 2012).
Energy Institute. 2011. “Human factors briefing note no. 20 – Occupational safety vs. process safety”. El Publications Online, Energy Institute. Online. 2nd Edition, July, <http://www.energyinstpubs.org.uk/cgi- bin/moreinfo/moreinfo.cgi? sessionid=1336107682&articleid=1731&backstring=sessionid--3D1336049442--26type--3Dsimple--26searchstring--3Doccupational--2Bhealth--26select--3D0> (Accessed Aug. 7, 2012).
European Aviation Safety Agency. 2011. “Safety Management and Safety Culture”. European Aviation Safety Agency Website. Online. Update January 2011, <http://easa.europa.eu/essi/ecast/main-page-2/sms/> (Accessed Aug. 7, 2012).
Fish Safe. 2009. “Offshore Structures Photo Gallery”. In Fish Safe, FLTC Services Limited. Online. <http://fishsafe.eu/en/offshore-structures/photo-gallery.aspx> (Accessed Aug. 7, 2012).
Freundenburg William R., Gramling Robert. 2011. Blowout in the Gulf. The BP Oil Spill Disaster and the Future of Energy in America. Massachusetts Intsitute of Technology, 254 p.
“Global Conference of Ocean, Climate and Security”. 2012. UMASS Boston, Collaborative Institute for Ocean, Climate and Security, University of Massachusetts Boston. Online. May 21-23, <http://www.gcocs.org/mabus.html> (Accessed Aug. 7, 2012).
Global Marine Oil Pollution. s. d. “Operational Discharges Oil” Global Marine Oil Pollution Informa-tion Gateaway. Online. <http://oils.gpa.unep.org/facts/operational.htm> (Accessed Aug. 7, 2012).
Goldenberg Suzanne. 2012. “Deepwater Horizon aftermath: how much is a dolphin worth?”. The Guardian. Online. April 19, <http://www.guardian.co.uk/environment/2012/apr/19/deepwater-horizon-aftermath-dolphin-worth> (Accessed Aug. 7, 2012).
Gorka Tomasz. 2010. “Magnetometry”. in Ludwig Maximilians Universität München, Geophysic, De-partment of Earth and Environmental Sciences. Online. December 08, <http://www.geophysik.uni-muenchen.de/research/archaeologicalprospection/magnetometry> (Accessed Aug. 7, 2012).
Grattan Lynn, Roberts Sparkle et alii. 2011(june). “The Early Psychological Impacts of the Deepwater Horizon Oil Spill on Florida and Alabama Communities”. Environmental Health Perspectives. Online. Vol. 119, n° 6, pp. 838-843. in Jstor <http://www.jstor.org.ezproxy.ulb.ac.be/> (Accessed Aug. 8, 2012).
“Gravimetry”. 2012. in Talk Talk Website, Helicon Publishing is division of RM. Online. <http://www.talktalk.co.uk/reference/encyclopaedia/hutchinson/m0006396.html> (Accessed Aug. 7, 2012).
Greenberg Jerry. s.d. “Gulf activity picks up the pace post-Macondo”, Offshore Magazine. Online.
Page 85 from 101
<http://www.offshore-mag.com/articles/print/volume-72/issue-4/geographic-focus/gulf-activity-picks-up-the-pace-post-macondo.html> (Accessed Aug. 7, 2012).
Grossi V, Massias D et alii. 2002. “Burial, exportation and degradation of acyclic petroleum hydrocar-bons following a simulated oil spill in bioturbated Mediterranean coastal sediments”. N.C.B.I. Website. Online. September, <http://www.ncbi.nlm.nih.gov/pubmed/12222790> (Accessed Aug. 7, 2012).
Gulf of Mexico Alliance. s. d. “Gulf of Mexico Research Initiative (GoMRI)”, Gulf of Mexico Re-search Initiative. Online. <http://www.gulfofmexicoalliance.org/contacts/gri.html> (Accessed Aug. 7, 2012).
Gupta Sujata. 2010 (August 20). “Gulf Spill: is the oil lurking underwater”. The NewScientist. Online. , <http://www.newscientist.com/article/dn19345-gulf-spill-is-the-oil-lurking- underwater.html > (Accessed Aug. 7, 2012).
Hampton Steve. 2012 (Last Updated March 4). “Estimating Bird Mortality”. California Department of Fish and Game. Online. <http://www.dfg.ca.gov/ospr/Science/estimating_bird_mortality.aspx> (Ac-cessed Aug. 7, 2012).
Henkel Jessica R, Sigel Bryan j, Taylor Caz M. 2012. “Large-scale impacts of the Deep-water Horizon Oil Spill: Can Local Distrubance Affect Distant Ecosytems through migratory shorebirds?”. BioS-cience. Online. Vol. 62, n° 7, (July), pp. 676-685. in Jstor <http://www.jstor.org.ezproxy.ulb.ac.be/> (Accessed Aug. 8, 2012).
Hermilo Ramires-Leon. 2012. “The Oil spill in the Gulf of Mexico”. Klapp J. et alii (eds.), Experi-mental and Theoretical Advances in Fluids Dynamics, Environmental Science and Engineering. On-line. Part 1, pp. 103-134. in Springerlink <http://www.springerlink.com.ezproxy.ulb.ac.be> (Accessed Aug. 8, 2012).
Hopkins Andrew. 2011. “Management Walk-arounds: Lessons from the Gulf of Mexico Oil Well Blo-wout”. Safety Science. Online. Vol. 49, Issue 10, December, pp.1421-1425. in Science Direct <http://www.sciencedirect.com.ezproxy.ulb.ac.be/science> (Accessed Aug. 8, 2012).
Institute Of Energy Research. s. d. “Fact Sheet on Inventory Video”. C.P.R. (Center for Progressive Reform). Online PDF, 5 pages. White Paper #1006, <http://www.energyforamerica.org/wp-content/uploads/2012/06/Fact-Sheet-on-Inventory-Video-Logo1.pdf> (Accessed Aug. 7, 2012).
International Energy Agency. 1996. Global offshore oil prospects to 2000. Paris: OECD, 156 p.
Investor’s Business Daily. 2012. “Gulf Deepwater Drilling Ban’s Hidden Victims”. Online. January 31. <http://news.investors.com/article/599612/201201311903/gulf-drilling-moratorium-killing-small-medium-business.htm?p=full> (Accessed Aug. 7, 2012).
Jernelöv Arne. 2010. “The threats from Oil Spills: Now, Then and in the Future”. AMBIO: A Journal of the Human Environment. Online. Vol. 39, n° 5-6, pp. 353-366. in Springerlink <http://www.springerlink.com.ezproxy.ulb.ac.be> (Accessed Aug. 8, 2012).
Kirsh Stuart. 2010. “Guest editorial : Sustainability and the BP oil spill”. Dialectical Anthropology. Online. Vol. 34, n° 3, pp. 295-300. in Springerlink <http://www.springerlink.com.ezproxy.ulb.ac.be> (Accessed Aug. 8, 2012).
Kleinnijenhuis Jan, Schultz Friederike et alii. 2012. “Strategic Framing in the BP Crisis: A semantic Network Analysis of Associative Frames”. Public Relations Review. Online. Vol. 38, Issue 1, March, pp. 97-107. in Science Direct <http://www.sciencedirect.com.ezproxy.ulb.ac.be/science> (Accessed Aug. 8, 2012).
Page 86 from 101

Larry Hughes, Jacinda Rudolph. 2011. “Future World Oil Production: Growth, Plateau, or Peak?”. Current Opinion in Environmental Sustainability. Online. Vol. 3, Issue 4, September, pp. 225-234. in Science Direct <http://www.sciencedirect.com.ezproxy.ulb.ac.be/science> (Accessed Aug. 8, 2012).
Lee Jesse. 2010. "Relentless Efforts to Stop the Leak and Contain the Damage", The White House President Barack Obama. Online. May 14, <http://www.whitehouse.gov/blog/2010/05/14/relentless-efforts-stop-leak-and-contain-damage> (Accessed Aug. 7, 2012).
Loewy Raymond. 2009. “BP”. Logo. Online. <http://logo-bedandy.blogspot.be/2009/09/raymond-loewy-designer-industriel-et.html> (Accessed Aug. 7, 2012).
Lubchenco Jane (Under Secretary of Commerce for Oceans ans Atmosphere and NOAA Administrat-or). 2011. “What is NOAA”. National Oceanic and Atmospheric Administration (United State Depart-ment of Commerce). Online PDF, 2 pages. February, <http://www.legislative.noaa.gov/policybriefs/What%20is%20NOAA%202011%20-%20FINAL.pdf> (Accessed Aug. 7, 2012).
M. Steve. 2010. “In depth: The Deepwater Horizon BP oil spill cause”. RadioVice. Image. Online. June 29, <http://radioviceonline.com/in-depth-the-deepwater-horizon-bp-oil-spill-cause/> (Accessed Aug. 7, 2012).
Maass Peter. 2005. “The Breaking Point”. The New York Times. Online. August 21, <http://www.nytimes.com/2005/08/21/magazine/21OIL.html?_r=1&pagewanted=all> (Accessed Aug. 7, 2012). Masland Michael (prod.), David Joseph (aut.). 2008. Plate-formes pétrolières, titans des mers. Docu-mentary released by France 5 on 30 January 2008. Online. 50.51 min., 4 parties : <http://www.dailymotion.com/video/x62pet_1-4-plateformes-petrolieres-titans_fun?search_algo=2 >, <http://www.dailymotion.com/video/x62pwz_2-4-plateformes-petrolieres-titans_fun>, <http://www.dailymotion.com/video/x62q7u_3-4-plateformes-petrolieres-titans_fun>, <http://www.dailymotion.com/video/x62q7u_3-4-plateformes-petrolieres-titans_fun>(Accessed Aug. 15, 2012).
Mcneil John R. 2010. “Les combustibles, l'outillage et l'économie”. in Mcneil John R., Du nouveau sous le soleil. Une histoire de l'environnement mondial au XXe siècle, Seyssel, Champ Vallon, Chapitre 10, pp. 392-428.
Mitsch William. 2010. “The 2010 oil spill in the Gulf of Mexico : What Would Mother Nature do?”. Ecological Engineering. Online. Vol. 36, Issue 12, December, pp. 1607-1610. in Science Direct <http://www.sciencedirect.com.ezproxy.ulb.ac.be/science> (Accessed Aug. 8, 2012).
MMS (Minerals Management Service). 2009. “Report to the Secretery US Department of the Interior : Survey of Available Data on OCS Resources and Identification of Data Gaps”. Online PDF, 219 pages. N° 015. <http://www.doi.gov/archive/ocs/report.pdf> (Accessed Aug. 13, 2012).
Mudblogger (Admin.). 2008. “Photos → z-337-981-9430-ensco-82”. Photography. Online. In The Mudblogger : Oilfield, Energy and Related Photographs. <http://mudblogger.com/photos/z-337-981-9430-ensco-82/> (Accessed Aug. 7, 2012).
Narayan Roger. 2010. “Titania: a material-based approach to oil spill remediation?”. Materials Today. Online. Vol. 13, Issue 9, September, pp. 58-59. in Science Direct <http://www.sciencedirect.com.ezproxy.ulb.ac.be/science> (Accessed Aug. 8, 2012).
Nash Steve. 2011(April). “Oil and Water, Economics and Ecology in the Gulf of Mexico”. BioS-
Page 87 from 101

cience. Online. Vol. 61, n°4, pp. 259-263. in Jstor <http://www.jstor.org.ezproxy.ulb.ac.be/> (Accessed Aug. 8, 2012).
National Academy of Science. s. d. “Welcome to the National Research Council”. National Academy of science Website. Online, <http://nationalacademies.org/nrc/index.html> (Accessed Aug. 7, 2012).
National Commission on the BP Deepwater Horizon Oil Spill and Offshore Drilling. 2011. “Deep Wa-ter. The Gulf Oil Disaster and the Future of Offshore Drilling. Report to the President”. Online PDF, 398 pages. January, <http://www.oilspillcommission.gov/sites/default/files/documents/DEEPWATER_ReporttothePresident_FINAL.pdf> (Accessed Aug. 7, 2012).
National Geographic. s. d. “ The Gulf of Mexico. Layers of Life”. Online PDF, 1 page. <http://images.nationalgeographic.com/wpf/media-content/file/layers-of-life-diagram_-cb1285178352.pdf> (Accessed Aug. 7, 2012).
NOAA. (Lead Author), Saundry, Peter and Hogan C Michael (Contributing Authors). 2012. “Geo-graphy. The Gulf Of Mexico”. The encyclopedi of Earth. Online. (Updated May 29, 2012), <http://www.eoearth.org/article/Gulf_of_Mexico> (Accessed Aug. 7, 2012).
NOAA. s.d. “Magnuson-Stevens Fishery Conservation and Management Act Reauthorized”. In NOAA Fisheries Service. Online. <http://www.nmfs.noaa.gov/msa2005/> (Accessed Aug. 7, 2012).
NOAA. 2011. “Sea Turtles, Dolphins, and Whales and the Gulf of Mexico Oil Spill”. NOAA Fisheries Office of Protected Resources. Online. (Updated September 12), <http://www.nmfs.noaa.gov/pr/health/oilspill.htm> (Accessed Aug. 7, 2012).
NOAA Fisheries: Office of Science & Technology, Fisheries Economics & Sociocultural Status & Trends Series.s. d. “Gulf of Mexico”. In NOAA Fisheries Service. Online PDF, 6 pages. <http://www.st.nmfs.noaa.gov/st5/publication/econ/Gulf_Summary_Econ.pdf> (Accessed Aug. 7, 2012).
Noussia.Kyriaki s. d. “Environmental Pollution Liability and Insurance Law Ramifiations In Light of the Deepwater Horizon Oil Spill”. Basedown J. et alii, Hamburg Studies on Maritime Affairs. Online. 1, Vol. 23, The Hamburg Lectures on Maritime Affairs 2009 & 2010, Part 2, pp. 137-176. in Springer-lin <http://www.springerlink.com.ezproxy.ulb.ac.be> (Accessed Aug. 8, 2012).
Ober Holly K.. 2010. “Effects of Oil Spills on Marine and Coastal Wildlife”. University Of Florida, IFAS Extension. Online PDF, 4 pages. May, <http://edis.ifas.ufl.edu/pdffiles/UW/UW33000.pdf> (Ac-cessed Aug. 7, 2012).
Oceana. 2012. “Offshore Drilling Reform. Report Card 2012”. in Oceana (Protecting the Ocean). On-line PDF, 14 pages. <http://oceana.org/sites/default/files/Offshore_Drilling_Report_Card_2012_FINAL_0.pdf> (Accessed Aug. 7, 2012).
Oceana. s. d. “How to Saving the Ocean Can Feed the Worl”. In Oceana (Protecting the Ocean). On-line. <http://oceana.org/en/about-us/what-we-do> (Accessed Aug. 7, 2012).
OCS Energy. s.d. “The Outer Continental Shelf”. OCS Alternative Energy and Alternate Use Pro-grammatic EIS. Online. <http://ocsenergy.anl.gov/guide/ocs/index.cfm> (Accessed Aug. 7, 2012).
Office of Natural Resources Revenue. 2012. “Who we Are”. In Office of Natural Ressources Revenue Website. Online. (Last Updated June 25), <http://www.onrr.gov/About/default.htm> (Ac-cessed Aug. 7, 2012).
Page 88 from 101

Oil and Gas UK. s.d. “Production Platforms”. The Voice of the offshore industry. Online. <http://www.oilandgasuk.co.uk/publications/Production/Production_Platforms.cfm> (Accessed Aug. 7, 2012).
Ottar Grundvig, James. 2010. “The Odyssey of the Dutch Oil Skimmers”. The EpochTime (English Edition). Photography. Online. (Last Updated July 10, 2010), <http://www.theepochtimes.com/n2/united-states/gulf-oil-spill-netherlands-38810.html> (Accessed Aug. 7, 2012).
“Outer Continental Shelf”. s. d. in Webster's Online Dictionary. Online. <http://www.websters-online-dictionary.org/definitions/outer+continental+shelf> (Accessed Aug. 7, 2012).
Patzek T.W. and Tainter J.A. s.d. “The Significance of Oil in the Gulf of Mexico”. Drilling Down: The Gulf Oil Debacle and our Energy Dilemma. Online. Chapter 2, pp. 7- 22. in Springerlink <http://www.springerlink.com.ezproxy.ulb.ac.be> (Accessed Aug. 8, 2012).
“Petrole”. 1975. in La Grande Encyclopédie Larousse. N°44, Parkinson- Phéniciens. Paris : Librairie Larousse, pp. 9133- 9356.
Pilkington Ed. 2010. “US Congress to tell BP boss: you broke rules, cut costs and it ended in disaster”. The Guardian. Online. June 15, <http://www.guardian.co.uk/environment/2010/jun/14/barack-obama-oil-spill-speech> (Accessed Aug. 7, 2012).
Raloff Janet. 2010. “Surface Oil isn't the only threat from Gulf gushers: Scientists try to understand deep-sea hydrocarbon clouds”. Science News. Online. Vol. 178, n°1, July 3, pp. 5-6. in Jstor <http://www.jstor.org.ezproxy.ulb.ac.be/> (Accessed Aug. 8, 2012).
Raloff Janet. 2010. “Teams disagree over breakdown of BP oil in the Gulf: Two studies offer confus-ing picture of deep-sea plumes”. Science News. Online. Vol. 178, n°6, September 11, pp. 5-6. in Jstor <http://www.jstor.org.ezproxy.ulb.ac.be/> (Accessed Aug. 8, 2012).
Ribic Christine A., Randall Davis et alii. 1997. “Distribution of seabirds in the northern Gulf of Mex-ico in relation to mesoscale features: initial observations”. ICES Journal of Marine Science, U.S. Gov-ernment. Online PDF, 7 pages. <http://icesjms.oxfordjournals.org/content/54/4/545.full.pdf> (Ac-cessed Aug. 7, 2012).
Rigzone. s. d. “How Do Jackups Work?”. In Rigzone Website. Online. <http://www.rigzone.com/training/insight.asp?insight_id=339&c_id=24>
Rigzone’s Official Website, http://www.rigzone.com> (Accessed Aug. 7, 2012).
Royal Haskoning. 2010. "Welkom op de website Ecological Engineering”. Royal Haskoning. Online. (Last Updated July 10, 2010), <http://www.ecological-engineering.nl/> (Accessed Aug. 7, 2012).
Rprokop. 2012. “Government Fails on Offshore Drilling Report Card”. Oceana (Protecting the Ocean). Online. April 17, <http://oceana.org/en/blogs/rprokop> (Accessed Aug. 7, 2012).
Schmidt Charles W. 2010. “Between the Devil and the Deep Blue Sea: Dispersants in the Gulf of Mexico”. Environmental Health Perspectives. Online. Vol. 118, n°8, August, pp. A 338- A 344. in Jstor <http://www.jstor.org.ezproxy.ulb.ac.be/> (Accessed Aug. 8, 2012).
Schmidt Charles W. 2011. “Occupational Health. Study to Examine Health Effects in “Deepwater Ho-rizon” Oil Spill Cleanup workers”. Environmental Health Perspectives. Online. Vol. 119, n° 5, May, p. A204. in Jstor <http://www.jstor.org.ezproxy.ulb.ac.be/> (Accessed Aug. 8, 2012).
Page 89 from 101

Science Daily. s. d. “Petroleum geology”. In Science Daily Website. Online. <http://www.sciencedaily.com/articles/p/petroleum_geology.htm> (Accessed Aug. 7, 2012).
Sébille-Lopez Philippe. 2006. Géopolitique du pétrole. Paris : Armand Colin, p. 479.
Shigenaka Gary. 2011. “Effect of Oil in the Environment”. Oil Spill Science and Technology. Online. Chapter 27, pp. 985-1024. in Science Direct <http://www.sciencedirect.com.ezproxy.ulb.ac.be/science> (Accessed Aug. 8, 2012).
“Short Ton”. In Bussiness Dictionary. Online. <http://www.businessdictionary.com/definition/short-ton.html> (Accessed Aug. 7, 2012).
Soraghan Mike. 2010. “As Spill Drifts Toward Gulf Shores, Oil Companies Brace for Political Whirl-wind”. The New York Times. Online. April 29, <http://www.nytimes.com/gwire/2010/04/29/29greenwire-as-spill-drifts-toward-gulf-shores-oil-compani-89449.html> (Accessed Aug. 7, 2012).
“Sub-Atlantic - Electric ROV Systemshttp://www.offshore-technology.com/contractors/rovs/sub-atlantic/sub-atlantic3.html and ROV System Components”. s.d. Offshoretechnology.com.Photography. Online. <> (Accessed Aug. 13, 2012).
“Supermajors - Largest Oil Companies”. 2010. Oilprices.org. Online. <http://www.oilprices.org/largest-oil-companies.html> (Accessed Aug. 13, 2012).
Tao Rui et alii. 2012. “Anaerobic Biodegradation of Benzene in Salt Marsh Sediment of the Louisiana Gulf coast”. Ecological Engineering. Online. Vol. 40, March, pp. 6-10. in Science Direct <http://www.sciencedirect.com.ezproxy.ulb.ac.be/science> (Accessed Aug. 8, 2012).
Techno Science. s. d. “BP (compagnie pétrolière)”. TechnoScience Website. Online. < http://www.techno-science.net/?onglet=glossaire&definition=7142> (Accessed Aug. 7, 2012).
The Federal Interagency Solutions Group,Oil Budget Calculator Science and Engineering Team. 2010. “Oil Budget Calculator. Deepwater Horizon”. Technical documentation, A Report to the National In-cident Command. Online PDF, 217 pages. November 2010, <http://www.noaanews.noaa.gov/stories2010/PDFs/OilBudgetCalc_Full_HQ-Print_111110.pdf> (Ac-cessed Aug. 7, 2012).
The HuffingtonPost. 2010. “First Dead Whale Found South Of Oil Spill”. The HuffingtonPost Website. Online. June 17, <http://www.huffingtonpost.com/2010/06/17/dead-whale-found-south-of_n_615505.html> (Accessed Aug. 7, 2012).
The New York Times. 2012. “Drilling Strategies, Sensible and Fantastical” (Editorial). The New York Times (Sunday Review). Online. July 14, <http://travel.nytimes.com/2012/07/15/opinion/sunday/drilling-strategies-sensible-and-fantastical.html?ref=offshoredrillingandexploration> (Accessed Aug. 7, 2012).
The Open University. “3.2.1 Seismic data and interpretation”. s.d. Image. in The Open University Website. Online. <http://openlearn.open.ac.uk/mod/oucontent/view.php?id=399434§ion=3.2.1> (Accessed Aug. 7, 2012).
“The RESTORE Act”. s. d. Restore the Mississippi River Delta Website. Online. <http://www.mississippiriverdelta.org/restore-the-delta/clean-water-act-penalties/restore-act/> (Ac-cessed Aug. 7, 2012).
Page 90 from 101
Object 1

“Two years after Macondo”. 2012. The Valllourec Oil and Gas Magazine Connection. Online. June, <http://www.connection-mag.com/?p=1262> (Accessed Aug. 7, 2012).
US. Department of Commerce (National Oceanic and Atmospheric Administration). 2010. “Federal Interagency Group Issues Peer-Reviewed 'Oil Budget' Technical Documentation. Oil Spill Calcula-tions Released in August Undergo Further Review”. Online. November 23, <http://www.noaanews.noaa.gov/stories2010/20101123_oilbudget.html> (Accessed Aug. 7, 2012).
US. Department of Commerce (National Oceanic and Atmospheric Administration). s. d. “Bayou Perot Louisiana Oil Well Blowout”. Photography. Online. <http://www.noaawatch.gov/2007/bayou_perot_oilspill.php> (Accessed Aug. 7, 2012).
US. Environmental Protection Agency. 2011. “General Facts about the Gulf of Mexico”. In Environ-mental Protection Agency. Online. (Last updated October 24, 2011), <http://www.epa.gov/gmpo/about/facts.html> (Accessed Aug. 7, 2012).
US. Environmental Protection Agency. 2011. “National Oil and Hazardous Substances Pollution Con-tingency Plan Overview”. Online. (Last updated August 19), <http://www.epa.gov/oem/content/lawsregs/ncpover.htm> (Accessed Aug. 7, 2012).
US. Environmental Protection Agency. 2011. “Oil Pollution Act Overview”. Online. (Last Updated January 28, 2011), <http://www.epa.gov/emergencies/content/lawsregs/opaover.htm> (Accessed Aug. 7, 2012).
US. Fish & Wildlife Service and the NOAA. s. d. “Cumulative Impacts to Wildlife and Actions to Pro-tect Wildlife in the Gulf of Mexico”. Online PDF, 1 page. <http://www.fws.gov/home/dhoilspill/pdfs/CumulativeImpactsBP.pdf> (Accessed Aug. 7, 2012).
US. Fish & Wildlife Service. 2010. “Oil Spill Response”. Online PDF, 1 page. May, <http://www.fws.gov/home/dhoilspill/pdfs/OilSpillFactSheet.pdf> (Accessed Aug. 7, 2012).
US. Fish & Wildlife Service. 2010. “The Natural Resource Damage Assessment and Restoration Pro-gram”. Online PDF, 2 pages. (May), <http://www.fws.gov/contaminants/pdf/USFWSNRDARDHDamageAssesRestFSOMBApproved05062010.pdf > (Accessed Aug. 7, 2012).
VAM. s.d. “World Leader for Premium Connections”. Online. <http://www.vam-usa.com/index.aspx> (Accessed Aug. 7, 2012).
Vick Vanessa. 2012. “Offshore Drilling and Exploration”. The New York Times. Online. March 5, <http://topics.nytimes.com/top/reference/timestopics/subjects/o/offshore_drilling_and_exploration/index.html> (Accessed Aug. 7, 2012).
Walsh Bryan. 2012. “There Will Be Oil—and That’s the Problem”. Times (Science and Space). Online. (March 29), <http://science.time.com/2012/03/29/there-will-be-oil-and-thats-the-problem/> (Accessed Aug. 7, 2012).
Walsh Bryan. 2012. “Nearly Two Years On, Did the BP Oil Spill Have to Happen to BP?”. Times (Sci-ence and Space). Online. April 5, <http://science.time.com/2012/04/05/nearly-two-years-on-did-the-bp-oil-spill-have-to-happen-to-bp/> (Accessed Aug. 7, 2012).
Waxman Henry, Stupak Bart. 2010. “Letter to Tony Hayward, Chief Executive Officer of BP (Rep. Henry Waxman and Rep. Bart Stupak)”. In The Hills Congress Blog. Online. June 15, <http://thehill.com/blogs/congress-blog/energy-a-environment/103255-letter-to-tony-hayward-chief-executive-officer-of-bp-rep-henry-waxman-and-rep-bart-stupak> (Accessed Aug. 7, 2012).
Page 91 from 101

Weinhold Bob. 2010. “Emergency Responder Health: What Have we Learned from Past Disaster?”. Environmental Health Perspectives. Online. Vol. 118, n° 8, August, pp. A346-A350. in Jstor <http://www.jstor.org.ezproxy.ulb.ac.be/> (Accessed Aug. 8, 2012).
Wingert Jean-Luc. 2005. La vie après le pétrole. De la pénurie aux énergies nouvelles Paris : Editions Autrement Frontières, 238 p.
Zeller Tom Jr. 2011. “Oil Spill Commission Action Group Gives Congress Low Grades For Regulat-ory Reform On Drilling”. The HuffingtonPost. Online. (Last Updated August 4), <http://www.huffingtonpost.com/2012/04/17/oil-spill-commission-action-grades_n_1431886.html> (Accessed Aug. 7, 2012).
Page 92 from 101

Annexes
– Annex 1 : Table of Conversion of Some Relevant Measurements
– Annex 2 : History of Offshore Oil and Gas in the United States
– Annex 3 : Laws Affecting OCS Oil and Gas Development
– Annex 4: Various Means to Control and Mitigate the Effects of the Macondo Blowout
– Annex 5: Biodiversity Present in the GoM, According to the Different Coastal and Marine Levels
– Annex 6 . Marine Species in IUCN Threatened Red List Categories of the GoM
– Annex 7 : Recommendations Issued in January 2011, by the National Commission on the BP
Deepwater Horizon Oil Spill and Offshore Drilling
– Annex 8 : Map of Alaska
Annex 1: Table of Conversion of Some Relevant Measurements:
Volumes http://metricunitconversion.globefeed.com/Volume_Conversion_Table.asp
Area http://www.infoplease.com/ipa/A0001661.html
1 cubic foot (ft³) 28.32 liters 1 square foot 929.030 square centimeters
1 gallon (gal) 3.79 liters 1 square mile 258.999 hectares
1 barrel (bbl) 119.24 liters
1 liter (L) 0.0353 (ft³)0.2642 (gal)0.0084 (bbl)
Length http://www.infoplease.com/ipa/A0001661.html
Weight http://www.infoplease.com/ipa/A0001661.html
1 km1 m
0.621 mile 1 ton, net or short
0.907 metric ton
1 foot 0.305 meter 1 pound 453.59 grams
1 mile (statute or land)
5,280 feet1.609 kilometers
1 mile (nautical international
1.852 kilometers1.151 statute miles0.999 U.S. nautical miles
Page 93 from 101
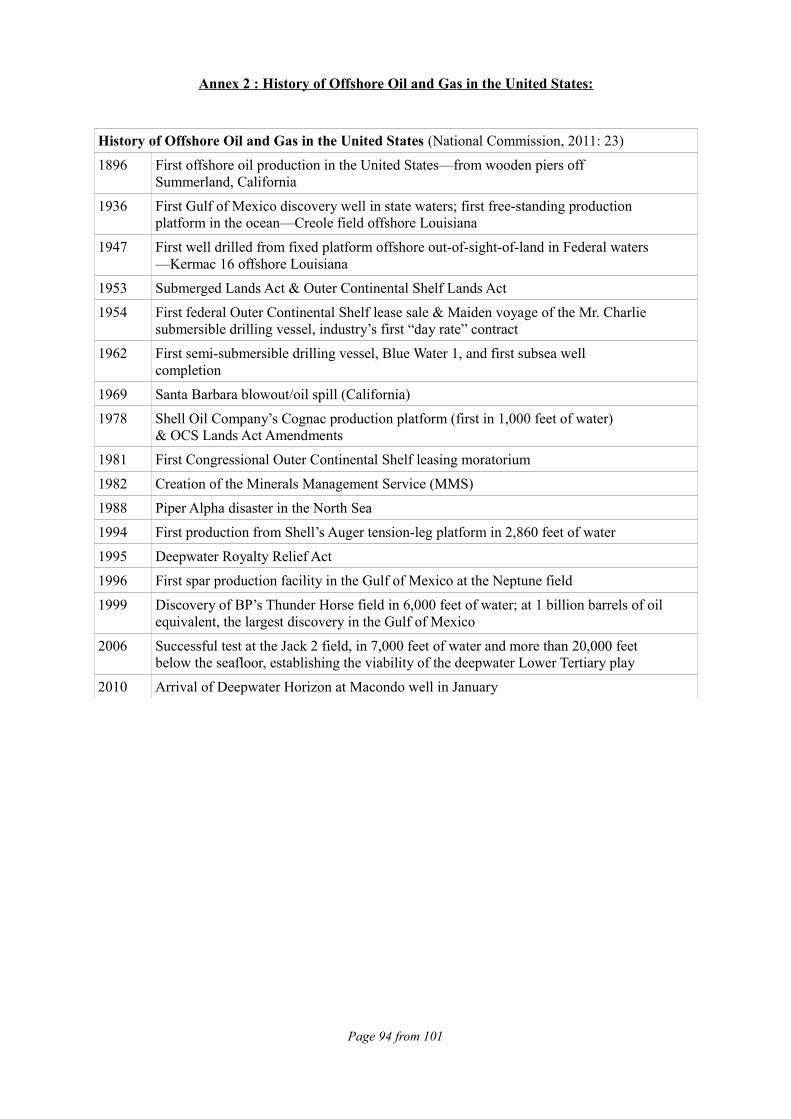
Annex 2 : History of Offshore Oil and Gas in the United States:
History of Offshore Oil and Gas in the United States (National Commission, 2011: 23)
1896 First offshore oil production in the United States—from wooden piers offSummerland, California
1936 First Gulf of Mexico discovery well in state waters; first free-standing productionplatform in the ocean—Creole field offshore Louisiana
1947 First well drilled from fixed platform offshore out-of-sight-of-land in Federal waters—Kermac 16 offshore Louisiana
1953 Submerged Lands Act & Outer Continental Shelf Lands Act
1954 First federal Outer Continental Shelf lease sale & Maiden voyage of the Mr. Charliesubmersible drilling vessel, industry’s first “day rate” contract
1962 First semi-submersible drilling vessel, Blue Water 1, and first subsea wellcompletion
1969 Santa Barbara blowout/oil spill (California)
1978 Shell Oil Company’s Cognac production platform (first in 1,000 feet of water)& OCS Lands Act Amendments
1981 First Congressional Outer Continental Shelf leasing moratorium
1982 Creation of the Minerals Management Service (MMS)
1988 Piper Alpha disaster in the North Sea
1994 First production from Shell’s Auger tension-leg platform in 2,860 feet of water
1995 Deepwater Royalty Relief Act
1996 First spar production facility in the Gulf of Mexico at the Neptune field
1999 Discovery of BP’s Thunder Horse field in 6,000 feet of water; at 1 billion barrels of oilequivalent, the largest discovery in the Gulf of Mexico
2006 Successful test at the Jack 2 field, in 7,000 feet of water and more than 20,000 feetbelow the seafloor, establishing the viability of the deepwater Lower Tertiary play
2010 Arrival of Deepwater Horizon at Macondo well in January
Page 94 from 101

Annex 3: Laws Affecting OCS Oil and Gas Development:
(Burroughs, 2011: 57)
Page 95 from 101

Annex 4: Various Means to Control and Mitigate the Effects of the Macondo Blowout:
(Atlas and Hazen, 2011: 4)
Page 96 from 101

Annex 5: Biodiversity Present in the GoM, According to the Different Coastal and Marine Levels: (National Geographic, s. d.)
Page 97 from 101
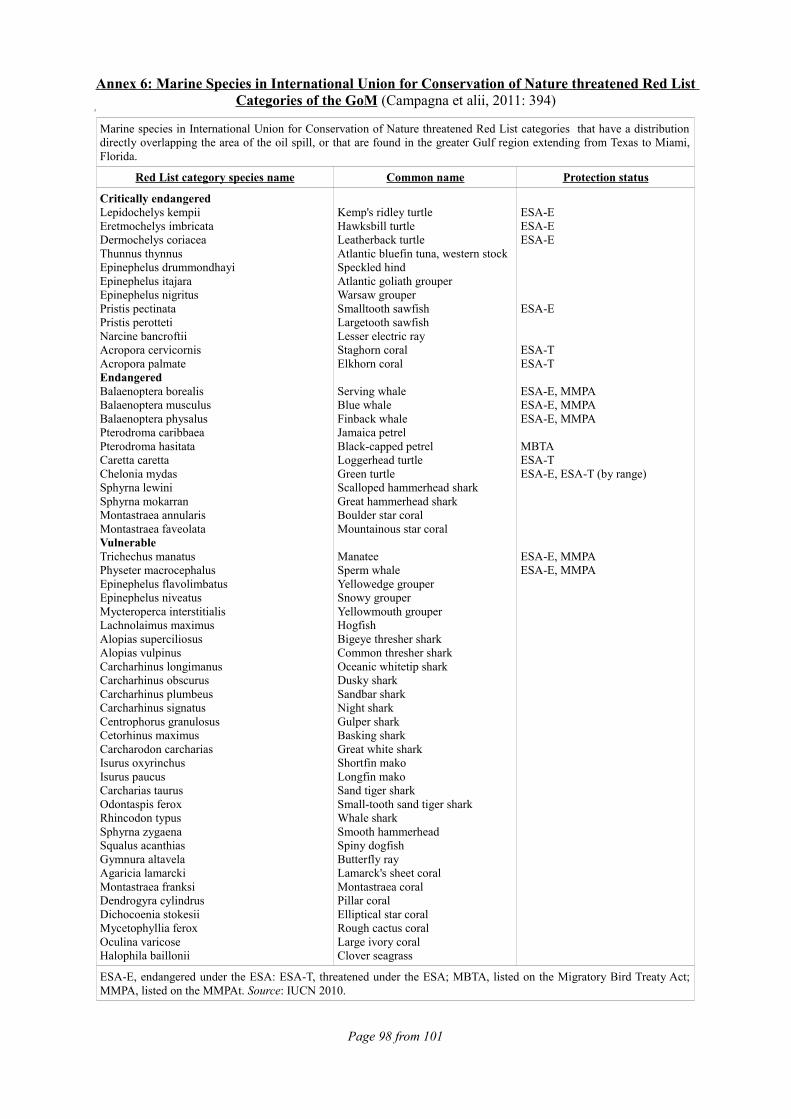
Annex 6: Marine Species in International Union for Conservation of Nature threatened Red List Categories of the GoM (Campagna et alii, 2011: 394)
2
Marine species in International Union for Conservation of Nature threatened Red List categories that have a distribution directly overlapping the area of the oil spill, or that are found in the greater Gulf region extending from Texas to Miami, Florida.
Red List category species name Common name Protection status
Critically endangeredLepidochelys kempiiEretmochelys imbricataDermochelys coriaceaThunnus thynnusEpinephelus drummondhayiEpinephelus itajaraEpinephelus nigritusPristis pectinataPristis perottetiNarcine bancroftiiAcropora cervicornisAcropora palmateEndangeredBalaenoptera borealisBalaenoptera musculusBalaenoptera physalusPterodroma caribbaeaPterodroma hasitataCaretta carettaChelonia mydasSphyrna lewiniSphyrna mokarranMontastraea annularisMontastraea faveolataVulnerableTrichechus manatusPhyseter macrocephalusEpinephelus flavolimbatusEpinephelus niveatusMycteroperca interstitialisLachnolaimus maximusAlopias superciliosusAlopias vulpinusCarcharhinus longimanusCarcharhinus obscurusCarcharhinus plumbeusCarcharhinus signatusCentrophorus granulosusCetorhinus maximusCarcharodon carchariasIsurus oxyrinchusIsurus paucusCarcharias taurusOdontaspis feroxRhincodon typusSphyrna zygaenaSqualus acanthiasGymnura altavelaAgaricia lamarckiMontastraea franksiDendrogyra cylindrusDichocoenia stokesiiMycetophyllia feroxOculina varicoseHalophila baillonii
Kemp's ridley turtleHawksbill turtleLeatherback turtleAtlantic bluefin tuna, western stockSpeckled hindAtlantic goliath grouperWarsaw grouperSmalltooth sawfishLargetooth sawfishLesser electric rayStaghorn coral Elkhorn coral
Serving whaleBlue whaleFinback whaleJamaica petrelBlack-capped petrelLoggerhead turtleGreen turtleScalloped hammerhead sharkGreat hammerhead sharkBoulder star coralMountainous star coral
ManateeSperm whaleYellowedge grouperSnowy grouperYellowmouth grouperHogfishBigeye thresher sharkCommon thresher sharkOceanic whitetip sharkDusky sharkSandbar sharkNight sharkGulper sharkBasking sharkGreat white sharkShortfin makoLongfin makoSand tiger sharkSmall-tooth sand tiger sharkWhale sharkSmooth hammerheadSpiny dogfishButterfly rayLamarck's sheet coralMontastraea coral Pillar coralElliptical star coralRough cactus coralLarge ivory coralClover seagrass
ESA-EESA-EESA-E
ESA-E
ESA-TESA-T
ESA-E, MMPAESA-E, MMPAESA-E, MMPA
MBTAESA-TESA-E, ESA-T (by range)
ESA-E, MMPAESA-E, MMPA
ESA-E, endangered under the ESA: ESA-T, threatened under the ESA; MBTA, listed on the Migratory Bird Treaty Act; MMPA, listed on the MMPAt. Source: IUCN 2010.
Page 98 from 101

Annex 7: Recommendations Issued in January 2011, by the National Commission on the BP Deepwater Horizon Oil Spill and Offshore Drilling: (National Commission, 2011: 252-290)
A Improving the Safety of Offshore Operations
A1: The Department of the Interior should supplement the risk-management program with pre-scriptive safety and pollution-prevention standards that are developed and selected in consulta-tion with international regulatory peers and that are at least as rigorous as the leasing terms and regulatory requirements in peer oil-producing nations.
A2: The Department of the Interior should develop a proactive, risk-based performance approach specific to individual facilities, operations and environments, similar to the “safety case” ap-proach in the North Sea.
A3: Working with the International Regulators’ Forum and other organizations, Congress and the Department of the Interior should identify those drilling, production, and emergency-response standards that best protect offshore workers and the environment, and initiate new standards and revisions to fill gaps and correct deficiencies. These standards should be applied throughout the Gulf of Mexico, in the Arctic, and globally wherever the international industry operates. Stand-ards should be updated at least every five years as under the formal review process of the Inter-national Organization for Standardization (ISO)
A4: Congress and the Department of the Interior should create an independent agency within the Department of the Interior with enforcement authority to oversee all aspects of offshore drilling safety (operational and occupational), as well as the structural and operational integrity of all off-shore energy production facilities, including both oil and gas production and renewable energy production.
A5: Congress and the Department of the Interior should provide a mechanism, including the use of lease provisions for the payment of regulatory fees, for adequate, stable, and secure funding to the key regulatory agencies—Interior, Coast Guard, and NOAA—to ensure that they can per-form their duties, expedite permits and reviews as needed, and hire experienced engineers, in-spectors, scientists, and first responders. (See Recommendation G2.)
B. Safeguarding the Environment
B1: The Council on Environmental Quality and the Department of the Interior should revise and strengthen the NEPA policies, practices, and procedures to improve the level of environmental analysis, transparency, and consistency at all stages of the OCS planning, leasing, exploration, and development process.
B2: The Department of the Interior should reduce risk to the environment from OCS oil and gas activities by strengthening science and interagency consultations in the OCS oil and gas de-cision-making process.
B3: Congress, by enacting legislation, and the Department of the Interior, through its lease provi -sion, should require the oil and gas industry to pay fees that support environmental science and regulatory review related to OCS oil and gas activities to enable cooperating agencies to carry out these responsibilities. (See Recommendation G2.)
C. Strengthening Oil Spill Response, Plan-ning, and Capacity
C1: The Department of the Interior should create a rigorous, transparent, and meaningful oil spill risk analysis and planning process for the development and implementation of better oil spill re-sponse
C2: EPA and the Coast Guard should establish distinct plans and procedures for responding to a “Spill of National Significance.”
C3: EPA and the Coast Guard should bolster state and local involvement in oil spill contingency planning and training and create a mechanism for local involvement in spill planning and re-sponse similar to the Regional Citizens’ Advisory Councils mandated by the Oil Pollution Act of 1990
C4: Congress should provide mandatory funding for oil spill response research and development and provide incentives for private-sector research and development.
.C5: EPA should update and periodically review its dispersant testing protocols for product list-ing or pre-approval, and modify the pre-approval process to include temporal duration, spatial reach, and volume of the spill.
C6: The Coast Guard should issue guidance to establish that offshore barrier berms and similar dredged barriers generally will not be authorized as an oil spill response measure in the National Contingency Plan or any Area Contingency Plan.
D. Advancing Well- D1: The National Response Team should develop and maintain expertise within the Federal gov-ernment to oversee source-control efforts.
Page 99 from 101

Containment Capab-ilities
D2: The Department of the Interior should require offshore operators to provide detailed plans for source control as part of their oil spill response plans and applications for permits to drill.
D3: The National Response Team should develop and maintain expertise within the federal gov-ernment to obtain accurate estimates of flow rate or spill volume early in a source-control effort.
D4: The Department of the Interior should require offshore operators seeking its approval of pro-posed well design to demonstrate that:• Well components, including blowout preventer stacks, are equipped with sensors or other tools to obtain accurate diagnostic information—for example, regarding pressures and the position of blowout preventer rams.• Wells are designed to mitigate risks to well integrity during post-blowout containment efforts.
E. Overcoming the Impacts of the Deep-water Horizon Spill and Restoring the Gulf
E1: The Coast Guard, through the Federal On-Scene Coordinator, should provide scientists with timely access to the response zone so that they can conduct independent scientific research dur-ing an oil spill response and long-term monitoring in the future.
E2: The Trustees for Natural Resources should ensure that compensatory restoration under the Natural Resource Damage Assessment process is transparent and appropriate.
E3: EPA should develop distinct plans and procedures to address human health impacts during a Spill of National Significance.
E4: Congress, federal agencies, and responsible parties should take steps to restore consumer confidence in the aftermath of a Spill of National Significance.
E5: Congress should dedicate 80 percent of the Clean Water Act penalties to longterm restoration of the Gulf of Mexico
E6: Congress and federal and state agencies should build the organizational, financial, scientific, and public outreach capacities needed to put the restoration effort on a strong footing.
E7: The appropriate federal agencies, including EPA, Interior, and NOAA, and the Trustees for Natural Resources should better balance the myriad economic and environmental interests con-centrated in the Gulf region going forward. This would include improved monitoring and in-creased use of sophisticated tools like coastal and marine spatial planning. Many of these tools and capacities will also be important to manage areas of the OCS outside the Gulf.
F. Ensuring Finan-cial Responsibility
F1: Congress should significantly increase the liability cap and financial responsibility require-ments for offshore facilities.
F2: Congress should increase the limit on per-incident payouts from the Oil Spill Liability Trust Fund.
F3: The Department of the Interior should enhance auditing and evaluation of the risk of offshore drilling activities by individual participants (operator, driller, other service companies). The De-partment of the Interior, insurance underwriters, or other independent entities should evaluate and monitor the risk of offshore drilling activities to promote enhanced risk management in off-shore operations and to discourage unqualified companies from remaining in the market.
F4: The Department of Justice’s Office of Dispute Resolution should conduct an evaluation of the Gulf Coast Claims Facility once all claims have been paid out, in order to inform claims pro-cesses in future Spills of National Significance. The evaluation should include a review of the process, the guidelines used for compensation, and the success rate for avoiding law suits.
G. Promoting Con-gressional Engage-ment to Ensure Re-sponsible Offshore Drilling
G1: Increase and maintain congressional awareness of the risks of offshore drilling in two ways. First, create additional congressional oversight of offshore safety and environmental risks. Second, require the appropriate congressional committees to hold an annual oversight hearing on the state of technology, application of process safety, and environmental protection to ensure these issues receive continuing congressional attention.
G2: Congress should enact legislation creating a mechanism for offshore oil and gas operators to provide ongoing and regular funding of the agencies regulating offshore oil and gas develop-ment.
Page 100 from 101

Annex 8: Map of Alaska: (Enchanted Learning, s.d.)
Page 101 from 101