the decimal system tracker v5 - primarytools.co.ukprimarytools.co.uk/files/curriculum...
TRANSCRIPT

The Decimal System Tracker
v5.2
The Class Progress Graph

2
© 2015 PrimaryTools.co.uk v5.2
Contents:
1 Introduction
1.1 History of the Tracker
1.2 Highlights
1.3 The Decimal System – an Overview
1.4 Progress
1.5 Targets
2 Using the Tracking System
2.1 The Decimal System Tracking System
2.2 Requirements
2.3 The Settings Tab
2.4 The Data Sheet Tab
2.5 Expectations Summary Tab
2.6 Filtered Report Tab
2.7 Year Group Progress Graph Tab
2.8 Class Progress Graph Tab
2.9 Current Overview Tab
2.10 Decimal Score Progress Tab
2.11 School Overview Tab
3 General Functionality
3.1 P-Scales and EYFS Data
3.2 Printing
3.3 Adding/Removing Pupils
3.4 Filtering
4 Important Information
4.1 Terms of Use
4.2 Support
4.3 Updates
5 Other Information
5.1 Appendices
5.2 FAQ
Filtered Report

3
© 2015 PrimaryTools.co.uk v5.2
1.1 History of the Tracker
The tracker has evolved over 3 years and was originally used to track point scores under the old National Curriculum
(pre 2014). It used to track reading, writing and mathematics although this version has been simplified to track just
one of these (see Settings to switch subjects) and has been adapted to use decimal scores rather than point scores.
1.2 Highlights:
Highlights are the powerful ‘Filtered Reports’ tab that responds to any number of filters in the ‘Data Sheet’. This
enables you to quickly analyse any group whether it be a class, year group, SEN, gender, EAL, a specific intervention
or any combination you need to. It is almost like a mini RaiseOnline tool but with the ability to look at all year groups
rather than at the end of Key Stages.
1.3 The Decimal System – an Overview
The tracking system should be used alongside the Assessment Sheets (above is an example of the writing sheets)
found on the PrimaryTools.co.uk website. These checklists, for each year group, convert criteria into a decimal score.
The score would look something like this: 3.5. The 3 represents that the pupil is working within the Year 3 criteria,
and the .5 shows they are at expected level (see table below). The decimal allows for fine tracking of progress. Full
details and example can be found at PrimaryTools.co.uk. It is possible to edit the sheets should you wish to
customise them to your own needs.
Emerging if… Expected if… Exceeding if…
.0 to .3 0.4 to .6 .7 to .9

4
© 2015 PrimaryTools.co.uk v5.2
1.4 Progress
You should expect to see smooth progress of pupils across an academic year. However it differs slightly from the
older ‘level’ system of the pre 2014 National Curriculum during transition of year groups.
Adequate progress is seen as making progress of +1.0 from year end to year end. For example, if a pupil is 2.7 (year 2
lower exceeding) at the end of year 2, they should be 3.7 (year 3 lower exceeding) at the end of year 3. Anything
above this should be seen as ‘good progress’, or less than this ‘less than adequate’.
This may mean a big jump from the end of a year group to the start of the next. For example, a pupil may finish year
2 at 2.7 (year 2 lower exceeding), and after Autumn’s first assessment be 3.2 (year 3 mid emerging). This would be a
jump of +0.5. However it should be kept in mind that by the end of year, adequate progress for that child would be
for them to attain a target decimal score of 3.7 (+1).
1.5 Targets
The system also provides reports on cohorts and shows how classes and year groups are working towards these
targets. You would expect a large number of pupils to be at the emerging stage at the start of an academic year, but
by the end, as more pupils reach expected and exceeding standards, this would reduce. Schools can set targets for
both individuals and classes/cohorts using this information. See the Class and Year Group Progress Graphs tabs in the
system or there is more information below.
Expectations Summary Table

5
© 2015 PrimaryTools.co.uk v5.2
2.1 The Decimal System Tracking System
The following is guidance on how to use the tracking system and what can be done on each Tab (these appear at the
bottom of the screen and are used to switch between sheets). The spreadsheet has much of the following guidance
built in, although this document goes into more detail. Look for and click on the green and red cells at the top of each
part of the spreadsheet for on screen help.
2.2 Requirements
The system was built using Excel 2010 and so may not be compatible with earlier versions. For it to work fully,
macros should be enabled.
2.3 Settings Tab
All of the information on this page can be edited although it is highly recommended that it is not apart from the
following. The system can manage a school with up to 4 forms and approximately 1100 pupils, and class codes
should be the only part that should be altered.
It is here you can change your subject between writing (default), reading and maths. This simply changes some of
the language in the rest of the workbook, and the some of the colours used on the headings.
2.4 Data Sheet Tab (editable columns have a green header, non-editable are in red)
2.4.1 Personal Information - Editable
It is best to import this data from your management system.
You can add new pupils at the bottom of the list then press the Sort Pupils button.
If you want to remove a pupil, right click the row number on the left and select delete row.
For the system to work properly, at a minimum, first name, surname, year group and class should be input.
Pupil forenames are shaded grey to give a quick indication of being pupil premium.
2.4.2 Personal Information - Non-editable
These fields are automatically updated and converts date of birth into current age and general ethnicity.
2.4.3 Interventions and Groups - Editable
Change the title of the group in the green header (for example change 'a' to 'spelling booster' or 'gifted and
talented') then enter a code of your choosing next to the pupil's name. Try to keep the code consistent for all pupils
in the group; this will help when filtering later.
2.4.4 Rank Pupils - Non-editable
This automatically ranks pupils in the whole school based on their latest assessment data.
2.4.5 Most up to date DS (Decimal System) score - Non-editable
This looks for the most recent score for a pupil and places it in this column.

6
© 2015 PrimaryTools.co.uk v5.2
2.4.6 Most up to date level - Non-editable
This converts the decimal system score into a level.
The number represents the year group
+ is exceeding
= is expected
- is emerging
p scale will appear p plus the scale number.
2.4.7 At age expected? - Non-editable
The icons gives a quick indication to whether the pupil is meeting or working towards age expectations. The green
shows meeting, amber shows they are working towards, and red shows they are in danger of not meeting the
expectations.
2.4.8 Previous Year Progress - Non-editable
This calculates and presents the progress within a pupil’s previous year group. For example, if a pupil is currently in
year 3, it will subtract the end of year 1 score from the end of year 2 score. Adequate progress would be +1.0 from
year to year although p-scales and ELGs will not work this way but still be presented as a decimal score.
2.4.9 Ability low/middle/high - Non-editable
This uses the Year Group Ranking (column to the right) and works out if the pupil is in the top third (h), middle third
(m) or lower third (l) of the year group.
2.4.10 Year Group Ranking - Non-editable
This differs from the 'Rank Pupils' column as it ranks pupils within the year group and not the whole school.
2.4.11 Current Academic Year Data - Non-editable
These columns display the progress across the current academic year. A green shade show progress from the
previous term’s assessment, yellow shows no progress and red would show a regression.
The 'Progress since End of Previous Year Column' takes the previous end of year score and subtracts it from the latest
assessment data. For example, if a pupil was 2.4 at the end of year 2, and is 3.3 at the latest assessment in year 3,
then it will show a difference of +0.9. +1.0 should be seen as adequate progress. Green shading show above
adequate progress, orange/yellow adequate and red below adequate progress.
2.4.12 Current Academic Year Level - Non-editable
This converts the above decimal system scores into a level.
The number represents the year group
+ is exceeding
7
© 2015 PrimaryTools.co.uk v5.2
= is expected
- is emerging
p scale will appear p plus the scale number.
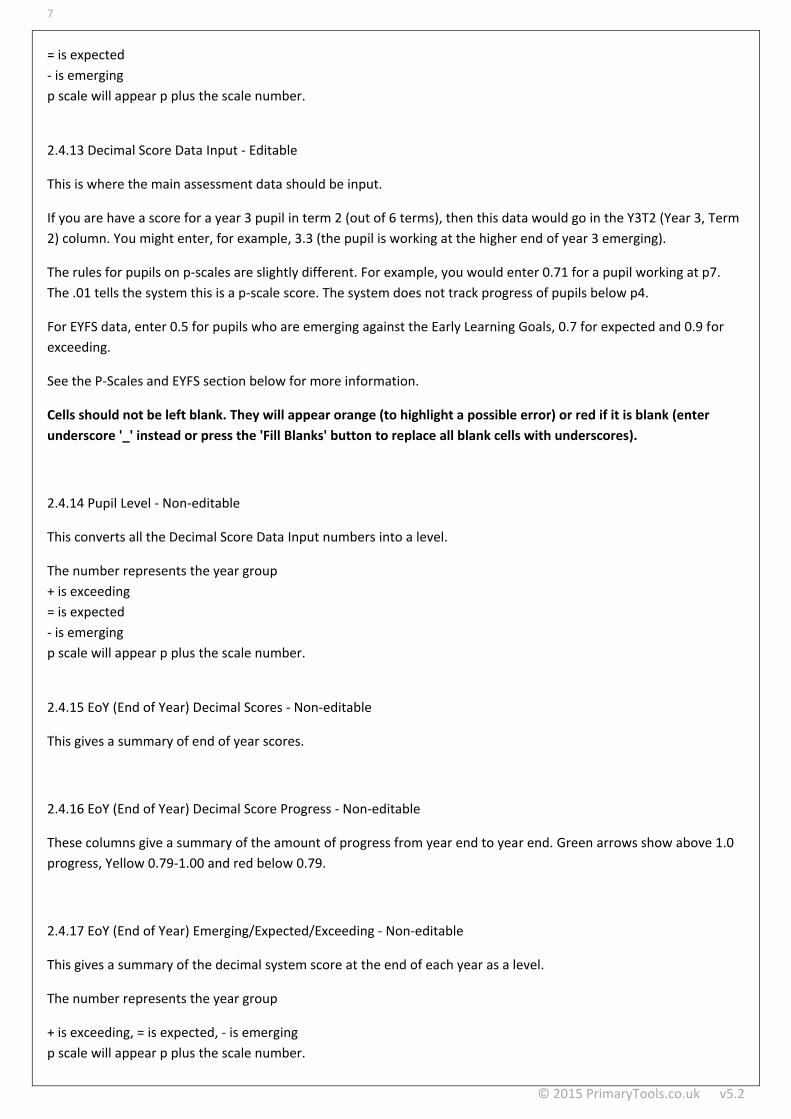
2.4.13 Decimal Score Data Input - Editable
This is where the main assessment data should be input.
If you are have a score for a year 3 pupil in term 2 (out of 6 terms), then this data would go in the Y3T2 (Year 3, Term
2) column. You might enter, for example, 3.3 (the pupil is working at the higher end of year 3 emerging).
The rules for pupils on p-scales are slightly different. For example, you would enter 0.71 for a pupil working at p7.
The .01 tells the system this is a p-scale score. The system does not track progress of pupils below p4.
For EYFS data, enter 0.5 for pupils who are emerging against the Early Learning Goals, 0.7 for expected and 0.9 for
exceeding.
See the P-Scales and EYFS section below for more information.
Cells should not be left blank. They will appear orange (to highlight a possible error) or red if it is blank (enter
underscore '_' instead or press the 'Fill Blanks' button to replace all blank cells with underscores).
2.4.14 Pupil Level - Non-editable
This converts all the Decimal Score Data Input numbers into a level.
The number represents the year group
+ is exceeding
= is expected
- is emerging
p scale will appear p plus the scale number.
2.4.15 EoY (End of Year) Decimal Scores - Non-editable
This gives a summary of end of year scores.
2.4.16 EoY (End of Year) Decimal Score Progress - Non-editable
These columns give a summary of the amount of progress from year end to year end. Green arrows show above 1.0
progress, Yellow 0.79-1.00 and red below 0.79.
2.4.17 EoY (End of Year) Emerging/Expected/Exceeding - Non-editable
This gives a summary of the decimal system score at the end of each year as a level.
The number represents the year group
+ is exceeding, = is expected, - is emerging
p scale will appear p plus the scale number.
8
© 2015 PrimaryTools.co.uk v5.2
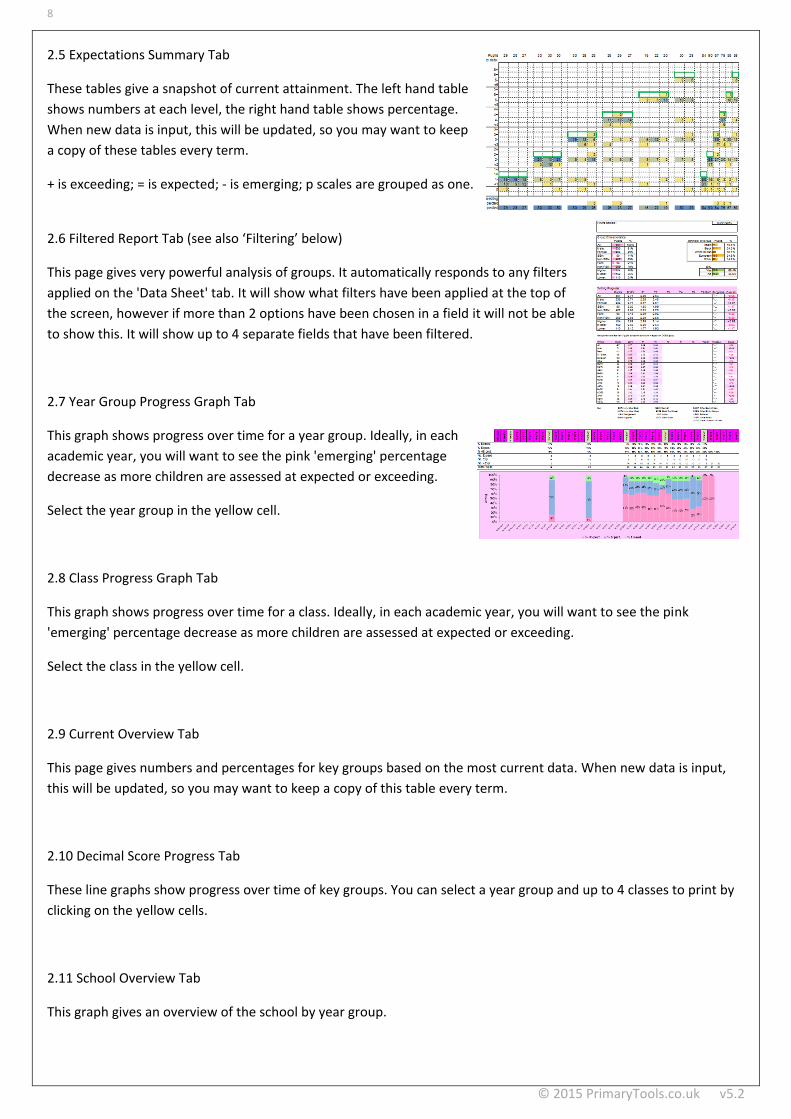
2.5 Expectations Summary Tab
These tables give a snapshot of current attainment. The left hand table
shows numbers at each level, the right hand table shows percentage.
When new data is input, this will be updated, so you may want to keep
a copy of these tables every term.
+ is exceeding; = is expected; - is emerging; p scales are grouped as one.
2.6 Filtered Report Tab (see also ‘Filtering’ below)
This page gives very powerful analysis of groups. It automatically responds to any filters
applied on the 'Data Sheet' tab. It will show what filters have been applied at the top of
the screen, however if more than 2 options have been chosen in a field it will not be able
to show this. It will show up to 4 separate fields that have been filtered.
2.7 Year Group Progress Graph Tab
This graph shows progress over time for a year group. Ideally, in each
academic year, you will want to see the pink 'emerging' percentage
decrease as more children are assessed at expected or exceeding.
Select the year group in the yellow cell.
2.8 Class Progress Graph Tab
This graph shows progress over time for a class. Ideally, in each academic year, you will want to see the pink
'emerging' percentage decrease as more children are assessed at expected or exceeding.
Select the class in the yellow cell.
2.9 Current Overview Tab
This page gives numbers and percentages for key groups based on the most current data. When new data is input,
this will be updated, so you may want to keep a copy of this table every term.
2.10 Decimal Score Progress Tab
These line graphs show progress over time of key groups. You can select a year group and up to 4 classes to print by
clicking on the yellow cells.
2.11 School Overview Tab
This graph gives an overview of the school by year group.

9
© 2015 PrimaryTools.co.uk v5.2
3.1 P-Scales and EYFS Data
The system is mainly built to track progress of pupils working towards the expectations set out in the National
Curriculum. It is however able to track P-Scales data. To track progress from end of EYFS to the National Curriculum,
you are also able to input Early Learning Goals for the end of Reception. See the table in the appendix for how to
input this or see the data input section above.
3.2 Printing
Most sheets have been set up to print nicely onto A4. It is less easy to do this with the Data Sheet which contains
many columns of data. You can adjust the print settings by using the standard in built Excel tools (Go to View – and
select Page Break Preview) and drag the blue lines to show what you want printed. The sheet is set up to always print
name, class and year group, and also the column headings.
To simplify the printing process, you can choose the ‘Set Key Print’ button, which will set itself up to print the most
useful columns (mainly the data for the current academic year). This works well if you filter a class first as well as the
print should fit all on one A4 sheet. If you choose the ‘Set All Print’ button, it will set itself up to print almost
everything and it is wise to do a print preview first to make sure it is what you require.
3.3 Adding/Removing Pupils
To add a pupil, simply add their personal data to the bottom of the list of pupils. Assuming you have included the
class and year group, when you press the ‘Sort Pupils’ button, it will put the pupil in the list with the rest of their
class. It sorts in order by year group, class, first name and finally surname.
To delete a pupil simply right click the row number on the edge of the spreadsheet and select delete row. This
cannot be undone so make sure you have the recommended backups and you are sure this is what you want to do.
3.4 Filtering
Under each heading of the Data Sheet is a grey row with small triangles. Click on these to begin filtering. You can
filter any of the columns you wish. Whenever a filter is applied, the information in the ‘Filtered Report’ tab is
automatically updated. This is very useful if you want to see the progress of pupils in a particular class, year group,
intervention or any of the columns on the Data Sheet. You can also apply multiple filters (for example you might
want to look at White British boys in upper Key Stage 2 which would require 3 filters). Filtering may take a few
moments before it updates the ‘Filtered Report’ or any of the graphs. The sheets will not print until the system has
completed recalculating after applying any filters.

10
© 2015 PrimaryTools.co.uk v5.2
4.1 Terms of Use
The tracking system is free and openly available from PrimaryTools.co.uk. PrimaryTools.co.uk retains the copyright to
the system and amendments to the tracking system are not permitted. The system has protection built in for two
main reasons: to prevent accidental corruption of the formulae and to prevent the owner’s work from being copied.
You should keep regular back-ups of the system as is good practice with any documentation, and PrimaryTools.co.uk
is not responsible for any loss of data or system break down.
4.2 Support
This guide aims to cover the main features of the tracking system and how it can be used. Any queries can be
emailed to PrimaryTools.co.uk at this address: [email protected] or by using the contact form in the website.
Replies can be expected the same day or within 24 hours. Major requests for support (for example the request for
new features) may be subject to a charge based on the time to taken to implement the feature (a quote would be
given for this), it would also be understood that the feature will be available to all once completed.
4.3 Updates
The system will be improved and new features added. Stay up to date by following Primary Tools through links on
the website (by mailing list, facebook and twitter).
11
© 2015 PrimaryTools.co.uk v5.2
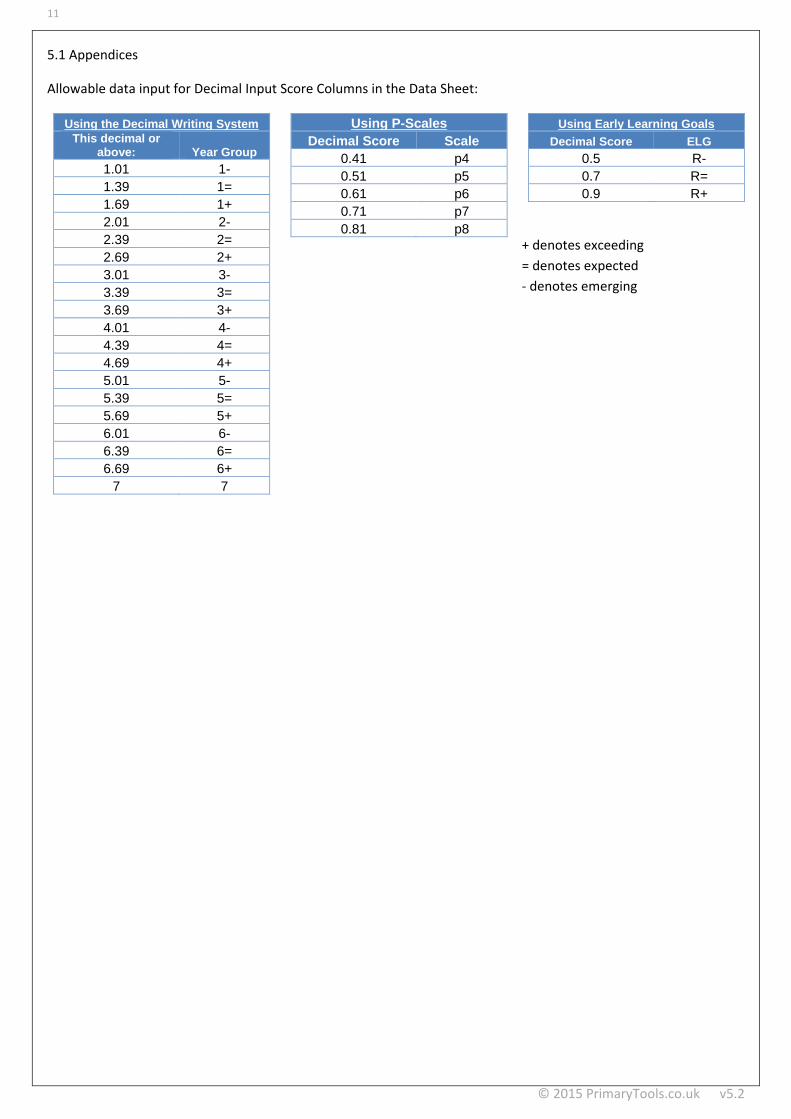
5.1 Appendices
Allowable data input for Decimal Input Score Columns in the Data Sheet:
Using the Decimal Writing System
This decimal or above: Year Group
1.01 1-
1.39 1=
1.69 1+
2.01 2-
2.39 2=
2.69 2+
3.01 3-
3.39 3=
3.69 3+
4.01 4-
4.39 4=
4.69 4+
5.01 5-
5.39 5=
5.69 5+
6.01 6-
6.39 6=
6.69 6+
7 7
Using P-Scales
Decimal Score Scale
0.41 p4
0.51 p5
0.61 p6
0.71 p7
0.81 p8
Using Early Learning Goals
Decimal Score ELG
0.5 R-
0.7 R=
0.9 R+
+ denotes exceeding
= denotes expected
- denotes emerging

12
© 2015 PrimaryTools.co.uk v5.2
5.2 FAQ (this will be updated with common questions)
Will there be a version for mathematics?
Yes, quite soon.
Why is it free?
The Assessment Sheets and Target Bookmarks that go along with the system are not free and so income is generated
through these.
Why is there data in the sheet when you download it?
This is fictional data that is there so people can immediately have a go at using the system and see how it works. You
will need to delete the personal information and the data input before using your own data.
Target Bookmarks for the Decimal Writing System