the decade ahead - wealth management usa · the decade ahead february 2011 3 introduction make...
TRANSCRIPT

China asserts
Energytransforms
Emerging markets ascend
In� ation reemerges
USleadership endures
Stocks deliver
Philanthropy impacts
Healthcareheals
Technology permeates
Emerging consumers
spend
Geopolitics disrupt
Bonds disappoint
Ab
The Decade Ahead
Our views on important trends that will impact your investments over the next ten years
Wealth Management Research
ContentsEditorial . . . . . . . . . . . . . . . . . . . . . . . . . . . . . . . . . . . . . . . . . . . . . . . . . . . . . . . . . . . . . . . . . . . 1
Introduction . . . . . . . . . . . . . . . . . . . . . . . . . . . . . . . . . . . . . . . . . . . . . . . . . . . . . . . . . . . . . . 2
Investment conclusions . . . . . . . . . . . . . . . . . . . . . . . . . . . . . . . . . . . . . . . . . . . . . . . . . 6
United States: still the leader of the pack . . . . . . . . . . . . . . . . . . . . . . . 8
China: � exing its muscles . . . . . . . . . . . . . . . . . . . . . . . . . . . . . . . . . . . . . . . . . 16
Geopolitics: the blind side . . . . . . . . . . . . . . . . . . . . . . . . . . . . . . . . . . . . . . . . 23
Emerging markets: the next big allocation shi� . . . . . . . . . . . . . . 28
Emerging consumers: more people, more money . . . . . . . . . . . . 35
Energy: alternatives threaten oil’s dominance . . . . . . . . . . . . . . . . 41
Technology: productivity and vulnerability . . . . . . . . . . . . . . . . . . . . 46
Healthcare: from healing to � xing . . . . . . . . . . . . . . . . . . . . . . . . . . . . . . 52
In� ation: the next wave takes shape . . . . . . . . . . . . . . . . . . . . . . . . . . . 57
Stocks: no repeat of the lost decade . . . . . . . . . . . . . . . . . . . . . . . . . . . . 63
Bonds: the elusive quest for a safe haven . . . . . . . . . . . . . . . . . . . . . 68
Philanthropy: makes an impact . . . . . . . . . . . . . . . . . . . . . . . . . . . . . . . . . . 76
Endnotes . . . . . . . . . . . . . . . . . . . . . . . . . . . . . . . . . . . . . . . . . . . . . . . . . . . . . . . . . . . . . . . . . 82
Acknowledgements . . . . . . . . . . . . . . . . . . . . . . . . . . . . . . . . . . . . . . . . . . . . . . . . . . . . 85
2 2011 Outlook
Publication details
Publisher UBS Financial Services Inc.Wealth Management Research1285 Avenue of the Americas, 13th Floor New York, NY 10019
This report has been prepared by UBS Financial Services Inc. (“UBS FS”). Please see important disclaimer and disclosures at the end of the document.
This report was published on 7 February 2011.
Editor in ChiefKurt E. Reiman
Authors (in alphabetical order)Thomas BernerAnne BrigliaJerry BrimeyerNicole DeckerSally DesslochRobert FaulknerStephen FreedmanKatherine KlingensmithDavid Le� owitzAlexandra MahoneyThomas McLoughlinKurt E. ReimanMike RyanJeremy Zirin
Research AssistantsAdam AkantChris Protasewich
EditorMarcy Tolko�
Desktop Publishing George StilabowerLisa Klausing
Project ManagementPaul LeemingJohn BellomoZach Graumann
Video feature: To watch Kurt Reiman, Head of Thematic Research, give a summary of the Decade Ahead report, please click here.

Editorial
Dear readers,
Since the global � nancial crisis came to a � tful and uneasy conclusion, the economy has undergone a broad-based recovery and � nancial markets rebounded amid one of the most aggressive policy responses in modern history. Yet despite the commitment of policymakers to ensure a more sustainable expansion, many investors remain deeply apprehensive about the future.
This anxiety is certainly understandable given the events that have transpired over the past three and one-half years. But it is also a function of current structural problems that range from unsustain-ably high public and private debt burdens in developed nations, to escalating in� ation pressures in the developing world, to rising social tensions from the widening of income inequality within many nations. It’s no wonder then that so many look to tomorrow with a certain sense of dread.
But to view the future with trepidation alone would be a mistake. Despite challenges that likely lie before us, extraordinary opportuni-ties abound as well. The world is changing rapidly. As it does, new industries are emerging, living standards are rising and wealth is being created. In this report, we map out the key trends that we believe will drive that change and transform our world in the decade ahead. To be sure, not all of these trends will be so warmly received. What might be seen as a bene� t to one nation, industry or socio-economic group could be viewed more warily by others. But understanding how these trends may play out will be critical to leveraging the investment opportunities that will emerge as a result. So as you read on, think of the glass as neither half full nor half empty, but rather see the water in the glass as a way to make crops grow, a nuclear system cool or a hydroelectric power plant run.
Mike Ryan, CFAChief Investment StrategistHead, Wealth Management Research – Americas
Kurt E. Reiman
Mike Ryan
Kurt E. ReimanHead, Thematic ResearchWealth Management Research – Americas
The Decade Ahead February 2011 1

2 February 2011 The Decade Ahead
The decade ahead
The dawn of a new decadeTen years from now when historians, cultural crit-ics, economists and the rest of the world look back on the decade spanning 2011 through 2020, how will they choose to categorize it?
Will this be a replay of the explosive growth – but also wasteful decadence – that marked the Roaring 20s, or will we see a return to the depressingly dark days of economic collapse that de� ned the Dirty 30s? Will we see the sort of sweeping social changes that were ushered in during the Turbulent 60s, or the economic stag-nation and � nancial market volatility that marked the Unsettled 70s? Will we witness another rebirth of productivity and a downsizing of gov-ernment that helped to de� ne the Great 80s, or will we simply hit the rewind button and experi-ence another lost decade amid unsustainable eco-nomic imbalances and an expansive public sector similar to the Aughties?
To be fair, no decade is as easily de� ned and cat-egorized as these labels might suggest. There are o� en many con� icting social, economic, techno-logical and cultural crosscurrents that are impos-sible to capture in any single descriptive word or phrase. Each period is marked instead by a con� u-ence of events and trends that defy such overly simplistic classi� cations. Even the decade itself is an arbitrary timeframe, meant to conform more to the way people chronicle their lives rather than the manner in which history chooses to in� uence them. Yet the beginnings and endings of decades a� ord an opportunity to re� ect upon what has happened, assess the impact of these changes on society at large, and ponder the trends and inno-vations that may emerge over the next 10 years to transform the world yet again.
So with a new decade now upon us, we thought it timely to o� er our own take on what the future may hold for investors. In this report, we highlight the critical developments that we believe will have a material impact on the real economy, � nancial markets and public policy decisions in the decade
ahead. To be sure, none of us possesses a crystal ball. Some of the forecasts we present here are likely to fall wide of the mark, while others will fail to go far enough in conceptualizing how radi-cally the world will change. The last decade, for example, began with widespread optimism about the Internet’s untapped potential to transform our
lives but was temporarily short-circuited by the implosion of the tech bubble and the 9/11 terror-ist attacks. Moreover, few would have predicted a � nancial crisis and global recession on the scale of the one that began in 2008, to say nothing of the lasting impact these events would have on the years ahead. So it is with a full understanding of these limitations that we embark upon our fore-cast for the next decade.
Trend extenders, trend breakers and paradigm shi� sThere is a natural tendency to view the future as a mere continuation of the present and to assume that the trends that dominate today will remain uninterrupted in the years ahead. Yet for periods as long as a decade, the world changes – o� en dramatically – thereby disrupting the status quo. Again, think back to the end of 2000: the US stood as the sole and unchallenged global super-power; the government had recorded a string of record budget surpluses generating fears of a Treasury bond “shortage”; Asia was still reeling from the currency crisis and required the sup-port of the International Monetary Fund; most Americans in the US had never heard of Osama bin Laden or Al-Qaeda; and cell phones – far bulkier than today’s sleek models – were used to
Introduction
The beginnings and endings of decades
a� ord an opportunity to re� ect upon what
has happened…and ponder the trends and
innovations that may emerge.
““

The Decade Ahead February 2011 3
Introduction
make phone calls. Who could have foreseen just how profoundly the world would change?
So while some existing trends will undoubtedly continue or perhaps even accelerate over the next decade (trend extenders), others will be dis-rupted by events or shocks that alter the status quo (trend breakers). Meanwhile, new trends will certainly emerge amid disruptive innovations that unleash a radically di� erent world view (paradigm shi� s). Of course, it is dif� cult to know how long a trend will continue or precisely when it has run its course – or from where the next major “game-changing” developments will one day materialize. It is therefore essential to re� ect upon the sources of the events that will likely shape the world in the decade ahead. While there are many drivers of change, they tend to fall into several broad cat-egories that include: demographics; technology; natural resources; geopolitics; the environment; and societal/cultural shi� s.
Understanding how demographic shi� s, such as an aging population and rising urbanization, will impact personal income growth and consumer demand, for example, o� ers valuable insight into economic drivers in both the developed and devel-oping worlds. Likewise, the sources and uses of natural resources may highlight potential supply bottlenecks, environmental hot spots and even future points of con� ict as nations compete for access to the raw materials needed to sustain growing populations. Technology, of course, has the ability to transform everything from com-merce to education and entertainment to warfare. Finally, societal and cultural shi� s driven by chang-ing norms and evolving consumer tastes will not only impact the types of products that people are willing to buy but also the manner in which they choose to buy them.
The de� ning trends of the next decadeBut these trends by themselves are unlikely to yield anything meaningful for investors. To make the jump to actual investment implications, there must be an additional set of catalysts coming from domestic policy and geopolitical developments; business investment and product innovations; con-sumer adoption and buyer preferences. Consider, for example, how the decision to privatize tele-
communications, the spread of globalization, the expansion of mobile technology and the demand for device convergence all shaped the develop-ment of the smartphone market during the past decade. It was a combination of many forces and needs, rather than a single trend development that created the investment opportunity. It is here that there is the most room for debate about whether a trend will become relevant for inves-tors. However, it is also here where investors must make some assumptions about how the world is likely to evolve if they are to take a long-term view when making investment decisions.
It is with this interplay between trends and cata-lysts that we explore 12 themes that we believe are most likely to impact economic growth pros-pects, drive � nancial market performance and shape public policy choices over the course of the next 10 years (see Fig. 1 for detailed chapter descriptions). These include:
As we consider these developments, we will focus on what they will likely mean for consumers, busi-ness owners, policymakers and investors alike. We will discuss the changes that are likely to occur in consumption patterns and how producers will seek to adapt to the new appetites and prefer-ences as consumer tastes change. We will also o� er some perspective on the dif� cult choices that both elected of� cials and taxpayers will have to grapple with as they seek to sustain growth
United States: still the leader of the pack
China: � exing its muscles
Geopolitics: the blind side
Emerging markets: the next big allocation shi�
Emerging consumers: more people, more money
Energy: alternatives threaten oil’s dominance
Technology: productivity and vulnerability
Healthcare: from healing to � xing
In� ation: the next wave takes shape
Stocks: no repeat of the lost decade
Bonds: the elusive quest for a safe haven
Philanthropy: makes an impact

4 February 2011 The Decade Ahead
Introduction
Topic Page Abstract
United States
8 The US will remain the dominant power in the world – despite the need for � scal, reg-ulatory and educational reform. While its relative strength will continue to slip over the coming decade, the US will retain its strong culture of innovation, entrepreneurialism and economic freedom.
China 16 China, now the world’s second-largest economy, will increasingly challenge US eco-nomic leadership. Along with newfound prosperity comes increased assertiveness in world a� airs and the potential for disruption as China’s thirst for resources strains rela-tions with competing countries.
Geopolitics 23 Geopolitical con� ict will become more important in shaping investment outcomes during the next decade. Such con� ict will likely keep risk premiums elevated – pri-marily for stocks but also for bonds – and may induce bouts of weakness in risk assets, as well as demand for safe havens.
Emerging markets
28 Numerous structural catalysts, such as a lasting economic growth advantage over developed markets, growing market capitalization and improving corporate gover-nance standards, will prompt a strategic asset allocation shi� into emerging markets over the next decade.
Emerging consumers
35 Consumption in emerging market countries is poised to expand over the next decade as personal incomes rise. This may be a consensus view, but the untapped potential of a prolonged expansion in global consumption may o� er a broader set of opportunities than investors anticipate.
Energy 41 High oil prices, rising energy security concerns and environmental awareness are encouraging businesses and consumers to embrace alternatives to oil. Natural gas stands out as the prime bene� ciary, but batteries and solar also have potential.
Technology 46 Technological advances will continue to improve and transform society, but our reliance on technology has also le� us vulnerable. While cloud computing will likely unlock numerous advantages, we also expect greater investment in safeguards against secu-rity breaches and system failures.
Healthcare 52 During the next decade, the US healthcare system will undergo considerable change. These changes, not solely driven by legislation, could a� ect nearly every aspect of health delivery, from the person we consider our primary care physician to the type of care we receive.
In� ation 57 A� er a quarter of a century of disin� ation – and a more recent brush with outright de� ation – we believe in� ation will reemerge during the decade ahead. However, we do not expect a reprise of the 1970s-style stag� ation that crippled the economy and weighed heavily upon � nancial markets.
Stocks 63 With valuation excesses wrung out, we expect stocks to deliver more “normal” returns, trumping bonds in the coming decade. Historically, it is quite rare for stocks to underperform bonds over a 10-year stretch, particularly a� er prolonged periods of equity market underperformance.
Bonds 68 We expect interest rates in advanced economies to rise amid structural de� cits, grow-ing debt burdens and the prospect of higher in� ation. Erosion in the perceived credit quality of government bonds will challenge the notion that sovereign debt is a risk-free asset, leading to an increase in risk premiums.
Philanthropy 76 People will increasingly judge philanthropy on results. Large donors demand account-ability, while smaller donors use social networks to pool resources and raise aware-ness. Socially responsible investing is broadening, prompting more companies to embrace sustainable business practices.
Fig. 1: Our views on the decade ahead

The Decade Ahead February 2011 5
Introduction
rates, while protecting the environment and car-ing for the most vulnerable members of society. This suggests that both opportunities and risks will abound over the next decade – and that it is criti-cal to understand from where they are most likely to emerge.
A brighter future awaits but will take workBefore we embark on our discussion, we thought it important to o� er some perspective on the future in general. If you were to walk into almost any bookstore today, you would encounter a sur-plus of works fraught with tales of impending doom and gloom. These futuristic horror stories might range from environmental crisis and moral decay to economic catastrophe and coarsening of the culture. But the one thing they would all share in common is the sense that the world will be worse in the future, not better. We beg to di� er.
We in no way seek to minimize the fact that 1.8 billion people are mired in poverty and lack basic sanitation, access to medicine and essen-
tial nutrition – a number equal to the entire world population just before World War I. We also acknowledge that a growing world popula-tion, rising atmospheric concentrations of carbon dioxide and increasingly scarce water resources may also pose threats to greater prosperity in the years ahead.
However, the path of human development is neither downward sloping nor static – it is ever ascending. While humanity has stagnated and even regressed periodically, the historical norm is for higher living standards, greater wealth, longer lives, more leisure time, lower mortality rates, bet-ter diets and greater human creativity.1 The very things that have accelerated over the past several decades – greater specialization, increased trade � ows, more widespread interpersonal connectiv-ity – will continue to o� er the greatest promise for the future. This accumulation of knowledge and pooling of skills is what di� erentiates humankind from every other species on the planet and is also what makes the future so exciting.

6 February 2011 The Decade Ahead
Investment conclusions
tunities through powerful brand names and strong presence within faster growth regions. Meanwhile, the culture of innovation and entrepreneurialism suggests that many of the next great companies to dominate industries – ranging from information technology and healthcare to agriculture and alter-native energy – will hail from the US.
� Stocks p. 63; United States p. 8 ; Emerging consumers p. 35
Include commodities for price appreciation and portfolio diversi� cation: The prospects for continued strong demand from emerg-ing markets, coupled with a rekindling of in� a-tion pressures, suggest that continued exposure to commodities is also warranted. While broad economic cycles, weather conditions, supply constraints, technological changes and shi� s in consumer preferences will periodically weigh upon commodity prices, the demand for raw materials will continue to rise along with the shi� in growth toward emerging markets. Although natural gas is currently in the doldrums, the outlook over the next decade is quite strong.
� China p. 16; Energy p. 41; Emerging consum-ers p. 35; In� ation p. 57; Geopolitics, pg. 23
Actively manage bond portfolios: Rising con-cerns over sovereign default risks, emerging chal-lenges in municipal credit and rising in� ation pressures require a more active approach toward the management of � xed income holdings. The three-decade-long decline in rates has drawn to a close, and while rates are unlikely to surge in the decade ahead, greater scrutiny must be given to select-ing, monitoring and periodically rebalancing � xed income assets. Passive buy-and-hold strategies for bond holdings are simply no longer appropriate.
� Bonds p. 68; In� ation p. 57
Incorporate strategies to protect against in� ation: Although US in� ation is dormant and not an immediate threat, we believe in� ation will reemerge and average 5% during the decade. As in� ation accelerates, this should bene� t hard assets, such as property and gold, as well as real
Position for equities to deliver higher risk-adjusted returns than bonds: While the � nan-cial crisis rightly focused attention on the need to properly diversify portfolios and manage risks more diligently, it would be a mistake to struc-turally underweight equities as a result. In our view, US stocks will provide “normalized” annual returns of between 8.5 and 9% over the coming decade as price-to-earnings multiples converge toward their longer-term historical average of 14.7x and corporate pro� ts trend toward USD 165 per share for the S&P 500 by 2020. Meanwhile, interest rates will likely move higher throughout the decade, as monetary policy becomes less accommodative, in� ation pressures accelerate, private sector credit demand rebounds and federal budget de� cits persist. Therefore, bonds are likely to trail stocks on a risk-adjusted basis during the next decade.
�Stocks p. 63; Bonds p. 68; In� ation p. 57
Retain a preference for emerging markets: Despite concerns that emerging markets may have become a “crowded trade” amid the extensive media hype and elevated � ows into the sector, it remains our view that emerging market equities will outperform those of the developed world. Better growth prospects and fewer structural constraints o� er a better performance outlook, while improvements in transparency and liquidity will help to broaden access. Consumer-oriented domestic stocks also stand to bene� t from rising per capita incomes in emerging markets over the coming decade. Finally, a deeper “tiering” within emerging markets assures that investors will be able to leverage new opportunities as frontier markets evolve and expand.
� Emerging markets p. 28; Emerging consumers p. 35
Maintain a presence in US markets: Although emerging markets likely o� er better absolute return prospects over the next decade, US dollar-based investors should still maintain a sizable weighting in domestic equity markets. US compa-nies remain well positioned to exploit global oppor-
6 February 2011 The Decade Ahead

Section upper right
The Decade Ahead February 2011 7
(in� ation-adjusted) assets like Treasury in� ation-protected securities (TIPS) and equities. While TIPS are presently expensive because of low real yields, they provide strong protection against erosion of purchasing power and a rise in in� ation. We also note that the Basic Materials and Energy sectors have historically done well during periods of high headline in� ation and rising commodity prices.
� In� ation p. 57; Energy p. 41; Emerging markets p. 28; Bonds p. 68
Diversify within energy companies: While oil will remain the dominant source of energy in the world over the coming decade, other sources will emerge to compete with petroleum – and in certain commercial applications even replace it. In addition to maintaining exposure to integrated oils, investors should also gain exposure to both traditional energy sources – such as natural gas and unregulated power generation – as well as emerging sectors, which include solar, wind and batteries.
� Energy p. 41; China p. 16
Exploit broad opportunities in technology: Much of the focus on technology has centered on those companies that make products and applica-tions that allow us to enjoy better, longer, health-ier and more ful� lled lives. But there will also be opportunities in industry sectors and companies within the technology universe that protect us against system failures, security breaches, property damage and loss of life. While the potential future application of new technology is limited only by our imagination, the investment opportunities in technology will � ow both from productivity and lifestyle enhancements, as well as advances to limit threats and vulnerabilities.
� Technology p. 46; Healthcare p. 52
Embrace changes in healthcare: The healthcare industry is rapidly evolving, with changes that range from the way healthcare providers are compen-sated to the way patients access critical services. Moreover, medicine will continue to shi� its e� orts away from treating illness and toward prevention and repairing genetic � aws. This suggests that the investment focus needs to broaden from tradi-tional pharmaceutical companies to managed care, genetic engineering and medical device companies.
� Healthcare p. 52; Emerging consumers p. 35
Deploy portfolio hedges: The likely rise in geo-political risk over the coming decade indicates a need to monitor sources of con� ict and hedge against extreme outcomes and liquidity events. Hedges could range from exposure to such natural risk hedges as precious metals, particularly gold, to structured investment vehicles that limit downside risks at the individual security, asset class or market level, like options and structured products.
� Geopolitics p. 23
Consider nontraditional assets: Despite dif� cul-ties faced by a number of university endowments, charitable organizations and individuals during the � nancial crisis, nontraditional assets have emerged as an e� ective way to enhance returns and limit risks. The limited absolute return prospects for bonds and cash over the next decade argue for an increased weighting in non-traditional assets.
� Philanthropy p. 76; Bonds p. 68
Consider multi-currency strategies: Given the many structural economic challenges facing the US, particularly its large and increasing public debt burden, we expect the US dollar will steadily lose value against many emerging market and commodity-exporting countries. However, we do not expect the US dollar to lose its status as the primary international reserve currency. Persistent institutional instability limits the euro’s prospects as a core central bank reserve holding, and China’s yuan is many years from being freely convertible.
� Bonds p. 68; In� ation p. 57; Emerging markets p. 28; United States p. 8; China p. 16
Selectively utilize socially responsible invest-ing strategies: Once viewed as a niche segment, socially responsible investing will likely become more mainstream due to competitive investment results and increased demand for this type of investment approach among philanthropic orga-nizations, endowments and individuals. Greater scrutiny on corporate governance and sustainabil-ity has opened an entirely new frontier and will provide additional criteria for evaluating corpora-tions. Others outside the philanthropic domain will also be drawn to the opportunity both to do good (values-based and impact investing) and do well (competitive performance prospects).
� Philanthropy p. 76
The Decade Ahead February 2011 7
8 February 2011 The Decade Ahead
United States: still the leader of the pack
But not only are such assessments super� cial, they are also largely misleading. While the US admit-tedly faces a number of serious challenges in the coming years, it also possesses myriad sources of strength that will enable the nation to not only cope with such dif� culties in the next decade but to continue to � ourish. In his thoughtfully provoca-tive book entitled, The Next 100 Years: A Forecast for the 21st Century, political scientist George Friedman likens the US not so much to an aged and in� rmed adult, but rather to a still imma-ture yet energetic adolescent.2 He argues that US power is overwhelming and rooted in economic, technological and cultural realities. But understand-ing the sources of that power is key to identifying in what ways the US will be challenged in the years ahead, who will emerge as its primary competitors
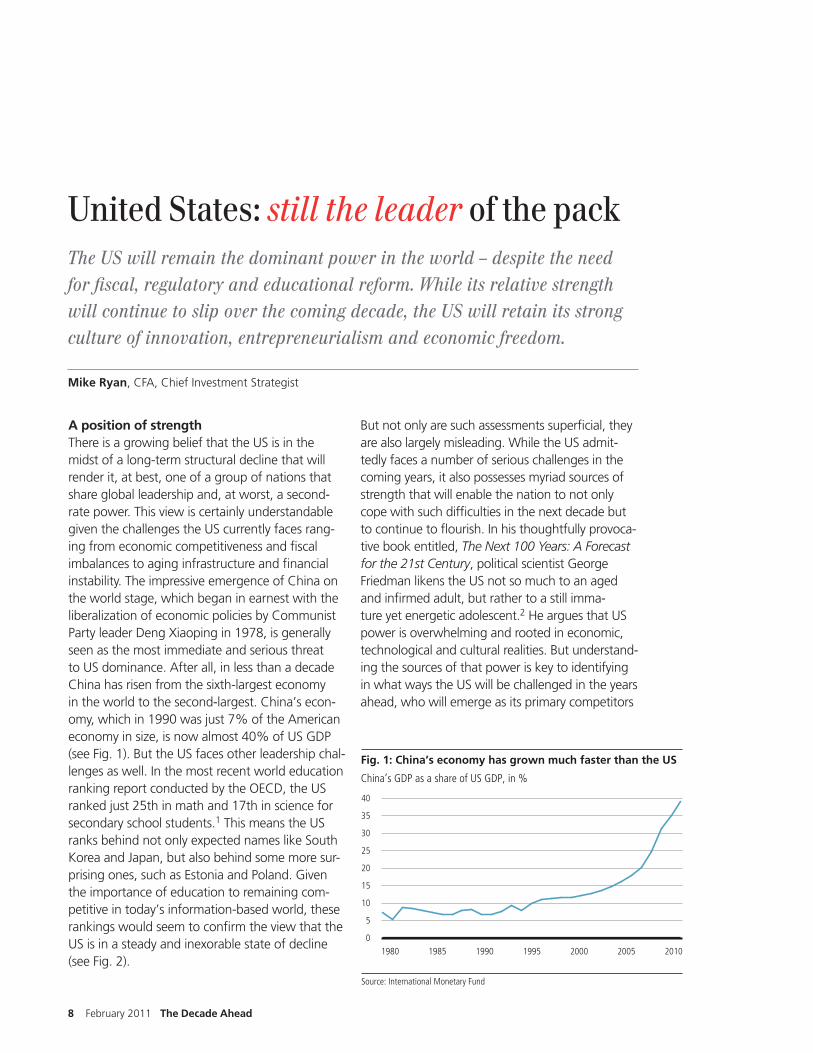
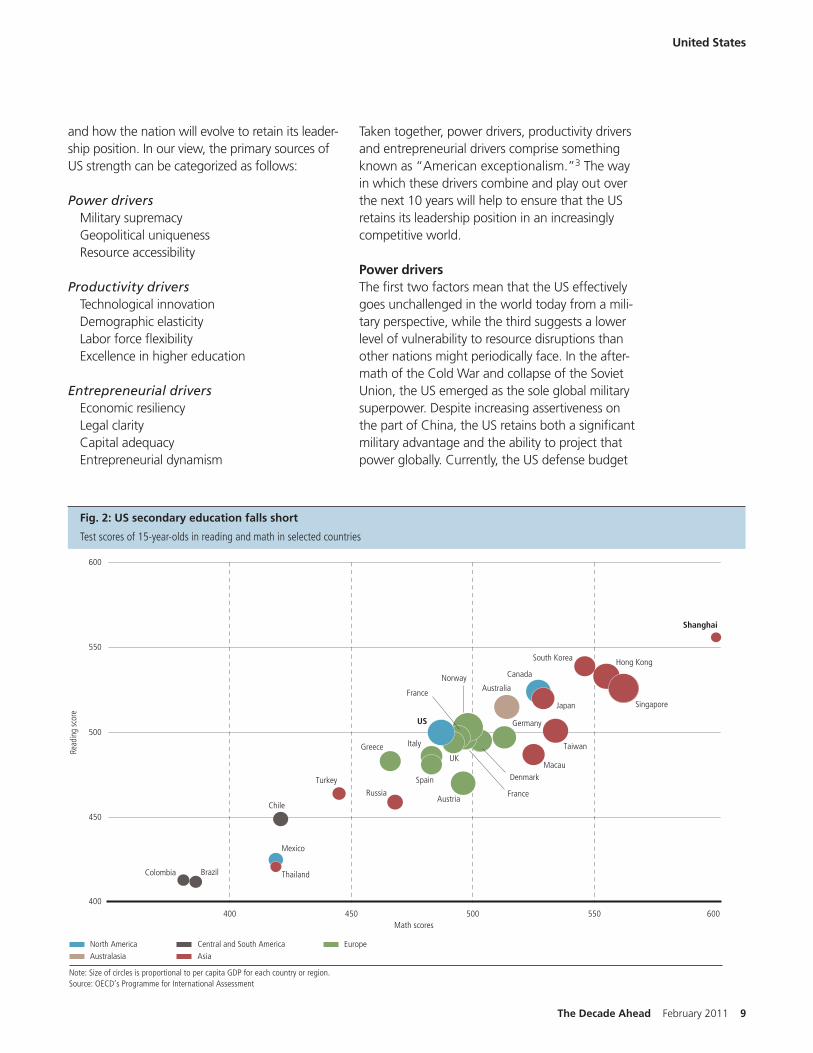
A position of strengthThere is a growing belief that the US is in the midst of a long-term structural decline that will render it, at best, one of a group of nations that share global leadership and, at worst, a second-rate power. This view is certainly understandable given the challenges the US currently faces rang-ing from economic competitiveness and � scal imbalances to aging infrastructure and � nancial instability. The impressive emergence of China on the world stage, which began in earnest with the liberalization of economic policies by Communist Party leader Deng Xiaoping in 1978, is generally seen as the most immediate and serious threat to US dominance. A� er all, in less than a decade China has risen from the sixth-largest economy in the world to the second-largest. China’s econ-omy, which in 1990 was just 7% of the American economy in size, is now almost 40% of US GDP (see Fig. 1). But the US faces other leadership chal-lenges as well. In the most recent world education ranking report conducted by the OECD, the US ranked just 25th in math and 17th in science for secondary school students.1 This means the US ranks behind not only expected names like South Korea and Japan, but also behind some more sur-prising ones, such as Estonia and Poland. Given the importance of education to remaining com-petitive in today’s information-based world, these rankings would seem to con� rm the view that the US is in a steady and inexorable state of decline (see Fig. 2).
Fig. 1: China’s economy has grown much faster than the US
Source: International Monetary Fund
China’s GDP as a share of US GDP, in %
10
5
0
40
15
35
30
25
20
1980 1985 1990 1995 2000 2005 2010
The US will remain the dominant power in the world – despite the need for � scal, regulatory and educational reform. While its relative strength will continue to slip over the coming decade, the US will retain its strong culture of innovation, entrepreneurialism and economic freedom.
Mike Ryan, CFA, Chief Investment Strategist
The Decade Ahead February 2011 9
Taken together, power drivers, productivity drivers and entrepreneurial drivers comprise something known as “American exceptionalism.”3 The way in which these drivers combine and play out over the next 10 years will help to ensure that the US retains its leadership position in an increasingly competitive world.
Power driversThe � rst two factors mean that the US e� ectively goes unchallenged in the world today from a mili-tary perspective, while the third suggests a lower level of vulnerability to resource disruptions than other nations might periodically face. In the a� er-math of the Cold War and collapse of the Soviet Union, the US emerged as the sole global military superpower. Despite increasing assertiveness on the part of China, the US retains both a signi� cant military advantage and the ability to project that power globally. Currently, the US defense budget
and how the nation will evolve to retain its leader-ship position. In our view, the primary sources of US strength can be categorized as follows:
Power driversMilitary supremacy Geopolitical uniqueness Resource accessibility
Productivity driversTechnological innovation Demographic elasticity Labor force � exibility Excellence in higher education
Entrepreneurial driversEconomic resiliency Legal clarity Capital adequacyEntrepreneurial dynamism
United States
Fig. 2: US secondary education falls short
Note: Size of circles is proportional to per capita GDP for each country or region.Source: OECD’s Programme for International Assessment
Test scores of 15-year olds in reading and math in selected countries
AustralasiaNorth America
AsiaCentral and South America Europe
Colombia Brazil
Chile
Turkey
RussiaAustria
Australia
Spain
Greece Italy
US
Shanghai
Norway
France
Denmark
Japan
Taiwan
Macau
Germany
Canada
South Korea
Singapore
Hong Kong
France
Mexico
Thailand
UK
400400 450 500 550 600
Math scores
450
500
550
600
Read
ing
scor
e
Fig. 2: US secondary education falls short
Test scores of 15-year-olds in reading and math in selected countries

10 February 2011 The Decade Ahead
is about 10 times larger than China’s, which is the second-largest (see Fig. 3). But even if other nations do manage to narrow America’s numeri-cal and technological military advantages, as evi-denced by China’s recent development of stealth � ghter aircra� , geopolitical uniqueness will still o� er the US advantages that others simply lack. Consider for a moment that the US is protected by two oceans and is bordered by two friendly and signi� cantly less powerful neighbors. This means the US needs to devote fewer resources to border defense but can mobilize to project power in two theaters – the Atlantic and the Paci� c.
Although the US is highly dependent on certain critical commodities such as oil, it is still a resource-rich nation that is able to satisfy a fair portion of its own needs for energy, industrial metals and, perhaps most important, drinkable water. Keep in mind that the US is the second-largest energy producer in the world, with signi� cant reserves of oil and gas in Alaska, the Dakotas and the Gulf of Mexico, as well as enormous coal deposits (see Fig. 4). The US also shares access to the larg-est body of fresh water on the planet in the form of the Great Lakes. This could well become the most important resource advantage, as a grow-ing global population searches for reliable access to clean, drinkable water. The nation’s access to other essential resources is still secured by a mili-tary pro� le that spans the globe and represents a � ve-decade commitment to establishing a pres-ence in regions that are deemed to be in its strate-gic national interest. So while regional players will emerge to test the US periodically, these strategic advantages suggest America will remain the domi-nant global power in the decade ahead.
Productivity driversIf the � rst three sources of strength listed above represent the essential building blocks behind the geopolitical power of the US, then the next four largely de� ne the nation’s economic might. The US has traditionally been a world leader in all sorts of technologies ranging from computers and nuclear power to the development of com-posite materials. While others have taken the lead in the industries America once dominated, the US remains a leader in such critical high-tech � elds as biomedical engineering, agricultural engineer-
United States
Fig. 3: The US spends far more on defense than any other nation
Source: Stockholm International Peace Research Institute
Total military spending, in billions of USD, 2009
100
200
0
300
400
500
700
600
US China UK France Russia Germany Japan
Fig. 5: The US leads in internationally recognized patents
Note: PCT = Patent Cooperation Treaty.Source: World Intellectual Property Organization
PCT patent applications, in thousands, 2009
10
20
0
30
40
50
US Japan Germany SouthKorea
China France UK
Fig. 4: The US is the second-largest energy producer in the world
Source: US Energy Information Administration
Energy production, in quadrillion BTUs, 2008
10
20
0
30
40
50
80
70
90
60
China US Russia Saudi Arabia India Iran Venezuela

The Decade Ahead February 2011 11
have negative equity in their homes, the US labor force is still the most � exible in the world and able to adapt fairly rapidly to changing labor needs.5 An open immigration policy for highly skilled, foreign-born workers has also a� orded the US a signi� cant demographic advantage enjoyed by
ing, nanotechnology and applied optics.4 Despite a fairly sharp decline in research and develop-ment spending over the past decade, the US still ranks highest in the � ling and granting of Patent Cooperation Treaty international patents, which are recognized in 177 di� erent countries (see Fig. 5). Keep in mind that patent grants actually repre-sent the application of technological innovation to enhance productivity. As Fig. 6 illustrates, there is a strong historical correlation between patent grants and economic growth. At the same time, the US continues to bene� t from a superior higher educa-tion system. While primary and secondary educa-tion ranks low against other nations, the American university system is still considered among the � nest in the world in many � elds, including math, science and engineering.
But it still requires a skilled, well-educated and productive work force to ensure that the US will remain competitive. While some structural rigidi-ties exist, particularly now that many Americans
United States
Economic leadership
The concept of US leadership, even when focusing narrowly on economic dimensions, is o� en poorly de� ned in the popular media. It is useful to distinguish among economic size, economic well-being and growth leadership.
As far as economic size is concerned, the US is the world’s uncontested economic heavyweight. Although China is catching up, it is unlikely to exceed the US in terms of economic output over the next decade. Regarding economic well-being, as loosely represented by GDP per capita, the US has been among the top 10 countries for the last three decades. It currently ranks sixth behind small wealthy countries, such as Qatar, Luxembourg and Singapore, but ahead of other large developed economies, such as Germany, Japan and the UK. Even under the most extreme scenarios, it appears highly unlikely that fast-growing emerging market countries will signi� cantly alter this ranking over the next 10 years. Keep in mind that China’s per capita GDP is presently only 16% that of the US.
Growth leadership is the one area where the balance has already shi� ed away from the US. In 2000, the US accounted for nearly a quarter of global growth in economic output, more than double China’s contribution. However, in 2009, the US accounted for a mere 20% of global economic growth, while China had a 26% share. This matters because such a shi� in growth contribution means that a large share of new global investment and business opportunities is progressively tilting away from the US.
Fig. 6: Patent growth correlated with economic growth
Source: Patent and Trademark Office, Bureau of Labor Statistics
Annual patent growth rate and nonfarm buisness productivity growth rate, in %
4
3
2
1
0
5
1980s1970s1960s 2000s1990s
Annual nonfarm business productivity growth Annual patent grant growth rate

12 February 2011 The Decade Ahead
Entrepreneurial driversIt is perhaps the last four variables that have been most critical to the ongoing competitiveness of the US economy – yet may pose the biggest obstacle in the future. The depth and ef� ciency of the US capital markets has historically enabled entrepreneurs to access available capital around the globe to build their businesses. Meanwhile, the US legal framework (well-de� ned property rights, granting and honoring of patents, robust adjudication process and consistent enforcement of regulation) has allowed corporations to � our-ish within a well-established set of operating principles. Entrepreneurs need to be provided a fertile environment for deploying capital and tak-ing business risks without the threat of arbitrary
few others. This means that the US su� ers less from an aging population than other developed nations that do not have the bene� t of immigra-tion. However, amid tightening of visa restrictions following the 9/11 terror attacks and growing opportunities on their respective home fronts, the number of foreign-born engineers working in the US has dropped markedly.6 Still, the output of American universities places the US within the top three globally – and the highest on a per capita basis – of technical graduates. It would there-fore appear that the drivers accounting for much improvement in US economic productivity are still intact and will continue to yield signi� cant bene� ts over the next decade.
United States
In the aftermath of the Cold War and collapse of the Soviet Union, the US emerged as the sole global military superpower. Despite increasing assert-iveness on the part of China, the US retains both a signi� cant military advantage and the ability to project that power globally.

The Decade Ahead February 2011 13
US. While it is dif� cult to assess exactly what the environment will look like over the next 10 years for US business with regard to an entrepreneur-ial culture, there is still reason for optimism. The most recent release of the Global Entrepreneurship and Development Index ranks the US third in the world overall, but � rst on the entrepreneurial aspirations sub-index. According to the study � nd-ings reported in the release, ”the US is among the world leaders in startup skills; it is a leader in competition; and it is � rst in developing new technologies.“7 By way of comparison, Japan was ranked 29th overall, China 40th and India 54th in the study (see Fig. 7). This suggests that America’s position as an incubator for entrepreneurs will remain robust well into the next decade.
But there is also an intangible and unquanti� able aspect of entrepreneurialism that goes beyond mere natural resource endowments, productiv-ity measures, the capital base and even military might – and it is this aspect that has been most critical to US leadership. Assorted studies have sought to determine what the primary drivers are that account for the accumulation of wealth and improvements in prosperity. Perhaps the most famous and in� uential e� ort on this front is The Wealth of Nations by 18th century Scottish economist and philosopher Adam Smith. Smith argues that economic freedom, rather than min-eral wealth or large pools of cheap labor, is chie� y responsible for prosperity. A recent study by econ-omists Art Carden and Joshua Hall appears to validate Smith’s views by providing evidence
or punitive litigation. But the orderly liquidation of failed enterprises is also necessary for the e� ec-tive reallocation of capital into more productive and ef� cient uses. It is this combination that has enabled the US economy to not only adapt to harsh business environments, but also to reinvent itself periodically to serve the changing needs and preferences of consumers.
Some argue however, that the capitalist system is no longer functioning properly within the US and point to the following: the misallocation of resources during the 1990s and 2000s into the Financial Services sector; the heavy-handed role the government played in bailing out banks and selective industries during the recent � nancial crisis; the refusal to honor the legal precedent of the Bankruptcy Code during the failure of sev-eral high pro� le companies; the impact of the US as a debtor nation on capital formation; and an increasingly burdensome and intrusive regula-tory backdrop. A� er all, this process of “creative destruction,” as Austrian-American economist and political scientist Joseph Schumpeter described it, is an essential feature of a vibrant, resilient and adaptive economy. If businesses are not permitted to both succeed and fail, con� dence in free enter-prise system erodes.
However, episodes of capital misallocation are not uncommon (recall the massive overinvestment in railroads in the US during the 1860s), and tem-porary state intervention following economic and � nancial dislocations are sometimes necessary (the Great Depression remains the most enduring example). That does not mean that capitalism is no longer workable. Despite both the enormous US � scal de� cit and large consumer debt burdens, there is little evidence that the � ow of capital available to entrepreneurs in the US has dimin-ished in any way. Moreover, while the unorthodox treatment of creditors during the General Motors bankruptcy raised concerns over a tendency to reward favored political constituencies, this has proven the exception rather than the rule.
However, policies that distort the ef� cient real-location of capital or prohibit the orderly liquida-tion of bankrupt businesses do pose a threat to the sustainable long-term competitiveness of the
United States
Fig. 7: The US ranks third in entrepreneurial culture and activity
Source: Small Business Administration
Global entrepreneurship and development index scores
0.1
0.2
0
0.3
0.4
0.5
0.8
0.7
0.9
0.6
Denmark Canada US Germany France Japan China India

14 February 2011 The Decade Ahead
United States
• Susan Dudley, the Director of the Regulatory Studies Center at George Washington University, has warned that overly burdensome and inef� cient regulatory schemes can in� ate costs, sti� e innovation and entrepreneurship and encourage ”rent-seeking behavior“ on the part of entrenched special interests. In a January 20th article published in The Economist, she notes that the federal government has issued 132 ”economically signi� cant“ regulations over the past two years versus an average of 47 per year during the Clinton administration and 48 per year during the Bush administration.13 Were this trend to continue, it could lead to a material erosion in US competitiveness.
• The Congressional Budget Of� ce estimates that the federal debt held by the public will soar from just 32.5% of GDP in 2001 to 70% of GDP by 2020 (see Fig. 8).14 Keep in mind that state and local governments also have incurred large structural imbalances over the past decade and a half due to expanded services and unfunded pension liabilities. For example, econ-omists Robert Novy-Marx from the University of Rochester and Joshua Rauh from Northwestern University estimate that Chicago will need to remit 53% of all tax revenue to retirees by 2023 – even under an optimistic scenario – to meet pension commitments.15 Large budget de� cits by themselves are troubling enough, but when combined with sizable trade imbalances they contribute to a dangerously high dependence on foreign capital and even the prospects for
that countries with greater economic freedom tend to enjoy both higher per capita GDP and higher growth in GDP.8 Although its competitive position has slipped as a result of the a� ershocks from the global � nancial crisis, the US is still one of the top-ranked nations in terms of economic freedom, according to the Heritage Foundation’s 2011 Index of Economic Freedom (the US ranked 9th, Japan 20th, Germany 23rd, India 124th and China 135th).9 The US remains one of the most adaptive, open and resilient economies in the world. In his most recently published book entitled, Uprising,10 UBS’s own senior economic advisor, George Magnus, cleverly o� ers that the abbreviation ”RIP“ should stand for ”renewal in progress“ rather than ”rest in peace,“ when used in relation to the US. It is this economic resiliency – and continued cultural adaptability – that will allow the US to retain its dominance in the coming decade.
Structural challengesOf course, the US does face a number of sig-ni� cant economic, political, � scal and social challenges that, if le� unaddressed, could still materially compromise America’s global stand-ing in the years ahead. Some of these issues are: a substandard primary and secondary educational system (grades K-12); an increasingly burden-some regulatory scheme; unsustainably large � scal imbalances; and a deeply corrosive political cul-ture. Consider the following:
• According to the Hoover Institute’s Koret Task force on K-12 Education, the ongoing failure of the US primary educational system now poses a signi� cant strategic risk.11 Chester Finn, the chair of the task force and former Assistant Secretary of Education, likens the stellar show-ing of both Shanghai and Hong Kong in the OECD’s most recent PISA (Programme for International Student Assessment) rankings to the Soviet Union’s launching of Sputnik half a century ago.12 Failure to respond with meaning-ful educational reforms could leave the US at a competitive disadvantage longer term – and even more dependent on foreign-born engi-neers and scientists at a time when the competi-tion for those skilled professionals is rising.
Fig. 8: The US faces an increasing federal debt burden
Source: Congressional Budget Office
Federal debt held by the public as a share of GDP, in %
60
50
40
30
20
10
0
70
80
ProjectedActual
1970 1975 1980 1985 2000 2005 2010 201519951990 2020

The Decade Ahead February 2011 15
US economically in the 1980s. Neither happened. Instead, the US adapted and thrived by allowing free enterprise and enlightened self-interest to guide that change – as opposed to an entrenched bureaucracy and a heavy-handed government. There have been, and will continue to be, mistakes made and setbacks experienced along the way. But the notion that the US will cede its leadership position over the next decade is premature. As we will see in the next section, China faces its own set of challenges in the years ahead that will impact its development as well. In short, the US will remain the leader of the pack through the decade.
selective defaults. This leaves the US vulnerable to higher rates, slower economic growth and currency weakness if foreign investors begin to withhold capital (see page 68 for a more detailed discussion of bonds and currencies).
• An increasingly bitter partisan atmosphere in Washington has made it dif� cult to deal with longer-term structural challenges. This means that each political party seeks to use such issues for tactical electoral advantage rather than as a starting point for serious discussion. The President’s National Commission on Fiscal Responsibility and Reform o� ered up a grab bag of measures that is projected to cut the de� -cit by as much as USD 200 billion per year by 2015.16 But the Commission failed to include any speci� c recommendations on entitlement reform in the proposal, which would certainly need to be included in any meaningful e� ort to reduce structural de� cits. It would therefore appear that there is little political will to work in the sort of bipartisan manner that is necessary to address these and other critical issues.
While none of these issues by themselves will necessarily compromise America’s standing in the world, taken together they do represent a signi� cant challenge for business leaders, policy-makers and elected of� cials. This suggests that the US economy is in for a period of below-trend growth in the years ahead as precious resources are diverted to address these needs. That does not mean that the US will cede its spot as the global leader. The US will almost certainly remain the world’s largest and most important economy through the next decade. What it does mean, however, is that the gap between the US and such rapidly growing economic powers as China and India will continue to narrow (see Fig. 9).
The leader of the packThe view that the US is in decline has become so widely held that it needs to be challenged on sev-eral fronts. The US has periodically appeared to be on the brink of forfeiting its position as a global leader – due both to its own missteps as well as the rising fortunes of others. Recall that the Soviet Union was destined to unseat the US militarily in the late 1960s, while Japan was set to eclipse the
United States
Fig. 9: Gap between US and emerging markets to narrow
Source: UBS WMR estimates based on Penn World Table 6.3 data
Selected country GDP as a share of US GDP, in %
80
60
40
20
0
100
ChinaBrazil
IndiaGermany Japan
Russia
1970 1975 1980 1985 1990 1995 2000 2005 2010 2015 2020

16 February 2011 The Decade Ahead
Fig. 1: China is now the world’s second-largest economy
Note: Measured at market exchage rates.Source: International Monetary Fund
Size of major world economies in trillions of USD, 2010
0
4
8
16
12
US China Japan Germany France UK Italy Brazil Canada Russia India
China: flexing its muscles
China risesChina’s emergence as a major economic player in the post-Cold War world has been nothing short of spectacular. An economy that just two decades ago was similar in size to Poland’s, has now soared past every other nation in the world with the exception of one (see Fig. 1). The rise of China thus far has been mostly bene� cial to the global economy. East Asian factories have played a vital role in supplying Western consumers with low-cost goods, while emerging market central banks recycled surplus funds back into bonds and helped keep global interest rates low to spur investment spending. China’s emergence also has been criti-cal in driving growth within Asia Paci� c (APAC), as other nations within the region have played some role in the broader Chinese manufacturing sup-ply chain. Finally, China’s more stable economy also helped the world overcome the most severe economic downturn since the Great Depression by supplanting developed nations, such as the US, as the locomotive for growth. Clearly, the reintegra-tion of China into the global economy has been an extraordinarily positive development over the past decade and a half.
But with China’s appetite for raw materials grow-ing more ravenous every day, and with a renewed sense of national pride that rivals its expanding economy, China is now also poised to become an increasingly assertive, and potentially even disrup-tive, global force. This means that China will not only assume a more visible and vocal presence
on the world stage, but there is a greater risk for more frequent clashes with nations, such as the US, when strategic interests are in con� ict. This new wave of Sino-assertiveness will manifest itself in � ve principal ways: • Procurement of resources• Projection of military power • Trade policy • Technological innovation • Political engagement
It’s a small world a� er all…for resourcesAs recently as 1993, China was not only energy self-suf� cient, but was actually a net exporter of coal and oil. China also enjoyed surpluses in all sorts of minerals, ranging from aluminum and
China, now the world’s second-largest economy, will increasingly challenge US economic leadership. Along with newfound prosperity comes increased assertiveness in world a� airs and the potential for disruption as China’s thirst for resources strains relations with competing countries.
Mike Ryan, CFA, Chief Investment Strategist

The Decade Ahead February 2011 17
Fig. 3: China eclipsed the US as the largest energy consumer
Source: International Energy Agency
Energy consumption, in million tons of oil equivalent
2000
1500
1000
500
0
2500
200320022000 2001 2005 2006 2007 2008 20092004
ChinaUS
Fig. 2: A voracious appetite for resources
Source: Bloomberg, Thomson Financial
China’s share of global commodity demand, in %, 2010
0
30
20
10
40
60
50
Iron ore Coal CornSoybeansAluminumCopperCotton Oil
China
molybdenum to zinc. But the economic reforms implemented under Deng Xiaoping in the 1970s unleashed an expansion that led to a four-fold increase in China’s economy over a period of fewer than 15 years. Alongside this rapid indus-trialization has come a ravenous appetite for raw materials of every kind, including energy, indus-trial metals, agricultural products, clean water and even precious metals (see Fig. 2). In 2009, China passed the US to become the single larg-est consumer of energy in the world, as estimated by the International Energy Agency (see Fig. 3). According to Elizabeth C. Economy, Director of Asia Studies at the Council on Foreign Relations, the need to secure raw materials will only con-tinue to rise as China plans to “urbanize” 400 mn people between now and 2030. Ms. Economy observes that the resource demands of rapid urbanization will be substantial, with about half the world’s new building construction occurring in China and the need to build between 20,000 and 50,000 skyscrapers over the next several decades.1 Chinese leaders are also concerned about access to suf� cient supplies of usable water, given that the amount of water available per person in China is only about one-fourth the global average due to geography, population shi� s and pollution.
China is already moving aggressively into alter-native energy sources, including nuclear, wind power, photovoltaic and hydroelectric (where it is already the world’s largest producer) as a way to ease energy dependence (see page 41 for a more detailed discussion of the outlook for
energy). But even if China is able to fully exploit alternatives to fossil fuels, its need for all types of raw materials will continue to rise over the next decade as the economy expands at a rapid pace. This means that China, along with the rest of emerging Asia, will be competing for the same pool of scarce resources as the developed world. China has already staked out an aggressive stance in resource procurement, as evidenced by its expanded relationships with resource-rich nations in the APAC region, Africa and the Americas.2 In addition to expanded trade ties, China has also sought to partner with leaders in these nations through direct investment, technical support, infrastructure spending and joint business initia-tives in an e� ort to expand the development and exploitation of natural resources and mineral wealth. These projects may be either too large or too risky for private sector companies to pursue on their own, leaving them as ideal targets for state-controlled entities within China seeking to secure stable and reliable access to raw materials. This growing share of resource consumption will likely lead to increased competition with the West and even potential shortages, as these new play-ers become more aggressive in securing sources of supply. So as China expands into parts of the world outside its current sphere of in� uence, the prospects for con� ict – possibly even military con-� ict – will rise as well (see page 23 for a more detailed discussion of geopolitics).
Playing catch-upAccording to GlobalFirepower.com, China already

18 February 2011 The Decade Ahead
China
forces from a coastal defense guard to a true “blue-water” maritime force that navigates across the world’s oceans.3 The Chinese want to be able to operate not only within the � rst island chain surrounding the mainland, but also to extend that naval footprint to protect critical transporta-tion routes in major sea lanes. Toward that goal, China has already secured deep-water ports on the Indian subcontinent and now is looking to expand into Africa as well. While China does not currently have a carrier-based force and represents little immediate threat to the US, it is expected that as many as three serviceable carriers will be operational by the end of this decade. Moreover, China’s unexpectedly rapid development of stealth aircra� suggests the gap may be narrowing on several fronts simultaneously. Although the US and China will still � nd common ground on which to operate jointly as they do now in the hunt for Somali pirates, for example, the potential for clashes will undoubtedly increase over the course of the next decade, as China seeks to extend its sphere of in� uence and defend its newly estab-lished strategic trade routes. But these potential � ash points will not be limited to just the US. China will also � nd its interests increasingly con-� icting with some of its most powerful neighbors including India, Russia and Japan.
Trade becomes more contentiousOne area where China has already surpassed the US is in the total amount of exports. According to the most recent data made available by the World Trade Organization, China is currently the largest
ranks second in the world to the US in terms of military strength. The Chinese army is the larg-est in the world numerically with over two million active service personnel currently under arms, and it also ranks second in such strategically impor-tant areas as naval vessels. However, the current strength of China’s military is greatly exagger-ated by these statistics. Despite a sharp increase in defense spending, China’s military budget is still only about one-seventh of what the US spends (see Fig. 4). Moreover, much of the mili-tary is dedicated to border and coastal operations (China shares borders with traditional rivals, India and Russia, and sea lanes with its historic enemy Japan). While the US currently has 11 aircra� car-riers in operation around the world and one in reserve, it is estimated that China will not be able to deploy a serviceable carrier until about 2015. The ability to commission, deploy and service an aircra� carrier is critical because it both allows for a broader projection of military power beyond the coastal region and also o� ers greater protection to critical maritime trade routes. In the absence of such capabilities, China is vulnerable to potential disruptions in raw materials and crude oil supplies which are critical to economic growth.
But while China may currently lack the he� and reach of the US military, it is devoting a dispro-portionate level of funding to building its military capabilities in an e� ort to protect its expand-ing global interests. They are, in essence, playing “catch-up.” China’s military leaders have already stated their ambition to transform their naval
Fig. 4: China’s growing military budget still a fraction of the US
Source: Stockholm International Peace Research Institute
Total military spending, in billions of USD, 2009
0
200
100
300
400
700
600
500
US China
Fig. 5: China is the world’s largest goods exporter
Source: World Trade Organization
Merchandise exports, in trillions of USD, 2009
0
0.8
0.6
0.4
0.2
1.0
1.4
1.2
China Germany US Japan France
The Decade Ahead February 2011 19
China
but perhaps also an increasingly contentious one over the next decade.
Tilting the playing � eldThere is more at stake on the competitive land-scape besides concerns over currency target-ing, trade tari� s and protectionist measures.4 China has embarked on a campaign to make the country one of the world’s leading knowledge-based economies over the next decade through a practice most refer to as “indigenous innova-tion.” The program, formally known as “The National Medium- and Long-Term Plan for the Development of Science and Technology” (MLP) de� nes indigenous innovation as “enhancing original innovation through co-innovation and re-innovation based on the assimilation of imported technologies.” In short, Chinese of� cials have required foreign companies to partner up with local entities in order to gain a presence in the local market. While these partnerships have clearly bene� ted foreign businesses in the short term, the policy has also facilitated the transfer of sophisti-cated, high-end technology and manufacturing capabilities to Chinese partners in the process. The US Chamber of Commerce has charged the Chinese with using this practice to unfairly com-pete against non-domestic companies by allowing for industrial espionage, failing to honor intel-lectual property rights and awarding preferen-tial treatment to Chinese companies during the government procurement process.5 This policy would appear to tilt the playing � eld against non-domestic companies who refuse to share critical
exporter by volume, with Germany, the US, Japan and France rounding out the top � ve (see Fig. 5). Given China’s continued reliance on trade to maintain growth, which in turn is critical to pre-serving social stability, Chinese policymakers will continue to push aggressively to expand exports. While elected of� cials, union leaders and small business owners in the US have railed against unfair trade practices, the issue had failed to gain traction amid the ongoing push for an expan-sion in global trade and the mutual bene� ts that accrue to all parties. However, with both the trade and current account de� cits at persistently high levels, there is a backlash within the US against the surge in imports from countries such as China. Keep in mind that the Obama administration has made increasing US exports a critical component of its strategy to seek a more balanced growth model that is less dependent upon consumer spending. This in turn has prompted calls for more tari� s and protec-tionist measures within the US to preserve American jobs and promote homegrown companies.
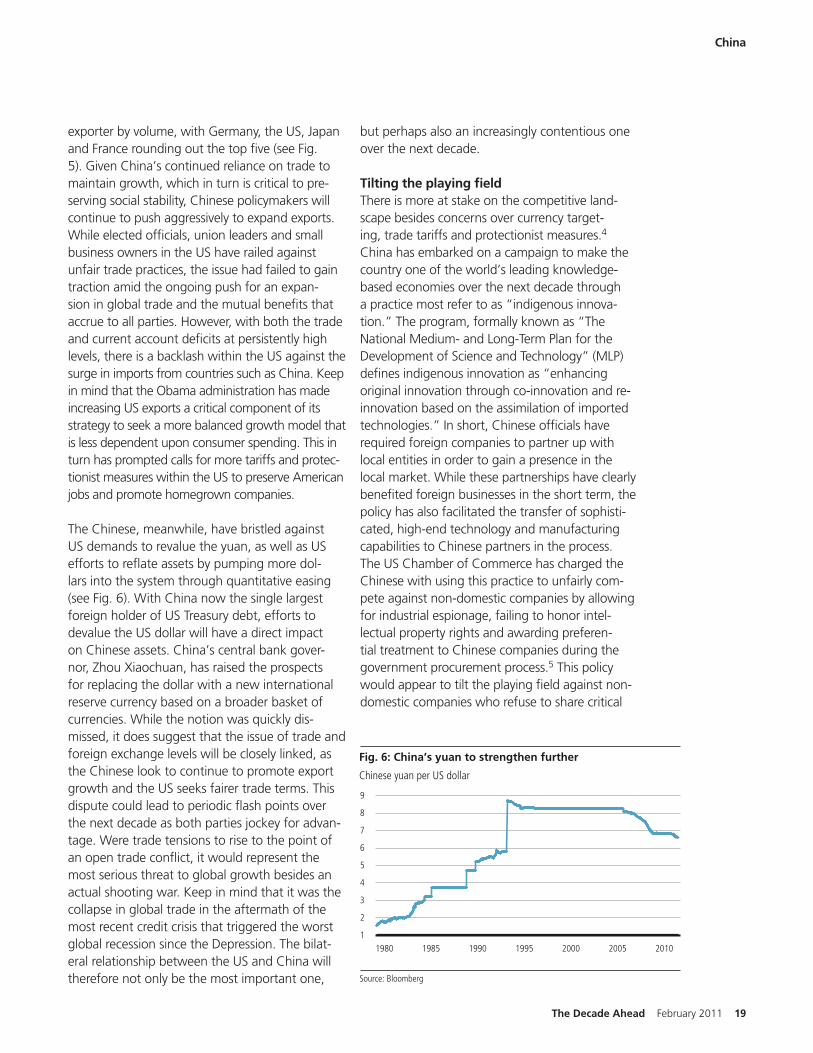
The Chinese, meanwhile, have bristled against US demands to revalue the yuan, as well as US e� orts to re� ate assets by pumping more dol-lars into the system through quantitative easing (see Fig. 6). With China now the single largest foreign holder of US Treasury debt, e� orts to devalue the US dollar will have a direct impact on Chinese assets. China’s central bank gover-nor, Zhou Xiaochuan, has raised the prospects for replacing the dollar with a new international reserve currency based on a broader basket of currencies. While the notion was quickly dis-missed, it does suggest that the issue of trade and foreign exchange levels will be closely linked, as the Chinese look to continue to promote export growth and the US seeks fairer trade terms. This dispute could lead to periodic � ash points over the next decade as both parties jockey for advan-tage. Were trade tensions to rise to the point of an open trade con� ict, it would represent the most serious threat to global growth besides an actual shooting war. Keep in mind that it was the collapse in global trade in the a� ermath of the most recent credit crisis that triggered the worst global recession since the Depression. The bilat-eral relationship between the US and China will therefore not only be the most important one,
Fig. 6: China’s yuan to strengthen further
Source: Bloomberg
Chinese yuan per US dollar
3
2
1
9
4
8
7
6
5
1980 1985 1990 1995 2000 2005 2010

20 February 2011 The Decade Ahead
China
greater source of con� ict in the decade ahead as Chinese companies look to move beyond low-end manufac-turing and place greater emphasis on high-end man-ufacturing and information technology leadership. In the absence of clearer rules-based technology sharing agreements, the impact on technology companies and manufacturers of sophisti-cated industrial equipment in the US, Germany and Japan could be material.
How will China lead?For the past several decades, the Chinese have played a mostly passive political role on the world stage, but that is poised to change as well. Under Deng’s leadership, China had adopted a policy of detachment from most global debates and chose to engage only when an issue
was directly related to national interests, such as the con� icts over Taiwan and Tibet. However, this extended period of self-seclusion has ended now that China’s interests are truly global in nature. China therefore seeks to play a much more active and engaged role in helping shape international
proprietary technology and in favor of Chinese companies.
Since the Chinese government spent USD 130 billion on technology and science projects this past year – an amount that will only continue to increase in the years ahead – the stakes for Western companies are indeed substantial. But the impact of this policy goes well beyond just gov-ernment procurement policies. By employing this uniquely aggressive form of indigenous innovation that some have dubbed “techno-nationalism,” Chinese companies are now making inroads into export markets and therefore competing head to head with many of the same companies who made these technologies available to the Chinese in the � rst place. This has already manifested itself in the form of high-speed trains and sophisti-cated jet � ghters but also more subtly in so� ware, where Microso� ’s Chairman, Steve Ballmer, has claimed that as much as 90% of all applications within China are pirated. This will become an even
Fig. 7: China’s growing influence in the IMF
Source: International Monetary Fund
IMF voting stakes, in %
1614121086420
18
GermanyChinaUS Japan France Russia India BrazilUK
Aer reformsBefore reforms
China’s rising economic power, growing appetite for raw materials and expanding footprint in international relations will have an increasingly transformative effect globally.

The Decade Ahead February 2011 21
China
encouraging example for other states in Asia and beyond. If consolidated, a liberal Chinese regime would be more prosperous and stable, and its political system might be better able to correct foreign policy mistakes if they do occur.”6 In short, China’s increased political engagement can be a source for good over the next decade, depending on how both Chinese and Western leaders choose to engage one another.
Contending with challengesKeep in mind of course that China’s role in the world will not be de� ned exclusively by its desire to become more engaged and assertive globally. China has de� ned its core interests to include eco-nomic growth and political stability. But toward these ends China faces a host of domestic issues that will occupy the attention of its leaders and require an enormous commitment of resources. While some see China purely as a rising power, it is easy to overlook both the internal and external challenges it will need to confront in the decade ahead if it is to emerge and remain a global leader. Consider the following:
• China will seek to evolve its economy from a largely export- and infrastructure-led growth model into a more dynamic and diversi� ed one. This economic transition will also require tackling entrenched special interests and the transition of power to consumers (see page 35 for a more detailed discussion of emerging consumers). It is still uncertain whether centrally planned econo-mies in general have the ability to adapt and
standards on issues ranging from technology and trade to � nancial stability. In December, the IMF passed reforms that will increase China’s voting stake in the organization from 3.8% to 6.1%, giving it increased leverage over a host of critical issues. Once the reforms are enacted, China will be the third-largest stakeholder behind only the US and Japan, but ahead of the UK, Germany and France (see Fig. 7). The shi� in emphasis away from a G7 global leadership structure to a broader G20 approach also a� ords the Chinese a bigger seat at the table. No longer content to engage the Western world in a deferential or junior role on economic issues, China’s leaders are now pushing more aggressively to advance the nation’s interests in strategically important areas as an equal.
But along with this expanded global leadership role comes increased responsibilities. Chinese lead-ers have sought to engage other nations as a peer on economic issues, yet remain deeply suspicious of Western motivations and continue to protect favored domestic industries. China may well elect to use this enhanced leadership position within the IMF to undermine certain provisions they � nd objectionable, including the annual review of cur-rency practices and transparency requirements for loan recipients. An increasingly combative approach to bilateral disputes could make the world less stable, but a more liberal and engaged China can also be a source of strength and secu-rity for the world in the decade ahead. As George Gilboy and Eric Heginbotham point out in Foreign A� airs,“ a politically reformed China would be an
Fig. 8: China’s growing income inequality
Note: Gini coefficient is an index of income inequality (0 = perfect equality and 1 = perfect inequality).Source: United Nations University, CIA World Factbook
Gini coefficients for selected countries
US
UK
India
Japan
Sweden
Germany
China
Mid 2000sMid 1980s
0 0.1 0.2 0.3 0.50.4
Fig. 9: China’s surplus of boys
Source: United Nations Population Division
Number of male births per female birth
1.20
1.15
1.10
1.05
1.00
0.95
1.25
EuropeChina US
1995–2000 2005–2010 2015–2020 2025–2030 2035–2040 2045–2050

22 February 2011 The Decade Ahead
China
Thus far, China has managed to avoid the sort of condemnation and boycotts that ultimately crippled South Africa’s economy. To be fair, other nations, including the US, have also been cited for abuses by human rights organizations with little economic impact. However, as China plays a more assertive role on the world stage and exports its own style of economic engage-ment, its human rights practices are likely to come under greater focus and become a poten-tially heightened risk.
• The transition to new Chinese leadership gets underway in 2012 when � ve of the seven top leaders in the Standing Committee of the Politburo retire. This is a source of both risk and opportunity as the current inward-looking lead-ership gives way to a potentially more open, con� dent and globally savvy group of leaders. While this could lead to more engagement with the West, it also could lead to a more aggres-sive posture toward securing national interests. But the real key will be how these unproven leaders handle the domestic challenges we have already outlined.
ConclusionThere is a mistaken belief that China’s rise must come at the expense of others – especially the US – but that is not necessarily the case. Economic growth is not a “zero-sum” game. Even as China continues to close the gap with the US in terms of economic leadership, both parties can continue to bene� t from increased global trade, joint initiatives to advance technology and the open exchange of ideas. However, it is clear that China’s rising eco-nomic power, growing appetite for raw materials and expanding global footprint in international relations will have an increasingly transformative e� ect on the rest of the world. The emergence of the US as a global superpower in the early part of the 20th century resulted in a fundamental realignment of strategic alliances, trading pat-terns and capital formation that endure to this day. The ascendance of China will likely have a similar impact. For example, just as exporting nations sought access to the growing af� uence of the US consumer in the post-war era, they will increasingly seek similar access to the growing consumer sector within China and the broader emerging markets.
reallocate capital quickly enough to respond to changing economic needs and realities.
• Chinese leadership must also face the chal-lenges emanating from growing income inequality and rising social unrest.7 China’s GINI coef� cient, a measure of income inequal-ity, has now risen to levels that rival those in Latin America (see Fig. 8). Were this trend to continue to deepen, it could well sti� e domes-tic demand and even inhibit the emergence of middle class consumers.
• Perhaps the biggest problem China will face over the next decade will be balancing the desire for rapid growth with the threat of rising in� ation.8 By pegging the yuan to a basket of currencies at what many consider to be under-valued levels, China is e� ectively importing in� ation. While some attribute rising price pres-sures to the surge in food costs, there is a risk that these problems could become structural in nature as shortages of skilled workers begin to push wages higher.
• The potential shortage of skilled workers is partly a function of a demographic pro� le that looks more like Western Europe than southeast Asia. But China must not only deal with issues such as limited pension assets for an aging population, but also signi� cant gender issues as well, given the large disparity between male and female populations (see Fig. 9).
• China is focused on controlling the � ow of information both within its borders as well as from external sources. But the expansion of the Internet and the chaotic nature of the revolu-tion in information technology in general make such control a practical impossibility. This poses a potential threat to the government leader-ship structure as broader access to information encourages grassroots political movements and greater demands for personal freedoms.
• China’s human rights record will also continue to be an issue and potentially even a source of risk in the decade ahead. Both Amnesty International and Human Rights Watch have labeled China as an abuser of human rights.

The Decade Ahead February 2011 23
Geopolitical risk exists on a spectrumThe end of the Cold War fundamentally altered the course of history as the 20th century drew to a close. The relaxation of geopolitical tension in the 1990s coincided with the spread of globalization, quantum leaps in technology and privatization of state-owned industries, all of which encouraged a further moderation of in� ation and growing eco-nomic prosperity. In addition, the global economy accrued a “peace dividend” as the threat of mutu-ally assured destruction subsided and defense spending shi� ed to more productive uses.
In recent years, however, economic activity and � nancial market performance have grown increas-ingly turbulent, in part due to imploding asset bubbles – � rst technology and then housing.
But renewed geopolitical upheaval – such as the 9/11 terrorist attacks, the proliferation of nuclear weapons capabilities in Asia, the threat of the Eurozone’s breakup and the recent political unrest in the Middle East – also le� their mark.
De� nitions of geopolitics in academic literature vary widely and, as such, the concept is highly � uid and heavily in� uenced by the principal developments in world a� airs. In this report, we are primarily concerned with how domestic eco-nomic and political decisions in� uence prevail-ing regional and international alliances through shi� s in the global balance of power, as well as how this in� uences the potential for con� ict aris-ing from natural resources demands, national strategic ambitions, non-state ideological objec-
Geopolitics: the blind side
Fig. 1: Swollen ranks of the unemployed
Source: Organization for Economic Cooperation and Development
Unemployment rate in OECD member countries, in %
6
5
7
9
8
1988 1994 2000 2006 2012
Fig. 2: Increased government role in the economy
Source: International Monetary Fund
Public debt as a share of GDP, in %
80
60
40
20
0
100
140
120
1950 1960 1970 200019901980 2010
G7
Advanced economies
We believe geopolitical con� ict will become more important in shaping investment outcomes during the next decade. Such con� ict will likely keep risk premiums elevated – primarily for stocks but also for bonds – and may induce bouts of weakness in risk assets, as well as demand for safe havens.
Kurt E. Reiman, Head, Thematic Research WMR-Americas

24 February 2011 The Decade Ahead
Geopolitics
developed countries will likely alternate between the slow lane and the breakdown lane. Economic divergences may have been perfectly acceptable in the past when unemployment was low and declin-ing, however, rich countries may feel pressure to enact protectionist measures to encourage job growth at home, especially as long as unemploy-ment remains high. This dichotomy could also fos-ter animosity among countries over their di� ering � scal and monetary policy choices, not to mention jealousy over the vibrancy of certain fast-growing emerging economies.
Global imbalances in international trade and capi-tal � ows make matters worse (see Fig. 3), par-ticularly as it concerns the increasingly important relationship between China and the US (see page 16 for a more detailed discussion of China’s role in the world). Since the � nancial crisis, China has been slow to let its currency, the yuan, appreci-ate versus the US dollar, mindful that such a move could curb its export competitiveness. But US poli-cymakers – deeply concerned about America’s still wide trade de� cit, not to mention China’s buildup of US dollar-denominated foreign exchange reserves – would prefer to see the dollar weaken modestly to improve US competitiveness overseas and restore its trade balance.
The Federal Reserve’s highly accommodative monetary policy stance and massive balance sheet expansion, while intended to encourage bank lending, reduce unemployment and stave o� de� ationary pressures at home, could pose
tives and income inequality both within and among states.
We believe geopolitics will become much more important in determining economic and � nan-cial market outcomes than in the recent past.1 Widespread economic dislocations, such as higher unemployment, pervasive income inequality2 and more government intervention in economic a� airs tend to corrode domestic political stability (see Fig. 1 and Fig. 2). Heavily indebted governments the world over are struggling to bring budgets back into balance before having � xed the core of the problem: people feel poorer and many have been unemployed for an extended period. How countries address these concerns and whether they are successful in doing so matters critically in an era when the global economy is highly interconnected. The risk is that e� orts to appeal to domestic interests may disrupt preexisting alli-ances, either directly or indirectly, through the use of protectionism, currency and asset devaluation, capital controls, resource embargos and, in certain extreme cases, perhaps even military measures.
Persistent stress between domestic labor and international capitalIn the absence of widespread geopolitical upheaval or internal con� ict, global economic activity is projected to remain strong for the foreseeable future, powered by strong growth in many highly populated emerging markets, such as China and India (see page 28 for a more detailed discussion of emerging market growth). Meanwhile, many
Fig. 3: Global imbalances continue
Source: International Monetary Fund
Current account balance for selected countries and regions, in % of world GDP
1
0
–1
–2
–3
2
4
3
1996 1998 2000 2008200620042002 2010
US
Oil exporters
Germany and Japan
Other CA deficit countries
China and emerging Asia
Rest of the world
Fig. 4: China is the largest foreign owner of US Treasuries
Note: Data unavailable for Russia in November 2005.Source: US Treasury Department
Largest foreign owners of US Treasury securities, in trillions of USD
0.4
0.2
0.0
0.6
1.0
0.8
Russ
ia
Taiw
an
Cana
da
Hong
Kon
g
Carib
bean
bank
ing
Braz
il
Oil
expo
rtersUK
Japa
n
Chin
a
Switz
erla
nd
Nov-10 Nov-05

The Decade Ahead February 2011 25
Geopolitics
have heavily indebted households and businesses (Spain, Portugal). Of the available potential � xes, neither currency devaluation nor a � scal transfer system nor wage and price controls nor massive austerity measures would appear plausible for long. Therefore, the euro seems destined to be reshaped, at � rst through the introduction of new institutional arrangements, such as a Eurozone bond market or even elements of a � scal trans-fer system. If these measures fail to appease all member states, then countries may be forced to withdraw from the union and introduce new cur-rencies, with serious implications for economic growth and global � nancial markets.
Ultimately, weak advanced economies may be tempted to encourage domestic employment growth and investment by embracing policies that are clearly incompatible with the objectives of highly populated, export-oriented economies. These mea-sures could well extend beyond traditional trade protectionism and could include currency devalu-ation, industry subsidies, capital controls and in� a-tionary � scal and monetary policies.
Risks of a traditional geopolitical � are upNations will also continue to confront more tradi-tional geopolitical threats, such as natural resource scarcity, development of military and nuclear weapons capabilities, and fundamental clashes over ideology in the decade ahead.
• Unpredictable weather patterns and rising global food and energy demand have already fueled
longer-term in� ation risks to the US economy and undermine the integrity of the US dollar (see page 57 for a more detailed discussion of in� ation). But these domestic US policies also serve to compli-cate China’s e� orts to rein in in� ation at home as long as the yuan remains tied to the dollar. These policies could also erode the value of the People’s Bank of China’s roughly USD 900 billion holdings of US Treasury bonds – the largest foreign owner-ship stake in the world (see Fig. 4). Ultimately, this demonstrates how policies to address domestic concerns o� en have far-reaching implications and may periodically con� ict with the interests of other countries, as well as those of the established regional alliances and multinational business inter-ests that were formed in recent years.
Even when policies are tightly coordinated among countries, as is the case with the sovereign debt crisis in Europe, there are rarely obvious or straight-forward solutions (see page 68 for a more detailed discussion of sovereign debt concerns). The Eurozone’s sovereign debt woes are � rmly rooted in di� erences in competitiveness among member states, highly varied � scal and social policy objec-tives and an insuf� cient commitment among gov-ernment of� cials to equalize them. Over many years, these characteristics undermine the viability of a single currency and common monetary policy.
As the � nancial crisis has revealed, some countries within the Eurozone are economically uncom-petitive (Greece, Italy), some are burdened by an insolvent banking sector (Ireland), and some
Fig. 5: Nuclear weapons inventory in Asia
Note: Despite two well-publicized nuclear tests in 2006 and 2009,there is no publicly avialable evidence that North Korea has nuclear warheads in operation.Source: Federation of American Scientists
Range of estimated nuclear warheads, April 2010
150
100
50
0
200
300
250
China Pakistan India North Korea
Fig. 6: Sharp rise in post-Cold War military spending
Note: Data for 1991 are unavailable. Measured at constant 2008 prices and exchange rates.Source: Stockholm International Peace Research Institute
World military expenditures, in trillions of USD
1.0
0.8
1.2
1.6
1.4
1988 19961992 2000 2004 2008

26 February 2011 The Decade Ahead
Geopolitics
high food prices, which have then sparked domestic unrest in recent years. Countries have so far failed to successfully map out a plan to control the rise of greenhouse gas emissions, which raises the potential for cross-border clashes to secure access to precious water and food supplies. E� orts to restrict the availability of scarce food resources through various pro-tectionist measures would only serve to worsen existing water stresses through a decline in “vir-tual” water trade.
• The international community and the United Nations Security Council have been unsuccess-ful in clamping down on states that are aggres-sively pursuing nuclear aspirations (see Fig. 5). Meanwhile, defense spending globally has risen steadily since the turn of the century (see Fig. 6).3
• Oil, natural gas and “rare earth” resources are increasingly concentrated in the hands of a few countries, and the biggest consumers are now dependent on imports from unpredictable sup-pliers to meet demand (see Fig. 7).
• And terrorism threats will never be entirely elimi-nated, no matter what countries do to reduce the risk, because of deeply entrenched ideological views aimed at destabilizing the current world order.
In our view, these stress points could escalate into full-blown con� ict over the next 10 years without a coordinated international e� ort to control them, especially given the high level of economic hard-ship and instability that exists today. In a globally integrated world, countries have an incentive to cooperate and coordinate e� orts, but the recent track record leaves considerable room for doubt.
Knowing when and how to reactThe de� ning geopolitical events of the past 100 years – the two World Wars, the Cuban Missile Crisis, the OPEC oil embargo, the end of the Cold War and the 9/11 terrorist attacks, to name a few – produced highly varied � nancial market out-comes (see Fig. 8).4 Some were long-lasting, some were short-lived. Certain events had a localized impact, while others were truly global. And some destroyed entire countries and disrupted economic activity, while others were less severe.
Geopolitics, therefore, must be understood as a type of risk that interacts with other sources of risk in an investment portfolio. A negative geopolitical event will tend to increase the risk premium and alter the direction of asset prices. Diversi� cation and ongoing risk assessment are important pre-cautionary measures to limit losses, but how one reacts to the shock of a geopolitical event can be just as important as advance planning, if not more so. Even the most astute observers of geopolitical events will not be able to completely insulate their portfolios from geopolitical risk, since the events o� en arrive in the form of unanticipated shocks. Hence, it is just as important that investors con-sider the possible economic and � nancial market outcomes of the various hot spots were they to erupt into a major crisis.
When there is little transmission of a geopoliti-cal shock to the broader economy, as is o� en the case with smaller-scale terrorist attacks, the e� ect on � nancial markets may be only temporary. As a result, the cost of hedging these � eeting risks would likely outweigh the bene� t. However, when a geopolitical event also depresses eco-nomic growth and changes the course of in� a-
Nations will continue to confront more traditional geopolitical threats, such as natural resource scarcity, development of military and nuclear weapons capabilities, and fundamen-tal clashes over ideology in the decade ahead.

The Decade Ahead February 2011 27
tion, then the e� ect on � nancial markets is likely to be more sustained. The direction of the impact will depend on the asset in question, and the magnitude will depend on the severity and resolu-tion of the incident.
Incorporate geopolitics into an investment processAll too o� en, investors spend the vast majority of their time attempting to incorporate quanti� -able variables into their investment process when deciding which assets to own in a portfolio and in which proportion. Macroeconomic data, � nancial market statistics, sentiment indicators, valuation models and polling results all feature prominently in this decision because they can be tracked over time and help to both quantify and qualify the risks. Geopolitical risk, on the other hand, typi-cally enters the discussion toward the end of the process, as a sort of catch-call caveat or reference to all the things that can go wrong when invest-ing in risky assets. Rarely do investors re� ect upon geopolitical risk at the outset of the investment process, along with all the other quanti� able vari-ables, to cra� a view of the investment environ-ment and the associated level of risk that is priced into � nancial markets.
Geopolitical events o� en appear unpredictable and uncertain before they take place. As a result, market participants frequently treat the subject as an a� erthought. However, we think this is a mis-take. Geopolitics can heavily in� uence economic growth and asset returns and can blindside an
investment portfolio. An outburst of geopoliti-cal con� ict will typically prove negative for stocks and, with the exception of a natural resource sup-ply shock and an international liquidation of US Treasury securities, would tend to support govern-ment bond prices. Heightened geopolitical risk would also imply periodic and signi� cant bouts of weakness in stocks, and perhaps even episodes of sustained high volatility.
That said, our view that geopolitical risk will increase over the coming decade does not preclude a material advance in stocks, nor does it imply that our portfolio should be heavily skewed in the direction of government bonds. If evaluated from the outset as part of an investment process, the acknowledgement that geopolitical risk will likely increase can have the e� ect of simply moderat-ing an otherwise overtly optimistic outlook for risk assets, such as stocks, when the macroeconomic outlook and valuation case are both favorable.
Paramount over the next decade, however, is that investors remain aware of the critical and ever-changing geopolitical landscape, understand how these shocks can impact various assets within a portfolio and regard geopolitics as central to the investment case, rather than simply as an a� erthought.
For more information on this subject, please see the UBS research focus entitled “Geopolitics: the blind side” dated June 2010.
Geopolitics
Fig. 8: Different events, countries and outcomes
Source: Dimson, Marsh and Staunton (2008)
Real equity return over selected periods, in %
–40–60–80
–100
–20
4020
6080
0
France Germany Japan WorldUSUK World ex-US
World War I (1914-18)
World War II (1939-48)
Oil shock (1973-74)
Fig. 7: Proven energy reserves
Source: Energy Information Administration
Crude oil, in billion barrels Natural gas, in trillion cubic feet
150
100
50
0
200
300
250
900
600
300
0
1,200
1,800
1,500
Qat
ar
Chin
aUS
Kaza
khst
an
Nig
eria
Liby
a
Russ
ia
UAE
Vene
zuel
a
Kuw
ait
Iraq
Iran
Cana
da
Saud
iAr
abia
Braz
il
Proven crude oil reserves (billion barrels, lhs)
Proven natural gas reserves (trillion cubic feet, rhs)

28 February 2011 The Decade Ahead
Emerging markets: the next big allocation shift
kets – in addition to the disparities in wealth and economic development – have been di� erences in market capitalization, liquidity, transparency and volatility. These issues have become less criti-cal, however, as emerging markets have improved their policy framework and � nancial market infra-structure. As emerging markets have evolved into more appealing candidates for broader investment portfolios, investors have looked with interest to emerging market countries for new ways to diver-sify portfolios, enhance returns and reduce expo-sure to their home markets.
Past disappointments and future opportunitiesJust over a decade ago it appeared as if emerging markets had lost their luster and were destined to become irrelevant to asset allocation decisions. The Asian currency crisis had just exposed the � aws in many of the so-called “Asian Tigers” and triggered a broader sell-o� in � nancial markets that rippled across the entire globe. Despite the appearance of attractive growth prospects, � nan-cial performance kept falling short of expectations.
The Asian crisis notwithstanding, we believe that emerging markets will remain in favor. In our view, the following � ve factors will prompt a material and sustained shi� toward emerging markets over the next decade:
Nearing a tipping pointThe growing appeal of emerging markets rep-resents more than just a fad or a passing fancy. Investors worldwide are increasingly channeling their investments toward emerging market nations to take advantage of the combination of stron-ger economic growth and superior performance prospects. Thus far, the allocation to the emerg-ing world has been modest and largely tactical, or opportunistic, in nature. That is, investors have tended to gravitate toward emerging markets whenever return prospects appear most favorable over short-term horizons. It is our view, however, that emerging market investing has now reached a critical tipping point. Rapid growth, still-surging populations, rising af� uence and a convergence of capital market and regulatory standards are prompting a tectonic shi� away from the devel-oped world and toward the emerging market world. As a result, the investment community is in the early stages of a broader and more sustained shi� into emerging market equities that will materially alter the way portfolios are allocated and managed over the next decade. This shi� will, of course, come with some challenges along the way, but it will also provide a broader set of opportunities for investors to enhance return and manage risk.
From an investment standpoint, what has set developed countries apart from emerging mar-
We believe numerous structural catalysts, such as a lasting economic growth advantage over developed markets, growing market capitalization and improving corporate governance standards, will prompt a strategic asset allocation shift into emerging markets over the next decade.
Stephen R. Freedman, PhD, CFA, Strategist; Mike Ryan, CFA, Chief Investment Strategist

The Decade Ahead February 2011 29
economic policy and investor protection that have been made over the last decade. Fig. 3 tracks the average compliance with international � nancial standards (principles of economic transparency, � nancial regulation, corporate governance and � nancial reporting) for emerging market countries and for the G7 since 2002. While compliance is greater in developed economies, the gap in com-pliance has been narrowing. So while emerging markets still have some catching up to do, we
• Persistent growth advantage • Growing market capitalization• Greater ease of access• Expanding investable frontier• Structural headwinds in the developed world
Persistent growth advantagePerhaps the most compelling catalyst to prompt a reallocation of assets into the emerging mar-kets over the next decade stems from their continued strong growth prospects. While emerging markets have periodically enjoyed superior growth rates compared with developed countries, the advance has been volatile and uneven. As Fig. 1 illustrates, while growth in the emerging market world has outpaced growth in advanced economies over the past 30 years, this growth has also been highly variable.
Optimism for emerging market investments on account of attractive growth prospects is noth-ing new. Yet, in the past, disappointing invest-ment outcomes have de� ated such optimism. For instance, the Latin American debt crisis in the 1980s or the Mexican and Asian � nancial crises in the 1990s were all preceded by phases of great hopes and high expectations that were ultimately dashed. In other instances, phases of strong eco-nomic growth in emerging economies failed to translate into meaningful investment returns. This was the case in China until the mid-2000s.
However, emerging markets now seem to have reached an in� ection point. Not only are the emerging markets contributing a larger portion to global growth than ever before, this growth also appears more sustainable and the underlying economies less crisis-prone than in the past. Many of these countries have improved their macroeco-nomic policymaking framework and improved their resilience to economic and � nancial crises. This becomes immediately clear when one looks at the marked improvement in sovereign credit rat-ings in recent years (see Fig. 2).
More important, we believe that improvements within emerging economies and their � nancial market architecture now make it more likely that positive growth outcomes will translate into � nan-cial performance. The key is the improvements in
Emerging markets
Fig. 1: EM growth has outpaced developed markets since 1980
Source: International Monetary Fund
Real GDP growth, in %
6
4
2
0
–2
–4
8
10
Emerging and developing economiesAdvanced economies
1980 1984 1988 1992 1996 2000 2004 2008
Fig. 2: Higher debt ratings reflect greater stability
Source: Bloomberg, Moody’s, UBS WMR
Moody’s foreign-currency long-term debt rating
AaaAa1Aa2Aa3 China 2011A1A2A3 China 2000Baa1 Russia 2011
Investment Grade Baa2Baa3 India 2011 Brazil 2011Ba1
Speculative Grade Ba2 India 2000Ba3B1B2 Brazil 2000
B3 Russia 2000
Caa1Caa2Caa3CaC

30 February 2011 The Decade Ahead
believe further progress will continue to prompt increased international interest in their markets. In particular, the increased shareholder focus has also meant that pro� tability measures have improved. We expect these trends to continue, and in combi-nation with the growth advantage, to elevate the pro� le of emerging market investments.
Growing market capitalizationWhile the investment experience with emerging markets during the 1990s is remembered for the Mexican peso crisis (1994) and the Asian � nancial crisis (1997-98), ironically it is during this decade that a signi� cant trend was set in motion – and is still ongoing. During the last two decades, emerging markets have experienced a signi� cant maturing and a steady deepening of their capi-tal markets. As Fig. 4 illustrates, there has been a meaningful shi� in relative market capitalization between developed and emerging markets over this time period.
The increased share of emerging market equities in the global investable equity universe is a result of two factors. First, emerging markets have out-performed developed markets in recent years, a fact that is re� ected in shi� s in relative market capitalization. Second, and perhaps more impor-tant, the depth of stock markets in the emerging world has expanded thanks to a signi� cant pickup in equity issuance activity. While emerging markets accounted for a mere 12% of global IPOs from 2001 to 2005, this share rose to 35% during the second half of the last decade (see Fig. 5).
As emerging markets take on a greater share of global equity market capitalization, a greater pro-portion of invested assets is likely to � ow toward emerging markets over time. Yet, while there have clearly been major in� ows into emerging markets, many investors have not signi� cantly adjusted their strategic benchmark allocations to emerging markets, leaving their allotted exposures still well short of emerging markets’ actual share of global stock market capitalization (see Fig. 6).
So as this market capitalization trend continues over the next decade, we believe there will be a continued asset shi� toward emerging markets, as investors rebalance portfolios to a new baseline.
Emerging markets
Fig. 5: IPO growth in emerging markets
Source: Bloomberg
Initial public offerings, in trillions of USD
2006–20102001–2005
1.2
1.0
0.8
0.6
0.4
0.2
0
1.4
Emerging marketsDeveloped markets
Fig. 4: EM accounts for increasing share of global equities
Source: MSCI
EM share of global equity market capitalization, in %
8
4
0
12
16
1988 1991 1994 1997 2000 2003 2006 2009
Fig. 3: International standards slowly converging
Source: eStandards Forum Financial Standards Foundation, UBS WMR
Compliance score for international standards
40
20
0
60
80
Average G7Average EM Difference
2002 2003 2004 2005 2006 2007 2008 2009 2010 2011
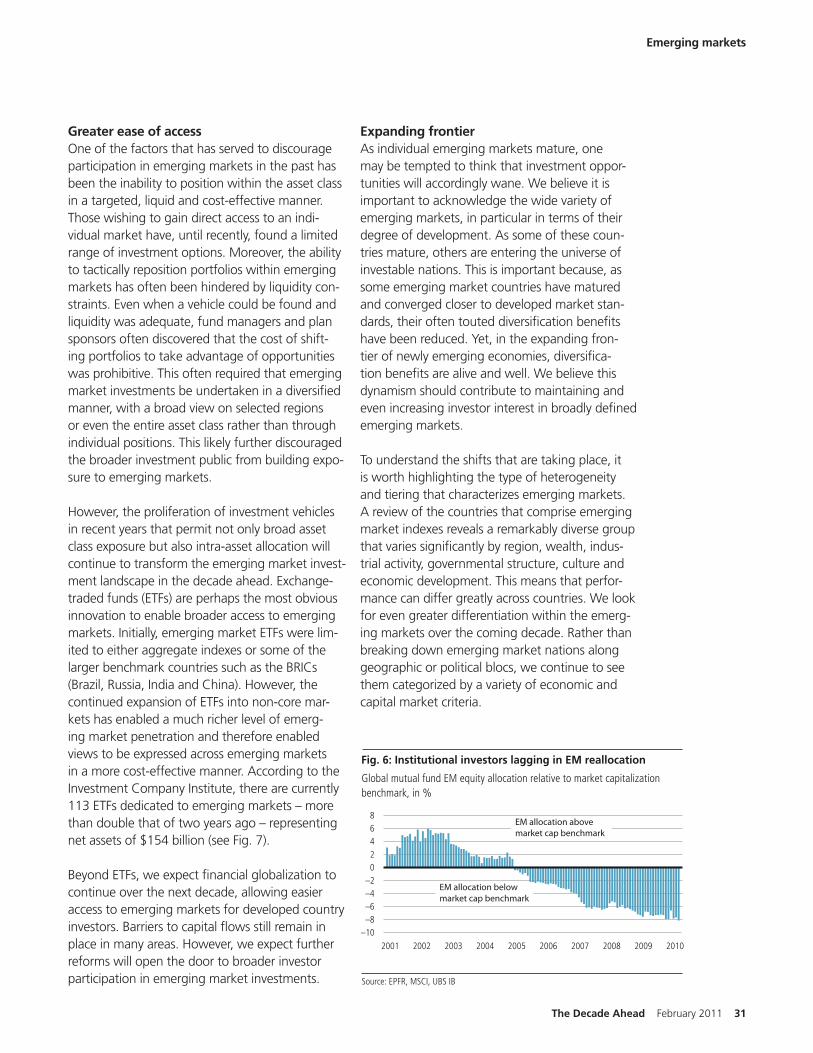
The Decade Ahead February 2011 31
Greater ease of accessOne of the factors that has served to discourage participation in emerging markets in the past has been the inability to position within the asset class in a targeted, liquid and cost-e� ective manner. Those wishing to gain direct access to an indi-vidual market have, until recently, found a limited range of investment options. Moreover, the ability to tactically reposition portfolios within emerging markets has o� en been hindered by liquidity con-straints. Even when a vehicle could be found and liquidity was adequate, fund managers and plan sponsors o� en discovered that the cost of shi� -ing portfolios to take advantage of opportunities was prohibitive. This o� en required that emerging market investments be undertaken in a diversi� ed manner, with a broad view on selected regions or even the entire asset class rather than through individual positions. This likely further discouraged the broader investment public from building expo-sure to emerging markets.
However, the proliferation of investment vehicles in recent years that permit not only broad asset class exposure but also intra-asset allocation will continue to transform the emerging market invest-ment landscape in the decade ahead. Exchange-traded funds (ETFs) are perhaps the most obvious innovation to enable broader access to emerging markets. Initially, emerging market ETFs were lim-ited to either aggregate indexes or some of the larger benchmark countries such as the BRICs (Brazil, Russia, India and China). However, the continued expansion of ETFs into non-core mar-kets has enabled a much richer level of emerg-ing market penetration and therefore enabled views to be expressed across emerging markets in a more cost-e� ective manner. According to the Investment Company Institute, there are currently 113 ETFs dedicated to emerging markets – more than double that of two years ago – representing net assets of $154 billion (see Fig. 7).
Beyond ETFs, we expect � nancial globalization to continue over the next decade, allowing easier access to emerging markets for developed country investors. Barriers to capital � ows still remain in place in many areas. However, we expect further reforms will open the door to broader investor participation in emerging market investments.
Emerging markets
Expanding frontierAs individual emerging markets mature, one may be tempted to think that investment oppor-tunities will accordingly wane. We believe it is important to acknowledge the wide variety of emerging markets, in particular in terms of their degree of development. As some of these coun-tries mature, others are entering the universe of investable nations. This is important because, as some emerging market countries have matured and converged closer to developed market stan-dards, their o� en touted diversi� cation bene� ts have been reduced. Yet, in the expanding fron-tier of newly emerging economies, diversi� ca-tion bene� ts are alive and well. We believe this dynamism should contribute to maintaining and even increasing investor interest in broadly de� ned emerging markets.
To understand the shi� s that are taking place, it is worth highlighting the type of heterogeneity and tiering that characterizes emerging markets. A review of the countries that comprise emerging market indexes reveals a remarkably diverse group that varies signi� cantly by region, wealth, indus-trial activity, governmental structure, culture and economic development. This means that perfor-mance can di� er greatly across countries. We look for even greater di� erentiation within the emerg-ing markets over the coming decade. Rather than breaking down emerging market nations along geographic or political blocs, we continue to see them categorized by a variety of economic and capital market criteria.
Fig. 6: Institutional investors lagging in EM reallocation
Source: EPFR, MSCI, UBS IB
Global mutual fund EM equity allocation relative to market capitalization benchmark, in %
420
–2–4–6–8
–10
68
2001 2002 2003 2004 2005 2006 2007 2008 2009 2010
EM allocation above market cap benchmark
EM allocation below market cap benchmark

32 February 2011 The Decade Ahead
broad-based � scal consolidation. Moreover, these structural challenges are not exclusive to the US. Similar headwinds confront most of the developed world, including the Eurozone, the UK and Japan. In other words, these challenges represent some-thing of a millstone for most of the major players in the developed world.
Emerging markets, in contrast, face few of the structural roadblocks mentioned above and appear to exhibit fewer systemic weaknesses than they have in the past. Instead of a debt-burdened consumer sector, many emerging markets are con-tending with a surplus in savings, and national bal-ance sheets that are overall much more solid than they were in the past. Besides making the underly-ing economies less vulnerable, the large pool of savings and massive foreign exchange reserves represent a source of potential future invest-ment growth without the need to rely on foreign sources of � nancing (see Fig. 8).
Moreover, although the � nancial crisis impacted � nancial institutions within emerging markets, most exited the crisis in much better shape than their counterparts in the developed world, having avoided many of the problem areas that continue to weigh heavily upon Western banks. Finally, the � scal positions in a great many emerging market nations are in far better shape than those in devel-oped countries. According to the International Monetary Fund (IMF), both current budget de� -cits and debt-to-GDP ratios for BRIC countries are materially lower than for the traditional G7 bloc.
The top tier includes South Korea and Taiwan, which are already considered developed markets in most bond indexes and will likely be included in developed equity market indexes within a decade. The BRICs are o� en seen as forming the next tier, but they may eventually go their separate ways in investors’ minds, as they are very di� erent coun-tries with little in common other than their large size. China may need a category all of its own, as it is already among the world’s largest econo-mies and equity markets, yet is still far from fully developed (see page 16 for a more detailed dis-cussion of the outlook for China). OECD mem-bers, such as Mexico, Turkey and Chile, might be considered as a group: countries that are smaller than the BRICs but rank higher in terms of per capita income.
The next tier, o� en referred to as “frontier mar-kets,” include a wide assortment of nations, such as Argentina, Bahrain, Nigeria, Pakistan and Vietnam. These countries have potential but would have to show further development to attract widespread interest from global equity investors. Over the next decade, there is likely to be continued mobility within the tiers, as well as the emergence of new players, as China’s reach for resources triggers development within Africa. This continued increase in segmentation and broadening of these tiers will only further encour-age expansion of a strategic allocation shi� into emerging markets.
Structural headwind shi� toward developed worldThe emerging market reallocation process will not be driven exclusively by the positive attributes the emerging market nations now possess, but also by the negative attributes they lack. As George Magnus1 points out in his 2010 book, Uprising, the global � nancial crisis has the potential to radi-cally reshape the world in the decade ahead. This is in part due to the structural damage caused by – or perhaps merely revealed by – the crisis itself. Keep in mind that the US will face three mate-rial structural challenges in coming years, which together portend an extended period of subop-timal growth: 1) the continued deleveraging of the consumer sector; 2) ongoing recapitaliza-tion of the � nancial system; and 3) prospects for
Emerging markets
Fig. 7: EM equity ETFs increasing in number and size
Source: Investment Company Institute
Number of emerging market equity ETFs Net assets, in billions of USD
Dec 2010Jan 2009
80
40
0
120
120
60
0
180
Net assets (rhs)Number of funds (lhs)

The Decade Ahead February 2011 33
are beginning to take their solid fundamentals for granted. A� er years of tough � scal choices, there are signs that policy discipline is diminishing. Examples include Brazil’s considerable increase in public spending or Turkey’s sudden monetary policy loosening. To achieve their growth poten-tial during the next decade, these emerging mar-ket economies will have to keep the responsible policies they have adopted in past years.
• Liquidity has improved markedly within most emerging market segments amid a con-tinued deepening of capital markets, broadening of the investor base and the emergence of more stable and consistent intermediaries. However, liquidity is uneven, and “gaps” emerge during periods of heightened market volatility, geopoliti-cal turmoil and localized events.
• The level of transparency within emerging market countries is also typically lower than that of the developed world, despite improve-ments stemming from the application of informa-tion technology and global push for improved governance. This suggests that greater care is needed when selecting investments and greater skepticism when relying on data and statistics.
• Property rights and the rule of law also tend to lag developed market standards. The adjudication of disputes, ability to exploit innovations and honoring of business contracts are hardly uniform either within countries or across the entire spectrum of emerging markets.
Emerging markets to outperform during the decadeWe believe that the described allocation shi� into emerging market equities will lead to outperfor-mance versus developed market equities during the decade. Using a framework similar to the one we employ to calculate the average return for US equities (8.5 to 9%) on page 67, we conclude that average annual emerging market returns could outpace those of the US and other devel-oped markets by up to 6%. This is the result of expected di� erences in earnings growth, dividend yield and multiple expansion. We factor in a 4 per-centage point earnings growth advantage and a 0.5 percentage point dividend yield disadvantage for emerging markets. Finally, while we assume no multiple expansion in the US for the decade ahead, we assume that emerging market price-to-earnings multiples will converge to the aver-age value observed in developed economies over the last 23 years. This suggests that multiple expansion in emerging markets will contribute 2.5 percentage point annually in excess of US equity returns.
Not without risksWhile the decade ahead will be marked by a con-tinued shi� into emerging markets, as investors seek to enhance returns and diversify their country exposures, the process will not be without risks or periodic setbacks. Emerging markets still possess certain risk characteristics that set them apart from the developed world. Investors must be cognizant of the risks and limitations of emerging market investing. Consider the following:
• Emerging markets are crisis-prone due to a number of factors, including the lack of market depth and lack of institutional structure. A large increase in capital in� ows can over-whelm markets that lack the capacity to e� ec-tively absorb and deploy such capital. This can lead to asset bubbles, market mispricings and political corruption. Moreover, the business cycle in emerging markets is still very much alive. They will continue to experience periodic recessions despite a positive structural outlook.
• A risk of complacency exists. Policy makers and elected of� cials in some emerging market nations
Emerging markets
Fig. 8: FX reserve accumulation reduces EM vulnerability
Source: Bloomberg
International reserve assets excluding gold, in trillions of USD
2.0
1.0
0
3.0
4.0
BRICsG7
2001 2002 2003 2004 2005 2006 2007 2008 2009 2010

34 February 2011 The Decade Ahead
markets intermittently over the next decade. While certain countries and even entire regions will continue to prosper from rising af� uence and expanding trade, others will su� er from both structural limitations and self-in� icted injuries due to poor leadership. However, there is likely to be a sustained strategic shi� into emerging market equities throughout the decade. Many emerging markets have already emerged and will continue to do so, but positioning within those markets will still require great care and judgment. This will demand greater diligence and heightened market surveillance on the part of investors but, in return, will yield improved return prospects and select opportunities for broader portfolio diversi� cation.
This can lead to � nancial returns that lag eco-nomic growth.
• Certain areas still bear signi� cant expo-sure to potentially dangerous in� uences, such as terror threats, illegal enterprises, black market competitors and an underdeveloped political culture and infrastructure. Return expectations can shi� with changes in leader-ship, revisions of existing laws or merely the reinterpretation of existing regulation.
The shi� goes onEmerging markets will still face periods of elevated volatility and are apt to underperform developed
Emerging markets
Emerging markets have emerged—and will continue to do so. They have earned a newfound respect from global investors who are increasingly being drawn to strong growth prospects and superior returns of-fered by developing nations.

The Decade Ahead February 2011 35
Emerging consumers: more people, more money
USD 30 trillion to nearly USD 110 trillion by 2020, and the “E7” emerging markets – China, India, Brazil, Russia, Mexico, Indonesia and Turkey – should account for over 40% of that increase (see Fig. 1). Although emerging market countries may grow more slowly than in the previous decade, especially China and Russia, we expect the E7’s projected USD 14 trillion contribution to global GDP growth will be nearly double that of the G7 countries: US, Japan, Germany, UK, France, Italy and Canada. Moreover, parts of the world that have been cut o� from global institutions and economic development will likely begin to see an acceleration of growth, particularly some of the
Beyond the basicsAs emerging markets continue to develop, we believe the resulting growth in the middle class will fuel demand for a variety of consumer prod-ucts and services, from the most basic human needs of food, clothing and shelter, to healthcare, education and more discretionary items, such as household appliances, autos, luxury goods and travel. We expect urban populations to increase as the middle class expands, and the growing number of city residents to spark a shi� in con-sumption toward more value-added goods. Rising consumer expenditures in emerging markets may be expected to buoy local � rms, as well as multi-national companies with an established presence in these countries.
The focal point of emerging markets growth has been the “BRIC” countries – Brazil, Russia, India and China – and we continue to expect these countries to generate an outsized contribution to global growth over the next 10 years. As the decade matures, however, we believe other coun-tries may begin to play an increasingly important role in driving growth, including countries such as Indonesia and a number of those on the African continent.
Driving global growthWe project1 global GDP will expand by more than
We believe consumption in emerging market countries is poised to expand over the next decade as personal incomes rise. This may be a consensus view, but the potential of a prolonged expansion in global consumption may o� er a broader set of opportunities than investors anticipate.
Sally Dessloch, Analyst
Fig. 1: Emerging markets are the engine of global GDP growth
Source: UBS WMR estimates based on Penn World Table 6.1 data
Contribution to global GDP growth, in %, 2010–20
G7 countries22%
Rest of world37%
E7 countries 41%
E7 countries 41%
G7 countries22%
Rest of world37%
Source: UBS WMR estimates based on Penn World Table 6.3 data
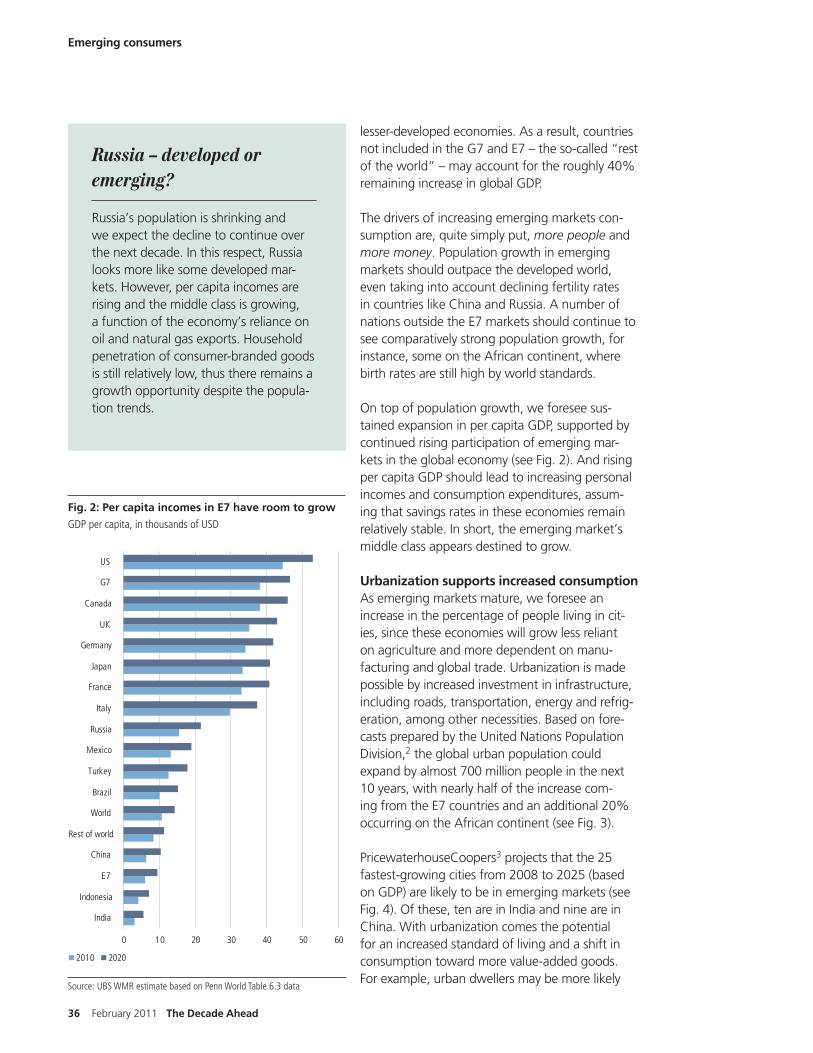
36 February 2011 The Decade Ahead
lesser-developed economies. As a result, countries not included in the G7 and E7 – the so-called “rest of the world” – may account for the roughly 40% remaining increase in global GDP.
The drivers of increasing emerging markets con-sumption are, quite simply put, more people and more money. Population growth in emerging markets should outpace the developed world, even taking into account declining fertility rates in countries like China and Russia. A number of nations outside the E7 markets should continue to see comparatively strong population growth, for instance, some on the African continent, where birth rates are still high by world standards.
On top of population growth, we foresee sus-tained expansion in per capita GDP, supported by continued rising participation of emerging mar-kets in the global economy (see Fig. 2). And rising per capita GDP should lead to increasing personal incomes and consumption expenditures, assum-ing that savings rates in these economies remain relatively stable. In short, the emerging market’s middle class appears destined to grow.
Urbanization supports increased consumptionAs emerging markets mature, we foresee an increase in the percentage of people living in cit-ies, since these economies will grow less reliant on agriculture and more dependent on manu-facturing and global trade. Urbanization is made possible by increased investment in infrastructure, including roads, transportation, energy and refrig-eration, among other necessities. Based on fore-casts prepared by the United Nations Population Division,2 the global urban population could expand by almost 700 million people in the next 10 years, with nearly half of the increase com-ing from the E7 countries and an additional 20% occurring on the African continent (see Fig. 3).
PricewaterhouseCoopers3 projects that the 25 fastest-growing cities from 2008 to 2025 (based on GDP) are likely to be in emerging markets (see Fig. 4). Of these, ten are in India and nine are in China. With urbanization comes the potential for an increased standard of living and a shi� in consumption toward more value-added goods. For example, urban dwellers may be more likely
Fig. 2: Per capita incomes in E7 have room to grow
GDP per capita, in thousands of USD
0 10 20 30 40 50 60
India
Indonesia
E7
China
Rest of world
World
Brazil
Turkey
Mexico
Russia
Italy
France
Japan
Germany
UK
Canada
G7
US
2010 2020
Emerging consumers
Source: UBS WMR estimate based on Penn World Table 6.3 data
Russia – developed or emerging?
Russia’s population is shrinking and we expect the decline to continue over the next decade. In this respect, Russia looks more like some developed mar-kets. However, per capita incomes are rising and the middle class is growing, a function of the economy’s reliance on oil and natural gas exports. Household penetration of consumer-branded goods is still relatively low, thus there remains a growth opportunity despite the popula-tion trends.

The Decade Ahead February 2011 37
Emerging consumers
Fig. 3: Expect 700mn more people in cities by 2020
Source of incremental urban population, in millions
Fig. 4: Emerging markets cities will grow rapidly
25 fastest growing cities by GDP 2008-2025
China
India
Afghanistan
Nigeria
Tanzania
Vietnam
Ethiopia
Lucknow
Kabul
Delhi
BangaloreChennai
Ahmedabad
Lagos
Pune
Hyderabad
Guangzhou
Ho Chi Min City
Chongqing
Beijing
Shanghai
Addis Ababa
Hanoi
Changchun
Xian
Surat
Kanpur
Jaipur Chengdu
Shenyang
Dar es Salaam
Tianjin
Source: Population Division of the Department of Economic and Social A� airs of the United Nations Secretariat, World Population Prospects: The 2008 Revi-sion and World Urbanization Prospects: The 2009 Revision
150,922 19,29798,869 18,006
10,445 9,305
(1,810)
China India Brazil Mexico Indonesia Turkey Africa Developed worldRussia
156,127 58,279
Source: PricewaterhouseCoopers UK Economic Outlook, November 2009

38 February 2011 The Decade Ahead
The competitive dynamics vary by country and by sector; in some markets, the local competition is formidable, but in others, multinational companies are well-established and their brands enjoy strong recognition. Restaurants. A number of fast food restaurant chains have invested heavily in emerging markets, and are enjoying good growth.
In these two areas, the global players that com-pete most successfully in these countries are those that have invested consistently over time – attain-ing “� rst mover” advantage vs. other developed market peers. The successful global competitors also have been adroit at tailoring their products to appeal to local tastes and a� ordability. It cannot
to consume packaged beverages, convenient processed foods and restaurant meals, as well as other consumer services.
A hierarchy of spendingConsumption of consumer goods and services is closely tied to rising personal income. As per cap-ita incomes increase, emerging market consumers � rst address their most immediate needs: basic foodstu� s, clothing and shelter. When consum-ers move beyond subsistence living, their choices become more discretionary but still skew to the more a� ordable pleasures, typically including packaged beverages and foods, basic household and personal care items and tobacco. Growth initially is driven by increased penetration, but therea� er may be stimulated by greater frequency of purchase. Along with the increase in personal incomes comes an increase in demand for more costly and discretionary consumer goods, such as appliances, media, autos, apparel, luxury goods and leisure pursuits.
Per capita consumption of consumer goods tends to rise rapidly with increasing levels of per capita personal income but, at some point, unit growth moderates as needs are met. When growth in per capita unit consumption begins to level o� , con-sumer goods companies will typically attempt to “trade up” the consumer to higher value-added products in order to capitalize on the growing wal-let of middle income consumers, thereby driving sales and pro� t growth. And as consumer goods companies begin to achieve scale in emerging markets, pro� t margins should expand, increasing investment returns.
Who stands to bene� t?In general, a broad range of consumer-oriented companies, both local and multinational, stand to bene� t from rising emerging market consumer incomes over the coming decade. A detailed dis-cussion of each of these sectors and industries is beyond the scope of this report, but here are two worth highlighting:
Consumer staples. Packaged goods companies are well-positioned to bene� t from increased con-sumer spending, as more people attain middle class status, and as urbanization pushes forward.
Fig. 5: Most emerging markets consumers pay more of their healthcare costs out of pocket
Out-of-pocket healthcare costs as a share of private expenditure on health, in %
0% 20% 40% 60% 80% 100%
US
France
Canada
Germany
Brazil
UK
Indonesia
Turkey
Japan
Russia
Italy
India
China
Mexico
Emerging consumers
Source: World Health Organization, World Health Statistics 2010 Report. Data as of 2007.

The Decade Ahead February 2011 39
Emerging consumers
be overemphasized – what works in a developed market may not work in a developing one, and even among developing markets, consumer tastes vary. This places a premium on having an in-depth understanding of the local consumer, a skill that a number of multinational marketers are bringing to bear in these countries.
Healthcare. Currently, healthcare expenditures in emerging markets are modest as a share of GDP, constrained by the lack of public healthcare coverage. However, spending on healthcare may grow alongside increases in per capita incomes. Consumer out-of-pocket costs are high, placing greater importance on cheaper traditional medi-cines, as well as over-the-counter and generic drugs (see Fig. 5). Emerging pharmaceutical markets tend to be highly fragmented now, and large-cap multinationals have relatively modest market share. Of course, this presents a longer-term opportunity for companies that are willing to adapt to the requirements of local markets. Over time, aging populations and rising incidence of chronic disease should support increasing demand. Similarly, private health insurance – as well as other types of insurance products – may see good growth in emerging markets such as China, where there is limited government-spon-sored coverage. To date, these markets are in the very early stages of development.
Beyond the above-mentioned sectors and indus-tries, there are a number of others that should grow over the coming decade – due to rising per capita incomes in emerging markets – including consumer discretionary industries such as auto, apparel and luxury goods manufacturers, among others.
What could derail the emerging market consumer?Our constructive view of emerging markets con-sumption growth is not without risks. Although each market is unique, adequacy of infrastruc-ture and healthcare, availability of water, demo-graphics, education and the role of government are issues that many countries have in common. Additionally, inequality of income distribution may become more pronounced in some coun-tries as incomes rise, possibly leading to social
China – increased consumption is key
China will continue to be a major part of the emerging mar-kets growth story. (Refer to the chapter beginning on page 16 for a more detailed discussion on China and its role in world a� airs). Chinese consumers do not spend as much of their incomes as do other emerging markets consumers (see Fig. 6), and sparking consumption growth in China is one key to restoring better balance to its international trade � ows. We think there are cultural factors at play in the Chinese propensity to save, but also believe government policies can in� uence behavior. The steep savings rate can be explained in part by the relative lack of publicly funded healthcare and retirement plans, as well as the need for Chinese families to save for education (schooling is o� en only free through middle school). China’s one-child policy may also in� uence savings behavior: its population is aging rapidly, and there will be fewer children supporting their aging relatives. Moreover, China’s gender imbalance will grow in the decade ahead. A relaxation of the one-child policy could help, although the bene� ts would take much longer than a decade to materialize.
The government has taken some steps to broaden healthcare coverage in China, and could further modify policy to lighten the savings burden on individuals. Many observers expect that a new � ve-year plan to be released this year may re� ect an increased emphasis on improving the quality of life in China, which may also address the building inequalities in income distribution.
0
10
20
30
40
50
60
70
80
W
orld
Ch
ina
Ru
ssia
In
dia
In
done
sia
Br
azil
M
exic
o
U
S
Tu
rkey
2010 2012
Source: World Bank (www.worldbank.org)
Fig. 6: Consumption is comparatively low in China
Private consumption as a share of GDP, in %

40 February 2011 The Decade Ahead
Emerging consumers
India – the next decade
We view India as one of the key emerging market opportunities over the next decade. Its population is growing more quickly than other E7 members, and it is a young country: According to World Bank esti-mates, half of its population is under the age of 25. To fully capitalize on its growth potential, India has to address its lack of infrastructure and need for better educa-tion and healthcare. Also, it must create more jobs for its growing population. We believe that, over the next 10 years, India will devote attention to these issues and play a greater role in global growth. India’s youthful population makes it an attractive market for a number of consumer goods manufacturers.
In general, a broad range of consumer-oriented companies, both local and multinational, stand to bene� t from rising emerging market consumer incomes over the coming decade.
unrest. Also, if in� ation in emerging markets rises sharply, a greater share of consumer income may be required to cover necessities, limiting more dis-cretionary purchases. Finally, international trade imbalances could give rise to protectionism in developed markets, suppressing potential growth in emerging markets.

The Decade Ahead February 2011 41
Energy: Alternatives threaten oil’s dominance
lar have increased demand for hard assets, such as crude oil, which tend to adjust over time to changes in the price level (see page 57 for a more detailed discussion of in� ation). Taken together, there are many factors that explain today’s high oil prices and the potential for even higher prices in the future.
However, high oil prices are unleashing sizable � nancial and intellectual resources to take advan-tage of cheaper energy sources that exist today, such as natural gas, as well as to improve the cost competitiveness of renewable energy sources. Oil therefore faces signi� cant competition at current price levels, and the race is on to develop lower-
The search for alternativesAs the 2010 Gulf of Mexico oil spill made tragi-cally clear, the seemingly unquenchable thirst for crude oil has sent the oil industry in search of increasingly complex and technologically challeng-ing deposits. Whether in ultra-deepwater, arctic regions or oil sands, the development of large new oil basins is both costly and risky. Compounding these supply constraints, global oil demand is pro-jected to expand as a result of continued strong growth in emerging markets (see page 28 for a more detailed discussion of emerging markets). In addition, concerns that overly accommodative US monetary and � scal policies will one day lead to in� ation and further weakness in the US dol-
High oil prices, rising energy security concerns and environmental awareness are encouraging businesses and consumers to embrace alternatives to oil. Natural gas stands out as the prime bene� ciary, but batteries and solar also have potential.
Nicole Decker, Analyst; David Le� owitz, CFA, Strategist
Fig. 1: Crude oil is one of the most expensive fuel sources
Source: Bloomberg
Price, in USD per British thermal unit
0
3
6
9
18
15
12
Oil Natural gas Coal
Fig. 2: Sharp increase in oil price relative to natural gas
Source: Bloomberg, US Department of Energy
Crude oil price relative to US natural gas prices, in USD
8
4
0
20
16
12
1985 1990 1995 2000 2005 2010

42 February 2011 The Decade Ahead
result of the scale of this price divergence between oil and natural gas.
The price gap between oil and electricity is also somewhat a function of low natural gas prices. Electricity prices generally move in sync with natu-ral gas prices because natural gas-� red power plants, which generate about 20% of US electric-ity needs, are the marginal producers of electric-ity. Consumers also have a hard time switching to electricity and away from oil products because there are hardly any vehicles that run on electric-ity. However, as we will soon show, businesses are rushing to facilitate a shi� from relatively expen-sive oil to other alternatives.
Energy security concerns on the riseIn addition to the � nancial incentives to develop oil substitutes, evolving government priorities to enhance energy security are also encouraging the development of alternative energy sources. China’s growing thirst for oil has forced the Western world to compete for oil resources for the � rst time in 60 years.3 This new dynamic, com-bined with the long-term reality that oil supplies are concentrated in politically unstable regions of the world, is driving e� orts to secure supplies, reduce dependence on imports and develop domestic sources of supply to meet expected future energy needs. The combination of struc-turally higher prices, demands for energy security and heightened environmental awareness have raised the pro� le and importance of improving energy ef� ciency. Global fuel economy standards,
cost alternatives. This will result in a transforma-tion not only in the types of fuels used to power industry and heat homes, but also in the sources of energy employed to propel our vehicles and light our cities. While renewable energy sources will gain share, more traditional domestic energy sources, such as natural gas, will play a crucial role in reducing dependence on imported energy in the decade ahead.
The trillion dollar opportunityThe most striking feature in energy markets, and one that we think has the greatest potential to transform the energy resource base over the next decade, is the high cost of oil relative to both natural gas and coal (see Fig 1). This is a relatively recent phenomenon. Fig. 2 and Fig. 3 show that this price discrepancy has rarely, if ever, been so high. This gap results from di� erent supply and demand dynamics in various segments of the energy market and the inability to quickly sub-stitute fuels other than oil byproducts to power global transportation networks. A� er all, oil is pri-marily a transportation fuel, for which infrastruc-ture is well-entrenched.
Natural gas prices have been in a steady decline since 2008 primarily as a result of new drilling techniques in North America (called “hydraulic fracturing” or simply “fracking”) that enable drill-ers to tap gas reserves in shale rock, where it was formerly inef� cient and uneconomic to drill.1 In addition, the ability to transport natural gas glob-ally as a result of lique� ed natural gas technology has allowed producers to develop large natu-ral gas reserves that were previously considered stranded, due to the lack of proximity to end markets. Meanwhile, oil markets have tightened, as growth in supply has failed to keep pace with demand. This is primarily due to the surge in demand for transportation fuels in emerging mar-kets, which has, in turn, boosted the increase in worldwide oil demand.
Consequently, the traditional oil-to-natural gas price relationship has broken down as current market prices adjust to re� ect these forces.2 With oil prices well above historical parity levels, it is fair to say that oil producers are reaping over USD 1 trillion of excess revenues annually as a
Fig. 3: Oil cost relative to electricity rivals 1970s peak
Source: Bloomberg, US Department of Energy
Oil price relative to US retail electricity prices, in USD
4
2
0
10
12
8
6
1970 1990198519801975 1995 2000 2005 2010
Energy
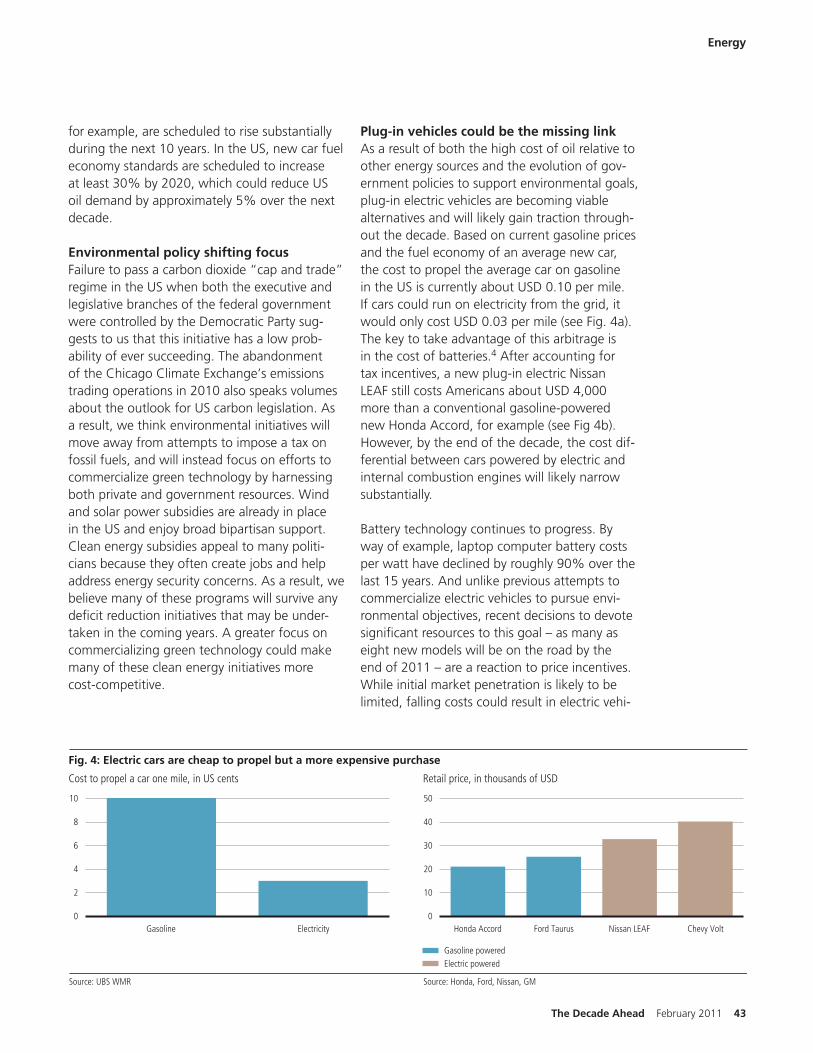
The Decade Ahead February 2011 43
Energy
Plug-in vehicles could be the missing linkAs a result of both the high cost of oil relative to other energy sources and the evolution of gov-ernment policies to support environmental goals, plug-in electric vehicles are becoming viable alternatives and will likely gain traction through-out the decade. Based on current gasoline prices and the fuel economy of an average new car, the cost to propel the average car on gasoline in the US is currently about USD 0.10 per mile. If cars could run on electricity from the grid, it would only cost USD 0.03 per mile (see Fig. 4a). The key to take advantage of this arbitrage is in the cost of batteries.4 A� er accounting for tax incentives, a new plug-in electric Nissan LEAF still costs Americans about USD 4,000 more than a conventional gasoline-powered new Honda Accord, for example (see Fig 4b). However, by the end of the decade, the cost dif-ferential between cars powered by electric and internal combustion engines will likely narrow substantially.
Battery technology continues to progress. By way of example, laptop computer battery costs per watt have declined by roughly 90% over the last 15 years. And unlike previous attempts to commercialize electric vehicles to pursue envi-ronmental objectives, recent decisions to devote signi� cant resources to this goal – as many as eight new models will be on the road by the end of 2011 – are a reaction to price incentives. While initial market penetration is likely to be limited, falling costs could result in electric vehi-
for example, are scheduled to rise substantially during the next 10 years. In the US, new car fuel economy standards are scheduled to increase at least 30% by 2020, which could reduce US oil demand by approximately 5% over the next decade.
Environmental policy shi� ing focusFailure to pass a carbon dioxide “cap and trade” regime in the US when both the executive and legislative branches of the federal government were controlled by the Democratic Party sug-gests to us that this initiative has a low prob-ability of ever succeeding. The abandonment of the Chicago Climate Exchange’s emissions trading operations in 2010 also speaks volumes about the outlook for US carbon legislation. As a result, we think environmental initiatives will move away from attempts to impose a tax on fossil fuels, and will instead focus on e� orts to commercialize green technology by harnessing both private and government resources. Wind and solar power subsidies are already in place in the US and enjoy broad bipartisan support. Clean energy subsidies appeal to many politi-cians because they o� en create jobs and help address energy security concerns. As a result, we believe many of these programs will survive any de� cit reduction initiatives that may be under-taken in the coming years. A greater focus on commercializing green technology could make many of these clean energy initiatives more cost-competitive.
Fig. 4: Electric cars are cheap to propel but a more expensive purchase
Source: UBS WMR
Cost to propel a car one mile, in US cents
0
6
4
2
8
10
Gasoline Electricity
Source: Honda, Ford, Nissan, GM
Retail price, in thousands of USD
0
30
20
10
40
50
Nissan LEAFFord TaurusHonda Accord Chevy Volt
Electric poweredGasoline powered

44 February 2011 The Decade Ahead
These types of business plans may work for small, compact geographies but improve-ments in battery technologies will have to lead to shorter charging times to mitigate concerns about range. A whole host of battery technol-ogy companies are trying to tackle this challenge from small venture capital-funded startups to the large automobile manufacturers. For example, a California startup company named CODA Automotive is introducing its own branded elec-tric vehicle, with proprietary technology embed-ded in various parts of its o� ering.
Here comes the sunContinued advancements in solar power also have the potential to alter the energy market-place during this decade. Solar power has the advantages of being clean and abundant and can also function without necessarily being con-nected to a distribution network. However, it is the increasing cost-competitiveness of solar power that is stoking demand. Between 2008 and 2011, photovoltaic module costs declined
cles taking a 5% share of new cars sold by the end of the decade – a signi� cant percentage rel-ative to expected global oil consumption growth of 1%-2% per year.
While we acknowledge that pure electric vehicles may still su� er from a limited range, plug-in hybrids, which also have a small internal combus-tion engine, mitigate this constraint. In addition, some startups are rolling out entirely new busi-ness models in an e� ort to minimize some of the current drawbacks of electric vehicles. For exam-ple, a company called Better Place is launching a subscription service in Israel that provides owners of electric cars with batteries. Subscribers do not own the batteries, but instead, lease them from Better Place. So in addition to recharging their cars at home or work, subscribers will also have the option of swapping an empty battery pack for one that is fully charged at any number of new Better Place service stations being deployed throughout the country. Better Place also plans to roll out this service in Hawaii and Denmark.
Energy
Continued advancements in solar power have the potential to alter the energy marketplace during this decade. Clean and abundant, it is the increasing cost-competitiveness of solar power that is stoking demand.

The Decade Ahead February 2011 45
Energy
ing the e� ort to take advantage of lower-cost alternatives to oil. The low price, abundance and relatively favorable environmental pro� le of natu-ral gas, suggest it could be a prime bene� ciary of these trends. However, we acknowledge that the natural gas industry has to ensure that it can access the new shale gas reservoirs without con-taminating drinking water, a goal that we believe is very achievable. While the natural gas market is over-supplied in the near term, prices should move higher by the end of the decade as demand increases.5
Businesses that can help consumers switch from oil could also be well positioned. Given the cost improvements we expect in battery and solar tech-nologies, these industries could see substantial increases in demand over the next 10 years. Other renewables, such as wind power, will also gain market share but we believe the rate of change will be more dramatic in the areas we have iden-ti� ed. And as usual, the oil industry itself is not standing still. High oil prices are also spurring the search for cheaper ways to exploit existing oil reserves as well as those that will be developed in the decades ahead. But while oil will continue to play an important role in powering the world’s transportation networks, viable alternatives, such as solar and natural gas, will expand their share of the overall energy supply, limit the environmental impact of energy consumption and reduce depen-dency on imported energy sources.
by more than 25% (see Fig. 5). If over the next 10 years solar costs decline by 7% annually (a slower rate of cost improvement than the period since 2008), solar power could become one of the cheaper sources of new power generation (see Fig. 6). The cost improvements in solar tech-nologies over the next decade will likely result in substantial growth in grid-connected solar power, which could lead to reduced demand for coal – the source of 41% of the world’s electricity and one of the dirtiest sources of energy.
In addition, as grid-connected solar power dis-places coal-� red power generation, the environ-mental and security advantages of plug-in electric cars become even more compelling. Economical solar power not only reduces the need for fos-sil fuels in power generation but also has the potential to improve the environmental footprint of transportation if improved battery technology materializes, as we expect. Imagine a solar panel on the roof of every plug-in hybrid electric car. If one could simultaneously drive a plug-in elec-tric car and collect the sun’s energy to recharge the car’s battery, the range limitations of electric cars could be substantially reduced. Ultimately, the development of economical solar and battery technologies will likely yield profound changes to how we consume and supply energy by the end of the decade.
The race is onWe believe there are signi� cant � nancial, secu-rity and environmental incentives that are driv-
Fig. 5: Photovoltaic modules becoming much less expensive
Average retail price of 125-watt and higher modules, in USD per watt
2007 2009 2011 2013 2015 2017 2019
Note: Shaded area represents projected retail prices.Source: Solarbuzz Research and Consulting
0
6
1
5
4
3
2
Fig. 6: Solar photovoltaic is cost competitive by end of decade
Note: Assumes no cost for CO2 emissions.Source: Bloomberg, UBS WMR estimates
Long-run cost of electricity generation by fuel source, in USD per megawatt hour
40
80
0
120
160
200
Natural gas Coal Wind Nuclear Solar Solar in10 years

46 February 2011 The Decade Ahead
Technology: productivity and vulnerability
such as server crashes and network overloads, while others are largely the result of simple human error, as with so� ware design glitches and incorrect data entry. However, many are more maliciously intended, ranging all the way from annoying so� ware viruses and denial of service attacks to cyber spying and even actual terror attacks.
Think of that same smartphone, but now – instead of being used to purchase a ticket or turn on a car – it is used to cripple the power grid or detonate an explosive device. While an electric power loss in the 1970s may have blacked out a
Tool, tank or toy? The productivity and ef� ciency gains that go along with technological innovations are simply stagger-ing, particularly when the advances have broad application across many industries and also a� ect our professional and personal lives (see Fig. 1).
Think for a moment what can now be done with the simple touch on a smartphone: lights can be turned on and o� at a home hundreds of miles away; children’s whereabouts can be monitored and tracked to within a few feet; patient informa-tion can be analyzed and sent on to colleagues for medical consultation; client presentations can be sent ahead of meetings and printed out on demand; and airline tickets can be ordered, pur-chased and downloaded in a few simple clicks. In short, the advances in information technology have such broad implications that they in� uence almost every aspect of human enterprise. This progress will not only continue but will likely accel-erate over the next decade as applications pene-trate new territory and devices become even more closely interconnected.
But along with this massive improvement in pro-ductivity comes a comparable increase in depen-dency and, therefore, an elevated vulnerability to service disruptions, vandalism or even terrorism. Some events are unintentional and temporary,
Technological advances will continue to improve and transform society, but our reliance on technology has also left us vulnerable. While cloud computing will likely unlock numerous advantages, we also expect greater investment in safeguards against security breaches and system failures.
Robert Faulkner, Analyst
Fig. 1: Dramatic improvements in productivity
Source: Bureau of Labor Statistics, UBS WMR
Nonfarm business output per hour
20
0
40
60
80
120
100
1960 1970 1980 1990 2000 2010

The Decade Ahead February 2011 47
Technology
city, that same sort of system-wide power failure today could be catastrophic. As our professional and personal lives become increasingly dependent upon technology – and many of those technolo-gies are interconnected – the risk of such dis-ruptions grows geometrically. So in addition to harnessing the productivity-improving potential of technology, we must also look to put in place safeguards against more malevolent uses.
The bright “cloud” on the horizonTechnology changes at an accelerating pace and what had been viewed as cutting edge just a decade ago is now quaint or archaic. The changes come in all sizes but few have the ability to fun-damentally transform business models and our daily lives. We do see one exciting development with such potential for fundamental change in the way businesses work. That development is “cloud computing” and part of its promise is its applica-bility across almost every industry.
What makes the potential for change so profound is the very nature of the concept. In cloud com-puting, individuals or organizations utilize neces-sary services and resources on an “as-needed” basis from providers rather than purchasing assets (hardware and so� ware) and operating a system on their own with all of the attendant mainte-nance and support requirements. As it stands now, cloud computing is still small in scale and limited in scope. It is responsible for a great deal of clever advertising as the next new thing, but, at its most fundamental level, it is a return to the time-sharing architecture of the 1960s.
Perhaps the best way to understand the potential impact of cloud computing is to use an existing industrial enterprise as an example – the electric power grid. Prior to the grid, electric generation and usage was “siloed,” which meant that each standalone power source needed to be large enough to provide for peak power needs yet still small enough to be economically ef� cient. This tradeo� between capacity and ef� ciency o� en led to suboptimal power generation infrastructure, which served to restrain growth. But the advent of the grid allowed users to tap into power sources that exceeded their own standalone capacity dur-ing periods of peak usage. Assuming not everyone
had identical power needs at the same time, this pooling of resources meant that the functional capacity could be signi� cantly greater than the sum of the standalone power sources. What’s more, since the grid needed to provide for many users, there needed to be backup sources in the event a generator went down – thus providing
safer, more reliable and consistent service. This led to massive improvements in productivity across vir-tually every industry that relied on electric power.
Transforming our worldCloud computing has the same potential to impact today’s world that the electric power grid had when it was � rst introduced at the end of the 19th century. The electric grid burst onto the scene midway through the industrial revolu-tion and represented a transformative process. Likewise, cloud computing may have a similar impact on the way individuals and organizations meet their information technology needs. For years, management gurus have preached the phi-losophy of focusing on our core competencies. In all but a few companies, core competency does not include processing payroll, so businesses hire � rms like ADP and Paychex to do the task. The promise of cloud computing is no di� erent. While the hype is well ahead of the reality at this point, the next several years will require the continued development of a number of building blocks for the cloud. These include increased server and storage virtualization, network acceleration, self-provisioning capabilities, a demonstrable record on safety and security and, most important, a clear return on investment.
We believe that it is only a� er a successful � rst phase that the cloud will be able to move en
Cloud computing has the same potential to
impact today’s world that the electric power
grid had when it was � rst introduced at the
end of the 19th century.
““

48 February 2011 The Decade Ahead
mission-critical functionality on an as-needed basis and, thereby, delivering signi� cant bene� ts to businesses, consumers and public entities alike. If the process plays out as envisioned, we should experience:
masse beyond the migration of generic, nonessen-tial functions, such as e-mail and of� ce productiv-ity. It is at this point when the cloud will become the much-hoped-for transformational tool. A� er it has demonstrated its strengths and resolved its weaknesses, we will see it hosting custom and
Technology
Technology changes at an accelerating pace and what had been viewed as cutting edge just a decade ago is now quaint or archaic.

The Decade Ahead February 2011 49
• Lower costs through the reduced need to acquire hardware, so� ware and other assets along with reduced expenses associated with supporting these resources
• Increased ef� ciency as expenses are directly pro-portional to the required services and resources (that is, there are no peak load requirements)
• Greater � exibility with the ability to trial new functions and features as available without a capital commitment
• Obtain quality of service commitments from ser-vice providers and leverage their investment in scarce technical talent
• Separate out service requirements from the underlying infrastructure, thereby enabling it to operate on the most cost-e� ective solution
While the cloud o� ers great potential, it also will increase our dependency on technology. And along with that increased dependency comes greater risk.
Some dark clouds loom as wellInformation technology has pushed its way from its original “glass house” into the hands of our children. As such, the risks have been discovered, more o� en than not, the hard way. As we ponder the decade ahead, we have to understand that the world we created through our reliance on technology comes with threats and some are the proverbial game-changer.
We see threats existing on three levels: individual; group or organizational; and societal. Many of the threats at the individual level are well docu-mented, particularly as they relate to the dangers of identity the� (see Fig. 2 and Fig. 3). Groups and organizations tend to be at greater risk, in part because they have more to protect, and the tar-gets are not only � nancial (see Fig. 4). In both of these instances, people are the weakest link in the security blanket. It is not that we are all ill-inten-tioned, but we are the ones who let our defenses down, trust someone or something we should not, or lose the laptop at the industry conference.Beyond the individual or group threat, there is a
Technology
Fig. 3: Technology is a catalyst for abuse
Source: Federal Trade Commission, Consumer Sentinal Network, UBS WMR
Contact method for fraud complaints, in %
10
0
20
30
40
60
50
Phone Internet-Web Site
Mail Other Internet-Email
Fig. 4: Organizational attacks are broadening
Source: Computer Security Institute, UBS WMR
Types of attacks experienced, in %, 2010
10
0
20
30
40
70
60
50
Wirelessexploitation
Financialfraud
Bots/zombies
Insiderabuse
Laptopthe/loss
Denial ofservice attacks
Malware
Fig. 2: A new crime explodes onto the scene
Source: Federal Trade Commission, Consumer Sentinal Network, UBS WMR
Identity the complaints, in thousands
100
50
0
150
200
250
350
300
2000 2002 2004 2006 2008
50 February 2011 The Decade Ahead
Technology
far greater risk at the societal level. Our magnetic attraction – some may say, even addiction – to technology has brought us to a point at which we are so totally dependent on it that to be without it for a period of time could be very destabilizing. There is the very real possibility that an event, pre-meditated or coincidental, could negatively a� ect our society for an extended period of time.
Cyber threats on critical infrastructureCritical infrastructure in the US has evolved rather dramatically in recent decades and has been impacted by technology in much the same way our lives have been. By critical infrastruc-ture, we mean:
• Electric power generation and distribution• Telecommunications and satellites• Petroleum and natural gas production and
distribution• Transportation• Water• Banking and � nance • Food production and distribution• Emergency services
Much of this infrastructure is monitored and controlled by Supervisory Control and Data Acquisition (SCADA) systems. These are special purpose computer systems that monitor opera-tions and take appropriate action if a device strays beyond required performance metrics.
Suppose a person or group with an understand-ing of industrial control systems created malicious so� ware known as “malware” that attacked our infrastructure and damaged its ability to generate electricity, distribute natural gas, transfer funds or some other essential process? We have seen what happens when the lights go out in a large metro-politan area for just a few hours. What if it were for weeks, months or longer?
Unfortunately, these are not “what if” questions anymore. Last summer, security specialists discov-ered Stuxnet, a worm (malware so named because it “crawls” from device to device) characterized as a “milestone” and a “wake-up call” by Dean Turner, Director of the Global Intelligence Network at Symantec.¹ He noted that it “demonstrates
the vulnerability of critical national infrastructure industrial control systems.”
If a Stuxnet-like worm were unleashed on some segment of our infrastructure, just how long would those systems remain functional? More important, would they be recoverable?
Malware is not the only threat we face due to our heavy reliance on technology. For some time, scientists have also been concerned about the destructive potential of an electromagnetic pulse (EMP).
The day the earth stands stillAn EMP can occur naturally as a result of a solar � are and can also be generated through a high-altitude detonation of a nuclear weapon. On a smaller scale, a device to create an electro-magnetic pulse could one day be built by those with too much time on their hands. Most of us already have such a device in our home: a micro-wave oven.
While the probability of an electromagnetic pulse occurring in the US is admittedly low, such an event could easily disable critical infrastructure. The SCADA systems controlling the nation’s infra-structure would be physically damaged and ren-dered inoperable because, for the most part, they are not shielded from EMPs. Simple shielding in our microwave ovens keeps the energy in and the same type of shielding could keep it out. Beyond the SCADA systems, all of the o� -the-shelf com-mercial computing and communications equip-ment that we use would su� er the same fate for the same reason. Most likely, computer records, like the ones that tell the bank how much money is in our account, would be gone as well. What might this look like? In the 1951 science � ction
In addition to harnessing the productivity-
improving potential of technology, we must
also look to put in place safeguards against
more malevolent uses.
““

The Decade Ahead February 2011 51
Technology
classic, The Day the Earth Stood Still, an alien and his robot essentially cripple the world by disabling all electric-powered motors. The sci-� depiction may be more benign than an actual EMP attack today: in the movie, the alien disrupted all power, with the exception of those sources necessary to maintain life and safety. It is quite possible that the modern day version of such an attack would not be so charitably deployed.
The US Congress formed a commission to evalu-ate the threat that EMP poses to critical national infrastructure. The commission’s 2004 report highlights a very real problem, noting: “EMP is one of a small number of threats that can hold our society at risk of catastrophic consequences.”2 Although there has been some criticism of the report as partisan and tied to the defense industry – and politicians and their supporters will continue to argue about the likelihood of a nuclear attack – another major solar � are seems inevitable. What we cannot know is the timing or strength. The vul-nerability of our infrastructure to EMP should be the focus of our discussion, not its source.
Opportunity is the � ip-side of riskNow that we have pointed out the doomsday scenario, the logical question is what can we do about the risks we have created? As is always the case, recognizing and understanding the risks are the � rst steps; next, we consider the solutions to these potential problems.
Cyber security threats are created when so� ware does something other than what it was designed to do. The resulting vulnerabilities are exploited like a door le� unlocked. In no other aspect of our lives do we tolerate products that expose us to such profound risks, but we are apparently will-ing to do so with so� ware. The so� ware industry must perform much more system-level simula-tion in the future to identify those vulnerabilities before products become commercially available. Individuals and organizations must demand it.
However, nothing is ever perfect, and we will always have a need to monitor our systems for security breaches. Much more powerful proces-sors should enable individuals and organizations to operate security tools that are far less intrusive,
more � exible and substantially more intelligent than today’s brute strength-based alternatives.
The EMP threat presents a di� erent problem in that the best solution may have to come from regulations that require new hardware and shield-ing. Estimates point to an additional impact on new equipment prices of as little as 1%-5%, if these precautions were incorporated into the ini-tial designs.3 Clearly, if the cost were prohibitive, microwave ovens would not be so inexpensive. Much (not all) of our commercial communications and computing hardware has a fairly short useful life due to its functional obsolescence, so replace-ment takes place at relatively short intervals. Consequently, if remediation were required over a 10-year period, the impact would be minimal. Any infrastructure that is not subject to turnover could be addressed on a case-by-case basis. The point here is that we would have a program in place to address the issue.
As we noted at the opening, technology has had a profound impact on us from an economic and lifestyle perspective. We know of few who would forego the bene� ts that have accrued over the decades, so there is really no way to put the genie back in the bottle. However, an understanding that there are risks associated with our reliance on technology makes us better equipped to work toward a solution. More important, when we pick up our smartphone to use it as a tool or a toy, entrepreneurs who understand the risks inherent in the activity will view any problems as opportu-nities. The creative cycle that has enabled us to bene� t so much from information technology will help ensure that we can continue to enjoy the bene� ts over the current decade and the decades to come.

52 February 2011 The Decade Ahead
Healthcare: from healing to fixing
Transformational change in healthcare is afootSeemingly all at once, a multitude of forces have converged to create a dynamic of change that will gradually reshape the US healthcare system over the course of this decade. While some might argue that these changes are being driven by recently legislated healthcare reform, many were already well under way before President Obama signed the bill into law in early 2010. Some of the most important developments include:
• Behavioral changes: higher patient deductibles and copayments leading to lower discretion-ary healthcare consumption and more price shopping
• Decision maker changes: more physicians directly employed by hospitals, shi� ing more healthcare decisions from doctors to cost-con-scious hospitals
• Reform changes: insurance company and cov-erage reform represents the � rst phase of leg-islative change and will likely be followed by additional measures, such as tort/malpractice reform
The common theme prompting change is run-away expenditures on healthcare, which in 2010 are expected to total USD 2.6 trillion or 17% of US GDP, and could rise to 20% of US GDP by 2018, according to the Centers for Medicare & Medicaid Services1 (see Fig. 1). Based on OECD
During the next decade, the US healthcare system will undergo considerable change. These changes, not solely driven by legislation, could a� ect nearly every aspect of health delivery, from the person we consider our primary care physician to the type of care we receive.
Jerry Brimeyer, Analyst
Fig. 1: US healthcare spending will steadily increase
Source: Centers for Medicare & Medicaid Services
US healthcare expenditures, in trillions of USD
1
0
2
4
5
3
2001 2003 2005 201720152013201120092007 2019
Fig. 2: US spends more on healthcare than any other country
Source: Organization for Economic Cooperation and Development
Healthcare spending as a share of GDP, in %, 2008
CanadaNetherlands
DenmarkSweden
SpainUK
AustraliaJapan
Mexico
Germany
FranceUS
Switzerland
0 5 1510 20

The Decade Ahead February 2011 53
data,2 the US spends, by far, the largest portion of GDP on healthcare in both absolute and per capita terms (see Fig. 2). It is this potentially economy-crippling reality that is causing so many ostensibly diverse arrows to aim at the same target – cutting healthcare costs while improving or at least main-taining the quality of care.
Most important, it is not one’s analysis of the ultimate potential for success or failure of these e� orts that should determine healthcare invest-ment decisions this decade, but rather the interim triumphs that gradually alter the cost trajectory while meeting increased demands for care and improving patient outcomes. Such victories could come by way of new technology, new cost-saving health delivery paradigms or new innovative prod-ucts and services.
Below we expound upon major themes driv-ing change over the next decade – coordinated care, physician shortages, personalized medicine and political in� uences – and o� er suggestions as to how innovative solutions can help address the demands of our evolving healthcare system, including:
• Comprehensive electronic health records (EHR) for all patients
• Cures for previously incurable diseases
• Robotics and order-entry systems to leverage scarce physician resources
• Powerful genetic analysis to determine disease potential and drug selection
• New vertically integrated healthcare delivery paradigms
Coordinated careThere are many reasons for the high cost of care in the US. High on the list are healthcare provid-ers’ fee-for-service payments, unnecessary medi-cal tests and uncoordinated care, namely among hospitals and physicians. The fragmentation of health services today is like the airline industry 20 years ago – signi� cant costs and waste due to uncoordinated systems and inef� cient use of tech-nology. Over this decade, patient care will almost undoubtedly become better coordinated among various providers and the number of unneces-sary tests and procedures will be substantially reduced, thanks largely to improved technology and changes in the way providers are incentivized to make change happen.
Already today, but currently limited to only a hand-ful of medical conditions, payers such as Medicare, Medicaid and managed care organizations reim-burse providers with a bundled payment – one payment for the entire episode of care – not for each component of care, or fee-for-service. New payment schemes should encourage much bet-ter coordination among providers as well as new vertically integrated healthcare delivery paradigms, where all healthcare services for an individual are managed by one entity. However, o� entimes
Healthcare
Fig. 3: Physician shortage will increase in the decade ahead
Note: Excludes residents.Source: Association of American Medical Colleges
Projected supply and demand of full-time physicians, in thousands
750
700
650
600
800
900
850
2005 2010 2015 2020 2025
Supply
Demand
Fig. 4: Number of Americans age 65+ will double by 2030
Source: US Census Bureau
Population of Americans age 65 and over, in millions
45
30
15
0
60
90
75
2000 2005 2010 2015 2020 2040203520302025 2045
Americans 65+
Baby boomers 65+

54 February 2011 The Decade Ahead
seemingly unnecessary tests are conducted to pro-tect against malpractice, which will require tort reform to be more fully addressed.
To further encourage coordinated care, all Americans will have an electronic health record (EHR), which will hold their entire medical history. In years past, this may have sounded like a pipe-dream because of the cost of implementing new IT systems and the unwillingness of many provid-ers to move away from traditional handwritten records. But today, aided by the stimulus pack-age (American Recovery and Reinvestment Act of 2009), the mechanics of this change are already under way, which provides USD 18 billion in incen-tives to physicians and hospitals to adopt EHRs.
A host of other technological innovations, such as electronic physician order entry, better cap-ture healthcare data and standardize provider processes, leading to process improvements and fewer medical errors. According to the Society of Actuaries,3 medical errors, such as preventable infections and complications, cost the US health-care system nearly USD 20 billion in 2008.
By 2020, patient care will be far more ef� cient, with much better continuity of care as providers adopt EHRs and other robust IT solutions to better coordinate services, streamline care delivery and manage resources. If executed properly, the bene-� ts will go far beyond greater ef� ciency and lower costs, and will achieve superior patient outcomes.
The looming physician shortageBy the end of this decade, the US will face a severe shortage of physicians, both primary care physicians (PCPs) and specialists. According to the Association of American Medical Colleges4 (AAMC), the physician shortage could surpass 90,000 by 2020 and 125,000 by 2025 (see Fig. 3).
The problem is mostly the ever-growing demand for healthcare, accentuated by population aging, as the baby boomers turn 65 beginning in 2011 (see Fig. 4). As people age, they use more health-care services, and Americans age 65 and over already account for 35% of the spending on healthcare (see Fig. 5). This inexorable force will not just result in inadequate physician numbers but will also place tremendous strain on the healthcare system and become a weighty � nancial burden on Medicare.
As the mechanics of healthcare reform begin to take hold, demand for care will further increase, potentially quite sharply. Between 2014 and 2019, the Congressional Budget Of� ce5 estimates that new state insurance exchanges will enroll 32 mil-lion Americans, most of whom were previously uninsured or underinsured and many who have pre-existing conditions that are very costly to treat.
With demand for healthcare growing at such a fast clip, the supply of physicians will hardly be able to keep pace. In spite of over 18,000 new students entering US medical schools each year, the AAMC6 estimates that the US will be
Healthcare
Fig. 5: Healthcare costs rise significantly with age
Source: Centers for Medicare and Medicaid Services
Per capita healthcare spending by age group, in USD, 2004
10000
0
5000
15000
25000
30000
20000
0–18 19–44 45–54 55–64 65–74 75–84 +85
Fig. 6: US government funds a large share of healthcare
Source: Kaiser Family Foundation, UBS estimates
US healthcare coverage, in %
Medicare12%
Dual eligible3%
Medicaid/other government
13%Employer sponsored51%
Private insurance5%
Uninsured16%

The Decade Ahead February 2011 55
shy 45,000 PCPs by 2020. The problem is com-pounded by the fact that nearly one-third of all physicians today are over age 55: the number of physicians retiring will be just slightly less than those entering the profession. This is not only becoming evident with PCPs, but the same trends, in virtually equal numbers, will sharply a� ect the supply of specialists as well.
The implications are far-reaching. In the future (already apparent in certain geographic regions today), your “primary” physician is unlikely to be the primary or � rst healthcare professional you will see when seeking healthcare services, given the mounting demands on PCPs. Filling the void will be perfectly competent physician assistants (PAs) and nurse practitioners (NPs), although the supply/demand imbalance of both PCPs and specialists will almost undoubtedly lead to longer wait times and hinder access to care.
Clearly, innovative solutions are needed to close the gap between healthcare demands and limited physician resources. PCPs will play more of a con-sulting role to the growing numbers of PAs and NPs – tightly coordinated by EHRs and other IT solutions – to improve ef� ciency and meet patient demands. Specialists will play a similar role, with surgeons making greater use of robotics for many common operating procedures, such as appendec-tomies and hysterectomies, some of which could be conducted from miles away. Despite these changes and advances, still more ef� ciencies and innovation will be necessary to meet the mounting demands by 2020.
Personalized medicineIn the future, and not at all out of reach, the medi-cines we use will become increasingly personalized to our speci� c genetic makeup. Genetic analy-sis, through better understanding of the human genome and advances in genetic diagnostics, will become commonplace with annual doctor visits or periodic “physicals.” These tests will permit physicians to predict disease predispositions and tailor healthcare to our individual genetics, rather than simply use therapeutic regimens that broadly assume all treatments a� ect everyone in the same fashion.
Given the considerable advances in understand-ing the human genome and the developments of targeted drug therapies, broad scale personalized medicine is not at all a whimsical notion. In fact, although in its infancy, early examples of per-sonalized treatments exist today. For instance, in breast cancer, patients with overexpression of the HER2 gene, commonly associated with aggressive forms of cancer, can be predicted to have a better response with the biologic Herceptin than patients without the gene. The same is true for other drugs and biologics as well.
Researchers are also investigating ways to alter and even remove genes that cause disease, known as gene therapy. Another novel approach to dis-ease prevention is RNA interference or RNAi, which blocks production of disease proteins pro-duced by speci� c genes types. RNAi is currently in early stages of investigation for Huntington’s disease and various viral diseases, such as hepatitis and HIV infection, but with strong prospects for successful products and procedures by 2020.
Though such targeted therapies are few in num-ber today, over this decade personalized medicine will be the focal point of drug research for many diseases, such as cancer, Alzheimer’s disease, heart attacks and depression, to name just a few. These new therapies are not only aimed at treating dis-ease, but at curing previously incurable diseases, including various types of cancer and viral infec-tions, like hepatitis C and AIDS. Such advances will not only improve the outcomes of medical care, but could signi� cantly reduce healthcare costs.
Winds of political changeWhat happens in Washington will also necessarily impact our healthcare system, given the changes from healthcare reform and the growing number of Americans with healthcare coverage through federal and state government programs. Currently, about 28% of the US population is covered via Medicare, Medicaid and other government health-care programs (see Fig. 6). And that � gure will likely be over 33% by the end of the decade, as the over-65 population continues to expand and 16 million more Americans enter Medicaid through health reform.
Healthcare

56 February 2011 The Decade Ahead
The most recent round of healthcare “reform” did not actually reform the system in a structural way: it dealt mostly with regulating insurers and increas-ing insurance coverage. Given that the recent leg-islation could bring millions of people into a system that already costs 17% of GDP, we fully expect future healthcare initiatives to address Medicare funding, structural reform and tort reform.
Longer term, the political winds of change will, in no small way, in� uence the structure and cost trajectory of our healthcare system. In the simplest terms, future healthcare legislation will be geared toward market-driven mechanisms or command- and government-driven mechanisms. Republicans are generally viewed as more favorable to health-care companies because they believe competitive markets will control costs, whereas Democratic-led reforms would likely lead to increased govern-ment control. Another major tenet of Republican-led plans is tort reform, which would seem to be essential to reduce the cost of unnecessary tests
and malpractice insurance.
In our opinion, because of the urgency with which additional reform is necessary, the administration in power during the next term could have the most profound impact on the future of healthcare in the US and, for that reason, the long-term per-formance of healthcare investments.
The decade of changeSo we end as we began, that this decade will likely experience the most signi� cant changes to our healthcare system in our lifetime. While no amount of credible analysis can portend the ultimate outcome of the multiple changes under way and those that are likely to follow, we sur-mise that, given the aim of reducing healthcare expenses and the desire to maintain quality care, cost-saving products and services that actually improve healthcare outcomes will lead to numer-ous healthcare investment opportunities through-out this decade.
Healthcare
New therapies will be aimed not only at treating disease, but at curing previously incurable diseases, including types of cancer and viral infections, like hepatitis C and AIDS.

The Decade Ahead February 2011 57
In� ation: the next wave takes shape
In� ation versus de� ationThe currently weak state of the US housing mar-ket, ongoing reductions in household debt bur-dens and high rates of unemployment continue to prompt a massive � scal and monetary policy response aimed at guarding against the risk of de� ation and avoiding the de� ationary trap Japan fell into when its housing and equity market bub-bles burst in the early 1990s. The opposing de� a-tionary and in� ationary forces are gargantuan. We need superlative adjectives to be able to describe the magnitude of the past banking crisis and the ongoing deleveraging cycle, as well as the mon-etary and � scal response. The size of these forces alone portends a clash between de� ationary and in� ationary pressures of unprecedented magni-tude. The result of that clash will be a wave, not a ripple. We expect that wave to be in� ation, not de� ation. With the threat of de� ation ever so real, the thought of in� ation may seem a remote pos-sibility. Although we think it could be several years o� before broad-based in� ation pressures emerge in the US, we believe the policies implemented today will give rise to the next wave of in� ation during this decade.
Ample resource slack contains in� ation at � rstThere is currently an enormous amount of resource slack, or underutilized productive capac-ity, in many advanced economies. In some countries, idle capacity is the highest since the double-dip recessions of the early 1980s. The
most comprehensive measure of resource slack in an economy is the so-called output gap, which measures actual GDP relative to potential GDP. Potential GDP represents the highest level of output that an economy can sustain over a long period of time without generating in� ation, given the existing capital stock, labor force and tech-nology. A less comprehensive but more accurate resource slack indicator is the di� erence between the actual unemployment rate and the unemploy-ment rate associated with long-run sustainable full employment. Fig. 1 shows this metric for the US and the UK.
Theoretically and empirically, narrow and wide output gaps are associated with in� ation and disin� ation, respectively. To see why, consider an
After a quarter of a century of disin� ation – and a more recent brush with outright de� ation – we believe in� ation will reemerge during the decade ahead. However, we do not expect a reprise of the 1970s-style stag� ation that crippled the economy and weighed heavily upon � nancial markets.
Thomas Berner, CFA, Economist
Fig. 1: Labor resource slack is massive
Difference between actual unemployment rate and estimated NAIRU, in %
2
0
–2
–4
4
6
Note: NAIRU = non-accelerating inflation rate of unemployment.Source: Bloomberg, UBS WMR
UKUS
1950 1960 1970 1980 1990 2000 2010

58 February 2011 The Decade Ahead
economy with substantial resource slack. If � rms try to raise prices in this environment, competitors will rush to hire unemployed workers to increase their production and gain market share. Therefore, � erce price competition will tend to moder-ate in� ation. For an extremely wide output gap, prices can fall and trip an economy into de� ation. In the opposite environment, when the output gap closes, in� ation tends to rise, since aggre-gate production cannot be increased further and, consequently, businesses have the power to raise prices. Fig. 2 depicts US labor market slack and the annual change in core CPI in� ation. A tight/loose labor market has historically been followed by ris-ing/falling in� ation, although that link has broken down somewhat since the early 1980s.
In the a� ermath of the Lehman Brothers collapse, policymakers implemented a wide array of mea-sures to prop up aggregate demand. The US, UK and Eurozone central banks decided to increase the money supply via quantitative easing mea-sures, which spurred aggregate demand through lower interest rates and tighter credit spreads (see Fig. 3). The Federal Reserve’s expansionary monetary policy spread to countries in Asia, the Middle East and Latin America, whose curren-cies were pegged to the US dollar. The worldwide passage of � scal stimulus measures supported demand through lower taxes and higher govern-ment spending. Finally, some countries pursued weaker currencies in an attempt to boost exports. Some of these currency moves likely also created even easier monetary conditions than would have
Fig. 2: Ample labor resource slack suggests disinflation
Change in inflation, in % Labor resource slack
–2
–4
–6
–8
6
4
2
0
8
3
4
5
–1
0
1
2
–2
–3
Source: Bloomberg, UBS WMR
12-month change in annual core CPI inflation (lhs)
US labor resource slack (rhs, inverted)
1960 1970 1980 1990 2000 2010
Fig. 3: Faster money supply growth since late 2008
Source: Bloomberg, UBS WMR
US and Eurozone M1 money supply aggregates
3000
2000
1000
0
4000
5000
Eurozone M1 money supply (in billions of EUR)US M1 money supply (in billions of USD)
1980 1985 1990 1995 2000 2000 2005 2010
Forces that shape consumer price changes and monetary policy
Economic theory and history point to � ve key drivers of consumer price changes: resource slack, in� ation expectations, labor costs, com-modity prices and currencies.* Monetary policy a� ects these � ve variables through several channels. Expansionary monetary policy (an increase in the money supply), lowers inter-est rates, which spurs aggregate demand through lower borrowing costs. It also positively impacts business and household balance sheets through higher asset prices, as economic agents positively adjust their expectations for future growth and prices. An increase in the money supply, lower borrowing costs and an improve-ment in balance sheets help to support bank lending. Thus, the money supply is extremely important for dictating consumer price changes but only if it impacts the above-mentioned � ve factors via the monetary transmission channels. A central bank could expand its money supply by a factor of 100 and not create in� ation if banks hoarded the cash as reserves and did not loan the money to borrowers.
* The last two factors are only relevant for small, open economies.
In� ation

The Decade Ahead February 2011 59
In� ation
had little wage bargaining power, the oil price shocks, the implementation of capital controls and the disintegration of Bretton Woods (money ceased being backed by gold) together pushed in� ation expectations higher. When central banks failed to rein in in� ation out of fear that econo-mies would slip into a severe recession, the wage-price in� ation spiral was set in motion. Businesses agreed to pay higher wages, since they expected to pass on the rising labor costs to consumers in the form of higher retail prices.
The crux of the matter is that higher in� a-tion expectations, once widely held and deeply entrenched, can lead to rising in� ation even when there is considerable slack in the economy. In an extreme case when people � ee cash for hard assets and gold, an acceleration in the so-called velocity of money portends an eventual increase in in� ation expectations. The velocity of money measures the pace at which economic transac-tions take place. The monetarist mantra is that in the long run, an increase in the money supply will show up in higher prices, not in higher real eco-nomic activity. Or, put di� erently, too much money will chase too few goods. Thus, in� ation expecta-tions and the velocity of money are important fac-tors in gauging the risk of in� ation when there is ample resource slack.
Even though the monetarist school of thought had theories for controlling a rise in in� ation expectations when the problem was in its early stages, it took Fed Chairman Paul Volcker’s actions
otherwise prevailed. All of these forces helped stabilize the degree of resource slack in the global economy.
On the opposite end of the spectrum, household balance sheet deleveraging (a reduction in debt relative to income), an impaired and slow-to-heal bank credit channel and an ongoing rapid increase in China’s productive capacity all served to keep resource slack elevated. The US housing-induced credit implosion, which followed a massive run-up in household debt-to-income ratios beginning in the early 1980s, is not over and, in our view, will take many more years to normalize (see Fig. 4). Banks are still absorbing debt losses on their balance sheet, and we believe US total bank lend-ing likely will remain � at for a year or two a� er it stops contracting. These de� ationary pressures weigh on aggregate demand.
Taken together, we think that current in� ationary and de� ationary forces are roughly o� setting each other, given the stabilization in resource slack as evidenced by the high but stable US unemploy-ment rate.
In� ation expectations matterNevertheless, in� ation expectations can still short-circuit the standard relationship between output gaps and in� ation. This was the painful lesson of the 1970s in the US, when high unemployment and high in� ation coexisted for about a decade. Even though ample resource slack meant that businesses had little pricing power and workers
Fig. 4: US household debt burden is normalizing
Source: Bloomberg, UBS WMR
US household debt to disposable income ratio, in %
100
80
60
40
120
140
1980 1985 1990 1995 2000 2005 2010
Fig. 5: Inflation expectations are well-anchored
Source: Bloomberg
Selected measures of inflation expectations, in %
8
6
4
2
0
10
12
University of Michigan 5–10 year averageUniversity of Michigan 1-year expectations Treasury bond market 5–10 year
average
1980 1985 1990 1995 2000 2005 2010

60 February 2011 The Decade Ahead
through into other prices did not materialize. Core CPI in� ation, which excludes energy and food prices, peaked at 2.9% y/y in late 2006.
There is understandably greater sensitivity to ris-ing commodity prices in countries that have: more energy-intensive production in relation to the size of their economies; higher trade sectors; and higher food shares in their consumption baskets. But even in these instances, commodity prices would have to increase unabated and aggregate demand growth would have to be very strong in order for commodity in� ation to morph into a broad in� ation problem.
A weaker currency cheapens exports and makes imports more expensive for a given set of export and import prices. Therefore, currencies a� ect in� ation through two channels. First, a weaker currency lowers resource slack by boosting net exports. Second, a weaker currency makes imports more expensive and thus “imports” in� ation. The e� ect of a weaker currency on in� ation is stronger for a sharper devaluation, as well as for a smaller and more open economy. In the US, the e� ect of a weaker dollar is fairly muted, as exports and imports comprise only about 12% and 15% of GDP, respectively. The USD would have to depre-ciate a lot in order to have a signi� cant impact on in� ation. The almost 40% devaluation of the trade-weighted USD from 2002 to 2008 and the accompanying surge in import prices – also due to the surge in the oil price – did not lead to a mas-sive in� ation bout over that time period.
Not déjà vu all over againThe current ample resource slack in the economy should forestall a rapid rise in in� ation from its rather low levels in the US and its moderate level in Europe for the next two years or so. Even if growth were to accelerate noticeably, which we do not expect, it would take many years to reach potential output. A convenient rule of thumb in the US is that for every one percentage point of above-trend real GDP growth, the unemployment rate falls by half a percentage point (Okun’s law). We estimate that in the next decade, potential real GDP growth in the US will likely average around 2.5% or less. Our moderate recovery scenario thus implies that it could take up to 10 years for the unemployment rate to fall back to 5%, a level
in the early 1980s to sharply raise short-term inter-est rates to reverse the trend. The outcome was a fairly deep recession, but not as deep as feared, followed by a prolonged moderation in in� ation. It is important to note that until Volcker stepped up, the Fed had operated pursuant to a di� erent model, one where in� ation expectations did not matter. This is a hard lesson learned, but learned nonetheless. Nowadays, central bankers rou-tinely try to manage in� ation expectations with their actions and speeches, having successfully anchored them at a low level for the better part of the past 15 years (see Fig. 5).
The interplay among resource slack, in� ation expectations and labor costsWhen in� ation expectations are well-anchored at a low rate, substantial resource slack dampens labor costs as workers have little wage bargain-ing power. In the US, labor costs represent about two-thirds of total production costs. Since the end of 2008, unit labor costs – labor costs per unit of GDP – have fallen by 3.5%. However, when in� ation expectations become unhinged and the wage-price spiral is set in motion, labor costs can rise even with ample spare capacity.
Commodities and currenciesCommodity prices a� ect in� ation through the same channel as wages. Rising prices of com-modities used in production raise total costs, and businesses will try to pass on these higher costs to consumers. Pricing power is a necessary con-dition for rising commodity prices to feed into in� ation. In our view, the impact of commodity prices on in� ation is o� en overstated in developed countries. In order to raise in� ation on an ongo-ing basis, commodity prices would have to keep rising unabated. However, as commodities get more expensive, they reach a price that tempers demand and stops the price ascent. Hence, the impact on in� ation subsides. We estimate that in the US, a 10% permanent increase in the price of oil in one month raises CPI in� ation by 0.4 per-centage points above the existing trend a� er 12 months. In the last expansion, West Texas inter-mediate crude oil prices rose from about USD 20/barrel in 2002 to nearly USD 150/barrel in 2008. Despite this surge, headline CPI in� ation did not get out of control, peaking at 5.6% year-over-year (y/y) in mid-2008. Moreover, the feared pass-
In� ation

The Decade Ahead February 2011 61
In� ation
banks will likely be hotly contested and the pressure to try to lower unemployment with even looser monetary policies will likely be high. Assuming average real GDP growth of 3% and average US federal de� cits of 5% between 2012 and 2020, we estimate that 5% average
which we consider to be consistent with long-run sustainable full employment.
However, in the middle and latter years of this decade, we think global in� ation will rise for three reasons:
• Most important, the Fed is engaged in an all-out � ght against de� ation and, in our view, would prefer to remain overly expansive for longer rather than risk choking o� a fragile expansion with policy tightening. The Fed’s forceful mon-etary response, Fed Chairman Ben Bernanke’s expertise on lessons learned from the Great Depression and Japan’s vivid example of the costs of de� ation support this view.
• Moreover, the projected increase in government debt-to-GDP ratios in developed nations is a strong incentive for politicians to seek higher in� ation in an e� ort to erode the real value of debt (see Fig. 6). The independence of central
Fig. 6: Higher inflation can lower the debt-to-GDP ratio
Source: Federal Reserve Bank of St. Louis, Thomson Reuters, UBS WMR
Annual change in US debt-to-GDP ratio and contributors to change, in %
20
10
0
–10
–20
30
40
Real GDP growth effectDeficit effect
Change in debt-to-GDP ratioInflation effect
1930 1950 1970 1990 2010
In the wake of the � nancial crisis lie clashing de� ationary and in� ationary pressures of unprecedented magnitude. The result of that clash will be a wave – not a ripple – and that wave will be in� ation, but any serious pressures are several years away.
62 February 2011 The Decade Ahead
In� ation
contain in� ation at a structurally higher level than exists today. Speci� cally, we expect US in� ation will average approximately 5% starting in 2013 and extending through 2020.
Keep in mind that the in� ation problems encoun-tered during the 1970s were not exclusively a result of central bank policies but also the result of supply constraints. Shortages of skilled work-ers, arti� cial constraints on oil supplies and limited productive industrial capacity also contributed to the increase in price pressures. However, the emer-gence of the developing countries as a source of incremental supply suggests that the bottlenecks that surfaced during the 1970s are less likely over the next decade. The reintegration of both China and India are tantamount to “beaming” hundreds of millions of productive working-age adults onto the planet. This suggests that the sort of runaway in� ation that crippled the global economy and wrought havoc in � nancial markets is unlikely in the decade ahead.
CPI in� ation would be suf� cient to stabilize the US debt-to-GDP ratio.
• Economic outcomes rarely develop gradually or linearly. When in� ationary forces � nally gain the upper hand over de� ationary pressures, as we expect, global central banks will have little time to react. Consistent with shrinking resource slack, we expect unit labor cost growth to even-tually turn positive again, but we are not look-ing for an uncontrolled ascent in wage in� ation. Given our expectation for monetary policy to remain tilted toward expansion, we expect in� a-tion expectations to rise above the long-term trend of about 3%.
So while commodity prices will likely rise in tan-dem with an ongoing expansion and the relentless rise of China, we do not foresee a spike in prices so massive that it could lead to an explosive in� a-tion spiral in all prices. Similarly, while countries will likely continue to engage in e� orts to devalue their currencies, such tactics are a zero-sum game, and not every country can devalue its way to prosperity. We also do not expect a collapse of the USD or the emergence of a contender to the greenback’s principal reserve currency status, but merely a dent in its sheen (see page 68 for a more detailed discussion of the outlook for bonds and currencies). Therefore, we also only see limited in� ation risk arising on the currency front.
Overall, we do not expect a repeat of the 1970s-style stag� ation that occurred in the US. The key reasons are the continued diligence of central banks and the expansion in capacity within the emerging markets. Unlike the situation in the early 1970s, central banks across the globe are acutely aware of the damage that runaway in� a-tion expectations can cause. Therefore, we believe the Fed and other central banks will react stead-fastly to rein in in� ation expectations once they begin to rise. Of� cials might be too late but, in our view, will not stay behind the curve for an entire decade like they did in the 1970s. Instead, central banks will continue to � ght in� ation expectations with both talk and actions. While there is always a risk that wage and consumer price in� ation will spiral out of control once the genie is let out of the bottle, we believe central banks will aim to

The Decade Ahead February 2011 63
Stocks: no repeat of the lost decade
An understanding of the pastBefore we tackle the daunting task of predicting what return the equity markets will deliver over the next 10 years, it is important to re� ect upon the last 10 years. A decade ago on December 31, 2000, the S&P 500 stood at 1320 – a� er already falling nearly 20% from its March 2000 peak – and few if any could have predicted that over the next 10 years, large-cap US equities would gener-ate an annualized total return (price appreciation plus dividends) of a paltry 1%. As a result, that time period earned the sobering moniker of “The Lost Decade.” And in order to not experience another one, it is essential to understand what went wrong. A� er all, to paraphrase philosopher George Santayana,1 those who cannot learn from the past are destined to repeat it.
Causes of the lost decade: economics, valua-tion, concentrationWe look closely at three factors to better under-stand the potential causes of the lost decade: eco-nomics, valuation and index concentration. First, we discuss the economic growth environment over the past 10 years and the historical relation-ship between the economy and the stock market. Next, we examine the relationship between valu-ation and future market returns. And � nally, we note the higher risk that greater index concentra-tion can have on broad market indexes.
The economyOver the past 10 years, the US economy grew at
a slower pace than in any other decade since the 1930s because of two recessions – one short and shallow setback in 2001 and the more signi� cant contraction during the Great Recession in 2008-2009. But it would be inaccurate to fully attribute the abysmal equity market performance over the last 10 years entirely to sub-trend US economic growth. A� er all, US real GDP growth was “only” average during the 1980s and 1990s yet the aver-age annualized rate of return for stocks during those decades was 13.8% and 17.4%, respec-tively. Fig. 1 shows that the economy and the stock market are related, but the magnitude of changes to stock prices cannot be fully explained simply by the growth path of the domestic econ-omy. Over the last 10 years, US real GDP grew at a 1.7% annualized rate, or half the rate of growth
With valuation excesses wrung out, we expect stocks to deliver more “normal” returns, trumping bonds in the coming decade. Historically, it is quite rare for stocks to underperform bonds over a 10-year stretch, particularly after prolonged periods of equity market underperformance.
Jeremy Zirin, CFA, Strategist
Fig. 1: GDP growth is not the only driver of stock returns
Source: Bureau of Economic Analysis, Standard and Poor's
Real US GDP growth rate, in % S&P 500 total return, in %
4
3
2
2
0
5
6
12
9
6
3
0
15
18
1990s1980s1970s1960s1950s1940s1930s 2000s
Real GDP growth (lhs)
S&P 500 total return (rhs)

64 February 2011 The Decade Ahead
of the prior two decades. But instead of generat-ing half of the return of the 1980-2000 period, on a total return basis (including reinvested divi-dends), stocks barely eked out any return at all.
ValuationWhen examining historical long-run stock mar-ket relationships, we � nd that valuation plays a greater role. At the end of 2000, on nearly every valuation metric that we analyze, stocks were incredibly expensive. On the traditional price-to-earnings (P/E) valuation metric, the S&P 500 was trading at 28 times one-year forward consensus earnings estimates (which never materialized, incidentally) at its peak in March 2000 and at a still-high 22 times by December 2000 (compared to the long-run average of roughly 15). On our preferred metric of cyclically adjusted or “normal-ized” earnings, stocks were trading at a whop-ping 39 times earnings2 (see Fig. 2). We have long argued that valuation alone is not a very good short-term predictor of equity markets, but over a 10-year span, the data suggests that there is a strong correlation between valuation and decade-ahead returns (see Fig. 3).
Sector concentrationAnother factor that made equity markets increas-ing susceptible to a meaningful decline was the fact that the S&P 500 index itself became highly concentrated – � rst during the tech bubble and then again during the � nancial crisis. At its peak in early 2000, the Information Technology sector represented 35% of the S&P 500 index market
capitalization, compared to the second-largest sector at the time, Financials, with just 12%. This gulf was the result of the wildly excessive valua-tions attributed to anything “dot com” and sig-ni� cant additions of technology stocks to the S&P 500 by its index committee. From 1990 to 2000, the number of technology stocks increased from 44 to 71. By comparison, there were net declines in index representation in the Industrials (from 88 to 56 companies), Basic Materials (from 61 to 41) and Consumer Staples (from 37 to 27) sectors over the same period. This dynamic feature of the composition of the S&P 500 index itself – in� u-enced by what Standard & Poor’s labels as “sector representation” – creates greater concentration risk when index changes are extreme. Said di� er-ently, as bubbles are being formed, the S&P 500 tends to add stocks from these new “growth sec-tors,” o� en a� er they have meaningfully appre-ciated and become quite expensive. That was certainly the case in the late 1990s, which exac-erbated market volatility both on the upside and downside.
A similar but less exaggerated experience occurred in the years leading up to the � nancial crisis when the Financial sector’s lead over the next-largest sector grew to nearly 8% (see Fig. 4). Clearly, when market indexes become less diversi� ed and have greater sector concentration, market risks rise since meaningful declines in those large sec-tors have a greater impact on the overall index.
Fig. 3: Valuation negatively correlated with decade returns
Source: Shiller (2011), Standard and Poor’s, UBS WMR estimates
P/E ratio versus annualized S&P 500 total return of next 10 years, in %
15
10
5
–5
0
25
20
0
P/E ratio
Annu
alize
d S&
P 50
0 to
tal r
etur
n of
nex
t 10
year
s
5 10 15 20
20001999
1998
3025
Stocks
Fig. 2: Stocks were extremely expensive ten years ago
Source: Shiller (2011), Standard and Poor’s, UBS WMR estimates
Price-to-earnings (P/E) ratio on trailing 10-year adjusted real operatingearnings per share
25
20
15
10
5
0
30
40
35
1900 1920 1940 1960 1980 2000

The Decade Ahead February 2011 65
Stocks
Fig. 4: Higher sector concentration increases market risk
Source: FactSet, UBS WMR
Difference between first- and second-largest S&P 500 sector, as % of S&P 500
20
15
10
5
0
25Tech bubble
Financial crisis
1900 1995 2000 2005 2010
All was not lost then, all is not lost nowOver the past 10 years, many non-US equity mar-kets and small- and mid-cap US stocks performed much better than the large-cap S&P 500 index. Within the S&P 500, there were some pockets of strong performance, notably in the commod-ities-related sectors. But while the average S&P 500 sector earned nearly 40% over the past 10 years, the index barely budged since Financials, Technology and Healthcare – which collectively represented 53% of the entire index in December 2000 – all posted negative returns. In fact, although the S&P 500 (a market-value-weighted index) generated an annualized total return of just 1.4% from 2000-2010, the S&P 500 equal-weighted total return index produced an annual-ized gain of 6.3%.
Looking back, looking ahead Ten years ago, investors in either the S&P 500 or a portfolio that closely tracked the index were actually holding a very expensive, highly concen-trated basket of stocks. In addition, the economy was at the precipice of an initial short and shal-low recession in 2001 and a terrorist attack that exacerbated that downturn, only to be followed seven years later by the deepest peacetime reces-sion since the 1930s. While the economic outlook remains challenging today, we propose that future equity returns appear far more attractive for inves-tors than they did at the outset of the last decade.
Admittedly, economic growth may fall short of long-run averages as the US economy faces the ongoing structural challenges of household sector deleveraging and inevitable � scal consolidation. Despite this trend US GDP growth over the next 10 years should manage to exceed last decade’s historically low growth rate of just 1.7% (see page 8 for a more detailed discussion of US leadership). Current GDP is depressed – still slightly below its 2007 peak – providing a low base e� ect to li� growth rates while gains in population, labor pro-ductivity and innovation should continue to sup-port economic growth rates. But keep in mind investors buy shares of companies, not shares of GDP. Corporate pro� ts for US companies ben-e� t not only from the domestic economy, but are increasingly global. Stronger structural growth in many emerging market countries should increas-
ingly boost US corporate pro� t growth as domes-tic companies have become more exposed to these faster-growing end markets. Note, however, that pro� ts derived in emerging markets may ulti-mately embed greater volatility, since these fast-growing but less-established markets are more prone to boom-bust cycles.
But the most dramatic di� erence between 10 years ago and today is the stark contrast in mar-ket valuation levels. Sky-high market S&P 500 valuation levels in the late 1990s and early 2000s were predicated on investors extrapolating robust, technology-driven productivity (and ultimately earnings) that failed to materialize. Using an adjustment to smooth out or “normalize” corpo-rate earnings, stocks traded at their all-time high valuation levels relative to trend earnings (by a wide margin) 10 years ago. On the same metric today, the S&P 500 trades roughly in line with his-torical averages.
Industry-speci� c, or index concentration, risk has also diminished markedly in recent years. No one sector in the S&P 500 comprises more than 19% of the market capitalization of the index. Perhaps even more important, the largest sector weights, Information Technology and Financials, are each trading at below-average valuations – both on an absolute basis and relative to the market. With little industry concentration and no obvious valu-ation or earnings bubbles, the probability of an adverse shock to market indexes appears low, compared to history.

66 February 2011 The Decade Ahead
Our 2020 S&P 500 “target” or fair-value estimateRecognizing that forecasting equity prices 10 years into the future is fraught with peril, we none-theless lay out a framework for how investors should be thinking about long-term equity market returns. Equity prices are a function of earnings and the price investors are willing to pay for those earnings, known as the price-to-earnings (P/E) multiple. Even though earnings fell sharply in both the 2001 and 2008-2009 recessions, over the last 10 years S&P 500 operating earnings actually rose a respectable 50%. As previously discussed, the primary culprit behind the paltry equity market performance during the lost decade was the sharp contraction of the S&P 500’s P/E multiple.
Imagine the date is December 31, 2000. Any stock market strategist who had predicted that the S&P 500 would be lower in 10 years would have been ridiculed. But a relatively simple forecasting tech-nique of valuing stocks based on normalized, or cyclically adjusted, earnings and applying a long-
term average P/E multiple to those earnings would have yielded that very conclusion. At the end of 2000, a strategist armed only with the observed market price and earnings data over the prior 60-year period and a fundamental belief in mean reversion could have determined the following: extrapolating 1940-2000 S&P 500 earnings over the upcoming decade would have yielded a 2010 S&P 500 earnings per share (EPS) estimate of USD 87. Applying the average 1940-2000 P/E multiple of 14.2 to those earnings would have resulted in an S&P 500 price target for the end of 2010 of 1250 – what remarkable accuracy!
Of course, the reason this “works” is because it assumed that P/E multiples would revert back to the long-run average. At the time, the abnor-mally robust equity market valuation multiples were defended by investors and strategists as the result of higher secular growth resulting from the tech-inspired “e-economy,” low and stable in� ation and the muting of the business cycle. Unfortunately, we all know how this movie ended.
Stocks
Our expectation that equities will outperform bonds during the decade ahead is predicated at least as much on a bleak outlook for � xed income investments as it is on overall constructive prospects for equities.

The Decade Ahead February 2011 67
Stocks
But fast forwarding to today, market returns over the next 10 years are likely to be more “normal” due to the very fact that the valuation excess wit-nessed earlier this decade have been painfully wrung out. Assuming that the S&P 500 will again gravitate toward its intrinsic value, we conclude that over the next 10 years, the S&P 500 should generate a total return of approximately 9%. Trend S&P 500 earnings should reach USD 165 per share by the end of 2020. Applying the average P/E multiple since 1940 on trailing EPS of 14.7x would imply an S&P 500 target for the end of 2020 of 2450, which roughly translates to a 7% annualized gain in the index. Adding a 2% divi-dend yield would push the annualized total return for stocks to 9% over the next 10 years.
Reversal of fortunesOur expectation that equities will outperform bonds during the decade ahead is predicated at least as much on a bleak outlook for � xed income investments as it is on overall constructive pros-pects for equities. As discussed in more detail on page 57, we expect in� ation to rise over the next couple of years and to average 5% during the decade. Together with mounting concerns about public debt sustainability, the implication is that yields for the broad bond market are likely to shi� into the 5-7% range and remain elevated for a protracted period. We would expect average bond returns in the low single digits. Adjusted for in� a-tion, bonds will have a hard time posting a posi-tive return.
For additional historical perspective, annual returns from equities have exceeded bonds 63% of the time since 1871. However, looking at cumulative 10-year returns, bonds have outperformed stocks just 15% of the time. Moreover, in those 10-year periods when bonds outperformed stocks, the average annualized stock market return has been just 2.1%. So it appears that there is signi� cant room for our equity market forecast of 9% annu-alized market gains to fall short and for stocks to still outperform bonds. Even if we assumed that earnings growth over the next 10 years would match the sub-trend growth of the past decade, stocks would still generate an annualized return of over 6%, assuming an average P/E multiple at the end of the period.
Another method to gauge the relative attractive-ness of stocks versus bonds is to compare the current equity risk premium (ERP) to the long-run average. The ERP is essentially a measure of rela-tive yield between stocks and bonds, namely the earnings yield on stocks minus the real bond yield. Based on our estimates, the current ERP falls in the 60th percentile. Historically, the higher the ERP, the stronger the outperformance of stocks relative to bonds in the subsequent 10 years. Keep in mind that between 1997 and 2001, the ERP was con-sistently between the 8th and 19th percentile, and subsequent 10-year relative returns favored bonds by the widest margin in history.
In sum, we expect that a� er a decade in which bonds outperformed stocks by one of the wid-est margins on record (see Fig. 5), the fortunes of these two asset classes will reverse. Bonds will come under severe pressure, while stocks should post reasonably attractive returns.
Fig. 5: Stocks likely to rebound aer pronounced weakness
Source: Shiller (2011), Standard and Poor’s, UBS WMR estimates
10-year rolling compound annual return of stocks minus bonds, in %
15
10
0
–10
5
–5
20Stocks outperform bonds
Bonds outperform stocks
1880 1900 1920 1940 19801960 2000

68 February 2011 The Decade Ahead
Bonds: the elusive quest for a safe haven
ing pressure in the decade ahead (although the prospects for actual sovereign defaults remain remote for most countries). This development represents a paradigm shi� brought about by the enormous debt loads these countries accu-mulated leading up to, and as a result of, the � nancial crisis (see Fig. 2).
Managing these debt burdens poses several struc-tural challenges:
• The risk of “crowding out” private borrowers increases as government debt takes on a larger share of the overall bond market. In this envi-ronment, interest rates rise for both individuals and corporations as they are forced to compete with the government for the same pool of sav-
The downside of leverage: eventually the piper has to be paidUS Treasuries have long been considered a “risk-free” asset, with a zero probability of default. However, the � nancial condition of the US fed-eral government has been subjected to increased scrutiny, and with it, the notion of Treasuries as a risk-free asset. Until recently, the credit quality of the government debt of European Monetary Union (EMU) members was also considered to have minimal, if any, risk of default. However, the European debt crisis has sparked a reassessment of credit quality, prompting ratings downgrades of several countries (see Fig. 1). We expect Treasury securities, as well as the sovereign debt of Japan and certain Eurozone countries, not to mention their respective currencies, will come under grow-
We expect interest rates in advanced economies to rise amid structural de� cits, growing debt burdens and the prospect of higher in� ation. Erosion in the perceived credit quality of government bonds will challenge the notion that sovereign debt is a risk-free asset, leading to an increase in risk premiums.
Anne Briglia, CFA, Strategist; Katherine Klingensmith, Strategist; Thomas McLoughlin, Analyst
Fig. 1: Soverign debt ratings are unstableChanges in long-term sovereign debt ratings, local currency, last 10 yearsStable Upgraded Downgraded
US China Greece
France Brazil Ireland
Germany India Portugal
Canada Japan Spain
UK Italy
Source: Moody's, S&P, Fitch
Fig. 2: Government debt threatens sovereign credit ratings
Source: OECD
Gross public debt as a share of GDP, in %, 2010
150100500 200
JapanItaly
GreeceBelgium
FranceUS
PortugalUK
GermanyIrelandAustria
NetherlandsSpain

The Decade Ahead February 2011 69
ings. This dynamic also restrains productivity and economic growth. Academic research suggests that once a country’s debt-to-GDP ratio reaches approximately 90%, the overall growth rate of the economy starts to slow.1 In many developed economies, debt ratios have already crossed this threshold and are likely to increase in the years to come.2
• The cost of debt service is likely to increase sig-ni� cantly. Up to this point, interest costs have actually fallen for many countries even as the amount of debt outstanding grew rapidly. For example, while US government borrowing increased by USD 3 trillion over the last two years, interest expense dropped from USD 253 billion to USD 197 billion, or just 1.4% of GDP (see Fig. 3). Debt service costs have been low because strong demand for government bonds, easy monetary policy and decelerating in� ation have pushed yields to historically low levels. The Federal Reserve (Fed) and the European Central Bank (ECB) have kept monetary policy rates extraordinarily accommodative in order to ward o� de� ation and stimulate economic growth. As the � nancial crisis recedes, de� ation fears will ebb, and growth will accelerate. We expect the demand for government debt will fade and central bankers will begin to normalize mon-etary policy. As interest rates rise, the interest expense on outstanding debt will grow rapidly. The Congressional Budget Of� ce (CBO) proj-ects that the interest expense for the US federal government will climb to USD 778 billion per
year by 2020, or 3.4% of GDP.3 As govern-ment debt increases and becomes a larger share of GDP, we expect the rate of interest that investors demand to hold US Treasuries will likewise increase.
• When chronic � scal and current account de� -cits coincide, the resulting dependence on for-eign savings can create political and economic friction. In the US, the federal government has grown more reliant on global investors for debt � nancing. Foreign ownership of US Treasury securities increased from 35% in the early 1990s to 47% presently (see Fig. 4). Three countries – China, Japan and the UK – account for nearly 25% of the foreign ownership of US government bonds. Although dif� cult to quan-tify, we can infer that foreign buying has had the signi� cant e� ect of lowering borrowing costs for the US government.4 Highly indebted advanced economies vary in terms of the degree of domestic savings available to � nance gov-ernment overruns, with countries such as the UK and some peripheral European nations also highly dependent on foreign savings. Should foreign investors choose to redeploy their capital elsewhere, domestic investors in these countries would need to shoulder more of the � nancing, sending bond yields higher.
• The most heavily indebted countries will most likely be unable to grow their way out of their problems, given the magnitude of government debt outstanding. Government debt burdens
Bonds
Fig. 3: Interest expense on US debt set to grow
Source: Congressional Budget Office, Office of Management and Budget
Net interest expense as a share of GDP, in %
3.0
2.5
2.0
1.5
1.0
0.5
0.0
3.5
4.0
EstimateNet interest expense as a share of GDP
1940 1960 1980 2000 2020
Fig. 4: Outstanding debt and foreign ownership have increased
Source: Bloomberg, US Treasury Department
Marketable US Treasury debt outstanding, in trillions of USD Foreign holdings, in %
8
6
4
2
0
10
30
20
10
0
50
40
60
Held by foreignersMarketable debt outstanding
2000 2006 20082002 2004 2010

70 February 2011 The Decade Ahead
are increasingly structural in nature rather than cyclical, making it much harder to automatically pare back on borrowing when the economy
revives. Structural problems include: an aging population and increased spending on old-age entitlements, such as healthcare and pensions; a workforce with obsolete skills or limited mobil-ity; and the politics of special interest groups, which make cutting services and subsidies extremely dif� cult. While austerity is the tradi-tional policy prescription, there are limits on how much a government can cut spending and hike taxes, since at some point higher taxes produce disincentives to work. And voters can reject spending cuts if they cause too much pain. Austerity can be critical for regaining the mar-ket’s con� dence, but historically it is rare that austerity alone actually brings down a country’s absolute level of debt.
A pact with the devil: rising in� ationWhat can a country possibly do to get out from under a crushing debt burden? While outright default is an option in principle, we � nd it unlikely, especially for those countries that control their own printing presses. Countries running exter-nal de� cits would be shooting themselves in the foot by defaulting, as they would � nd it especially painful when they eventually return to interna-tional capital markets to seek new loans. Instead, we expect central bankers will tolerate higher levels of in� ation, although to di� erent degrees (see page 57 for a more detailed discussion on our outlook for in� ation). Because debt is � xed in nominal terms and most governments borrow in their domestic currency – a value over which they have some control – there is a strong temptation to allow in� ation to rise. To lower the value of the debt, all policymakers need to do is devalue the money in which the debt is repaid through an
increase in in� ation and an erosion of purchasing power. To do this, a government could ask – or even compel - its central bank to buy its sovereign
debt with newly printed money, a process known as “debt mon-etization.” The result will be higher in� ation and an erosion of the debt’s value in real, or in� ation-adjusted, terms. Those countries that do not have their own currency cannot in� ate away debt. This puts countries that use the euro at lower risk
of monetization but at higher risk of default than the US or the UK.
Sovereign debt: the thrill is goneWe believe default risk, which is the ultimate threat to bondholders, is higher for Eurozone countries than the US. Because monetary policy is conducted by the ECB, individual governments no longer have their own currency to debase through in� ation. Instead, governments of those countries facing high debt burdens within the Eurozone will be forced to rely more on auster-ity measures than the US. We do not think there will be widespread sovereign defaults, but the threat that the EMU might permit the restructur-ing of an individual government’s debt and force losses on private bondholders will cause substan-tial market volatility. Those countries with better fundamentals and a higher likelihood of growth and successful austerity programs are less likely to experience dif� culties raising money in inter-
Bonds
Fig. 5: Financing costs will continue to diverge
Source: Factset
Benchmark 10-year government bond yields, in %
10
8
6
4
2
0
12
14
GreeceGermany
SpainIreland
2006 2007 2008 2009 2010 2011
While outright default is an option in
principle, we � nd it unlikely, especially for
those countries that control their own
printing presses.
““

The Decade Ahead February 2011 71
national capital markets. Investors have already begun to di� erentiate among Eurozone coun-tries, a trend we believe will deepen. Credit risk premiums have been applied to most European sovereign debt, and yields on bonds from Greece, Ireland, Portugal and Spain have increased com-pared with Germany (see Fig. 5).
In contrast, US Treasuries are still considered a
risk-free asset. Although we believe there is little chance that US Treasuries will actually default, the overall creditworthiness of the federal govern-ment debt will deteriorate in the eyes of lenders if Congress fails to adopt � scally sustainable tax and spending policies. A downgrade of US Treasuries will not, in our view, mean a material risk of default but will result in considerable interest rate risk and a substantial increase in volatility.
Bonds
We expect the US to experience higher in� ation than other developed countries, further burdening the dollar, as the Fed struggles to reduce its large balance sheet and is tempted to employ some degree of debt monetization.

72 February 2011 The Decade Ahead
encourage businesses and consumers to borrow more aggressively. In their view, the American economy is caught in a liquidity trap whereby loan demand is diminished because consumers and businesses cannot identify pro� table investment opportunities. Some foreign central banks have also criticized QE2 as a thinly disguised attempt to depreciate the value of the dollar at the expense of other currencies. By driving the dollar lower in value, US exports may become more attractive to purchasers outside the US. Critics argue, however, that such a policy will reduce global growth by hampering economic activity in developing coun-tries and simply drive up the prices of imported goods in the US, thereby further contributing to higher in� ation.
Low in� ation and falling in� ation expectations have been a critical element of low overall yields. As the economy � nds a � rmer footing in the years ahead, the Fed will need to reverse an extraordi-nary amount of monetary stimulus. Should the Fed fail to unwind its easy monetary policy in a timely fashion, it risks overheating the economy and triggering in� ation pressures. Perhaps an even bigger risk is that of deliberate monetization by the Fed in order to help the Treasury Department maintain demand for its bonds (see page 57 for a more detailed discussion of in� ation).
Where do we go from here?We expect that due to both heightened credit and in� ation concerns, bond yields on the sov-ereign debt of many of the advanced economies
Trouble ahead: higher US government bond yieldsWe believe the 30-year decline in Treasury yields has run its course. Although a sustained period of higher bond yields is unlikely in 2011, due to lingering de� ationary pressures and still mod-est private sector borrowing needs, a number of structural factors point to higher Treasury yields in the years ahead. The Fed’s aggressively accommo-dative monetary policy response to the � nancial crisis and the ensuing Great Recession was a key factor in lowering Treasury yields to generational lows. During the acute phase of the � nancial crisis, Treasury yields fell to levels last seen in the 1950s as investors dumped riskier assets and snapped up Treasury securities (see Fig. 6). Constrained by the zero lower bound on interest rates and anxious to avert a Japanese-style bout of de� a-tion, the Fed implemented several asset purchase programs, buying agency and Treasury securities, among other assets, in an e� ort to lower yields on intermediate- and longer-maturity bonds. The asset purchase program, known as “quantitative easing” (QE), provided essential support for the housing and banking sectors during the recession (see Fig. 7).
A second round of quantitative easing, commonly referred to as QE2, has been more controversial in the US and abroad. By adding more reserves to the banking industry, the Fed is attempting to stimulate loan demand and encourage credit expansion. Critics assert that rates are already so low that further monetary stimulus is unlikely to
Bonds
Fig. 6: Treasury yields are low from an historical perspective
Source: Federal Reserve
10-year US Treasury note yields, in %
4
2
0
16
6
14
12
10
8
1950 1960 1970 1980 1990 2000 2010
Fig 7: The Fed expands its balance sheet
Note: MBS = Mortgage-backed securities. CPFF = Commercial Paper Funding Facility.Source: Federal Reserve
Federal Reserve balance sheet assets, in trillions of USD
1.5
1.0
0.5
0.0
2.0
2.5
3.0
2005 2006 2010200920082007 2011
Term auction credit Other loans
Agency MBS
Repos
Central bank liquidity swaps
US Treasuries Agency debt
Other assets
CPFF

The Decade Ahead February 2011 73
is partly what has made it an attractive place to park assets. This gives the US an unrivaled ability to sell bonds to investors around the world. We expect that America’s worrisome public balance sheet – its high and increasing level of debt and its large current account and budget de� cits – will weigh on the dollar for the foreseeable future.
will rise and become more volatile over the next several years. The concept of risk-free assets and a passive “no risk” portion of a portfolio is, in our view, obsolete. This represents an overall shi� in the way investors approach and manage � xed income portfolios. We expect such rate volatility will demand much more intensive management of bond portfolios.
Bond yields can be decomposed into the real yield plus a premium to compensate for in� ation risk and credit risk. Historically, bond investors have not demanded a credit risk premium to hold Treasury securities but we believe this will change in the decade ahead. Assuming a real yield of 2%, a credit risk premium of 1% and an in� ation pre-mium of 3% to 5%, we believe that the 10-year Treasury yield could rise to somewhere between 6% and 8% over the next 10 years – up substan-tially from current levels near 3.50%.
Using a simple model to calculate projected nominal and real (i.e., a� er in� ation) returns, we estimate that bonds would o� er investors a low nominal return, ranging between 3.0% and 3.50%, while in� ation-adjusted returns would range between minus 0.5% to plus 0.75%. (Note: The projections for these return ranges refer to average annual returns over the decade.) Bear in mind that these calculations are rough estimates and that the outcome is signi� cantly in� uenced by the path of forecasts for in� ation, the real yield and the credit risk premium. Returns in individual years during which the yield increase happens are likely to be abysmal. Still, the analysis suggests two conclusions. First, it seems unlikely that the absolute return on bonds will match the favorable experience of the last 10 years. Second, bond returns are likely to lag those on stocks (see page 63 for a more detailed discussion of stocks versus bonds).
Toward a multi-currency frameworkIn large part because of its risk-free status over the years, Treasury securities and the US dollar have been the world’s reserve asset and currency, respectively, since before World War II.5 As the reserve currency, the dollar is the primary means of exchange and a store of value in global mar-kets. Ironically, the depth of the Treasury market
Bonds
The European debt crisis
The EMU was founded with the idea that the countries within the union would eventually “converge” to similar levels of GDP per capita, as well as savings and spending behavior. However, since the introduction of a common currency in 1999, some countries have run persistent current account de� cits (especially those poorer countries on the “periphery” of Europe, such as Greece, Spain, Portugal and Ireland), while others have run surpluses (principally Germany). Markets were asking for similar interest rates to lend to di� er-ent countries, facilitating the run-up in debt among those peripheral countries with current account de� cits, such as Greece and Portugal, and to those with highly leveraged bank-ing sectors, such as Ireland. With the onset of the � nancial crisis and widespread stress in the banking industry, those countries with large banking industries saw these liabilities at least partially transferred to the state, elevat-ing government indebtedness. While the risk of monetizing debt (and therefore in� ation) is lower with an independent supranational central bank, the costs of implementing harsh austerity measures are daunting. We expect that the structural heterogeneity in Europe will not improve and that eventually the union will have to change form or membership. Such a transition will cause substantial volatility in debt and currency markets, if national curren-cies are reintroduced.

74 February 2011 The Decade Ahead
Bonds
Additionally, we expect the US to experience higher in� ation than other developed countries, further burdening the dollar, as the Fed struggles to reduce its large balance sheet and is tempted to employ some degree of debt monetization. However, because there is no ready substitute for the dollar and given that so many countries have their savings in the US currency, we do not expect a collapse in the dollar.
At present, we believe only a major geopolitical or economic upheaval could ultimately unseat the US dollar as the world’s reserve currency. First, although its share of the global economy will slip over the next decade, we believe the US will retain its leadership role in world a� airs (see page 8 for a more detailed discussion of US leadership). Second, despite its myriad problems, the dollar has a strong grip as the principal reserve currency because of network e� ects (that is, the cumula-tive bene� ts of having a single, dominant reserve currency). Given America’s � scal challenges and the demand among of� cial and private investors for diversi� ed currency portfolios, we expect the share of dollars held in international portfolios to decline gradually over time (see Fig. 8). However, in the absence of alternatives, we expect the dol-lar to retain its dominant role in foreign exchange markets.
A large part of the dollar’s staying power is that there is currently no viable alternative. Hard assets, such as gold, are too scarce and provide limited monetary � exibility. The British pound and the Japanese yen were at one time serious contenders, but have been shrinking in international portfolios because both the British and Japanese economies face slow growth and a smaller global role. It will likely take many years and profound institutional change for the euro to regain appeal as a safe and liquid currency. China’s currency, the yuan, is not freely traded outside China, and the country still imposes high barriers to foreign investment and shows little inclination to expand its government debt market. We expect that China will reduce its capital controls and continue to increase the con-vertibility of the yuan, but even as the currency grows in global importance and value we do not think it will challenge the dollar’s role this decade. In sum, we think the dollar is likely to slowly lose
its absolute dominance, leading to a gradual shi� in foreign exchange reserve holdings, but will not be overtaken by another currency as a primary reserve currency.
Emerging markets will continue to shineMany emerging market countries have been on the opposite side of these growing global imbal-ances, as they accumulate savings and lend to other countries. As such, emerging market curren-cies have bene� ted from the strong performance of their economies and from substantial improve-ments in policies and governance (see page 28 for a more detailed discussion of emerging markets). We expect further improvement in the macro-economic environment, including high economic growth rates and well-managed in� ation, to raise productivity, encourage investment, increase domestic consumption and lower interest rates. While we expect a steep appreciation path for many emerging market currencies over the next decade, the large imbalances among blocks of countries also can be destabilizing. Some emerg-ing markets still have unstable governments, a high reliance on exports and uncertain invest-ment environments. Changes in relative economic power can cause political friction, with widespread rami� cations (see page 23 for a more detailed dis-cussion of geopolitics).
We do not believe emerging market currencies will form a major part of central bank reserves for at least a decade; nor will they compete directly with the currencies of advanced economies as stores of
Fig. 8: US dollar remains the largest reserve currency
Source: International Monetary Fund COFER database
Composition of reported official foreign exchange reserves, in %
60
40
20
0
80
100
Pounds sterlingU.S. dollars
EuroJapanese yen Other currencies
1999 2000 2004200320022001 200720062005 2008 2009

The Decade Ahead February 2011 75
For many years, the US municipal market exhibited little volatility. State and local government ratings were generally stable and bond insurance was plentiful. For individuals – the single largest part of the municipal market’s investor base – the rela-tive stability of the municipal market was a welcome attribute.
Much has changed. The Build America Bonds program broadened the universe of municipal investors, and with it, forced greater scrutiny of state and local gov-ernment � nances. Antiquated disclosure practices are now subject to widespread criticism; investors can expect more direct federal regulation in the decade ahead.The recent recession has placed a signi� -cant amount of strain on state and local government � nances across the country through lower tax revenues, sometimes severely so, and corresponding spending cuts. Critical media coverage has exacer-bated the problem by increasing the anxi-ety of individual investors, who together constitute 36% of the market. Not surpris-ingly, volatility has increased.
Even so, the revenue available to state and local governments is suf� cient to pay prin-cipal and interest on amortizing debt. And unlike many other asset classes, the munici-pal market employs long-term amortiz-
ing debt almost exclusively. We believe the potential for a liquidity crisis is muted by the absence of debt structures reliant on periodic bullet maturities. As the U.S. economy recov-ers, albeit slowly, investors are likely to shi� their focus to longer-term challenges.Three states – Alaska, Michigan and Utah – have already transitioned from de� ned ben-e� t plans toward de� ned contribution plans for new employees. As this decade unfolds, more states will follow their lead as the only rational approach to the growing � nancial burden posed by traditional public pension programs. Persistent budget constraints also will compel states and local governments to rely more heavily on private sector invest-ment in transportation and utility infrastruc-ture. Resistance from public employee unions has been a stumbling block in the past to privatization. We believe governments will be compelled to proceed despite such opposi-tion in the years ahead.
We expect a consensus of sorts to emerge among investors eager to reward state and local governments that proactively address these two most important and pressing issues for the municipal bond market – pension liabilities and infrastructure invest-ment. And these same investors will reduce their credit exposure to governments that fail to adopt meaningful reform.
Bonds
Municipals: focus shifts to pension reform and infrastructure
value or mediums of exchange. We expect central banks will seek to diversify their foreign exchange reserves, and a multi-currency reserve framework may slowly emerge. With the euro’s credentials diminished, Japan’s towering debt-to-GDP ratio hindering the yen and the limited convertibility of the Chinese yuan, the dollar is le� as the best among the options. We therefore think a multi-currency reserve framework, with the US dollar playing a central role, seems the most likely devel-
opment over the coming decade. While it is our view that US Treasuries and the dollar will remain dominant in global � nancial markets, investors would be wise to seek global diversi� cation and hold bonds and currencies of those countries not facing severe debt burdens.

76 February 2011 The Decade Ahead
Philanthropy: makes an impact
The promise that lies aheadThere are many reasons to expect philanthropy and charitable giving to grow during the next decade:• The population of potentially large donors is
growing. According to Forbes magazine,1 the number of billionaires has risen from just 300 at the start of the new millennium to over 1,000 in 2010 (see Fig. 1).
• An aging world also portends an increase in giv-ing, since people are more likely to donate to charity as they age and leave money in bequests (see Fig. 2). Given historical donation rates at various estate size levels, Havens and Schervish2 forecast that Americans may bequeath USD 6 trillion (based on USD 1998) to charities over the next half century.
• Technology is transforming philanthropy by gen-erating social networks to raise awareness of important social issues, as well as new channels for microgiving.
While the potential for charitable giving is enor-mous, there is also massive need:• Nearly 1 billion people worldwide are under-
nourished, and one child dies every six seconds from hunger-related causes.3
• More than 2 billion people lack access to basic water sanitation.4
• An estimated 33.3 million people live with HIV/AIDS, and 16.6 million children were orphaned due to AIDS in 2009.5
These and many other problems are clearly enor-
People will increasingly judge philanthropy on results. Large donors demand accountability, while smaller donors use social networks to pool resources and raise awareness. Socially responsible investing is broadening, prompting more companies to embrace sustainable business practices.
Alexandra Mahoney, Analyst; Kurt E. Reiman, Head, Thematic Research WMR Americas
800
600
400
200
0
1000
1200
1996 1998 2000 2002 2004 2006 2008 2010
Fig. 1: Number of billionaires increases to 1,000
Number of billionaires worldwide
Source: Forbes
15–24 25–34 35-49 50+
30
25
20
15
10
5
0
35
Fig. 2: Frequency of giving increases with age
Share of respondents who had given money to charity in the previous month, in %
Source: Charities Aid Foundation

The Decade Ahead February 2011 77
mous, and donors have high hopes that their e� orts will make a di� erence. As governments are forced to pare back spending on important social programs, gi� s of time and money will become more important for achieving social change. Therefore, donors and philanthropic organizations will work ever harder to ensure that every dol-lar has the greatest possible impact. Additionally, numerous corporations are embedding environ-mental, social and governance objectives into their business culture at a time when investors – both individuals and large foundations – are looking to apply their values to their portfolio. Socially responsible investing and impact investing provide the interface between the investors who expect their assets to generate a “sustainable” return and the companies and investments that achieve strong � nancial and social performance.
The size of charitable giving is impressive. In the US alone, charitable contributions exceeded USD 300 billion in 2009, or 2.1% of GDP (see Fig. 3).6 This represents nearly USD 2,000 per American household per year. It is the collective action of these donors, both large and small, as well as the e� orts of investors, businesses, foundations and volunteers, that we believe will leave a lasting imprint on the world over the next 10 years.
The whole becomes more than the sum of its partsThe scope and objectives of philanthropic activi-ties – whether through charitable giving or private investing – are also evolving. While impossible to
pinpoint all, we identi� ed a number of trends that we believe will shape the world of philanthropy over the next decade.
Colossal pledges of wealthIndividual donations represent the majority of charitable gi� s each year (see Fig. 4). But this past decade may yet be de� ned by the monumental pledges that the world’s wealthiest individuals made to philanthropic organizations, not to men-tion the formation of massive new foundations. As of 2007, Bill and Melinda Gates had given or pledged over an estimated USD 28 billion, or about 50% of their net worth, which is admin-istered in part through the Bill & Melinda Gates Foundation. In 2006, Warren Bu� ett pledged USD 30 billion of his assets over 20 years to the Bill & Melinda Gates Foundation, which represented the largest charitable gi� in history.7
The challenge that Warren Bu� ett and Bill and Melinda Gates made to America’s billionaires to pledge the majority of their wealth to charity within their lifetime or upon death resulted in the Giving Pledge in August 2010 and 58 commit-ments by February 2010. These gi� s from newly minted millionaires and billionaires have become increasingly important to funding philanthropic e� orts because, according to The Economist,8 “The richest 1% of the world’s adults control 43% of the world’s assets; the wealthiest 10% have 83%.”
Philanthropy
0.0
0.5
1.0
1.5
2.0
2.5
1969 1974 1979 1984 1989 1994 1999 2004 2009
Fig. 3: Charitable giving roughly constant as a share of GDP
Total US giving as a share of US gross domestic product, in %
Source: Giving USA Foundation
Bequests
7.8%
Foundations
12.7%
Corporations
4.6%
Individuals
74.9%
Fig. 4: Individuals are far and away the largest donors
Sources of contributions, in %, 2009
Source: Giving USA Foundation

78 February 2011 The Decade Ahead
ingly more value-aligned for economic and social reasons. Matthew Bishop, co-author of Philanthrocapitalism: How Giving Can Save the World, identi� es multiple motivations for corpo-rate social involvement that go well beyond pub-licity stunts and government pressure. Particularly important to companies is being identi� ed as an employer with core social values that inspire people. Bishop also believes that corporations rec-ognize the importance of being a strong corporate citizen, especially when entering emerging mar-kets. “Being more philanthropic is becoming part of corporations’ strategies…the DNA of a com-pany,” according to Bishop.9
SRI broadens its reachBoth socially responsible investing (SRI) and impact investing (II) will continue to grow throughout the decade as the business of philanthropy becomes both more institutionalized and values-based. Moreover, greater scrutiny of corporate gover-nance has opened an entirely new frontier that will widen the scope of SRI investing and provide addi-tional criteria for evaluating corporations. The need for endowments and trusts to both “do good” and “do well” means that more resources will be allocated to managing SRI and II assets as inves-tor demand grows. What had once been viewed as a niche market or satellite strategy will become increasingly mainstream, due to the more aggres-sive positioning by philanthropic organizations and continued strong investment results. Moreover, this may lead to spillovers, helping to popularize SRI and II in other parts of the investment community.
Corporate involvement to ramp upCorporations were the fourth-largest donor in 2009, trailing contributions from individu-als, foundations and bequests. However, the biggest philanthropic impact from businesses may not necessarily � ow from the money they donate but rather from the values they embrace. We anticipate corporations becoming increas-
Philanthropy
500
400
300
200
100
0
600
700
FTSE KLD 400 Social IndexS&P 500 Index
1990 1992 1994 1996 1998 2000 2002 2004 2006 2008 2010
Fig. 5: SRI has outperformed the broad market since 1990
FTSE KLD 400 Social Index versus S&P 500 Index (April 1990 = 100)
Source: Bloomberg
Socially responsible investing and impact investing
Traditional socially responsible investing (SRI) strategies apply “negative screens” to a port-folio to remove companies with poor environ-mental or social track records. Quakers were the � rst to apply this investment approach as far back as a century ago. However, founda-tions and endowments also use this exclusion method to rid portfolios of investments that do not align with their social missions. A modern-day manifestation of SRI is the FTSE KLD 400 Social Index of US equities that measures the impact of social and environmental screening on investment portfolios. Since its inception in May 1990, the FTSE KLD 400 Social Index had compounded annual growth rates of 7.8%, compared to the S&P 500’s annualized returns of 6.8% over the same period (see Fig. 5).
A close relative to SRI – “impact investing” – takes a di� erent tack. According to a report by Harvard University, impact investing (II) is de� ned as “investments intended to cre-ate positive impact beyond � nancial return” that seek to “actively deploy capital in busi-nesses and projects that can provide solutions at scale.”10 Impact investing is particularly applicable to endowments and foundations because it enables them to further invest in their missions while also growing the asset base. It is where “philanthropy meets wealth management” as the organization attempts to “maximize its social impact,” according to Wayne Farmer of Arabella Advisors.11 The Rockefeller Philanthropy Advisors describes impact investing as a way to bridge “the sharp dichotomy between pro� t-maximizing � nancial investment and “give-it-away” charity [which] is gradually losing its edge.”12

The Decade Ahead February 2011 79
operations and strategies of charitable giving and values-based investing over the next 10 years. However, the impetus behind these investments is to create social change by involving more people and raising more funds. We believe these philan-thropic e� orts will de� ne the decade ahead and leave a lasting and positive impact for the decades beyond.
Individuals identify goalsAmerican history is dotted with transformational donations by some of the country’s wealthiest citizens. For example, Scottish-American indus-trialist Andrew Carnegie donated USD 350 mil-lion, almost all of his wealth, during his retirement years on the belief that he could help others help themselves.13 To this end, Carnegie focused his e� orts on building over 2,500 public libraries and other academic institutions. Many credit his vision with furthering literacy at the beginning of the 20th century.
The guiding principle behind the Bill & Melinda Gates Foundation is “that every life has equal value.” The foundation creates grants target-
Technology connectsWe believe charitable organizations and donors can bene� t from existing technology, especially when it involves responding rapidly to tragic devel-opments, like a natural disaster. We anticipate more Internet-enabled organizations will use tech-nology to educate, connect and report results to foundations and individuals. Nicole Sexton of The FEED Foundation believes that nonpro� t organiza-tions must use social media to prospe. She sees social media as a natural progression to connect with younger generations, now and in the future. Social networks may also pave the way for growth in charitable giving over the next 10 years as more organizations use the Internet as a marketing and fundraising tool. These social networks connect people with similar interests and enable organiza-tions to communicate quickly with their followers. There are even Facebook applications, like Good Samaritan, Social Vibe and Charity Trivia, that tar-get a certain social issue and facilitate donations.
Springing to action: strong underpinning brings resultsThe factors we mentioned above shape the
Philanthropy
While the potential for charitable giving is enormous, the social issues that need to be addressed are even more massive: Nearly 1 billion people worldwide are undernourished, and one child dies every six seconds from hunger-related causes.

80 February 2011 The Decade Ahead
Corporations adopt sustainable beliefsCorporations are increasingly adopting environ-mental, social and governance criteria in the pur-suit of a more sustainable business model. This increased awareness of the wider world within which companies operate has yielded numer-ous positive social bene� ts. P&G is committed to being a corporation focused on its environment and social responsibilities by instigating change around the world. One example of P&G’s progress is through the P&G Children’s Safe Drinking Water Program. On a not-for-pro� t basis, the corporation and its program partners distribute “PUR” packets to purify water. One packet can clean up to 10 liters of dirty water. Since inception, this project has puri� ed more than 2.5 billion liters of drinking water in more than 60 countries, helping to save more than 13,000 lives.”15
Investors align assets with valuesIn addition to SRI, di� erent investment vehicles are enabling foundations and investors to collect a return, while also ful� lling their philanthropic agenda. Many are doing this by tapping into the knowledge and expertise of others. For example, the Calvert Social Investment Foundation, a non-pro� t organization founded in 1988, o� ers the Community Investment Note – a diversi� ed mix of high-impact organizations whose missions cover a range of issues. “Our investors are looking for a way to have their investment portfolio impact the world they live in and strengthen their local com-munities,” says Calvert Foundation’s Art Stevens. “We direct their investment to over 250 organiza-tions working in all 50 states and over 100 coun-tries to provide that � rst critical loan for a small entrepreneur, or help build a day care center that allows a single parent to work. Since inception, our investors and supporters have helped us build or rehabilitate over 17,000 homes, create 430,000 jobs in the U.S. and in developing countries, and � nance over 25,000 cooperatives, social enter-prises, and community facilities, all while return-ing interest and principal. We believe it is a real ‘win-win’.”
Building a sustainable endowmentTo grow and remain relevant, foundations must ensure that their social investments have an impact, but they must also manage their portfo-
ing global health, development and education. In 2010, the foundation launched a decade-long ini-tiative pledging USD 10 billion to research, develop and deliver vaccines for the world’s poorest coun-tries. The foundation hopes its grants, together with additional gi� s, will increase vaccine cover-age in developing countries to 90%. If the goal is reached, projections suggest it “could prevent the deaths of some 7.6 million children under age � ve from 2010-2019. The foundation also estimates that an additional 1.1 million children could be saved with the rapid introduction of a malaria vac-cine beginning in 2014, bringing the total number of potential lives saved to 8.7 million.”14
While foundations are able to deploy massive gi� s to achieve their mission, individuals are increas-ingly joining forces to achieve social change. The availability of information online enables individuals to pinpoint their cause and spring to action. A great example of redistributing wealth through technology is the organization, Kiva, whose mission, according to its website, is to “connect people through lending to alleviate pov-erty.” Pro� les of entrepreneurs in impoverished regions, many of them women, are posted on Kiva’s website. Donors then invest in the growth of the entrepreneur’s business with small loans that are transferred to an af� liated local micro-� nance organization and delivered to the entre-preneur. The loan can be small, starting at USD 25. Accountability is placed on the entrepreneurs, who are required to pay the interest and repay the loan over time. The entrepreneurs can then post photos or commentary at repayment to display the results of the loan. Since inception in 2007, Kiva has made over 250,000 loans with an esti-mated total value of USD 190 million to almost half a million entrepreneurs.
This heralds a fundamental shi� in the nature of giving. In the past, a fair portion of charitable gi� s was made with little collaboration or coordina-tion. So while each gi� had an impact, the cumu-lative e� ects were more limited due to potential for “overgiving” to certain favored causes and an inability to align gi� s with needs. The next genera-tion will be more about “purpose-driven” gi� ing but with an eye toward allocating those funds more ef� ciently and e� ectively.
Philanthropy

The Decade Ahead February 2011 81
and integral investment approach, which has prompted more companies to embrace sustain-able business practices. While there will not be one predominant trend that will shape philan-thropic institutions over the next 10 years, many opportunities will � ow from an increased aware-ness and focus on accountability.
lio of assets for sustainable growth. The so-called “endowment model” championed by Harvard, Yale and other leading universities was seen as a template for the future evolution in using asset management to achieve long-term investment goals. The ability to both diversify more broadly using nontraditional assets and the shi� toward absolute return vehicles were considered more in line with the long-term goals of the institutions. However, the poor returns and liquidity dif� culties that surfaced during the � nancial crisis prompted many to rethink the expansion into the alter-native investment space. A report by the Tellus Institute and Center for Social Philanthropy16 even called for “a transformation of the Endowment Model of Investing” in the a� ermath of the crisis. Mandatory annual disbursement requirements also pose a challenge for investments that do not provide consistent and predictable cash � ows.
Despite these limitations, it is our view that endowments and other charitable organizations will expand their holdings of alternative invest-ments, such as hedge funds, private equity, com-modities and real estate, in the decade ahead. While annual disbursements and short-term liquidity requirements still have to be managed, these funds also need to achieve more consis-tent and balanced long-term growth. Alternative investments may o� er a means for protecting fund assets against the impact of extreme events through greater diversi� cation. Moreover, with bond yields still hovering near generational lows, bonds are likely to generate substandard returns in the decade ahead as monetary policy is nor-malized, in� ation re-emerges, private capital demands recover and government debt burdens remain high (see page 68 for a more detailed dis-cussion of our outlook on bonds). This suggests that endowments will need to continue moving beyond traditional asset allocation approaches to meet their investment goals.
Making an impactIn our view, people will increasingly judge philan-thropic e� orts by the results they achieve. Large donors demand greater accountability, while smaller donors are able to use social networks to pool resources and raise awareness. Socially responsible investing is broadening as an accepted
Philanthropy
Leading the charge
Experts on philanthropy are seeing a shi� in the guidance and expectations of these charitable e� orts. The current examples of philanthropic leadership, in our opinion, may facilitate more change in the next 10 years than in the decade before. Today’s philanthropists are adamant about creating more with what they have been given and displaying their results. The desire to illustrate the changes may be from the in� uence of today’s donors, who are results driven.
How foundations and individuals approach philanthropy is evolving, according to Sharon Schneider of Foundation Source, into a holistic philosophy or an “Integrated Life.” She states, “Instead of treating philanthropy as a holiday check writing exercise divorced from the rest of our lives, we are striving to integrate personal passions, professional expertise, consumer habits, vacation time and even household buying decisions into a single identity that expresses a consistent set of values.”
The FEED Foundation’s Nicole Sexton believes that organiza-tions should be readily accountable and transparent to their donors. The Internet provides e� ective ways to illustrate results. Bishop says technology allows the “voice of the recipi-ents” to be heard. Both Sexton and Bishop notice younger generations are leading the demand for organizations to show and track their results. “Giving is not enough, people want impact,” comments Matthew Bishop.
Re� ecting on the next decade, Robin Ganzert, CEO of the American Humane Association, recognizes the seismic shi� occurring in the world of philanthropy and charitable giving. She notices a stark di� erence between today’s philanthropists and those of the last 10 years – “a new set of energized phi-lanthropists are emerging who are speaking about change in real terms, asking for measurable impact and creating real economic value from their e� orts.”

82 February 2011 The Decade Ahead
11 “Koret Task Force on K–12 Education,” Hoover Institution, 2011. Web. <http://www.hoover.org/taskforces/education>.
12 Chester E Finn Jr, “A Sputnik Moment for U.S. Education,” The Wall Street Journal, New York, December 8 2010. Print.
13 “Red Tape Rising,” The Economist January 20 2011. Web.
14 US Congressional Budget Of� ce, The Budget and Economic Outlook: Fiscal Years 2011 to 2021, Vol. 4236, Washington DC, January 2011. Print.
15 Daniel Fisher, “Capital Crunch,” Forbes.com, Forbes Magazine, January 26, 2011. Web.
16 US National Commission on Fiscal Responsibility and Reform, The Moment of Truth, Washington: White House, 2010. Print.
China1 Elizabeth C Economy, “The Game Changer.” Foreign A� airs (November/December 2010). Web.
2 Deborah Brautigam, “Africa’s Eastern Promise: What the West Can Learn From Chinese Investment in Africa,” Foreign A� airs, January 2010. Web.
3 Robert S Ross, “China’s Naval Nationalism: Sources, Prospects, and the U. S. Response,” International Security 34.2 (Fall 2009): 46-81. Print.
4 David Leonhardt, “The Real Problem With China,” New York Times, January 11, 2011.
5 James McGregor, China’s Drive for ‘Indigenous Innovation’, Washington DC: U.S. Chamber of Commerce, 2010.
6 George J Gilboy and Eric Heginbotham, “China’s Dilemma: Social Change and Political Reform,” Foreign A� airs, October 14 2010. Web.
7 Patrick Douglass, “Income Inequality and Fiscal Policy Reform in China,” SAIS Review 29.1 (Winter-Spring 2009): 129-39.
8 Sudeep Reddy, “Bernanke: China ‘Risking In� ation’ With Currency Policy” Wall Street Journal, December 6, 2010.
Intro1 Matt Ridley, The Rational Optimist: How Prosperity Evolves, New York, Harper, 2010. Print.
United States1 Programme for International Student Assessment (PISA) rankings within OECD, December 2010.
2 George Friedman, The Next 100 Years: A Forecast for the 21st Century, New York, Doubleday, 2009. Print.
3 Saunders and Otley, First noted in: Tocqueville, Alexis De, Democracy in America, London, 1835. Print.
4 Jonathan Eaton and Samuel Kortum, “National Security in a Knowledge-Based Global Economy,” Perspectives on U.S. Competitiveness in Science and Technology. Washington D.C., RAND Corporation, 2007. 53-73. Print.
5 Richard B. Freeman, America Works: The Exceptional U.S. Labor Market, New York, Russell Sage Foundation, 2007. Print.
6 Committee on a New Government-University Partnership for Science and Security, National Research Council, Science and Security in a Post 9/11 World: A Report Based on Regional Discussions Between the Science and Security Communities, Washington, D.C., National Academies, 2007. Print.
7 Zoltán J Acs and László Szerb, The Global Entrepreneurship and Development Index (GEDI), Imperial College London Business School, June 18 2010. Web.
8 Art Carden, and Joshua Hall, “Why Are Some Places Rich While Others Are Poor? The Institutional Necessity of Economic Freedom,” Social Science Research Network Economic Growth eJournal, July 2009. Web.
9 “Index of Economic Freedom,” The Heritage Foundation, 2011. Web. <http://www.heritage.org/index/ranking>.
10 George Magnus, Uprising: Will Emerging Markets Shape or Shake the World Economy? Chichester, Wiley, 2011. Print.
Endnotes

The Decade Ahead February 2011 83
Technology1 Hearing on Securing Critical Infrastructure in the Age of Stuxnet, Before the United States Senate Committee on Homeland Security and Governmental A� airs, pp. 4 (2010) (testimony of Dean Turner). Print.
2 United States, Cong. US EMP Commission. “Report of the Commission to Assess the Threat to the United States from Electromagnetic Pulse (EMP) Attack: Critical National Infrastructures,” Volume 1: Executive Report, Washington, D.C., 2004. Print.
3 Jack Spencer, “America’s Vulnerability to a Di� erent Nuclear Threat: An Electromagnetic Pulse,” Heritage Foundation, Backgrounder #1372, May 26, 2000.
Healthcare1 Center for Medicare & Medicaid Services, “National Health Expenditures Database.” <https://www.cms.gov/NationalHealthExpendData/downloads/proj2009.pdf>
2 Organization for Economic Cooperation and Development. <http://www.oecd.org>
3 Jon Shreve, “The Economic Measurement of Medical Errors,” Society of Actuaries, June 2010. <http://www.soa.org/� les/pdf/research-econ-mea-surement.pdf>
4 Association of American Medical Colleges, “Physician Shortages to Worsen Without Increases in Residency Training,” September 30, 2010.
5 Congressional Budget Of� ce, “An Analysis of Health Insurance Premiums Under the Patient Protection and A� ordable Care Act,” November 30, 2009.
6 Association of American Medical Colleges, “Physician Shortages to Worsen Without Increases in Residency Training,” September 30, 2010.
Stocks1 George Santayana, ”The Life of Reason; Or, The Phases of Human Progress,” Vol. 1. New York, C. Scribner’s Sons, 1905. Print.
2 R. Shiller, (2011), Updated data set from Market Volatility (1989), Cambridge: MIT Press, Retrieved March 3, 2009. <http://www.econ.yale.edu/~shiller/data.htm>
Geopolitics1 UBS, Geopolitics: the blind side, Zurich: UBS Wealth Management, 2010.
2 Emmanuel Saez and Thomas Piketty, “Striking It Richer,” Pathways Magazine, Stanford Center for the Study of Poverty and Inequality, August 5, 2009. <elsa.berkeley.edu/~saez/saez-UStopin-comes-2007.pdf>.
3 SIPRI Military Expenditure Database, “Stockholm International Peace Research Institute Yearbook 2010,” 2010. <http://www.sipri.org/research/armaments/milex/resultoutput>
4 Elroy Dimson, Paul Marsh, and Mike Staunton, Credit Suisse Global Investment Returns Sourcebook 2010, Zurich: Credit Suisse Research Institute, 2010.
Emerging markets1 George Magnus, Uprising: Will Emerging Markets Shape or Shake the World Economy?, Chichester, West Sussex, U.K., Wiley, 2011. Print.
Emerging consumers1 UBS WMR estimates based on Alan Heston, Robert Summers and Bettina Aten, Penn World Table Version 6.3, Center for International Comparisons of Production, Income and Prices at the University of Pennsylvania, August 2009.
2 United Nations Population Division, 2011. <http://www.un.org/popin/data.html>
3 PricewaterhouseCoopers LLP. “UK Economics Outlook,” November 2010. <http://www.pwcwe-bcast.co.uk/ukeo_nov2010_complete.pdf>
Energy1 Myra P Saefong, “Natural Gas: The Commodity World’s ‘Ugly Duckling,’” MarketWatch, 28 Jan. 2011.
2 Donald Marron, “Revisiting Oil and Natural Gas Prices,” CSMonitor.com, The Christian Science Monitor, April 12, 2010.
3 Brian Baskin, “Commodities: China’s Oil Demand Is Poised to Push Up Prices,” WSJ.com, The Wall Street Journal, November 8, 2011.
4 Jonathan Fahey, “The Search for Cheaper, Lighter Car Batteries,” Forbes.com, Forbes Magazine, June 6, 2010.
5 Eric Reguly, “IEA Sees End to Natural Gas Glut,” The Globe and Mail, November 9, 2010.
Endnotes

84 February 2011 The Decade Ahead
Endnotes
7 National Philanthropic Trust, History of Philanthropy, National Philanthropic Trust, 2007. <http://www.npt.org/philanthropy/history_philan-thropy.asp>
8 “A special report on global leaders: The few,” The Economist, January 22, 2011.
9 Matthew Bishop, “UBS Wealth Management Decade Ahead – Philanthropy,” Telephone inter-view, January 21, 2011. The Economist
10 Insight at Community Ventures & The Initiative For Responsible Investment, Harvard University, January 2011. <http://www.thegiin.org/cgi-bin/iowa/resources/research/173.html>
11 Wayne Farmer, “UBS Wealth Management Decade Ahead – Philanthropy,” Telephone inter-view, January 19, 2011. Arabella Advisors
12 Solutions for Impact Investors: From Strategy to Implementation, The Rockefeller Philanthropy Advisors, 2009.
13 PBS Online, “People & Events: Andrew Carnegie,” 1999. <http://www.pbs.org/wgbh/amex/carnegie/peopleevents/pande01.html>
14 “Bill and Melinda Gates Pledge USD 10 Billion in Call for Decade of Vaccines,” January 29, 2010. <http://www.gatesfoundation.org/press-releases/Pages/decade-of-vaccines-wec-announce-ment-100129.aspx >
15 P&G Children’s Safe Drinking Water Program, Proctor & Gamble, 2011. <http://www.pg.com/en_US/sustainability/social_responsibility/childrens_safe_water.shtml>
16 “Educational Endowments and the Financial Crisis: Social Costs and the Systemic Risk in the Shadow Banking System,” Tellus Institute, Center for Social Philanthropy, May 27, 2007.
Bonds1 Mehmet Caner, Thomas Grennes, and Fritzi Koehler-Geib, “Finding the Tipping Point When Sovereign Debt Turns Bad” Washington, D.C., World Bank Paper No 5391, 2010. Print.
2 Carmen M Reinhart and Kenneth Rogo� . “Growth in a Time of Debt.” London: Centre for Economic Policy Research, NBER Working Paper No 15639, 2010. Print.
3 United States, “A CBO Study: Federal Debt and Interest Costs,” The Congress of the United States, Congressional Budget Of� ce, December 2010.
4 Francis E. Warnock and Veronica Cacdac Warnock, “International Capital Flows and U.S. Interest Rates,” National Bureau of Economic Research Working Paper Series, 2006. <http://www.nber.org/papers/w12560.pdf>
5 Barry Eichengreen and Marc Flandreau, “The Rise and Fall of the Dollar, or When Did the Dollar Replace Sterling as the Leading International Currency?” National Bureau of Economic Research Working Paper Series, No. 14154, 2008. <http://www.nber.org/papers/w14154.pdf>
Philanthropy 1 Nikola Krastev, “Forbes Rich List: Number of New Billionaires Re� ect Global Recovery,” Forbes Magazine, March 11, 2010.
2 John J. Havens and Paul G. Schervish, “Wealth Transfer and Philanthropy,” Interview by Investment & Wealth Monitor, Investment & Wealth Monitor Sept.-Oct. 2009: pp. 6-8. Print.
3 The State of Food Insecurity in the World 2006, Food and Agriculture Organization of the United Nations and FAOSAT, 2007. <www.wfp.org/hunger>
4 UNSECO, “UN World Water Redevelopment Report: Water in a Changing World,” UNSECO Publishing, London, 2009. <http://www.unesco.org/water/wwap/facts_� gures/basic_needs.shtml>
5 UNAIDS, “AIDS Scorecards: Overview: UNAIDS report on the Global AIDS Epidemic,” November 2010.
6 Giving USA Foundation, Giving USA 2010: The Annual Report on Philanthropy for the Year 2009, research and written by The Center on Philanthropy at Indiana University, 2010.

Section upper right
The Decade Ahead February 2011 85
Acknowledgements
About this publication. The authors of this report extend their appreciation to the people and organizations below for the insight that they provided:
Jonathan Anderson, Economist, UBS Invesestment ResearchMark Moller Andersen, Strategist, Wealth Management Research, UBS AGRonald J. Barone, Analyst, UBS Investment ResearchMatthew Bishop, The EconomistAndrew Cates, Economist, UBS Investment ResearchThomas J. Decker, GE HealthcareJennifer Delaney, Strategist, UBS Investment ResearchRajiv Dewan, William E. Simon Graduate School of Business, University of RochesterJulien Dumoulin-Smith, Analyst, UBS Investment ResearchThomas Doer� inger, Strategist, UBS Investment ResearchPaul Donovan, Economist, UBS Investment ResearchWayne Farmer, Arabella Philanthropic AdvisorsWilliam Featherston, Analyst, UBS Investment ResearchRobin Ganzert, American Humane AssociationMatthew Garrison, Product & Communications Strategist, UBS Financial Services Inc.Maury N. Harris, Economist, UBS Investment ResearchLarry Hatheway, Economist, UBS Investment ResearchAndreas Hoefert, Chief Economist, Wealth Management Research, UBS AGErika Karp, Head of Global Sector Research, UBS Investment ResearchGeorge Magnus, Senior Economic Advisor, UBS Investment ResearchKatherine Morin, Business Analyst, UBS Financial Services Inc.Yonghao Pu, Strategist, Wealth Management Research, UBS AGTony Roth, Head of Wealth Management Strategies, UBS Financial Services Inc. Anita Sands, Chief Operating Of� cer, UBS Financial Services Inc.Sharon Schneider, Foundation SourceNicholas Smithie, Strategist, UBS Investment ResearchArt Stevens, Calvert FoundationWilliam Sutton, Head of Philanthropic Services -- US, UBS Financial Services Inc.Nikos Theodosopoulos, Analyst, UBS Investment ResearchConstantin Vayenas, Analyst, Wealth Management Research, UBS AGCesare Valeggia, Analyst, Wealth Management Research, UBS AGDouglas Wilde, Senior Wealth Management Portfolio Analyst, UBS Financial Services Inc.Wisconsin Energy Research ConsortiumMark Zupan, William E. Simon Graduate School of Business, University of Rochester
UBS Investment Research is part of UBS Investment Bank (the UBS business group that includes, among others, UBS Securities LLC).
The Decade Ahead February 2011 85

86 February 2011 The Decade Ahead
Disclaimer
Wealth Management Research is published by Wealth Management & Swiss Bank and Wealth Management Americas, Business Divisions of UBS AG (UBS) or an af� liate thereof.
In certain countries UBS AG is referred to as UBS SA. This publication is for your information only and is not intended as an o� er, or a solicitation of an o� er, to buy or sell any
investment or other speci� c product. The analysis contained herein is based on numerous assumptions. Di� erent assumptions could result in materially di� erent results. Certain
services and products are subject to legal restrictions and cannot be o� ered worldwide on an unrestricted basis and/or may not be eligible for sale to all investors. All information
and opinions expressed in this document were obtained from sources believed to be reliable and in good faith, but no representation or warranty, express or implied, is made as
to its accuracy or completeness (other than disclosures relating to UBS and its af� liates). All information and opinions as well as any prices indicated are currently only as of the
date of this report, and are subject to change without notice. Opinions expressed herein may di� er or be contrary to those expressed by other business areas or divisions of UBS
as a result of using di� erent assumptions and/or criteria. At any time UBS AG and other companies in the UBS group (or employees thereof) may have a long or short position,
or deal as principal or agent, in relevant securities or provide advisory or other services to the issuer of relevant securities or to a company connected with an issuer. Some invest-
ments may not be readily realisable since the market in the securities is illiquid and therefore valuing the investment and identifying the risk to which you are exposed may be
dif� cult to quantify. UBS relies on information barriers to control the � ow of information contained in one or more areas within UBS, into other areas, units, divisions or af� liates
of UBS. Futures and options trading is considered risky. Past performance of an investment is no guarantee for its future performance. Some investments may be subject to sud-
den and large falls in value and on realisation you may receive back less than you invested or may be required to pay more. Changes in FX rates may have an adverse e� ect on
the price, value or income of an investment. We are of necessity unable to take into account the particular investment objectives, � nancial situation and needs of our individual
clients and we would recommend that you take � nancial and/or tax advice as to the implications (including tax) of investing in any of the products mentioned herein. This docu-
ment may not be reproduced or copies circulated without prior authority of UBS or a subsidiary of UBS. UBS expressly prohibits the distribution and transfer of this document to
third parties for any reason. UBS will not be liable for any claims or lawsuits from any third parties arising from the use or distribution of this document. This report is for distribu-
tion only under such circumstances as may be permitted by applicable law.
• Australia: Distributed by UBS Wealth Management Australia Ltd (Holder of Australian Financial Services License No. 231127), Chi� ey Tower, 2 Chi� ey Square, Sydney, New
South Wales, NSW 2000. Bahamas: This publication is distributed to private clients of UBS (Bahamas) Ltd and is not intended for distribution to persons designated as a
Bahamian citizen or resident under the Bahamas Exchange Control Regulations. Canada: In Canada, this publication is distributed to clients of UBS Wealth Management
Canada by UBS Investment Management Canada Inc.. Dubai: Research is issued by UBS AG Dubai Branch within the DIFC, is intended for professional clients only and is
not for onward distribution within the United Arab Emirates. France: This publication is distributed by UBS (France) S.A., French “société anonyme” with share capital of
€ 125.726.944, 69, boulevard Haussmann F-75008 Paris, R.C.S. Paris B 421 255 670, to its clients and prospects. UBS (France) S.A. is a provider of investment services duly
authorized according to the terms of the “Code Monétaire et Financier,” regulated by French banking and � nancial authorities as the “Banque de France” and the “Autorité
des Marchés Financiers.” Germany: The issuer under German Law is UBS Deutschland AG, Stephanstrasse 14-16, 60313 Frankfurt am Main. UBS Deutschland AG is autho-
rized and regulated by the “Bundesanstalt für Finanzdienstleistungsaufsicht.“ Hong Kong: This publication is distributed to clients of UBS AG Hong Kong Branch by UBS
AG Hong Kong Branch, a licensed bank under the Hong Kong Banking Ordinance and a registered institution under the Securities and Futures Ordinance. Indonesia: This
research or publication is not intended and not prepared for purposes of public o� ering of securities under the Indonesian Capital Market Law and its implementing regula-
tions. Securities mentioned in this material have not been, and will not be, registered under the Indonesian Capital Market Law and regulations. Italy: This publication is
distributed to the clients of UBS (Italia) S.p.A., via del vecchio politecnico 3 - Milano, an Italian bank duly authorized by Bank of Italy to the provision of � nancial services and
supervised by “Consob” and Bank of Italy. Jersey: UBS AG, Jersey Branch is regulated by the Jersey Financial Services Commission to carry on investment business and trust
company business under the Financial Services (Jersey) Law 1998 (as amended) and to carry on banking business under the Banking Business (Jersey) Law 1991 (as amended).
Luxembourg/Austria: This publication is not intended to constitute a public o� er under Luxembourg/Austrian law, but might be made available for information purposes
to clients of UBS (Luxembourg) S.A./UBS (Luxembourg) S.A. Niederlassung Österreich, a regulated bank under the supervision of the “Commission de Surveillance du Secteur
Financier” (CSSF), to which this publication has not been submitted for approval. Singapore: Please contact UBS AG Singapore branch, an exempt � nancial adviser under
the Singapore Financial Advisers Act (Cap. 110) and a wholesale bank licensed under the Singapore Banking Act (Cap. 19) regulated by the Monetary Authority of Singapore,
in respect of any matters arising from, or in connection with, the analysis or report. Spain: This publication is distributed to clients of UBS Bank, S.A. by UBS Bank, S.A., a
bank registered with the Bank of Spain. UAE: This research report is not intended to constitute an o� er, sale or delivery of shares or other securities under the laws of the
United Arab Emirates (UAE). The contents of this report have not been and will not be approved by any authority in the United Arab Emirates including the UAE Central Bank
or Dubai Financial Authorities, the Emirates Securities and Commodities Authority, the Dubai Financial Market, the Abu Dhabi Securities market or any other UAE exchange.
UK: Approved by UBS AG, authorised and regulated in the UK by the Financial Services Authority. A member of the London Stock Exchange. This publication is distributed to
private clients of UBS London in the UK. Where products or services are provided from outside the UK they will not be covered by the UK regulatory regime or the Financial
Services Compensation Scheme. USA: Distributed to US persons by UBS Financial Services Inc., a subsidiary of UBS AG. UBS Securities LLC is a subsidiary of UBS AG and an
af� liate of UBS Financial Services Inc. UBS Financial Services Inc. accepts responsibility for the content of a report prepared by a non-US af� liate when it distributes reports to
US persons. All transactions by a US person in the securities mentioned in this report should be e� ected through a US-registered broker dealer af� liated with UBS, and not
through a non-US af� liate.
©UBS 2011. The key symbol and UBS are among the registered and unregistered trademarks of UBS. All rights reserved.

The Decade Ahead February 2011 87

88 2011 Outlook
ab
©2011 UBS Financial Services Inc. All rights reserved. Member SIPC.
All other trademarks, registered trademarks, service marks
and registered service marks are of their respective companies.
UBS Financial Services Inc.
www.ubs.com/� nancialservicesinc
UBS Financial Services Inc. is a subsidiary of UBS AG.
101202-2625
Order # X3077