the data deluge: opportunities for research in …edm.usu.edu/publications/data_deluge.pdf1 the data...
TRANSCRIPT

1
The Data Deluge: Opportunities for Research in Educational Digital Libraries
Beijie Xu
Mimi Recker Department of Instructional Technology & Learning Sciences
Utah State University 2830 Old Main Hill
Logan UT, 84322-2830, U.S.A. [email protected]
Sherry Hsi
The Exploratorium San Francisco, CA
Chapter submitted to Digital Libraries: Web Development, Software Technologies and Data Management
September 2009
Abstract
Increasingly, educational digital libraries and associated services that support
both formal and informal learning are available on the Web. As these collections are web-based, they can be engineered to capture fine-grained web usage data. However, because of their voluminous and detailed nature, rigorous analytical and interpretation strategies remain challenging. In response, webmetrics refers to the process of measuring, collecting, analyzing, and reporting web usage data. This chapter discusses the utility of webmetrics as a research method, and illustrates approaches for engineering and collecting web usage data in two digital library environments, the Instructional Architect and the Exploratorium’s Learning Resources Collection. The chapter describes how using a set of common webmetrics such as visits, page views, and geographical location can help better understand the behaviors of end users. We also describe the application of educational data mining (EDM) to help discover meaningful patterns in usage data. Results include analyses from a pilot study that applies a clustering technique to teacher usage data from the Instructional Architect. The chapter concludes with a discussion of some of the current limitations and future possibilities of using web metrics to analyze and evaluate use and impact of educational digital libraries.

2
Introduction
Increasingly, educational digital libraries and associated services that support both formal and informal learning are available on the Web. The purpose of these sites is to provide teacher and learner access to high-quality learning resources in order to help improve both the effectiveness and efficiency of education (McArthur & Zia, 2008). In the U.S., the National Science Digital Library (NSDL.org) is a prominent example. This educational digital library offers a comprehensive collection of over 2.5 million high-quality, catalogued educational content and services to learners, educators, and academic policy makers (McArthur & Zia, 2008). The Exploratorium’s Learning Resource Collection (nsdl.exploratorium.edu) is another example digital library and a focus of this chapter. It offers access to over 700 teacher-tested science activities and instructional resources inspired and created from the Exploratorium’s exhibits, public program events, and teacher professional development programs.
As these collections are web-based, they can be engineered to capture fine-
grained web usage data. The resulting massive and longitudinal datasets potentially contain important evidence about teacher and learner behaviors in complex online information ecologies (Computing Research Association, 2005; Borgman et al., 2008). However, because of their voluminous and detailed nature, rigorous analytical and interpretation strategies remain challenging. This challenge is sometimes referred to the ‘data deluge’ problem (Hey & Trefethen, 2003).
In response, webmetrics refers to the process of measuring, collecting,
analyzing, and reporting web traffic through a web site (Chan, 2008; Khoo et al., 2008). In tandem, the field of educational data mining (EDM) offers methods for mining and discovering patterns in data automatically captured by educational tools (Muehlenbrock, 2005; Nickles, 2005; Romero & Ventura, 2007). These approaches typically do not assume conventional models or employ traditional statistical methods; instead they rely upon computational power to help reveal and visualize emerging patterns.
Engaging in rigorous and ongoing webmetrics research is a key component
of a comprehensive evaluation strategy of digital library environments. First, as a baseline, it helps provide usage data, and thus another means for understanding teacher/learner activities that are increasingly happening outside of formal school hours. Second, it can help determine if the site is meeting end user needs. For example, are teachers/learners using the site as intended? Why or why not? Third, identifying unexpected usage can help designers learn from users, and identify new avenues for growth. Finally, the data provide fertile ground for applying emerging analytical techniques to complex educational data.
This chapter describes approaches for engineering educational digital
libraries and services to capture, analyze, and mine web usage data. In doing so, we first review key webmetrics that are applicable to the study of web usage activity.

3
We next present strategies for describing these large datasets. We then discuss an application of an emerging field of study, educational data mining, to help discover meaningful patterns in usage data.
To ground the discussion, we demonstrate the utility of these methods in the
context of two digital library environments, the Instructional Architect (IA), and the Exploratorium’s Learning Resources Collection (ELRC). We conclude with a discussion of important limitations when working with these kinds of datasets.
Description of Two Educational Digital Library Environments
The Instructional Architect
The Instructional Architect (IA) is an educational digital library service
developed to support the instructional use of the National Science Digital Library (NSDL) and other online learning resources. With the IA, teachers are able to search, select, sequence, annotate and reuse online learning resources to create instructional web pages, called IA projects. IA breaks down the technology barriers and allows teachers with basic computer skills to create online projects and efficiently address their instructional needs (Recker et al., 2007).
Audience
The Instructional Architect targets two main audiences: teachers and their students. A teacher can create a free account, which provides exclusive access to his/her saved resources and projects. As part of the registration procedure, the teacher completes a profile indicating subjects and grades taught, teaching experience, and level of information literacy.
System Description
After a teacher logs into the system, the IA offers two major usage modes: resources management and project management. In the resources management mode, teachers can search for and store links to NSDL resources within the IA context (see Figure 1), as well as provide a name and add non-NSDL resource links to their own collection too. In addition to an individual default resource folder, a user can create and name more folders for organizing saved resources.
The project management mode allows teachers to create an IA project web
page and share it with the public or only with their own students. The teacher’s resource collections are listed on the left, and can be added to the project with a single click (see Figure 2). JavaScript and HTML code is allowed, which means dynamic objects such as multimedia, blogs, and RSS can be included. Teachers can add basic project metadata such as subject area, grade level, and core curriculum standard, and these metadata are used to support project search and browse. A registered teacher can create a generic student account that is shared by all his/her students. With such an account, students have exclusive access to their teachers’ private projects that are marked as “student-view only”.

4
Web Usage
From 2002 to June 2009, over 4,100 users have registered in Instructional Architect, more than 8,500 IA projects have been created, and 38,000 online resources have been added to the IA database. Since August 2006, IA public projects have been viewed over 560,000 times (see also Table 2).
The Exploratorium Learning Resources Collection
The Exploratorium Learning Resources Collection (ELRC)
(nsdl.exploratorium.edu) is a digital library of over 700 teacher-tested science activities and instructional resources inspired and created from the Exploratorium1’s exhibits, public program events, and teacher professional development programs.
The ELRC is designed for elementary and secondary school teachers as a
primary audience, and informal educators as a secondary audience. Teachers can browse the collection by topic or conduct keyword searches. Search results provide a short description of the item, as well as related topics to explore (Figure 3). For each resource item found, a resource record is provided that includes a description of the resource as well as teaching tips where appropriate. Advanced search enables teachers to narrow a search by curricular area, grade level, and specific resource type (i.e., image, video, activity, article, web interactive, web exhibition, museum exhibit, and professional development resource.) The ELRC is available to use from the Web and no registration is required to use the application. Through interoperability, the ELRC items can be also found in other educational libraries including the National Science Digital Library (nsdl.org). Web Usage
In 2008, the digital library ELRC was accessed by over 35,500 unique visitors. Since its launch in 2005, visitors from all 50 States across North America and over 170 countries have accessed the collection. The most frequently accessed resources include the website page from “Faultline” which explains the differences between P- and S waves, and a hands-on electric circuit activity called “Jitterbug.”
Webmetrics Data Sources More than a dozen commercial and open source Web Analytics tools are
currently available. One approach, called page-tagging, uses third-party services that capture web traffic by embedding Javascript into web pages. Popular examples include Google Analytics (analytics.google.com) and Omniture (www.omniture.com).
1 The Exploratorium is a hands-on museum of science, art, and human perception located in San Francisco,
California.

5
Another approach relies on analyzing log files that are automatically generated by web servers. Examples include Summary (summary.net) and AWStats (awstats.sourceforge.net). For dynamically generated sites, such as the IA and the ELRC, a third approach relies on engineering the back-end database to record fine-grained user transactions for later analysis. Together, these tools can capture a complex array of data (see Table 1 for examples).
Table 1 Common webmetrics
Metric Definition
Visits
Sequence of user transactions from a single IP within a certain time period (considered a more robust measure than ‘hits’)
Unique visitors A measure of a site’s true audience size Page views Number of times web pages are accessed during a single visit,
including repeated viewing of the same page Visitor origin Country or region of visitor origin Operating Sys/ Browsers
Operating system and browser used by visitors
Session length Time spent by visitor during each single visit Entry/Exit Pages First and last pages accessed by visitors Referrer Last page the user visits before landing on the site Bounce rate The percentage of visitors who "bounce" away to a different
site from the entrance page Search keywords The search terms that visitors enter into a search engine
The IA has been collecting web server logs since 2002, and engineered to collect data with Google Analytics (GA) since early 2006. As a dynamic site, its database captures many low-level actions on a per-user basis. Finally, registration profiles are also collected when teachers create their free IA accounts. This includes grade level, subjects taught, teaching experience, and information literacy skills.
The Exploratorium’s main website has been collecting basic webmetrics data
since 1995 using the commercial tool Summary (Semper et al., 2000), and with Google Analytics since 2007. The ELRC collects several sources of data that include web traffic from GA, server log files, search terms, and a short online user survey. Because the Exploratorium was interested in broader impact, an embedded evaluation tool was also created to request zip codes of users who both lived in the U.S. and visited the site, providing evidence of use by people from other country.
Currently, there is little standardization across Webmetrics tools in defining
and tracking user visits (Google Analytics Report, 2009). As such, caution must be taken when comparing them. For example, Figure 4 plots page views as reported by GA and the IA database over a 15-month period. Note that while the results can differ by as much as 12%, the correlation is very high (r=.98).
6
Webmetrics Description Working with large web usage datasets provides many challenges. This
section describes two important considerations: data aggregation and tracking growth.
Data Aggregation and Presentation
Data aggregation and presentation strategies involve analyzing important
metrics for a particular learning context on a regular basis. These strategies help address questions about users, their behaviors, their location, and the content they are accessing.
Users
First, it is important to note that most web usage datasets show an underlying zipf (or long-tail) distribution (Recker & Pitkow, 1996). Thus, a first step in examining data is to plot users against some activity measure (for example, number of logins). Figure 5 shows a plot of the number of users against the number of IA projects created. It displays the characteristic long-tail distribution, except in the middle. Noting such distributions means that some statistical measures (e.g., means, standard deviation) and tests (t-test) should be used with caution because the dataset might not meet underlying assumptions.
Google Analytics can also be a powerful tool in addressing questions about
users, in that it can quickly report a variety of aggregated usage data over different time periods. For example, Figure 6 shows visits to the IA and ELRC over a 12-month period. Note that while both graphs show holiday ebbs, the IA’s shows a dramatic drop-off during the summer reflecting its school-based usage.
In contrast, the ELRC aims to understand how many visitors were educators,
and how many educators were first time users or loyal users of the web resource. By aggregating data and sorting data by IP addresses, and making an assumption based on .edu are educational users from schools and universities, one can infer what proportion of visitors are from educational institutions and therefore educators. The temporal pattern of higher traffic during the school year is also an indicator that formal educators are using the resource.
When analyzing the two sites’ traffic source over a similar time period, the IA
shows a much higher percentage of direct traffic than ELRC (57.45% vs. 27.39%), and lower bounce rate (33.93% vs. 54.89%). This suggests that more ELRC users are discovering the site, while the IA has more repeated users and purposeful usage.
Finally, analyzing length of session reveals interesting differences in patterns
between the two sites. As an authoring site, 15.9% of IA sessions last more than 10 minutes. In contrast for the ELRC, a more ‘shop-and-go’ site, 6.9% of sessions last more than 10 minutes.

7
Location
Webmetrics can help determine the geographical location of site visitors, called geo-segmentation. Figure 7a&b shows visits to the IA and ELRC, respectively, over a 6-month period in the US. Darker shades indicate more visits. Given that the IA is based in Utah and has outreach activities in New York and Michigan, while the ELRC is California-based, the maps show that both groups are successful in local dissemination activities. The ELRC also shows more widespread U.S. visitors.
These maps can also be overlayed with other publically available geographical datasets, for example from the U.S. Census (factfinder.census.gov) and the National Center for Education Statistics (nces.ed.gov). These maps may reveal relationships between site usage and demographic or school characteristics.
Figures2 8a&b and 9a&b show IA and ELRC visitor traffic overlayed on two
selected datasets (number of schools per district and median family income), as they most appeared to display a relationship with visitor traffic. The relationship with number of schools suggests that visitors are frequently school audiences. The relationship with family income level may be a function of resources (i.e., computing) available in the local schools and communities.
Content
An examination of popular content accessed on sites can reveal insights about users’ intent. In terms the IA, 26% of the use represents user accesses to teacher-created IA projects. GA also shows that the ratio of student login paths to teacher login paths was nearly constant, at about 4:1. This suggests the site is used as intended: teachers create IA projects for their students to use.
For the ELRC, the top page is the search results page, which occurs four times as often as the browse page (the second highest page). One can infer that educators have a task in mind and are looking for specific resources rather than browsing the collection. Tracking Site Growth
Tracking site growth addresses questions such as identifying usage growth,
and how it compares to other sites. Here, it is important to avoid comparing raw visit counts, as sites are very different in their purposes and penetration, and may be at different phases of maturity. Instead, percentage growth for particular time periods can be more insightful. For example, Table 2 shows growth rate in IA usage in various categories. It shows the largest growth in the number of project views.
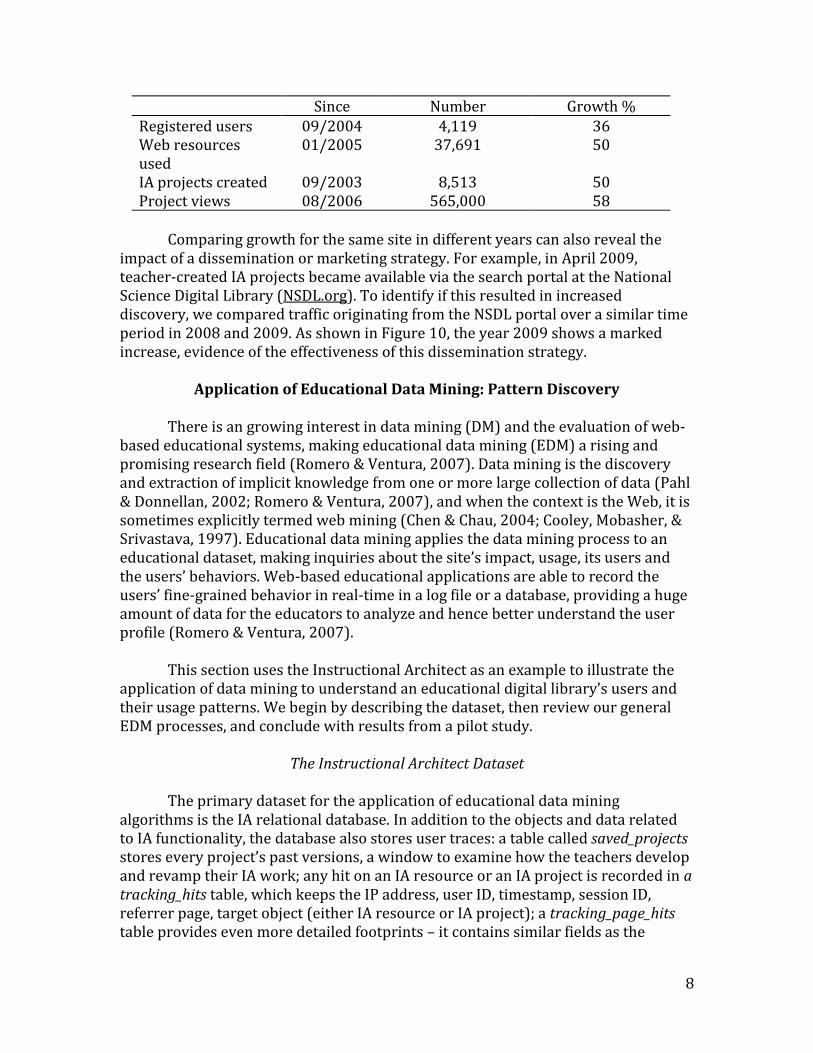
Table 2 Usage data growth (to June 2009)
2 For space reasons, only the continental 48 states are shown.
8
Since Number Growth % Registered users 09/2004 4,119 36 Web resources used
01/2005 37,691 50
IA projects created 09/2003 8,513 50 Project views 08/2006 565,000 58
Comparing growth for the same site in different years can also reveal the
impact of a dissemination or marketing strategy. For example, in April 2009, teacher-created IA projects became available via the search portal at the National Science Digital Library (NSDL.org). To identify if this resulted in increased discovery, we compared traffic originating from the NSDL portal over a similar time period in 2008 and 2009. As shown in Figure 10, the year 2009 shows a marked increase, evidence of the effectiveness of this dissemination strategy.
Application of Educational Data Mining: Pattern Discovery
There is an growing interest in data mining (DM) and the evaluation of web-
based educational systems, making educational data mining (EDM) a rising and promising research field (Romero & Ventura, 2007). Data mining is the discovery and extraction of implicit knowledge from one or more large collection of data (Pahl & Donnellan, 2002; Romero & Ventura, 2007), and when the context is the Web, it is sometimes explicitly termed web mining (Chen & Chau, 2004; Cooley, Mobasher, & Srivastava, 1997). Educational data mining applies the data mining process to an educational dataset, making inquiries about the site’s impact, usage, its users and the users’ behaviors. Web-based educational applications are able to record the users’ fine-grained behavior in real-time in a log file or a database, providing a huge amount of data for the educators to analyze and hence better understand the user profile (Romero & Ventura, 2007).
This section uses the Instructional Architect as an example to illustrate the
application of data mining to understand an educational digital library’s users and their usage patterns. We begin by describing the dataset, then review our general EDM processes, and conclude with results from a pilot study.
The Instructional Architect Dataset
The primary dataset for the application of educational data mining
algorithms is the IA relational database. In addition to the objects and data related to IA functionality, the database also stores user traces: a table called saved_projects stores every project’s past versions, a window to examine how the teachers develop and revamp their IA work; any hit on an IA resource or an IA project is recorded in a tracking_hits table, which keeps the IP address, user ID, timestamp, session ID, referrer page, target object (either IA resource or IA project); a tracking_page_hits table provides even more detailed footprints – it contains similar fields as the

9
tracking_hits table, and in addition to requests to IA resources and projects, it records almost every URL (a PHP page or link to an external resource) users have clicked.
Knowledge Discovery in Database
Educational data mining by and large follows the standard Knowledge Discovery and Data Mining (KDD) process: 1) data cleaning and integration, selection and transformation, 2) applying data mining algorithms, 3) evaluation and presentation (Han & Kamber, 2002; Witten & Frank, 2005). Sometimes, the first two phases (data cleaning and integration, selection and transformation) are combined and called data preprocessing (Cooley, et al., 1997; Romero & Ventura, 2007).
This section describes major issues and challenges in each KDD phase documented in the literature.
Phase I – Data Preprocessing
Raw data are far from being ready to be input into a mining algorithm, because there might be missing entries, irrelevant information, or the need to integrate data from different resources before using them. Thus, the first step of knowledge discovery – data preprocessing – is very critical to ensure that the data are in a suitable shape and could produce valid results. It is estimated that data preprocessing comprises the majority (90%) of the work in knowledge discovery. Yet, it is more than a tedious necessity, because all the decisions made in data preprocessing phase can deeply influence the results of the actual data mining. Data preprocessing in general may contain more than one of the tasks listed below.
Data Cleaning and Path Completion Data cleaning, the most intensive step in data preprocessing, is to remove
noise and inconsistent data from the data source (Han & Kamber, 2002). Search engine spiders (Weischedel & Huizingh, 2006) constantly crawl IA pages, and spam programs have attacked the IA in the past, leading to a large number of spam accounts, projects, and visits scattered in different tables of the database. In addition, some teachers attempted to create projects, but stopped in the middle, leaving numerous unfinished work (e.g., without title or without content) in the system. Thus, all the data contributed from noise made by spiders and humans need to be removed from the database.
Data Integration Data integration entails the combination of data from multiple autonomous
and heterogeneous sources (Halevy, Rajaraman, & Ordille, 2006; Han & Kamber, 2002; Romero & Ventura, 2007). It is another central step in data preprocessing for knowledge discovery (Kriegel, et al., 2006). Data mining algorithms generally require a homogeneous dataset – data originating from one single source. However, sometimes information from a single source is insufficient for data mining, and there is a need to refer to different sources to get a more comprehensive picture of

10
the topic at hand, especially in real-world situations, such as large enterprises who own a multitude of data sources, large-scale scientific projects that collect data produced independently by different researchers, or cooperation among government agencies (Halevy, et al., 2006). Entries of different data sources, however, may have different semantics, different scales and formats, and varying degrees of noise – all pose considerable challenges to data combination.
Data Selection Usually not all the information obtained from the raw data is necessary for
data mining. For example, IA teachers are asked to select the background color and theme logo for their projects, information not significantly reflecting the quality and usage of the projects, and therefore should be discarded from the set of prepared variables. As such, a set of features – feature vector – is selected to represent a user’s profile and their relevant online activity.
Google Analytics is useful in this regard. It presents a series of reports about the visitors, traffic source, and navigation path, which can provide a lead for the direction of further exploration. Table 3 illustrates how the GA data influence the data selection process. Table 3 Google Analytics (GA) and Data Selection
GA facts Questions for further exploration
Relevant variables
40% visitors have only visited the IA site once, while 8% have visited it more than 200 times.
Can different behaviors be identified from users of different visit frequency?
What are the typical behaviors of loyal users?
The duration between visits
The number of times a user has visited the IA.
The number of projects a user has created.
The number of IA resources a user has collected.
40% people bounce away after viewing one page and the percentage of visitors decrease as they go deeper into the site; however, 4% have more than 20 pages per visit.
Is the depth of visit a descriptive attribute for categorizing users?
Depth of visit
Particular IA projects become the top landing
Is the projects’ popularity a descriptive attribute
A project’s number of visits

11
pages. for categorizing users?
GA has observed some popular navigational path.
How to generalize those navigational paths into meaningful activities, in order to characterize visitors?
Page requests
Site overlay tells that a guest user usually visits three places after entering the site: my resources, create new projects, and browse IA projects.
Is a users’ frequently visited page(s) a descriptive attribute for categorizing users?
Page requests
Data Transformation Data transformation is the process of transforming raw data into forms
appropriate for mining. Han & Kamber (2002) lists several commonly used data transformation methods: smoothing (e.g., binning, regression, and clustering), aggregation (e.g., converting daily sales data to monthly total amount), generalization (replacing lower-level or primitive data with higher-level concepts), normalization, and attribute construction (adding new attributes from the given attributes).
These methods are utilized to reduce the complexity of the IA dataset. Table 4
presents an example of the data transformation adopted in the pilot study to be discussed later.
Table 4 Data Transformation
Raw data Transformed data Method
Timestamps Session length Generalization Attribute construction
Number of times in various occasions
Project / resource / visit stickiness
Smoothing Generalization
Project types The percentage of each type of projects
Attribute construction
URL Browsing activity Generalization Number of page views per visits
Depth of visit Generalization Attribute construction
Phase II – Applying Data Mining Algorithms
After the raw data are cleaned, transformed and important variables are selected, some data mining algorithms will be applied to extract the hidden patterns from the processed data. Researchers in education and information science have applied almost all data mining algorithms to discover useful information from educational datasets. This pilot study, described below, relied on a particular type of

12
data mining method -- clustering -- in analyzing IA users and their usage patterns from different perspectives.
Clustering Clustering is an unsupervised learning model (Han & Kamber, 2002). That is,
there is neither a predefined number of clusters nor pre-labeled instances. Clustering algorithms normally group data based on two measures: the similarity between the data objects within the same cluster (minimal intra-cluster distance), and the dissimilarity between the data objects of different clusters (maximal inter-cluster distance).
In the IA context, teacher users are the most complicated group of visitors; they exhibit different navigational behaviors, and make their individual decisions on how to use web resources and their own projects. It is very likely that more than one type of teachers exist in this complex IA environment. Since there are no predefined teacher sub-groups, clustering algorithms should suit the situation – to discover typical IA teacher groups. Phase III – Interpretation and Post-processing
There is no golden standard for evaluating the ‘goodness’ of mining results, and even the same dataset could render different results after going through different preprocessing procedure and web mining algorithms. In addition, the interpretation is highly problem dependent. Just as neither p-values nor effect sizes make sense unless contextualized and accompanied with appropriate explanations, the same applies to data mining results. The discovered patterns would not be very useful unless there are mechanisms and tools to help analysts better understand them (Cooley, et al., 1997). Although statistical analysis software (e.g., SPSS, LatentGold) and web analytics tools (e.g., Google Analytics) have the ability to visually display results, researchers are ultimately responsible for the interpretation and presentation of discovered patterns.
Pilot Study: Clustering IA Users
In this section, we present a pilot study using a small sample of Instructional Architect usage data. The purpose of this study was to detect and describe user groups based on their varying online behaviors.
Data Preprocessing
User Selection The small-scale pilot study included users who registered between January
and June 2009. From this set, data from one-time users and users who never created any projects were excluded. The data from the remaining 468 registered users (out a total of 560 registered users during that period) were included in the pilot study.

13
Feature Selection We identified one category of process measures (Nickles, 2005), navigational
behavior, and two categories of product measures, resource usage and project usage, to quantify and aggregate teacher users’ online behavior. Several usage variables were used to define each category (see Table 5).
Some values were easily calculated, such as the percentage of each type of
projects. Some were aggregated from numerous footprints, such as session length, and depth of visit. Finally, because users have been using the IA for different amount of time, it is unfair to compare the number of visits without considering how long they have been registered. As such, some variables were constructed by comparing them to other users’ performance, such as resource stickiness, visit stickiness and project stickiness. The latter are described next.
First, we calculated every user’s number of visits occurring in the ith month
after registration, denoted by vki (k = 1, …, 468). Second, we calculated the average number of visits occurring in the ith month after lining up all users’ registration date. That is, average(vi) = , where vki ≠0. Then, we calculated the average number of visits occurring in the first ith months after registration. Sum(i) =
, where vkj ≠0. Finally, each user’s visit stickiness is calculated by comparing
the total number of visits with sum(i) where i is the number of months since registration. Thus, stickiness(k) = vk / sum(i).
Clustering
This pilot study used Latent Class Analysis (LCA) (Magidson & Vermunt, 2002) to classify registered users (teachers) into groups. LCA is a model-based cluster analysis technique in that a statistical model (a mixture of probability distributions) is postulated for the population based on a set of sample data. LCA offers several advantages over traditional clustering approaches such as K-means: 1) for each data point, it assigns a probability to the cluster membership, instead of relying on the distances to biased cluster means; 2) it provides various diagnostics such as common statistics, L2, and p-value to determine the number of clusters and the significance of variables’ effect; 3) it accepts variables of mixed types without the need to standardize them; and 4) it allows for the inclusion of demographics and other exogenous variables either as active or inactive factors (Magidson & Vermunt, 2002, 2004; Vermunt & Magidson, 2002).
Initially, all variables were entered into the latent class analysis as indicators, using three to six cluster models to group teachers. Some variables had an R2 less than 0.1, meaning those user features did not contribute much to the explanation of group membership. Moreover, such phenomena were consistent across different models. Thus, variables with less discriminative power were removed from all models one by one, leaving only eight features in the final analysis (see the last column of Table 5).

14
When continuous indicators are used, the cluster module can be designed to range from the most unrestricted to the most restricted models. With an unrestricted model, each cluster may have its own variance and a full covariance matrix; though flexible, it results in a large number of parameters to be estimated, which increases as the indicators and the number of clusters k increase. On the other hand, if we assume all clusters share the same variance and all covariances equal zero (locally independent), we get the most restrictive model, requiring less parameters but relying on an unrealistic assumption.
In order to set up the most parsimonious probability model, we allowed for class dependent variance and set the off-diagonal elements of the covariance matrix to be zero, and set the number of clusters from k = 3 to 6. In this round, all indicators achieved statistical significance (p < 0.05) and a reasonable R2 (> 0.1). But when k = 6, one of the cluster’s size was less than 1%, indicating that this model overestimated the number of clusters. On the other hand, when k = 3, the model failed to provide clear distinctions between the users of different clusters. Finally, we set k = 5, because it produced a much lower BIC value (a Bayesian information criterion to measure model fitness) than when k = 4.
In the 5-class model, we observed several large bivariate residuals (BVR), suggesting that the model fell somewhat short of explaining the association between variables. Thus, we included local dependence between pairs of indicators with large BVR one by one, until all BVR values were less than 10. With such specification, we achieved much lower BIC value, and accepted such setting as the final model.
Results and Interpretation
Clustering Results Table 6 shows the final clustering results. The values under each cluster are
the mean scores for the corresponding indicators.
Table 6 LCA Clustering Results
Cluster1 Cluster2 Cluster3 Cluster4 Cluster5
Cluster Size 0.29 0.24 0.21 0.16 0.10
Indicators Range
Percent_student_projects 0 - 1 0.96 0 0.34 1 0.44
Percent_private_projects 0 - 1 0 1 0.29 0 0.32
Percent_copy_projects 0 - 1 0 0.15 0.30 0 0.32
Percent_public_projects 0 - 1 0.96 0 0.40 0 0.43
Visit stickiness 0.22 – 8.93 1.16 0.62 0.99 0.71 2.98
Project stickiness 0.15 – 8.06 1.99 0.20 0.66 0.32 2.12
Resource stickiness 0 - 29.91 1.06 0.39 0.77 0.57 4.22
Browse others 0 - 1 0.44 0.44 0.20 0.59 0.21
Note. k = 5. Class dependent variance and local dependence between the following pairs of indicators: resource stickiness and project stickiness, percent_public_project and percent_private_project,

15
percent_public_project and percent_student_project. Browse others is the only dichotomous variable. 0 means a teacher has never browsed another user’s project, and 1 means browsed at least once.
Interpretation We examined each variable’s distribution with the following interpretations
about the characteristics of each user group, ordered by cluster size. Cluster 1: Goal-oriented, Willing-to-share This group of users tends to collect many web resources and is very
productive (high project stickiness). They never create dummy projects, and once they have an instructional need, they will turn it into a public IA project or make it available to their students. Though they may or may not browse other people’s projects, they don’t adapt others’ work, perhaps because they prefer a customized lesson plan to meet students’ learning objective.
Cluster 2: Inactive, Less motivated This group of users does not visit the IA very often. Moreover, members have
never contributed to the IA community because they only create a few private projects for practice or just for fun.
Cluster 3: Lukewarm Performers This group of users shows loading on every indictor, yet all stickiness
indicators measure at lower levels. Members in this cluster have adapted other teachers’ projects. Though they have created several projects, they make at least one project public or available to their students. They appreciate and utilize every function provided by the IA service, but are less enthusiastic than Cluster 5.
Cluster 4: Goal-oriented, Unwilling-to-share, Less devoted Like users in Cluster 1, people in this group also create IA projects with
specific instructional objectives in mind. However, they only make projects available to their own students, unwilling to share with the general public. As infrequent users, they only collect a few resources and create a few projects. Probably they use IA for one time to fulfill their instructional needs but seldom come back.
Cluster 5: Productive, Active, Adapters Members of this group like to browse other teachers’ projects and make a
copy for themselves. They are more active and productive than group 3 in terms of visits, projects created, and resources collected. Though extremely active, they are not as focused as Cluster 1 and Cluster 4.
Summary
As noted above, the IA is intended to increase the utility of online resources for teachers. Teachers are expected to collect and contextualize resources, and share their instructional web pages with students and colleagues. Cluster 1 seems to be the group that best meets this objective, as members are active consumers, designers, and contributors to this teacher network (Recker, 2006). However, the

16
fact that they seldom adapt others’ work makes them less productive than Cluster 5. Ideally, we expect teachers to possess the strength of both groups to become functional and efficient IA users.

17
Table 5 Feature Space
Categories Features Data type Description Cluster Analysis
Resource Usage
Add own resource Categorical Add a non-NSDL resource Removed
Add IA projects as resources
Categorical Put an IA project into the resource collection Removed
Resource stickiness Continuous # of resources collected by this user divided by average # of resources by all users after N months of use
Included
Project usage
Project stickiness Continuous # of projects by this user divided by average # of projects by all users after N months of use
Included
Percent of public projects Continuous The percentages of public projects among all this user’s projects.
Included
Percent of student-view projects
Continuous The percentages of student-view projects among all this user’s projects.
Included
Percent of private projects Continuous The percentages of private projects in this user’s projects.
Included
Percent of copied projects Continuous The percentages of copied projects in all this user’s projects.
Included
Navigation
Browse other projects Categorical Has this user browsed other people’s projects? Included
Visit stickiness Continuous # of visits by this user divided by average # of visits by all users after N months of use
Included
Session length Continuous The average time spent on the IA website per visit Removed
Depth of visit Continuous The average # of pages visited per session Removed

18
Conclusion
This chapter has reviewed approaches for analyzing web usage data,
webmetrics and educational data mining, in the context of two learning environment, as well as presented a pilot study with teacher usage data to demonstrate clustering using Latent Class Analysis. Our work identified diverse user behaviors, and as well as clusters of effective users.
In the future, we plan to add another layer of data transformation by
converting all variables to a 0 ~ 1 range. We also plan to extend the current work to a large-scale study by including all users to analyze their longitudinal behaviors. The present pilot study only considered eight indicators, and ignored vast amount of user data, such as click-stream data. Educational data mining is an emerging field, where researchers bring together knowledge from different fields to answer educational research questions. In the long term, our research is not necessarily limited to one methodology and a single algorithm, as we plan to utilize other data mining approach (e.g., association rule mining) and to combing results with more traditional evaluation data (e.g., user surveys) to better illuminate the behaviors and motivations of IA users.
In conclusion, we note that while these approaches have utility, they do come
with several caveats. The implementation of webmetrics tools as well as analysis of the resulting data is time consuming. Effective webmetrics analyses require adequate resources, integrated with a comprehensive research and evaluation strategy. A second caveat is limitation of the webmetrics, which are a measure of user behavior not of knowledge or attitude. Consequently, inferences about users’ intentions cannot be made solely from web metrics. To help with interpretation issues, usage data should be triangulated with other data sources, such as data from usability studies, field studies, surveys, focus groups, and interviews. Finally, because collection of web usage data can be done without the full knowledge of the user, it poses a privacy threat. Informed consent needs to be designed into the online environment to allow users to opt-in or out of research participation
Despite the current struggle, the field of web metrics and educational data mining is slowly making progress towards standardizing terms and measures. As online environments continue to generate a data deluge of massive and longitudinal datasets, this presents multiple opportunities to explore this rich territory.
Acknowledgements
This material is based upon work supported by the National Science Foundation under Grants No. 840745 & 0840738, and Utah State University. Any opinions, findings, and conclusions or recommendations expressed in this material are those of the author(s) and do not necessarily reflect the views of the National

19
Science Foundation. We thank the members of the IA research group, especially Bart Palmer.

20
Figures
Figure 1. Searching for NSDL Resources inside the IA
Figure 2. Project Creation Interface

21
Figure 3. Search results from the Exploratorium Learning Resources Collection

22
Figure 4. Page Views from Two Webmetrics Sources over a 15-month Period
Figure 5. A Zipf (long-tail) distribution characterizes IA’s usage

23
Figure 6. Number of visits, as generated by Google Analytics

24
Figure 7a&b. U.S. Geo-segmentation generated by Google Analytics. Darker shade indicates more visits.
(a), Instructional Architect
(b), ELRC
Figure 8a&b. U.S. map showing IA visits (yellow indicates visits; red is high visit frequency) overlayed with (a) number of schools per district, and (b) median family income (b) (darker shade indicates higher value) over 1 year.
(a), schools per district
(b), median family income

25
Figure 9a&b. U.S. map of ELRC visits (yellow indicates visits; red is high visit frequency) overlayed with (a) number of schools per district, and (b) median family income (darker shade indicates higher value) over 1.5 years.
Figure 10. IA Traffic Referrals from the NSDL months before (green) and after (blue) dissemination strategy.
(a), schools per district
(b), median family income
26
References Borgman, C. L., Abelson, H., Dirks, L., Johnson, R., Koedinger, K. R., Linn, M. C., et al.
(2008). Fostering learning in the networked world: The cyberlearning opportunity and challenge. Report of the NSF Task Force on Cyberlearning. Retrieved from http://www.nsf.gov/pubs/2008/nsf08204/nsf08204.pdf
Chan, S., (2009). Towards new metrics of success for on-line museum projects. In J. Trant & D. Bearman (eds.), Proceedings of the Museums and the Web 2008. Toronto, Canada: Archives & Museum Informatics.
Chen, H., & Chau, M. (2004). Web mining: Machine learning for web applications. In C. Blaise (Ed.), Annual review of information science and technology, 38 (pp. 289-329). Medford, NJ: Information Today, Inc.
Computing Research Association (2005). Cyberinfrastructure for education and learning for the future: A vision and research agenda. Retrieved from Computing Research Association, CRA publication website: http://www.cra.org/reports/cyberinfrastructure.pdf
Cooley, R., Mobasher, B., & Srivastava, J. (1997). Web mining: Information and pattern discovery on the World Web Web. Proceedings of the 9th IEEE International Conference on Tools with Artificial Intelligence, Newport Beach, CA, 558-567.
Google Analytics Report (2009). Why does Google Analytics report different values than some other web analytics solutions? [Online troubleshooting reports]. Retrieved June 08, 2009, from http://www.google.com/support/googleanalytics/bin/answer.py?hl=en&answer=55614
Halevy, A., Rajaraman, A., & Ordille, J. (2006). Data integration: The teenage years. Proceedings of the 32nd International Conference on Very Large Data Bases, Seoul, Korea, 9-16.
Han, J., & Kamber, M. (2002). Data mining: Concepts and techniques (2nd ed.). San Francisco, CA: Morgan Kaufmann Publishers.
Hey, T., & Trefethen, A. (2003). The data deluge: An e-Science perspective. In F. Berman, G. Fox & T. Hey (Eds.), Grid computing: Making the global infrastructure a reality (pp. 809-824): Wiley.
Khoo, M., Recker, M., Pagano, J., Palmer, B., Washington, A., & Donahue, R. A. (2008). Using webmectrics to analyze digital libraries, ACM/IEEE-CS Joint Conference on Digital Libraries. Pittsburgh, PA.
Kriegel, H.-P., Borgwardt, K., M, Kröger, P., Pryakhin, A., Schubert, M., & Zimek, A. (2006). Future trends in data mining. Data Mining and Knowledge Discovery, 15(1), 87-97.
Magidson, J., & Vermunt, J. (2002). Latent class models for clustering: A comparison with K-means. Canadian Journal of Marketing Research, 20, 37-44.
Magidson, J., & Vermunt, J., K. (2004). Latent class models. In D. Kaplan (Ed.), The Sage Handbook of Quantitative Methodology for the Social Sciences (pp. 175-198). Thousand Oakes: CA: Sage Publications.

27
McArthur, D. J., & Zia, L. L. (2008). From NSDL 1.0 to NSDL 2.0: Towards a Comprehensive Cyberinfrastructure for Teaching and Learning. Proceedings of the JCDL'08, Pittsburg, Pennsylvania, 66-69.
Muehlenbrock, M. (2005). Automatic action analysis in an interactive learning environment. Proceedings of the workshop on Usage Analysis in Learning Systems at AIED-2005, Amsterdam, The Netherlands.
Nickles III, G., M (2005). Identifying measures of student behavior from interaction with a course management system. Journal of Educational Technology Systems, 34(1), 111-126.
Pahl, C., & Donnellan, D. (2002). Data mining technology for the evaluation of web-based teaching and learning systems. Proceedings of E-Learn 2002 World Conference on E-Learning in Corporate, Government, Healthcare, & Higher Education, Montreal, Quebec, Canada, 747-752.
Recker, M., & Pitkow, J. (1996). Predicting document access in large, multimedia repositories. ACM Transactions on Computer-Human Interaction , 3(4), 352-375.
Recker, M. (2006). Perspectives on Teachers as Digital Library Users: Consumers, Contributors, and Designers. D-Lib Magazine, 12(9).
Recker, M., Walker, A., Giersch, S., Mao, X., Halioris, S., Palmer, B., et al. (2007). A study of teachers’ use of online learning resources to design classroom activities. New Review of Hypermedia and Multimedia, 13(2), 117-134.
Romero, C., & Ventura, S. (2007). Educational data mining: A survey from 1995 to 2005. Expert Systems with Applications, 33(1), 135-146.
Semper, R., Wanner, N., Jackson, R., & Bazley, M. (2000, April). Who's Out There? A pilot user study of educational Web resources by the Science Learning Network (SLN). Paper presented at the Museums & the Web 2000 Conference, Minneapolis, MN.
Vermunt, J., K., & Magidson, J. (2002). Latent class cluster analysis. In J. Hagenaars & A. McCutcheon (Eds.), Applied latent class analysis (pp. 89-106). New York, NY: Cambridge University Press.
Weischedel, B., & Huizingh, E. K. (2006). Website optimization with web metrics: A case study. Proceedings of the 8th International Conference on Electronic Commerce, Fredericton, New Brunswick, Cananda, 463-470.
Witten, I. H., & Frank, E. (2005). Data mining: Practical machine learning tools and techniques (2nd ed.). San Francisco, CA: Morgan Kaufmann.