the current and potential costs from diseases of pulse ... · grdc the current and potential costs...
TRANSCRIPT

GRDCThe Current and Potential Costs
from Diseases of Pulse Crops in Australia
GoRDon M. MuRRAy AnD John P. BRennAn

GRDC | 2 | CuRRenT AnD PoTenTiAl CosTs fRoM DiseAses of Pulse CRoPs in AusTRAliA
Title: The Current and Potential Costs from Diseases of Pulse Crops in Australia
GRDC Research Code: CER00002
Authors: Gordon M Murray and John P. Brennan
Gordon M. Murray ‘Hickory Grove’215 Brucedale DriveWagga Wagga NSW 2650Phone: 02 6921 1803Email: [email protected]
John P. BrennanCoolamaine Economic ResearchPO Box 309Castlemaine Vic 3450Phone: 03 5472 2760Email: [email protected]
© 2012 Grains Research and Development Corporation.All rights reserved.
Published: May 2012
ISBN: 978-1-921779-19-0
In submitting this report, the researchers have agreed to the GRDC publishing this material in its edited form.
For free copies please contact:
Ground Cover DirectFree phone: 1800 11 00 44 Email: [email protected] or
Ms Maureen CribbGRDC Publishing Manager
PO Box 5367 KINGSTON ACT 2604 Phone: 02 6166 4500 Email: [email protected]
Design and production: Coretext, www.coretext.com.au
DisclaimerThe content of this bulletin is provided for information purposes only. While reasonable care is taken in its preparation, the Grains Research and Development Corporation does not guarantee or warrant the accuracy, reliability, completeness or currency of the information on in this document or its usefulness in achieving any purpose.
Users of this document are responsible for assessing the relevance and accuracy of its content. The Grains Research and Development Corporation will not be liable for any loss, damage, cost or expense incurred or arising by reason of any person using or relying on the information in this document..

CuRRenT AnD PoTenTiAl CosTs fRoM DiseAses of Pulse CRoPs in AusTRAliA | 3 | GRDC
ConTenTs
executive summary-----------------------------------------------------------------------------------------------------------------------------------------------------------------6
Acknowledgements -------------------------------------------------------------------------------------------------------------------------------------------------------------- 12
seCTion 1: introduction -------------------------------------------------------------------------------------------------------------------------------------------------- 12
seCTion 2: Method ----------------------------------------------------------------------------------------------------------------------------------------------------------- 13
2.1 introduction ----------------------------------------------------------------------------------------------------------------------------------------- 13
2.2 Geographical regions and crop production data for survey ---------------------------------------- 13
2.3 Climate in the pulse growing areas ------------------------------------------------------------------------------------------ 13
2.4 The diseases and their pathogens ------------------------------------------------------------------------------------------- 14
2.5 Potential and present disease losses ------------------------------------------------------------------------------------- 14
2.6 Control methods ------------------------------------------------------------------------------------------------------------------------------- 16
2.7 survey ---------------------------------------------------------------------------------------------------------------------------------------------------- 16
2.8 Calculating disease costs ------------------------------------------------------------------------------------------------------------- 16
2.9 use of pesticides for control of pulse diseases ----------------------------------------------------------------- 16
seCTion 3: Current and potential losses from diseases of field peas ------------------------------------------------------ 17
3.1 introduction ----------------------------------------------------------------------------------------------------------------------------------------- 17
3.2 field pea production ----------------------------------------------------------------------------------------------------------------------- 17
3.3 Diseases of field peas -------------------------------------------------------------------------------------------------------------------- 17
3.4 incidence and severity of field pea diseases ---------------------------------------------------------------------- 18
3.5 losses from field pea diseases ------------------------------------------------------------------------------------------------- 23
3.6 Value of control of field pea diseases ------------------------------------------------------------------------------------- 27
3.7 use of pesticides for control of field pea diseases ---------------------------------------------------------- 27
3.8 Discussion and Conclusions ------------------------------------------------------------------------------------------------------- 29
seCTion 4: Current and potential losses from diseases of narrowleaf lupins -------------------------------------- 30
4.1 introduction ----------------------------------------------------------------------------------------------------------------------------------------- 30
4.2 narrowleaf lupin production -------------------------------------------------------------------------------------------------------- 30
4.3 Diseases of narrowleaf lupins ----------------------------------------------------------------------------------------------------- 30
4.4 incidence and severity of narrowleaf lupin diseases ------------------------------------------------------- 32
4.5 losses from narrowleaf lupin diseases ---------------------------------------------------------------------------------- 35
4.6 Value of control of narrowleaf lupin diseases --------------------------------------------------------------------- 36
4.7 use of pesticides for control of narrowleaf lupin diseases ------------------------------------------ 41
4.8 Discussion and Conclusions ------------------------------------------------------------------------------------------------------- 41
seCTion 5: Current and potential losses from diseases of albus lupins ------------------------------------------------- 42
5.1 introduction ----------------------------------------------------------------------------------------------------------------------------------------- 42
5.2 Albus lupin production ------------------------------------------------------------------------------------------------------------------- 42
5.3 Diseases of albus lupins---------------------------------------------------------------------------------------------------------------- 43
5.4 incidence and severity of albus lupin diseases ----------------------------------------------------------------- 43
5.5 losses from albus lupin diseases--------------------------------------------------------------------------------------------- 45
5.6 Value of control of albus lupin diseases -------------------------------------------------------------------------------- 47

GRDC | 4 | CuRRenT AnD PoTenTiAl CosTs fRoM DiseAses of Pulse CRoPs in AusTRAliA
5.7 use of pesticides for control of albus lupin diseases ----------------------------------------------------- 48
5.8 Discussion and Conclusions ------------------------------------------------------------------------------------------------------- 49
seCTion 6: Current and potential losses from diseases of chickpeas ----------------------------------------------------- 51
6.1 introduction ----------------------------------------------------------------------------------------------------------------------------------------- 51
6.2 Chickpea production ----------------------------------------------------------------------------------------------------------------------- 51
6.3 Diseases of chickpeas ------------------------------------------------------------------------------------------------------------------- 51
6.4 incidence and severity of chickpea diseases --------------------------------------------------------------------- 53
6.5 losses from chickpea diseases ------------------------------------------------------------------------------------------------ 57
6.6 Value of control of chickpea diseases ------------------------------------------------------------------------------------ 59
6.7 use of pesticides for control of chickpea diseases --------------------------------------------------------- 59
6.8 Discussion and Conclusions ------------------------------------------------------------------------------------------------------- 63
seCTion 7: Current and potential losses from diseases of faba beans ------------------------------------------------- 64
7.1 introduction ----------------------------------------------------------------------------------------------------------------------------------------- 64
7.2 faba bean production -------------------------------------------------------------------------------------------------------------------- 64
7.3 Diseases of faba beans ----------------------------------------------------------------------------------------------------------------- 64
7.4 incidence and severity of faba bean diseases ------------------------------------------------------------------- 67
7.5 losses from faba bean diseases ---------------------------------------------------------------------------------------------- 70
7.6 Value of control of faba bean diseases ---------------------------------------------------------------------------------- 75
7.7 use of pesticides for control of faba bean diseases ------------------------------------------------------- 75
7.8 Discussion and Conclusions ------------------------------------------------------------------------------------------------------- 76
seCTion 8: Current and potential losses from diseases of lentils -------------------------------------------------------------- 77
8.1 introduction ----------------------------------------------------------------------------------------------------------------------------------------- 77
8.2 lentil production ------------------------------------------------------------------------------------------------------------------------------- 77
8.3 Diseases of lentils ----------------------------------------------------------------------------------------------------------------------------- 78
8.4 incidence and severity of lentil diseases ------------------------------------------------------------------------------- 79
8.5 losses from lentil diseases ---------------------------------------------------------------------------------------------------------- 80
8.6 Value of control of lentil diseases --------------------------------------------------------------------------------------------- 83
8.7 use of pesticides for control of lentil diseases ------------------------------------------------------------------ 84
8.8 Discussion and Conclusions ------------------------------------------------------------------------------------------------------- 86
seCTion 9: Current and potential losses from diseases of vetch -------------------------------------------------------------- 87
9.1 introduction ----------------------------------------------------------------------------------------------------------------------------------------- 87
9.2 Vetch production ------------------------------------------------------------------------------------------------------------------------------- 87
9.3 Diseases of vetch ----------------------------------------------------------------------------------------------------------------------------- 88
9.4 incidence and severity of vetch diseases ----------------------------------------------------------------------------- 89
9.5 losses from vetch diseases -------------------------------------------------------------------------------------------------------- 90
9.6 Value of control of vetch diseases ------------------------------------------------------------------------------------------- 92
9.7 use of pesticides for control of vetch diseases ---------------------------------------------------------------- 94
9.8 Discussion and Conclusions ------------------------------------------------------------------------------------------------------- 94
seCTion 10: Current and potential losses from diseases of peanuts ------------------------------------------------------ 96
10.1 introduction --------------------------------------------------------------------------------------------------------------------------------------- 96
10.2 Peanut production ------------------------------------------------------------------------------------------------------------------------- 96

CuRRenT AnD PoTenTiAl CosTs fRoM DiseAses of Pulse CRoPs in AusTRAliA | 5 | GRDC
10.3 Diseases of peanuts --------------------------------------------------------------------------------------------------------------------- 97
10.4 incidence and severity of peanut diseases ----------------------------------------------------------------------- 99
10.5 losses from peanut diseases ------------------------------------------------------------------------------------------------101
10.6 Value of control of peanut diseases ------------------------------------------------------------------------------------103
10.7 use of pesticides for control of peanut diseases ---------------------------------------------------------107
10.8 Discussion and Conclusions --------------------------------------------------------------------------------------------------107
seCTion 11: Current and potential losses from diseases of mungbeans ---------------------------------------------108
11.1 introduction -------------------------------------------------------------------------------------------------------------------------------------108
11.2 Mungbean production ---------------------------------------------------------------------------------------------------------------108
11.3 Diseases of mungbeans -----------------------------------------------------------------------------------------------------------109
11.4 incidence and severity of mungbean diseases -------------------------------------------------------------110
11.5 losses from mungbean diseases ----------------------------------------------------------------------------------------111
11.6 Value of control of mungbean diseases ----------------------------------------------------------------------------115
11.7 use of pesticides for control of mungbean diseases -------------------------------------------------115
11.8 Discussion and Conclusions --------------------------------------------------------------------------------------------------116
seCTion 12: Disease losses to Australian pulse crops: Discussion and Conclusions -------------------117
12.1 Production of pulse crops in Australia -------------------------------------------------------------------------------117
12.2 Diseases of pulse crops in Australia -----------------------------------------------------------------------------------117
12.3 Contribution of major disease groups to losses -----------------------------------------------------------118
12.4 Control of pulse diseases --------------------------------------------------------------------------------------------------------122
12.5 Conclusions ------------------------------------------------------------------------------------------------------------------------------------124
seCTion 13: References -----------------------------------------------------------------------------------------------------------------------------------------------125
Appendix A Production data for the pulse crops -----------------------------------------------------------------------------------------------126
Appendix B Disease data for the pulse crops by agro-ecological zone -------------------------------------------------129
Appendix C Pesticide use data for the pulse crops by agro-ecological zone --------------------------------------197
“how can we expect practical men to be properly impressed with the importance of our work and to vote large sums of money for its support when in place of facts we have only vague guesses to give them and we do not take the trouble to make careful estimates.”
— lyman (1918)

GRDC | 6 | CuRRenT AnD PoTenTiAl CosTs fRoM DiseAses of Pulse CRoPs in AusTRAliA
The current loss from diseases in the Australian pulse industry averages $74 million per year, or 14.8 per cent of the gross value of pulse production. These losses are due to diseases caused by fungi, nematodes, bacteria, viruses and phytoplasmas. Losses would be far higher without the current range of controls, which include the use of resistant varieties, rotation, paddock management and the use of pesticides. The Grains Research and Development Corporation (GRDC) has supported much of the research and development of these disease controls.
The allocation of resources for the control of pulse crop diseases, both at grower level (when deciding whether to control a particular disease) and at the national level (when allocating funds for research and development) depends on an assessment of the losses caused by those diseases.
The pulse crops included in this study were narrowleaf and albus lupins, field peas, chickpeas, faba beans, lentils, vetch, peanuts and mungbeans. The disease losses to pulse crops are estimated from a survey of plant pathologists across Australia. An examination was made of the present costs of diseases and the potential costs if current control measures were not in place. The application and costs of pesticides applied to pulse crops for disease control were also estimated. These figures provide key insights into the importance of pulse crop diseases in Australia.
Pulse crops are grown throughout the cropping areas of Australia. For the five years ending 2008-09, their average gross value of production was $503 million per year from an average area of 1.5 million hectares. The largest area is in the GRDC Southern Region, with 786,000ha annually. The Western Region has 420,000ha and the Northern Region 281,000ha.
Narrowleaf lupins have the largest area, with 498,000ha, followed by field peas (303,000ha), chickpeas (300,000ha), faba beans (139,000ha), lentils (122,000ha), vetch (42,000ha), mungbeans (40,000ha), albus lupins (32,000ha) and peanuts (12,000ha).
Although third in area sown, their higher value gives chickpeas the highest gross value of production in Australia. They are also the highest value crop in the Northern Region, with lentils the highest in the Southern Region and narrowleaf lupins the highest in the Western Region.
Within crops, the highest disease losses occur in chickpeas and field peas, each with a current average annual loss of $24 million, and narrowleaf lupins ($15 million). Based on percentage loss, field peas have the highest present losses (32 per cent of the crop value) followed by peanuts (28 per cent), chickpeas (16 per cent), narrowleaf lupins (14 per cent) and faba beans (11 per cent). Losses in lentils, mungbeans, albus lupins and vetch are under 5 per cent of the crop value.
Nationally, current losses from the potentially most important disease of each crop exceed $100 per hectare for only one pulse – peanuts – and are less than $20/ha for the other pulses. However, the potential loss from the most important disease affecting each crop exceeds $100/ha for five of the nine pulse crops, with the potential loss of the most important disease only less than $10/ha for one crop, albus lupins.
Control of the major diseases affecting each pulse crop has high value, and is the difference between the potential cost and the present cost.
The estimates of disease losses were made using disease and crop production data collected for each agro-ecological zone where the pulse crop was grown. These estimates were then aggregated for each of the GRDC regions and then for Australia. This report estimates the status of pulse disease losses in the first decade of the 21st century. It provides a benchmark to capture future changes.
Losses from the major diseases of each crop are as follows.
exeCuTiVe suMMARy
Gross value of production of pulse crops for each region and for Australia (average over 5 years ending 2008-09, $ million)
Pulse Northern Region
Southern Region
Western Region Australia
Field peas 0.0 61.8 16.4 78.2
Narrowleaf lupins 0.0 30.9 81.5 112.4
Albus lupins 0.0 11.3 0.3 11.6
Chickpeas 109.0 39.0 3.4 151.3
Faba beans 4.1 36.3 0.8 41.2
Lentils 0.0 61.9 0.0 61.9
Vetch 0.0 4.7 0.0 4.7
Peanuts 8.7 0.0 0.8 9.6
Mungbeans 29.3 3.3 0.0 32.5
Total pulse 151.1 249.0 103.3 503.4
Potential and present average annual loss ($/ha) and the control value ($/ha and $million) of the disease with highest potential loss of each pulse crop for Australia
CropHighest potential
disease
Loss ($/ha) Control value
Potential Present ($/ha) ($ million)
Field peas Mycosphaerella black spot 60 18 42 12.7
Narrowleaf lupins brown leaf spot 165 8 157 78.0
Albus lupins Pleiochaeta root rot 5 2 3 0.1
Chickpeas Ascochyta blight 134 16 118 34.9
Faba beans Ascochyta blight 67 8 60 8.3
Lentils Ascochyta blight 133 7 126 15.3
Vetch Ascochyta blight 15 0 15 0.6
Peanuts damping off/seed aflatoxin 286 114 172 2.1
Mungbeans root lesion nematode thornei 113 19 94 3.3

CuRRenT AnD PoTenTiAl CosTs fRoM DiseAses of Pulse CRoPs in AusTRAliA | 7 | GRDC
field peasMost field peas are grown in the Southern Region, which has 79 per cent of the area sown with the remainder grown in the Western Region while in recent years only a trace area has been sown in the Northern Region.
Diseases cause an estimated current average annual loss of $23.7 million, or $78.35/ha, to the Australian field pea industry. This loss is 31.6 per cent of the average annual value of the field pea crop over a recent five-year period. Nationally, these losses are dominated by five diseases:
Disease $/ha $ million
Mycosphaerella black spot 18.35 5.6
Koolunga black spot 17.13 5.2
black spot complex 16.26 4.9
Phoma black spot 12.93 3.9
downy mildew 4.07 1.2
Total losses from others 9.60 2.9
Total Present Loss 78.35 23.7
If the current control measures were not in place, losses would be far higher. The magnitude of potential losses is shown by the loss estimates for the top five diseases when uncontrolled:
Disease $/ha $ million
Mycosphaerella black spot 60.16 18.2
Koolunga black spot 57.11 17.3
black spot complex 54.20 16.4
Phoma black spot 24.63 7.5
pea seed-borne mosaic 22.48 6.8
All of these except pea seed-borne mosaic are collectively the ‘black spot complex’ and are difficult to distinguish in the field. There is evidence that the main component of the complex may vary in different parts of Australia.
The loss estimates were derived from a national survey of the incidence and severity of 40 field pea diseases. The information was collected from 10 of the 13 agro-ecological zones where field peas are grown in Australia, with the incidence and severity data in each zone supplied by eight plant pathologists familiar with the diseases. These data were combined with data on area, production and value of the crop to estimate the economic value of the losses.
Current control values have reduced the losses from these diseases considerably. Breeding, cultural measures and pesticides are generally used in conjunction, as shown by the following diseases:
Most of the field pea crops in the Southern Region are treated either with seed or foliar fungicides costing about $7 million a year, or $30/ha.
narrowleaf lupinsMost narrowleaf lupins are grown in the Western Region, which has 70 per cent of the area sown, with the rest grown in the Southern Region. There have been no narrowleaf lupin plantings in the Northern Region in recent years.
Diseases cause an estimated current average annual loss of $15.3 million, or $30.73/ha, to the Australian narrowleaf lupin industry. This loss is 13.6 per cent of the average annual value of the narrowleaf lupin crop over a recent five-year period. Nationally, these losses are dominated by five diseases:
Disease $/ha $ million
Pleiochaeta root rot 15.28 7.6
brown leaf spot 8.21 4.1
anthracnose 2.91 1.4
Rhizoctonia bare patch 2.36 1.2
Eradu patch 0.91 0.5
Total losses from others 1.06 0.5
Total Present loss 30.73 15.3
If the current control measures were not in place, losses would be far higher. The magnitude of potential losses is shown by the loss estimates for the top five diseases when uncontrolled:
Disease $/ha $ million
brown leaf spot 165.03 82.1
Pleiochaeta root rot 152.90 76.1
epicotyl rot 32.67 16.3
anthracnose 28.97 14.4
Rhizoctonia bare patch 6.10 3.0
The loss estimates were derived from a national survey of the incidence and severity of 34 narrowleaf lupin diseases. The information was collected from 10 of the 11 agro-ecological zones where narrowleaf lupins are grown in Australia, with the incidence and severity data in each zone supplied by five plant pathologists familiar with the diseases. These data were combined with data on area, production and value of the crop to estimate the economic value of the losses.
Current control values have considerably reduced the losses from these diseases. Breeding, cultural measures and pesticides are generally used in conjunction, as shown by the following diseases:
DiseaseControl value
($ million)
Contribution to control ($ million) by
Breeding Cultural Pesticides
Mycosphaerella black spot 12.7 1.2 9.1 2.4
Koolunga black spot 12.1 0.0 9.1 3.0
black spot complex 11.5 0.0 11.5 0.0
powdery mildew 6.7 3.6 0.1 3.0
pea seed-borne mosaic 4.9 0.0 4.9 0.0
DiseaseControl value
($ million)Contribution to control ($ million) by
Breeding Cultural Pesticides
brown leaf spot 78.0 4.1 50.5 23.4
Pleiochaeta root rot 68.5 0.1 68.4 0.0
epicotyl rot 15.9 0.0 14.3 1.6
anthracnose 13.0 9.7 1.9 1.3
Rhizoctonia bare patch 1.9 0.0 1.8 0.0

GRDC | 8 | CuRRenT AnD PoTenTiAl CosTs fRoM DiseAses of Pulse CRoPs in AusTRAliA
Albus lupinsMost albus lupins are grown in the Southern Region, which has 98 per cent of the area sown. The remainder are in the Western Region.
Diseases cause an estimated current average annual loss of $140,000, or $4.35/ha, to the Australian albus lupin industry. This loss is only 1.2 per cent of the average annual value of the crop over a recent five-year period, the second lowest loss to diseases of any pulse crop. Nationally, five diseases dominate these losses:
Disease $/ha $ million
Pleiochaeta root rot 1.63 0.05
Rhizoctonia bare patch 1.09 0.03
Rhizoctonia root rot 1.09 0.03
Rhizoctonia damping off 0.36 0.01
sudden death 0.18 0.01
Total losses from others 0.00 0.01
Total Present loss 4.35 0.14
If the current control measures were not in place, losses would be far higher. The magnitude of potential losses is shown by the loss estimates for the top five diseases when uncontrolled:
Disease $/ha $ million
Pleiochaeta root rot 4.89 0.15
Rhizoctonia bare patch 2.17 0.07
Rhizoctonia root rot 2.17 0.07
Phomopsis stem blight 1.81 0.06
brown leaf spot 0.72 0.02
The loss estimates were derived from a national survey of the incidence and severity of 23 albus lupin diseases. The information was collected from six of the seven agro-ecological zones where albus lupins are grown in Australia, with the incidence and severity data in each zone supplied by two plant pathologists familiar with the diseases. These data were combined with data on area, production and value of the crop to estimate the economic value of the losses.
Current control values have reduced the losses from these diseases considerably. Breeding, cultural measures and pesticides are generally used in conjunction, as shown by the following diseases:
In the Southern Region, 30 per cent of the crop is treated with a seed fungicide costing about $6/ha, primarily to control Pleiochaeta root rot.
ChickpeasMost chickpeas are grown in the Northern Region, which has 73 per cent of the area sown. Most of the remainder are in the Southern Region with only one per cent of the area in the Western Region.
Diseases cause an estimated current average annual loss of $24.0 million, or $81.07/ha, to the Australian chickpea industry. This loss is 15.9 per cent of the average annual value of the crop over a recent five-year period. Nationally, five diseases dominate these losses:
Disease $/ha $ million
Phytophthora root rot 27.70 8.2
root lesion nematode thornei 18.47 5.5
Ascochyta blight 16.08 4.8
root lesion nematode neglectus 7.75 2.3
beet western yellows 5.09 1.5
Total losses from others 5.99 1.8
Total Present loss 81.07 24.0
If the current control measures were not in place, losses would be far higher. The magnitude of potential losses is shown by the loss estimates for the top five diseases when uncontrolled:
Disease $/ha $ million
Ascochyta blight 134.20 39.7
root lesion nematode thornei 59.25 17.5
Phytophthora root rot 57.76 17.1
root lesion nematode neglectus 20.06 5.9
beet western yellows 10.43 3.1
The loss estimates were derived from a national survey of the incidence and severity of 41 chickpea diseases. The information was collected from 12 of the 14 agro-ecological zones where chickpeas are grown in Australia, with the incidence and severity data in each zone supplied by nine plant pathologists familiar with the diseases. These data were combined with data on area, production and value of the crop to estimate the economic value of the losses.
Current control values have reduced the losses from these diseases considerably. Breeding, cultural measures and pesticides are generally used in conjunction, as shown by the following diseases:
About 80 per cent of chickpea crops across Australia are treated with seed or foliar fungicides, mostly for control of Ascochyta blight. Total annual cost is about $15 million or $49/ha.
DiseaseControl value
($ million)
Contribution to control ($ million) by
Breeding Cultural Pesticides
Pleiochaeta root rot 0.10 0.05 0.04 0.01
Phomopsis stem blight 0.06 0.05 0.01 0.00
Rhizoctonia bare patch 0.03 0.00 0.03 0.01
Rhizoctonia root rot 0.03 0.00 0.03 0.01
brown leaf spot 0.02 0.02 0.00 0.00
DiseaseControl value
($ million)
Contribution to control ($ million) by
Breeding Cultural PesticidesAscochyta blight 34.9 15.7 6.9 12.4
root lesion nematode thornei 12.1 10.8 1.2 0.0
Phytophthora root rot 8.9 3.6 5.3 0.0
root lesion nematode neglectus 3.6 3.2 0.5 0.0
cucumber mosaic 2.4 0.0 2.4 0.0
CuRRenT AnD PoTenTiAl CosTs fRoM DiseAses of Pulse CRoPs in AusTRAliA | 9 | GRDC
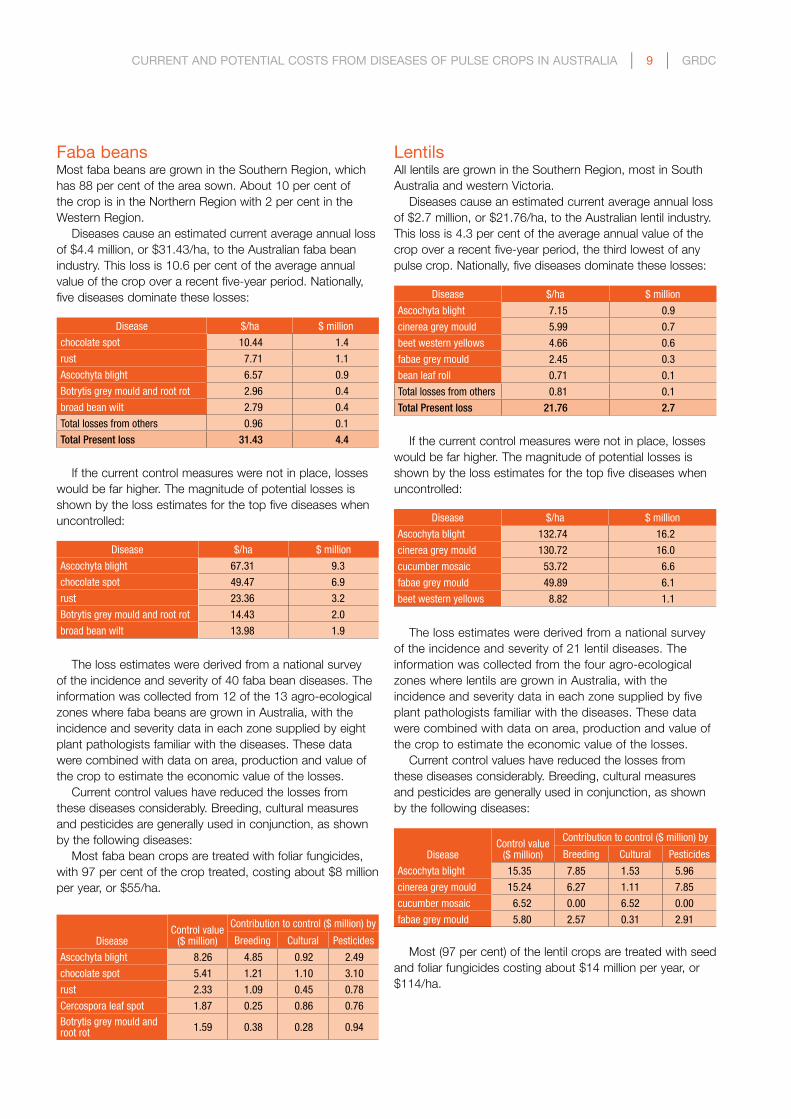
faba beansMost faba beans are grown in the Southern Region, which has 88 per cent of the area sown. About 10 per cent of the crop is in the Northern Region with 2 per cent in the Western Region.
Diseases cause an estimated current average annual loss of $4.4 million, or $31.43/ha, to the Australian faba bean industry. This loss is 10.6 per cent of the average annual value of the crop over a recent five-year period. Nationally, five diseases dominate these losses:
Disease $/ha $ million
chocolate spot 10.44 1.4
rust 7.71 1.1
Ascochyta blight 6.57 0.9
Botrytis grey mould and root rot 2.96 0.4
broad bean wilt 2.79 0.4
Total losses from others 0.96 0.1
Total Present loss 31.43 4.4
If the current control measures were not in place, losses would be far higher. The magnitude of potential losses is shown by the loss estimates for the top five diseases when uncontrolled:
Disease $/ha $ million
Ascochyta blight 67.31 9.3
chocolate spot 49.47 6.9
rust 23.36 3.2
Botrytis grey mould and root rot 14.43 2.0
broad bean wilt 13.98 1.9
The loss estimates were derived from a national survey of the incidence and severity of 40 faba bean diseases. The information was collected from 12 of the 13 agro-ecological zones where faba beans are grown in Australia, with the incidence and severity data in each zone supplied by eight plant pathologists familiar with the diseases. These data were combined with data on area, production and value of the crop to estimate the economic value of the losses.
Current control values have reduced the losses from these diseases considerably. Breeding, cultural measures and pesticides are generally used in conjunction, as shown by the following diseases:
Most faba bean crops are treated with foliar fungicides, with 97 per cent of the crop treated, costing about $8 million per year, or $55/ha.
lentilsAll lentils are grown in the Southern Region, most in South Australia and western Victoria.
Diseases cause an estimated current average annual loss of $2.7 million, or $21.76/ha, to the Australian lentil industry. This loss is 4.3 per cent of the average annual value of the crop over a recent five-year period, the third lowest of any pulse crop. Nationally, five diseases dominate these losses:
Disease $/ha $ million
Ascochyta blight 7.15 0.9
cinerea grey mould 5.99 0.7
beet western yellows 4.66 0.6
fabae grey mould 2.45 0.3
bean leaf roll 0.71 0.1
Total losses from others 0.81 0.1
Total Present loss 21.76 2.7
If the current control measures were not in place, losses would be far higher. The magnitude of potential losses is shown by the loss estimates for the top five diseases when uncontrolled:
Disease $/ha $ million
Ascochyta blight 132.74 16.2
cinerea grey mould 130.72 16.0
cucumber mosaic 53.72 6.6
fabae grey mould 49.89 6.1
beet western yellows 8.82 1.1
The loss estimates were derived from a national survey of the incidence and severity of 21 lentil diseases. The information was collected from the four agro-ecological zones where lentils are grown in Australia, with the incidence and severity data in each zone supplied by five plant pathologists familiar with the diseases. These data were combined with data on area, production and value of the crop to estimate the economic value of the losses.
Current control values have reduced the losses from these diseases considerably. Breeding, cultural measures and pesticides are generally used in conjunction, as shown by the following diseases:
DiseaseControl value
($ million)
Contribution to control ($ million) by
Breeding Cultural Pesticides
Ascochyta blight 15.35 7.85 1.53 5.96
cinerea grey mould 15.24 6.27 1.11 7.85
cucumber mosaic 6.52 0.00 6.52 0.00
fabae grey mould 5.80 2.57 0.31 2.91
Most (97 per cent) of the lentil crops are treated with seed and foliar fungicides costing about $14 million per year, or $114/ha.
DiseaseControl value
($ million)
Contribution to control ($ million) by
Breeding Cultural Pesticides
Ascochyta blight 8.26 4.85 0.92 2.49
chocolate spot 5.41 1.21 1.10 3.10
rust 2.33 1.09 0.45 0.78
Cercospora leaf spot 1.87 0.25 0.86 0.76
Botrytis grey mould and root rot 1.59 0.38 0.28 0.94

GRDC | 10 | CuRRenT AnD PoTenTiAl CosTs fRoM DiseAses of Pulse CRoPs in AusTRAliA
VetchVetch is grown in the Southern Region and concentrated in three agro-ecological zones in South Australia and western Victoria.
Diseases cause an estimated current average annual loss of $0.03 million, or $0.73/ha, to the Australian vetch industry. This loss is 0.6 per cent of the average annual value of the crop over a recent five-year period, the lowest loss to disease of any pulse crop. Nationally, five diseases dominate these losses:
Disease $/ha $ million
Phoma spot 0.39 0.02
chocolate spot (fabae) 0.32 0.01
Rhizoctonia root rot 0.01 0.00
Total losses from others 0.00 0.00
Total Present loss 0.73 0.03
If the current control measures were not in place, losses would be far higher. The magnitude of potential losses is shown by the loss estimates for the top five diseases when uncontrolled:
Disease $/ha $ million
Ascochyta blight 15.29 0.64
chocolate spot (fabae) 7.24 0.30
chocolate spot (cinerea) 5.83 0.24
rust 1.49 0.06
Phoma spot 0.70 0.03
The loss estimates were derived from a national survey of the incidence and severity of 23 vetch diseases. The information was collected from three of the five agro-ecological zones where vetch is grown in Australia, with the incidence and severity data in each zone supplied by two plant pathologists familiar with the diseases. These data were combined with data on area, production and value of the crop to estimate the economic value of the losses.
Current control values have reduced the losses from these diseases considerably. Breeding, cultural measures and pesticides are generally used in conjunction, as shown by the following diseases:
DiseaseControl value
($ million)
Contribution to control ($ million) by
Breeding Cultural Pesticides
Ascochyta blight 0.64 0.30 0.02 0.32
chocolate spot (fabae) 0.29 0.00 0.08 0.21
chocolate spot (cinerea) 0.24 0.00 0.07 0.18
rust 0.06 0.00 0.00 0.06
downy mildew 0.01 0.00 0.00 0.01
PeanutsMost peanuts are grown in the Northern Region, which has 94 per cent of the area sown. The rest are grown around Katherine in the Northern Territory, which is not in a defined agro-ecological area. Due to similarities with the Ord zone,
we have aggregated the Katherine area to the Western Region.
Diseases cause an estimated current average annual loss of $2.7 million, or $233.41/ha, to the Australian peanut industry. This loss is 28.1 per cent of the average annual value of the crop over a recent five-year period. The per area loss is the highest of any pulse crop while the loss as a proportion of crop value is the second highest of any pulse. Nationally, five diseases dominate these losses:
Disease $/ha $ million
damping off and seed aflatoxin 114.40 1.4
late leaf spot 33.82 0.4
rust 23.05 0.3
Cylindrocladium black rot 21.17 0.3
early leaf spot 10.13 0.1
Total losses from others 20.32 0.2
Total Present loss 233.41 2.7
If the current control measures were not in place, losses would be far higher. The magnitude of potential losses is shown by the loss estimates for the top five diseases when uncontrolled:
Disease $/ha $ million
damping off and seed aflatoxin 286.14 3.47
late leaf spot 264.37 3.21
rust 182.70 2.22
early leaf spot 40.50 0.49
Cylindrocladium black rot 25.43 0.31
The loss estimates were derived from a national survey of the incidence and severity of 32 peanut diseases. The information was collected from the six agro-ecological zones where peanuts are grown in Australia, with the incidence and severity data in each zone supplied by eight plant pathologists and agronomists familiar with the diseases. These data were combined with data on area, production and value of the crop to estimate the economic value of the losses.
Current control values have reduced the losses from these diseases considerably. Breeding, cultural measures and pesticides are generally used in conjunction, as shown by the following diseases:
DiseaseControl value
($ million)
Contribution to control ($ million) by
Breeding Cultural Pesticides
late leaf spot 2.80 0.37 0.96 1.47
damping off and seed aflatoxin 2.08 0.00 2.08 0.00
rust 1.94 0.33 0.65 0.96
early leaf spot 0.37 0.04 0.17 0.17
Sclerotinia blight 0.07 0.00 0.05 0.02
Most (97 per cent) of the peanut crops in the Northern Region are treated with seed and foliar fungicides costing about $2.4 million per year, or $201/ha.

CuRRenT AnD PoTenTiAl CosTs fRoM DiseAses of Pulse CRoPs in AusTRAliA | 11 | GRDC
MungbeansMost mungbeans are grown in the Northern Region, which has 90 per cent of the area sown. The rest are in the NSW Central zone of the Southern Region.
Diseases cause an estimated current average annual loss of $1.4 million, or $39.50/ha, to the Australian mungbean industry. This loss is 4.4 per cent of the average annual value of the crop over a recent five-year period. Nationally, five diseases dominate these losses:
Disease $/ha $ million
root lesion nematode thornei 19.10 0.67
halo blight 13.85 0.49
leaf scorch 4.62 0.16
charcoal rot 1.15 0.04
bacterial blight 0.58 0.02
Total losses from others 0.21 0.01
Total Present loss 39.50 1.39
For the Northern Region, the five major diseases by potential loss on a per hectare basis and their total cost to the industry are:
Disease $/ha $ million
root lesion nematode thornei 112.91 3.97
powdery mildew 23.08 0.81
halo blight 18.47 0.65
leaf scorch 9.23 0.32
charcoal rot 2.31 0.08
The loss estimates were derived from a national survey of the incidence and severity of 19 mungbean diseases. The information was collected from three of the five agro-ecological zones where mungbeans are grown in Australia, with the incidence and severity data in each zone supplied by two plant pathologists familiar with the diseases. These data were combined with data on area, production and value of the crop to estimate the economic value of the losses.
Current control values have reduced the losses from these diseases considerably. Breeding, cultural measures and pesticides are generally used in conjunction, as shown by the following diseases:
DiseaseControl value
($ million)
Contribution to control ($ million) by
Breeding Cultural Pesticides
root lesion nematode thornei 3.30 2.02 1.28 0.00
powdery mildew 0.81 0.61 0.00 0.20
halo blight 0.16 0.08 0.08 0.00
leaf scorch 0.16 0.13 0.03 0.00
charcoal rot 0.04 0.00 0.04 0.00
effect of diseases on qualitySome diseases can impact on the quality of the seed harvested by causing blemishes and reduced seed size, which can lower the value of the seed particularly for human consumption. The value of these losses were estimated where data were available.
Crop Disease
Loss ($/ha) Loss ($ million)
Potential Present Potential Present
Field peaspowdery mildew 12.26 0.50 3.71 0.15
pisi bacterial blight 0.04 0.02 0.01 0.01
Narrowleaf lupins anthracnose 2.92 0.31 1.45 0.15
Chickpeasgrey mould 1.23 0.17 0.36 0.05
Ascochyta blight 10.48 1.14 3.10 0.34
Faba beansAscochyta blight 10.91 1.64 1.51 0.23
chocolate spot 8.79 1.42 1.22 0.20
LentilsAscochyta blight 12.28 0.71 1.50 0.09
cinerea grey mould 80.83 3.55 9.88 0.43
Peanuts seed aflatoxin 179.21 71.68 2.17 0.87

GRDC | 12 | CuRRenT AnD PoTenTiAl CosTs fRoM DiseAses of Pulse CRoPs in AusTRAliA
The Grains Research and Development Corporation (GRDC) has commissioned this report based on assessment of disease losses to the Australian grains industry to assist in the allocation of resources for disease control in these pulse crops. This report, the assessment of losses to pulse crops, is the third such study. The first two studies found that losses to the Australian wheat industry averaged $913 million per year or 19.5 per cent of the value of production (Murray and Brennan 2009a, c) and $252 million per year (19.6 per cent of the value of production) to the Australian barley industry (Murray and Brennan 2009b, 2010).
This report uses the methods developed for wheat and barley (Murray and Brennan 2009a, b) to estimate the losses to the Australian pulse industries. The crops assessed in this study are field peas, narrowleaf and albus lupins, chickpeas, faba beans, lentils, vetch, peanuts and mungbeans.
The following sections of this report describe the general methodology used to make the assessments and then each chapter presents the results for each crop. Appendices provide the detailed results.
The crop sections contain:n average area, production, yield and value of the crop over
a recent five-year period;n a list of the pathogens and their diseases that were
considered;n the incidence and severity of the diseases in each
production region;n potential and present yield loss as a percentage of yield
and the value of this loss;n the value of the control of each disease; andn the present level of expenditure on fungicides on the crop
Section 12, general discussion and conclusions, follows the sections on each crop, with the final section containing the references. The appendices give detailed results for each crop.
The aim of this study was to develop estimates of the importance of diseases to pulse crops in a fully transparent manner to allow quick revision as new information becomes available. These estimates provide a benchmark to determine future changes.
This survey could not have been done without the cooperation of a large number of plant pathologists and other pulse specialists throughout Australia. We are fortunate to have these experienced people throughout the nation to support the health of Australian pulse crops. They are listed in Section 2. We thank them for their contributions. The results of this survey show the value of their work and that of their colleagues in plant breeding, agronomy, applied plant pathology and related disciplines.
The methodology follows that developed for our estimations of the losses from wheat and barley diseases (Murray and Brennan 2009a, b, c; 2010). It is based on our previous work (Brennan and Murray 1989, 1998), which in turn owes its existence to a question from Dr Howard Dengate and a book chapter by Professor John F. Brown (1975). Dr Chris Upper described the basic methodology of estimating disease importance on a whole-crop basis to Gordon Murray while he was a student at the University of Wisconsin.
The data on area, yield, production and price has been obtained from a number of sources. The GRDC and Neil Clark and Associates sourced the available data from the Australian Bureau of Statistics for the GRDC zones and regions. Gordon Cumming, Trevor Bray, Wayne Hawthorne and Alan Meldrum of Pulse Australia provided further data with additional details. Their considerable and concerted efforts to produce a consistent set of data for use in this study are very much appreciated. Pat Harden of the Peanut Company of Australia Ltd provided valuable and much-appreciated additional data for the non-GRDC zones for peanuts.
We thank the GRDC for commissioning this report and providing the funding to carry out this work.
1 inTRoDuCTionAcknowledgements

CuRRenT AnD PoTenTiAl CosTs fRoM DiseAses of Pulse CRoPs in AusTRAliA | 13 | GRDC
experimental method, it permits estimates over large areas and comparisons of the likely losses from each disease.
The key processes involved in estimating the value of loss from diseases for a crop in Australia are:1. Identification of areas within the cropping belt with similar
growing conditions (climate, soils, etc.).2. Estimation of the area, production and value of the crop
within each area relevant to the time period of the loss estimation.
3. Development of a list of the pathogens and their diseases known to occur in at least one part of Australia (estimates for the potential losses caused by exotic pathogens are not part of this study).
4. Assessment of the potential losses caused in epidemics and the frequency of epidemics.
5. Identification of the control methods used and their costs.
2.2 Geographical regions and crop production data for survey
The geographical regions used for the surveys of diseases of pulse crops are the GRDC’s agro-ecological zones, which divide the cropping belt of Australia into areas of similar climate (Figure 2.1). These zones are grouped into three production regions: the Northern Region, Southern Region and Western Region (Table 2.1).
One or more pulse crops, because of their diversity and growing requirements, occupy all of these zones. In addition, some growing areas for peanuts in the Northern Territory and coastal Queensland are not in any GRDC zone and we have recognised additional zones for these growing areas. These additional zones are defined for peanuts in the relevant section.
2.3 Climate in the pulse growing areasMurray and Brennan (2009a) examined the likelihood that changing climatic conditions brought about changes in the spectrum of wheat diseases. They found that the potential losses from several wheat diseases had changed from the previous decade (Brennan and Murray 1998) and that these changes were consistent with the observed changes in temperature and rainfall in the wheat belt.
This is the first comprehensive estimation of losses caused by pulse diseases across Australia. These estimates take into account the observed development of diseases since 2000. Earlier pulse disease estimates are not available so that possible changes in diseases due to climate change cannot be estimated in this study.
2.4 The diseases and their pathogensPathogens are the causes of disease. The extent of disease development depends on:n the host’s response to infection by the pathogen;n how favourable the seasonal conditions are;
2.1 introductionEstimates of disease losses should be fully transparent and documented; that is, the processes by which the data, assumptions and calculations are used to produce the final estimates should be clearly spelt out. This enables a critical appraisal by others and a recalculation of the estimates when new information becomes available.
James (1974) summarised two phases in disease-loss appraisal. The first is field experiments that characterise the relationship between disease and yield loss so that loss can be reliably estimated over a range of conditions. The second phase is assessment of disease with surveys over a number of fields. This phase requires considerable resources to provide information over a large area and over time.
Our early discussions with pulse pathologists showed that only limited work has been done on the two phases, so that the experiments and observations required to satisfy James (1974) are not available for many of the recorded diseases of pulse crops in Australia. We have collected the available information, much of which are preliminary estimates based on limited field surveys. When detailed data is not available, Zadoks and Schein (1979) have argued that it is necessary to use the estimates of experts who “have built up enough experience to have some feeling for the effects of injuries and the resulting damages to the crop”.
Brennan and Murray (1989, 1998) and Dubin and Van Ginkel (1990) used such surveys to capture the opinions of experts in the field to estimate losses from wheat diseases over national and international crop areas. Murray and Brennan (2009 a, b, c; 2010) developed the method further to produce estimates of losses to wheat and barley in Australia. Although this approach lacks the high precision of the detailed
2 MeThoD
WA Northern
WA OrdQld Atherton
Qld Burdekin
WA Eastern
WA CentralWA Sandplain-Mallee
SA-Vic Mallee
WA MalleeSA Mid-North/Lower Yorke, Eyre
SA-Vic Bordertown-Wimmera
Tas Grain
Vic High Rainfall
NSW-VicSlopes
NSW NW/Qld SW
NSW Central
NSW NE/Qld SE
Qld Central
Figure 2.1 Agro-ecological zones of the Australian cropping belt
GRDC | 14 | CuRRenT AnD PoTenTiAl CosTs fRoM DiseAses of Pulse CRoPs in AusTRAliA
n overall climate and soil; andn the management of the cropping system.
This report deals with the losses caused by the diseases. However, because a disease may be called by different names, the name of the pathogen as well as the disease is given in the tables listing the diseases of each crop in the following sections.
The pathogens included in this study have caused losses or have been of interest in one or more of the agro-ecological zones in Australia where pulse crops are grown. The tables for each crop are not complete lists of all pulse pathogens recorded in Australia. Similarly, the tables do not include pathogens not yet recorded in Australia. Respondents to the survey recorded whether the pathogen was present in the zone and if present, provided the incidence and loss estimates.
The names of the pathogens and their diseases used in this report are those generally accepted by taxonomists, plant pathologists and the farming industry in Australia. Where several pathogens cause diseases with the same common name, as occurs with the root lesion nematodes, we have added the species name of the nematode for clarity.
Most of the pathogens are widely distributed throughout the pulse growing areas of Australia. However, the frequency and the damage caused varies between zones and regions since pathogens can be present in an area without causing significant disease. This report seeks to estimate these frequencies and losses under the present growing conditions.
The pathogens are grouped by the part of the plant affected by fungi, and then as nematodes, bacteria and viruses in the tables for each pulse crop.
2.5 Potential and present disease losses2.5.1 incidence and severity of diseaseAverage loss in a zone is determined by the incidence and the severity of a disease. Incidence is the frequency with which environmental conditions enable the disease to reach its maximum severity in that zone. Severity is the level of damage caused when the environmental conditions are favourable for that development. Often, only a proportion of the crop grown in a paddock will be affected in an outbreak.
Incidence as used in this report has two components: the frequency of years that favour development of the disease to damaging levels, and the proportion of the crop area affected in such a favourable year. Frequency of years is expressed as a percentage of years. The proportion of the crop area is that area of the zone where the disease develops in years favourable for it, expressed as a percentage of the pulse crop area in the zone.
This survey assessed both potential severity, which is the severity reached in the absence of present controls, and present severity, which is the severity that occurs with the current control methods of resistant varieties, cultural methods and pesticides. The difference between potential and present severity is a measure of the effectiveness of current controls.
Severity is the loss caused by the disease in a year favourable for its development, assessed on a per paddock basis. It is expressed as a percentage of yield in the absence of disease.
Survey respondents were asked to consider the seasons since 2000 for incidence and severity so that the estimations would reflect current conditions.
2.5.2 estimating average yield lossThis use of incidence and severity means that the following assessments can be made. For a foliar fungal disease, for example, severe disease may develop in wet springs that occur in 40 per cent of years, affecting early sown crops that are 25 per cent of the crop area. Thus, incidence is 40 per cent frequency in 25 per cent of the area, so that the average incidence of the disease affecting the crop is 10 per cent. When severe, loss on a susceptible variety may be 40 per cent while current loss on resistant varieties grown is 5 per cent. Thus, potential severity is 40 per cent while current severity is 5 per cent. The average potential yield loss is (10 per cent incidence × 40 per cent severity) or 4 per cent, while average present yield loss is 0.5 per cent (10 per cent × 5 per cent).
For the example of a root disease, severe disease may develop following wet winters, which occur in 25 per cent of years, affecting early sown crops, once again occupying 25 per cent of the crop area. Average incidence is thus 25 per cent frequency in 25 per cent of the area (6.25 per cent). When severe, loss occurs in patches in the crop, with say 25 per cent of the paddock having patches where the loss is 80 per cent. In this case, severity in affected paddocks would be 20 per cent (25 per cent × 80 per cent). Thus, the average potential yield loss would be 1.25 per cent (6.25 per cent × 20 per cent).
2.5.3 effects of quality lossSome pathogens will reduce grain quality and yield. Blemishes on some pulse seeds can reduce the quality from human consumption grade to stockfeed, with a large reduction in value. Other blemishes or the presence of potentially toxic substances produced by some pulse pathogens can further reduce the value of the grain. This estimated loss in quality and value was based on advice from Pulse Australia, who provided the basis for estimates of expected current losses from quality from diseases for the pulse crops (Appendix D). The potential costs of quality effects of these diseases were then determined by using the ratio of potential severity to present severity. More details of the effects of diseases on market value are given in the sections dealing with the individual pulse crops.
2.6 Control methodsThree broad categories of controls are available for pulse diseases:n breeding (resistant cultivars);n cultural practices including stubble management, tillage
and crop rotations; and

CuRRenT AnD PoTenTiAl CosTs fRoM DiseAses of Pulse CRoPs in AusTRAliA | 15 | GRDC
Table 2.1 Respondents to the survey of incidence, severity and control measures for diseases of pulse crops for each agro-ecological zone
Crop ContributorQu
eens
land
Bur
deki
n
Quee
nsla
nd A
ther
ton
Quee
nsla
nd C
entra
l
NSW
NE/
Quee
nsla
nd S
E
NSW
NW
/Que
ensl
and
SW
NSW
Cen
tral
NSW
Vic
toria
n Sl
opes
Vict
oria
n Hi
gh R
ainf
all
SA V
icto
rian
Mal
lee
SA V
ic B
orde
r Wim
mer
a
SA M
N/L
Yor
ke, E
yre
Tasm
ania
WA
North
ern
WA
Cent
ral
WA
East
ern
WA
Sand
plai
n M
alle
e
WA
Ord
NT C
entra
l (Ka
ther
ine)
Quee
nsla
nd S
outh
Coa
st
Field peas Jenny Davidson X X X
Geoff Dean X
Angela Freeman X X
Rohan Kimber X X X
Kurt Lindbeck X X X X X
Bill Macleod X X
Helen Richardson X X X
Joop van Leur X XNarrowleaf lupins Jenny Davidson X
Geoff Dean X
Rohan Kimber X
Kurt Lindbeck X X X X X
Bill Macleod X X X XAlbus lupins Geoff Dean X
Kurt Lindbeck X X X X XChickpeas Jenny Davidson X X X
Angela Freeman X X
Rohan Kimber X X X
Kurt Lindbeck X X X X
Bill Macleod X X X
Kevin Moore X X X X
Kirsty Owen X X X
Helen Richardson X X X
Malcolm Ryley X X XFaba beans Jenny Davidson X X
Geoff Dean X
Angela Freeman X X
Rohan Kimber X X X
Kurt Lindbeck X X X X X
Bill Macleod X X X
Helen Richardson X X X
Joop van Leur X XLentils Jenny Davidson X X
Angela Freeman X X
Rohan Kimber X X
Kurt Lindbeck X X X
Helen Richardson X XVetch Jenny Davidson X X X
Rohan Kimber X X XPeanuts Dennis Persley X X X X X X
Malcolm Ryley X X X X X X
Murray Sharman X X X X X X
Graham Stirling X
Jeff Tatnell X X X X X X
John Thomas X X X X X X
Peter Trevorrow X X X X X X
Graeme Wright X X X X X XMungbeans Kirsty Owen X X X
Malcolm Ryley X

GRDC | 16 | CuRRenT AnD PoTenTiAl CosTs fRoM DiseAses of Pulse CRoPs in AusTRAliA
n pesticides (fungicides applied as seed treatments, in-furrow and foliar sprays, and insecticides/miticides for vector control).Survey respondents were asked to estimate the
proportion of the current level of control for each category, with the total being 100 per cent of the control achieved. This enabled a broad estimate to be made of the value of each form of control.
For the pesticides category, the survey sought information on what proportion of the crop in each zone was treated with the various types of application methods, such as seed treatments, soil application and foliar sprays. The survey also recorded the costs per hectare of each of the controls applied, to enable estimates of the average total costs of pesticides applied to each crop.
2.7 surveyThe data were collected from plant pathologists and other researchers familiar with pulse diseases in each agro-ecological zone. The respondents are listed in Table 2.1. The responses were collated, checked for consistency and returned to the survey respondents for final checking if required. The results were tabulated for agro-ecological zones and form the base data for calculating the costs of diseases.
2.8 Calculating disease costsIn a production environment where a disease causes yield losses in the presence of current controls, there is an implied (higher) yield that would occur if that disease were fully controlled. From the observed current yield (with the disease) and the estimated yield reduction that has occurred, we can estimate the without-disease yield, and from that calculate the size and value of the losses occurring. The method used to estimate the size of the potential and current yield losses and the associated value of those losses is in Murray and Brennan (2009a).
The method used for calculating the value of the quality losses from pulse diseases is broadly based on that outlined for wheat (Murray and Brennan 2009a). Once the losses from yield and quality have been estimated on a per hectare basis, they are converted to aggregate losses in each zone by relating the per hectare losses to the number of hectares of the pulse in each zone. Both the potential and the present losses are average annual losses.
As in Murray and Brennan (2009a), the value of the current control measures is the difference between the outcome if there were no controls and the outcome with current controls in place. The value of the controls across a production zone is converted to a per hectare basis by dividing by the number of hectares in the zone.
Implicit in these estimations is the assumption that there is no interaction between diseases. However, if all diseases developed and were uncontrolled, there would be significant interaction between them. The first to develop would be expected to have a greater effect on yield than subsequent diseases. Thus, the estimates of potential losses assume
that for each disease, it is the only one that develops. Therefore, it is not appropriate to sum the total potential loss over all diseases.
For current losses, there would be far less interaction between diseases at those levels. In this case, we have assumed that it is possible to sum total present disease losses.
2.9 use of pesticides for control of pulse diseases
Fungicides are commonly applied to pulse crops to control foliar diseases. However, little information is available publicly on the cost to farmers of those applications. Murray and Brennan (2009a, b) found that the cost of fungicide applications to wheat and barley crops was $154 million per year ($12.89/ha) and $33 million ($8.81/ha), respectively.
The present study collected information that enabled estimates of the aggregate expenditure on different forms of fungicides for pulse disease control in Australia. While not a precise estimate, these figures provide a broad indication of the mix of fungicides used for disease controls in pulse crops, and broad estimates of the amounts spent each year by farmers in controlling fungal diseases in pulses.
Fungicides are applied to pulse crops in two ways: (a) as seed treatments; and (b) as foliar sprays to growing crops. They can be applied separately or in combination. In addition, pesticides can be applied to control vectors, for example as aphicides for control of virus transmission.
Survey respondents were asked to identify the percentage of each crop that received some form of pesticide/fungicide treatment and the estimated cost ($/ha) of each treatment. In addition, respondents were asked to estimate the percentage of the crop area that received no fungicide. Where precise data were not available, respondents were asked to provide their best estimates, after consultation with others as necessary. Where costings were not available from the respondent, we used values from advisory information or assumed that these costs would be the same as those in neighbouring zones. From these data, the total expenditure in each agro-ecological zone was calculated, and then aggregated to the three major production regions.

CuRRenT AnD PoTenTiAl CosTs fRoM DiseAses of Pulse CRoPs in AusTRAliA | 17 | GRDC
3.1 introductionField peas (Pisum sativum) are grown in the winter cropping areas of Australia in each of the three GRDC production regions. The crop is sown from late autumn to mid (late) winter and harvested in late spring. Some field peas are grown for human consumption which have higher quality standards. The majority of the crop is used for stockfeed.
This section contains:n average area, production, yield and value of field peas
over a recent five-year period;n a list of the diseases of field peas that were considered;n the incidence and severity of the diseases in each
production area;n the potential and present yield loss as a percentage of
yield, effect on quality and the value of this loss;n overall control methods and their value for each disease;
andn the present level of expenditure on fungicides on the crop.
3.2 field pea productionEstimation of the value of disease losses depends on base data on the area, yield and value of the crop. The production data for field peas are for the year 2008-09. The average data for the five years ending in that year were calculated as representative of current production. Field pea production data were obtained from Pulse Australia.
The average area, yield, production and value of field peas in each agro-ecological zone are shown in Table 3.1 (see Appendix A for more details). The average annual area of field peas sown in Australia was 303,000 hectares producing an average of 301,000 tonnes, with an overall average yield of 0.99t/ha.
The mean unit value of field peas over the five-year period was $260/t, giving an average gross value of production of $78.2 million per year.
Field pea production was mostly in the Southern Region (79 per cent of the crop area), with 21 per cent in the Western Region and none in the Northern Region.
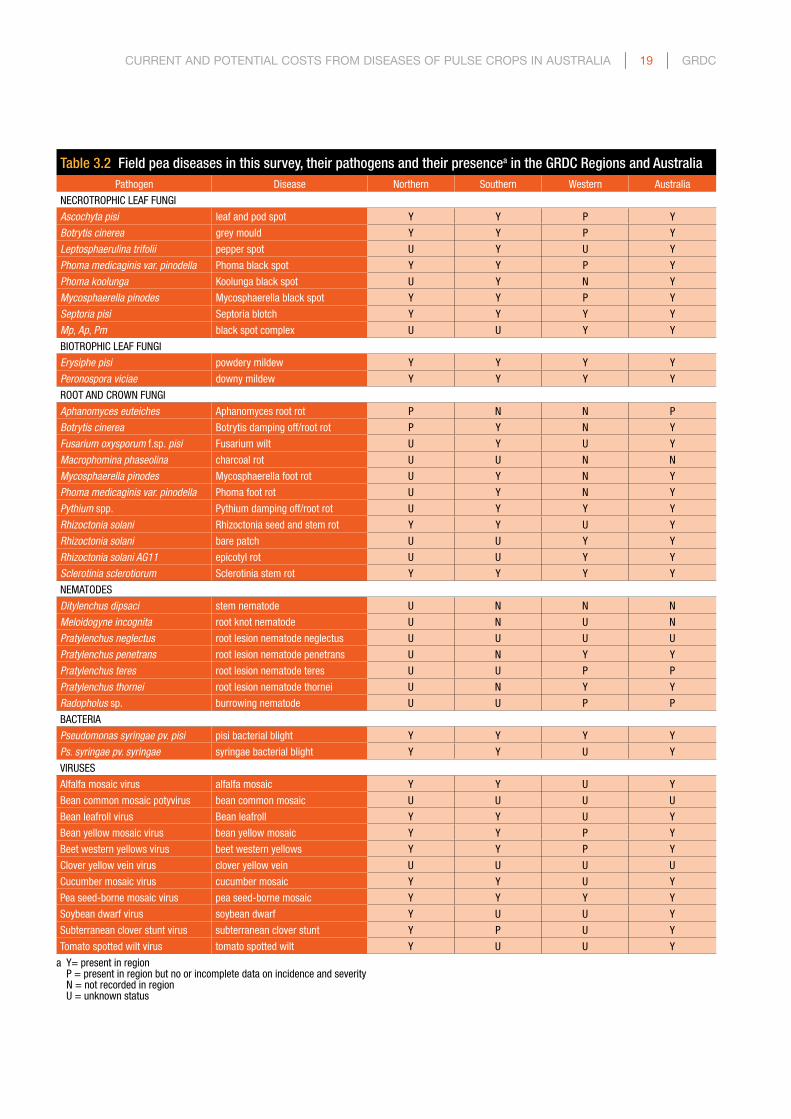
3.3 Diseases of field peas3.3.1 field pea diseases and their pathogensThere were 40 diseases of field peas considered in this survey, comprising seven necrotrophic leaf fungal diseases, two biotrophic leaf diseases, 11 root and crown fungal diseases, seven nematode diseases, two bacterial diseases and 11 viral diseases (Table 3.2). Phoma black spot and Mycosphaerella black spot are difficult to distinguish in the field so these were combined in the Western Region as ‘black spot complex’, so that 39 diseases were considered for that region. Three different anastomosis groups of Rhizoctonia solani cause different root and crown diseases.
The field pea diseases were caused by 16 fungi (three fungi cause both aerial stem diseases and root rots), seven nematodes, two bacteria and 11 viruses. No phytoplasma diseases were included.
As several species of Pratylenchus nematodes attack crops and pastures, the species names were added to the common name “root lesion nematode” for clarity.
Data on disease incidence, severity and control measures were obtained for all zones in the Northern and Southern regions and from two of the four zones in the Western Region where field peas are grown (Table 3.1). Data were not available for the WA Northern and WA Eastern Zones, which had 4.8 and 71.4 per cent of the Western Region pea areas, respectively. We assumed that the disease estimates for the WA Northern Zone would be as for the WA Central Zone and those for the WA Eastern Zone would be as for the WA Sandplain-Mallee Zone. Disease information and the respondents for each zone are in Appendix B.
3 CuRRenT AnD PoTenTiAl losses fRoM DiseAses of fielD PeAs
Table 3.1 Mean field pea area, yield, production and value by agro-ecological zone and GRDC region, 2004-05 to 2008-09
Area(‘000 ha)
Yield(t/ha)
Production(‘000 t)
Gross value
($ million)
Queensland Burdekin 0.0 0.00 0.0 0.0
Queensland Atherton 0.0 0.00 0.0 0.0
Queensland Central 0.0 0.00 0.0 0.0
NSW North-East/ Queensland South-East* 0.0 1.00 0.0 0.0
NSW North-West/ Queensland South-West* 0.0 1.00 0.0 0.0
TOTAL NORTHERN REGION 0.0 1.00 0.0 0.0
NSW Central* 6.1 0.99 6.0 1.6
NSW-Victoria Slopes* 45.4 0.79 36.1 9.4
Victoria High Rainfall* 15.1 1.19 18.0 4.7
SA-Victoria Mallee* 36.3 0.99 36.1 9.4
SA-Victoria Border-Wimmera* 30.3 1.09 33.1 8.6
SA Mid-North/Lower Yorke, Eyre* 106.0 1.02 108.2 28.1
Tasmania Grain Growing* 0.0 1.00 0.0 0.0
TOTAL SOUTHERN REGION 239.3 0.99 237.5 61.8
WA Northern 3.0 0.99 3.0 0.8
WA Central* 3.0 0.99 3.0 0.8
WA Eastern 45.4 0.99 45.1 11.7
WA Sandplain-Mallee* 12.1 0.99 12.0 3.1
WA Ord 0.0 0.00 0.0 0.0
Northern Territory Central (Katherine) 0.0 0.00 0.0 0.0
TOTAL WESTERN REGION 63.6 0.99 63.1 16.4
TOTAL AUSTRALIA 302.9 0.99 300.7 78.2* Disease data obtained for this zone

GRDC | 18 | CuRRenT AnD PoTenTiAl CosTs fRoM DiseAses of Pulse CRoPs in AusTRAliA
3.3.2 Distribution of the pathogens in AustraliaFive of the seven necrotrophic leaf fungal diseases were present in all regions while the status of pepper spot and Koolunga black spot was unknown in the Northern and Western Regions (Table 3.2). The known distribution of Koolunga black spot was limited to three zones in the Southern Region: South Australia–Victoria Mallee, South Australia–Victoria Border Wimmera and South Australia Mid-North/Lower Yorke, Eyre Zones (Appendix B). Both biotrophic leaf diseases were present in the three regions.
Of the 11 root and crown fungal diseases, only Sclerotinia stem rot was present in all regions. Four were present in the Northern Region, seven in the Southern Region and four in the Western Region. Charcoal rot was not reported on field peas from any region.
Although the seven nematodes occur on other plants, their status on field peas is either unknown or not present in the eastern regions. Four were reported as present on field peas in the Western Region.
Both bacterial diseases are present in the eastern regions while only pisi bacterial blight was reported from the Western Region. The two bacterial blights can only be distinguished by laboratory identification of the pathogens.
Of the 11 viral diseases, three were reported on field peas in each region. Nine were present on field peas in the Northern Region, seven in the Southern Region and three in the Western Region (Table 3.2).
3.4 incidence and severity of field pea diseases
3.4.1 incidence of field pea diseasesIncidence was assessed as the proportion of years that favoured development of the disease in each zone, and as the proportion of the crop area in the zone affected when the disease developed. These values were averaged for the region and Australia by weighting by the area sown to the crop in each zone for which disease data were available, and are shown in Table 3.3.
For Australia, there were eight diseases that occurred with a yearly incidence of 25 per cent or greater. The black spot group of Phoma, Koolunga and Mycosphaerella black spots occurred at the highest annual incidence followed by pea seed-borne mosaic, Septoria blotch and pepper spot. Eight diseases occurred over 25 per cent of the crop area in years favourable for their development: pepper spot was the highest followed by the black spot group, powdery mildew, downy mildew, pea seed-borne mosaic and Septoria blotch.
Within the Northern Region, there were seven diseases that occurred with a yearly incidence of 25 per cent or greater. Rhizoctonia seed and stem rot, Sclerotinia stem rot and pea seed-borne mosaic occurred every year with powdery mildew the next most common followed by bean leafroll. Five diseases occurred over 25 per cent of the crop area in years favourable for their development: powdery mildew and pea seed-borne mosaic occurred over the whole area followed by bean leafroll, beet western yellows and soybean dwarf.
Within the Southern Region, there were nine diseases that occurred with a yearly incidence of 25 per cent or greater. Phoma and Mycosphaerella black spots occurred in 85 per cent of years with Koolunga black spot the next most common, followed by pepper spot and pea seed-borne mosaic. Eight diseases occurred over 25 per cent of the crop area in years favourable for their development: pepper spot occurred most widely (72 per cent of the area) followed by Phoma black spot, Mycosphaerella black spot, powdery mildew and Koolunga black spot.
Within the Western Region, there were eight diseases that occurred with a yearly incidence of 25 per cent or greater. Septoria blotch, the black spot complex, downy mildew, bare patch and root lesion nematode penetrans occurred in all years. Six diseases occurred over 25 per cent of the crop area in years favourable for their development: the highest was the black spot complex occurring over the entire area followed by pea seed-borne mosaic, downy mildew, Septoria blotch and bare patch.
3.4.2 severity of field pea diseasesSeverity was assessed as the percentage yield loss that occurred in affected crops in the zone in years favourable for development of the disease. Two assessments were made. The first was the potential severity, that is, the severity that would occur if current controls were not applied. The second was the present severity with current controls in place. These assessments were made at the zone level and aggregated to the region by weighting by area sown as in 3.4.1 (Table 3.4).
For Australia, 13 diseases have the potential to cause 10 per cent or more yield loss in years when they developed. The highest is syringae bacterial blight (over 35 per cent) followed by Mycosphaerella black spot, Koolunga black spot, downy mildew, pisi bacterial blight and powdery mildew. The two bacterial blights have a present loss of more than 10 per cent or more.
In the Northern Region, 11 diseases have the potential to cause 10 per cent or more yield loss in years when they developed. Bean leafroll and cucumber mosaic have the highest potential severity of 100 per cent yield loss followed by powdery mildew, Rhizoctonia seed and stem rot, Sclerotinia stem rot and soybean dwarf. Only one disease, bean leafroll, has a present severity of more than 10 per cent.
In the Southern Region, 11 diseases have potential yield losses of more than 10 per cent in years when they developed. The highest was syringae bacterial blight has the highest with 45 per cent yield loss followed by Mycosphaerella black spot, Koolunga black spot, downy mildew and pisi bacterial blight. Four diseases have a present severity of more than 10 per cent yield loss: syringae bacterial blight, pisi bacterial blight, Mycosphaerella black spot and Koolunga black spot.
In the Western Region, five diseases have potential yield losses of more than 10 per cent in years when they developed: black spot complex (100 per cent), pea seed-borne mosaic, root lesion nematode penetrans, downy
CuRRenT AnD PoTenTiAl CosTs fRoM DiseAses of Pulse CRoPs in AusTRAliA | 19 | GRDC
Table 3.2 Field pea diseases in this survey, their pathogens and their presencea in the GRDC Regions and AustraliaPathogen Disease Northern Southern Western Australia
NECROTROPHIC LEAF FUNGI
Ascochyta pisi leaf and pod spot Y Y P Y
Botrytis cinerea grey mould Y Y P Y
Leptosphaerulina trifolii pepper spot U Y U Y
Phoma medicaginis var. pinodella Phoma black spot Y Y P Y
Phoma koolunga Koolunga black spot U Y N Y
Mycosphaerella pinodes Mycosphaerella black spot Y Y P Y
Septoria pisi Septoria blotch Y Y Y Y
Mp, Ap, Pm black spot complex U U Y Y
BIOTROPHIC LEAF FUNGI
Erysiphe pisi powdery mildew Y Y Y Y
Peronospora viciae downy mildew Y Y Y Y
ROOT AND CROWN FUNGI
Aphanomyces euteiches Aphanomyces root rot P N N P
Botrytis cinerea Botrytis damping off/root rot P Y N Y
Fusarium oxysporum f.sp. pisi Fusarium wilt U Y U Y
Macrophomina phaseolina charcoal rot U U N N
Mycosphaerella pinodes Mycosphaerella foot rot U Y N Y
Phoma medicaginis var. pinodella Phoma foot rot U Y N Y
Pythium spp. Pythium damping off/root rot U Y Y Y
Rhizoctonia solani Rhizoctonia seed and stem rot Y Y U Y
Rhizoctonia solani bare patch U U Y Y
Rhizoctonia solani AG11 epicotyl rot U U Y Y
Sclerotinia sclerotiorum Sclerotinia stem rot Y Y Y Y
NEMATODES
Ditylenchus dipsaci stem nematode U N N N
Meloidogyne incognita root knot nematode U N U N
Pratylenchus neglectus root lesion nematode neglectus U U U U
Pratylenchus penetrans root lesion nematode penetrans U N Y Y
Pratylenchus teres root lesion nematode teres U U P P
Pratylenchus thornei root lesion nematode thornei U N Y Y
Radopholus sp. burrowing nematode U U P P
BACTERIA
Pseudomonas syringae pv. pisi pisi bacterial blight Y Y Y Y
Ps. syringae pv. syringae syringae bacterial blight Y Y U Y
VIRUSES
Alfalfa mosaic virus alfalfa mosaic Y Y U Y
Bean common mosaic potyvirus bean common mosaic U U U U
Bean leafroll virus Bean leafroll Y Y U Y
Bean yellow mosaic virus bean yellow mosaic Y Y P Y
Beet western yellows virus beet western yellows Y Y P Y
Clover yellow vein virus clover yellow vein U U U U
Cucumber mosaic virus cucumber mosaic Y Y U Y
Pea seed-borne mosaic virus pea seed-borne mosaic Y Y Y Y
Soybean dwarf virus soybean dwarf Y U U Y
Subterranean clover stunt virus subterranean clover stunt Y P U Y
Tomato spotted wilt virus tomato spotted wilt Y U U Y
a Y= present in region P = present in region but no or incomplete data on incidence and severity N = not recorded in region U = unknown status
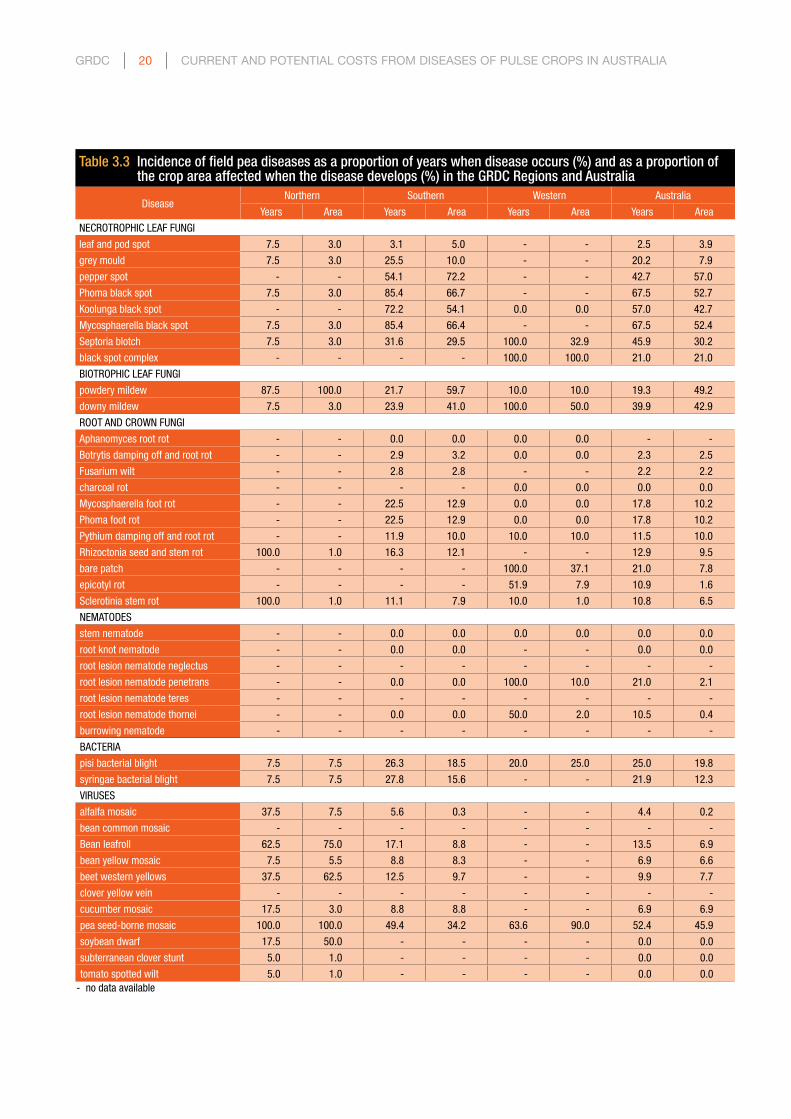
GRDC | 20 | CuRRenT AnD PoTenTiAl CosTs fRoM DiseAses of Pulse CRoPs in AusTRAliA
Table 3.3 Incidence of field pea diseases as a proportion of years when disease occurs (%) and as a proportion of the crop area affected when the disease develops (%) in the GRDC Regions and Australia
DiseaseNorthern Southern Western Australia
Years Area Years Area Years Area Years Area
NECROTROPHIC LEAF FUNGI
leaf and pod spot 7.5 3.0 3.1 5.0 - - 2.5 3.9
grey mould 7.5 3.0 25.5 10.0 - - 20.2 7.9
pepper spot - - 54.1 72.2 - - 42.7 57.0
Phoma black spot 7.5 3.0 85.4 66.7 - - 67.5 52.7
Koolunga black spot - - 72.2 54.1 0.0 0.0 57.0 42.7
Mycosphaerella black spot 7.5 3.0 85.4 66.4 - - 67.5 52.4
Septoria blotch 7.5 3.0 31.6 29.5 100.0 32.9 45.9 30.2
black spot complex - - - - 100.0 100.0 21.0 21.0
BIOTROPHIC LEAF FUNGI
powdery mildew 87.5 100.0 21.7 59.7 10.0 10.0 19.3 49.2
downy mildew 7.5 3.0 23.9 41.0 100.0 50.0 39.9 42.9
ROOT AND CROWN FUNGI
Aphanomyces root rot - - 0.0 0.0 0.0 0.0 - -
Botrytis damping off and root rot - - 2.9 3.2 0.0 0.0 2.3 2.5
Fusarium wilt - - 2.8 2.8 - - 2.2 2.2
charcoal rot - - - - 0.0 0.0 0.0 0.0
Mycosphaerella foot rot - - 22.5 12.9 0.0 0.0 17.8 10.2
Phoma foot rot - - 22.5 12.9 0.0 0.0 17.8 10.2
Pythium damping off and root rot - - 11.9 10.0 10.0 10.0 11.5 10.0
Rhizoctonia seed and stem rot 100.0 1.0 16.3 12.1 - - 12.9 9.5
bare patch - - - - 100.0 37.1 21.0 7.8
epicotyl rot - - - - 51.9 7.9 10.9 1.6
Sclerotinia stem rot 100.0 1.0 11.1 7.9 10.0 1.0 10.8 6.5
NEMATODES
stem nematode - - 0.0 0.0 0.0 0.0 0.0 0.0
root knot nematode - - 0.0 0.0 - - 0.0 0.0
root lesion nematode neglectus - - - - - - - -
root lesion nematode penetrans - - 0.0 0.0 100.0 10.0 21.0 2.1
root lesion nematode teres - - - - - - - -
root lesion nematode thornei - - 0.0 0.0 50.0 2.0 10.5 0.4
burrowing nematode - - - - - - - -
BACTERIA
pisi bacterial blight 7.5 7.5 26.3 18.5 20.0 25.0 25.0 19.8
syringae bacterial blight 7.5 7.5 27.8 15.6 - - 21.9 12.3
VIRUSES
alfalfa mosaic 37.5 7.5 5.6 0.3 - - 4.4 0.2
bean common mosaic - - - - - - - -
Bean leafroll 62.5 75.0 17.1 8.8 - - 13.5 6.9
bean yellow mosaic 7.5 5.5 8.8 8.3 - - 6.9 6.6
beet western yellows 37.5 62.5 12.5 9.7 - - 9.9 7.7
clover yellow vein - - - - - - - -
cucumber mosaic 17.5 3.0 8.8 8.8 - - 6.9 6.9
pea seed-borne mosaic 100.0 100.0 49.4 34.2 63.6 90.0 52.4 45.9
soybean dwarf 17.5 50.0 - - - - 0.0 0.0
subterranean clover stunt 5.0 1.0 - - - - 0.0 0.0
tomato spotted wilt 5.0 1.0 - - - - 0.0 0.0- no data available

CuRRenT AnD PoTenTiAl CosTs fRoM DiseAses of Pulse CRoPs in AusTRAliA | 21 | GRDC
Table 3.4 Potential and present severity of field pea diseases (% yield loss in years suitable for disease development) in the GRDC Regions and Australia
DiseaseNorthern Southern Western Australia
Potential Present Potential Present Potential Present Potential Present
NECROTROPHIC LEAF FUNGI
leaf and pod spot 7.5 0.0 3.3 0.0 - - 2.6 0.0
grey mould 7.5 0.0 5.5 0.0 - - 4.4 0.0
pepper spot - - 0.7 0.0 - - 0.6 0.0
Phoma black spot 7.5 0.0 21.0 9.6 - - 16.6 7.6
Koolunga black spot - - 36.1 10.8 0.0 0.0 28.5 8.5
Mycosphaerella black spot 7.5 0.0 40.3 12.5 - - 31.8 9.9
Septoria blotch 7.5 0.0 9.7 3.3 5.0 3.0 8.7 3.2
black spot complex - - - - 100.0 30.0 21.0 6.3
BIOTROPHIC LEAF FUNGI
powdery mildew 80.0 0.0 21.4 0.0 2.0 2.0 17.3 0.4
downy mildew 5.0 0.0 30.9 0.0 15.0 15.0 27.6 3.1
ROOT AND CROWN FUNGI
Aphanomyces root rot - - 0.0 0.0 0.0 0.0 - -
Botrytis damping off and root rot - - 4.8 0.0 0.0 0.0 3.8 0.0
Fusarium wilt - - 4.8 2.0 - - 3.8 1.6
charcoal rot - - - - 0.0 0.0 0.0 0.0
Mycosphaerella foot rot - - 15.4 7.5 0.0 0.0 12.2 5.9
Phoma foot rot - - 14.0 7.5 0.0 0.0 11.0 5.9
Pythium damping off and root rot - - 15.4 6.1 3.0 3.0 12.8 5.4
Rhizoctonia seed and stem rot 50.0 1.0 17.7 5.0 - - 14.0 3.9
bare patch - - - - 14.0 6.5 2.9 1.4
epicotyl rot - - - - 2.0 2.0 0.4 0.4
Sclerotinia stem rot 50.0 1.0 7.1 3.5 1.8 1.8 6.0 3.1
NEMATODES
stem nematode - - 0.0 0.0 0.0 0.0 0.0 0.0
root knot nematode - - 0.0 0.0 - - 0.0 0.0
root lesion nematode neglectus - - - - - - - -
root lesion nematode penetrans - - 0.0 0.0 30.0 5.0 6.3 1.0
root lesion nematode teres - - - - - - - -
root lesion nematode thornei - - 0.0 0.0 1.0 1.0 0.2 0.2
burrowing nematode - - - - - - - -
BACTERIA
pisi bacterial blight 12.5 1.0 30.8 13.8 2.0 2.0 24.8 11.3
syringae bacterial blight 12.5 1.0 45.4 15.3 - - 35.8 12.0
VIRUSES
alfalfa mosaic 20.0 5.0 0.0 0.0 - - 0.0 0.0
bean common mosaic - - - - - - - -
Bean leafroll 100.0 20.0 2.4 1.9 - - 1.9 1.5
bean yellow mosaic 10.0 0.0 2.0 1.9 - - 1.6 1.5
beet western yellows 0.0 0.0 2.4 1.9 - - 1.9 1.5
clover yellow vein - - - - - - - -
cucumber mosaic 100.0 5.0 2.0 0.0 - - 1.6 0.0
pea seed-borne mosaic 30.0 0.0 6.8 0.0 41.7 4.6 14.1 1.0
soybean dwarf 50.0 1.0 - - - - 0.0 0.0
subterranean clover stunt 0.0 0.0 - - - - 0.0 0.0
tomato spotted wilt 0.0 0.0 - - - - 0.0 0.0- no data available

GRDC | 22 | CuRRenT AnD PoTenTiAl CosTs fRoM DiseAses of Pulse CRoPs in AusTRAliA
Table 3.5 Potential and present average annual yield losses (%) from field pea diseases by GRDC Regions and Australia
DiseaseNorthern Southern Western Australia
Potential Present Potential Present Potential Present Potential Present
NECROTROPHIC LEAF FUNGI
leaf and pod spot 0.0 0.0 0.0 0.0 - - 0.0 0.0
grey mould 0.0 0.0 0.1 0.0 - - 0.1 0.0
pepper spot - - 0.5 0.0 - - 0.4 0.0
Phoma black spot 0.0 0.0 11.8 6.2 - - 9.3 4.9
Koolunga black spot - - 27.1 8.1 0.0 0.0 21.4 6.4
Mycosphaerella black spot 0.0 0.0 28.7 8.8 - - 22.7 6.9
Septoria blotch 0.0 0.0 1.0 0.4 1.6 1.0 1.1 0.5
black spot complex - - - - 100.0 30.0 21.0 6.3
SUB TOTAL 0.0 23.4 31.0 25.0
BIOTROPHIC LEAF FUNGI
powdery mildew 70.0 0.0 4.6 0.0 0.0 0.0 3.6 0.0
downy mildew 0.0 0.0 4.5 0.0 7.5 7.5 5.1 1.6
SUB TOTAL 0.0 0.0 7.5 1.6
ROOT AND CROWN FUNGI
Aphanomyces root rot - - 0.0 0.0 0.0 0.0 - -
Botrytis damping off and root rot - - 0.0 0.0 0.0 0.0 0.0 0.0
Fusarium wilt - - 0.0 0.0 - - 0.0 0.0
charcoal rot - - - - 0.0 0.0 0.0 0.0
Mycosphaerella foot rot - - 0.5 0.2 0.0 0.0 0.4 0.2
Phoma foot rot - - 0.4 0.2 0.0 0.0 0.3 0.2
Pythium damping off and root rot - - 0.2 0.1 0.0 0.0 0.1 0.1
Rhizoctonia seed and stem rot 0.5 0.0 0.4 0.1 - - 0.3 0.1
bare patch - - - - 5.5 2.6 1.1 0.5
epicotyl rot - - - - 0.1 0.1 0.0 0.0
Sclerotinia stem rot 0.5 0.0 0.1 0.0 0.0 0.0 0.0 0.0
SUB TOTAL 0.0 0.7 2.7 1.1
NEMATODES
stem nematode - - 0.0 0.0 0.0 0.0 0.0 0.0
root knot nematode - - 0.0 0.0 - - 0.0 0.0
root lesion nematode neglectus - - - - - - - -
root lesion nematode penetrans - - 0.0 0.0 3.0 0.5 0.6 0.1
root lesion nematode teres - - - - - - - -
root lesion nematode thornei - - 0.0 0.0 0.0 0.0 0.0 0.0
burrowing nematode - - - - - - - -
SUB TOTAL 0.0 0.0 0.5 0.1
BACTERIA
pisi bacterial blight 0.1 0.0 1.5 0.7 0.1 0.1 1.2 0.6
syringae bacterial blight 0.1 0.0 2.1 0.7 - - 1.6 0.5
SUB TOTAL 0.0 1.4 0.1 1.1
VIRUSES
alfalfa mosaic 0.6 0.2 0.0 0.0 - - 0.0 0.0
bean common mosaic - - - - - - - -
bean leafroll 46.9 9.4 0.1 0.0 - - 0.1 0.0
bean yellow mosaic 0.1 0.0 0.0 0.0 - - 0.0 0.0
beet western yellows 0.0 0.0 0.1 0.0 - - 0.1 0.0
clover yellow vein - - - - - - - -
cucumber mosaic 0.7 0.0 0.0 0.0 - - 0.0 0.0
pea seed-borne mosaic 30.0 0.0 2.2 0.0 24.2 2.7 6.8 0.6
soybean dwarf 4.4 0.1 - - - - 0.0 0.0
subterranean clover stunt 0.0 0.0 - - - - 0.0 0.0
tomato spotted wilt 0.0 0.0 - - - - 0.0 0.0
SUB TOTAL 9.7 0.1 2.7 0.7
TOTAL 9.7 25.6 44.5 29.6
- no data available

CuRRenT AnD PoTenTiAl CosTs fRoM DiseAses of Pulse CRoPs in AusTRAliA | 23 | GRDC
mildew and bare patch. Two diseases have a present severity of more than 10 per cent yield loss: the black spot complex (30 per cent) and downy mildew.
3.5 losses from field pea diseases3.5.1 Potential and present percentage
yield lossesThe average annual yield loss was calculated from the incidence and severity data (see Section 2.5 for the method). The potential severity was used to calculate the potential losses if current controls were not used and the present severity to calculate present losses with current control measures.
For Australia, the black spot complex of diseases comprising Phoma, Koolunga, and Mycosphaerella black spot had the highest potential and present average annual yield losses (Table 3.5). These diseases were unimportant in the Northern Region but were the major diseases in the Southern Region where they were rated separately. In the Western Region they were rated as complex because of difficulty of distinguishing them in the field.
In the Northern Region, three diseases had a potential average annual yield loss of more than 10 per cent. The highest average annual potential yield loss was 70.0 per cent from powdery mildew, followed by bean leafroll and pea seed-borne mosaic. With current disease controls, bean leafroll was the highest with 9.4 per cent present average annual loss and almost no loss from any other disease (Table 3.5).
In the Southern Region, three diseases had a potential average annual yield loss of more than 10 per cent. The highest average annual potential yield loss of more than 28 per cent was from Mycosphaerella black spot, followed by Koolunga black spot, Phoma black spot, powdery mildew and downy mildew. With current disease controls, the black spot complex cause the highest with over 8 per cent present average annual loss, followed by Koolunga black spot and Phoma black spot (Table 3.5).
In the Western Region, two diseases had a potential average annual yield loss of more than 10 per cent: the black spot complex (100 per cent loss) followed by pea seed-borne mosaic. With current disease controls, the black spot complex was the highest with 30 per cent present
average annual loss followed by downy mildew and bare patch (Table 3.5).
For Australia, the total present average annual yield loss from all diseases was 29.6 per cent. Necrotrophic leaf fungal diseases dominated and totalled 25.0 per cent. The others caused minor losses with biotrophic leaf fungal diseases causing 1.6 per cent, root and crown fungi 1.1 per cent, nematodes 0.1 per cent, bacteria 1.1 per cent, viruses 0.7 per cent and phytoplasma diseases nil.
3.5.2 Quality effects of diseases on field peasField peas are grown for both human consumption and stockfeed. Their value for human consumption is greater than for stockfeed but appearance and freedom from blemishes are paramount for the former grade. Diseases that discolour or reduce the size of the seed also reduce grain quality and value.
The two diseases identified as causing quality losses in field peas are powdery mildew and pisi bacterial blight, with all those losses occurring in the Southern Region (Table 3.6). Both diseases have the potential to cause considerable losses but average present losses are relatively small.
3.5.3 Value of losses from field pea diseasesThe value of these yield losses was calculated by relating the percentage losses to the gross value of field pea production in each zone, using the average value of field peas, over a five-year period (see Section 3.2). The value of quality losses were combined with these yield losses, and the total losses were calculated on a per hectare and aggregate basis for each zone for which disease data were available, then for each GRDC region and nationally.
The potential losses estimated for each disease are in Table 3.7 ($ per hectare) and Table 3.8 (aggregate losses). For Australia, the five major diseases by potential loss on a per hectare basis and their total cost to the industry are:
Disease $/ha $ million
Mycosphaerella black spot 60.16 18.2
Koolunga black spot 57.11 17.3
black spot complex 54.20 16.4
Phoma black spot 24.63 7.5
pea seed-borne mosaic 22.48 6.8
Table 3.6 Potential and present average annual quality losses from field pea diseases by GRDC Regions and Australia
Quality lossesNorthern Southern Western Australia
Potential Present Potential Present Potential Present Potential Present
$/ha
powdery mildew 0.00 0.00 15.51 0.64 0.00 0.00 12.26 0.50
pisi bacterial blight 0.00 0.00 0.05 0.02 0.00 0.00 0.04 0.02
0.00 0.66 0.00 0.52
$ million
powdery mildew 0.00 0.00 3.71 0.15 0.00 0.00 3.71 0.15
pisi bacterial blight 0.00 0.00 0.01 0.01 0.00 0.00 0.01 0.01
0.00 0.16 0.00 0.16
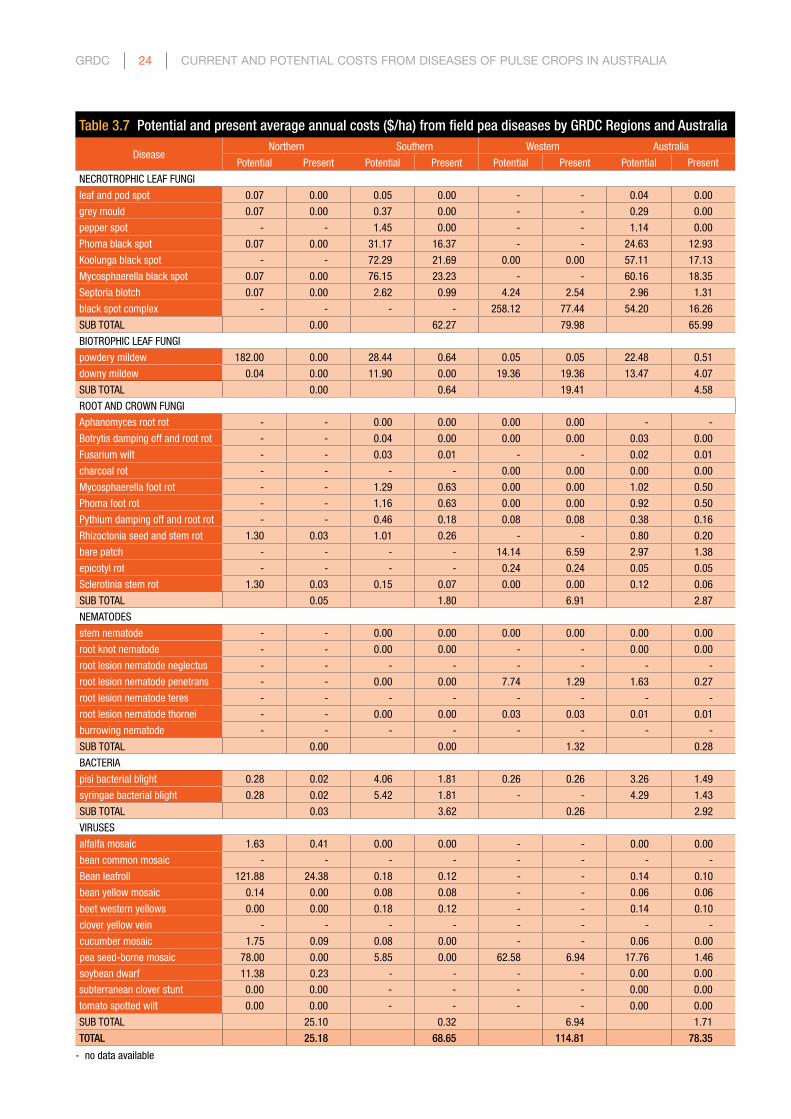
GRDC | 24 | CuRRenT AnD PoTenTiAl CosTs fRoM DiseAses of Pulse CRoPs in AusTRAliA
Table 3.7 Potential and present average annual costs ($/ha) from field pea diseases by GRDC Regions and Australia
DiseaseNorthern Southern Western Australia
Potential Present Potential Present Potential Present Potential Present
NECROTROPHIC LEAF FUNGI
leaf and pod spot 0.07 0.00 0.05 0.00 - - 0.04 0.00
grey mould 0.07 0.00 0.37 0.00 - - 0.29 0.00
pepper spot - - 1.45 0.00 - - 1.14 0.00
Phoma black spot 0.07 0.00 31.17 16.37 - - 24.63 12.93
Koolunga black spot - - 72.29 21.69 0.00 0.00 57.11 17.13
Mycosphaerella black spot 0.07 0.00 76.15 23.23 - - 60.16 18.35
Septoria blotch 0.07 0.00 2.62 0.99 4.24 2.54 2.96 1.31
black spot complex - - - - 258.12 77.44 54.20 16.26
SUB TOTAL 0.00 62.27 79.98 65.99
BIOTROPHIC LEAF FUNGI
powdery mildew 182.00 0.00 28.44 0.64 0.05 0.05 22.48 0.51
downy mildew 0.04 0.00 11.90 0.00 19.36 19.36 13.47 4.07
SUB TOTAL 0.00 0.64 19.41 4.58
ROOT AND CROWN FUNGI
Aphanomyces root rot - - 0.00 0.00 0.00 0.00 - -
Botrytis damping off and root rot - - 0.04 0.00 0.00 0.00 0.03 0.00
Fusarium wilt - - 0.03 0.01 - - 0.02 0.01
charcoal rot - - - - 0.00 0.00 0.00 0.00
Mycosphaerella foot rot - - 1.29 0.63 0.00 0.00 1.02 0.50
Phoma foot rot - - 1.16 0.63 0.00 0.00 0.92 0.50
Pythium damping off and root rot - - 0.46 0.18 0.08 0.08 0.38 0.16
Rhizoctonia seed and stem rot 1.30 0.03 1.01 0.26 - - 0.80 0.20
bare patch - - - - 14.14 6.59 2.97 1.38
epicotyl rot - - - - 0.24 0.24 0.05 0.05
Sclerotinia stem rot 1.30 0.03 0.15 0.07 0.00 0.00 0.12 0.06
SUB TOTAL 0.05 1.80 6.91 2.87
NEMATODES
stem nematode - - 0.00 0.00 0.00 0.00 0.00 0.00
root knot nematode - - 0.00 0.00 - - 0.00 0.00
root lesion nematode neglectus - - - - - - - -
root lesion nematode penetrans - - 0.00 0.00 7.74 1.29 1.63 0.27
root lesion nematode teres - - - - - - - -
root lesion nematode thornei - - 0.00 0.00 0.03 0.03 0.01 0.01
burrowing nematode - - - - - - - -
SUB TOTAL 0.00 0.00 1.32 0.28
BACTERIA
pisi bacterial blight 0.28 0.02 4.06 1.81 0.26 0.26 3.26 1.49
syringae bacterial blight 0.28 0.02 5.42 1.81 - - 4.29 1.43
SUB TOTAL 0.03 3.62 0.26 2.92
VIRUSES
alfalfa mosaic 1.63 0.41 0.00 0.00 - - 0.00 0.00
bean common mosaic - - - - - - - -
Bean leafroll 121.88 24.38 0.18 0.12 - - 0.14 0.10
bean yellow mosaic 0.14 0.00 0.08 0.08 - - 0.06 0.06
beet western yellows 0.00 0.00 0.18 0.12 - - 0.14 0.10
clover yellow vein - - - - - - - -
cucumber mosaic 1.75 0.09 0.08 0.00 - - 0.06 0.00
pea seed-borne mosaic 78.00 0.00 5.85 0.00 62.58 6.94 17.76 1.46
soybean dwarf 11.38 0.23 - - - - 0.00 0.00
subterranean clover stunt 0.00 0.00 - - - - 0.00 0.00
tomato spotted wilt 0.00 0.00 - - - - 0.00 0.00
SUB TOTAL 25.10 0.32 6.94 1.71
TOTAL 25.18 68.65 114.81 78.35
- no data available

CuRRenT AnD PoTenTiAl CosTs fRoM DiseAses of Pulse CRoPs in AusTRAliA | 25 | GRDC
Table 3.8 Aggregate potential and present average annual costs ($ million) from field pea diseases by GRDC Regions and Australia
Northern Southern Western Australia
Potential Present Potential Present Potential Present Potential Present
NECROTROPHIC LEAF FUNGI
leaf and pod spot 0.0 0.0 0.0 0.0 - - 0.0 0.0
grey mould 0.0 0.0 0.1 0.0 - - 0.1 0.0
pepper spot - - 0.3 0.0 - - 0.3 0.0
Phoma black spot 0.0 0.0 7.5 3.9 - - 7.5 3.9
Koolunga black spot - - 17.3 5.2 0.0 0.0 17.3 5.2
Mycosphaerella black spot 0.0 0.0 18.2 5.6 - - 18.2 5.6
Septoria blotch 0.0 0.0 0.6 0.2 0.3 0.2 0.9 0.4
black spot complex - - - - 16.4 4.9 16.4 4.9
SUB TOTAL 0.0 14.9 5.1 20.0
BIOTROPHIC LEAF FUNGI
powdery mildew 0.0 0.0 6.8 0.2 0.0 0.0 6.8 0.2
downy mildew 0.0 0.0 2.8 0.0 1.2 1.2 4.1 1.2
SUB TOTAL 0.0 0.2 1.2 1.4
ROOT AND CROWN FUNGI
Aphanomyces root rot - - 0.0 0.0 0.0 0.0 - -
Botrytis damping off and root rot - - 0.0 0.0 0.0 0.0 0.0 0.0
Fusarium wilt - - 0.0 0.0 - - 0.0 0.0
charcoal rot - - - - 0.0 0.0 0.0 0.0
Mycosphaerella foot rot - - 0.3 0.2 0.0 0.0 0.3 0.2
Phoma foot rot - - 0.3 0.2 0.0 0.0 0.3 0.2
Pythium damping off and root rot - - 0.1 0.0 0.0 0.0 0.1 0.0
Rhizoctonia seed and stem rot 0.0 0.0 0.2 0.1 - - 0.2 0.1
bare patch - - - - 0.9 0.4 0.9 0.4
epicotyl rot - - - - 0.0 0.0 0.0 0.0
Sclerotinia stem rot 0.0 0.0 0.0 0.0 0.0 0.0 0.0 0.0
SUB TOTAL 0.0 0.4 0.4 0.9
NEMATODES
stem nematode - - 0.0 0.0 0.0 0.0 0.0 0.0
root knot nematode - - 0.0 0.0 - - 0.0 0.0
root lesion nematode neglectus - - - - - - - -
root lesion nematode penetrans - - 0.0 0.0 0.5 0.1 0.5 0.1
root lesion nematode teres - - - - - - - -
root lesion nematode thornei - - 0.0 0.0 0.0 0.0 0.0 0.0
burrowing nematode - - - - - - - -
SUB TOTAL 0.0 0.0 0.1 0.1
BACTERIA
pisi bacterial blight 0.0 0.0 1.0 0.4 0.0 0.0 1.0 0.4
syringae bacterial blight 0.0 0.0 1.3 0.4 - - 1.3 0.4
SUB TOTAL 0.0 0.9 0.0 0.9
VIRUSES
alfalfa mosaic 0.0 0.0 0.0 0.0 - - 0.0 0.0
bean common mosaic - - - - - - - -
Bean leafroll 0.0 0.0 0.0 0.0 - - 0.0 0.0
bean yellow mosaic 0.0 0.0 0.0 0.0 - - 0.0 0.0
beet western yellows 0.0 0.0 0.0 0.0 - - 0.0 0.0
clover yellow vein - - - - - - - -
cucumber mosaic 0.0 0.0 0.0 0.0 - - 0.0 0.0
pea seed-borne mosaic 0.0 0.0 1.4 0.0 4.0 0.4 5.4 0.4
soybean dwarf 0.0 0.0 - - - - 0.0 0.0
subterranean clover stunt 0.0 0.0 - - - - 0.0 0.0
tomato spotted wilt 0.0 0.0 - - - - 0.0 0.0
SUB TOTAL 0.0 0.1 0.4 0.5
TOTAL 0.0 16.4 7.3 23.7
- no data available

GRDC | 26 | CuRRenT AnD PoTenTiAl CosTs fRoM DiseAses of Pulse CRoPs in AusTRAliA
Table 3.9 Value of current disease control practices in field peas per hectare and by GRDC Region and Australia
DiseasePer hectare ($) Total ($ million)
Northern Southern Western Australia Northern Southern Western Australia
NECROTROPHIC LEAF FUNGI
leaf and pod spot 0.07 0.05 - 0.04 0.0 0.0 - 0.0
grey mould 0.07 0.37 - 0.29 0.0 0.1 - 0.1
pepper spot - 1.45 - 1.14 - 0.3 - 0.3
Phoma black spot 0.07 14.80 - 11.69 0.0 3.5 - 3.5
Koolunga black spot - 50.60 0.00 39.98 - 12.1 0.0 12.1
Mycosphaerella black spot 0.07 52.92 - 41.81 0.0 12.7 - 12.7
Septoria blotch 0.07 1.63 1.70 1.64 0.0 0.4 0.1 0.5
black spot complex - - 180.68 37.94 - - 11.5 11.5
BIOTROPHIC LEAF FUNGI
powdery mildew 182.00 27.80 0.00 21.97 0.0 6.7 0.0 6.7
downy mildew 0.04 11.90 0.00 9.40 0.0 2.8 0.0 2.8
ROOT AND CROWN FUNGI
Aphanomyces root rot - 0.00 0.00 - - 0.0 0.0 -
Botrytis damping off and root rot - 0.04 0.00 0.03 - 0.0 0.0 0.0
Fusarium wilt - 0.02 - 0.01 - 0.0 - 0.0
charcoal rot - - 0.00 0.00 - - 0.0 0.0
Mycosphaerella foot rot - 0.66 0.00 0.52 - 0.2 0.0 0.2
Phoma foot rot - 0.52 0.00 0.41 - 0.1 0.0 0.1
Pythium damping off and root rot - 0.28 0.00 0.22 - 0.1 0.0 0.1
Rhizoctonia seed and stem rot 1.27 0.75 - 0.59 0.0 0.2 - 0.2
bare patch - - 7.55 1.58 - - 0.5 0.5
epicotyl rot - - 0.00 0.00 - - 0.0 0.0
Sclerotinia stem rot 1.27 0.07 0.00 0.06 0.0 0.0 0.0 0.0
NEMATODES
stem nematode - 0.00 0.00 0.00 - 0.0 0.0 0.0
root knot nematode - 0.00 - 0.00 - 0.0 - 0.0
root lesion nematode neglectus - - - - - - - -
root lesion nematode penetrans - 0.00 6.45 1.36 - 0.0 0.4 0.4
root lesion nematode teres - - - - - - - -
root lesion nematode thornei - 0.00 0.00 0.00 - 0.0 0.0 0.0
burrowing nematode - - - - - - - -
BACTERIA
pisi bacterial blight 0.26 2.25 0.00 1.78 0.0 0.5 0.0 0.5
syringae bacterial blight 0.26 3.62 - 2.86 0.0 0.9 - 0.9
VIRUSES
alfalfa mosaic 1.22 0.00 - 0.00 0.0 0.0 - 0.0
bean common mosaic - - - - - - - -
Bean leafroll 97.50 0.06 - 0.04 0.0 0.0 - 0.0
bean yellow mosaic 0.14 0.00 - 0.00 0.0 0.0 - 0.0
beet western yellows 0.00 0.06 - 0.04 0.0 0.0 - 0.0
clover yellow vein - - - - - - - -
cucumber mosaic 1.67 0.08 - 0.06 0.0 0.0 - 0.0
pea seed-borne mosaic 78.00 5.85 55.64 16.31 0.0 1.4 3.5 4.9
soybean dwarf 11.15 - - 0.00 0.0 - - 0.0
subterranean clover stunt 0.00 - - 0.00 0.0 - - 0.0
tomato spotted wilt 0.00 - - 0.00 0.0 - - 0.0
- no data available

CuRRenT AnD PoTenTiAl CosTs fRoM DiseAses of Pulse CRoPs in AusTRAliA | 27 | GRDC
The black spot group of diseases dominates this list. It is difficult to identify each disease separately in the field, some respondents have combined them while others have estimated them separately. As a result, the total loss from these diseases will be a partial sum of the separate estimates as there has been some double counting of this group.
The present losses estimated for each disease are in Table 3.7 ($ per hectare) and Table 3.8 (aggregate losses). For Australia, the five major diseases by average annual present loss on a per hectare basis and total cost to the industry are:
Disease $/ha $ million
Mycosphaerella black spot 18.35 5.6
Koolunga black spot 17.13 5.2
black spot complex 16.26 4.9
Phoma black spot 12.93 3.9
downy mildew 4.07 1.2
Total losses from others 9.60 2.9
Total Present Loss 78.35 23.7
These five diseases account for over 85 per cent of the total present losses in field peas. As for the potential losses, the black spot group dominates the present losses.
3.6 Value of control of field pea diseasesThe value of present controls of field pea diseases is the difference between the potential average annual loss when current control practices were not in place and the present average annual loss with current controls in place. Estimates of the value of control for each disease surveyed on a per hectare basis and the total value for the production regions and Australia are in Table 3.9.
For diseases with high potential loss and effective control, the value of control is high. For Australia, the leading diseases in terms of value of control are Mycosphaerella black spot ($12.7 million), Koolunga black spot ($12.1 million), black spot complex ($11.5 million), powdery mildew ($6.7 million), pea seed-borne mosaic ($4.9 million), Phoma black spot ($3.5 million) and downy mildew ($2.8 million).
The regional and national values are of primary consideration by funding bodies to determine the return on investment for development of a control. However, for farmers, the cost of using a control needs to be weighed against the return. Here, the per hectare cost is often more useful. The value of control of two black spot diseases exceeds $50/ha in the Southern Region and that of the black spot complex is $180/ha in the Western Region. Control of powdery mildew is worth an average of $182/ha in the Northern Region.
For the survey, control measures were grouped in three broad categories: breeding (resistant cultivars); cultural practices including stubble management, tillage and crop rotation; and pesticides, including fungicides applied to the seed, in fertilisers and by spraying, and insecticides to control vectors. The proportion of control contributed by
each category and its value are in Table 3.10.Breeding and the use of genetic resistance provided 50
per cent or more of the control of four diseases. Even where this control provided less than 50 per cent of the control, its value was considerable. The three most important values of resistance were powdery mildew $3.6 million, downy mildew $1.5 million, and Mycosphaerella black spot $1.2 million (Table 3.10).
Cultural practices contributed 50 per cent or more of the control for 19 diseases and 25 per cent or more for a further five. The top five average annual values for this control were: black spot complex, $11.5 million; Koolunga black spot, $9.1 million; Mycosphaerella black spot $9.1 million; pea seed-borne mosaic, $4.9 million; and Phoma black spot, $2.4 million (Table 3.10).
Pesticides, mainly fungicides, contributed 50 per cent or more of the control for seven diseases and 25 per cent or more for a further five. The four most significant average annual values for control with pesticides were: Koolunga black spot, $3.0 million; powdery mildew, $3.0 million; Mycosphaerella black spot, $2.4 million; and downy mildew, $1.3 million (Table 3.10).
3.7 use of pesticides for control of field pea diseases
The total expenditure is estimated at $7.1 million per year for field pea, all of which are in the Southern Region (Table 3.11). On average, half the expenditure ($3.6 million) was for seed treatment and half ($3.6 million) was spent on foliar fungicides. The costs of fungicide applications to field pea crops averaged $29.79/ha in the Southern Region. Across Australia, 38 per cent of the field pea crop did not receive any fungicide (Table 3.11).
3.8 Discussion and ConclusionsDiseases have a high potential to damage field pea crops but are reasonably well controlled at present, with total present losses of $23.7 million or 31.6 per cent of the gross value of production.
On average, the current average annual losses from field pea diseases are $78.35/ha. The five major diseases of field peas in Australia in order of potential and present losses are:
Rank By potential loss By present loss
1 Mycosphaerella black spot Mycosphaerella black spot
2 Koolunga black spot Koolunga black spot
3 black spot complex black spot complex
4 Phoma black spot Phoma black spot
5 powdery mildew downy mildew

GRDC | 28 | CuRRenT AnD PoTenTiAl CosTs fRoM DiseAses of Pulse CRoPs in AusTRAliA
Table 3.10 Value of different forms of field pea disease control in Australia
DiseaseCost/value ($ million) Contribution (%) Contribution ($ million)
Potential Present Control Breeding Cultural Pesticide Breeding Cultural Pesticide
NECROTROPHIC LEAF FUNGI
leaf and pod spot 0.0 0.0 0.0 0 60 40 0.0 0.0 0.0
grey mould 0.1 0.0 0.1 0 14 86 0.0 0.0 0.1
pepper spot 0.3 0.0 0.3 0 0 100 0.0 0.0 0.3
Phoma black spot 7.5 3.9 3.5 9 68 22 0.3 2.4 0.8
Koolunga black spot 17.3 5.2 12.1 0 75 25 0.0 9.1 3.0
Mycosphaerella black spot 18.2 5.6 12.7 9 72 19 1.2 9.1 2.4
Septoria blotch 0.9 0.4 0.5 1 31 68 0.0 0.2 0.3
black spot complex 16.4 4.9 11.5 0 100 0 0.0 11.5 0.0
BIOTROPHIC LEAF FUNGI
powdery mildew 6.8 0.2 6.7 54 2 44 3.6 0.1 3.0
downy mildew 4.1 1.2 2.8 53 1 46 1.5 0.0 1.3
ROOT AND CROWN FUNGI
Aphanomyces root rot - - - - - -
Botrytis damping off and root rot 0.0 0.0 0.0 0 50 50 0.0 0.0 0.0
Fusarium wilt 0.0 0.0 0.0 0 50 50 0.0 0.0 0.0
charcoal rot 0.0 0.0 0.0 0.0 0.0 0.0
Mycosphaerella foot rot 0.3 0.2 0.2 10 66 24 0.0 0.1 0.0
Phoma foot rot 0.3 0.2 0.1 10 66 24 0.0 0.1 0.0
Pythium damping off and root rot 0.1 0.0 0.1 0 25 75 0.0 0.0 0.0
Rhizoctonia seed and stem rot 0.2 0.1 0.2 0 78 22 0.0 0.1 0.0
bare patch 0.9 0.4 0.5 0 100 0 0.0 0.5 0.0
epicotyl rot 0.0 0.0 0.0 0.0 0.0 0.0
Sclerotinia stem rot 0.0 0.0 0.0 0 40 60 0.0 0.0 0.0
NEMATODES
stem nematode 0.0 0.0 0.0 0.0 0.0 0.0
root knot nematode 0.0 0.0 0.0 0.0 0.0 0.0
root lesion nematode neglectus - - - - - -
root lesion nematode penetrans 0.5 0.1 0.4 0 100 0 0.0 0.4 0.0
root lesion nematode teres - - - - - -
root lesion nematode thornei 0.0 0.0 0.0 0.0 0.0 0.0
burrowing nematode - - - - - -
BACTERIA
pisi bacterial blight 1.0 0.4 0.5 9 91 0 0.0 0.5 0.0
syringae bacterial blight 1.3 0.4 0.9 9 91 0 0.1 0.8 0.0
VIRUSES
alfalfa mosaic 0.0 0.0 0.0 50 50 0 0.0 0.0 0.0
bean common mosaic - - - - - -
Bean leafroll 0.0 0.0 0.0 1 49 49 0.0 0.0 0.0
bean yellow mosaic 0.0 0.0 0.0 0 100 0 0.0 0.0 0.0
beet western yellows 0.0 0.0 0.0 0 50 50 0.0 0.0 0.0
clover yellow vein - - - - - -
cucumber mosaic 0.0 0.0 0.0 0 100 0 0.0 0.0 0.0
pea seed-borne mosaic 5.4 0.4 4.9 0 100 0 0.0 4.9 0.0
soybean dwarf 0.0 0.0 0.0 75 25 0 0.0 0.0 0.0
subterranean clover stunt 0.0 0.0 0.0 0.0 0.0 0.0
tomato spotted wilt 0.0 0.0 0.0 0.0 0.0 0.0
- no data available

CuRRenT AnD PoTenTiAl CosTs fRoM DiseAses of Pulse CRoPs in AusTRAliA | 29 | GRDC
Necrotrophic fungal leaf diseases cause present losses of $20.0 million per year in field peas in Australia, or 84 per cent of the total loss. The losses are dominated by several diseases that cause similar symptoms, and are known as ‘Ascochyta blight’ and ‘black spot’. Separately they are leaf and pod spot (Ascochyta pisi), Phoma black spot (Phoma medicaginis var. pinodella), Koolunga black spot (Phoma koolunga) and Mycosphaerella black spot (Mycosphaerella pinodes).
Studies funded by the GRDC aim to identify the significance of different components of this black spot complex. Until more is known of the distribution and relative importance of this group of diseases, the estimates of losses from each are preliminary. Regardless, losses from some or all of the diseases are high.
Although the potential losses from the biotrophic leaf fungi are high, present losses with current controls are relatively low and these are 6 per cent of the present average annual loss.
Similarly, the root and crown fungi, bacterial diseases and viral diseases are currently well controlled and they contribute 4, 4 and 2 per cent, respectively, to the total present loss.
Current controls for black spot diseases rely largely on cultural methods and pesticides, which are likely to have similar effectiveness on all. However, breeding for resistance has value; further research is required to find whether resistance is specific to each disease.
Although several nematode species attack peas, there is little evidence of severe losses, with the current estimated loss being less than one per cent of the total disease loss. Peas may be more significant as hosts of some nematodes which could affect the subsequent crop in the rotation.
At present, there are no phytoplasma diseases reported on field peas.
Current control values have reduced the losses from these diseases considerably. Breeding, cultural measures and pesticides are generally used in conjunction, as shown by the following diseases:
DiseaseControl value
($ million)
Contribution to control ($ million) by
Breeding Cultural Pesticides
Mycosphaerella black spot 12.7 1.2 9.1 2.4
Koolunga black spot 12.1 0.0 9.1 3.0
black spot complex 11.5 0.0 11.5 0.0
powdery mildew 6.7 3.6 0.1 3.0
pea seed-borne mosaic 4.9 0.0 4.9 0.0
Diseases such as powdery mildew and pisi bacterial blight have the potential to reduce grain quality through blemishes and reduced seed size. A limit of one per cent seed with “Poor colour” is set for Field No. 1 Grade and Yellow Split Peas with other limits on undersized peas. Further research on the effect of field pea diseases and the value of the harvested grain is needed, since this is likely to have a major effect on the value of the loss and justify greater efforts at control.
Table 3.11 Pesticide use on field pea crops for disease control by GRDC Regions and Australia
Region Crop area‘000 ha
Seed fungicide$ million
Foliar fungicide$ million
Total fungicide$ million
Other pesticides$ million
Total pesticides$ million Total $ per ha % no fungicide
Northern 0.0 0.0 0.0 0.0 0.0 0.0 0.00 100
Southern 239.3 3.6 3.6 7.1 0.0 7.1 29.79 21
Western 63.6 0.0 0.0 0.0 0.0 0.0 0.20 99
Australia 302.9 3.6 3.6 7.1 0.0 7.1 23.58 38

GRDC | 30 | CuRRenT AnD PoTenTiAl CosTs fRoM DiseAses of Pulse CRoPs in AusTRAliA
4.1 introductionNarrowleaf lupins (Lupinus angustifolius) are grown in the winter cropping areas of Australia in each of the three GRDC production regions. The crop is sown in autumn and harvested in late spring. Narrowleaf lupins are grown for stockfeed.
Data on disease incidence and severity were not available for the Northern Region because very little of the crop is grown there (see Section 4.2 for narrowleaf lupin production).
This section contains:n average area, production, yield and value of narrowleaf
lupins over a recent five-year period;n a list of the diseases of narrowleaf lupins that were
considered;n the incidence and severity of the diseases in each
production area;n the potential and present yield loss as a percentage of
yield, effect on quality and the value of this loss;n overall control methods and their value for each disease;
andn the present level of expenditure on fungicides on the crop.
4.2 narrowleaf lupin productionEstimation of the value of disease losses depends on base data on the area, yield and value of the crop. The production data for narrowleaf lupins are for the year 2008-09. The average data for the five years ending 2008-09 were calculated as representative of current production. Narrowleaf lupin production data were obtained from Pulse Australia.
The average area, yield, production and value of narrowleaf lupins in each agro-ecological zone are shown in Table 4.1 (see Appendix A for more detail). For the period 2004-05 to 2008-09, the average annual area of narrowleaf lupins sown in Australia was 497,460 hectares producing an average of 485,600 tonnes, with an overall average yield of 0.98t/ha.
The mean unit value of narrowleaf lupins over the five-year period was $230/t, giving an average gross value of production of $112.4 million per year.
Narrowleaf lupin production was mostly in the Western Region with 70 per cent of the crop area, a 30 per cent crop area in the Southern Region and none in the Northern Region.
4.3 Diseases of narrowleaf lupins4.3.1 narrowleaf lupin diseases and
their pathogensThere were 34 diseases of narrowleaf lupins considered in this survey, comprising six necrotrophic leaf fungal diseases, one biotrophic leaf disease, 15 root and crown fungal diseases, six nematode diseases and six viral diseases. There were no bacterial and phytoplasma diseases (Table 4.2). These diseases were caused by 23 fungi, six nematodes and six viruses. There were five Rhizoctonia fungi. These are distinguished on some morphological bases, by chemistry and by disease symptoms and host ranges.
As several species of the Pratylenchus nematodes attack crops and pastures, the species names ‘brachyurus’, ‘neglectus’, ‘penetrans’, ‘teres’ and ‘thornei’ were added to the common name ‘root lesion nematode’ for clarity.
Data on disease incidence, severity and control measures were obtained for six of the seven zones in the Southern Region (77 per cent of the crop area in the region) and from the four zones in the Western Region where narrowleaf lupins are grown; there was no production in the Northern Region (Table 4.1). Disease information and the respondents for each zone are in Appendix B.
4.3.2 Distribution of the pathogens in AustraliaFor Australia, 27 of the surveyed pathogens had been recorded, 19 in the Southern Region and 22 in the Western Region, while 14 were recorded on narrowleaf lupins in both regions (Table 4.2).
Five of the six necrotrophic leaf fungal diseases were
4 CuRRenT AnD PoTenTiAl losses fRoM DiseAses of nARRowleAf luPins
Table 4.1 Mean narrowleaf lupin area, yield, production and value by agro-ecological zone and GRDC Region 2004-05 to 2008-09
Area(‘000 ha)
Yield(t/ha)
Production(‘000 t)
Gross value($ million)
Queensland Burdekin 0.0 0.00 0.0 0.0
Queensland Atherton 0.0 0.00 0.0 0.0
Queensland Central 0.0 0.00 0.0 0.0NSW North-East/ Queensland South-East 0.0 0.00 0.0 0.0
NSW North-West/ Queensland South-West 0.0 0.00 0.0 0.0
TOTAL NORTHERN REGION 0.0 0.00 0.0 0.0
NSW Central* 0.0 1.00 0.0 0.0
NSW–Victoria Slopes* 29.8 0.65 19.4 5.1
Victoria High Rainfall* 5.0 0.98 4.9 1.3
SA–Victoria Mallee* 39.8 0.85 34.0 7.8
SA–Victoria Border–Wimmera* 39.8 0.98 38.9 8.9
SA Mid-North/Lower Yorke, Eyre 34.8 0.98 34.0 7.8
TAS Grain Growing* 0.0 1.00 0.0 0.0
TOTAL SOUTHERN REGION 149.2 0.88 131.1 30.9
WA Northern* 174.1 1.06 184.5 42.4
WA Central* 99.5 0.98 97.1 22.3
WA Eastern* 24.9 0.98 24.3 5.6
WA Sandplain–Mallee* 49.7 0.98 48.6 11.2
WA Ord 0.0 0.00 0.0 0.0
Northern Territory Central (Katherine) 0.0 0.00 0.0 0.0
TOTAL WESTERN REGION 348.2 1.02 354.5 81.5
TOTAL AUSTRALIA 497.5 0.98 485.6 112.4* Disease data obtained for this zone

CuRRenT AnD PoTenTiAl CosTs fRoM DiseAses of Pulse CRoPs in AusTRAliA | 31 | GRDC
Table 4.2 Narrowleaf lupin diseases in this survey, their pathogens and their presencea in the GRDC Regions and AustraliaPathogen Disease Northern Southern Western Australia
NECROTROPHIC LEAF FUNGI
Botrytis cinerea grey mould - Y P Y
Cladosporium sp. Cladosporium leaf spot - U U U
Colletotrichum lupini anthracnose - Y Y Y
Diaporthe toxica Phomopsis stem blight - Y P Y
Pleiochaeta setosa brown leaf spot - Y Y Y
Stemphylium botryosum grey leaf spot - Y Y Y
BIOTROPHIC LEAF FUNGI
Erysiphe spp., Oidium sp. powdery mildew - U P P
ROOT AND CROWN FUNGI
Fusarium avenaceum Fusarium root and pod rot - Y U Y
Macrophomina phaseolina charcoal rot - Y Y Y
Phytophthora spp. Phytophthora root rot - Y U Y
Pleiochaeta setosa Pleiochaeta root rot - Y Y Y
Pythium spp. Pythium damping off - Y P Y
Rhizoctonia (thin binucleate) Eradu patch - N Y Y
Rhizoctonia spp. Rhizoctonia damping off - Y U Y
Rhizoctonia spp. Rhizoctonia root rot - Y P Y
Rhizoctonia solani AG8 Rhizoctonia bare patch - Y Y Y
Rhizoctonia solani AG11 epicotyl rot - Y Y Y
Sclerotinia minor Sclerotinia crown rot - Y Y Y
Sclerotinia sclerotiorum Sclerotinia stem rot - Y Y Y
Sclerotium rolfsii Sclerotium wilt - Y N Y
Thielaviopsis basicola Thielaviopsis root rot - Y N Y
Verticillium sp. Verticillium wilt - U N N
NEMATODES
Pratylenchus brachyurus root lesion nem. brachyurus - U U U
Pratylenchus neglectus root lesion nematode neglectus - U Y Y
Pratylenchus penetrans root lesion nematode penetrans - U P P
Pratylenchus teres root lesion nematode teres - U P P
Pratylenchus thornei root lesion nematode thornei - U U U
Radopholus sp. burrowing nematode - U P P
VIRUSES
Alfalfa mosaic virus alfalfa mosaic - U P P
Bean yellow mosaic virus bean yellow mosaic - U P P
Broad bean wilt virus broad bean wilt - U U U
Cucumber mosaic virus cucumber mosaic - Y P Y
Lettuce necrotic yellows virus lettuce necrotic yellows - U U U
Subterranean clover red leaf virus subterranean clover red leaf - U U Ua Y= present in region P = present in region but no or incomplete data on incidence and severity N = not recorded in region U = unknown status
present in the Southern and Western regions (Table 4.2). Although anthracnose has been recorded in the Southern Region, its distribution is limited to the western growing areas of South Australia. It has not been recorded on narrowleaf lupins further east but is present in some naturalised populations of ornamental lupins outside the lupin cropping areas.
The status of the biotrophic leaf disease powdery mildew was unknown in the Southern Region but is present in the Western Region.
Of the 15 root and crown fungal diseases, 13 are present in the Southern Region and the status of two is unknown; nine are present in the Western Region, three are not present on lupins and the status of three is unknown.
The status of the six nematodes is unknown in the Southern Region and four are present on lupins in the Western Region.
Only one virus disease is known on lupins in the Southern Region while three have been recorded in the Western Region on lupins.

GRDC | 32 | CuRRenT AnD PoTenTiAl CosTs fRoM DiseAses of Pulse CRoPs in AusTRAliA
4.4 incidence and severity of narrowleaf lupin diseases
4.4.1 incidence of narrowleaf lupin diseasesIncidence was assessed as the proportion of years that favoured development of the disease in each zone, and as the proportion of the crop area in the zone affected when the disease developed. These values were averaged for the region and Australia by weighting by the area sown to the crop in each zone for which disease data were available, and are shown in Table 4.3.
Since no narrowleaf lupins were grown in the Northern
Region, there are no data on diseases for that region.For Australia, there were nine diseases that occurred with
a yearly incidence of 25 per cent or greater. Brown leaf spot had the highest incidence, occurring in more than 81 per cent of years followed by Rhizoctonia bare patch, Pleiochaeta root rot, root lesion nematode neglectus and epicotyl rot. Four diseases occurred over 25 per cent of the crop area in years favourable for their development: brown leaf spot occurred most widely (76 per cent of the area) followed by Pleiochaeta root rot, epicotyl rot, Rhizoctonia bare patch and anthracnose.
Within the Southern Region, there were three diseases
Table 4.3 Incidence of narrowleaf lupin diseases as a proportion of years when disease occurs (%) and as a proportion of the crop area affected when the disease develops (%) in the GRDC Regions and Australia
DiseaseNorthern Southern Western Australia
Years Area Years Area Years Area Years Area
NECROTROPHIC LEAF FUNGI
grey mould - - 5.4 4.3 - - 1.6 1.3
Cladosporium leaf spot - - - - - - - -
anthracnose - - 0.0 0.0 40.0 31.6 28.0 22.1
Phomopsis stem blight - - 20.0 14.3 - - 6.0 4.3
brown leaf spot - - 38.4 21.1 100.0 100.0 81.5 76.3
grey leaf spot - - 11.4 5.0 0.0 0.0 3.4 1.5
BIOTROPHIC LEAF FUNGI
powdery mildew - - - - - - - -
ROOT AND CROWN FUNGI
Fusarium root and pod rot - - 6.2 6.2 - - 1.9 1.9
charcoal rot - - 6.2 5.0 3.9 0.8 4.6 2.1
Phytophthora root rot - - 7.5 6.2 - - 2.3 1.9
Pleiochaeta root rot - - 15.3 16.3 100.0 100.0 74.6 74.9
Pythium damping off - - 4.6 4.6 - - 1.4 1.4
Eradu patch - - 0.0 0.0 78.6 7.9 55.0 5.5
Rhizoctonia damping off - - 5.0 5.0 - - 1.5 1.5
Rhizoctonia root rot - - 22.0 13.7 - - 6.6 4.1
Rhizoctonia bare patch - - 28.2 18.7 100.0 28.6 78.4 25.6
epicotyl rot - - 0.0 0.0 93.6 40.1 65.5 28.0
Sclerotinia crown rot - - 10.8 8.7 50.7 0.5 38.7 2.9
Sclerotinia stem rot - - 10.8 8.7 43.6 0.5 33.7 2.9
Sclerotium wilt - - 2.5 6.4 0.0 0.0 0.7 1.9
Thielaviopsis root rot - - 12.5 7.5 0.0 0.0 3.7 2.2
Verticillium wilt - - - - 0.0 0.0 0.0 0.0
NEMATODES
root lesion nematode brachyurus - - - - - - - -
root lesion nematode neglectus - - - - 100.0 0.0 70.0 0.0
root lesion nematode penetrans - - - - - - - -
root lesion nematode teres - - - - - - - -
root lesion nematode thornei - - - - - - - -
burrowing nematode - - - - - - - -
VIRUSES
alfalfa mosaic - - - - - - - -
bean yellow mosaic - - - - - - - -
broad bean wilt - - - - - - - -
cucumber mosaic - - 50.0 5.0 - - 15.0 1.5
lettuce necrotic yellows - - - - - - - -
subterranean clover red leaf - - - - - - - -- no data available

CuRRenT AnD PoTenTiAl CosTs fRoM DiseAses of Pulse CRoPs in AusTRAliA | 33 | GRDC
that occurred with a yearly incidence of 25 per cent or greater. Cucumber mosaic had the highest annual incidence of 50 per cent followed by brown leaf spot, Rhizoctonia bare patch, Rhizoctonia root rot, Phomopsis stem blight and Pleiochaeta root rot. No diseases occurred over 25 per cent or more of the crop area in years favourable for their development. The highest was brown leaf spot which occurred most widely (21 per cent of the area) followed by Rhizoctonia bare patch, Pleiochaeta root rot, Phomopsis stem blight and Rhizoctonia root rot.
Within the Western Region, there were nine diseases that
occurred with a yearly incidence of 25 per cent or greater: brown leaf spot, Pleiochaeta root rot, Rhizoctonia bare patch and root lesion nematode neglectus. They occurred in all years with epicotyl rot the next most common (more than 93 per cent of years). Five diseases occurred over 25 per cent of the crop area in years favourable for their development: brown leaf spot and Pleiochaeta root rot occurred over the whole area followed by epicotyl rot, anthracnose and Rhizoctonia bare patch.
Table 4.4 Potential and present severity of narrowleaf lupin diseases (% yield loss in years suitable for disease development) in the GRDC Regions and Australia
DiseaseNorthern Southern Western Australia
Potential Present Potential Present Potential Present Potential Present
NECROTROPHIC LEAF FUNGI
grey mould - - 4.3 0.0 - - 1.3 0.0
Cladosporium leaf spot - - - - - - - -
anthracnose - - 0.0 0.0 88.6 9.3 62.0 6.5
Phomopsis stem blight - - 3.4 0.0 - - 1.0 0.0
brown leaf spot - - 16.9 1.2 100.0 5.0 75.1 3.8
grey leaf spot - - 5.0 5.0 0.0 0.0 1.5 1.5
BIOTROPHIC LEAF FUNGI
powdery mildew - - - - - - - -
ROOT AND CROWN FUNGI
Fusarium root and pod rot - - 5.0 0.0 - - 1.5 0.0
charcoal rot - - 5.0 0.0 0.0 0.0 1.5 0.0
Phytophthora root rot - - 7.2 1.2 - - 2.2 0.4
Pleiochaeta root rot - - 15.0 1.2 92.9 9.3 69.5 6.8
Pythium damping off - - 3.4 0.0 - - 1.0 0.0
Eradu patch - - 0.0 0.0 7.9 5.5 5.5 3.8
Rhizoctonia damping off - - 3.9 0.0 - - 1.2 0.0
Rhizoctonia root rot - - 7.5 1.0 - - 2.3 0.3
Rhizoctonia bare patch - - 10.0 1.0 11.4 5.0 11.0 3.8
epicotyl rot - - 0.0 0.0 44.3 0.9 31.0 0.6
Sclerotinia crown rot - - 5.2 0.5 18.6 18.6 14.5 13.1
Sclerotinia stem rot - - 5.2 0.5 18.6 18.6 14.5 13.1
Sclerotium wilt - - 2.5 0.0 0.0 0.0 0.7 0.0
Thielaviopsis root rot - - 12.5 5.0 0.0 0.0 3.7 1.5
Verticillium wilt - - - - 0.0 0.0 0.0 0.0
NEMATODES
root lesion nem.brachyurus - - - - - - - -
root lesion nematode neglectus - - - - 0.0 0.0 0.0 0.0
root lesion nematode penetrans - - - - - - - -
root lesion nematode teres - - - - - - - -
root lesion nematode thornei - - - - - - - -
burrowing nematode - - - - - - - -
VIRUSES
alfalfa mosaic - - - - - - - -
bean yellow mosaic - - - - - - - -
broad bean wilt - - - - - - - -
cucumber mosaic - - 7.5 0.0 - - 2.2 0.0
lettuce necrotic yellows - - - - - - - -
subterranean clover red leaf - - - - - - - -- no data available

GRDC | 34 | CuRRenT AnD PoTenTiAl CosTs fRoM DiseAses of Pulse CRoPs in AusTRAliA
Table 4.5 Potential and present average annual yield losses (%) from narrowleaf lupin diseases by GRDC Regions and Australia
DiseaseNorthern Southern Western Australia
Potential Present Potential Present Potential Present Potential Present
NECROTROPHIC LEAF FUNGI
grey mould - - 0.0 0.0 - - 0.0 0.0
Cladosporium leaf spot - - - - - - - -
anthracnose - - 0.0 0.0 15.7 1.6 11.0 1.1
Phomopsis stem blight - - 0.1 0.0 - - 0.0 0.0
brown leaf spot - - 1.8 0.0 100.0 5.0 70.5 3.5
grey leaf spot - - 0.1 0.1 0.0 0.0 0.0 0.0
SUB TOTAL - 0.1 6.6 4.6
BIOTROPHIC LEAF FUNGI
powdery mildew - - - - - - - -
SUB TOTAL - 0.0 0.0 0.0
ROOT AND CROWN FUNGI
Fusarium root and pod rot - - 0.0 0.0 - - 0.0 0.0
charcoal rot - - 0.0 0.0 0.0 0.0 0.0 0.0
Phytophthora root rot - - 0.1 0.0 - - 0.0 0.0
Pleiochaeta root rot - - 0.3 0.0 92.9 9.3 65.1 6.5
Pythium damping off - - 0.0 0.0 - - 0.0 0.0
Eradu patch - - 0.0 0.0 0.8 0.6 0.5 0.4
Rhizoctonia damping off - - 0.0 0.0 - - 0.0 0.0
Rhizoctonia root rot - - 0.3 0.1 - - 0.1 0.0
Rhizoctonia bare patch - - 0.5 0.1 3.6 1.4 2.7 1.0
epicotyl rot - - 0.0 0.0 19.7 0.4 13.8 0.3
Sclerotinia crown rot - - 0.1 0.0 0.1 0.1 0.1 0.0
Sclerotinia stem rot - - 0.1 0.0 0.0 0.0 0.0 0.0
Sclerotium wilt - - 0.0 0.0 0.0 0.0 0.0 0.0
Thielaviopsis root rot - - 0.5 0.2 0.0 0.0 0.1 0.1
Verticillium wilt - - - - 0.0 0.0 0.0 0.0
SUB TOTAL - 0.4 11.8 8.3
NEMATODES
root lesion nem. brachyurus - - - - - - - -
root lesion nematode neglectus - - - - 0.0 0.0 0.0 0.0
root lesion nematode penetrans - - - - - - - -
root lesion nematode teres - - - - - - - -
root lesion nematode thornei - - - - - - - -
burrowing nematode - - - - - - - -
SUB TOTAL - 0.0 0.0 0.0
VIRUSES
alfalfa mosaic - - - - - - - -
bean yellow mosaic - - - - - - - -
broad bean wilt - - - - - - - -
cucumber mosaic - - 0.7 0.0 - - 0.2 0.0
lettuce necrotic yellows - - - - - - - -
subterranean clover red leaf - - - - - - - -
SUB TOTAL - 0.0 0.0 0.0
TOTAL - 0.5 18.3 13.0- no data available
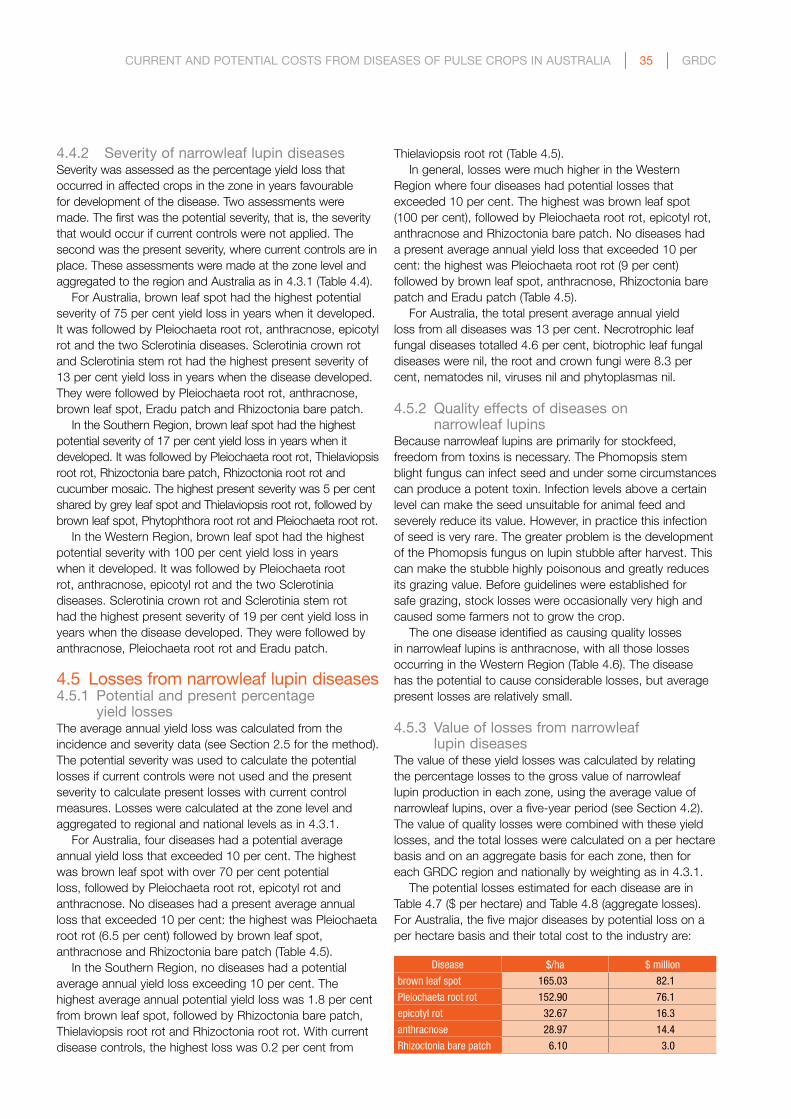
CuRRenT AnD PoTenTiAl CosTs fRoM DiseAses of Pulse CRoPs in AusTRAliA | 35 | GRDC
4.4.2 severity of narrowleaf lupin diseasesSeverity was assessed as the percentage yield loss that occurred in affected crops in the zone in years favourable for development of the disease. Two assessments were made. The first was the potential severity, that is, the severity that would occur if current controls were not applied. The second was the present severity, where current controls are in place. These assessments were made at the zone level and aggregated to the region and Australia as in 4.3.1 (Table 4.4).
For Australia, brown leaf spot had the highest potential severity of 75 per cent yield loss in years when it developed. It was followed by Pleiochaeta root rot, anthracnose, epicotyl rot and the two Sclerotinia diseases. Sclerotinia crown rot and Sclerotinia stem rot had the highest present severity of 13 per cent yield loss in years when the disease developed. They were followed by Pleiochaeta root rot, anthracnose, brown leaf spot, Eradu patch and Rhizoctonia bare patch.
In the Southern Region, brown leaf spot had the highest potential severity of 17 per cent yield loss in years when it developed. It was followed by Pleiochaeta root rot, Thielaviopsis root rot, Rhizoctonia bare patch, Rhizoctonia root rot and cucumber mosaic. The highest present severity was 5 per cent shared by grey leaf spot and Thielaviopsis root rot, followed by brown leaf spot, Phytophthora root rot and Pleiochaeta root rot.
In the Western Region, brown leaf spot had the highest potential severity with 100 per cent yield loss in years when it developed. It was followed by Pleiochaeta root rot, anthracnose, epicotyl rot and the two Sclerotinia diseases. Sclerotinia crown rot and Sclerotinia stem rot had the highest present severity of 19 per cent yield loss in years when the disease developed. They were followed by anthracnose, Pleiochaeta root rot and Eradu patch.
4.5 losses from narrowleaf lupin diseases4.5.1 Potential and present percentage
yield lossesThe average annual yield loss was calculated from the incidence and severity data (see Section 2.5 for the method). The potential severity was used to calculate the potential losses if current controls were not used and the present severity to calculate present losses with current control measures. Losses were calculated at the zone level and aggregated to regional and national levels as in 4.3.1.
For Australia, four diseases had a potential average annual yield loss that exceeded 10 per cent. The highest was brown leaf spot with over 70 per cent potential loss, followed by Pleiochaeta root rot, epicotyl rot and anthracnose. No diseases had a present average annual loss that exceeded 10 per cent: the highest was Pleiochaeta root rot (6.5 per cent) followed by brown leaf spot, anthracnose and Rhizoctonia bare patch (Table 4.5).
In the Southern Region, no diseases had a potential average annual yield loss exceeding 10 per cent. The highest average annual potential yield loss was 1.8 per cent from brown leaf spot, followed by Rhizoctonia bare patch, Thielaviopsis root rot and Rhizoctonia root rot. With current disease controls, the highest loss was 0.2 per cent from
Thielaviopsis root rot (Table 4.5).In general, losses were much higher in the Western
Region where four diseases had potential losses that exceeded 10 per cent. The highest was brown leaf spot (100 per cent), followed by Pleiochaeta root rot, epicotyl rot, anthracnose and Rhizoctonia bare patch. No diseases had a present average annual yield loss that exceeded 10 per cent: the highest was Pleiochaeta root rot (9 per cent) followed by brown leaf spot, anthracnose, Rhizoctonia bare patch and Eradu patch (Table 4.5).
For Australia, the total present average annual yield loss from all diseases was 13 per cent. Necrotrophic leaf fungal diseases totalled 4.6 per cent, biotrophic leaf fungal diseases were nil, the root and crown fungi were 8.3 per cent, nematodes nil, viruses nil and phytoplasmas nil.
4.5.2 Quality effects of diseases on
narrowleaf lupinsBecause narrowleaf lupins are primarily for stockfeed, freedom from toxins is necessary. The Phomopsis stem blight fungus can infect seed and under some circumstances can produce a potent toxin. Infection levels above a certain level can make the seed unsuitable for animal feed and severely reduce its value. However, in practice this infection of seed is very rare. The greater problem is the development of the Phomopsis fungus on lupin stubble after harvest. This can make the stubble highly poisonous and greatly reduces its grazing value. Before guidelines were established for safe grazing, stock losses were occasionally very high and caused some farmers not to grow the crop.
The one disease identified as causing quality losses in narrowleaf lupins is anthracnose, with all those losses occurring in the Western Region (Table 4.6). The disease has the potential to cause considerable losses, but average present losses are relatively small.
4.5.3 Value of losses from narrowleaf lupin diseases
The value of these yield losses was calculated by relating the percentage losses to the gross value of narrowleaf lupin production in each zone, using the average value of narrowleaf lupins, over a five-year period (see Section 4.2). The value of quality losses were combined with these yield losses, and the total losses were calculated on a per hectare basis and on an aggregate basis for each zone, then for each GRDC region and nationally by weighting as in 4.3.1.
The potential losses estimated for each disease are in Table 4.7 ($ per hectare) and Table 4.8 (aggregate losses). For Australia, the five major diseases by potential loss on a per hectare basis and their total cost to the industry are:
Disease $/ha $ million
brown leaf spot 165.03 82.1
Pleiochaeta root rot 152.90 76.1
epicotyl rot 32.67 16.3
anthracnose 28.97 14.4
Rhizoctonia bare patch 6.10 3.0

GRDC | 36 | CuRRenT AnD PoTenTiAl CosTs fRoM DiseAses of Pulse CRoPs in AusTRAliA
The present losses estimated for each disease are in Table 4.7 ($ per hectare) and Table 4.8 (aggregate losses). For Australia, the five major diseases by average annual present loss on a per hectare basis and their total cost to the industry are:
Disease $/ha $ million
Pleiochaeta root rot 15.28 7.6
brown leaf spot 8.21 4.1
anthracnose 2.91 1.4
Rhizoctonia bare patch 2.36 1.2
Eradu patch 0.91 0.5
Total losses from others 1.06 0.5
Total Present loss 30.73 15.3
Collectively, present average annual losses from the necrotrophic leaf fungi were $5.6 million, biotrophic leaf fungi nil, root and crown fungi $9.7 million, nematodes nil and viruses nil (Table 4.8).
4.6 Value of control of narrowleaf lupin diseases
The value of present controls of narrowleaf lupin diseases is the difference between the potential average annual loss when current control practices were not in place and the present average annual loss with current controls in place. Estimates of the value of control for each disease surveyed on a per hectare basis and the total value for the production regions and Australia are in Table 4.9.
For Australia, the highest control value was $78.0 million for control of brown leaf spot followed by $68.5 million for Pleiochaeta root rot, $15.9 million for epicotyl rot and $13.0 million for anthracnose (Table 4.9).
These control values were almost wholly achieved in the Western Region. In the Southern Region, the highest control value was for brown leaf spot with $0.6 million per year.
The regional and national values are of primary consideration by funding bodies to judge the return on investment for development of a control. However, for farmers, the cost of using a control needs to be weighed against the return. Here, the per hectare cost is often more
useful. The control value for brown leaf spot in the Western Region was $222.45/ha but only $3.70/ha in the Southern Region.
For the survey, control measures were grouped in three broad categories: breeding (resistant cultivars); cultural practices including stubble management, tillage and crop rotation; and pesticides, including fungicides applied to the seed, in fertilisers and by spraying, and insecticides to control vectors. The proportion of control contributed by each category and its value are in Table 4.10.
Breeding and the use of genetic resistance provided 75 per cent of the control of anthracnose, worth $9.7 million per annum (Table 4.10). Although the estimated return for the value of harvested lupin seed is small for Phomopsis stem blight, this control value would be far higher if the feed value due to lower risk of lupinosis in stock were considered. Brown leaf spot ($4.1 million) also received a high value for control by breeding.
Cultural practices contributed 50 per cent or more of the control for 17 diseases. The greatest control value was for Pleiochaeta root rot ($68.4 million/year) followed by brown leaf spot ($50.5 million/year), epicotyl rot ($14.3 million/year), anthracnose ($1.9 million/year) and Rhizoctonia bare patch ($1.8 million/year) (Table 4.10).
Pesticides, mainly fungicides, contributed more than 50 per cent of the control for three diseases and 20 per cent or more for a further three. The top three average annual values for control with pesticides were brown leaf spot ($23.4 million), epicotyl rot ($1.6 million) and anthracnose ($1.3 million) (Table 4.10).
4.7 use of pesticides for control of narrowleaf lupin diseases
The total expenditure on pesticides for control of diseases is estimated at $0.9 million per year for narrowleaf lupins in the Southern Region. There were no narrowleaf lupins grown in the Northern Region and no estimates of pesticide use were available for the Western Region. In the Southern Region the expenditure was entirely for seed treatment ($0.9 million) and averaged $6.29/ha. In the Southern Region, 47 per cent of the narrowleaf lupin crop did not receive any fungicide (Table 4.11).
Table 4.6 Potential and present average annual quality losses from narrowleaf lupin diseases by GRDC Regions and Australia
Quality lossesNorthern Southern Western Australia
Potential Present Potential Present Potential Present Potential Present
$/ha
anthracnose - - 0.00 0.00 4.17 0.44 2.92 0.31
- 0.00 0.44 0.31
$ million
anthracnose - - 0.00 0.00 1.45 0.15 1.45 0.15
- 0.00 0.15 0.15- no crop grown

CuRRenT AnD PoTenTiAl CosTs fRoM DiseAses of Pulse CRoPs in AusTRAliA | 37 | GRDC
Table 4.7 Potential and present average annual costs ($/ha) from narrowleaf lupin diseases by GRDC Regions and Australia
DiseaseNorthern Southern Western Australia
Potential Present Potential Present Potential Present Potential Present
NECROTROPHIC LEAF FUNGI
grey mould - - 0.02 0.00 - - 0.01 0.00
Cladosporium leaf spot - - - - - - - -
anthracnose - - 0.00 0.00 41.39 4.16 28.97 2.91
Phomopsis stem blight - - 0.21 0.00 - - 0.06 0.00
brown leaf spot - - 3.75 0.05 234.16 11.71 165.03 8.21
grey leaf spot - - 0.24 0.24 0.00 0.00 0.07 0.07
SUB TOTAL - 0.29 15.87 11.19
BIOTROPHIC LEAF FUNGI
powdery mildew - - - - - - - -
SUB TOTAL - 0.00 0.00 0.00
ROOT AND CROWN FUNGI
Fusarium root and pod rot - - 0.04 0.00 - - 0.01 0.00
charcoal rot - - 0.03 0.00 0.00 0.00 0.01 0.00
Phytophthora root rot - - 0.11 0.03 - - 0.03 0.01
Pleiochaeta root rot - - 0.72 0.04 218.12 21.81 152.90 15.28
Pythium damping off - - 0.03 0.00 - - 0.01 0.00
Eradu patch - - 0.00 0.00 1.86 1.30 1.30 0.91
Rhizoctonia damping off - - 0.03 0.00 - - 0.01 0.00
Rhizoctonia root rot - - 0.63 0.10 - - 0.19 0.03
Rhizoctonia bare patch - - 1.05 0.10 8.26 3.33 6.10 2.36
epicotyl rot - - 0.00 0.00 46.68 0.94 32.67 0.66
Sclerotinia crown rot - - 0.12 0.03 0.12 0.12 0.12 0.09
Sclerotinia stem rot - - 0.12 0.03 0.10 0.10 0.11 0.08
Sclerotium wilt - - 0.05 0.00 0.00 0.00 0.01 0.00
Thielaviopsis root rot - - 0.98 0.39 0.00 0.00 0.29 0.12
Verticillium wilt - - - - 0.00 0.00 0.00 0.00
SUB TOTAL - 0.72 27.60 19.54
NEMATODES
root lesion nematode brachyurus - - - - - - - -
root lesion nematode neglectus - - - - 0.00 0.00 0.00 0.00
root lesion nematode penetrans - - - - - - - -
root lesion nematode teres - - - - - - - -
root lesion nematode thornei - - - - - - - -
burrowing nematode - - - - - - - -
SUB TOTAL - 0.00 0.00 0.00
VIRUSES
alfalfa mosaic - - - - - - - -
bean yellow mosaic - - - - - - - -
broad bean wilt - - - - - - - -
cucumber mosaic - - 1.57 0.00 - - 0.47 0.00
lettuce necrotic yellows - - - - - - - -
subterranean clover red leaf - - - - - - - -
SUB TOTAL - 0.00 0.00 0.00
TOTAL - 1.01 43.47 30.73- no data available

GRDC | 38 | CuRRenT AnD PoTenTiAl CosTs fRoM DiseAses of Pulse CRoPs in AusTRAliA
Table 4.8 Aggregate potential and present average annual costs ($ million) from narrowleaf lupin diseases by GRDC Regions and Australia
DiseaseNorthern Southern Western Australia
Potential Present Potential Present Potential Present Potential Present
NECROTROPHIC LEAF FUNGI
grey mould - - 0.0 0.0 - - 0.0 0.0
Cladosporium leaf spot - - - - - - - -
anthracnose - - 0.0 0.0 14.4 1.4 14.4 1.4
Phomopsis stem blight - - 0.0 0.0 - - 0.0 0.0
brown leaf spot - - 0.6 0.0 81.5 4.1 82.1 4.1
grey leaf spot - - 0.0 0.0 - - 0.0 0.0
SUB TOTAL - 0.0 5.5 5.6
BIOTROPHIC LEAF FUNGI
powdery mildew - - - - - - - -
SUB TOTAL - 0.0 0.0 0.0
ROOT AND CROWN FUNGI
Fusarium root and pod rot - - 0.0 0.0 - - 0.0 0.0
charcoal rot - - 0.0 0.0 0.0 0.0 0.0 0.0
Phytophthora root rot - - 0.0 0.0 - - 0.0 0.0
Pleiochaeta root rot - - 0.1 0.0 76.0 7.6 76.1 7.6
Pythium damping off - - 0.0 0.0 - - 0.0 0.0
Eradu patch - - 0.0 0.0 0.6 0.5 0.6 0.5
Rhizoctonia damping off - - 0.0 0.0 - - 0.0 0.0
Rhizoctonia root rot - - 0.1 0.0 - - 0.1 0.0
Rhizoctonia bare patch - - 0.2 0.0 2.9 1.2 3.0 1.2
epicotyl rot - - 0.0 0.0 16.3 0.3 16.3 0.3
Sclerotinia crown rot - - 0.0 0.0 0.0 0.0 0.1 0.0
Sclerotinia stem rot - - 0.0 0.0 0.0 0.0 0.1 0.0
Sclerotium wilt - - 0.0 0.0 0.0 0.0 0.0 0.0
Thielaviopsis root rot - - 0.1 0.1 0.0 0.0 0.1 0.1
Verticillium wilt - - - - 0.0 0.0 0.0 0.0
SUB TOTAL - 0.1 9.6 9.7
NEMATODES
root lesion nematode brachyurus - - - - - - - -
root lesion nematode neglectus - - - - 0.0 0.0 0.0 0.0
root lesion nematode penetrans - - - - - - - -
root lesion nematode teres - - - - - - - -
root lesion nematode thornei - - - - - - - -
burrowing nematode - - - - - - - -
SUB TOTAL - 0.0 0.0 0.0
VIRUSES
alfalfa mosaic - - - - - - - -
bean yellow mosaic - - - - - - - -
broad bean wilt - - - - - - - -
cucumber mosaic - - 0.2 0.0 - - 0.2 0.0
lettuce necrotic yellows - - - - - - - -
subterranean clover red leaf - - - - - - - -
SUB TOTAL - 0.0 0.0 0.0
TOTAL - 0.2 15.1 15.3

CuRRenT AnD PoTenTiAl CosTs fRoM DiseAses of Pulse CRoPs in AusTRAliA | 39 | GRDC
Table 4.9 Value of current disease control practices in narrowleaf lupins per hectare by GRDC Region and Australia
DiseasePer hectare ($) Total ($ million)
Northern Southern Western Australia Northern Southern Western Australia
NECROTROPHIC LEAF FUNGI
grey mould - 0.02 - 0.01 - 0.0 - 0.0
Cladosporium leaf spot - - - - - - - -
anthracnose - 0.00 37.23 26.06 - 0.0 13.0 13.0
Phomopsis stem blight - 0.21 - 0.06 - 0.0 - 0.0
brown leaf spot - 3.70 222.45 156.82 - 0.6 77.5 78.0
grey leaf spot - 0.00 0.00 0.00 - 0.0 - 0.0
BIOTROPHIC LEAF FUNGI
powdery mildew - - - - - - - -
ROOT AND CROWN FUNGI
Fusarium root and pod rot - 0.04 - 0.01 - 0.0 - 0.0
charcoal rot - 0.03 0.00 0.01 - 0.0 0.0 0.0
Phytophthora root rot - 0.08 - 0.02 - 0.0 - 0.0
Pleiochaeta root rot - 0.68 196.31 137.62 - 0.1 68.4 68.5
Pythium damping off - 0.03 - 0.01 - 0.0 - 0.0
Eradu patch - 0.00 0.56 0.39 - 0.0 0.2 0.2
Rhizoctonia damping off - 0.03 - 0.01 - 0.0 - 0.0
Rhizoctonia root rot - 0.53 - 0.16 - 0.1 - 0.1
Rhizoctonia bare patch - 0.95 4.93 3.74 - 0.1 1.7 1.9
epicotyl rot - 0.00 45.74 32.02 - 0.0 15.9 15.9
Sclerotinia crown rot - 0.10 0.00 0.03 - 0.0 0.0 0.0
Sclerotinia stem rot - 0.10 0.00 0.03 - 0.0 0.0 0.0
Sclerotium wilt - 0.05 0.00 0.01 - 0.0 0.0 0.0
Thielaviopsis root rot - 0.59 0.00 0.18 - 0.1 0.0 0.1
Verticillium wilt - - 0.00 0.00 - - 0.0 0.0
NEMATODES
root lesion nematode brachyurus - - - - - - - -
root lesion nematode neglectus - - 0.00 0.00 - - 0.0 0.0
root lesion nematode penetrans - - - - - - - -
root lesion nematode teres - - - - - - - -
root lesion nematode thornei - - - - - - - -
burrowing nematode - - - - - - - -
VIRUSES
alfalfa mosaic - - - - - - - -
bean yellow mosaic - - - - - - - -
broad bean wilt - - - - - - - -
cucumber mosaic - 1.57 - 0.47 - 0.2 - 0.2
lettuce necrotic yellows - - - - - - - -
subterranean clover red leaf - - - - - - - -- no data available

GRDC | 40 | CuRRenT AnD PoTenTiAl CosTs fRoM DiseAses of Pulse CRoPs in AusTRAliA
Table 4.10 Value of different forms of narrowleaf lupin disease control in Australia
DiseaseCost/value ($ million)
Contribution(%)
Contribution($ million)
Potential Present Control Breeding Cultural Pesticide Breeding Cultural Pesticide
NECROTROPHIC LEAF FUNGI
grey mould 0.0 0.0 0.0 0 57 43 0.0 0.0 0.0
Cladosporium leaf spot - - - - - -
anthracnose 14.4 1.4 13.0 75 15 10 9.7 1.9 1.3
Phomopsis stem blight 0.0 0.0 0.0 58 42 0 0.0 0.0 0.0
brown leaf spot 82.1 4.1 78.0 5 65 30 4.1 50.5 23.4
grey leaf spot 0.0 0.0 0.0 0.0 0.0 0.0
BIOTROPHIC LEAF FUNGI
powdery mildew - - - - - -
ROOT AND CROWN FUNGI
Fusarium root and pod rot 0.0 0.0 0.0 0 90 10 0.0 0.0 0.0
charcoal rot 0.0 0.0 0.0 0 100 0 0.0 0.0 0.0
Phytophthora root rot 0.0 0.0 0.0 0 100 0 0.0 0.0 0.0
Pleiochaeta root rot 76.1 7.6 68.5 0 100 0 0.1 68.4 0.0
Pythium damping off 0.0 0.0 0.0 0 50 50 0.0 0.0 0.0
Eradu patch 0.6 0.5 0.2 0 100 0 0.0 0.2 0.0
Rhizoctonia damping off 0.0 0.0 0.0 0 50 50 0.0 0.0 0.0
Rhizoctonia root rot 0.1 0.0 0.1 0 50 50 0.0 0.0 0.0
Rhizoctonia bare patch 3.0 1.2 1.9 0 98 2 0.0 1.8 0.0
epicotyl rot 16.3 0.3 15.9 0 90 10 0.0 14.3 1.6
Sclerotinia crown rot 0.1 0.0 0.0 0 96 4 0.0 0.0 0.0
Sclerotinia stem rot 0.1 0.0 0.0 0 96 4 0.0 0.0 0.0
Sclerotium wilt 0.0 0.0 0.0 0 80 20 0.0 0.0 0.0
Thielaviopsis root rot 0.1 0.1 0.1 0 100 0 0.0 0.1 0.0
Verticillium wilt 0.0 0.0 0.0 0.0 0.0 0.0
NEMATODES
root lesion nematode brachyurus - - - - - -
root lesion nematode neglectus 0.0 0.0 0.0 0.0 0.0 0.0
root lesion nematode penetrans - - - - - -
root lesion nematode teres - - - - - -
root lesion nematode thornei - - - - - -
burrowing nematode - - - - - -
VIRUSES
alfalfa mosaic - - - - - -
bean yellow mosaic - - - - - -
broad bean wilt - - - - - -
cucumber mosaic 0.2 0.0 0.2 0 100 0 0.0 0.2 0.0
lettuce necrotic yellows - - - - - -
subterranean clover red leaf - - - - - -- no data available
Table 4.11 Pesticide use on narrowleaf lupin crops for disease control by GRDC Regions and Australia
Region Crop area‘000 ha
Seed fungicide$ million
Foliar fungicide$ million
Total fungicide$ million
Other pesticides$ million
Total pesticides$ million Total $ per ha % no fungicide
Northern 0.0
Southern 149.2 0.9 0.0 0.9 0.0 0.9 6.29 47
Western 348.2
Australia 497.5

CuRRenT AnD PoTenTiAl CosTs fRoM DiseAses of Pulse CRoPs in AusTRAliA | 41 | GRDC
4.8 Discussion and ConclusionsDiseases have a high potential to damage narrowleaf lupin crops but are well controlled at present, with total present losses of $15.3 million or 13.6 per cent of the gross value of production. There is a marked difference in present losses between the Western and Southern regions, with most of the present loss in the Western Region. There, the present loss is $15.1 million or 18.6 per cent of the value of production, compared with $0.2 million or 0.5 per cent of the value of production in the Southern Region.
On average, the current average annual losses from narrowleaf lupin diseases are $30.43/ha nationally, with $43.47/ha in the Western Region and only $1.01/ha in the Southern Region. The five major diseases of narrowleaf lupins in Australia in order of potential and present losses are:
Rank By potential loss By present loss
1 brown leaf spot Pleiochaeta root rot
2 Pleiochaeta root rot brown leaf spot
3 epicotyl rot anthracnose
4 anthracnose Rhizoctonia bare patch
5 Rhizoctonia bare patch Eradu patch
Necrotrophic fungal leaf diseases cause present losses of $5.6 million per year in narrowleaf lupins in Australia, or 36 per cent of the total loss. The losses are dominated by brown leaf spot and anthracnose. Although their present average annual losses of $4.1 million and $1.4 million are substantial, they are considerably less than the potential losses of $82.1 million and $14.4 million, respectively.
The root and crown diseases cause present losses of $9.7 million per year, or 64 per cent of the total present disease losses. These losses are dominated by Pleiochaeta root rot and Rhizoctonia bare patch with present average annual losses of $7.6 million and $1.2 million, respectively. Effective current controls minimise the losses compared with the potential losses of $76.1 million and $16.3 million for Pleiochaeta root rot and epicotyl rot, respectively.
Biotrophic leaf fungi, nematodes, bacteria, viruses and phytoplasmas do not cause any recognised losses in narrowleaf losses at present. Without control, cucumber mosaic can cause some loss. However, the role of narrowleaf lupins as alternative hosts of nematodes and viruses that affect other crops may be important.
Current control values have reduced the losses from diseases considerably. Breeding, cultural measures and pesticides are generally used in conjunction, as shown by the following diseases:
DiseaseControl value
($ million)
Contribution to control ($ million) by
Breeding Cultural Pesticides
brown leaf spot 78.0 4.1 50.5 23.4
Pleiochaeta root rot 68.5 0.1 68.4 0.0
epicotyl rot 15.9 0.0 14.3 1.6
anthracnose 13.0 9.7 1.9 1.3
Rhizoctonia bare patch 1.9 0.0 1.8 0.0
The difference in yield losses from diseases between the Western and Southern Regions may be largely due to brown leaf spot and Pleiochaeta leaf spot, both caused by the same fungal pathogen, Pleiochaeta setosa. These diseases are effectively controlled by a combination of resistance, rotation, stubble management and seed fungicide.
Resistance and seed treatment can be applied equally effectively in both regions. However, the higher intensity of lupin growing in the Western Region means that there is likely to be a shorter interval between lupin crops in the rotation and a closer proximity to last year’s stubble than in the east. These factors would increase the inoculum load on new lupin crops and thus increase the potential for disease in the Western Region more so than in the Southern Region. In addition, anthracnose occurs widely in the Western Region but is absent from most of the Southern Region.
The foliar diseases have the potential to reduce grain quality by blemishes and reduced seed size. However, as narrowleaf lupins are used for stockfeed, this will have less effect on quality than on pulses used for human consumption and so have less effect on price. In areas where anthracnose is present there are increased seed production costs to control the disease. The disease can limit or prevent the sale of narrowleaf lupin seed to areas which are free of the pathogen. Further research on the effect of narrowleaf lupin diseases and the value of the harvested grain is warranted.

GRDC | 42 | CuRRenT AnD PoTenTiAl CosTs fRoM DiseAses of Pulse CRoPs in AusTRAliA
5.1 introductionAlbus lupins (Lupinus albus) are grown in the winter cropping areas of Australia in the Southern and Western regions. The crop is sown in autumn and harvested in late spring. Although the majority of the crop is for stockfeed, there is potential for albus lupins to be used for human consumption.
This section contains:n average area, production, yield and value of albus lupins
over a recent five-year period;n a list of the diseases of albus lupins that were considered;n the incidence and severity of the diseases in each
production area;n the potential and present yield loss as a percentage of
yield, effect on quality and the value of this loss;n overall control methods and their value for each disease;
andn the present level of expenditure on fungicides on the crop.
5.2 Albus lupin productionEstimation of the value of disease losses depends on base data on the area, yield and value of the crop. The production data for albus lupins are for the year 2008-09. The average
data for the five years ending in that year were calculated as representative of current production. Albus lupin production data were obtained from Pulse Australia.
The average area, yield, production and value of albus lupins in each agro-ecological zone are shown in Table 5.1. For the period 2004-05 to 2008-09, the average annual area of albus lupins sown in Australia was 31,800 hectares producing an average of 28,800 tonnes, with an overall average yield of 0.91t/ha.
The mean unit value of albus lupins over the five-year period was $400/t, giving an average gross value of production of $11.6 million per year.
Albus lupin production was mostly in the Southern Region with 98 per cent of the crop area, with 2 per cent of the crop area in the Western Region and none in the Northern Region.
5.3 Diseases of albus lupins5.3.1 Albus lupin diseases and their pathogensThere were 23 diseases of albus lupins considered in this survey, comprising four necrotrophic leaf fungal diseases, one biotrophic leaf disease, 12 root and crown fungal
5 CuRRenT AnD PoTenTiAl losses fRoM DiseAses of AlBus luPins
Table 5.1 Mean albus lupin area, yield, production and value by agro-ecological zone and GRDC region, 2004-05 to 2008-09
Area (‘000 ha) Yield (t/ha) Production (‘000 t) Gross value ($ million)
Queensland Burdekin 0.0 0.00 0.0 0.0
Queensland Atherton 0.0 0.00 0.0 0.0
Queensland Central 0.0 0.00 0.0 0.0
NSW North-East/Queensland South-East 0.0 0.00 0.0 0.0
NSW North-West/Queensland South-West 0.0 0.00 0.0 0.0
TOTAL NORTHERN REGION 0.0 0.00 0.0 0.0
NSW Central* 16.2 1.07 17.3 6.9
NSW–Victoria Slopes* 14.9 0.73 10.9 4.4
Victoria High Rainfall* 0.0 1.00 0.0 0.0
SA–Victoria Mallee* 0.0 1.00 0.0 0.0
SA–Victoria Border–Wimmera* 0.0 1.00 0.0 0.0
SA Mid-North/Lower Yorke, Eyre 0.0 0.00 0.0 0.0
Tasmania Grain Growing* 0.0 1.00 0.0 0.0
TOTAL SOUTHERN REGION 31.2 0.91 28.2 11.3
WA Northern 0.6 0.91 0.6 0.3
WA Central 0.0 0.00 0.0 0.0
WA Eastern 0.0 0.00 0.0 0.0
WA Sandplain–Mallee 0.0 0.00 0.0 0.0
WA Ord 0.0 0.00 0.0 0.0
Northern Territory Central (Katherine) 0.0 0.00 0.0 0.0
TOTAL WESTERN REGION 0.6 0.91 0.6 0.3
TOTAL AUSTRALIA 31.8 0.91 28.8 11.6* Disease data obtained for this zone

CuRRenT AnD PoTenTiAl CosTs fRoM DiseAses of Pulse CRoPs in AusTRAliA | 43 | GRDC
diseases and six viral diseases (Table 5.2). These diseases were caused by 16 fungi (one fungus, Pleiochaeta setosa, causes both a leaf spot and a root rot) and six viruses. There were no diseases caused by nematodes, bacteria and phytoplasmas considered.
Data on disease incidence, severity and control measures were obtained for all zones in the Southern Region where albus lupins are grown. There were no disease data from the Northern and Western Regions where there is no or very little production (Table 5.1). Disease information and the respondents for each zone are in Appendix B.
5.3.2 Distribution of the pathogens in AustraliaThe four necrotrophic leaf fungal diseases were present in the Southern Region but the biotrophic fungal disease powdery mildew was not present on albus lupins. Ten of the root and crown fungal diseases were present but the status of the viral diseases was unknown (Table 5.2).
Anthracnose affects all lupin species in Australia and is widely distributed in Western Australia but with a limited distribution in eastern Australia, where internal quarantine is in place to reduce its potential for spread.
5.4 incidence and severity of albus lupin diseases
5.4.1 incidence of albus lupin diseasesIncidence was assessed as the proportion of years that favoured development of the disease in each zone, and as the proportion of the crop area in the zone affected when the disease developed. As disease data were only supplied for the Southern Region, only the results for that region are given. These values were averaged for the region by weighting by the area sown to the crop in each zone for which disease data were available, and are shown in Table 5.3. The values for the Southern Region are the estimates for Australia.
Within the Southern Region, there were four diseases that occurred with a yearly incidence of 25 per cent or greater. The highest was Pleiochaeta root rot (60 per cent of years) followed by Phomopsis stem blight, Rhizoctonia root rot and Rhizoctonia bare patch. No disease occurred over 25 per cent of the crop area in years favourable for its development: the highest were Phomopsis stem blight, brown leaf spot, Rhizoctonia root rot and Rhizoctonia bare patch (all 20 per cent of the area) followed by Pleiochaeta root rot.
Table 5.2 Albus lupin diseases in this survey, their pathogens and their presencea in the GRDC Regions and AustraliaPathogen Disease Northern Southern Western Australia
NECROTROPHIC LEAF FUNGI
Botrytis cinerea grey mould - Y - Y
Colletotrichum lupini anthracnose - Y - Y
Diaporthe toxica Phomopsis stem blight - Y - Y
Pleiochaeta setosa brown leaf spot - Y - Y
BIOTROPHIC LEAF FUNGI
Oidium sp. powdery mildew - N - N
ROOT AND CROWN FUNGI
Fusarium avenaceum Fusarium root and pod rot - Y - Y
Macrophomina phaseolina charcoal rot - Y - Y
Pleiochaeta setosa Pleiochaeta root rot - Y - Y
Pythium spp. Pythium damping off - Y - Y
Rhizoctonia (thin binucleate) Eradu patch - N - N
Rhizoctonia spp. Rhizoctonia damping off - Y - Y
Rhizoctonia spp. Rhizoctonia root rot - Y - Y
Rhizoctonia AG8 Rhizoctonia bare patch - Y - Y
Sclerotinia minor Sclerotinia crown rot - Y - Y
Sclerotinia sclerotiorum Sclerotinia stem rot - Y - Y
Sclerotium rolfsii Sclerotium wilt - U - U
Phytophthora sp. sudden death - Y - Y
VIRUSES
Alfalfa mosaic virus alfalfa mosaic - U - U
Bean yellow mosaic virus bean yellow mosaic - U - U
Broad bean wilt virus broad bean wilt - U - U
Cucumber mosaic virus cucumber mosaic - U - U
Lettuce necrotic yellows virus lettuce necrotic yellows - U - U
Subterranean clover red leaf virus subterranean clover red leaf - U - U
a Y= present in region N = not recorded in region U = unknown status - no data available

GRDC | 44 | CuRRenT AnD PoTenTiAl CosTs fRoM DiseAses of Pulse CRoPs in AusTRAliA
5.4.2 severity of albus lupin diseasesSeverity was assessed as the percentage yield loss that occurred in affected crops in the zone in years favourable for development of the disease. Two assessments were made. The first was the potential severity, that is, the severity that would occur if current controls were not applied. The second was the present severity, when current controls are in place. These assessments were made at the zone level and aggregated to the region by weighting the average by the area of the crop in each zone (Table 5.4).
Severity assessments were only available for the Southern Region. There, six diseases have the potential to cause 10 per cent or more yield loss in years when they developed. Pleiochaeta root rot and sudden death were the highest (15 per cent loss) followed by Pythium damping off, Rhizoctonia damping off, Rhizoctonia root rot and Rhizoctonia bare patch. No disease has a present severity of more than 10 per cent yield loss but five have present severities of 5 per cent: Pleiochaeta root rot, Rhizoctonia damping off, Rhizoctonia root rot, Rhizoctonia bare patch and sudden death.
5.5 losses from albus lupin diseases5.5.1 Potential and present percentage
yield lossesThe average annual yield loss was calculated from the incidence and severity data (see Section 2.5 for the method). The potential severity was used to calculate the potential losses if current controls were not used and the present severity to calculate present losses with current control measures.
In the Southern Region, only Pleiochaeta root rot had a potential average annual yield loss of more than one per cent. It was followed by Rhizoctonia root rot, Rhizoctonia bare patch and Phomopsis stem blight. With current disease controls, no disease had a present average annual yield loss exceeding one per cent: the highest was Pleiochaeta root rot with 0.4 per cent, followed by Rhizoctonia root rot, Rhizoctonia bare patch and Rhizoctonia damping off (Table 5.5).
5.5.2 Quality effects of diseases
on albus lupinsAlbus lupins are grown for stockfeed and have potential for human consumption. Their value for human consumption is greater than for stockfeed but appearance
Table 5.3 Incidence of albus lupin diseases as a proportion of years when disease occurs (%) and as a proportion of the crop area affected when the disease develops (%) in the GRDC Regions and Australia
DiseaseNorthern Southern Western Australia
Years Area Years Area Years Area Years Area
NECROTROPHIC LEAF FUNGI
grey mould - - 5.0 5.0 - - 5.0 5.0
anthracnose - - 0.0 0.0 - - 0.0 0.0
Phomopsis stem blight - - 50.0 20.0 - - 50.0 20.0
brown leaf spot - - 20.0 20.0 - - 20.0 20.0
BIOTROPHIC LEAF FUNGI
powdery mildew - - 0.0 0.0 - - 0.0 0.0
ROOT AND CROWN FUNGI
Fusarium root and pod rot - - 10.0 10.0 - - 10.0 10.0
charcoal rot - - 10.0 5.0 - - 10.0 5.0
Pleiochaeta root rot - - 60.0 15.0 - - 60.0 15.0
Pythium damping off - - 20.0 10.0 - - 20.0 10.0
Eradu patch - - 0.0 0.0 - - 0.0 0.0
Rhizoctonia damping off - - 20.0 10.0 - - 20.0 10.0
Rhizoctonia root rot - - 30.0 20.0 - - 30.0 20.0
Rhizoctonia bare patch - - 30.0 20.0 - - 30.0 20.0
Sclerotinia crown rot - - 10.0 5.0 - - 10.0 5.0
Sclerotinia stem rot - - 10.0 5.0 - - 10.0 5.0
Sclerotium wilt - - - - - - - -
sudden death - - 10.0 10.0 - - 10.0 10.0
VIRUSES
alfalfa mosaic - - - - - - - -
bean yellow mosaic - - - - - - - -
broad bean wilt - - - - - - - -
cucumber mosaic - - - - - - - -
lettuce necrotic yellows - - - - - - - -
subterranean clover red leaf - - - - - - - -
- no data available

CuRRenT AnD PoTenTiAl CosTs fRoM DiseAses of Pulse CRoPs in AusTRAliA | 45 | GRDC
and freedom from blemishes are paramount for the former grade. Diseases that discolour or reduce the size of the seed can reduce grain quality and value.
No diseases were identified as causing present losses to albus lupin crops. However, Phomopsis stem blight can reduce the value of albus lupin stubble for grazing by producing the lupinosis toxin in the stubble. See section 4.5.2 for discussion of Phomopsis stem blight.
5.5.3 Value of losses from albus lupin diseasesThe value of these yield losses was calculated by relating the percentage losses to the gross value of albus lupin production in each zone, using the average value of albus lupins, over a five-year period (see Section 5.2). These losses were calculated on a per hectare basis and on an aggregate basis for each zone, then for the Southern Region. Since the area of albus lupins in the Western Region was only two per cent of the national total, the estimates for the Southern Region will be close to the national totals.
The potential losses estimated for each disease are in Table 5.6 ($ per hectare) and Table 5.7 (aggregate losses). For Australia, the five major diseases by potential loss on a per hectare basis and their total cost to the industry are:
Disease $/ha $ million
Pleiochaeta root rot 4.89 0.15
Rhizoctonia bare patch 2.17 0.07
Rhizoctonia root rot 2.17 0.07
Phomopsis stem blight 1.81 0.06
brown leaf spot 0.72 0.02
The present losses estimated for each disease are in Table 5.6 ($ per hectare) and Table 5.7 (aggregate losses). For Australia, the five major diseases by average annual present loss on a per hectare basis and their total cost to the industry are:
Disease $/ha $ million
Pleiochaeta root rot 1.63 0.05
Rhizoctonia bare patch 1.09 0.03
Rhizoctonia root rot 1.09 0.03
Rhizoctonia damping off 0.36 0.01
sudden death 0.18 0.01
Total losses from others 0.00 0.01
Total Present loss 4.35 0.14
Table 5.4 Potential and present severity of albus lupin diseases (% yield loss in years suitable for disease development) in the GRDC Regions and Australia
DiseaseNorthern Southern Western Australia
Potential Present Potential Present Potential Present Potential Present
NECROTROPHIC LEAF FUNGI
grey mould - - 5.0 0.0 - - 5.0 0.0
anthracnose - - 0.0 0.0 - - 0.0 0.0
Phomopsis stem blight - - 5.0 0.0 - - 5.0 0.0
brown leaf spot - - 5.0 0.0 - - 5.0 0.0
BIOTROPHIC LEAF FUNGI
powdery mildew - - 0.0 0.0 - - 0.0 0.0
ROOT AND CROWN FUNGI
Fusarium root and pod rot - - 5.0 0.0 - - 5.0 0.0
charcoal rot - - 5.0 0.0 - - 5.0 0.0
Pleiochaeta root rot - - 15.0 5.0 - - 15.0 5.0
Pythium damping off - - 10.0 0.0 - - 10.0 0.0
Eradu patch - - 0.0 0.0 - - 0.0 0.0
Rhizoctonia damping off - - 10.0 5.0 - - 10.0 5.0
Rhizoctonia root rot - - 10.0 5.0 - - 10.0 5.0
Rhizoctonia bare patch - - 10.0 5.0 - - 10.0 5.0
Sclerotinia crown rot - - 5.0 0.0 - - 5.0 0.0
Sclerotinia stem rot - - 5.0 0.0 - - 5.0 0.0
Sclerotium wilt - - - - - - - -
sudden death - - 15.0 5.0 - - 15.0 5.0
VIRUSES
alfalfa mosaic - - - - - - - -
bean yellow mosaic - - - - - - - -
broad bean wilt - - - - - - - -
cucumber mosaic - - - - - - - -
lettuce necrotic yellows - - - - - - - -
subterranean clover red leaf - - - - - - - -
- no data available

GRDC | 46 | CuRRenT AnD PoTenTiAl CosTs fRoM DiseAses of Pulse CRoPs in AusTRAliA
Table 5.5 Potential and present average annual yield losses (%) from albus lupin diseases by GRDC Regions and Australia
DiseaseNorthern Southern Western Australia
Potential Present Potential Present Potential Present Potential Present
NECROTROPHIC LEAF FUNGI
grey mould - - 0.0 0.0 - - 0.0 0.0
anthracnose - - 0.0 0.0 - - 0.0 0.0
Phomopsis stem blight - - 0.5 0.0 - - 0.5 0.0
brown leaf spot - - 0.2 0.0 - - 0.2 0.0
SUB TOTAL 0.0 0.0
BIOTROPHIC LEAF FUNGI
powdery mildew - - 0.0 0.0 - - 0.0 0.0
SUB TOTAL 0.0 0.0
ROOT AND CROWN FUNGI
Fusarium root and pod rot - - 0.0 0.0 - - 0.0 0.0
charcoal rot - - 0.0 0.0 - - 0.0 0.0
Pleiochaeta root rot - - 1.3 0.4 - - 1.3 0.4
Pythium damping off - - 0.2 0.0 - - 0.2 0.0
Eradu patch - - 0.0 0.0 - - 0.0 0.0
Rhizoctonia damping off - - 0.2 0.1 - - 0.2 0.1
Rhizoctonia root rot - - 0.6 0.3 - - 0.6 0.3
Rhizoctonia bare patch - - 0.6 0.3 - - 0.6 0.3
Sclerotinia crown rot - - 0.0 0.0 - - 0.0 0.0
Sclerotinia stem rot - - 0.0 0.0 - - 0.0 0.0
Sclerotium wilt - - - - - - - -
sudden death - - 0.1 0.0 - - 0.1 0.0
SUB TOTAL 1.2 1.2
VIRUSES
alfalfa mosaic - - - - - - - -
bean yellow mosaic - - - - - - - -
broad bean wilt - - - - - - - -
cucumber mosaic - - - - - - - -
lettuce necrotic yellows - - - - - - - -
subterranean clover red leaf - - - - - - - -
SUB TOTAL 0.0 0.0
TOTAL 1.2 1.2- no data available
Collectively, present average annual losses from the necrotrophic leaf fungi were nil, biotrophic leaf fungi nil, root and crown fungi $0.14 million, nematodes nil, bacteria nil, viruses nil and phytoplasmas nil.
5.6 Value of control of albus lupin diseases
The value of present controls of albus lupin diseases is the difference between the potential average annual loss when current control practices were not in place and the present average annual loss with current controls in place. Estimates of the value of control for each disease surveyed on a per hectare basis and the total value for the Southern Region are in Table 5.8. No estimates were made for the Western Region. As it contained only 2 per cent of the albus lupin area, the estimates for the Southern Region provide a good estimate of the Australian values.
The value of controls is much less for albus lupins than
for the other pulses. The highest was for Pleiochaeta root rot ($3.26 per hectare and a total of $0.10 million), followed by Phomopsis stem blight, Rhizoctonia root rot and Rhizoctonia bare patch.
For the survey, control measures were grouped in three broad categories: breeding (resistant cultivars); cultural practices including stubble management, tillage and crop rotation; and pesticides, including fungicides applied to the seed, in fertilisers and by spraying, and insecticides to control vectors. The proportion of control contributed by each category and its value are in Table 5.9.
Breeding and the use of genetic resistance provided 50 per cent or more of the control of three diseases: Phomopsis stem blight and Pleiochaeta root rot, each worth $50,000; and brown leaf spot, worth $20,000 (Table 5.9).
Cultural practices contributed 50 per cent or more of the control for 11 diseases and more than 25 per cent for an additional one. The top five average annual values for this

CuRRenT AnD PoTenTiAl CosTs fRoM DiseAses of Pulse CRoPs in AusTRAliA | 47 | GRDC
control were: Pleiochaeta root rot, $40,000; Rhizoctonia root rot and Rhizoctonia bare patch, $30,000; Pythium damping off, $20,000; and Phomopsis stem blight, $10,000 (Table 5.9).
Pesticides, mainly fungicides, contributed more than 25 per cent of the control for two diseases: Sclerotinia crown rot and Sclerotinia stem rot. However, as these caused very little loss in the Southern Region, the value was less than $10,000. Pesticides had a control value of $10,000 for three diseases: Pleiochaeta root rot, Rhizoctonia root rot and Rhizoctonia bare patch (Table 5.9).
5.7 use of pesticides for control of albus lupin diseases
Albus lupins were not grown in the Northern Region and their use was not estimated for the Western Region. However, as 98 per cent of the crop was grown in the Southern Region, the estimates for that region will be similar to the national values.
The total expenditure on pesticides for control of diseases in the Southern Region is estimated at $0.2 million per year for albus lupins (Table 5.10). The expenditure was for seed dressing. The costs of fungicide applications to albus lupin crops averaged $6.00/ha across Australia, although 70 per cent of crops were not treated (Table 5.10), very low compared to other pulse crops besides narrowleaf lupins.
5.8 Discussion and ConclusionsDiseases have a moderate potential to damage albus lupin crops but are well controlled at present, with total present losses of $140,000 or 1.2 per cent of the gross value of production in the Southern Region, which has 98 per cent of the crop area. On average, the current average annual losses from albus lupin diseases in the Southern Region are $4.35/ha. The five major diseases of albus lupins in Australia in order of potential and present losses are:
Table 5.6 Potential and present average annual costs ($/ha) from albus lupin diseases by GRDC Region and Australia
DiseaseNorthern Southern Western Australia
Potential Present Potential Present Potential Present Potential Present
NECROTROPHIC LEAF FUNGI
grey mould 0.05 0.00 - - 0.05 0.00
anthracnose 0.00 0.00 - - 0.00 0.00
Phomopsis stem blight 1.81 0.00 - - 1.81 0.00
brown leaf spot 0.72 0.00 - - 0.72 0.00
SUB TOTAL 0.00 - 0.00
BIOTROPHIC LEAF FUNGI
powdery mildew 0.00 0.00 - - 0.00 0.00
SUB TOTAL 0.00 - 0.00
ROOT AND CROWN FUNGI
Fusarium root and pod rot 0.18 0.00 - - 0.18 0.00
charcoal rot 0.09 0.00 - - 0.09 0.00
Pleiochaeta root rot 4.89 1.63 - - 4.89 1.63
Pythium damping off 0.72 0.00 - - 0.72 0.00
Eradu patch 0.00 0.00 - - 0.00 0.00
Rhizoctonia damping off 0.72 0.36 - - 0.72 0.36
Rhizoctonia root rot 2.17 1.09 - - 2.17 1.09
Rhizoctonia bare patch 2.17 1.09 - - 2.17 1.09
Sclerotinia crown rot 0.09 0.00 - - 0.09 0.00
Sclerotinia stem rot 0.09 0.00 - - 0.09 0.00
Sclerotium wilt - - - - - -
sudden death 0.54 0.18 - - 0.54 0.18
SUB TOTAL 4.35 - 4.35
VIRUSES
alfalfa mosaic - - - - - -
bean yellow mosaic - - - - - -
broad bean wilt - - - - - -
cucumber mosaic - - - - - -
lettuce necrotic yellows - - - - - -
subterranean clover red leaf - - - - - -
SUB TOTAL 0.00 0.00
TOTAL 4.35 4.35- no data available
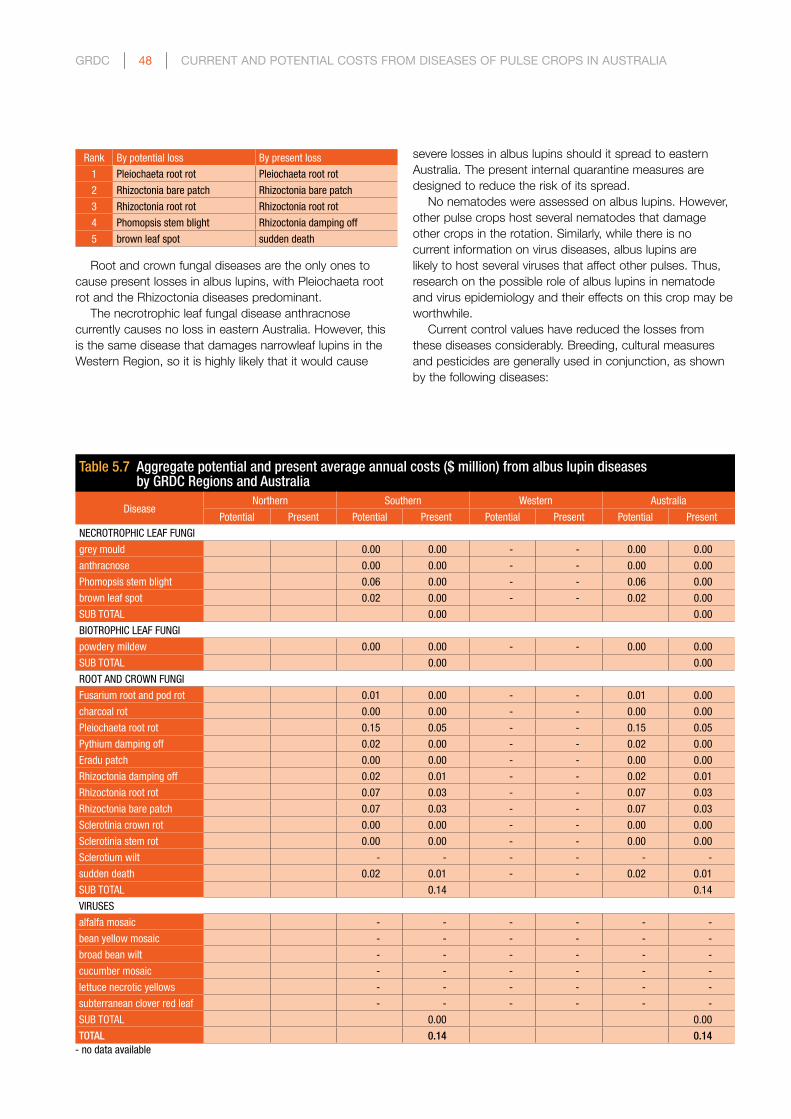
GRDC | 48 | CuRRenT AnD PoTenTiAl CosTs fRoM DiseAses of Pulse CRoPs in AusTRAliA
Rank By potential loss By present loss
1 Pleiochaeta root rot Pleiochaeta root rot
2 Rhizoctonia bare patch Rhizoctonia bare patch
3 Rhizoctonia root rot Rhizoctonia root rot
4 Phomopsis stem blight Rhizoctonia damping off
5 brown leaf spot sudden death
Root and crown fungal diseases are the only ones to cause present losses in albus lupins, with Pleiochaeta root rot and the Rhizoctonia diseases predominant.
The necrotrophic leaf fungal disease anthracnose currently causes no loss in eastern Australia. However, this is the same disease that damages narrowleaf lupins in the Western Region, so it is highly likely that it would cause
Table 5.7 Aggregate potential and present average annual costs ($ million) from albus lupin diseases by GRDC Regions and Australia
DiseaseNorthern Southern Western Australia
Potential Present Potential Present Potential Present Potential Present
NECROTROPHIC LEAF FUNGI
grey mould 0.00 0.00 - - 0.00 0.00
anthracnose 0.00 0.00 - - 0.00 0.00
Phomopsis stem blight 0.06 0.00 - - 0.06 0.00
brown leaf spot 0.02 0.00 - - 0.02 0.00
SUB TOTAL 0.00 0.00
BIOTROPHIC LEAF FUNGI
powdery mildew 0.00 0.00 - - 0.00 0.00
SUB TOTAL 0.00 0.00
ROOT AND CROWN FUNGI
Fusarium root and pod rot 0.01 0.00 - - 0.01 0.00
charcoal rot 0.00 0.00 - - 0.00 0.00
Pleiochaeta root rot 0.15 0.05 - - 0.15 0.05
Pythium damping off 0.02 0.00 - - 0.02 0.00
Eradu patch 0.00 0.00 - - 0.00 0.00
Rhizoctonia damping off 0.02 0.01 - - 0.02 0.01
Rhizoctonia root rot 0.07 0.03 - - 0.07 0.03
Rhizoctonia bare patch 0.07 0.03 - - 0.07 0.03
Sclerotinia crown rot 0.00 0.00 - - 0.00 0.00
Sclerotinia stem rot 0.00 0.00 - - 0.00 0.00
Sclerotium wilt - - - - - -
sudden death 0.02 0.01 - - 0.02 0.01
SUB TOTAL 0.14 0.14
VIRUSES
alfalfa mosaic - - - - - -
bean yellow mosaic - - - - - -
broad bean wilt - - - - - -
cucumber mosaic - - - - - -
lettuce necrotic yellows - - - - - -
subterranean clover red leaf - - - - - -
SUB TOTAL 0.00 0.00
TOTAL 0.14 0.14- no data available
severe losses in albus lupins should it spread to eastern Australia. The present internal quarantine measures are designed to reduce the risk of its spread.
No nematodes were assessed on albus lupins. However, other pulse crops host several nematodes that damage other crops in the rotation. Similarly, while there is no current information on virus diseases, albus lupins are likely to host several viruses that affect other pulses. Thus, research on the possible role of albus lupins in nematode and virus epidemiology and their effects on this crop may be worthwhile.
Current control values have reduced the losses from these diseases considerably. Breeding, cultural measures and pesticides are generally used in conjunction, as shown by the following diseases:

CuRRenT AnD PoTenTiAl CosTs fRoM DiseAses of Pulse CRoPs in AusTRAliA | 49 | GRDC
Disease Control value ($ million)
Contribution to control ($ million) by
Breeding Cultural Pesticides
Pleiochaeta root rot 0.10 0.05 0.04 0.01
Phomopsis stem blight 0.06 0.05 0.01 0.00
Rhizoctonia bare patch 0.03 0.00 0.03 0.01
Rhizoctonia root rot 0.03 0.00 0.03 0.01
brown leaf spot 0.02 0.02 0.00 0.00
Foliar and stem diseases have the potential to reduce grain quality through blemishes and reduced seed size. These could reduce the grading from human consumption quality to feed and so reduce the value of the grain. More importantly, Phomopsis stem blight can result in dangerous levels of toxin in the stubble, reducing its value for grazing. Further research on the effect of albus lupin diseases and the value of the harvested grain and stubble is warranted, since this is likely to have a major effect on the value of the loss and justify greater efforts at control.
Table 5.8 Value of current disease control practices in albus lupins per hectare by GRDC Region and Australia
DiseasePer hectare ($) Total ($ million)
Northern Southern Western Australia Northern Southern Western Australia
Necrotrophic leaf fungi
grey mould 0.05 - 0.05 - 0.00 - 0.00
anthracnose 0.00 - 0.00 - 0.00 - 0.00
Phomopsis stem blight 1.81 - 1.81 - 0.06 - 0.06
brown leaf spot 0.72 - 0.72 - 0.02 - 0.02
Biotrophic leaf fungi
powdery mildew 0.00 - 0.00 - 0.00 - 0.00
Root and crown fungi
Fusarium root and pod rot 0.18 - 0.18 - 0.01 - 0.01
charcoal rot 0.09 - 0.09 - 0.00 - 0.00
Pleiochaeta root rot 3.26 - 3.26 - 0.10 - 0.10
Pythium damping off 0.72 - 0.72 - 0.02 - 0.02
Eradu patch 0.00 - 0.00 - 0.00 - 0.00
Rhizoctonia damping off 0.36 - 0.36 - 0.01 - 0.01
Rhizoctonia root rot 1.09 - 1.09 - 0.03 - 0.03
Rhizoctonia bare patch 1.09 - 1.09 - 0.03 - 0.03
Sclerotinia crown rot 0.09 - 0.09 - 0.00 - 0.00
Sclerotinia stem rot 0.09 - 0.09 - 0.00 - 0.00
Sclerotium wilt - - - - - - -
sudden death 0.36 - 0.36 - 0.01 - 0.01
Viruses
alfalfa mosaic - - - - - - -
bean yellow mosaic - - - - - - -
broad bean wilt - - - - - - -
cucumber mosaic - - - - - - -
lettuce necrotic yellows - - - - - - -
subterranean clover red leaf - - - - - - -- no data available

GRDC | 50 | CuRRenT AnD PoTenTiAl CosTs fRoM DiseAses of Pulse CRoPs in AusTRAliA
Table 5.9 Value of different forms of albus lupin disease control in Australia
DiseaseCost/value ($ million) Contribution (%) Contribution ($ million)
Potential Present Control Breeding Cultural Pesticide Breeding Cultural Pesticide
Necrotrophic leaf fungi
grey mould 0.00 0.00 0.00 0 90 10 0.00 0.00 0.00
anthracnose 0.00 0.00 0.00 0 100 0 0.00 0.00 0.00
Phomopsis stem blight 0.06 0.00 0.06 80 20 0 0.05 0.01 0.00
brown leaf spot 0.02 0.00 0.02 80 20 0 0.02 0.00 0.00
Biotrophic leaf fungi
powdery mildew 0.00 0.00 0.00 0.00 0.00 0.00
Root and crown fungi
Fusarium root and pod rot 0.01 0.00 0.01 0 80 20 0.00 0.00 0.00
charcoal rot 0.00 0.00 0.00 0 100 0 0.00 0.00 0.00
Pleiochaeta root rot 0.15 0.05 0.10 50 40 10 0.05 0.04 0.01
Pythium damping off 0.02 0.00 0.02 0 80 20 0.00 0.02 0.00
Eradu patch 0.00 0.00 0.00 0.00 0.00 0.00
Rhizoctonia damping off 0.02 0.01 0.01 0 80 20 0.00 0.01 0.00
Rhizoctonia root rot 0.07 0.03 0.03 0 80 20 0.00 0.03 0.01
Rhizoctonia bare patch 0.07 0.03 0.03 0 80 20 0.00 0.03 0.01
Sclerotinia crown rot 0.00 0.00 0.00 0 70 30 0.00 0.00 0.00
Sclerotinia stem rot 0.00 0.00 0.00 0 70 30 0.00 0.00 0.00
Sclerotium wilt - - - - - -
sudden death 0.02 0.01 0.01 0 100 0 0.00 0.01 0.00
Viruses
alfalfa mosaic - - - - - -
bean yellow mosaic - - - - - -
broad bean wilt - - - - - -
cucumber mosaic - - - - - -
lettuce necrotic yellows - - - - - -
subterranean clover red leaf - - - - - -- no data available
Table 5.10 Pesticide use on albus lupin crops for disease control by GRDC Regions and Australia
Region Crop area‘000 ha
Seed fungicide$ million
Foliar fungicide$ million
Total fungicide$ million
Other pesticides$ million
Total pesticides$ million Total $ per ha % no fungicide
Northern 0.0
Southern 31.2 0.2 0.0 0.2 0.0 0.2 6.00 70
Western 0.6 - - - - - - -
Australia 31.8
- no data available

CuRRenT AnD PoTenTiAl CosTs fRoM DiseAses of Pulse CRoPs in AusTRAliA | 51 | GRDC
6.1 introductionChickpeas (Cicer arietinum) are grown in the winter cropping areas of Australia in the three GRDC production regions. The crop is sown from late autumn to early winter and harvested in late spring. Chickpeas are grown for human consumption and so the harvested seed has high quality standards.
This section contains:n average area, production, yield and value of chickpeas
over a recent five-year period;n a list of the diseases of chickpeas that were considered;n the incidence and severity of the diseases in each
production area;n the potential and present yield loss as a percentage of
yield, effect on quality and the value of this loss;n overall control methods and their value for each disease;
andn the present level of expenditure on fungicides on the crop.
6.2 Chickpea productionEstimation of the value of disease losses depends on base data on the area, yield and value of the crop. The production data for chickpeas are for the year 2008-09. The average data for the five years ending 2008-09 were calculated as
representative of current production. Chickpea production data were obtained from Pulse Australia.
The average area, yield, production and value of chickpeas in each agro-ecological zone are shown in Table 6.1. For the period 2004-05 to 2008-09, the average annual area of chickpeas sown in Australia was 299,700 hectares producing an average of 348,400 tonnes, with an overall average yield of 1.16t/ha.
The mean unit value of chickpeas over the five-year period was $411/t, giving an average gross value of production of $151.3 million per year.
Chickpea production was mostly in the Northern Region with 73 per cent of the crop area, with 25 per cent of the crop area in the Southern Region and 1 per cent in the Western Region.
6.3 Diseases of chickpeas6.3.1 Chickpea diseases and their pathogensThere were 41 diseases of chickpeas considered in this survey, comprising four necrotrophic leaf fungal diseases, one biotrophic leaf disease, 14 root and crown fungal diseases, seven nematode diseases, 14 viral diseases and one phytoplasma disease (Table 6.2). These diseases were
6 CuRRenT AnD PoTenTiAl losses fRoM DiseAses of ChiCkPeAs
Table 6.1 Mean chickpea area, yield, production and value by agro-ecological zone and GRDC region 2004-05 to 2008-09
Area (‘000 ha) Yield (t/ha) Production (‘000 t) Gross value ($ million)
Queensland Burdekin 2.7 1.19 3.2 1.3
Queensland Atherton 0.0 0.00 0.0 0.0
Queensland Central* 33.4 1.38 46.3 19.0
NSW North-East/Queensland South-East* 88.6 1.30 115.3 47.0
NSW North-West/Queensland South-West* 95.4 1.09 103.8 41.6
TOTAL NORTHERN REGION 220.1 1.22 268.7 109.0
NSW Central* 32.9 1.19 39.1 15.7
NSW–Victoria Slopes* 4.7 1.01 4.7 2.6
Victoria High Rainfall* 3.0 0.08 0.2 0.2
SA–Victoria Mallee* 15.8 0.78 12.4 9.0
SA–Victoria Border–Wimmera* 13.9 0.87 12.1 8.8
SA Mid-North/Lower Yorke, Eyre* 5.4 1.19 6.5 2.6
Tasmania Grain Growing 0.0 0.00 0.0 0.0
TOTAL SOUTHERN REGION 75.7 0.99 75.0 39.0
WA Northern* 2.7 1.19 3.2 1.3
WA Central* 0.0 1.00 0.0 0.0
WA Eastern* 0.0 1.00 0.0 0.0
WA Sandplain–Mallee 0.0 0.00 0.0 0.0
WA Ord 1.1 1.32 1.5 2.1
Northern Territory Central (Katherine) 0.0 0.00 0.0 0.0
TOTAL WESTERN REGION 3.8 1.23 4.7 3.4
TOTAL AUSTRALIA 299.7 1.16 348.4 151.3* Disease data obtained for this zone
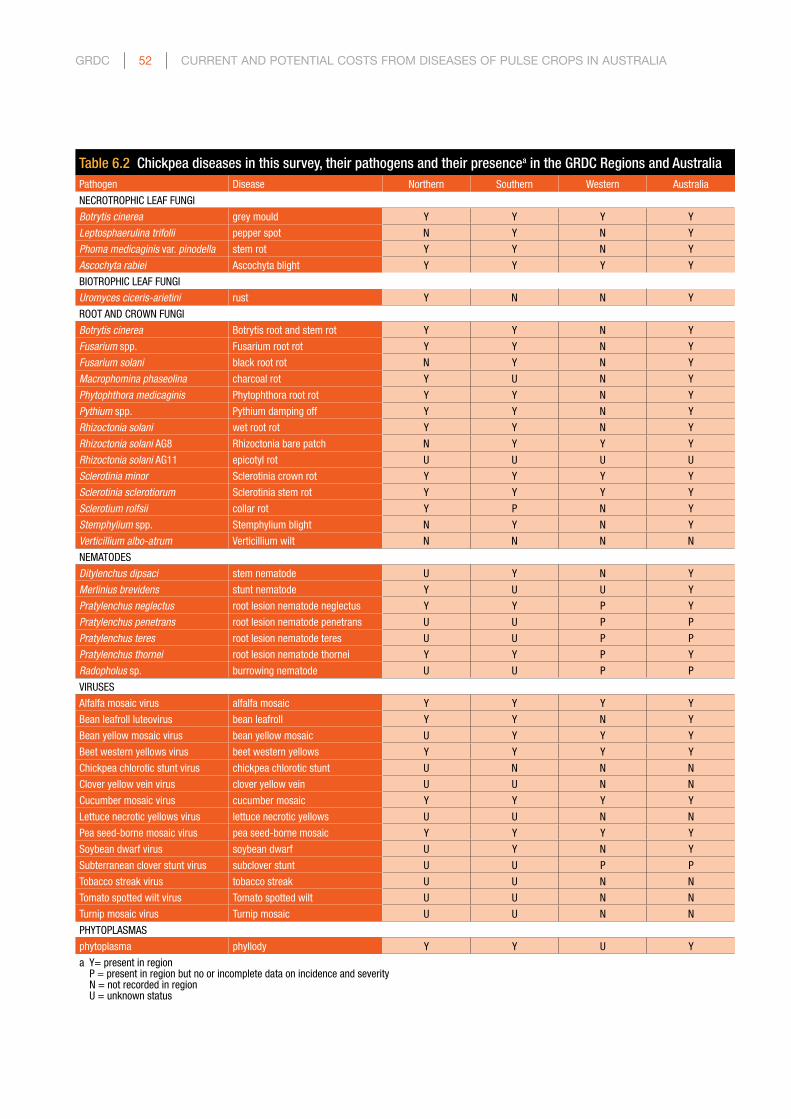
GRDC | 52 | CuRRenT AnD PoTenTiAl CosTs fRoM DiseAses of Pulse CRoPs in AusTRAliA
Table 6.2 Chickpea diseases in this survey, their pathogens and their presencea in the GRDC Regions and AustraliaPathogen Disease Northern Southern Western Australia
NECROTROPHIC LEAF FUNGI
Botrytis cinerea grey mould Y Y Y Y
Leptosphaerulina trifolii pepper spot N Y N Y
Phoma medicaginis var. pinodella stem rot Y Y N Y
Ascochyta rabiei Ascochyta blight Y Y Y Y
BIOTROPHIC LEAF FUNGI
Uromyces ciceris-arietini rust Y N N Y
ROOT AND CROWN FUNGI
Botrytis cinerea Botrytis root and stem rot Y Y N Y
Fusarium spp. Fusarium root rot Y Y N Y
Fusarium solani black root rot N Y N Y
Macrophomina phaseolina charcoal rot Y U N Y
Phytophthora medicaginis Phytophthora root rot Y Y N Y
Pythium spp. Pythium damping off Y Y N Y
Rhizoctonia solani wet root rot Y Y N Y
Rhizoctonia solani AG8 Rhizoctonia bare patch N Y Y Y
Rhizoctonia solani AG11 epicotyl rot U U U U
Sclerotinia minor Sclerotinia crown rot Y Y Y Y
Sclerotinia sclerotiorum Sclerotinia stem rot Y Y Y Y
Sclerotium rolfsii collar rot Y P N Y
Stemphylium spp. Stemphylium blight N Y N Y
Verticillium albo-atrum Verticillium wilt N N N N
NEMATODES
Ditylenchus dipsaci stem nematode U Y N Y
Merlinius brevidens stunt nematode Y U U Y
Pratylenchus neglectus root lesion nematode neglectus Y Y P Y
Pratylenchus penetrans root lesion nematode penetrans U U P P
Pratylenchus teres root lesion nematode teres U U P P
Pratylenchus thornei root lesion nematode thornei Y Y P Y
Radopholus sp. burrowing nematode U U P P
VIRUSES
Alfalfa mosaic virus alfalfa mosaic Y Y Y Y
Bean leafroll luteovirus bean leafroll Y Y N Y
Bean yellow mosaic virus bean yellow mosaic U Y Y Y
Beet western yellows virus beet western yellows Y Y Y Y
Chickpea chlorotic stunt virus chickpea chlorotic stunt U N N N
Clover yellow vein virus clover yellow vein U U N N
Cucumber mosaic virus cucumber mosaic Y Y Y Y
Lettuce necrotic yellows virus lettuce necrotic yellows U U N N
Pea seed-borne mosaic virus pea seed-borne mosaic Y Y Y Y
Soybean dwarf virus soybean dwarf U Y N Y
Subterranean clover stunt virus subclover stunt U U P P
Tobacco streak virus tobacco streak U U N N
Tomato spotted wilt virus Tomato spotted wilt U U N N
Turnip mosaic virus Turnip mosaic U U N N
PHYTOPLASMAS
phytoplasma phyllody Y Y U Y
a Y= present in region P = present in region but no or incomplete data on incidence and severity N = not recorded in region U = unknown status

CuRRenT AnD PoTenTiAl CosTs fRoM DiseAses of Pulse CRoPs in AusTRAliA | 53 | GRDC
caused by 18 fungi (Botrytis cinerea is both an aerial stem disease and a root rot), seven nematodes, 14 viruses and one phytoplasma. No bacterial diseases were considered.
Because several species of the Pratylenchus nematodes attack crops and pastures, the species names ‘neglectus’, ‘penetrans’, ‘teres’ and ‘thornei’ were added to the common name ‘root lesion nematode’ for clarity.
Data on disease incidence, severity and control measures were obtained for all zones in the Northern, Southern and Western regions and where chickpeas are grown, except for the Queensland Burdekin and WA Ord Zones (Table 6.1). These zones had 1.2 per cent of the chickpea area in the Northern Zone and 29.2 per cent of the area in the Western Zone, or 1.3 per cent of the Australian area. Disease information and the respondents for each zone are in Appendix B.
6.3.2 Distribution of the pathogens in AustraliaThirty-two of the pathogens surveyed were reported as present in one or more of the regions: 21 in the Northern Region, 26 in the Southern and 16 in the Western (Table 6.2).
Two of the four necrotrophic leaf fungal diseases were present in all regions, one present in the two eastern regions, and one present only in the Southern Region. The biotrophic leaf disease rust was only present in the Northern Region (Table 6.2).
Of the 14 root and crown fungal diseases, nine were present in the Northern Region, 11 in the Southern Region and three in the Western Region. Two diseases, epicotyl rot and Verticillium wilt, were not reported on chickpeas in any region. Only the two Sclerotinia rots were present in all regions. Of the remainder, six were present in the two eastern regions, one in the Southern and Western regions, one only in the Northern Region and two only in the Southern Region.
Of the seven nematodes, three are present on chickpeas in the Northern Region, three in the Southern and five in the Western. Two were present in all regions.
Of the 14 viral diseases considered, five were present on chickpeas in the Northern Region, seven in the Southern and six in the Western. Four were present in all regions, a further one in the two eastern regions, and one in the Southern and Western Regions. Six were not reported in any region. The phytoplasma disease is present on chickpeas in both eastern regions (Table 6.2).
6.4 incidence and severity of chickpea diseases
6.4.1 incidence of chickpea diseasesIncidence was assessed as the proportion of years that favoured development of the disease in each zone, and as the proportion of the crop area in the zone affected when the disease developed. These values were averaged for the region and Australia by weighting by the area sown to the crop in each zone for which disease data were available, and are shown in Table 6.3.
For Australia, there were six diseases that occurred with
a yearly incidence of 25 per cent or greater. Ascochyta blight occurred in over 82 per cent of years followed by root lesion nematode thornei, stunt nematode, root lesion nematode neglectus and phyllody. Four diseases occurred over 25 per cent of the crop area in years favourable for their development: stunt nematode occurred most widely (over 48 per cent of the area) followed by root lesion nematode thornei, Ascochyta blight and Phytophthora root rot.
Within the Northern Region, there were six diseases that occurred with a yearly incidence of 25 per cent or greater. These were stunt nematode and root lesion nematode thornei (which occurred every year) and Ascochyta blight, phyllody, root lesion nematode neglectus and phytophthora root rot. Five diseases occurred over 25 per cent of the crop area in years favourable for their development: stunt nematode occurred most widely (66 per cent of the area) followed by root lesion nematode thornei, Phytophthora root rot, Ascochyta blight and root lesion nematode neglectus.
Within the Southern Region, there were six diseases that occurred with a yearly incidence of 25 per cent or greater. Ascochyta blight occurred in over 69 per cent of years followed by cucumber mosaic, alfalfa mosaic, beet western yellows, bean leafroll and pea seed-borne mosaic. Five diseases occurred over 25 per cent of the crop area in years favourable for their development: Ascochyta blight occurred most widely (over 55 per cent of the area) followed by beet western yellows, Phytophthora root rot, alfalfa mosaic and cucumber mosaic.
Within the Western Region, there were 10 diseases that occurred with a yearly incidence of 25 per cent or greater. Ascochyta blight, Rhizoctonia bare patch, alfalfa mosaic, bean yellow mosaic, cucumber mosaic and pea seed-borne mosaic occurred every year. Five diseases occurred over 25 per cent or more of the crop area in years favourable for their development: Ascochyta blight (100 per cent of area), cucumber mosaic, Sclerotinia crown rot, grey mould and beet western yellows.
6.4.2 severity of chickpea diseasesSeverity was assessed as the percentage yield loss that occurred in affected crops in the zone in years favourable for development of the disease. Two assessments were made. The first was the potential severity, that is, the severity that would occur if current controls were not applied. The second was the present severity, when current controls are in place. These assessments were made at the zone level and aggregated to the region and national levels by weighting as in 6.3.1 (Table 6.4).
For Australia, Ascochyta blight had the highest potential severity of 72 per cent yield loss in years when it developed. It was followed by Phytophthora root rot, grey mould, root lesion nematode thornei and Pythium damping off. Phytophthora root rot had the highest present severity of 28 per cent yield loss in years when the disease developed. It was followed by Pythium damping off, Ascochyta blight, root lesion nematode thornei and root lesion nematode neglectus.
In the Northern Region, Ascochyta blight had the highest

GRDC | 54 | CuRRenT AnD PoTenTiAl CosTs fRoM DiseAses of Pulse CRoPs in AusTRAliA
Table 6.3 Incidence of chickpea diseases as a proportion of years when disease occurs (%) and as a proportion of the crop area affected when the disease develops (%) in the GRDC Regions and Australia
DiseaseNorthern Southern Western Australia
Years Area Years Area Years Area Years Area
NECROTROPHIC LEAF FUNGI
grey mould 20.4 8.9 15.6 20.5 28.8 47.4 19.3 12.3
pepper spot 0.0 0.0 23.2 23.2 0.0 0.0 5.9 5.9
stem rot 4.1 0.4 9.9 9.8 0.0 0.0 5.5 2.8
Ascochyta blight 87.0 28.6 69.6 55.8 100.0 100.0 82.7 36.2
BIOTROPHIC LEAF FUNGI
rust 2.2 0.4 0.0 0.0 0.0 0.0 1.6 0.3
ROOT AND CROWN FUNGI
Botrytis root and stem rot 20.4 8.9 7.4 7.7 0.0 0.0 16.9 8.5
Fusarium root rot 10.0 5.0 5.4 5.3 0.0 0.0 8.7 5.0
black root rot 0.0 0.0 2.1 4.2 0.0 0.0 0.5 1.1
charcoal rot 10.0 5.0 - - 0.0 0.0 7.3 3.7
Phytophthora root rot 31.8 30.9 24.2 36.3 0.0 0.0 29.5 31.9
Pythium damping off 23.7 13.2 14.7 14.5 0.0 0.0 21.2 13.4
wet root rot 23.1 5.0 4.6 4.6 0.0 0.0 18.1 4.9
Rhizoctonia bare patch 0.0 0.0 6.9 5.7 100.0 4.9 2.7 1.5
epicotyl rot - - - - - - - -
Sclerotinia crown rot 8.5 6.6 10.0 12.1 29.1 47.8 9.0 8.4
Sclerotinia stem rot 8.5 8.5 7.8 8.2 29.1 14.5 8.5 8.5
collar rot 11.5 1.0 - - 0.0 0.0 8.5 0.7
Stemphylium blight 0.0 0.0 3.7 1.8 0.0 0.0 0.9 0.5
Verticillium wilt 0.0 0.0 0.0 0.0 0.0 0.0 0.0 0.0
NEMATODES
stem nematode - - 5.2 1.8 0.0 0.0 1.3 0.5
stunt nematode 100.0 66.1 - - - - 73.4 48.5
root lesion nematode neglectus 84.6 27.1 10.4 10.4 - - 64.8 22.6
root lesion nematode penetrans - - - - - - - -
root lesion nematode teres - - - - - - - -
root lesion nematode thornei 100.0 61.0 10.4 5.8 - - 76.1 46.3
burrowing nematode - - - - - - - -
VIRUSES
alfalfa mosaic 8.5 8.5 43.1 28.2 100.0 1.0 18.2 13.4
bean leafroll 8.5 8.5 28.2 24.3 0.0 0.0 13.4 12.4
bean yellow mosaic - - 23.2 17.3 100.0 10.0 6.9 4.5
beet western yellows 8.5 8.5 43.1 39.8 50.0 30.0 17.7 16.7
chickpea chlorotic stunt - - 0.0 0.0 0.0 0.0 0.0 0.0
clover yellow vein - - - - 0.0 0.0 0.0 0.0
cucumber mosaic 4.2 4.2 48.9 25.7 100.0 50.0 16.6 10.2
lettuce necrotic yellows - - - - 0.0 0.0 0.0 0.0
pea seed-borne mosaic 4.2 4.2 25.7 5.9 100.0 20.0 10.7 4.8
soybean dwarf - - 3.9 0.4 0.0 0.0 1.0 0.1
subclover stunt - - - - - - - -
tobacco streak - - - - 0.0 0.0 0.0 0.0
Tomato spotted wilt - - - - 0.0 0.0 0.0 0.0
Turnip mosaic - - - - 0.0 0.0 0.0 0.0
PHYTOPLASMAS
phyllody 86.2 1.0 1.8 1.8 - - 63.7 1.2- no data available

CuRRenT AnD PoTenTiAl CosTs fRoM DiseAses of Pulse CRoPs in AusTRAliA | 55 | GRDC
Table 6.4 Potential and present severity of chickpea diseases (% yield loss in years suitable for disease development) in the GRDC Regions and Australia
DiseaseNorthern Southern Western Australia
Potential Present Potential Present Potential Present Potential Present
NECROTROPHIC LEAF FUNGI
grey mould 23.6 5.0 15.3 3.1 100.0 100.0 22.2 5.4
pepper spot 0.0 0.0 0.5 0.0 0.0 0.0 0.1 0.0
stem rot 4.1 0.4 10.4 3.0 0.0 0.0 5.7 1.1
Ascochyta blight 68.3 10.7 83.0 8.8 100.0 10.0 72.4 10.2
BIOTROPHIC LEAF FUNGI
rust 0.4 0.4 0.0 0.0 0.0 0.0 0.3 0.3
ROOT AND CROWN FUNGI
Botrytis root and stem rot 14.7 2.9 12.5 0.0 0.0 0.0 14.0 2.1
Fusarium root rot 5.0 5.0 6.0 1.3 0.0 0.0 5.2 4.0
black root rot 0.0 0.0 3.1 1.0 0.0 0.0 0.8 0.3
charcoal rot 5.0 1.0 - - 0.0 0.0 3.7 0.7
Phytophthora root rot 63.5 29.6 49.6 24.8 0.0 0.0 59.3 28.1
Pythium damping off 16.3 11.2 16.8 11.6 0.0 0.0 16.3 11.2
wet root rot 10.8 1.6 5.8 2.3 0.0 0.0 9.4 1.8
Rhizoctonia bare patch 0.0 0.0 7.2 1.2 5.0 3.0 1.9 0.3
epicotyl rot - - - - - - - -
Sclerotinia crown rot 3.4 0.2 6.7 1.1 30.0 10.0 4.5 0.5
Sclerotinia stem rot 4.2 0.0 5.9 0.0 20.0 10.0 4.8 0.1
collar rot 10.0 1.0 - - 0.0 0.0 7.3 0.7
Stemphylium blight 0.0 0.0 0.0 0.0 0.0 0.0 0.0 0.0
Verticillium wilt 0.0 0.0 0.0 0.0 0.0 0.0 0.0 0.0
NEMATODES
stem nematode - - 2.0 0.0 0.0 0.0 0.5 0.0
stunt nematode 0.0 0.0 - - - - 0.0 0.0
root lesion nematode neglectus 16.9 6.7 11.6 2.3 - - 15.4 5.5
root lesion nematode penetrans - - - - - - - -
root lesion nematode teres - - - - - - - -
root lesion nematode thornei 27.0 8.4 4.6 2.3 - - 21.0 6.8
burrowing nematode - - - - - - - -
VIRUSES
alfalfa mosaic 8.5 4.2 7.3 3.1 100.0 1.0 9.1 3.9
bean leafroll 8.5 4.2 6.8 3.6 0.0 0.0 7.9 4.0
bean yellow mosaic - - 1.8 1.1 70.0 1.0 1.1 0.3
beet western yellows 8.5 4.2 15.3 7.8 100.0 1.0 11.1 5.1
chickpea chlorotic stunt - - 0.0 0.0 0.0 0.0 0.0 0.0
clover yellow vein - - - - 0.0 0.0 0.0 0.0
cucumber mosaic 8.5 4.2 14.0 3.1 100.0 5.0 10.8 4.0
lettuce necrotic yellows - - - - 0.0 0.0 0.0 0.0
pea seed-borne mosaic 0.8 0.8 2.2 0.5 70.0 1.0 1.9 0.8
soybean dwarf - - 0.0 0.0 0.0 0.0 0.0 0.0
subclover stunt - - - - - - - -
tobacco streak - - - - 0.0 0.0 0.0 0.0
Tomato spotted wilt - - - - 0.0 0.0 0.0 0.0
Turnip mosaic - - - - 0.0 0.0 0.0 0.0
PHYTOPLASMAS
phyllody 0.8 0.8 4.1 1.8 - - 1.7 1.1
- no data available

GRDC | 56 | CuRRenT AnD PoTenTiAl CosTs fRoM DiseAses of Pulse CRoPs in AusTRAliA
Table 6.5 Potential and present average annual yield losses (%) from chickpea diseases by GRDC Region and Australia
DiseaseNorthern Southern Western Australia
Potential Present Potential Present Potential Present Potential Present
NECROTROPHIC LEAF FUNGI
grey mould 0.5 0.1 1.3 0.1 15.0 15.0 0.8 0.2
pepper spot 0.0 0.0 0.1 0.0 0.0 0.0 0.0 0.0
stem rot 0.0 0.0 0.4 0.1 0.0 0.0 0.1 0.0
Ascochyta blight 19.5 3.0 35.2 2.7 100.0 10.0 24.3 3.0
SUB TOTAL 3.1 2.9 25.0 3.3
BIOTROPHIC LEAF FUNGI
rust 0.0 0.0 0.0 0.0 0.0 0.0 0.0 0.0
SUB TOTAL 0.0 0.0 0.0 0.0
ROOT AND CROWN FUNGI
Botrytis root and stem rot 0.3 0.1 0.1 0.0 0.0 0.0 0.2 0.0
Fusarium root rot 0.0 0.0 0.1 0.0 0.0 0.0 0.0 0.0
black root rot 0.0 0.0 0.1 0.0 0.0 0.0 0.0 0.0
charcoal rot 0.0 0.0 - - 0.0 0.0 0.0 0.0
Phytophthora root rot 10.3 4.8 18.0 9.0 0.0 0.0 12.2 5.8
Pythium damping off 0.5 0.3 0.5 0.4 0.0 0.0 0.5 0.4
wet root rot 0.1 0.0 0.1 0.0 0.0 0.0 0.1 0.0
Rhizoctonia bare patch 0.0 0.0 0.1 0.0 0.2 0.1 0.0 0.0
epicotyl rot - - - - - - - -
Sclerotinia crown rot 0.0 0.0 0.1 0.0 4.3 1.4 0.1 0.0
Sclerotinia stem rot 0.0 0.0 0.0 0.0 0.9 0.4 0.1 0.0
collar rot 0.0 0.0 - - 0.0 0.0 0.0 0.0
Stemphylium blight 0.0 0.0 0.0 0.0 0.0 0.0 0.0 0.0
Verticillium wilt 0.0 0.0 0.0 0.0 0.0 0.0 0.0 0.0
SUB TOTAL 5.3 9.5 2.0 6.3
NEMATODES
stem nematode - - 0.4 0.0 0.0 0.0 0.1 0.0
stunt nematode 0.0 0.0 - - - - 0.0 0.0
root lesion nematode neglectus 5.4 2.1 0.6 0.1 - - 4.1 1.6
root lesion nematode penetrans - - - - - - - -
root lesion nematode teres - - - - - - - -
root lesion nematode thornei 16.5 5.1 0.1 0.1 - - 12.1 3.8
burrowing nematode - - - - - - - -
SUB TOTAL 7.3 0.2 0.0 5.4
VIRUSES
alfalfa mosaic 0.1 0.0 1.0 0.3 1.0 0.0 0.3 0.1
bean leafroll 0.1 0.0 0.4 0.3 0.0 0.0 0.2 0.1
bean yellow mosaic - - 0.3 0.2 7.0 0.1 0.2 0.1
beet western yellows 0.1 0.0 6.4 3.3 15.0 0.2 1.8 0.9
chickpea chlorotic stunt - - 0.0 0.0 0.0 0.0 0.0 0.0
clover yellow vein - - - - 0.0 0.0 0.0 0.0
cucumber mosaic 0.0 0.0 4.5 0.3 50.0 2.5 1.7 0.1
lettuce necrotic yellows - - - - 0.0 0.0 0.0 0.0
pea seed-borne mosaic 0.0 0.0 0.1 0.0 14.0 0.2 0.2 0.0
soybean dwarf - - 0.0 0.0 0.0 0.0 0.0 0.0
subclover stunt - - - - - - - -
tobacco streak - - - - 0.0 0.0 0.0 0.0
Tomato spotted wilt - - - - 0.0 0.0 0.0 0.0
Turnip mosaic - - - - 0.0 0.0 0.0 0.0
SUB TOTAL 0.1 4.4 3.0 1.3
PHYTOPLASMAS
phyllody 0.0 0.0 0.0 0.0 - - 0.0 0.0
SUB TOTAL 0.0 0.0 0.0 0.0
TOTAL 15.8 17.0 30.0 16.2

CuRRenT AnD PoTenTiAl CosTs fRoM DiseAses of Pulse CRoPs in AusTRAliA | 57 | GRDC
potential severity of 68.3 per cent yield loss in years when it developed. It was followed by Phytophthora root rot, root lesion nematode thornei, grey mould and root lesion nematode neglectus. Phytophthora root rot had the highest present severity of almost 30 per cent yield loss in years when the disease developed. It was followed by Pythium damping off, Ascochyta blight, root lesion nematode thornei and root lesion nematode neglectus.
In the Southern Region, Ascochyta blight also had the highest potential severity with 83.0 per cent yield loss in years when it developed. It was followed by Phytophthora root rot, Pythium damping off, grey mould and beet western yellows. Phytophthora root rot had the highest present severity of almost 25 per cent yield loss in years when the disease developed. It was followed by Pythium root rot, Ascochyta blight, Beet western yellows and bean leafroll.
In the Western Region, grey mould, Ascochyta blight, alfalfa mosaic, beet western yellows and cucumber mosaic had the highest potential severity of 100 per cent yield loss in years when they developed. The highest present severity was grey mould with 100 per cent yield loss in years when it developed, followed by Sclerotinia crown rot, Sclerotinia stem rot, Ascochyta blight and cucumber mosaic.
6.5 losses from chickpea diseases6.5.1 Potential and present percentage
yield lossesThe average annual yield loss was calculated from the incidence and severity data (see Section 2.5 for the method). The potential severity was used to calculate the potential losses if current controls were not used and the present severity to calculate present losses with current control measures.
For Australia, three diseases, Ascochyta blight, Phytophthora root rot and root lesion nematode thornei, had the potential to cause an annual yield loss of more than 10 per cent, with potential losses of 24, 12 and 12 per cent, respectively. The next two in order of potential yield loss were root lesion nematode neglectus and beet western yellows. With current controls, the present average annual yield loss was much less. Phytophthora root rot had the highest present yield loss with over 5 per cent average
annual loss, followed by root lesion nematode thornei, Ascochyta blight, root lesion nematode neglectus and beet western yellows (Table 6.5).
In the Northern Region, three diseases had a potential average annual yield loss of more than 10 per cent. The highest average annual potential yield loss was 19 per cent from Ascochyta blight, followed by root lesion nematode thornei, Phytophthora root rot, root lesion nematode neglectus and Pythium damping off. With current disease controls, root lesion nematode thornei was the highest with 5 per cent present average annual loss, followed by Phytophthora root rot, Ascochyta blight, and root lesion nematode neglectus (Table 6.5).
In the Southern Region, two diseases had a potential average annual yield loss of more than 10 per cent. The highest average annual potential yield loss was 35 per cent from Ascochyta blight, followed by Phytophthora root rot, beet western yellows, cucumber mosaic, and grey mould. With current disease controls, Phytophthora root rot was the highest with 9 per cent present average annual loss, followed by beet western yellows, Ascochyta blight and Pythium damping off (Table 6.5).
In the Western Region, five diseases had a potential average annual yield loss of more than 10 per cent. The highest average annual potential yield loss was 100 per cent from Ascochyta blight, followed by cucumber mosaic, beet western yellows, grey mould and pea seed-borne mosaic. With current disease controls, grey mould was the highest with 15 per cent present average annual loss, followed by Ascochyta blight, cucumber mosaic and Sclerotinia crown rot (Table 6.5).
For Australia, the total present average annual yield loss from all diseases was 16.2 per cent. Necrotrophic leaf fungal diseases totalled 3.3 per cent, biotrophic leaf fungal diseases were nil, the root and crown fungi were 6.3 per cent, nematodes 5.4 per cent, bacteria nil, viruses 1.3 per cent and Phytoplasmas nil.
6.5.2 Quality effects of diseases on chickpeasBecause chickpeas are primarily for human consumption, appearance and freedom from toxins are paramount. Ascochyta blight can discolour the seed and all grades must
Table 6.6 Potential and present average annual quality losses from chickpea diseases by GRDC Regions and Australia
Quality lossesNorthern Southern Western Australia
Potential Present Potential Present Potential Present Potential Present
$/ha
grey mould 0.79 0.17 2.55 0.18 0.00 0.00 1.23 0.17
Ascochyta blight 7.34 1.19 19.87 1.03 0.00 0.00 10.48 1.14
1.35 1.21 0.00 1.30
$ million
grey mould 0.17 0.04 0.19 0.01 0.00 0.00 0.36 0.05
Ascochyta blight 1.59 0.26 1.50 0.08 0.00 0.00 3.10 0.34
0.29 0.09 0.00 0.39- no crop grown

GRDC | 58 | CuRRenT AnD PoTenTiAl CosTs fRoM DiseAses of Pulse CRoPs in AusTRAliA
Table 6.7 Potential and present average annual costs ($/ha) from chickpea diseases by GRDC Regions and Australia
DiseaseNorthern Southern Western Australia
Potential Present Potential Present Potential Present Potential Present
NECROTROPHIC LEAF FUNGI
grey mould 3.28 0.67 9.69 0.58 71.45 71.45 5.55 1.30
pepper spot 0.00 0.00 0.68 0.00 0.00 0.00 0.17 0.00
stem rot 0.02 0.00 2.21 0.63 0.00 0.00 0.58 0.16
Ascochyta blight 104.02 16.04 208.58 15.04 476.55 47.65 134.20 16.08
SUB TOTAL 16.71 16.26 119.11 17.54
BIOTROPHIC LEAF FUNGI
rust 0.00 0.00 0.00 0.00 0.00 0.00 0.00 0.00
SUB TOTAL 0.00 0.00 0.00 0.00
ROOT AND CROWN FUNGI
Botrytis root and stem rot 1.56 0.32 0.51 0.00 0.00 0.00 1.28 0.23
Fusarium root rot 0.12 0.12 0.31 0.07 0.00 0.00 0.17 0.11
black root rot 0.00 0.00 0.36 0.12 0.00 0.00 0.09 0.03
charcoal rot 0.12 0.02 - - 0.00 0.00 0.09 0.02
Phytophthora root rot 48.46 22.61 86.57 43.28 0.00 0.00 57.76 27.70
Pythium damping off 2.29 1.53 2.44 2.13 0.00 0.00 2.30 1.67
wet root rot 0.67 0.13 0.34 0.14 0.00 0.00 0.58 0.13
Rhizoctonia bare patch 0.00 0.00 0.45 0.07 1.19 0.71 0.13 0.02
epicotyl rot - - - - - - - -
Sclerotinia crown rot 0.13 0.01 0.70 0.15 21.44 7.15 0.47 0.11
Sclerotinia stem rot 0.20 0.00 0.23 0.00 4.29 2.14 0.25 0.02
collar rot 0.06 0.01 - - 0.00 0.00 0.04 0.00
Stemphylium blight 0.00 0.00 0.00 0.00 0.00 0.00 0.00 0.00
Verticillium wilt 0.00 0.00 0.00 0.00 0.00 0.00 0.00 0.00
SUB TOTAL 24.75 45.96 10.00 30.04
NEMATODES
stem nematode - - 1.70 0.00 0.00 0.00 0.44 0.00
stunt nematode 0.00 0.00 - - - - 0.00 0.00
root lesion nematode neglectus 26.09 10.31 3.46 0.69 - - 20.06 7.75
root lesion nematode penetrans - - - - - - - -
root lesion nematode teres - - - - - - - -
root lesion nematode thornei 80.37 25.00 0.74 0.37 - - 59.25 18.47
burrowing nematode - - - - - - - -
SUB TOTAL 35.31 1.06 0.00 26.22
VIRUSES
alfalfa mosaic 0.41 0.20 5.80 1.76 4.77 0.05 1.83 0.60
bean leafroll 0.41 0.20 2.40 1.48 0.00 0.00 0.91 0.53
bean yellow mosaic - - 1.94 1.22 33.36 0.48 0.80 0.32
beet western yellows 0.41 0.20 37.03 19.27 71.49 0.71 10.43 5.09
chickpea chlorotic stunt - - 0.00 0.00 0.00 0.00 0.00 0.00
clover yellow vein - - - - 0.00 0.00 0.00 0.00
cucumber mosaic 0.10 0.05 25.98 2.00 238.31 11.92 8.92 0.66
lettuce necrotic yellows - - - - 0.00 0.00 0.00 0.00
pea seed-borne mosaic 0.01 0.01 0.37 0.01 66.73 0.95 0.71 0.02
soybean dwarf - - 0.00 0.00 0.00 0.00 0.00 0.00
subclover stunt - - - - - - - -
tobacco streak - - - - 0.00 0.00 0.00 0.00
Tomato spotted wilt - - - - 0.00 0.00 0.00 0.00
Turnip mosaic - - - - 0.00 0.00 0.00 0.00
SUB TOTAL 0.67 25.73 14.11 7.21
PHYTOPLASMAS
phyllody 0.04 0.04 0.26 0.12 - - 0.10 0.06
SUB TOTAL 0.04 0.12 0.00 0.06
TOTAL 77.49 89.13 143.22 81.07
- no data available

CuRRenT AnD PoTenTiAl CosTs fRoM DiseAses of Pulse CRoPs in AusTRAliA | 59 | GRDC
have less than one per cent of seed affected by this disease at receival. Any diseases that reduce seed size could increase screenings and thus reduce grain quality.
The two diseases identified as causing quality losses in chickpeas are grey mould and Ascochyta blight, with those losses occurring in both the Northern and the Southern Regions (Table 6.6). Both diseases have the potential to cause considerable losses, but average present losses are much smaller.
6.5.3 Value of losses from chickpea diseasesThe value of these yield losses was calculated by relating the percentage losses to the gross value of chickpea production in each zone, using the average value of chickpeas, over a five-year period (see Section 6.2). The value of quality losses were combined with these yield losses, and the total losses were calculated on a per hectare basis and on an aggregate basis for each zone, then for each GRDC region and nationally.
The potential losses estimated for each disease are in Table 6.7 ($ per hectare) and Table 6.8 (aggregate losses). For Australia, the five major diseases by potential loss on a per hectare basis and their total cost to the industry are:
Disease $/ha $ million
Ascochyta blight 134.20 39.7
root lesion nematode thornei 59.25 17.5
Phytophthora root rot 57.76 17.1
root lesion nematode neglectus 20.06 5.9
beet western yellows 10.43 3.1
The present losses estimated for each disease are in Table 6.7 ($ per hectare) and Table 6.8 (aggregate losses). For Australia, the five major diseases by average annual present loss on a per hectare basis and their total cost to the industry are:
Disease $/ha $ million
Phytophthora root rot 27.70 8.2
root lesion nematode thornei 18.47 5.5
Ascochyta blight 16.08 4.8
root lesion nematode neglectus 7.75 2.3
beet western yellows 5.09 1.5
Total losses from others 5.99 1.8
Total Present loss 81.07 24.0
Collectively, present average annual losses from the necrotrophic leaf fungi were $5.2 million, biotrophic leaf fungi nil, root and crown fungi $8.9 million, nematodes $7.8 million, bacteria nil, viruses $2.1 million and Phytoplasmas $0.02 million.
6.6 Value of control of chickpea diseasesThe value of present controls of chickpea diseases is the difference between the potential average annual loss when current control practices were not in place and the present average annual loss with current controls in place. Estimates
of the value of control for each disease surveyed on a per hectare basis and the total value for the production regions and Australia are in Table 6.9.
For diseases with high potential loss and effective control, the value of control is high. For Australia, the five leading diseases in terms of value of control are Ascochyta blight ($34.9 million), root lesion nematode thornei ($12.1 million), Phytophthora root rot ($8.9 million), root lesion nematode neglectus ($3.6 million) and cucumber mosaic ($2.4 million).
The regional and national values are of primary consideration by funding bodies to determine the return on investment for development of a control. However, for farmers, the cost of using a control needs to be weighed against the return. Here, the per hectare cost is often more useful. The foliar disease such as Ascochyta blight can be controlled with fungicide sprays and the current average value of control for this is $118/ha.
For the survey, control measures were grouped in three broad categories: breeding (resistant cultivars); cultural practices including stubble management, tillage and crop rotation; and pesticides, including fungicides applied to the seed, in fertilisers and by spraying, and insecticides to control vectors. The proportion of control contributed by each category and its value are in Table 6.10.
Breeding and the use of genetic resistance provided 50 per cent or more of the control of two diseases and 25 per cent or more for a further two diseases. This control for Ascochyta blight was valued at $15.7 million, root lesion nematode thornei $10.8 million, Phytophthora root rot $3.6 million and root lesion nematode neglectus $3.2 million (Table 6.10).
Cultural practices contributed 50 per cent or more of the control for 14 diseases and more than 25 per cent for a further three. The top four average annual values for this control were: Ascochyta blight, $6.9 million; Phytophthora root rot $5.3 million; cucumber mosaic, $2.4 million; and root lesion nematode thornei, $1.2 million (Table 6.10).
Pesticides, mainly fungicides, contributed more than 50 per cent of the control for nine diseases and more than 25 per cent for a further four. The top three average annual values for control with pesticides were: Ascochyta blight, $12.4 million; grey mould, $1.1 million; and beet western yellows, $0.8 million (Table 6.10).
6.7 use of pesticides for control of chickpea diseases
The total expenditure for pesticide use on chickpeas is estimated at $14.6 million per year, of which $8.5 million and $6.1 million are in the Northern and Southern Regions, respectively (Table 6.11). No estimates were available from the Western Region but this is only a small proportion of the national crop, so the totals for the two eastern regions are a good estimate of the Australian values. On average, the main expenditure for chickpea crops was for foliar fungicides ($11.0 million), while $3.6 million was spent on seed treatment. The costs of fungicide applications to chickpea crops averaged $48.70/ha/year across Australia (Table 6.11).

GRDC | 60 | CuRRenT AnD PoTenTiAl CosTs fRoM DiseAses of Pulse CRoPs in AusTRAliA
Table 6.8 Aggregate potential and present average annual costs ($ million) from chickpea diseases by GRDC Regions and Australia
DiseaseNorthern Southern Western Australia
Potential Present Potential Present Potential Present Potential Present
NECROTROPHIC LEAF FUNGI
grey mould 0.7 0.1 0.7 0.0 0.2 0.2 1.6 0.4
pepper spot 0.0 0.0 0.1 0.0 0.0 0.0 0.1 0.0
stem rot 0.0 0.0 0.2 0.0 0.0 0.0 0.2 0.0
Ascochyta blight 22.6 3.5 15.8 1.1 1.3 0.1 39.7 4.8
SUB TOTAL 3.6 1.2 0.3 5.2
BIOTROPHIC LEAF FUNGI
rust 0.0 0.0 0.0 0.0 0.0 0.0 0.0 0.0
SUB TOTAL 0.0 0.0 0.0 0.0
ROOT AND CROWN FUNGI
Botrytis root and stem rot 0.3 0.1 0.0 0.0 0.0 0.0 0.4 0.1
Fusarium root rot 0.0 0.0 0.0 0.0 0.0 0.0 0.1 0.0
black root rot 0.0 0.0 0.0 0.0 0.0 0.0 0.0 0.0
charcoal rot 0.0 0.0 - - 0.0 0.0 0.0 0.0
Phytophthora root rot 10.5 4.9 6.6 3.3 0.0 0.0 17.1 8.2
Pythium damping off 0.5 0.3 0.2 0.2 0.0 0.0 0.7 0.5
wet root rot 0.1 0.0 0.0 0.0 0.0 0.0 0.2 0.0
Rhizoctonia bare patch 0.0 0.0 0.0 0.0 0.0 0.0 0.0 0.0
epicotyl rot - - - - - - - -
Sclerotinia crown rot 0.0 0.0 0.1 0.0 0.1 0.0 0.1 0.0
Sclerotinia stem rot 0.0 0.0 0.0 0.0 0.0 0.0 0.1 0.0
collar rot 0.0 0.0 - - 0.0 0.0 0.0 0.0
Stemphylium blight 0.0 0.0 0.0 0.0 0.0 0.0 0.0 0.0
Verticillium wilt 0.0 0.0 0.0 0.0 0.0 0.0 0.0 0.0
SUB TOTAL 5.4 3.5 0.0 8.9
NEMATODES
stem nematode - - 0.1 0.0 0.0 0.0 0.1 0.0
stunt nematode 0.0 0.0 - - - - 0.0 0.0
root lesion nematode neglectus 5.7 2.2 0.3 0.1 - - 5.9 2.3
root lesion nematode penetrans - - - - - - - -
root lesion nematode teres - - - - - - - -
root lesion nematode thornei 17.5 5.4 0.1 0.0 - - 17.5 5.5
burrowing nematode - - - - - - - -
SUB TOTAL 7.7 0.1 0.0 7.8
VIRUSES
alfalfa mosaic 0.1 0.0 0.4 0.1 0.0 0.0 0.5 0.2
bean leafroll 0.1 0.0 0.2 0.1 0.0 0.0 0.3 0.2
bean yellow mosaic - - 0.1 0.1 0.1 0.0 0.2 0.1
beet western yellows 0.1 0.0 2.8 1.5 0.2 0.0 3.1 1.5
chickpea chlorotic stunt - - 0.0 0.0 0.0 0.0 0.0 0.0
clover yellow vein - - - - 0.0 0.0 0.0 0.0
cucumber mosaic 0.0 0.0 2.0 0.2 0.6 0.0 2.6 0.2
lettuce necrotic yellows - - - - 0.0 0.0 0.0 0.0
pea seed-borne mosaic 0.0 0.0 0.0 0.0 0.2 0.0 0.2 0.0
soybean dwarf - - 0.0 0.0 0.0 0.0 0.0 0.0
subclover stunt - - - - - - - -
tobacco streak - - - - 0.0 0.0 0.0 0.0
Tomato spotted wilt - - - - 0.0 0.0 0.0 0.0
Turnip mosaic - - - - 0.0 0.0 0.0 0.0
SUB TOTAL 0.1 1.9 0.0 2.1
PHYTOPLASMAS
phyllody 0.0 0.0 0.0 0.0 - - 0.0 0.0
SUB TOTAL 0.0 0.0 0.0 0.0
TOTAL 16.8 6.7 0.4 24.0
- no data available
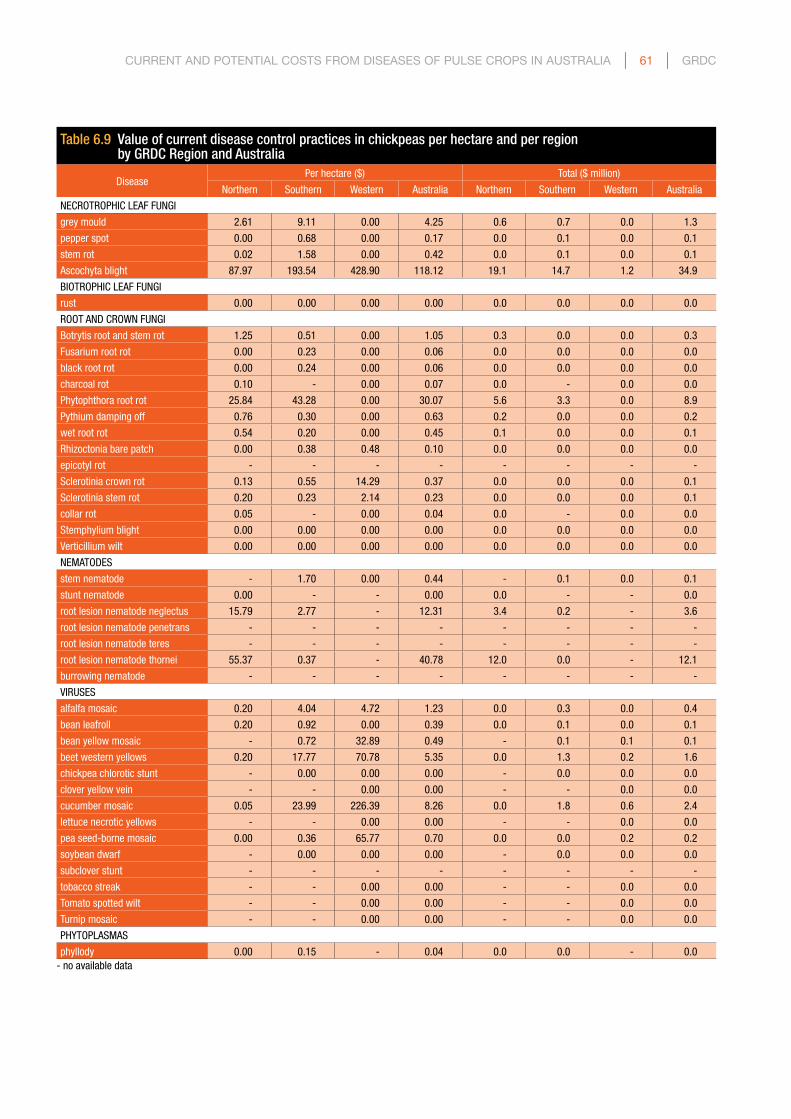
CuRRenT AnD PoTenTiAl CosTs fRoM DiseAses of Pulse CRoPs in AusTRAliA | 61 | GRDC
Table 6.9 Value of current disease control practices in chickpeas per hectare and per region by GRDC Region and Australia
DiseasePer hectare ($) Total ($ million)
Northern Southern Western Australia Northern Southern Western Australia
NECROTROPHIC LEAF FUNGI
grey mould 2.61 9.11 0.00 4.25 0.6 0.7 0.0 1.3
pepper spot 0.00 0.68 0.00 0.17 0.0 0.1 0.0 0.1
stem rot 0.02 1.58 0.00 0.42 0.0 0.1 0.0 0.1
Ascochyta blight 87.97 193.54 428.90 118.12 19.1 14.7 1.2 34.9
BIOTROPHIC LEAF FUNGI
rust 0.00 0.00 0.00 0.00 0.0 0.0 0.0 0.0
ROOT AND CROWN FUNGI
Botrytis root and stem rot 1.25 0.51 0.00 1.05 0.3 0.0 0.0 0.3
Fusarium root rot 0.00 0.23 0.00 0.06 0.0 0.0 0.0 0.0
black root rot 0.00 0.24 0.00 0.06 0.0 0.0 0.0 0.0
charcoal rot 0.10 - 0.00 0.07 0.0 - 0.0 0.0
Phytophthora root rot 25.84 43.28 0.00 30.07 5.6 3.3 0.0 8.9
Pythium damping off 0.76 0.30 0.00 0.63 0.2 0.0 0.0 0.2
wet root rot 0.54 0.20 0.00 0.45 0.1 0.0 0.0 0.1
Rhizoctonia bare patch 0.00 0.38 0.48 0.10 0.0 0.0 0.0 0.0
epicotyl rot - - - - - - - -
Sclerotinia crown rot 0.13 0.55 14.29 0.37 0.0 0.0 0.0 0.1
Sclerotinia stem rot 0.20 0.23 2.14 0.23 0.0 0.0 0.0 0.1
collar rot 0.05 - 0.00 0.04 0.0 - 0.0 0.0
Stemphylium blight 0.00 0.00 0.00 0.00 0.0 0.0 0.0 0.0
Verticillium wilt 0.00 0.00 0.00 0.00 0.0 0.0 0.0 0.0
NEMATODES
stem nematode - 1.70 0.00 0.44 - 0.1 0.0 0.1
stunt nematode 0.00 - - 0.00 0.0 - - 0.0
root lesion nematode neglectus 15.79 2.77 - 12.31 3.4 0.2 - 3.6
root lesion nematode penetrans - - - - - - - -
root lesion nematode teres - - - - - - - -
root lesion nematode thornei 55.37 0.37 - 40.78 12.0 0.0 - 12.1
burrowing nematode - - - - - - - -
VIRUSES
alfalfa mosaic 0.20 4.04 4.72 1.23 0.0 0.3 0.0 0.4
bean leafroll 0.20 0.92 0.00 0.39 0.0 0.1 0.0 0.1
bean yellow mosaic - 0.72 32.89 0.49 - 0.1 0.1 0.1
beet western yellows 0.20 17.77 70.78 5.35 0.0 1.3 0.2 1.6
chickpea chlorotic stunt - 0.00 0.00 0.00 - 0.0 0.0 0.0
clover yellow vein - - 0.00 0.00 - - 0.0 0.0
cucumber mosaic 0.05 23.99 226.39 8.26 0.0 1.8 0.6 2.4
lettuce necrotic yellows - - 0.00 0.00 - - 0.0 0.0
pea seed-borne mosaic 0.00 0.36 65.77 0.70 0.0 0.0 0.2 0.2
soybean dwarf - 0.00 0.00 0.00 - 0.0 0.0 0.0
subclover stunt - - - - - - - -
tobacco streak - - 0.00 0.00 - - 0.0 0.0
Tomato spotted wilt - - 0.00 0.00 - - 0.0 0.0
Turnip mosaic - - 0.00 0.00 - - 0.0 0.0
PHYTOPLASMAS
phyllody 0.00 0.15 - 0.04 0.0 0.0 - 0.0- no available data

GRDC | 62 | CuRRenT AnD PoTenTiAl CosTs fRoM DiseAses of Pulse CRoPs in AusTRAliA
Table 6.10 Value of different forms of chickpea disease control in Australia
DiseaseCost/value ($ million) Contribution (%) Contribution ($ million)
Potential Present Control Breeding Cultural Pesticide Breeding Cultural Pesticide
grey mould 1.6 0.4 1.3 0 16 84 0.0 0.2 1.1
pepper spot 0.1 0.0 0.1 0 0 100 0.0 0.0 0.1
stem rot 0.2 0.0 0.1 0 35 65 0.0 0.0 0.1
Ascochyta blight 39.7 4.8 34.9 45 20 35 15.7 6.9 12.4
BIOTROPHIC LEAF FUNGI
rust 0.0 0.0 0.0 0.0 0.0 0.0
ROOT AND CROWN FUNGI
Botrytis root and stem rot 0.4 0.1 0.3 0 19 81 0.0 0.1 0.3
Fusarium root rot 0.1 0.0 0.0 0 18 82 0.0 0.0 0.0
black root rot 0.0 0.0 0.0 0 0 100 0.0 0.0 0.0
charcoal rot 0.0 0.0 0.0 0 100 0 0.0 0.0 0.0
Phytophthora root rot 17.1 8.2 8.9 41 59 0 3.6 5.3 0.0
Pythium damping off 0.7 0.5 0.2 0 34 66 0.0 0.1 0.1
wet root rot 0.2 0.0 0.1 0 39 61 0.0 0.1 0.1
Rhizoctonia bare patch 0.0 0.0 0.0 0 57 43 0.0 0.0 0.0
epicotyl rot - - - - - -
Sclerotinia crown rot 0.1 0.0 0.1 0 87 13 0.0 0.1 0.0
Sclerotinia stem rot 0.1 0.0 0.1 0 96 4 0.0 0.1 0.0
collar rot 0.0 0.0 0.0 0 90 10 0.0 0.0 0.0
Stemphylium blight 0.0 0.0 0.0 0.0 0.0 0.0
Verticillium wilt 0.0 0.0 0.0 0.0 0.0 0.0
NEMATODES
stem nematode 0.1 0.0 0.1 0 100 0 0.0 0.1 0.0
stunt nematode 0.0 0.0 0.0 0.0 0.0 0.0
root lesion nematode neglectus 5.9 2.3 3.6 87 13 0 3.2 0.5 0.0
root lesion nematode penetrans - - - - - -
root lesion nematode teres - - - - - -
root lesion nematode thornei 17.5 5.5 12.1 90 10 0 10.8 1.2 0.0
burrowing nematode - - - - - -
VIRUSES
alfalfa mosaic 0.5 0.2 0.4 0 100 0 0.0 0.4 0.0
bean leafroll 0.3 0.2 0.1 0 73 27 0.0 0.1 0.0
bean yellow mosaic 0.2 0.1 0.1 0 86 14 0.0 0.1 0.0
beet western yellows 3.1 1.5 1.6 0 52 48 0.0 0.8 0.8
chickpea chlorotic stunt 0.0 0.0 0.0 0.0 0.0 0.0
clover yellow vein 0.0 0.0 0.0 0.0 0.0 0.0
cucumber mosaic 2.6 0.2 2.4 0 100 0 0.0 2.4 0.0
lettuce necrotic yellows 0.0 0.0 0.0 0.0 0.0 0.0
pea seed-borne mosaic 0.2 0.0 0.2 0 100 0 0.0 0.2 0.0
soybean dwarf 0.0 0.0 0.0 0.0 0.0 0.0
subclover stunt - - - - - -
tobacco streak 0.0 0.0 0.0 0.0 0.0 0.0
Tomato spotted wilt 0.0 0.0 0.0 0.0 0.0 0.0
Turnip mosaic 0.0 0.0 0.0 0.0 0.0 0.0
PHYTOPLASMAS
phyllody 0.0 0.0 0.0 0 50 50 0.0 0.0 0.0
- no data available
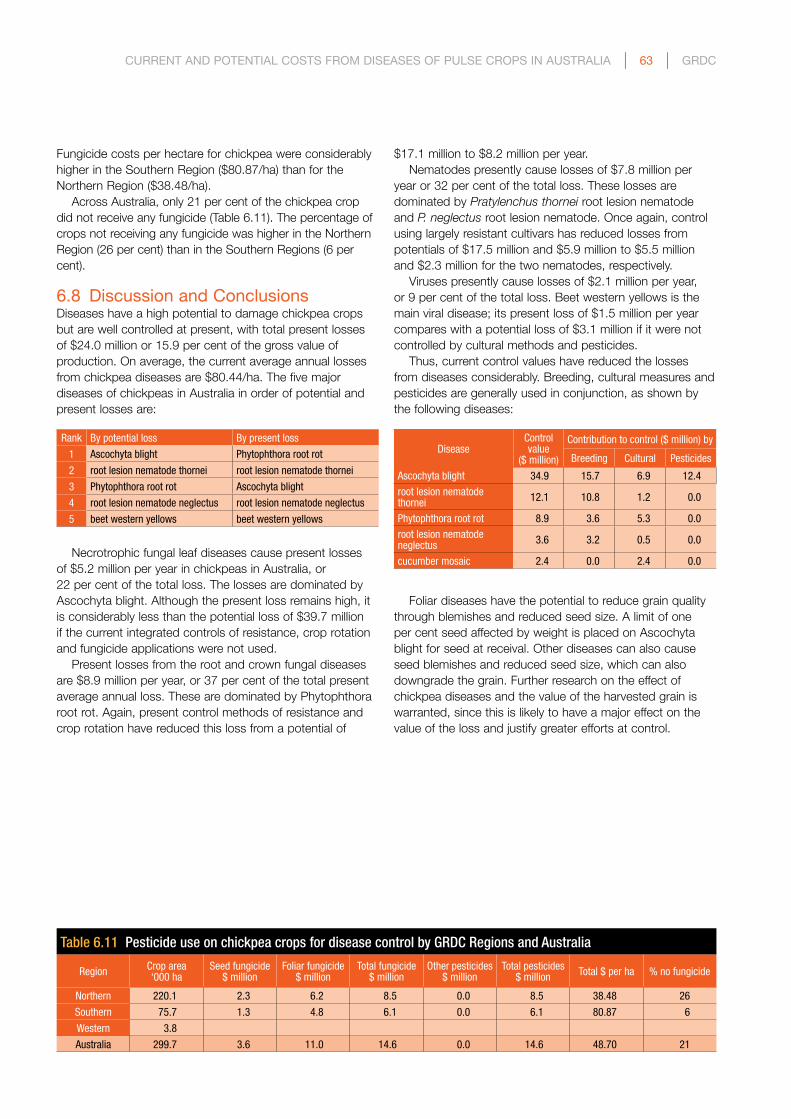
CuRRenT AnD PoTenTiAl CosTs fRoM DiseAses of Pulse CRoPs in AusTRAliA | 63 | GRDC
Fungicide costs per hectare for chickpea were considerably higher in the Southern Region ($80.87/ha) than for the Northern Region ($38.48/ha).
Across Australia, only 21 per cent of the chickpea crop did not receive any fungicide (Table 6.11). The percentage of crops not receiving any fungicide was higher in the Northern Region (26 per cent) than in the Southern Regions (6 per cent).
6.8 Discussion and ConclusionsDiseases have a high potential to damage chickpea crops but are well controlled at present, with total present losses of $24.0 million or 15.9 per cent of the gross value of production. On average, the current average annual losses from chickpea diseases are $80.44/ha. The five major diseases of chickpeas in Australia in order of potential and present losses are:
Rank By potential loss By present loss
1 Ascochyta blight Phytophthora root rot
2 root lesion nematode thornei root lesion nematode thornei
3 Phytophthora root rot Ascochyta blight
4 root lesion nematode neglectus root lesion nematode neglectus
5 beet western yellows beet western yellows
Necrotrophic fungal leaf diseases cause present losses of $5.2 million per year in chickpeas in Australia, or 22 per cent of the total loss. The losses are dominated by Ascochyta blight. Although the present loss remains high, it is considerably less than the potential loss of $39.7 million if the current integrated controls of resistance, crop rotation and fungicide applications were not used.
Present losses from the root and crown fungal diseases are $8.9 million per year, or 37 per cent of the total present average annual loss. These are dominated by Phytophthora root rot. Again, present control methods of resistance and crop rotation have reduced this loss from a potential of
$17.1 million to $8.2 million per year.Nematodes presently cause losses of $7.8 million per
year or 32 per cent of the total loss. These losses are dominated by Pratylenchus thornei root lesion nematode and P. neglectus root lesion nematode. Once again, control using largely resistant cultivars has reduced losses from potentials of $17.5 million and $5.9 million to $5.5 million and $2.3 million for the two nematodes, respectively.
Viruses presently cause losses of $2.1 million per year, or 9 per cent of the total loss. Beet western yellows is the main viral disease; its present loss of $1.5 million per year compares with a potential loss of $3.1 million if it were not controlled by cultural methods and pesticides.
Thus, current control values have reduced the losses from diseases considerably. Breeding, cultural measures and pesticides are generally used in conjunction, as shown by the following diseases:
DiseaseControl value
($ million)
Contribution to control ($ million) by
Breeding Cultural Pesticides
Ascochyta blight 34.9 15.7 6.9 12.4root lesion nematode thornei 12.1 10.8 1.2 0.0
Phytophthora root rot 8.9 3.6 5.3 0.0root lesion nematode neglectus 3.6 3.2 0.5 0.0
cucumber mosaic 2.4 0.0 2.4 0.0
Foliar diseases have the potential to reduce grain quality through blemishes and reduced seed size. A limit of one per cent seed affected by weight is placed on Ascochyta blight for seed at receival. Other diseases can also cause seed blemishes and reduced seed size, which can also downgrade the grain. Further research on the effect of chickpea diseases and the value of the harvested grain is warranted, since this is likely to have a major effect on the value of the loss and justify greater efforts at control.
Table 6.11 Pesticide use on chickpea crops for disease control by GRDC Regions and Australia
Region Crop area‘000 ha
Seed fungicide$ million
Foliar fungicide$ million
Total fungicide$ million
Other pesticides$ million
Total pesticides$ million Total $ per ha % no fungicide
Northern 220.1 2.3 6.2 8.5 0.0 8.5 38.48 26
Southern 75.7 1.3 4.8 6.1 0.0 6.1 80.87 6
Western 3.8
Australia 299.7 3.6 11.0 14.6 0.0 14.6 48.70 21
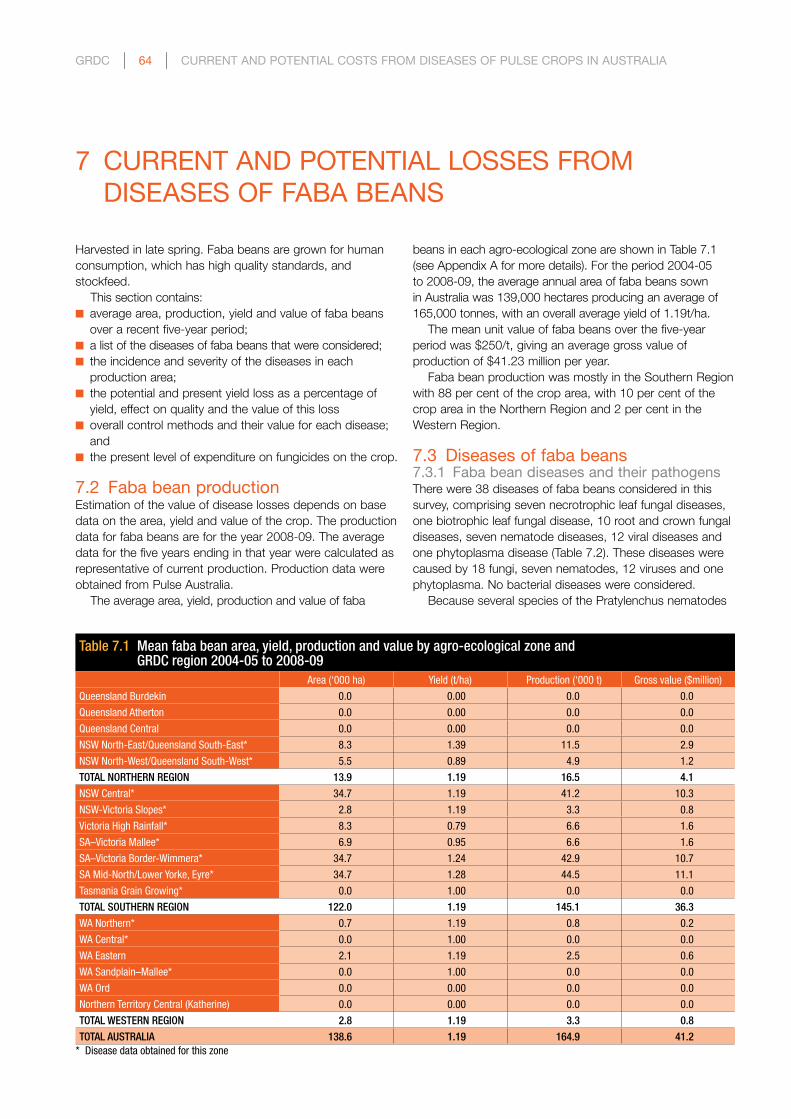
GRDC | 64 | CuRRenT AnD PoTenTiAl CosTs fRoM DiseAses of Pulse CRoPs in AusTRAliA
7 CuRRenT AnD PoTenTiAl losses fRoM DiseAses of fABA BeAns
Table 7.1 Mean faba bean area, yield, production and value by agro-ecological zone and GRDC region 2004-05 to 2008-09
Area (‘000 ha) Yield (t/ha) Production (‘000 t) Gross value ($million)
Queensland Burdekin 0.0 0.00 0.0 0.0
Queensland Atherton 0.0 0.00 0.0 0.0
Queensland Central 0.0 0.00 0.0 0.0
NSW North-East/Queensland South-East* 8.3 1.39 11.5 2.9
NSW North-West/Queensland South-West* 5.5 0.89 4.9 1.2
TOTAL NORTHERN REGION 13.9 1.19 16.5 4.1
NSW Central* 34.7 1.19 41.2 10.3
NSW-Victoria Slopes* 2.8 1.19 3.3 0.8
Victoria High Rainfall* 8.3 0.79 6.6 1.6
SA–Victoria Mallee* 6.9 0.95 6.6 1.6
SA–Victoria Border-Wimmera* 34.7 1.24 42.9 10.7
SA Mid-North/Lower Yorke, Eyre* 34.7 1.28 44.5 11.1
Tasmania Grain Growing* 0.0 1.00 0.0 0.0
TOTAL SOUTHERN REGION 122.0 1.19 145.1 36.3
WA Northern* 0.7 1.19 0.8 0.2
WA Central* 0.0 1.00 0.0 0.0
WA Eastern 2.1 1.19 2.5 0.6
WA Sandplain–Mallee* 0.0 1.00 0.0 0.0
WA Ord 0.0 0.00 0.0 0.0
Northern Territory Central (Katherine) 0.0 0.00 0.0 0.0
TOTAL WESTERN REGION 2.8 1.19 3.3 0.8
TOTAL AUSTRALIA 138.6 1.19 164.9 41.2* Disease data obtained for this zone
Harvested in late spring. Faba beans are grown for human consumption, which has high quality standards, and stockfeed.
This section contains:n average area, production, yield and value of faba beans
over a recent five-year period;n a list of the diseases of faba beans that were considered;n the incidence and severity of the diseases in each
production area;n the potential and present yield loss as a percentage of
yield, effect on quality and the value of this lossn overall control methods and their value for each disease;
andn the present level of expenditure on fungicides on the crop.
7.2 faba bean productionEstimation of the value of disease losses depends on base data on the area, yield and value of the crop. The production data for faba beans are for the year 2008-09. The average data for the five years ending in that year were calculated as representative of current production. Production data were obtained from Pulse Australia.
The average area, yield, production and value of faba
beans in each agro-ecological zone are shown in Table 7.1 (see Appendix A for more details). For the period 2004-05 to 2008-09, the average annual area of faba beans sown in Australia was 139,000 hectares producing an average of 165,000 tonnes, with an overall average yield of 1.19t/ha.
The mean unit value of faba beans over the five-year period was $250/t, giving an average gross value of production of $41.23 million per year.
Faba bean production was mostly in the Southern Region with 88 per cent of the crop area, with 10 per cent of the crop area in the Northern Region and 2 per cent in the Western Region.
7.3 Diseases of faba beans7.3.1 faba bean diseases and their pathogensThere were 38 diseases of faba beans considered in this survey, comprising seven necrotrophic leaf fungal diseases, one biotrophic leaf fungal disease, 10 root and crown fungal diseases, seven nematode diseases, 12 viral diseases and one phytoplasma disease (Table 7.2). These diseases were caused by 18 fungi, seven nematodes, 12 viruses and one phytoplasma. No bacterial diseases were considered.
Because several species of the Pratylenchus nematodes
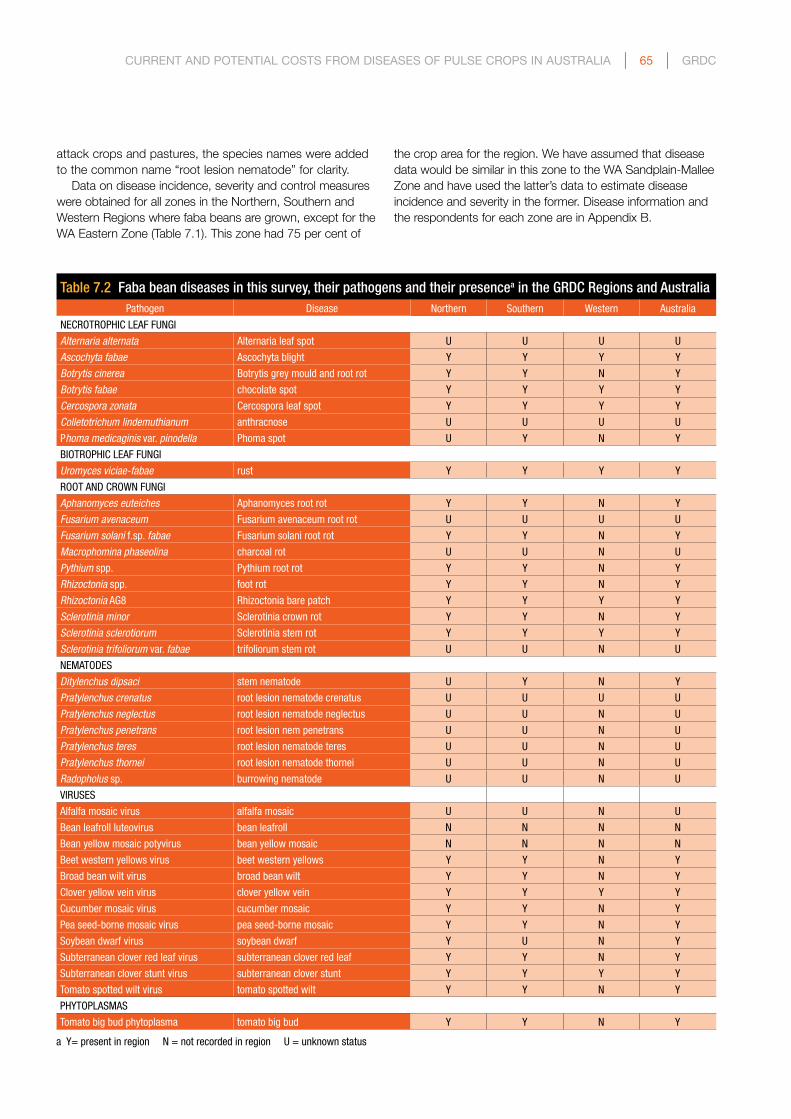
CuRRenT AnD PoTenTiAl CosTs fRoM DiseAses of Pulse CRoPs in AusTRAliA | 65 | GRDC
Table 7.2 Faba bean diseases in this survey, their pathogens and their presencea in the GRDC Regions and AustraliaPathogen Disease Northern Southern Western Australia
NECROTROPHIC LEAF FUNGI
Alternaria alternata Alternaria leaf spot U U U U
Ascochyta fabae Ascochyta blight Y Y Y Y
Botrytis cinerea Botrytis grey mould and root rot Y Y N Y
Botrytis fabae chocolate spot Y Y Y Y
Cercospora zonata Cercospora leaf spot Y Y Y Y
Colletotrichum lindemuthianum anthracnose U U U U
Phoma medicaginis var. pinodella Phoma spot U Y N Y
BIOTROPHIC LEAF FUNGI
Uromyces viciae-fabae rust Y Y Y Y
ROOT AND CROWN FUNGI
Aphanomyces euteiches Aphanomyces root rot Y Y N Y
Fusarium avenaceum Fusarium avenaceum root rot U U U U
Fusarium solani f.sp. fabae Fusarium solani root rot Y Y N Y
Macrophomina phaseolina charcoal rot U U N U
Pythium spp. Pythium root rot Y Y N Y
Rhizoctonia spp. foot rot Y Y N Y
Rhizoctonia AG8 Rhizoctonia bare patch Y Y Y Y
Sclerotinia minor Sclerotinia crown rot Y Y N Y
Sclerotinia sclerotiorum Sclerotinia stem rot Y Y Y Y
Sclerotinia trifoliorum var. fabae trifoliorum stem rot U U N U
NEMATODES
Ditylenchus dipsaci stem nematode U Y N Y
Pratylenchus crenatus root lesion nematode crenatus U U U U
Pratylenchus neglectus root lesion nematode neglectus U U N U
Pratylenchus penetrans root lesion nem penetrans U U N U
Pratylenchus teres root lesion nematode teres U U N U
Pratylenchus thornei root lesion nematode thornei U U N U
Radopholus sp. burrowing nematode U U N U
VIRUSES
Alfalfa mosaic virus alfalfa mosaic U U N U
Bean leafroll luteovirus bean leafroll N N N N
Bean yellow mosaic potyvirus bean yellow mosaic N N N N
Beet western yellows virus beet western yellows Y Y N Y
Broad bean wilt virus broad bean wilt Y Y N Y
Clover yellow vein virus clover yellow vein Y Y Y Y
Cucumber mosaic virus cucumber mosaic Y Y N Y
Pea seed-borne mosaic virus pea seed-borne mosaic Y Y N Y
Soybean dwarf virus soybean dwarf Y U N Y
Subterranean clover red leaf virus subterranean clover red leaf Y Y N Y
Subterranean clover stunt virus subterranean clover stunt Y Y Y Y
Tomato spotted wilt virus tomato spotted wilt Y Y N Y
PHYTOPLASMAS
Tomato big bud phytoplasma tomato big bud Y Y N Y
a Y= present in region N = not recorded in region U = unknown status
attack crops and pastures, the species names were added to the common name “root lesion nematode” for clarity.
Data on disease incidence, severity and control measures were obtained for all zones in the Northern, Southern and Western Regions where faba beans are grown, except for the WA Eastern Zone (Table 7.1). This zone had 75 per cent of
the crop area for the region. We have assumed that disease data would be similar in this zone to the WA Sandplain-Mallee Zone and have used the latter’s data to estimate disease incidence and severity in the former. Disease information and the respondents for each zone are in Appendix B.

GRDC | 66 | CuRRenT AnD PoTenTiAl CosTs fRoM DiseAses of Pulse CRoPs in AusTRAliA
Table 7.3 Incidence of faba bean diseases as a proportion of years when disease occurs (%) and as a proportion of the crop area affected when the disease develops (%) in the GRDC Regions and Australia
DiseaseNorthern Southern Western Australia
Years Area Years Area Years Area Years Area
NECROTROPHIC LEAF FUNGI
Alternaria leaf spot 0.0 0.0 0.0 0.0 0.0 0.0 0.0 0.0
Ascochyta blight 10.0 3.4 76.7 75.8 76.3 37.8 70.0 67.8
Botrytis grey mould and root rot 5.0 1.0 53.7 62.0 0.0 0.0 47.8 54.6
chocolate spot 10.0 65.0 54.4 62.3 82.5 57.5 50.5 62.5
Cercospora leaf spot 0.0 0.0 63.0 48.8 50.0 50.0 56.4 43.9
anthracnose 0.0 0.0 0.0 0.0 0.0 0.0 0.0 0.0
Phoma spot 0.0 0.0 17.7 15.5 0.0 0.0 15.6 13.6
BIOTROPHIC LEAF FUNGI
rust 84.0 84.0 19.7 29.7 37.5 11.2 26.5 34.8
ROOT AND CROWN FUNGI
Aphanomyces root rot 50.0 1.0 2.8 2.8 0.0 0.0 7.5 2.6
Fusarium avenaceum root rot 0.0 0.0 0.0 0.0 0.0 0.0 0.0 0.0
Fusarium solani root rot 50.0 1.0 6.9 6.9 0.0 0.0 11.0 6.1
charcoal rot 0.0 0.0 0.0 0.0 0.0 0.0 0.0 0.0
Pythium root rot 10.0 1.0 6.9 6.9 0.0 0.0 7.0 6.1
foot rot 10.0 1.0 6.9 7.0 0.0 0.0 7.0 6.3
Rhizoctonia bare patch 10.0 1.0 6.9 6.7 100.0 31.2 9.1 6.6
Sclerotinia crown rot 20.0 1.0 12.6 9.7 0.0 0.0 13.1 8.6
Sclerotinia stem rot 20.0 1.0 10.5 6.9 40.0 5.0 12.1 6.2
trifoliorum stem rot 0.0 0.0 0.0 0.0 0.0 0.0 0.0 0.0
NEMATODES
stem nematode 0.0 0.0 5.7 4.9 0.0 0.0 5.0 4.3
root lesion nematode crenatus 0.0 0.0 0.0 0.0 0.0 0.0 0.0 0.0
root lesion nematode neglectus 0.0 0.0 0.0 0.0 0.0 0.0 0.0 0.0
root lesion nem penetrans 0.0 0.0 0.0 0.0 0.0 0.0 0.0 0.0
root lesion nematode teres 0.0 0.0 0.0 0.0 0.0 0.0 0.0 0.0
root lesion nematode thornei 0.0 0.0 0.0 0.0 0.0 0.0 0.0 0.0
burrowing nematode 0.0 0.0 0.0 0.0 0.0 0.0 0.0 0.0
VIRUSES
alfalfa mosaic 0.0 0.0 0.0 0.0 0.0 0.0 0.0 0.0
bean leafroll 0.0 0.0 0.0 0.0 0.0 0.0 0.0 0.0
bean yellow mosaic 0.0 0.0 0.0 0.0 0.0 0.0 0.0 0.0
beet western yellows 40.0 8.0 6.8 0.3 0.0 0.0 10.0 1.1
broad bean wilt 65.0 65.0 17.0 3.4 0.0 0.0 21.5 9.5
clover yellow vein 40.0 50.0 17.0 0.3 100.0 50.0 21.0 6.3
cucumber mosaic 50.0 50.0 34.1 17.0 0.0 0.0 35.0 20.0
pea seed-borne mosaic 10.0 1.0 6.8 0.3 0.0 0.0 7.0 0.4
soybean dwarf 10.0 1.0 0.0 0.0 0.0 0.0 1.0 0.1
subterranean clover red leaf 19.0 5.0 19.9 2.0 0.0 0.0 19.4 2.2
subterranean clover stunt 100.0 1.0 4.0 0.2 100.0 100.0 15.5 2.3
tomato spotted wilt 75.0 19.0 6.8 0.3 0.0 0.0 13.5 2.2
PHYTOPLASMAS
tomato big bud 75.0 5.0 6.8 0.3 0.0 0.0 13.5 0.8- no data available

CuRRenT AnD PoTenTiAl CosTs fRoM DiseAses of Pulse CRoPs in AusTRAliA | 67 | GRDC
7.3.2 Distribution of the pathogens in AustraliaTwenty-four of the pathogens surveyed were reported as present on faba beans in Australia, eight of them in all regions, 22 in the Northern Region, 23 in the Southern and eight in the Western (Table 7.2).
Five of the seven necrotrophic leaf fungal diseases were present in faba beans in Australia, four in the Northern Region, five in the Southern and three in the Western. Rust was present in all regions.
Of the 10 root and crown fungal diseases, seven were present on faba beans in Australia and the two eastern regions while only two of these were present in the Western Region.
Although the seven nematodes occur on other plants, the status of six on faba beans was unknown or not present on faba beans in the three regions. Stem nematode was reported present on faba beans in the Southern Region.
Of the 12 viral diseases, nine were reported as present on faba beans in Australia and in the Northern Region. Of these, eight were present in the Southern and two in the Western Region. Three were not reported present on faba beans in any region.
The phytoplasma disease was present on faba beans in the two eaståern regions (Table 7.2).
7.4 incidence and severity of faba bean diseases
7.4.1 incidence of faba bean diseasesIncidence was assessed as the proportion of years that favoured development of the disease in each zone, and as the proportion of the crop area in the zone affected when the disease developed. These values were averaged for the region and Australia by weighting by the area sown to the crop in each zone for which disease data were available, and are shown in Table 7.3.
For Australia, there were six diseases that occurred with a yearly incidence of 25 per cent or greater. The highest was Ascochyta blight, which occurred in 70 per cent of years, followed by Cercospora leaf spot, chocolate spot, Botrytis grey mould and cucumber mosaic. Five diseases occurred over 25 per cent of the crop area in years favourable for their development. Ascochyta blight was the highest (68 per cent of area) followed by chocolate spot, Botrytis grey mould and root rot, Cercospora leaf spot and rust (Table 7.3).
Within the Northern Region, there were 10 diseases that occurred with a yearly incidence of 25 per cent or greater. Subterranean clover stunt occurred every year followed by rust, tomato spotted wilt and broad bean wilt. Five diseases occurred over 25 per cent of the crop area in years favourable for their development: rust occurred over 84.0 per cent of the area, followed by chocolate spot, broad bean wilt, clover yellow vein and cucumber mosaic.
Within the Southern Region, there were five diseases that occurred with a yearly incidence of 25 per cent or greater. Ascochyta blight occurred in 77 per cent of years followed by Cercospora leaf blight, chocolate spot, Botrytis grey mould and root rot, and cucumber mosaic. Five diseases occurred over 25 per cent of the crop area in
years favourable for their development: Ascochyta blight occurred most widely (75.8 per cent of the area) followed by chocolate spot, Botrytis grey mould and root rot, Cercospora leaf spot and rust.
Within the Western Region, there were eight diseases that occurred with a yearly incidence of 25 per cent or greater. Rhizoctonia bare patch, clover yellow vein and subterranean clover stunt occurred every year followed by chocolate spot and Ascochyta blight. Six diseases occurred over 25 per cent of the crop area in years favourable for their development. The highest was subterranean clover stunt, which occurred over the whole area, followed by chocolate spot, Cercospora leaf spot, clover yellow vein and Ascochyta blight.
7.4.2 severity of faba bean diseasesSeverity was assessed as the percentage yield loss that occurred in affected crops in the zone in years favourable for development of the disease. Two assessments were made. The first was the potential severity, that is, the severity that would occur if current controls were not applied. The second was the present severity, when current controls are in place. These assessments were made at the zone level and aggregated to the region and Australia by weighting as in 7.4.1 (Table 7.4).
For Australia, six diseases have the potential to cause 10 per cent or more yield loss in years when they developed. Chocolate spot has the highest potential yield loss of 45 per cent followed by Ascochyta blight, rust, Botrytis grey mould and root rot, and broad bean wilt. One disease, chocolate spot, can cause a present loss of greater than 10 per cent, followed by Ascochyta blight, Aphanomyces root rot, rust and Botrytis grey mould and root rot (Table 7.4).
In the Northern Region, 10 diseases have the potential to cause 10 per cent or more yield loss in years when they developed. Chocolate spot, broad bean wilt and tomato spotted wilt have the highest potential severity of 100 per cent yield loss followed by rust and Aphanomyces root rot. Four diseases have a present severity of more than 10 per cent: chocolate spot, rust, broad bean wilt and Aphanomyces root rot.
In the Southern Region, four diseases have potential yield losses of more than 10 per cent in years when they developed. Chocolate spot has the highest with 38 per cent yield loss followed by Ascochyta blight, rust and Botrytis grey mould and root rot. No diseases have a present severity of more than 10 per cent yield loss. The highest is chocolate spot with 7 per cent followed by Ascochyta blight, Botrytis grey mould and root rot, Aphanomyces root rot and Sclerotinia crown rot.
In the Western Region, five diseases have potential yield losses of more than 10 per cent in years when they developed. Chocolate spot has the highest with 100 per cent yield loss followed by subterranean clover stunt, clover yellow vein, Ascochyta blight and Rhizoctonia bare patch. One disease, chocolate spot, has a present severity of more than 10 per cent yield loss. It is followed by Ascochyta blight, Rhizoctonia bare patch, Sclerotinia stem rot and rust.
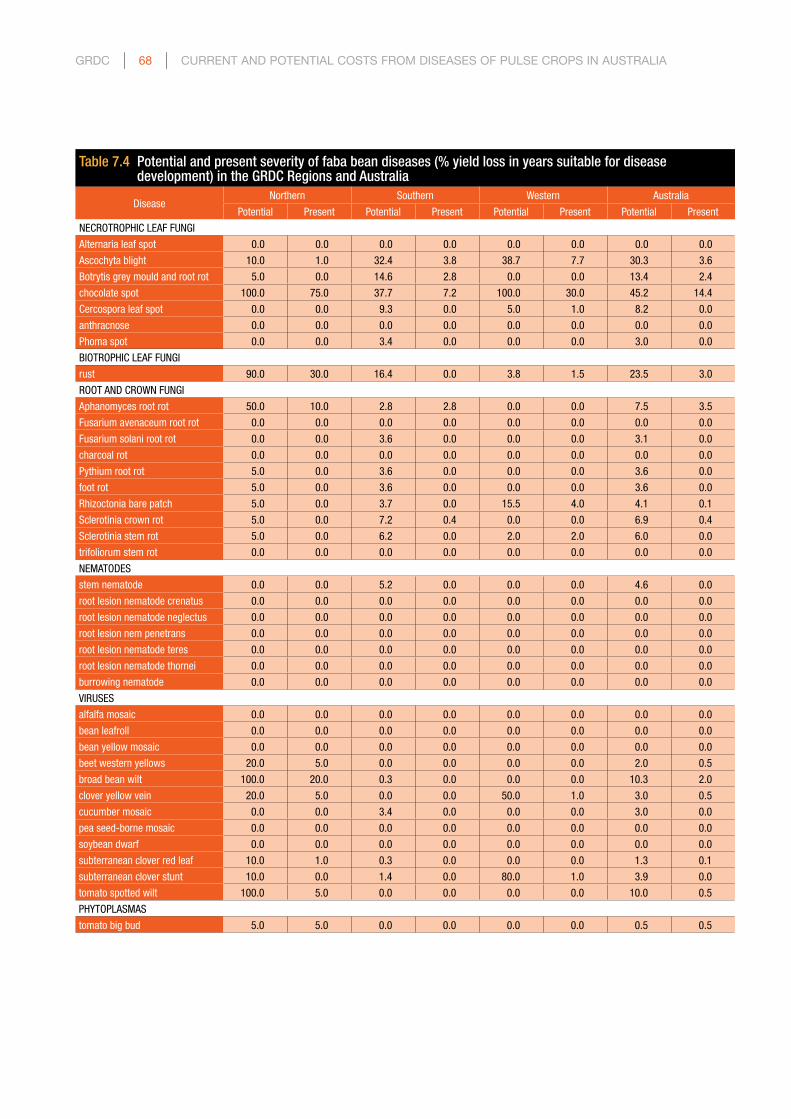
GRDC | 68 | CuRRenT AnD PoTenTiAl CosTs fRoM DiseAses of Pulse CRoPs in AusTRAliA
Table 7.4 Potential and present severity of faba bean diseases (% yield loss in years suitable for disease development) in the GRDC Regions and Australia
DiseaseNorthern Southern Western Australia
Potential Present Potential Present Potential Present Potential Present
NECROTROPHIC LEAF FUNGI
Alternaria leaf spot 0.0 0.0 0.0 0.0 0.0 0.0 0.0 0.0
Ascochyta blight 10.0 1.0 32.4 3.8 38.7 7.7 30.3 3.6
Botrytis grey mould and root rot 5.0 0.0 14.6 2.8 0.0 0.0 13.4 2.4
chocolate spot 100.0 75.0 37.7 7.2 100.0 30.0 45.2 14.4
Cercospora leaf spot 0.0 0.0 9.3 0.0 5.0 1.0 8.2 0.0
anthracnose 0.0 0.0 0.0 0.0 0.0 0.0 0.0 0.0
Phoma spot 0.0 0.0 3.4 0.0 0.0 0.0 3.0 0.0
BIOTROPHIC LEAF FUNGI
rust 90.0 30.0 16.4 0.0 3.8 1.5 23.5 3.0
ROOT AND CROWN FUNGI
Aphanomyces root rot 50.0 10.0 2.8 2.8 0.0 0.0 7.5 3.5
Fusarium avenaceum root rot 0.0 0.0 0.0 0.0 0.0 0.0 0.0 0.0
Fusarium solani root rot 0.0 0.0 3.6 0.0 0.0 0.0 3.1 0.0
charcoal rot 0.0 0.0 0.0 0.0 0.0 0.0 0.0 0.0
Pythium root rot 5.0 0.0 3.6 0.0 0.0 0.0 3.6 0.0
foot rot 5.0 0.0 3.6 0.0 0.0 0.0 3.6 0.0
Rhizoctonia bare patch 5.0 0.0 3.7 0.0 15.5 4.0 4.1 0.1
Sclerotinia crown rot 5.0 0.0 7.2 0.4 0.0 0.0 6.9 0.4
Sclerotinia stem rot 5.0 0.0 6.2 0.0 2.0 2.0 6.0 0.0
trifoliorum stem rot 0.0 0.0 0.0 0.0 0.0 0.0 0.0 0.0
NEMATODES
stem nematode 0.0 0.0 5.2 0.0 0.0 0.0 4.6 0.0
root lesion nematode crenatus 0.0 0.0 0.0 0.0 0.0 0.0 0.0 0.0
root lesion nematode neglectus 0.0 0.0 0.0 0.0 0.0 0.0 0.0 0.0
root lesion nem penetrans 0.0 0.0 0.0 0.0 0.0 0.0 0.0 0.0
root lesion nematode teres 0.0 0.0 0.0 0.0 0.0 0.0 0.0 0.0
root lesion nematode thornei 0.0 0.0 0.0 0.0 0.0 0.0 0.0 0.0
burrowing nematode 0.0 0.0 0.0 0.0 0.0 0.0 0.0 0.0
VIRUSES
alfalfa mosaic 0.0 0.0 0.0 0.0 0.0 0.0 0.0 0.0
bean leafroll 0.0 0.0 0.0 0.0 0.0 0.0 0.0 0.0
bean yellow mosaic 0.0 0.0 0.0 0.0 0.0 0.0 0.0 0.0
beet western yellows 20.0 5.0 0.0 0.0 0.0 0.0 2.0 0.5
broad bean wilt 100.0 20.0 0.3 0.0 0.0 0.0 10.3 2.0
clover yellow vein 20.0 5.0 0.0 0.0 50.0 1.0 3.0 0.5
cucumber mosaic 0.0 0.0 3.4 0.0 0.0 0.0 3.0 0.0
pea seed-borne mosaic 0.0 0.0 0.0 0.0 0.0 0.0 0.0 0.0
soybean dwarf 0.0 0.0 0.0 0.0 0.0 0.0 0.0 0.0
subterranean clover red leaf 10.0 1.0 0.3 0.0 0.0 0.0 1.3 0.1
subterranean clover stunt 10.0 0.0 1.4 0.0 80.0 1.0 3.9 0.0
tomato spotted wilt 100.0 5.0 0.0 0.0 0.0 0.0 10.0 0.5
PHYTOPLASMAS
tomato big bud 5.0 5.0 0.0 0.0 0.0 0.0 0.5 0.5

CuRRenT AnD PoTenTiAl CosTs fRoM DiseAses of Pulse CRoPs in AusTRAliA | 69 | GRDC
Table 7.5 Potential and present average annual yield losses (%) from faba bean diseases by GRDC Region and Australia
DiseaseNorthern Southern Western Australia
Potential Present Potential Present Potential Present Potential Present
NECROTROPHIC LEAF FUNGI
Alternaria leaf spot 0.0 0.0 0.0 0.0 0.0 0.0 0.0 0.0
Ascochyta blight 0.0 0.0 20.4 2.2 18.7 3.7 18.3 2.0
Botrytis grey mould and root rot 0.0 0.0 5.5 1.2 0.0 0.0 4.9 1.0
chocolate spot 6.5 4.9 13.5 2.6 48.7 14.6 13.5 3.0
Cercospora leaf spot 0.0 0.0 4.8 0.0 1.3 0.3 4.3 0.0
anthracnose 0.0 0.0 0.0 0.0 0.0 0.0 0.0 0.0
Phoma spot 0.0 0.0 0.2 0.0 0.0 0.0 0.2 0.0
SUB TOTAL 4.9 6.0 18.6 6.1
BIOTROPHIC LEAF FUNGI
rust 64.0 21.3 1.3 0.0 0.3 0.1 7.6 2.1
SUB TOTAL 21.3 0.0 0.1 2.1
ROOT AND CROWN FUNGI
Aphanomyces root rot 0.3 0.1 0.0 0.0 0.0 0.0 0.0 0.0
Fusarium avenaceum root rot 0.0 0.0 0.0 0.0 0.0 0.0 0.0 0.0
Fusarium solani root rot 0.0 0.0 0.0 0.0 0.0 0.0 0.0 0.0
charcoal rot 0.0 0.0 0.0 0.0 0.0 0.0 0.0 0.0
Pythium root rot 0.0 0.0 0.0 0.0 0.0 0.0 0.0 0.0
foot rot 0.0 0.0 0.0 0.0 0.0 0.0 0.0 0.0
Rhizoctonia bare patch 0.0 0.0 0.0 0.0 6.0 1.5 0.1 0.0
Sclerotinia crown rot 0.0 0.0 0.1 0.0 0.0 0.0 0.1 0.0
Sclerotinia stem rot 0.0 0.0 0.1 0.0 0.0 0.0 0.1 0.0
trifoliorum stem rot 0.0 0.0 0.0 0.0 0.0 0.0 0.0 0.0
SUB TOTAL 0.1 0.0 1.6 0.1
NEMATODES
stem nematode 0.0 0.0 0.0 0.0 0.0 0.0 0.0 0.0
root lesion nematode crenatus 0.0 0.0 0.0 0.0 0.0 0.0 0.0 0.0
root lesion nematode neglectus 0.0 0.0 0.0 0.0 0.0 0.0 0.0 0.0
root lesion nem penetrans 0.0 0.0 0.0 0.0 0.0 0.0 0.0 0.0
root lesion nematode teres 0.0 0.0 0.0 0.0 0.0 0.0 0.0 0.0
root lesion nematode thornei 0.0 0.0 0.0 0.0 0.0 0.0 0.0 0.0
burrowing nematode 0.0 0.0 0.0 0.0 0.0 0.0 0.0 0.0
SUB TOTAL 0.0 0.0 0.0 0.0
VIRUSES
alfalfa mosaic 0.0 0.0 0.0 0.0 0.0 0.0 0.0 0.0
bean leafroll 0.0 0.0 0.0 0.0 0.0 0.0 0.0 0.0
bean yellow mosaic 0.0 0.0 0.0 0.0 0.0 0.0 0.0 0.0
beet western yellows 0.7 0.2 0.0 0.0 0.0 0.0 0.1 0.0
broad bean wilt 43.8 8.8 0.0 0.0 0.0 0.0 4.4 0.9
clover yellow vein 4.0 1.0 0.0 0.0 25.0 0.5 0.9 0.1
cucumber mosaic 0.0 0.0 1.7 0.0 0.0 0.0 1.5 0.0
pea seed-borne mosaic 0.0 0.0 0.0 0.0 0.0 0.0 0.0 0.0
soybean dwarf 0.0 0.0 0.0 0.0 0.0 0.0 0.0 0.0
subterranean clover red leaf 0.1 0.0 0.0 0.0 0.0 0.0 0.0 0.0
subterranean clover stunt 0.1 0.0 0.0 0.0 80.0 1.0 1.6 0.0
tomato spotted wilt 14.3 0.7 0.0 0.0 0.0 0.0 1.4 0.1
SUB TOTAL 10.6 0.0 1.5 1.1
PHYTOPLASMAS
tomato big bud 0.2 0.2 0.0 0.0 0.0 0.0 0.0 0.0
SUB TOTAL 0.2 0.0 0.0 0.0
TOTAL 37.1 6.0 21.8 9.4

GRDC | 70 | CuRRenT AnD PoTenTiAl CosTs fRoM DiseAses of Pulse CRoPs in AusTRAliA
7.5 losses from faba bean diseases7.5.1 Potential and present percentage yield
lossesThe average annual yield loss was calculated from the incidence and severity data (see Section 2.5 for the method). The potential severity was used to calculate the potential losses if current controls were not used and the present severity to calculate present losses with current control measures.
For Australia, two diseases had a potential average annual yield loss of more than 10 per cent. The highest was 18 per cent from Ascochyta blight followed by chocolate spot, rust, Botrytis grey mould and root rot, broad bean wilt and Cercospora leaf spot. With current disease controls, no disease had a loss exceeding 10 per cent. The highest current average annual yield loss was 3 per cent from chocolate spot followed by rust, Ascochyta blight and Botrytis grey mould and root rot (Table 7.5).
In the Northern Region, three diseases had a potential average annual yield loss of more than 10 per cent. The highest average annual potential yield loss was 64 per cent from rust, followed by broad bean wilt and tomato spotted wilt. With current disease controls, rust was the highest with 21 per cent present average annual loss, followed by broad bean wilt and chocolate spot (Table 7.5).
In the Southern Region, two diseases had a potential average annual yield loss of more than 10 per cent: Ascochyta blight with 20.4 per cent average annual yield loss followed by chocolate spot, Botrytis grey mould and root rot, Cercospora leaf spot and rust. With current disease controls, no disease caused an annual average loss of more than 10 per cent. The highest was chocolate spot with almost 3 per cent followed by Ascochyta blight and Botrytis grey mould and root rot (Table 7.5).
In the Western Region, four diseases had a potential average annual yield loss of more than 10 per cent: subterranean clover stunt with 80 per cent average annual yield loss, followed by chocolate spot, clover yellow vein and Ascochyta blight. With current disease controls, one disease, chocolate spot, caused an annual average loss of more than 10 per cent. It was followed by Ascochyta blight and Rhizoctonia bare patch (Table 7.5).
For Australia, the total present average annual yield loss from all diseases was 9 per cent. Necrotrophic leaf
fungal diseases totalled 6 per cent, biotrophic leaf fungal diseases 2 per cent, the root and crown fungi 0.1 per cent, nematodes nil, bacteria nil, viruses 1 per cent, and phytoplasmas nil.
7.5.2 Quality effects of diseases on faba beansFaba beans are grown for both human consumption and stockfeed. Their value for human consumption is greater than for stockfeed but appearance and freedom from blemishes are paramount for the former grade. Diseases that discolour or reduce the size of the seed can reduce grain quality and value.
The two diseases identified as causing quality losses in faba beans are Ascochyta blight and chocolate spot (Table 7.6). Although the losses per hectare are higher in the Western Region, the total losses are concentrated in the Southern Region, as that is where the crop production is concentrated. Both diseases have the potential cause considerable losses, but average present losses are relatively small.
7.5.3 Value of losses from faba bean diseasesThe value of these yield losses was calculated by relating the percentage losses to the gross value of faba bean production in each zone, using the average value of faba beans, over a five-year period (see Section 7.2). The value of quality losses was combined with these yield losses, and the total losses were calculated on a per hectare basis and on an aggregate basis for each zone, then for each GRDC region and nationally.
The potential losses estimated for each disease are in Table 7.7 ($ per hectare) and Table 7.8 (aggregate losses). For Australia, the five major diseases by potential loss on a per hectare basis and their total cost to the industry are:
Disease $/ha $ million
Ascochyta blight 67.31 9.3
chocolate spot 49.47 6.9
rust 23.36 3.2
Botrytis grey mould and root rot 14.43 2.0
broad bean wilt 13.98 1.9
The present losses estimated for each disease are in Table 7.7 ($ per hectare) and Table 7.8 (aggregate losses).
Table 7.6 Potential and present average annual quality losses from faba bean diseases by GRDC Region and Australia
Quality lossesNorthern Southern Western Australia
Potential Present Potential Present Potential Present Potential Present
$/ha
Ascochyta blight 0.00 0.00 11.73 1.73 29.74 5.95 10.91 1.64
chocolate spot 0.66 0.50 9.91 1.55 0.00 0.00 8.79 1.42
0.50 3.29 5.95 3.06
$ million
Ascochyta blight 0.00 0.00 1.43 0.21 0.08 0.02 1.51 0.23
chocolate spot 0.01 0.01 1.21 0.19 0.00 0.00 1.22 0.20
0.01 0.40 0.02 0.42

CuRRenT AnD PoTenTiAl CosTs fRoM DiseAses of Pulse CRoPs in AusTRAliA | 71 | GRDC
Table 7.7 Potential and present average annual costs ($/ha) from faba bean diseases by GRDC Region and Australia
DiseaseNorthern Southern Western Australia
Potential Present Potential Present Potential Present Potential Present
NECROTROPHIC LEAF FUNGI
Alternaria leaf spot - - - - - - - -
Ascochyta blight 0.11 0.01 74.53 8.37 85.48 17.10 67.31 7.71
Botrytis grey mould and root rot 0.01 0.00 16.40 3.37 0.00 0.00 14.43 2.96
chocolate spot 20.73 15.55 50.57 9.11 144.94 43.48 49.47 10.44
Cercospora leaf spot 0.00 0.00 15.27 0.00 3.72 0.74 13.51 0.01
anthracnose - - - - - - - -
Phoma spot - - 0.55 0.00 0.00 0.00 0.49 0.00
SUB TOTAL 15.56 20.84 61.32 21.13
BIOTROPHIC LEAF FUNGI
rust 196.92 65.64 4.15 0.00 0.84 0.33 23.36 6.57
SUB TOTAL 65.64 0.00 0.33 6.57
ROOT AND CROWN FUNGI
Aphanomyces root rot 0.74 0.15 0.09 0.09 0.00 0.00 0.15 0.09
Fusarium avenaceum root rot - - - - - - - -
Fusarium solani root rot 0.00 0.00 0.10 0.00 0.00 0.00 0.09 0.00
charcoal rot - - - - 0.00 0.00 - -
Pythium root rot 0.01 0.00 0.10 0.00 0.00 0.00 0.09 0.00
foot rot 0.01 0.00 0.10 0.00 0.00 0.00 0.09 0.00
Rhizoctonia bare patch 0.01 0.00 0.10 0.00 17.91 4.50 0.45 0.09
Sclerotinia crown rot 0.03 0.00 0.28 0.01 0.00 0.00 0.25 0.01
Sclerotinia stem rot 0.03 0.00 0.26 0.00 0.12 0.12 0.24 0.00
trifoliorum stem rot - - - - 0.00 0.00 - -
SUB TOTAL 0.15 0.10 4.62 0.20
NEMATODES
stem nematode - - 0.14 0.00 0.00 0.00 0.13 0.00
root lesion nematode crenatus - - - - - - - -
root lesion nematode neglectus - - - - 0.00 0.00 - -
root lesion nem penetrans - - - - 0.00 0.00 - -
root lesion nematode teres - - - - 0.00 0.00 - -
root lesion nematode thornei - - - - 0.00 0.00 - -
burrowing nematode - - - - 0.00 0.00 - -
SUB TOTAL 0.00 0.00 0.00 0.00
VIRUSES
alfalfa mosaic - - - - 0.00 0.00 - -
bean leafroll 0.00 0.00 0.00 0.00 0.00 0.00 0.00 0.00
bean yellow mosaic 0.00 0.00 0.00 0.00 0.00 0.00 0.00 0.00
beet western yellows 2.30 0.58 0.00 0.00 0.00 0.00 0.23 0.06
broad bean wilt 139.40 27.88 0.05 0.00 0.00 0.00 13.98 2.79
clover yellow vein 12.64 3.16 0.00 0.00 74.34 1.49 2.75 0.35
cucumber mosaic 0.00 0.00 5.07 0.00 0.00 0.00 4.46 0.00
pea seed-borne mosaic 0.00 0.00 0.00 0.00 0.00 0.00 0.00 0.00
soybean dwarf 0.00 0.00 - - 0.00 0.00 0.00 0.00
subterranean clover red leaf 0.30 0.03 0.06 0.00 0.00 0.00 0.08 0.00
subterranean clover stunt 0.30 0.00 0.00 0.00 237.88 2.97 4.79 0.06
tomato spotted wilt 45.72 2.29 0.00 0.00 0.00 0.00 4.57 0.23
SUB TOTAL 33.93 0.00 4.46 3.48
PHYTOPLASMAS
tomato big bud 0.56 0.56 0.00 0.00 0.00 0.00 0.06 0.06
SUB TOTAL 0.56 0.00 0.00 0.06
TOTAL 115.84 20.95 70.73 31.43- no available data

GRDC | 72 | CuRRenT AnD PoTenTiAl CosTs fRoM DiseAses of Pulse CRoPs in AusTRAliA
Table 7.8 Aggregate potential and present average annual costs ($ million) from faba bean diseases by GRDC Regions and Australia
DiseaseNorthern Southern Western Australia
Potential Present Potential Present Potential Present Potential Present
NECROTROPHIC LEAF FUNGI
Alternaria leaf spot - - - - - - - -
Ascochyta blight 0.0 0.0 9.1 1.0 0.2 0.0 9.3 1.1
Botrytis grey mould and root rot 0.0 0.0 2.0 0.4 0.0 0.0 2.0 0.4
chocolate spot 0.3 0.2 6.2 1.1 0.4 0.1 6.9 1.4
Cercospora leaf spot 0.0 0.0 1.9 0.0 0.0 0.0 1.9 0.0
anthracnose - - - - - - - -
Phoma spot - - 0.1 0.0 0.0 0.0 0.1 0.0
SUB TOTAL 0.2 2.5 0.2 2.9
BIOTROPHIC LEAF FUNGI
rust 2.7 0.9 0.5 0.0 0.0 0.0 3.2 0.9
SUB TOTAL 0.9 0.0 0.0 0.9
ROOT AND CROWN FUNGI
Aphanomyces root rot 0.0 0.0 0.0 0.0 0.0 0.0 0.0 0.0
Fusarium avenaceum root rot - - - - - - - -
Fusarium solani root rot 0.0 0.0 0.0 0.0 0.0 0.0 0.0 0.0
charcoal rot - - - - 0.0 0.0 - -
Pythium root rot 0.0 0.0 0.0 0.0 0.0 0.0 0.0 0.0
foot rot 0.0 0.0 0.0 0.0 0.0 0.0 0.0 0.0
Rhizoctonia bare patch 0.0 0.0 0.0 0.0 0.0 0.0 0.1 0.0
Sclerotinia crown rot 0.0 0.0 0.0 0.0 0.0 0.0 0.0 0.0
Sclerotinia stem rot 0.0 0.0 0.0 0.0 0.0 0.0 0.0 0.0
trifoliorum stem rot - - - - 0.0 0.0 - -
SUB TOTAL 0.0 0.0 0.0 0.0
NEMATODES
stem nematode - - 0.0 0.0 0.0 0.0 0.0 0.0
root lesion nematode crenatus - - - - - - - -
root lesion nematode neglectus - - - - 0.0 0.0 - -
root lesion nem penetrans - - - - 0.0 0.0 - -
root lesion nematode teres - - - - 0.0 0.0 - -
root lesion nematode thornei - - - - 0.0 0.0 - -
burrowing nematode - - - - 0.0 0.0 - -
SUB TOTAL 0.0 0.0 0.0 0.0
VIRUSES
alfalfa mosaic - - - - 0.0 0.0 - -
bean leafroll 0.0 0.0 0.0 0.0 0.0 0.0 0.0 0.0
bean yellow mosaic 0.0 0.0 0.0 0.0 0.0 0.0 0.0 0.0
beet western yellows 0.0 0.0 0.0 0.0 0.0 0.0 0.0 0.0
broad bean wilt 1.9 0.4 0.0 0.0 0.0 0.0 1.9 0.4
clover yellow vein 0.2 0.0 0.0 0.0 0.2 0.0 0.4 0.0
cucumber mosaic 0.0 0.0 0.6 0.0 0.0 0.0 0.6 0.0
pea seed-borne mosaic 0.0 0.0 0.0 0.0 0.0 0.0 0.0 0.0
soybean dwarf 0.0 0.0 - - 0.0 0.0 0.0 0.0
subterranean clover red leaf 0.0 0.0 0.0 0.0 0.0 0.0 0.0 0.0
subterranean clover stunt 0.0 0.0 0.0 0.0 0.7 0.0 0.7 0.0
tomato spotted wilt 0.6 0.0 0.0 0.0 0.0 0.0 0.6 0.0
SUB TOTAL 0.5 0.0 0.0 0.5
PHYTOPLASMAS
tomato big bud 0.0 0.0 0.0 0.0 0.0 0.0 0.0 0.0
SUB TOTAL 0.0 0.0 0.0 0.0
TOTAL 1.6 2.6 0.2 4.4- no available data

CuRRenT AnD PoTenTiAl CosTs fRoM DiseAses of Pulse CRoPs in AusTRAliA | 73 | GRDC
Table 7.9 Value of current disease control practices in faba beans per hectare and by GRDC Region and Australia
DiseasePer hectare ($) Total ($ million)
Northern Southern Western Australia Northern Southern Western Australia
NECROTROPHIC LEAF FUNGI
Alternaria leaf spot - - - - - - - -
Ascochyta blight 0.10 66.16 68.38 59.60 0.0 8.1 0.2 8.3
Botrytis grey mould and root rot 0.01 13.04 0.00 11.47 0.0 1.6 0.0 1.6
chocolate spot 5.18 41.46 101.46 39.03 0.1 5.1 0.3 5.4
Cercospora leaf spot 0.00 15.27 2.97 13.50 0.0 1.9 0.0 1.9
anthracnose - - - - - - - -
Phoma spot - 0.55 0.00 0.49 - 0.1 0.0 0.1
BIOTROPHIC LEAF FUNGI
rust 131.28 4.15 0.50 16.79 1.8 0.5 0.0 2.3
ROOT AND CROWN FUNGI
Aphanomyces root rot 0.59 0.00 0.00 0.06 0.0 0.0 0.0 0.0
Fusarium avenaceum root rot - - - - - - - -
Fusarium solani root rot 0.00 0.10 0.00 0.09 0.0 0.0 0.0 0.0
charcoal rot - - 0.00 - - - 0.0 -
Pythium root rot 0.01 0.10 0.00 0.09 0.0 0.0 0.0 0.0
foot rot 0.01 0.10 0.00 0.09 0.0 0.0 0.0 0.0
Rhizoctonia bare patch 0.01 0.10 13.42 0.36 0.0 0.0 0.0 0.0
Sclerotinia crown rot 0.03 0.27 0.00 0.24 0.0 0.0 0.0 0.0
Sclerotinia stem rot 0.03 0.26 0.00 0.24 0.0 0.0 0.0 0.0
trifoliorum stem rot - - 0.00 - - - 0.0 -
NEMATODES
stem nematode - 0.14 0.00 0.13 - 0.0 0.0 0.0
root lesion nematode crenatus - - - - - - - -
root lesion nematode neglectus - - 0.00 - - - 0.0 -
root lesion nem penetrans - - 0.00 - - - 0.0 -
root lesion nematode teres - - 0.00 - - - 0.0 -
root lesion nematode thornei - - 0.00 - - - 0.0 -
burrowing nematode - - 0.00 - - - 0.0 -
VIRUSES
alfalfa mosaic - - 0.00 - - - 0.0 -
bean leafroll 0.00 0.00 0.00 0.00 0.0 0.0 0.0 0.0
bean yellow mosaic 0.00 0.00 0.00 0.00 0.0 0.0 0.0 0.0
beet western yellows 1.73 0.00 0.00 0.17 0.0 0.0 0.0 0.0
broad bean wilt 111.52 0.05 0.00 11.20 1.5 0.0 0.0 1.6
clover yellow vein 9.48 0.00 72.85 2.41 0.1 0.0 0.2 0.3
cucumber mosaic 0.00 5.07 0.00 4.46 0.0 0.6 0.0 0.6
pea seed-borne mosaic 0.00 0.00 0.00 0.00 0.0 0.0 0.0 0.0
soybean dwarf 0.00 - 0.00 0.00 0.0 - 0.0 0.0
subterranean clover red leaf 0.27 0.06 0.00 0.08 0.0 0.0 0.0 0.0
subterranean clover stunt 0.30 0.00 234.91 4.74 0.0 0.0 0.7 0.7
tomato spotted wilt 43.44 0.00 0.00 4.34 0.6 0.0 0.0 0.6
PHYTOPLASMAS
tomato big bud 0.00 0.00 0.00 0.00 0.0 0.0 0.0 0.0
- no available data

GRDC | 74 | CuRRenT AnD PoTenTiAl CosTs fRoM DiseAses of Pulse CRoPs in AusTRAliA
Table 7.10 Value of different forms of faba bean disease control in Australia
DiseaseCost/value ($ million) Contribution (per cent) Contribution ($ million)
Potential Present Control Breeding Cultural Pesticide Breeding Cultural Pesticide
Necrotrophic leaf fungi
Alternaria leaf spot - - - - - -
Ascochyta blight 9.3 1.1 8.3 59 11 30 4.9 0.9 2.5
Botrytis grey mould and root rot 2.0 0.4 1.6 24 18 59 0.4 0.3 0.9
chocolate spot 6.9 1.4 5.4 22 20 57 1.2 1.1 3.1
Cercospora leaf spot 1.9 0.0 1.9 14 46 41 0.3 0.9 0.8
anthracnose - - - - - -
Phoma spot 0.1 0.0 0.1 0 77 23 0.0 0.1 0.0
Biotrophic leaf fungi
rust 3.2 0.9 2.3 47 20 34 1.1 0.5 0.8
Root and crown fungi
Aphanomyces root rot 0.0 0.0 0.0 50 50 0 0.0 0.0 0.0
Fusarium avenaceum root rot - - - - - -
Fusarium solani root rot 0.0 0.0 0.0 0 90 10 0.0 0.0 0.0
charcoal rot - - - - - -
Pythium root rot 0.0 0.0 0.0 0 90 10 0.0 0.0 0.0
foot rot 0.0 0.0 0.0 0 90 10 0.0 0.0 0.0
Rhizoctonia bare patch 0.1 0.0 0.0 0 98 2 0.0 0.0 0.0
Sclerotinia crown rot 0.0 0.0 0.0 0 87 13 0.0 0.0 0.0
Sclerotinia stem rot 0.0 0.0 0.0 0 100 0 0.0 0.0 0.0
trifoliorum stem rot - - - - - -
Nematodes
stem nematode 0.0 0.0 0.0 0 98 2 0.0 0.0 0.0
root lesion nematode crenatus - - - - - -
root lesion nematode neglectus - - - - - -
root lesion nem penetrans - - - - - -
root lesion nematode teres - - - - - -
root lesion nematode thornei - - - - - -
burrowing nematode - - - - - -
Viruses
alfalfa mosaic - - - - - -
bean leafroll 0.0 0.0 0.0 0.0 0.0 0.0
bean yellow mosaic 0.0 0.0 0.0 0.0 0.0 0.0
beet western yellows 0.0 0.0 0.0 50 50 0 0.0 0.0 0.0
broad bean wilt 1.9 0.4 1.6 90 10 0 1.4 0.2 0.0
clover yellow vein 0.4 0.0 0.3 20 80 0 0.1 0.3 0.0
cucumber mosaic 0.6 0.0 0.6 0 50 50 0.0 0.3 0.3
pea seed-borne mosaic 0.0 0.0 0.0 0.0 0.0 0.0
soybean dwarf 0.0 0.0 0.0 0.0 0.0 0.0
subterranean clover red leaf 0.0 0.0 0.0 18 82 0 0.0 0.0 0.0
subterranean clover stunt 0.7 0.0 0.7 0 100 0 0.0 0.7 0.0
tomato spotted wilt 0.6 0.0 0.6 25 75 0 0.2 0.5 0.0
Phytoplasmas
tomato big bud 0.0 0.0 0.0 0.0 0.0 0.0
- no available data
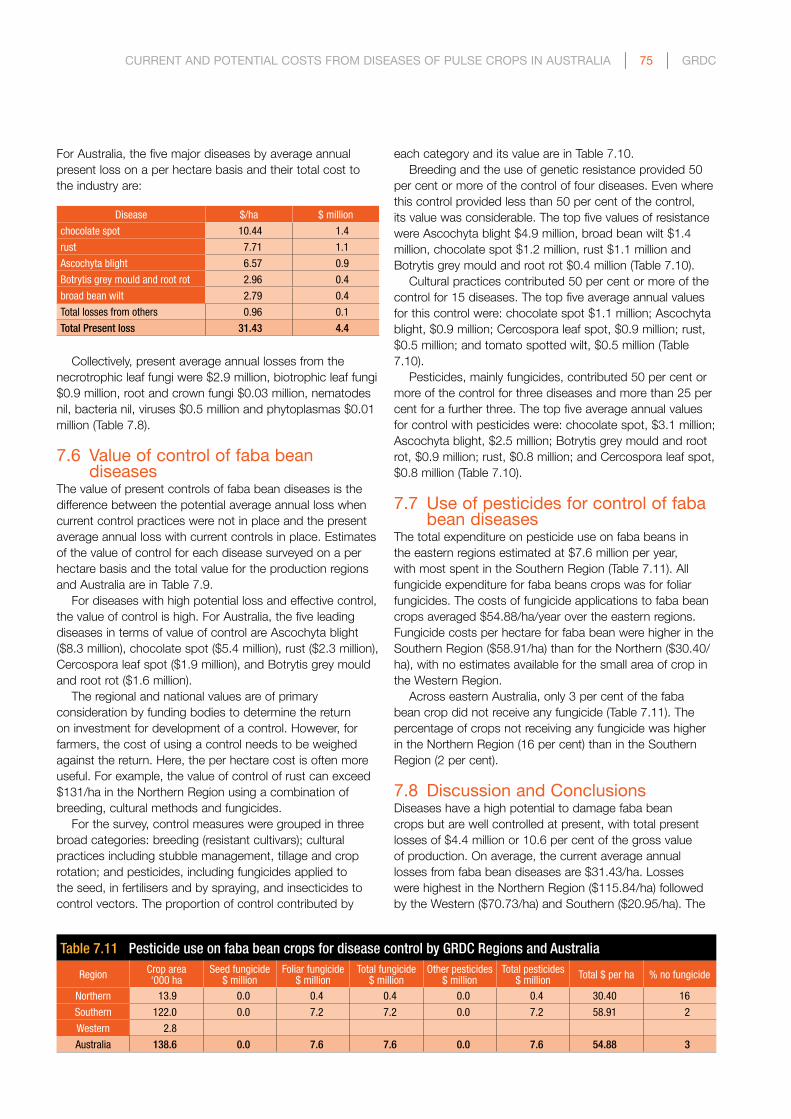
CuRRenT AnD PoTenTiAl CosTs fRoM DiseAses of Pulse CRoPs in AusTRAliA | 75 | GRDC
For Australia, the five major diseases by average annual present loss on a per hectare basis and their total cost to the industry are:
Disease $/ha $ million
chocolate spot 10.44 1.4
rust 7.71 1.1
Ascochyta blight 6.57 0.9
Botrytis grey mould and root rot 2.96 0.4
broad bean wilt 2.79 0.4
Total losses from others 0.96 0.1
Total Present loss 31.43 4.4
Collectively, present average annual losses from the necrotrophic leaf fungi were $2.9 million, biotrophic leaf fungi $0.9 million, root and crown fungi $0.03 million, nematodes nil, bacteria nil, viruses $0.5 million and phytoplasmas $0.01 million (Table 7.8).
7.6 Value of control of faba bean diseases
The value of present controls of faba bean diseases is the difference between the potential average annual loss when current control practices were not in place and the present average annual loss with current controls in place. Estimates of the value of control for each disease surveyed on a per hectare basis and the total value for the production regions and Australia are in Table 7.9.
For diseases with high potential loss and effective control, the value of control is high. For Australia, the five leading diseases in terms of value of control are Ascochyta blight ($8.3 million), chocolate spot ($5.4 million), rust ($2.3 million), Cercospora leaf spot ($1.9 million), and Botrytis grey mould and root rot ($1.6 million).
The regional and national values are of primary consideration by funding bodies to determine the return on investment for development of a control. However, for farmers, the cost of using a control needs to be weighed against the return. Here, the per hectare cost is often more useful. For example, the value of control of rust can exceed $131/ha in the Northern Region using a combination of breeding, cultural methods and fungicides.
For the survey, control measures were grouped in three broad categories: breeding (resistant cultivars); cultural practices including stubble management, tillage and crop rotation; and pesticides, including fungicides applied to the seed, in fertilisers and by spraying, and insecticides to control vectors. The proportion of control contributed by
each category and its value are in Table 7.10.Breeding and the use of genetic resistance provided 50
per cent or more of the control of four diseases. Even where this control provided less than 50 per cent of the control, its value was considerable. The top five values of resistance were Ascochyta blight $4.9 million, broad bean wilt $1.4 million, chocolate spot $1.2 million, rust $1.1 million and Botrytis grey mould and root rot $0.4 million (Table 7.10).
Cultural practices contributed 50 per cent or more of the control for 15 diseases. The top five average annual values for this control were: chocolate spot $1.1 million; Ascochyta blight, $0.9 million; Cercospora leaf spot, $0.9 million; rust, $0.5 million; and tomato spotted wilt, $0.5 million (Table 7.10).
Pesticides, mainly fungicides, contributed 50 per cent or more of the control for three diseases and more than 25 per cent for a further three. The top five average annual values for control with pesticides were: chocolate spot, $3.1 million; Ascochyta blight, $2.5 million; Botrytis grey mould and root rot, $0.9 million; rust, $0.8 million; and Cercospora leaf spot, $0.8 million (Table 7.10).
7.7 use of pesticides for control of faba bean diseases
The total expenditure on pesticide use on faba beans in the eastern regions estimated at $7.6 million per year, with most spent in the Southern Region (Table 7.11). All fungicide expenditure for faba beans crops was for foliar fungicides. The costs of fungicide applications to faba bean crops averaged $54.88/ha/year over the eastern regions. Fungicide costs per hectare for faba bean were higher in the Southern Region ($58.91/ha) than for the Northern ($30.40/ha), with no estimates available for the small area of crop in the Western Region.
Across eastern Australia, only 3 per cent of the faba bean crop did not receive any fungicide (Table 7.11). The percentage of crops not receiving any fungicide was higher in the Northern Region (16 per cent) than in the Southern Region (2 per cent).
7.8 Discussion and ConclusionsDiseases have a high potential to damage faba bean crops but are well controlled at present, with total present losses of $4.4 million or 10.6 per cent of the gross value of production. On average, the current average annual losses from faba bean diseases are $31.43/ha. Losses were highest in the Northern Region ($115.84/ha) followed by the Western ($70.73/ha) and Southern ($20.95/ha). The
Table 7.11 Pesticide use on faba bean crops for disease control by GRDC Regions and Australia
Region Crop area‘000 ha
Seed fungicide$ million
Foliar fungicide$ million
Total fungicide$ million
Other pesticides$ million
Total pesticides$ million Total $ per ha % no fungicide
Northern 13.9 0.0 0.4 0.4 0.0 0.4 30.40 16
Southern 122.0 0.0 7.2 7.2 0.0 7.2 58.91 2
Western 2.8
Australia 138.6 0.0 7.6 7.6 0.0 7.6 54.88 3

GRDC | 76 | CuRRenT AnD PoTenTiAl CosTs fRoM DiseAses of Pulse CRoPs in AusTRAliA
five major diseases of faba beans in Australia in order of potential and present losses are:
Rank By potential loss By present loss
1 Ascochyta blight chocolate spot
2 chocolate spot Ascochyta blight
3 rust rust
4 Botrytis grey mould and root rot Botrytis grey mould and root rot
5 broad bean wilt broad bean wilt
Necrotrophic fungal leaf diseases cause present losses of $2.9 million per year in chickpeas in Australia, or 67 per cent of the total loss. The losses are dominated by chocolate spot ($1.4 million) and Ascochyta blight ($1.1 million). Although the present loss remains high, it is considerably less than the potential losses of $6.9 million and $9.3 million, respectively, if the current integrated controls of resistance, crop rotation and fungicide applications were not used.
The biotrophic fungal leaf disease rust causes present average annual loss of $0.9 million or 21 per cent of the total loss. Control has reduced this loss from a potential of $3.2 million per year.
Viruses presently cause losses of $0.5 million per year, or 11 per cent of the total loss. Broad bean wilt is the main viral disease; its present loss of $0.4 million per year compares with a potential loss of $1.9 million if it not controlled.
Present losses from the root and crown fungal diseases are $0.03 million per year, or one per cent of the total present average annual loss.
The phytoplasma disease tomato big bud has a present average annual loss of $0.01 million or 0.2 per cent of the total.
Nematodes and bacterial diseases presently cause no loss. However, faba beans may host several nematodes that are damaging to other crops in the rotation. Their role in the epidemiology of these nematodes may be important.
Current control values have reduced the losses from diseases considerably. Breeding, cultural measures and pesticides are generally used in conjunction, as shown by the following diseases:
Disease Control value ($ million)
Contribution to control ($ million) byBreeding Cultural Pesticides
Ascochyta blight 8.26 4.85 0.92 2.49
chocolate spot 5.41 1.21 1.10 3.10
rust 2.33 1.09 0.45 0.78
Cercospora leaf spot 1.87 0.25 0.86 0.76
Botrytis grey mould and root rot 1.59 0.38 0.28 0.94
Foliar diseases have the potential to reduce grain quality by blemishes and reduced seed size. A limit of one per cent seed with ‘Poor Colour’ is set for Canning Grade with progressively higher tolerances for lower priced grades. There are also limits on undersized beans. Further research on the effect of faba bean diseases and the value of the harvested grain is warranted, since this is likely to have a major effect on the value of the loss and justify greater efforts at control.

CuRRenT AnD PoTenTiAl CosTs fRoM DiseAses of Pulse CRoPs in AusTRAliA | 77 | GRDC
8.1 introductionLentils (Lens culinaris) are grown in the southern winter cropping areas of Australia, preferring loam to clay soils with neutral to alkaline pH. Their main growing areas are in South Australia and western Victoria, with smaller areas in NSW and Western Australia.
Lentils are mainly grown for human consumption. Grain for human consumption has high quality standards, so blemishes and foreign material above a very low level can cause grain to be rejected for this purpose and downgraded to stockfeed with a lower value.
Most of the lentil crop is sown in late autumn to late winter depending on the location. The crop sown in May–September 2009 and harvested in November–January 2010 is identified as the 2009-10 season.
This chapter contains:n average area, production, yield and value of lentils over a
recent five-year period;n a list of the diseases of lentils that were considered;n the incidence and severity of the diseases in each
production area;n the potential and present yield loss as a percentage of
yield, effect on quality and the value of this loss;
n overall control methods and their value for each disease; and
n the present level of expenditure on fungicides on the crop.
8.2 lentil productionEstimation of the value of disease losses depends on base data on the area, yield and value of the crop. The production data for lentils are for the year 2008-09. As with other pulses, production has varied considerably over time, so the average data for the five years ending 2008-09 were calculated as representative of current production. Lentil production data were supplied by Pulse Australia.
The average area, yield, production and value of lentils in each agro-ecological zone are shown in Table 8.1 (see Appendix A for more detail). For the period 2004-05 to 2008-09, the average annual area of lentils sown in Australia was 122,200 hectares producing an average of 95,200 tonnes, with an overall average yield of 0.78t/ha.
Lentil production was entirely in the Southern Region in three agro-ecological zones: SA-Victoria Mallee, 10 per cent of area; SA-Victoria Border-Wimmera, 40 per cent; and SA Mid-North/Lower Yorke, Eyre, 50 per cent.
The mean unit value of lentils over the five-year period
8 CuRRenT AnD PoTenTiAl losses fRoM DiseAses of lenTils
Table 8.1 Mean lentil area, yield, production and value by agro-ecological zone and GRDC region 2004-05 to 2008-09Area (‘000 ha) Yield (t/ha) Production (‘000 t) Gross value ($ million)
Queensland Burdekin 0.0 0.00 0.0 0.0
Queensland Atherton 0.0 0.00 0.0 0.0
Queensland Central 0.0 0.00 0.0 0.0
NSW North-East/Queensland South-East 0.0 0.00 0.0 0.0
NSW North-West/Queensland South-West 0.0 0.00 0.0 0.0
TOTAL NORTHERN REGION 0.0 0.00 0.0 0.0
NSW Central 0.0 0.00 0.0 0.0
NSW–Victoria Slopes* 0.0 1.00 0.0 0.0
Victoria High Rainfall 0.0 0.00 0.0 0.0
SA–Victoria Mallee* 12.2 0.55 6.7 4.3
SA–Victoria Border-Wimmera* 48.9 0.55 26.7 17.3
SA Mid-North/Lower Yorke, Eyre* 61.1 1.01 61.9 40.2
Tasmania Grain Growing 0.0 0.00 0.0 0.0
TOTAL SOUTHERN REGION 122.2 0.78 95.2 61.9
WA Northern 0.0 0.00 0.0 0.0
WA Central 0.0 0.00 0.0 0.0
WA Eastern 0.0 0.00 0.0 0.0
WA Sandplain–Mallee 0.0 0.00 0.0 0.0
WA Ord 0.0 0.00 0.0 0.0
Northern Territory Central (Katherine) 0.0 0.00 0.0 0.0
TOTAL WESTERN REGION 0.0 0.00 0.0 0.0
TOTAL AUSTRALIA 122.2 0.78 95.2 61.9
* Disease data obtained for this zone

GRDC | 78 | CuRRenT AnD PoTenTiAl CosTs fRoM DiseAses of Pulse CRoPs in AusTRAliA
Table 8.2 Lentil diseases in this survey, their pathogens and their presencea in the GRDC Regions and AustraliaPathogen Disease Northern Southern Western Australia
NECROTROPHIC LEAF FUNGI
Ascochyta lentis Ascochyta blight - Y - Y
Botrytis cinerea cinerea grey mould - Y - Y
Botrytis fabae fabae grey mould - Y - Y
Stemphylium spp. Stemphylium blight - Y - Y
ROOT AND CROWN FUNGI
Botrytis cinerea cinerea seedling blight - Y - Y
Botrytis fabae fabae seedling blight - Y - Y
Pythium spp. Pythium root rot - Y - Y
Rhizoctonia solani wet root rot - Y - Y
Sclerotinia sclerotiorum Sclerotinia stem rot - Y - Y
NEMATODES
Ditylenchus dipsaci stem nematode - U - U
Pratylenchus thornei root lesion nematode thornei - P - P
VIRUSES
Alfalfa mosaic virus alfalfa mosaic - Y - Y
Bean leafroll luteovirus bean leafroll - Y - Y
Bean yellow mosaic potyvirus bean yellow mosaic - Y - Y
Beet western yellows virus beet western yellows - Y - Y
Clover yellow vein virus clover yellow vein - U - U
Cucumber mosaic virus cucumber mosaic - Y - Y
Pea seed-borne mosaic virus pea seed-borne mosaic - Y - Y
Soybean dwarf virus soybean dwarf - Y - Y
Subterranean clover stunt virus subclover stunt - U - U
Tomato spotted wilt virus tomato spotted wilt - Y - Y
a Y= present in region P = present in region but no or incomplete data on incidence and severity U = unknown status - no crop grown in region
was $650/t, giving an average gross value of production of $61.9 million per year.
8.3 Diseases of lentils8.3.1 lentil diseases and their pathogensThere were 21 diseases of lentils considered in this survey, comprising four necrotrophic leaf fungal diseases, five root and crown fungal diseases, two nematode diseases and 10 viral diseases (Table 8.2). These diseases were caused by seven fungi, two nematodes and 10 viruses. There were no biotrophic fungal leaf, bacterial and phytoplasma diseases.
Two species of Botrytis, B. cinerea and B. fabae, affect lentils causing similar ‘grey moulds’ and ‘seedling blights’: these diseases sharing the same common name are distinguished by adding ‘cinerea’ and ‘fabae’ to the common names.
Because several species of the Pratylenchus nematodes attack crops and pastures, the species name ‘thornei’ was added to the common name ‘root lesion nematode’ for clarity.
Data on disease incidence, severity and control measures were obtained for all zones in the Southern Region where lentils are grown. No data were available from the Northern and Western Regions where there was virtually no lentil production(Table 8.1). Disease information and the respondents for each zone are in Appendix B.
8.3.2 Distribution of the pathogens in AustraliaEighteen, including all the fungal diseases, of the 21 diseases surveyed were reported as present on lentils in the Southern Region and, therefore, in Australia. Eight of the viral diseases were also reported as present (Table 8.2).
Root lesion nematode thornei was present on lentils but no data on its incidence and severity were available. The status of the other nematode and two of the viral diseases on lentils was unknown. There were no biotrophic fungal leaf, bacterial or phytoplasma diseases reported.
8.4 incidence and severity of lentil diseases
8.4.1 incidence of lentil diseasesIncidence was assessed as the proportion of years that favoured development of the disease in each zone, and as the proportion of the crop area in the zone affected when the disease developed. These values were averaged for the region by weighting by the area sown to the crop in each zone for which disease data were available, and are shown in Table 8.3. Only data from zones in the Southern Region were available as no lentils are grown in the other regions at present and are the estimates for Australia.
Within the Southern Region, there were eight diseases

CuRRenT AnD PoTenTiAl CosTs fRoM DiseAses of Pulse CRoPs in AusTRAliA | 79 | GRDC
that occurred with a yearly incidence of 25 per cent or greater. Alfalfa mosaic and cucumber mosaic developed in every year followed by Ascochyta blight, cinerea and fabae grey moulds, and Stemphylium blight. In this region, five diseases occurred over 25 per cent of the crop area in years favourable for their development: cucumber mosaic occurred most widely (over 67 per cent of the area) followed by beet western yellows, Ascochyta blight and the two grey moulds.
8.4.2 severity of lentil diseasesSeverity was assessed as the percentage yield loss that occurred in affected crops in the zone in years favourable for development of the disease. Two assessments were made. The first was the potential severity, that is, the severity that would occur if current controls were not applied. The second was the present severity, when current controls are in place. These assessments were made at the zone level and aggregated to the region by weighting the average by the area of the crop in each zone (Table 8.4).
Within the Southern Region, six diseases had potential severities of 10 per cent or more in years when they developed. The highest were Ascochyta blight and the two Botrytis grey moulds with 39 per cent yield loss, followed by the two Botrytis seedling blights and cucumber mosaic.
No diseases had a present severity exceeding 10 per cent. The highest was beet western yellows (5 per cent) followed by bean leafroll, Ascochyta blight, bean yellow mosaic and the two Botrytis grey moulds.
8.5 losses from lentil diseases8.5.1 Potential and present percentage
yield lossesThe average annual yield loss was calculated from the incidence and severity data (see Section 2.5 for the method). The potential severity was used to calculate the potential losses if current controls were not used and the present severity to calculate present losses with current control measures.
In the Southern Region, only one disease, Ascochyta blight, had a potential average annual yield loss of more than 10 per cent (Table 8.5). It was followed by cucumber mosaic, the two Botrytis grey moulds and beet western yellows. With current disease controls, the present average annual yield loss was much less. Ascochyta blight was again the highest with 1.1 per cent average annual yield loss followed by beet western yellows and the two Botrytis grey moulds.
Total present average annual yield loss from all diseases was 3.1 per cent. Necrotrophic leaf fungal diseases totalled
Table 8.3 Incidence of lentil diseases as a proportion of years when disease occurs (%) and as a proportion of the crop area affected when the disease develops (per cent) in the GRDC Regions and Australia
DiseaseNorthern Southern Western Australia
Years Area Years Area Years Area Years Area
NECROTROPHIC LEAF FUNGI
Ascochyta blight - - 91.5 49.5 - - 91.5 49.5
cinerea grey mould - - 33.7 40.0 - - 33.7 40.0
fabae grey mould - - 33.7 40.0 - - 33.7 40.0
Stemphylium blight - - 25.0 19.0 - - 25.0 19.0
ROOT AND CROWN FUNGI
cinerea seedling blight - - 22.0 20.9 - - 22.0 20.9
fabae seedling blight - - 22.0 20.9 - - 22.0 20.9
Pythium root rot - - 5.2 2.8 - - 5.2 2.8
wet root rot - - 5.2 2.8 - - 5.2 2.8
Sclerotinia stem rot - - 5.0 2.8 - - 5.0 2.8
NEMATODES
stem nematode - - - - - - - -
root lesion nematode thornei - - - - - - - -
VIRUSES
alfalfa mosaic - - 100.0 19.0 - - 100.0 19.0
bean leafroll - - 30.0 13.5 - - 30.0 13.5
bean yellow mosaic - - 24.0 7.0 - - 24.0 7.0
beet western yellows - - 30.0 55.5 - - 30.0 55.5
clover yellow vein - - - - - - - -
cucumber mosaic - - 100.0 67.5 - - 100.0 67.5
pea seed-borne mosaic - - 24.0 7.0 - - 24.0 7.0
soybean dwarf - - 5.0 0.0 - - 5.0 0.0
subclover stunt - - - - - - - -
tomato spotted wilt - - 5.0 0.0 - - 5.0 0.0
- no crop grown or no data available

GRDC | 80 | CuRRenT AnD PoTenTiAl CosTs fRoM DiseAses of Pulse CRoPs in AusTRAliA
Table 8.4 Potential and present severity of lentil diseases (% yield loss in years suitable for disease development) in the GRDC Regions and Australia
DiseaseNorthern Southern Western Australia
Potential Present Potential Present Potential Present Potential Present
NECROTROPHIC LEAF FUNGI
Ascochyta blight - - 39.0 2.4 - - 39.0 2.4
cinerea grey mould - - 39.0 1.7 - - 39.0 1.7
fabae grey mould - - 39.0 1.7 - - 39.0 1.7
Stemphylium blight - - 5.0 0.0 - - 5.0 0.0
ROOT AND CROWN FUNGI
cinerea seedling blight - - 22.5 0.0 - - 22.5 0.0
fabae seedling blight - - 22.5 0.0 - - 22.5 0.0
Pythium root rot - - 2.5 0.0 - - 2.5 0.0
wet root rot - - 2.5 0.0 - - 2.5 0.0
Sclerotinia stem rot - - 2.5 0.0 - - 2.5 0.0
NEMATODES
stem nematode - - - - - - - -
root lesion nematode thornei - - - - - - - -
VIRUSES
alfalfa mosaic - - 3.8 0.3 - - 3.8 0.3
bean leafroll - - 5.0 3.6 - - 5.0 3.6
bean yellow mosaic - - 3.5 2.1 - - 3.5 2.1
beet western yellows - - 8.5 5.0 - - 8.5 5.0
clover yellow vein - - - - - - - -
cucumber mosaic - - 10.8 0.3 - - 10.8 0.3
pea seed-borne mosaic - - 3.5 0.0 - - 3.5 0.0
soybean dwarf - - 0.0 0.0 - - 0.0 0.0
subclover stunt - - - - - - - -
tomato spotted wilt - - 0.0 0.0 - - 0.0 0.0
- no crop grown or no data available
1.9 per cent, viruses 1.2 per cent loss and root and crown fungi, nematodes, bacteria and phytoplasmas nil.
8.5.2 Quality effects of diseases on lentilsThe Australian Pulse Trading Standards set limits to the proportion of lentil grain with “Poor seed coat colour” and “Poor kernel colour” and has limits for smaller seeds. If these are exceeded, the grain will be downgraded progressively from No.1 to No. 2 grade, or not be acceptable for human consumption. Ascochyta blight can cause a brown patchy appearance on infected lentil seed that will downgrade seed quality. The grey moulds can also infect seed leading to discolouration and shrivelling, again causing downgrading of quality. These diseases along with the virus diseases can reduce seed size, which can also affect grain quality.
The two diseases identified as causing quality losses in lentils are Ascochyta blight and cinerea grey mould, with all those losses occurring in the Southern Region (Table 8.6). Both diseases have the potential to cause considerable losses, but average present losses are relatively small.
8.5.3 Value of losses from lentil diseasesThe value of these yield losses was calculated by relating the percentage losses to the gross value of lentil production in each zone, using the average value of lentils, over a five-year period (see Section 8.2). These losses were calculated for the Southern Region on a per hectare basis and on an aggregate basis for each zone and then for the region. As the crop is entirely in the Southern Region at present, these loss estimates are also the estimates for Australia.
The potential losses estimated for each disease are in Table 8.7 ($ per hectare) and Table 8.8 (aggregate losses). For the Southern Region and Australia, the five major diseases by potential loss on a per hectare basis and their total cost to the industry are:
Disease $/ha $ million
Ascochyta blight 132.74 16.2
cinerea grey mould 130.72 16.0
cucumber mosaic 53.72 6.6
fabae grey mould 49.89 6.1
beet western yellows 8.82 1.1

CuRRenT AnD PoTenTiAl CosTs fRoM DiseAses of Pulse CRoPs in AusTRAliA | 81 | GRDC
Table 8.5 Potential and present average annual yield losses (%) from lentil diseases by GRDC Regions and Australia
DiseaseNorthern Southern Western Australia
Potential Present Potential Present Potential Present Potential Present
NECROTROPHIC LEAF FUNGI
Ascochyta blight - - 20.6 1.1 - - 20.6 1.1
cinerea grey mould - - 7.9 0.4 - - 7.9 0.4
fabae grey mould - - 7.9 0.4 - - 7.9 0.4
Stemphylium blight - - 0.3 0.0 - - 0.3 0.0
SUB TOTAL 1.9 1.9
ROOT AND CROWN FUNGI
cinerea seedling blight - - 1.2 0.0 - - 1.2 0.0
fabae seedling blight - - 1.2 0.0 - - 1.2 0.0
Pythium root rot - - 0.0 0.0 - - 0.0 0.0
wet root rot - - 0.0 0.0 - - 0.0 0.0
Sclerotinia stem rot - - 0.0 0.0 - - 0.0 0.0
SUB TOTAL 0.0 0.0
NEMATODES
stem nematode - - - - - - - -
root lesion nematode thornei - - - - - - - -
SUB TOTAL 0.0 0.0
VIRUSES
alfalfa mosaic - - 0.8 0.0 - - 0.8 0.0
bean leafroll - - 0.2 0.1 - - 0.2 0.1
bean yellow mosaic - - 0.1 0.1 - - 0.1 0.1
beet western yellows - - 1.5 0.8 - - 1.5 0.8
clover yellow vein - - - - - - - -
cucumber mosaic - - 8.7 0.1 - - 8.7 0.1
pea seed-borne mosaic - - 0.1 0.0 - - 0.1 0.0
soybean dwarf - - 0.0 0.0 - - 0.0 0.0
subclover stunt - - - - - - - -
tomato spotted wilt - - 0.0 0.0 - - 0.0 0.0
SUB TOTAL 1.2 1.2
TOTAL 3.1 3.1
- no crop grown or no data available
Table 8.6 Potential and present average annual quality losses from lentil diseases by GRDC Regions and Australia
Quality lossesNorthern Southern Western Australia
Potential Present Potential Present Potential Present Potential Present
$/ha
Ascochyta blight 12.28 0.71 12.28 0.71
cinerea grey mould 80.83 3.55 80.83 3.55
4.25 4.25
$ million
Ascochyta blight 1.50 0.09 1.50 0.09
cinerea grey mould 9.88 0.43 9.88 0.43
0.52 0.00 0.52

GRDC | 82 | CuRRenT AnD PoTenTiAl CosTs fRoM DiseAses of Pulse CRoPs in AusTRAliA
The present losses estimated for each disease are in Table 8.7 ($ per hectare) and Table 8.8 (aggregate losses). For the Southern Region, the five major diseases by average annual present loss on a per hectare basis and their total cost to the industry are:
Disease $/ha $ million
Ascochyta blight 7.15 0.9
cinerea grey mould 5.99 0.7
beet western yellows 4.66 0.6
fabae grey mould 2.45 0.3
bean leaf roll 0.71 0.1
Total losses from others 0.81 0.1
Total Present loss 21.76 2.7
Collectively, present average annual losses from the necrotrophic leaf fungi were $1.9 million and viral diseases $0.8 million, with no losses from the other groups of diseases.
8.6 Value of control of lentil diseasesThe value of present controls of lentil diseases is the difference between the potential average annual loss when current control practices were not in place and the present average annual loss with current controls in place. Estimates of the value of control for each disease surveyed on a per hectare basis and the total value for the region and Australia are in Table 8.9. As before, estimates were made for the Southern Region, which are also the Australian values.
For diseases with high potential loss and effective control, the value of control is high. The four leading diseases in terms of value of control are Ascochyta blight ($15.3 million), cinerea grey mould ($15.2 million), cucumber mosaic ($6.5 million) and fabae grey mould ($5.8 million).
The regional and national values are of primary consideration by funding bodies to judge the return on investment for development of a control. However, for farmers, the cost of using a control needs to be weighed against the return. Here, the per hectare cost is often more
Table 8.7 Potential and present average annual costs ($/ha) from lentil diseases by GRDC Regions and Australia
DiseaseNorthern Southern Western Australia
Potential Present Potential Present Potential Present Potential Present
NECROTROPHIC LEAF FUNGI
Ascochyta blight - - 132.74 7.15 - - 132.74 7.15
cinerea grey mould - - 130.72 5.99 - - 130.72 5.99
fabae grey mould - - 49.89 2.45 - - 49.89 2.45
Stemphylium blight - - 1.54 0.00 - - 1.54 0.00
SUB TOTAL - 15.59 15.59
ROOT AND CROWN FUNGI
cinerea seedling blight - - 7.01 0.00 - - 7.01 0.00
fabae seedling blight - - 7.01 0.00 - - 7.01 0.00
Pythium root rot - - 0.04 0.00 - - 0.04 0.00
wet root rot - - 0.04 0.00 - - 0.04 0.00
Sclerotinia stem rot - - 0.04 0.00 - - 0.04 0.00
SUB TOTAL - 0.00 0.00
NEMATODES
stem nematode - - - - - - - -
root lesion nematode thornei - - - - - - - -
SUB TOTAL - 0.00 0.00
VIRUSES
alfalfa mosaic - - 4.77 0.12 - - 4.77 0.12
bean leafroll - - 1.06 0.71 - - 1.06 0.71
bean yellow mosaic - - 0.55 0.33 - - 0.55 0.33
beet western yellows - - 8.82 4.66 - - 8.82 4.66
clover yellow vein - - - - - - - -
cucumber mosaic - - 53.72 0.35 - - 53.72 0.35
pea seed-borne mosaic - - 0.55 0.00 - - 0.55 0.00
soybean dwarf - - 0.00 0.00 - - 0.00 0.00
subclover stunt - - - - - - - -
tomato spotted wilt - - 0.00 0.00 - - 0.00 0.00
SUB TOTAL - 6.18 6.18
TOTAL 21.76 21.76
- no crop grown or no data available

CuRRenT AnD PoTenTiAl CosTs fRoM DiseAses of Pulse CRoPs in AusTRAliA | 83 | GRDC
useful. The foliar diseases can be controlled with fungicide sprays. The current average value of control is $126/ha for Ascochyta blight so that a fungicide control program is beneficial on crops with good yield potential, particularly as these fungicides also control grey mould.
For the survey, control measures were grouped in three broad categories: breeding (resistant cultivars); cultural practices including stubble management, tillage and crop rotation; and pesticides, including fungicides applied to the seed, in fertilisers and by spraying, and insecticides to control vectors. The proportion of control contributed by each category and its value are in Table 8.10.
Integrated control, where more than one category contributed more than 10 per cent of the control, was frequent. The three control groups were used for Ascochyta blight while the use of resistance (breeding) was combined with pesticides for three diseases and cultural methods and pesticides were used for six diseases.
Breeding and the use of genetic resistance provided more than 50 per cent of the control of Ascochyta blight and more than 40 per cent for cinerea grey mould and fabae grey mould, worth $7.9 million, $6.3 million and $2.6 million per annum, respectively (Table 8.10). Breeding was not used as a control for any of the other diseases.
Cultural practices contributed 50 per cent or more of the control for nine diseases. The top five average annual values for this control were: cucumber mosaic, $6.5 million; Ascochyta blight, $1.5 million; cinerea grey mould, $1.1 million; and alfalfa mosaic, $0.6 million (Table 8.10).
Pesticides, mainly fungicides and insecticides, contributed 50 per cent or more of the control for eight diseases and more than 25 per cent for a further three. The top five average annual values for control with pesticides were: cinerea grey mould, $7.9 million; Ascochyta blight, $6.0 million; fabae grey mould, $2.9 million; and the two grey mould seedling blights, $0.8 million each (Table 8.10).
Table 8.8 Aggregate potential and present average annual costs ($ million) from lentil diseases by GRDC Regions and Australia
DiseaseNorthern Southern Western Australia
Potential Present Potential Present Potential Present Potential Present
NECROTROPHIC LEAF FUNGI
Ascochyta blight - - 16.2 0.9 - - 16.2 0.9
cinerea grey mould - - 16.0 0.7 - - 16.0 0.7
fabae grey mould - - 6.1 0.3 - - 6.1 0.3
Stemphylium blight - - 0.2 0.0 - - 0.2 0.0
SUB TOTAL 1.9 1.9
ROOT AND CROWN FUNGI
cinerea seedling blight - - 0.9 0.0 - - 0.9 0.0
fabae seedling blight - - 0.9 0.0 - - 0.9 0.0
Pythium root rot - - 0.0 0.0 - - 0.0 0.0
wet root rot - - 0.0 0.0 - - 0.0 0.0
Sclerotinia stem rot - - 0.0 0.0 - - 0.0 0.0
SUB TOTAL 0.0 0.0
NEMATODES
stem nematode - - - - - - - -
root lesion nematode thornei - - - - - - - -
SUB TOTAL 0.0 0.0
VIRUSES
alfalfa mosaic - - 0.6 0.0 - - 0.6 0.0
bean leafroll - - 0.1 0.1 - - 0.1 0.1
bean yellow mosaic - - 0.1 0.0 - - 0.1 0.0
beet western yellows - - 1.1 0.6 - - 1.1 0.6
clover yellow vein - - - - - - - -
cucumber mosaic - - 6.6 0.0 - - 6.6 0.0
pea seed-borne mosaic - - 0.1 0.0 - - 0.1 0.0
soybean dwarf - - 0.0 0.0 - - 0.0 0.0
subclover stunt - - - - - - - -
tomato spotted wilt - - 0.0 0.0 - - 0.0 0.0
SUB TOTAL 0.8 0.8
TOTAL 2.7 2.7
- no crop grown or no data available

GRDC | 84 | CuRRenT AnD PoTenTiAl CosTs fRoM DiseAses of Pulse CRoPs in AusTRAliA
8.7 use of pesticides for control of lentil diseases
Estimates of pesticide use on lentils were made for the Southern Region where the entire Australian lentil crop is grown. The total expenditure on pesticide use on this crop is estimated at $13.9 million per year. The main pesticide expenditure was for foliar fungicides ($11.9 million), with $2.2 million spent on seed treatment. The costs of fungicide applications to lentil crops averaged $114.15/ha/year across Australia. Only 3 per cent of the lentil crop did not receive any fungicide (Table 8.11).
8.8 Discussion and ConclusionsDiseases have a high potential to damage lentil crops but are well controlled at present, with total present losses of $2.7 million or 4.3 per cent of the gross value of production. On average, the current average annual losses from lentil diseases are $21.76/ha. The five major diseases of lentils in the Southern Region in order of potential and present losses are:
Rank By potential loss By present loss
1 Ascochyta blight Ascochyta blight
2 cinerea grey mould cinerea grey mould
3 cucumber mosaic beet western yellows
4 fabae grey mould fabae grey mould
5 beet western yellows bean leaf roll
Necrotrophic fungal leaf diseases cause present losses of $1.9 million per year in lentils in Australia, or 72 per cent of the total loss. The losses are dominated by Ascochyta blight and cinerea grey mould. Although their present losses remain significant, they are considerably less than the potential losses of $15.3 million and $15.2 million, respectively, if the current integrated controls of resistance and fungicide applications were not used.
Viruses presently cause losses of $0.8 million per year, or 28 per cent of the total loss. Beet western yellows is the main viral disease; its present loss of $0.6 million per year compares with a potential loss of $1.1 million if it were not controlled by cultural methods and pesticides.
Table 8.9 Value of current disease control practices in lentils per hectare by GRDC Region and Australia
DiseasePer hectare ($) Total ($ million)
Northern Southern Western Australia Northern Southern Western Australia
NECROTROPHIC LEAF FUNGI
Ascochyta blight - 125.59 - 125.59 - 15.3 - 15.3
cinerea grey mould 124.73 - 124.73 - 15.2 - 15.2
fabae grey mould - 47.45 - 47.45 - 5.8 - 5.8
Stemphylium blight - 1.54 - 1.54 - 0.2 - 0.2
ROOT AND CROWN FUNGI
cinerea seedling blight - 7.01 - 7.01 - 0.9 - 0.9
fabae seedling blight - 7.01 - 7.01 - 0.9 - 0.9
Pythium root rot - 0.04 - 0.04 - 0.0 - 0.0
wet root rot - 0.04 - 0.04 - 0.0 - 0.0
Sclerotinia stem rot - 0.04 - 0.04 - 0.0 - 0.0
NEMATODES
stem nematode - - - - - - - -
root lesion nematode thornei - - - - - - - -
VIRUSES
alfalfa mosaic - 4.65 - 4.65 - 0.6 - 0.6
bean leafroll - 0.35 - 0.35 - 0.0 - 0.0
bean yellow mosaic - 0.22 - 0.22 - 0.0 - 0.0
beet western yellows - 4.16 - 4.16 - 0.5 - 0.5
clover yellow vein - - - - - - - -
cucumber mosaic - 53.37 - 53.37 - 6.5 - 6.5
pea seed-borne mosaic - 0.55 - 0.55 - 0.1 - 0.1
soybean dwarf - 0.00 - 0.00 - 0.0 - 0.0
subclover stunt - - - - - - - -
tomato spotted wilt - 0.00 - 0.00 - 0.0 - 0.0
- no crop grown or no data available

CuRRenT AnD PoTenTiAl CosTs fRoM DiseAses of Pulse CRoPs in AusTRAliA | 85 | GRDC
Table 8.10 Value of different forms of faba bean disease control in Australia
DiseaseCost/value ($ million) Contribution (per cent) Contribution ($ million)
Potential Present Control Breeding Cultural Pesticide Breeding Cultural Pesticide
NECROTROPHIC LEAF FUNGI
Ascochyta blight 16.2 0.9 15.3 51 10 39 7.9 1.5 6.0
cinerea grey mould 16.0 0.7 15.2 41 7 52 6.3 1.1 7.9
fabae grey mould 6.1 0.3 5.8 44 5 50 2.6 0.3 2.9
Stemphylium blight 0.2 0.0 0.2 0 1 99 0.0 0.0 0.2
ROOT AND CROWN FUNGI
cinerea seedling blight 0.9 0.0 0.9 0 1 99 0.0 0.0 0.8
fabae seedling blight 0.9 0.0 0.9 0 1 99 0.0 0.0 0.8
Pythium root rot 0.0 0.0 0.0 0 60 40 0.0 0.0 0.0
wet root rot 0.0 0.0 0.0 0 60 40 0.0 0.0 0.0
Sclerotinia stem rot 0.0 0.0 0.0 0 76 24 0.0 0.0 0.0
NEMATODES
stem nematode - - - - - -
root lesion nematode thornei - - - - - -
VIRUSES
alfalfa mosaic 0.6 0.0 0.6 0 100 0 0.0 0.6 0.0
bean leafroll 0.1 0.1 0.0 0 50 50 0.0 0.0 0.0
bean yellow mosaic 0.1 0.0 0.0 0 50 50 0.0 0.0 0.0
beet western yellows 1.1 0.6 0.5 0 50 50 0.0 0.3 0.3
clover yellow vein - - - - - -
cucumber mosaic 6.6 0.0 6.5 0 100 0 0.0 6.5 0.0
pea seed-borne mosaic 0.1 0.0 0.1 0 100 0 0.0 0.1 0.0
soybean dwarf 0.0 0.0 0.0 0.0 0.0 0.0
subclover stunt - - - - - -
tomato spotted wilt 0.0 0.0 0.0 0.0 0.0 0.0
- no data available
Table 8.11 Pesticide use on faba bean crops for disease control, by GRDC Regions and Australia
Region Crop area‘000 ha
Seed fungicide$ million
Foliar fungicide$ million
Total fungicide$ million
Other pesticides$ million
Total pesticides$ million Total $ per ha % no fungicide
Northern 0.0 - - - - - - -
Southern 122.2 2.2 11.9 14.1 0.0 13.9 114.15 3
Western 0.0 - - - - - - -
Australia 122.2 2.2 11.9 14.1 0.0 13.9 114.15 3
- Not applicable because no crop grown in the region

GRDC | 86 | CuRRenT AnD PoTenTiAl CosTs fRoM DiseAses of Pulse CRoPs in AusTRAliA
There are no current losses reported for nematode, bacterial and phytoplasma diseases. The role of nematodes on lentil health has not been studied in detail. It is possible that there is unrecognised damage and that lentils may be an alternative host for nematodes that cause little damage on this crop but could damage subsequent crops in the rotation.
Thus, current control values have reduced the losses from diseases considerably. Breeding, cultural measures and pesticides are generally used in conjunction, as shown by the following diseases:
Disease Control value ($ million)
Contribution to control ($ million) byBreeding Cultural Pesticides
Ascochyta blight 15.35 7.85 1.53 5.96
cinerea grey mould 15.24 6.27 1.11 7.85
cucumber mosaic 6.52 0.00 6.52 0.00
fabae grey mould 5.80 2.57 0.31 2.91
The foliar and viral diseases have the potential to reduce grain quality by blemishes and reduced seed size, and can downgrade the grain and have a greater effect on the value of loss than was estimated in this report. Further research on the effect of lentil diseases and the value of the harvested grain is warranted, since this is likely to have a major effect on the value of the loss and justify greater efforts at control.
Disease incidence and severity was only assessed in the Southern Region, as the lentil area and harvest is nil in the Northern and Western regions at present. However, if the crop were to expand in these regions, the assessment of disease potential incidence and severity is warranted. The effects of wheat and barley diseases differed considerably between agro-ecological zones around Australia (Murray and Brennan 2009a, b), so it is likely that diseases of lentils will also similarly vary between zones and regions.

CuRRenT AnD PoTenTiAl CosTs fRoM DiseAses of Pulse CRoPs in AusTRAliA | 87 | GRDC
9.1 introductionCommon vetch (Vicia sativa), purple vetch (Vicia benghalensis) and woolly-pod vetch (Vicia vollosa) are grown in the winter cropping areas of Australia principally in the GRDC Southern Region. The crop is sown in autumn and harvested in late spring, with the seed used for stockfeed.
This section contains:n average area, production, yield and value of vetches over
a recent five-year period;n a list of the diseases of vetch that were considered;n the incidence and severity of the diseases in each
production area;n the potential and present yield loss as a percentage of
yield, effect on quality and the value of this loss;n overall control methods and their value for each disease;
andn the present level of expenditure on fungicides on the crop.
9.2 Vetch productionEstimation of the value of disease losses depends on base data on the area, yield and value of the crop. The production data for vetch are for the year 2008-09. The average data
for the five years ending in that year were calculated as representative of current production. Vetch production data were obtained from the Australian Bureau of Statistics.
The average area, yield, production and value of vetch in each agro-ecological zone are shown in Table 9.1 (see Appendix A for more detail). For the period 2004-05 to 2008-09, the average annual area of vetch sown in Australia was 42,200 hectares producing an average of 15,600 tonnes, with an overall average yield of 0.37t/ha.
The mean unit value of vetch over the five-year period was $302/t, giving an average gross value of production of $4.7 million per year.
Vetch production was almost entirely in the Southern Region, with almost all of the area in three agro-ecological zones: SA-Victoria Mallee, 41 per cent of the area; SA-Victoria Border–Wimmera, 33 per cent; and SA Mid-North/Lower Yorke Eyre, 24 per cent.
Because the crop is limited to the Southern Region at present, data on incidence and severity, and estimates for losses, are for this region and provide the Australian estimates.
9 CuRRenT AnD PoTenTiAl losses fRoM DiseAses of VeTCh
Table 9.1 Mean vetch area, yield, production and value by agro-ecological zone and GRDC region, 2004-05 to 2008-09Area (‘000 ha) Yield (t/ha) Production (‘000 t) Gross value ($million)
Queensland Burdekin 0.0 0.00 0.0 0.0
Queensland Atherton 0.0 0.00 0.0 0.0
Queensland Central 0.0 0.00 0.0 0.0
NSW North-East/Queensland South-East 0.0 0.00 0.0 0.0
NSW North-West/Queensland South-West 0.0 0.00 0.0 0.0
TOTAL NORTHERN REGION 0.0 0.00 0.0 0.0
NSW Central 0.0 0.00 0.0 0.0
NSW–Victoria Slopes 0.2 0.04 0.0 0.0
Victoria High Rainfall 0.5 0.18 0.1 0.0
SA–Victoria Mallee* 17.3 0.23 4.0 1.2
SA–Victoria Border–Wimmera* 14.1 0.39 5.4 1.6
SA Mid-North/Lower Yorke, Eyre* 10.3 0.59 6.1 1.8
Tasmania Grain Growing 0.0 0.00 0.0 0.0
TOTAL SOUTHERN REGION 42.2 0.37 15.6 4.7
WA Northern 0.0 0.00 0.0 0.0
WA Central 0.0 0.00 0.0 0.0
WA Eastern 0.0 0.00 0.0 0.0
WA Sandplain–Mallee 0.0 1.00 0.0 0.0
WA Ord 0.0 0.00 0.0 0.0
Northern Territory Central (Katherine) 0.0 0.00 0.0 0.0
TOTAL WESTERN REGION 0.0 1.00 0.0 0.0
TOTAL AUSTRALIA 42.2 0.37 15.6 4.7
* Disease data obtained for this zone

GRDC | 88 | CuRRenT AnD PoTenTiAl CosTs fRoM DiseAses of Pulse CRoPs in AusTRAliA
9.3 Diseases of vetch9.3.1 Vetch diseases and their pathogensThere were 23 diseases of vetch considered in this survey, comprising six necrotrophic leaf fungal diseases, two biotrophic leaf diseases, three root and crown fungal diseases, three nematode diseases, one bacterial disease, and eight viral diseases (Table 9.2). These diseases were caused by 11 fungi, three nematodes, one bacterium and eight viruses. There were no phytoplasma diseases.
Because several species of the Pratylenchus nematodes attack crops and pastures, the species name “neglectus” was added to the common name “root lesion nematode” for clarity.
Data on disease incidence, severity and control measures were obtained for three of the five zones in the Southern Region where vetches are grown (covering over 98 per cent of the vetch area in the region). No data were available from the Northern and Western Regions where there was no vetch production (Table 9.1). Disease information and the respondents for each zone are in Appendix B.
9.3.2 Distribution of the pathogens in AustraliaSeven of the 23 diseases were reported as present on vetch in the Southern Region: four of the six necrotrophic leaf fungal diseases, both biotrophic leaf diseases and one of the three root and crown fungal diseases. The status of the nematode, bacterial and virus diseases is unknown.
Table 9.2 Vetch diseases in this survey, their pathogens and their presencea in the GRDC Regions and AustraliaPathogen Disease Northern Southern Western Australia
NECROTROPHIC LEAF FUNGI
Ascochyta pisi f.sp. viciae Ascochyta blight - Y - Y
Botrytis cinerea chocolate spot (cinerea) - Y - Y
Botrytis fabae chocolate spot (fabae) - Y - Y
Colletotrichum sp. anthracnose - U - U
Phoma medicaginis var. pinodella Phoma spot - Y - Y
Septoria sp. Septoria blight - U - U
BIOTROPHIC LEAF FUNGI
Peronospora viciae downy mildew - Y - Y
Uromyces viciae rust - Y - Y
ROOT AND CROWN FUNGI
Aphanomyces sp. Aphanomyces root rot - U - U
Rhizoctonia sp. Rhizoctonia root rot - Y - Y
Sclerotinia sclerotiorum Sclerotinia stem rot - U - U
NEMATODES
Ditylenchus dipsaci stem nematode - U - U
Meloidogyne sp. root knot nematode - U - U
Pratylenchus neglectus root lesion nematode neglectus - U - U
BACTERIA
Pseudomonas andropogonis bacterial blight - U - U
VIRUSES
Alfalfa mosaic virus alfalfa mosaic - U - U
Bean leafroll luteovirus bean leafroll - U - U
Bean yellow mosaic potyvirus bean yellow mosaic - U - U
Clover yellow vein virus clover yellow vein - U - U
Cucumber mosaic virus cucumber mosaic - U - U
Pea seed-borne mosaic virus pea seed-borne mosaic - U - U
Subterranean clover red leaf virus subterranean clover red leaf - U - U
Tomato spotted wilt virus tomato spotted wilt - U - U
a Y= present in region U = unknown status - no crop grown

CuRRenT AnD PoTenTiAl CosTs fRoM DiseAses of Pulse CRoPs in AusTRAliA | 89 | GRDC
9.4 incidence and severity of vetch diseases
9.4.1 incidence of vetch diseasesIncidence was assessed as the proportion of years that favoured development of the disease in each zone, and as the proportion of the crop area in the zone affected when the disease developed. These values were averaged for the region by weighting by the area sown to the crop in each zone for which disease data were available, and are shown in Table 9.3. As all production was in the Southern Region, these values are the estimates for Australia.
Within the Southern Region, there were four diseases that occurred with a yearly incidence of 25 per cent or greater. Ascochyta blight occurred in 75 per cent of years followed by cinerea and fabae chocolate spots, Phoma spot and Rhizoctonia root rot. Four diseases occurred over 25 per cent of the crop area in years favourable for their development: Ascochyta blight occurred most widely (71 per
cent of the area) followed by cinerea and fabae chocolate spots, Phoma spot and Rhizoctonia root rot.
9.4.2 severity of vetch diseasesSeverity was assessed as the percentage yield loss that occurred in affected crops in the zone in years favourable for development of the disease. Two assessments were made. The first was the potential severity, that is, the severity that would occur if current controls were not applied. The second was the present severity, when current controls are in place. These assessments were made at the zone level and aggregated to the region by weighting as in 9.4.1 (Table 9.4).
In the Southern Region, three diseases have potential yield losses of more than 10 per cent in years when they developed. Fabae chocolate spot has the highest with 33 per cent yield loss followed by cinerea chocolate spot, Ascochyta blight and Phoma spot. No diseases have a present severity of more than 10 per cent yield loss. The
Table 9.3 Incidence of vetch diseases as a proportion of years when disease occurs (%) and as a proportion of the crop area affected when the disease develops (%) in the GRDC Regions and Australia
DiseaseNorthern Southern Western Australia
Years Area Years Area Years Area Years Area
NECROTROPHIC LEAF FUNGI
Ascochyta blight - - 74.6 70.8 - - 74.6 70.8
chocolate spot (cinerea) - - 30.0 62.1 - - 30.0 62.1
chocolate spot (fabae) - - 30.0 63.8 - - 30.0 63.8
anthracnose - - - - - - - -
Phoma spot - - 27.7 30.0 - - 27.7 30.0
Septoria blight - - - - - - - -
BIOTROPHIC LEAF FUNGI
downy mildew - - 0.0 0.0 - - 0.0 0.0
rust - - 0.0 0.0 - - 0.0 0.0
ROOT AND CROWN FUNGI
Aphanomyces root rot - - - - - - - -
Rhizoctonia root rot - - 10.0 10.0 - - 10.0 10.0
Sclerotinia stem rot - - - - - - - -
NEMATODES
stem nematode - - - - - - - -
root knot nematode - - - - - - - -
root lesion nematode neglectus - - - - - - - -
BACTERIA
bacterial blight - - - - - - - -
VIRUSES
alfalfa mosaic - - - - - - - -
bean leafroll - - - - - - - -
bean yellow mosaic - - - - - - - -
clover yellow vein - - - - - - - -
cucumber mosaic - - - - - - - -
pea seed-borne mosaic - - - - - - - -
subterranean clover red leaf - - - - - - - -
tomato spotted wilt - - - - - - - -
subclover stunt - - - - - - - -
tomato spotted wilt - - - - - - - -
- no crop grown or no data available

GRDC | 90 | CuRRenT AnD PoTenTiAl CosTs fRoM DiseAses of Pulse CRoPs in AusTRAliA
highest is Phoma spot with 4 per cent, followed by fabae chocolate spot and Rhizoctonia root rot.
9.5 losses from vetch diseases9.5.1 Potential and present percentage
yield lossesThe average annual yield loss was calculated from the incidence and severity data (see Section 2.5 for the method). The potential severity was used to calculate the potential losses if current controls were not used and the present severity to calculate present losses with current control measures.
In the Southern Region, one disease, Ascochyta blight, had a potential average annual yield loss of more than 10 per cent followed by fabae chocolate spot, cinerea chocolate spot, rust and Phoma spot. With current disease controls, no disease had an average annual yield loss exceeding one per cent. The highest was Phoma spot followed by fabae chocolate spot (Table 9.5).
For the Southern Region and Australia, the total present average annual yield loss from all diseases was 0.7 per
cent, caused entirely by the necrotrophic leaf fungal diseases. Losses from the other disease groups were nil.
9.5.2 Quality effects of diseases on vetchVetch is grown for stockfeed. “Farmer dressed” and ‘Export Standard’ vetch must have less than one per cent ‘poor colour’. Thus, diseases that discolour the seed, such as the necrotrophic leaf fungal diseases, can reduce grain quality and value. However, no diseases were identified as causing present quality losses in vetch.
9.5.3 Value of losses from vetch diseasesThe value of these yield losses was calculated by relating the percentage losses to the gross value of vetch production in each zone, using the average value of vetch, over a five-year period (see Section 9.2). These losses were calculated on a per hectare basis and on an aggregate basis for each zone, then for each GRDC region and nationally.
The potential losses estimated for each disease are in Table 9.6 ($ per hectare) and Table 9.7 (aggregate losses).
Table 9.4 Potential and present severity of vetch diseases (% yield loss in years suitable for disease development) in the GRDC Regions and Australia
DiseaseNorthern Southern Western Australia
Potential Present Potential Present Potential Present Potential Present
NECROTROPHIC LEAF FUNGI
Ascochyta blight 25.8 0.0 - - 25.8 0.0
chocolate spot (cinerea) 27.3 0.0 - - 27.3 0.0
chocolate spot (fabae) 33.1 1.9 - - 33.1 1.9
anthracnose - - - - - -
Phoma spot 7.5 4.3 - - 7.5 4.3
Septoria blight - - - - - -
BIOTROPHIC LEAF FUNGI
downy mildew 0.0 0.0 - - 0.0 0.0
rust 0.0 0.0 - - 0.0 0.0
ROOT AND CROWN FUNGI
Aphanomyces root rot - - - - - -
Rhizoctonia root rot 5.0 0.8 - - 5.0 0.8
Sclerotinia stem rot - - - - - -
NEMATODES
stem nematode - - - - - -
root knot nematode - - - - - -
root lesion nematode neglectus - - - - - -
BACTERIA
bacterial blight - - - - - -
VIRUSES
alfalfa mosaic - - - - - -
bean leafroll - - - - - -
bean yellow mosaic - - - - - -
clover yellow vein - - - - - -
cucumber mosaic - - - - - -
pea seed-borne mosaic - - - - - -
subterranean clover red leaf - - - - - -
tomato spotted wilt - - - - - -- no crop grown or no data available

CuRRenT AnD PoTenTiAl CosTs fRoM DiseAses of Pulse CRoPs in AusTRAliA | 91 | GRDC
For Australia, the five major diseases by potential loss on a per hectare basis and their total cost to the industry are:
Disease $/ha $ million
Ascochyta blight 15.29 0.64
chocolate spot (fabae) 7.24 0.30
chocolate spot (cinerea) 5.83 0.24
rust 1.49 0.06
Phoma spot 0.70 0.03
The present losses estimated for each disease are in Table 9.6 ($ per hectare) and Table 9.7 (aggregate losses). For Australia, only three diseases cause average annual present loss:
Disease $/ha $ million
Phoma spot 0.39 0.02
chocolate spot (fabae) 0.32 0.01
Rhizoctonia root rot 0.01 0.00
Total losses from others 0.00 0.00
Total Present loss 0.73 0.03
Collectively, present average annual losses from the necrotrophic leaf fungi were $30,000, with no measurable loss from the other groups of diseases.
Table 9.5 Potential and present average annual yield losses (%) from vetch diseases by GRDC Regions and Australia
DiseaseNorthern Southern Western Australia
Potential Present Potential Present Potential Present Potential Present
NECROTROPHIC LEAF FUNGI
Ascochyta blight - - 13.7 0.0 - - 13.7 0.0
chocolate spot (cinerea) - - 4.9 0.0 - - 4.9 0.0
chocolate spot (fabae) - - 6.1 0.3 - - 6.1 0.3
anthracnose - - - - - - - -
Phoma spot - - 0.6 0.4 - - 0.6 0.4
Septoria blight - - - - - - - -
SUB TOTAL 0.7 0.7
BIOTROPHIC LEAF FUNGI
downy mildew - - 0.3 0.0 - - 0.3 0.0
rust - - 1.3 0.0 - - 1.3 0.0
SUB TOTAL 0.0 0.0
ROOT AND CROWN FUNGI
Aphanomyces root rot - - - - - - - -
Rhizoctonia root rot - - 0.1 0.0 - - 0.0 0.0
Sclerotinia stem rot - - - - - - - -
SUB TOTAL - - 0.0 0.0
NEMATODES
stem nematode - - - - - - - -
root knot nematode - - - - - - - -
root lesion nematode neglectus - - - - - - - -
SUB TOTAL 0.0 0.0
BACTERIA
bacterial blight - - - - - - - -
SUB TOTAL 0.0 0.0
VIRUSES
alfalfa mosaic - - - - - - - -
bean leafroll - - - - - - - -
bean yellow mosaic - - - - - - - -
clover yellow vein - - - - - - - -
cucumber mosaic - - - - - - - -
pea seed-borne mosaic - - - - - - - -
subterranean clover red leaf - - - - - - - -
tomato spotted wilt - - - - - - - -
SUB TOTAL 0.0 0.0
TOTAL 0.7 0.7- no crop grown or no data available

GRDC | 92 | CuRRenT AnD PoTenTiAl CosTs fRoM DiseAses of Pulse CRoPs in AusTRAliA
9.6 Value of control of vetch diseasesThe value of present controls of vetch diseases is the difference between the potential average annual loss when current control practices were not in place and the present average annual loss with current controls in place. Estimates of the value of control for each disease surveyed on a per hectare basis and the total value for the production regions and Australia are in Table 9.8.
For diseases with high potential loss and effective control, the value of control is high. For Australia, the five leading diseases in terms of value of control are Ascochyta blight ($0.64 million), fabae chocolate spot ($0.29 million), cinerea chocolate spot ($0.24 million), rust ($0.06 million) and Phoma spot ($0.01 million).
The regional and national values are of primary consideration by funding bodies to judge the return on investment for development of a control. However, for farmers, the cost of using a control needs to be weighed against the return. Here, the per hectare cost is often more useful. The value of control of the Ascochyta blight averages $15.29/ha/year in the Southern Region. This is small relative to the cost of spraying, so the farmer must carefully consider the yield potential of the crop before deciding to spray.
For the survey, control measures were grouped in three broad categories: breeding (resistant cultivars); cultural practices including stubble management, tillage and crop rotation; and pesticides, including fungicides applied to the seed, in fertilisers and by spraying, and insecticides to
Table 9.6 Potential and present average annual costs ($/ha) from vetch diseases by GRDC Regions and Australiaa
DiseaseNorthern Southern Western Australia
Potential Present Potential Present Potential Present Potential Present
NECROTROPHIC LEAF FUNGI
Ascochyta blight - - 15.29 0.00 - - 15.29 0.00
chocolate spot (cinerea) - - 5.83 0.00 - - 5.83 0.00
chocolate spot (fabae) - - 7.24 0.33 - - 7.24 0.33
anthracnose - - - - - - - -
Phoma spot - - 0.70 0.39 - - 0.70 0.39
Septoria blight - - - - - - - -
SUB TOTAL 0.72 0.72
BIOTROPHIC LEAF FUNGI
downy mildew - - 0.32 0.00 - - 0.32 0.00
rust - - 1.49 0.00 - - 1.49 0.00
SUB TOTAL 0.00 0.00
ROOT AND CROWN FUNGI
Aphanomyces root rot - - - - - - - -
Rhizoctonia root rot - - 0.06 0.01 - - 0.06 0.01
Sclerotinia stem rot - - - - - - - -
SUB TOTAL 0.01 0.01
NEMATODES
stem nematode - - - - - - - -
root knot nematode - - - - - - - -
root lesion nematode neglectus - - - - - - - -
SUB TOTAL 0.00 0.00
BACTERIA
bacterial blight - - - - - - - -
SUB TOTAL 0.00 0.00
VIRUSES
alfalfa mosaic - - - - - - - -
bean leafroll - - - - - - - -
bean yellow mosaic - - - - - - - -
clover yellow vein - - - - - - - -
cucumber mosaic - - - - - - - -
pea seed-borne mosaic - - - - - - - -
subterranean clover red leaf - - - - - - - -
tomato spotted wilt - - - - - - - -
SUB TOTAL 0.00 0.00
TOTAL 0.73 0.73
- no crop grown or no data available

CuRRenT AnD PoTenTiAl CosTs fRoM DiseAses of Pulse CRoPs in AusTRAliA | 93 | GRDC
control vectors. The proportion of control contributed by each category and its value are in Table 9.9.
Breeding and the use of genetic resistance provided control of Ascochyta blight only and was worth $0.30 million/year (Table 9.9).
Cultural practices contributed 50 per cent or more of the control for two diseases and more than 25 per cent for a further two. The top four average annual values for this control were: fabae chocolate spot, $0.08 million; cinerea chocolate spot $0.07 million; Ascochyta blight, $0.02 million; and Phoma spot, $0.01 million (Table 9.9).
Pesticides, mainly fungicides, contributed 50 per cent or more of the control for five diseases. The top five average annual values for control with pesticides were: Ascochyta
blight, $0.32 million; fabae chocolate spot, $0.21 million; cinerea chocolate spot, $0.18 million; rust, $0.06 million; and downy mildew, $0.01 million (Table 9.9).
9.7 use of pesticides for control of vetch diseases
No data were available on the use of pesticides on vetch crops.
9.8 Discussion and ConclusionsDiseases have a high potential to damage vetch crops but are very well controlled at present, with total present losses of $0.03 million or 0.6 per cent of the gross value of production. On average, the current average annual losses
Table 9.7 Aggregate potential and present average annual costs ($ million) from vetch diseases by GRDC Regions and Australia
DiseaseNorthern Southern Western Australia
Potential Present Potential Present Potential Present Potential Present
NECROTROPHIC LEAF FUNGI
Ascochyta blight - - 0.64 0.00 - - 0.64 0.00
chocolate spot (cinerea) - - 0.24 0.00 - - 0.24 0.00
chocolate spot (fabae) - - 0.30 0.01 - - 0.30 0.01
anthracnose - - - - - - - -
Phoma spot - - 0.03 0.02 - - 0.03 0.02
Septoria blight - - - - - - - -
SUB TOTAL 0.03 0.00 0.03
BIOTROPHIC LEAF FUNGI
downy mildew - - 0.01 0.00 - - 0.01 0.00
rust - - 0.06 0.00 - - 0.06 0.00
SUB TOTAL 0.00 0.00 0.00
ROOT AND CROWN FUNGI
Aphanomyces root rot - - - - - - - -
Rhizoctonia root rot - - 0.00 0.00 - - 0.00 0.00
Sclerotinia stem rot - - - - - - - -
SUB TOTAL 0.00 0.00 0.00
NEMATODES
stem nematode - - - - - - - -
root knot nematode - - - - - - - -
root lesion nematode neglectus - - - - - - - -
SUB TOTAL 0.00 0.00 0.00
BACTERIA
bacterial blight - - - - - - - -
SUB TOTAL 0.00 0.00 0.00
VIRUSES
alfalfa mosaic - - - - - - - -
bean leafroll - - - - - - - -
bean yellow mosaic - - - - - - - -
clover yellow vein - - - - - - - -
cucumber mosaic - - - - - - - -
pea seed-borne mosaic - - - - - - - -
subterranean clover red leaf - - - - - - - -
tomato spotted wilt - - - - - - - -
SUB TOTAL 0.00 0.00 0.00
TOTAL 0.03 0.00 0.03- no crop grown or no data available
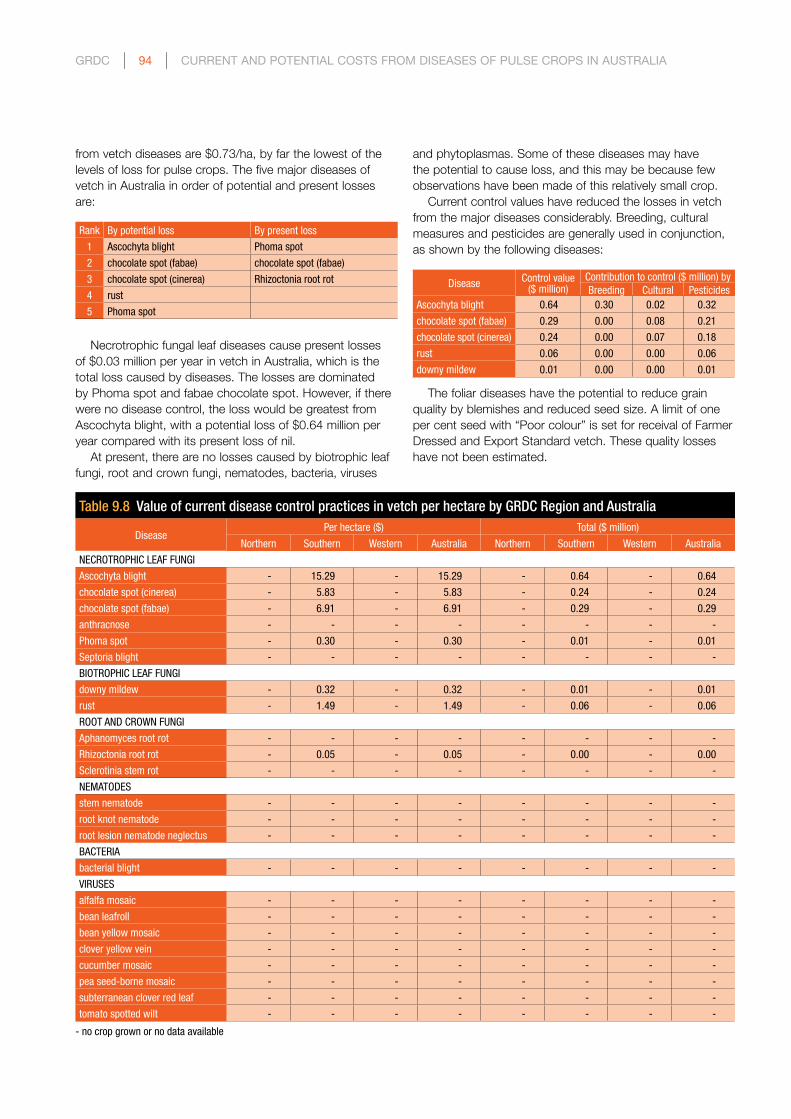
GRDC | 94 | CuRRenT AnD PoTenTiAl CosTs fRoM DiseAses of Pulse CRoPs in AusTRAliA
from vetch diseases are $0.73/ha, by far the lowest of the levels of loss for pulse crops. The five major diseases of vetch in Australia in order of potential and present losses are:
Rank By potential loss By present loss
1 Ascochyta blight Phoma spot
2 chocolate spot (fabae) chocolate spot (fabae)
3 chocolate spot (cinerea) Rhizoctonia root rot
4 rust
5 Phoma spot
Necrotrophic fungal leaf diseases cause present losses of $0.03 million per year in vetch in Australia, which is the total loss caused by diseases. The losses are dominated by Phoma spot and fabae chocolate spot. However, if there were no disease control, the loss would be greatest from Ascochyta blight, with a potential loss of $0.64 million per year compared with its present loss of nil.
At present, there are no losses caused by biotrophic leaf fungi, root and crown fungi, nematodes, bacteria, viruses
and phytoplasmas. Some of these diseases may have the potential to cause loss, and this may be because few observations have been made of this relatively small crop.
Current control values have reduced the losses in vetch from the major diseases considerably. Breeding, cultural measures and pesticides are generally used in conjunction, as shown by the following diseases:
Disease Control value ($ million)
Contribution to control ($ million) byBreeding Cultural Pesticides
Ascochyta blight 0.64 0.30 0.02 0.32
chocolate spot (fabae) 0.29 0.00 0.08 0.21
chocolate spot (cinerea) 0.24 0.00 0.07 0.18
rust 0.06 0.00 0.00 0.06
downy mildew 0.01 0.00 0.00 0.01
The foliar diseases have the potential to reduce grain quality by blemishes and reduced seed size. A limit of one per cent seed with “Poor colour” is set for receival of Farmer Dressed and Export Standard vetch. These quality losses have not been estimated.
Table 9.8 Value of current disease control practices in vetch per hectare by GRDC Region and Australia
DiseasePer hectare ($) Total ($ million)
Northern Southern Western Australia Northern Southern Western Australia
NECROTROPHIC LEAF FUNGI
Ascochyta blight - 15.29 - 15.29 - 0.64 - 0.64
chocolate spot (cinerea) - 5.83 - 5.83 - 0.24 - 0.24
chocolate spot (fabae) - 6.91 - 6.91 - 0.29 - 0.29
anthracnose - - - - - - - -
Phoma spot - 0.30 - 0.30 - 0.01 - 0.01
Septoria blight - - - - - - - -
BIOTROPHIC LEAF FUNGI
downy mildew - 0.32 - 0.32 - 0.01 - 0.01
rust - 1.49 - 1.49 - 0.06 - 0.06
ROOT AND CROWN FUNGI
Aphanomyces root rot - - - - - - - -
Rhizoctonia root rot - 0.05 - 0.05 - 0.00 - 0.00
Sclerotinia stem rot - - - - - - - -
NEMATODES
stem nematode - - - - - - - -
root knot nematode - - - - - - - -
root lesion nematode neglectus - - - - - - - -
BACTERIA
bacterial blight - - - - - - - -
VIRUSES
alfalfa mosaic - - - - - - - -
bean leafroll - - - - - - - -
bean yellow mosaic - - - - - - - -
clover yellow vein - - - - - - - -
cucumber mosaic - - - - - - - -
pea seed-borne mosaic - - - - - - - -
subterranean clover red leaf - - - - - - - -
tomato spotted wilt - - - - - - - -
- no crop grown or no data available

CuRRenT AnD PoTenTiAl CosTs fRoM DiseAses of Pulse CRoPs in AusTRAliA | 95 | GRDC
Table 9.9 Value of different forms of vetch disease control in Australia
DiseaseCost/value ($ million) Contribution (%) Contribution ($ million)
Potential Present Control Breeding Cultural Pesticide Breeding Cultural Pesticide
NECROTROPHIC LEAF FUNGI
Ascochyta blight 0.64 0.00 0.64 47 3 50 0.30 0.02 0.32
chocolate spot (cinerea) 0.24 0.00 0.24 0 28 73 0.00 0.07 0.18
chocolate spot (fabae) 0.30 0.01 0.29 0 28 73 0.00 0.08 0.21
anthracnose - - - - - -
Phoma spot 0.03 0.02 0.01 0 75 25 0.00 0.01 0.00
Septoria blight - - - - - -
BIOTROPHIC LEAF FUNGI
downy mildew 0.01 0.00 0.01 0 0 100 0.00 0.00 0.01
rust 0.06 0.00 0.06 0 0 100 0.00 0.00 0.06
ROOT AND CROWN FUNGI
Aphanomyces root rot - - - - - -
Rhizoctonia root rot 0.00 0.00 0.00 0 100 0 0.00 0.00 0.00
Sclerotinia stem rot - - - - - -
NEMATODES
stem nematode - - - - - -
root knot nematode - - - - - -
root lesion nematode neglectus - - - - - -
BACTERIA
bacterial blight - - - - - -
VIRUSES
alfalfa mosaic - - - - - -
bean leafroll - - - - - -
bean yellow mosaic - - - - - -
clover yellow vein - - - - - -
cucumber mosaic - - - - - -
pea seed-borne mosaic - - - - - -
subterranean clover red leaf - - - - - -
tomato spotted wilt - - - - - -
- no data available

GRDC | 96 | CuRRenT AnD PoTenTiAl CosTs fRoM DiseAses of Pulse CRoPs in AusTRAliA
10.1 introductionPeanuts (Arachis hypogaea) are a subtropical crop needing relatively warm growing conditions and 500 to 600mm of well-distributed rainfall plus stored soil water to produce a high-yielding crop. Peanuts are grown in Queensland and to a small extent in the Northern Territory in higher rainfall areas (500 to 600mm) or under supplementary irrigation. They are a summer crop, sown in spring and harvested in late summer to early autumn.
Peanuts are grown for human consumption and so the harvested seed has high quality standards.
This section contains:n average area, production, yield and value of peanuts over
a recent five-year period;n a list of the diseases of peanuts that were considered;n the incidence and severity of the diseases in each
production area;n the potential and present yield loss as a percentage of
yield, effect on quality and the value of this loss;n overall control methods and their value for each disease;
andn the present level of expenditure on fungicides on the crop.
10.2 Peanut productionEstimation of the value of disease losses depends on base data on the area, yield and value of the crop. The production data for peanuts are for the year 2008-09. The average data for the five years ending 2008-09 were calculated as representative of current production. Peanut production data were obtained from the Australian Bureau of Statistics.
The average area, yield, production and value of peanuts in each agro-ecological zone are shown in Table 10.1 (see Appendix A for more detail). For the period 2004-05 to 2008-09, the average annual area of peanuts sown in Australia was 12,100 hectares producing an average of 32,100 tonnes, with an overall average yield of 2.65t/ha.
The mean unit value of peanuts over the five-year period was $298/t, giving an average gross value of production of $9.6 million per year.
Peanut production was mostly in Queensland in the Northern Region with 94 per cent of the crop area. There is a small area around Katherine in the Northern Territory with 6 per cent of the crop area. Two peanut growing areas, the Queensland South Coast and Katherine, are not within the boundaries of any present GRDC agro-ecological zone. This
10 CuRRenT AnD PoTenTiAl losses fRoM DiseAses of PeAnuTs
Table 10.1 Mean peanut area, yield, production and value by agro-ecological zone and GRDC Region 2004-05 to 2008-09
Area (‘000 ha) Yield (t/ha) Production (‘000 t) Gross value ($ million)
Queensland South Coast* 1.4 4.86 6.9 2.1
Queensland Atherton* 2.1 3.66 7.7 2.3
Queensland Central* 0.4 4.37 1.8 0.6
NSW North-East/Queensland South-East* 7.5 1.72 12.9 3.8
NSW North-West/Queensland South-West* 0.0 1.00 0.0 0.0
TOTAL NORTHERN REGION 11.4 2.56 29.3 8.7
NSW Central 0.0 0.00 0.0 0.0
NSW–Victoria Slopes 0.0 0.00 0.0 0.0
Victoria High Rainfall 0.0 0.00 0.0 0.0
SA–Victoria Mallee 0.0 0.00 0.0 0.0
SA–Victoria Border–Wimmera 0.0 0.00 0.0 0.0
SA Mid-North/Lower Yorke, Eyre 0.0 0.00 0.0 0.0
Tasmania Grain Growing 0.0 0.00 0.0 0.0
TOTAL SOUTHERN REGION 0.0 0.00 0.0 0.0
WA Northern 0.0 0.00 0.0 0.0
WA Central 0.0 0.00 0.0 0.0
WA Eastern 0.0 0.00 0.0 0.0
WA Sandplain–Mallee 0.0 1.00 0.0 0.0
WA Ord 0.0 0.00 0.0 0.0
Northern Territory Central (Katherine)* 0.7 4.00 2.8 0.8
TOTAL WESTERN REGION 0.7 4.00 2.8 0.8
TOTAL AUSTRALIA 12.1 2.65 32.1 9.6
* Disease data obtained for this zone

CuRRenT AnD PoTenTiAl CosTs fRoM DiseAses of Pulse CRoPs in AusTRAliA | 97 | GRDC
report recognises these as two additional zones, ‘Qld South Coast’ and ‘NT Central (Katherine)’. The first is placed in the Northern Region, while the second is placed in the Western Region because of the similarity of subtropical irrigation farming of Katherine with the Ord area of the Western Region.
10.3 Diseases of peanuts10.3.1 Peanut diseases and their pathogensThere were 32 diseases of peanuts considered in this survey, comprising four necrotrophic leaf fungal diseases, one biotrophic leaf disease, 15 root and crown fungal diseases, seven nematode diseases, four viral diseases and one
phytoplasma disease (Table 10.2). These diseases were caused by 20 fungi, seven nematodes, four viruses and one phytoplasma. There were no bacterial diseases.
As several species of the Pratylenchus nematodes attack crops and pastures, the species name ‘brachyurus’ was added to the common name ’root lesion nematode‘ for clarity.
Data on disease incidence, severity and control measures were obtained for all zones in the Northern Region where peanuts are grown. There was no peanut production in the other regions (Table 10.1). Disease information and the respondents for each zone are in Appendix B.
Table 10.2 Peanut diseases in this survey, their pathogens and their presencea in the GRDC Regions and AustraliaPathogen Disease Northern Southern Western* Australia
NECROTROPHIC LEAF FUNGI
Cercospora arachidicola early leaf spot Y - U Y
Didymella arachidicola net blotch Y - N Y
Leptosphaerulina crassiaca pepper spot Y - N Y
Mycosphaerella berkeleyi late leaf spot Y - Y Y
BIOTROPHIC LEAF FUNGI
Puccinia arachidis rust Y - Y Y
ROOT AND CROWN FUNGI
Aspergillus flavus damping off and seed aflatoxin Y - Y Y
Aspergillus niger Aspergillus crown rot Y - Y Y
Cylindrocladium parasiticum Cylindrocladium black rot Y - N Y
Fusarium sp. Fusarium root rot Y - U Y
Lasiodiplodia theobromae Diplodia rot Y - U Y
Macrophomina phaseolina charcoal rot Y - Y Y
Neocosmospora vasinfecta Neocosmospora root rot Y - N Y
Pythium spp. Pythium pod rot and damping off U - U U
Rhizopus stolonifer Rhizopus damping off U - U U
Rhizoctonia sp. Rhizoctonia damping off U - U U
Rhizoctonia solani Rhizoctonia blight Y - Y Y
Sclerotinia minor Sclerotinia blight Y - N Y
Sclerotinia sclerotiorum Sclerotinia stem rot Y - N Y
Sclerotium rolfsii base rot Y - Y Y
Verticillium dahliae Verticillium wilt Y - U Y
NEMATODES
Meloidogyne hapla northern root knot nem. Y - U Y
Meloidogyne incognita root knot nematode U - U U
Meloidogyne javanica Javanese root knot nem. U - U U
Pratylenchus brachyurus root lesion nem. brachyurus Y - U Y
Xiphinema elongatum dagger nematode Y - U Y
Criconemella sp. ring nematode Y - U Y
Meloidogyne arenaria groundnut root knot nem. U - U U
VIRUSES
Capsicum chlorosis virus capsicum chlorosis Y - N Y
Peanut mottle potyvirus peanut mottle Y - Y Y
Tobacco streak virus tobacco streak Y - U Y
Tomato spotted wilt tospovirus tomato spotted wilt Y - Y Y
PHYTOPLASMAS
Phytoplasma witch’s broom Y - Y Ya Y= present in region N = not recorded in region U = unknown status - peanuts not grown in the region * The Northern Territory (Katherine zone) is allocated to the Western Region (Ord area)

GRDC | 98 | CuRRenT AnD PoTenTiAl CosTs fRoM DiseAses of Pulse CRoPs in AusTRAliA
10.3.2 Distribution of the pathogens in AustraliaTwenty-six of the 32 diseases surveyed were reported as present on peanuts in Australia: four necrotrophic leaf fungal disease, one biotrophic leaf fungal disease, 12 of the 13 root and crown fungal diseases, four of the seven nematodes, the four viral diseases and the phytoplasma disease. All of these were present in the Northern Region but only 10 were reported in the Western Region (Katherine) (Table 10.2).
All the fungal leaf diseases were present in the Northern
Region but only one, late leaf spot, was reported from the Northern Territory. Of the root and crown fungi, 12 are present in the Northern Region and five are known in the Western Region, while the status of the others is unknown. For nematodes, four are present on peanuts in the Northern Region while the status of nematodes in the Western Region is unknown. All viruses are known for the Northern Region while two are known for the Western. The phytoplasma is present in both regions (Table 10.2).
Table 10.3 Incidence of peanut diseases as a proportion of years when disease occurs (%) and as a proportion of the crop area affected when the disease develops (%) in the GRDC Regions and Australia
DiseaseNorthern Southern Western* Australia
Years Area Years Area Years Area Years Area
NECROTROPHIC LEAF FUNGI
early leaf spot 27.9 52.7 - - - - 26.3 49.6
net blotch 25.7 12.5 - - 0.0 0.0 24.2 11.8
pepper spot 18.3 0.2 - - 0.0 0.0 17.3 0.2
late leaf spot 100.0 59.2 - - 100.0 50.0 100.0 58.6
BIOTROPHIC LEAF FUNGI
rust 86.9 52.7 - - 33.0 10.0 83.8 50.3
ROOT AND CROWN FUNGI
damping off and seed aflatoxin 50.8 59.1 - - 10.0 1.0 48.4 55.8
Aspergillus crown rot 83.5 1.0 - - 100.0 1.0 84.5 1.0
Cylindrocladium black rot 17.1 4.7 - - 0.0 0.0 16.1 4.4
Fusarium root rot 6.2 0.6 - - - - 5.9 0.6
Diplodia rot 13.1 6.6 - - - - 12.3 6.2
charcoal rot 14.4 3.5 - - 10.0 1.0 14.1 3.4
Neocosmospora root rot 20.0 4.0 - - 0.0 0.0 18.9 3.8
Pythium pod rot and damping off - - - - - - - -
Rhizopus damping off - - - - - - - -
Rhizoctonia damping off - - - - - - - -
Rhizoctonia blight 2.6 0.5 - - 10.0 1.0 3.1 0.6
Sclerotinia blight 14.0 19.8 - - 0.0 0.0 13.2 18.7
Sclerotinia stem rot 13.5 17.7 - - 0.0 0.0 12.7 16.7
base rot 19.1 4.5 - - 20.0 5.0 19.1 4.5
Verticillium wilt 38.8 8.4 - - - - 36.6 7.9
NEMATODES
northern root knot nematode 14.3 3.3 - - - - 13.4 3.1
root knot nematode - - - - - - - -
Javanese root knot nematode - - - - - - - -
root lesion nematode brachyurus 14.3 5.2 - - - - 13.4 4.9
Dagger nematode 12.4 0.6 - - - - 11.7 0.6
Ring nematode 12.4 0.6 - - - - 11.7 0.6
Groundnut root knot nematode - - - - - - - -
VIRUSES
Capsicum chlorosis 12.4 1.2 - - 0.0 0.0 11.7 1.2
peanut mottle 81.7 0.8 - - 100.0 1.0 82.7 0.8
tobacco streak 0.0 0.0 - - - - 0.0 0.0
tomato spotted wilt 14.8 3.4 - - 5.0 1.0 14.3 3.3
PHYTOPLASMAS
witch's broom 0.0 0.0 - - 0.0 0.0 0.0 0.0
- peanuts not grown in the region or no data available * The Northern Territory (Katherine zone) is allocated to the Western Region (Ord area)

CuRRenT AnD PoTenTiAl CosTs fRoM DiseAses of Pulse CRoPs in AusTRAliA | 99 | GRDC
10.4 incidence and severity of peanut diseases
10.4.1 incidence of peanut diseasesIncidence was assessed as the proportion of years that favoured development of the disease in each zone, and as the proportion of the crop area in the zone affected when the disease developed. These values were averaged for the region and Australia by weighting by the area sown to the crop in each zone for which disease data were available, and are shown in Table 10.3.
Within the Northern Region, there were eight diseases
that occurred with a yearly incidence of 25 per cent or greater. Late leaf spot developed in every year followed by rust, Aspergillus crown rot, peanut mottle and damping off/seed aflatoxin. In the Katherine zone (Western Region), four diseases occurred with a yearly incidence of 25 per cent or greater. Late leaf spot, Aspergillus crown rot and peanut mottle occurred every year, followed by rust and base rot.
Four diseases occurred over 25 per cent of the crop area in years favourable for their development in the Northern Region: late leaf spot occurred most widely (59 per cent of the area) followed by damping off/seed aflatoxin, early
Table 10.4 Potential and present severity of peanut diseases (% yield loss in years suitable for disease development) in the GRDC Regions and Australia
DiseaseNorthern Southern Western* Australia
Potential Present Potential Present Potential Present Potential Present
NECROTROPHIC LEAF FUNGI
early leaf spot 27.2 6.7 - - - - 25.6 6.3
net blotch 5.9 1.7 - - 0.0 0.0 5.6 1.6
pepper spot 0.2 0.0 - - 0.0 0.0 0.2 0.0
late leaf spot 41.7 5.9 - - 50.0 5.0 42.1 5.9
BIOTROPHIC LEAF FUNGI
rust 41.7 5.9 - - 20.0 2.0 40.4 5.7
ROOT AND CROWN FUNGI
damping off and seed aflatoxin 40.8 13.1 - - 50.0 0.0 41.4 12.3
Aspergillus crown rot 42.7 5.0 - - 50.0 5.0 43.1 5.0
Cylindrocladium black rot 14.7 9.2 - - 0.0 0.0 13.9 8.6
Fusarium root rot 1.2 1.2 - - - - 1.2 1.2
Diplodia rot 3.3 1.3 - - - - 3.1 1.2
charcoal rot 4.4 1.9 - - 5.0 5.0 4.4 2.0
Neocosmospora root rot 3.2 2.8 - - 0.0 0.0 3.0 2.6
Pythium pod rot and damping off - - - - - - - -
Rhizopus damping off - - - - - - - -
Rhizoctonia damping off - - - - - - - -
Rhizoctonia blight 3.4 0.9 - - 10.0 0.0 3.8 0.9
Sclerotinia blight 38.3 16.8 - - 0.0 0.0 36.1 15.8
Sclerotinia stem rot 25.2 11.7 - - 0.0 0.0 23.7 11.0
base rot 18.8 5.0 - - 20.0 5.0 18.8 5.0
Verticillium wilt 17.6 14.3 - - - - 16.5 13.5
NEMATODES
northern root knot nematode 6.1 5.5 - - - - 5.8 5.2
root knot nematode - - - - - - - -
Javanese root knot nematode - - - - - - - -
root lesion nema.brachyurus 4.3 3.7 - - - - 4.0 3.5
Dagger nematode 0.1 0.0 - - - - 0.1 0.0
Ring nematode 0.1 0.0 - - - - 0.1 0.0
Groundnut root knot nematode - - - - - - - -
VIRUSES
Capsicum chlorosis 2.5 1.2 - - 0.0 0.0 2.3 1.2
peanut mottle 1.6 1.6 - - 2.0 2.0 1.7 1.7
tobacco stream 0.0 0.0 - - - - 0.0 0.0
tomato spotted wilt 3.8 3.8 - - 2.0 2.0 3.7 3.7
PHYTOPLASMAS
witch's broom 0.0 0.0 - - 0.0 0.0 0.0 0.0
- peanuts not grown in the region or no data available * The Northern Territory (Katherine zone) is allocated to the Western Region (Ord area)

GRDC | 100 | CuRRenT AnD PoTenTiAl CosTs fRoM DiseAses of Pulse CRoPs in AusTRAliA
leaf spot, rust and Sclerotinia blight. In the Katherine zone (Western Region), only one disease, late leaf spot, occurred widely (50 per cent of area) in years that favoured development of the disease, followed by rust (10 per cent) and base rot.
10.4.2 severity of peanut diseasesSeverity was assessed as the percentage yield loss that occurred in affected crops in the zone in years favourable for development of the disease. Two assessments were made. The first was the potential severity, that is, the severity
Table 10.5 Potential and present average annual yield losses (%) from peanut diseases by GRDC Region and Australia
DiseaseNorthern Southern Western* Australia
Potential Present Potential Present Potential Present Potential Present
NECROTROPHIC LEAF FUNGI
early leaf spot 8.4 2.1 - - - - 7.9 2.0
net blotch 0.9 0.5 - - 0.0 0.0 0.9 0.4
pepper spot 0.0 0.0 - - 0.0 0.0 0.0 0.0
late leaf spot 28.2 3.9 - - 25.0 2.5 28.0 3.8
SUB TOTAL 6.4 2.5 6.2
BIOTROPHIC LEAF FUNGI
rust 20.3 2.8 - - 0.7 0.1 19.2 2.6
SUB TOTAL 2.8 0.1 2.6
ROOT AND CROWN FUNGI
damping off and seed aflatoxin 22.1 8.8 - - 0.1 0.0 20.8 8.3
Aspergillus crown rot 0.4 0.0 - - 0.5 0.1 0.4 0.0
Cylindrocladium black rot 2.5 2.1 - - 0.0 0.0 2.3 1.9
Fusarium root rot 0.0 0.0 - - - - 0.0 0.0
Diplodia rot 0.1 0.0 - - - - 0.1 0.0
charcoal rot 0.0 0.0 - - 0.0 0.0 0.0 0.0
Neocosmospora root rot 0.1 0.0 - - 0.0 0.0 0.1 0.0
Pythium pod rot and damping off - - - - - - - -
Rhizopus damping off - - - - - - - -
Rhizoctonia damping off - - - - - - - -
Rhizoctonia blight 0.0 0.0 - - 0.0 0.0 0.0 0.0
Sclerotinia blight 2.0 0.8 - - 0.0 0.0 1.9 0.7
Sclerotinia stem rot 0.9 0.4 - - 0.0 0.0 0.8 0.4
base rot 0.2 0.0 - - 0.2 0.1 0.2 0.0
Verticillium wilt 0.7 0.5 - - - - 0.7 0.5
SUB TOTAL 12.8 0.1 12.1
NEMATODES
northern root knot nematode 0.2 0.0 - - - - 0.2 0.0
root knot nematode - - - - - - - -
Javanese root knot nematode - - - - - - - -
root lesion nema. brachyurus 0.3 0.0 - - - - 0.2 0.0
Dagger nematode 0.0 0.0 - - - - 0.0 0.0
Ring nematode 0.0 0.0 - - - - 0.0 0.0
Groundnut root knot nematode - - - - - - - -
SUB TOTAL 0.0 0.0
VIRUSES
Capsicum chlorosis 0.2 0.1 - - 0.0 0.0 0.2 0.1
peanut mottle 0.0 0.0 - - 0.0 0.0 0.0 0.0
tobacco stream 0.0 0.0 - - - - 0.0 0.0
tomato spotted wilt 0.0 0.0 - - 0.0 0.0 0.0 0.0
SUB TOTAL 0.2 0.0 0.2
PHYTOPLASMAS
witch's broom 0.0 0.0 - - 0.0 0.0 0.0 0.0
SUB TOTAL 0.0 0.0 0.0
TOTAL 22.2 2.7 21.1
- peanuts not grown in the region or no data available * The Northern Territory (Katherine zone) is allocated to the Western Region (Ord area)

CuRRenT AnD PoTenTiAl CosTs fRoM DiseAses of Pulse CRoPs in AusTRAliA | 101 | GRDC
Table 10.6 Potential and present average annual quality losses from peanut diseases by GRDC Region and Australia
Quality lossesNorthern Southern Western* Australia
Potential Present Potential Present Potential Present Potential Present
$/ha
damping off and seed aflatoxin 190.19 76.08 0.00 0.00 179.21 71.68
76.08 0.00 0.00 71.68
$ million
damping off and seed aflatoxin 2.17 0.87 0.00 0.00 2.17 0.87
0.87 0.00 0.00 0.87
* The Northern Territory (Katherine zone) is allocated to the Western Region (Ord area)
that would occur if current controls were not applied. The second was the present severity, when current controls are in place. These assessments were made at the zone level and aggregated to the region by weighting as in 10.4.1 (Table 10.4).
Severity assessments were made for the zones in the Northern and Western Regions where peanuts were grown. Because most peanuts are grown in the Northern Region, its severity ratings are similar to the Australian aggregation.
Within the Northern Region, 10 diseases had a potential severity of more than 10 per cent yield loss in years when they developed. Aspergillus crown rot had the highest potential severity of 43 per cent yield loss followed by late leaf spot, rust, damping off/seed aflatoxin and Sclerotinia blight. Four diseases had present severities exceeding 10 per cent yield loss. Sclerotinia blight had the highest present severity of 17 per cent yield loss, followed by Verticillium wilt, damping off/seed aflatoxin, Sclerotinia stem rot and Cylindrocladium black rot.
In the Western Region (Katherine), six diseases had a potential severity exceeding 10 per cent yield loss: late leaf spot, rust and damping off/seed aflatoxin had the highest potential severity of 50 per cent yield loss, followed by rust and base rot. No diseases had a present severity that exceeded 10 per cent yield loss. The highest were late leaf spot, Aspergillus crown rot, charcoal rot and base rot.
10.5 losses from peanut diseases10.5.1 Potential and present percentage
yield lossesThe average annual yield loss was calculated from the incidence and severity data (see Section 2.5 for the method). The potential severity was used to calculate the potential losses if current controls were not used and the present severity to calculate present losses with current control measures.
In the Northern Region, three diseases had a potential average annual yield loss of more than 10 per cent (Table 10.5). The highest was 28 per cent from late leaf spot followed by damping off/seed aflatoxin, rust, early leaf spot and Cylindrocladium black rot. With current disease controls, no diseases had a present average annual yield loss of 10 per cent or more. The highest was damping off/seed aflatoxin with 9 per cent followed by late leaf spot, rust, early leaf spot and Cylindrocladium black rot.
In the Western Region (Katherine), only late leaf spot had
a substantial potential average annual yield loss (25 per cent). Its present loss is 2.5 per cent.
For Australia, the total present average annual yield loss from all diseases was 21 per cent. Necrotrophic leaf fungal diseases totalled 6 per cent, biotrophic leaf fungal diseases were 2.6 per cent, the root and crown fungi were 12 per cent, nematodes nil, viruses 0.2 per cent and Phytoplasmas nil.
10.5.2 Quality effects of diseases on peanutsAs peanuts are for human consumption, appearance and freedom from toxins are paramount. Presence of seed aflatoxin is not acceptable, while some other diseases will affect the appearance of the seed. Some diseases would be expected to cause losses in quality and therefore in the value of the seed.
The one disease identified as causing quality losses in peanuts is damping off and seed aflatoxin (caused by Aspergillus flavus), with all those losses occurring in the Northern Region (Table 10.6). Average present losses are considerable, though the disease has the potential cause greater losses.
10.5.3 Value of losses from peanut diseasesThe value of these yield losses was calculated by relating the percentage losses to the gross value of peanut production in each zone, using the average value of peanuts, over a five-year period (see Section 10.2). These losses were calculated on a per hectare basis and on an aggregate basis for each zone, then for each GRDC region and nationally. As the Northern Region dominates production, totals for that region are virtually the same as the national totals.
The potential losses estimated for each disease are in Table 10.7 ($ per hectare) and Table 10.8 (aggregate losses). For Australia, the five major diseases by potential loss on a per hectare basis and their total cost to the industry are:
Disease $/ha $ million
damping off and seed aflatoxin 286.14 3.47
late leaf spot 264.37 3.21
rust 182.70 2.22
early leaf spot 40.50 0.49
Cylindrocladium black rot 25.43 0.31
The present losses estimated for each disease are in Table 10.7 ($ per hectare) and Table 10.8 (aggregate losses).

GRDC | 102 | CuRRenT AnD PoTenTiAl CosTs fRoM DiseAses of Pulse CRoPs in AusTRAliA
Table 10.7 Potential and present average annual costs ($/ha) from peanut diseases by GRDC Regions and Australia
DiseaseNorthern Southern Western* Australia
Potential Present Potential Present Potential Present Potential Present
NECROTROPHIC LEAF FUNGI
early leaf spot 42.98 10.75 - - - - 40.50 10.13
net blotch 10.07 5.01 - - 0.00 0.00 9.49 4.72
pepper spot 0.02 0.00 - - 0.00 0.00 0.02 0.00
late leaf spot 262.31 34.06 - - 297.93 29.79 264.37 33.82
SUB TOTAL 49.82 29.79 48.66
BIOTROPHIC LEAF FUNGI
rust 193.41 24.41 - - 7.87 0.79 182.70 23.05
SUB TOTAL 24.41 0.79 23.05
ROOT AND CROWN FUNGI
damping off and seed aflatoxin 303.63 121.41 - - 0.60 0.00 286.14 114.40
Aspergillus crown rot 2.84 0.29 - - 5.96 0.60 3.02 0.31
Cylindrocladium black rot 26.98 22.46 - - 0.00 0.00 25.43 21.17
Fusarium root rot 0.45 0.45 - - - - 0.42 0.42
Diplodia rot 0.34 0.13 - - - - 0.32 0.13
charcoal rot 0.18 0.07 - - 0.06 0.06 0.17 0.07
Neocosmospora root rot 0.58 0.49 - - 0.00 0.00 0.55 0.46
Pythium pod rot and damping off - - - - - - - -
Rhizopus damping off - - - - - - - -
Rhizoctonia damping off - - - - - - - -
Rhizoctonia blight 0.05 0.02 - - 0.12 0.00 0.06 0.02
Sclerotinia blight 10.10 4.05 - - 0.00 0.00 9.52 3.82
Sclerotinia stem rot 6.02 2.51 - - 0.00 0.00 5.67 2.36
base rot 1.28 0.32 - - 2.38 0.60 1.34 0.34
Verticillium wilt 5.63 4.79 - - - - 5.31 4.52
SUB TOTAL 157.00 1.25 148.01
NEMATODES
northern root knot nematode 2.31 0.06 - - - - 2.18 0.06
root knot nematode - - - - - - - -
Javanese root knot nematode - - - - - - - -
root lesion nema. brachyurus 3.64 0.04 - - - - 3.43 0.04
Dagger nematode 0.09 0.00 - - - - 0.08 0.00
Ring nematode 0.09 0.00 - - - - 0.08 0.00
Groundnut root knot nematode - - - - - - - -
SUB TOTAL 0.10 0.00 0.09
VIRUSES
Capsicum chlorosis 3.60 1.80 - - 0.00 0.00 3.39 1.70
peanut mottle 0.11 0.11 - - 0.24 0.24 0.12 0.12
tobacco stream 0.00 0.00 - - - - 0.00 0.00
tomato spotted wilt 0.17 0.17 - - 0.01 0.01 0.16 0.16
SUB TOTAL 2.08 0.25 1.98
PHYTOPLASMAS
witch's broom 0.00 0.00 - - 0.00 0.00 0.00 0.00
SUB TOTAL 0.00 0.00 0.00
TOTAL 233.41 32.08 221.79
- no peanuts grown or no data available * The Northern Territory (Katherine zone) is allocated to the Western Region (Ord area)
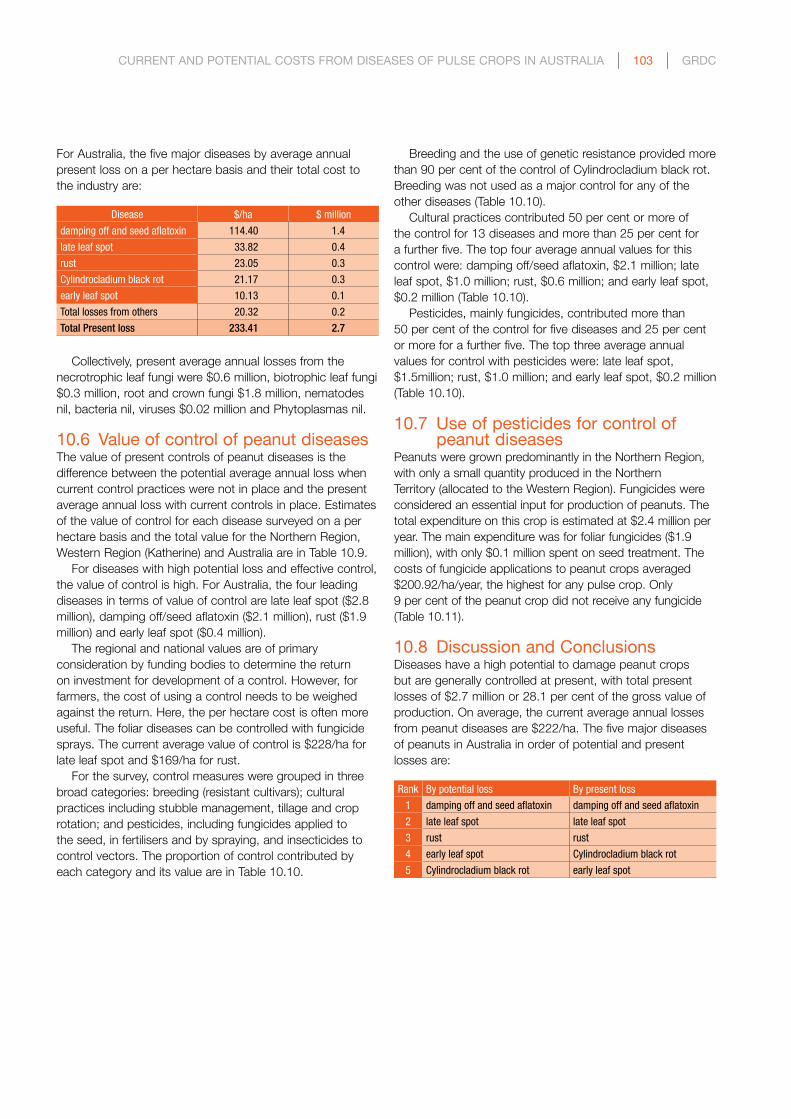
CuRRenT AnD PoTenTiAl CosTs fRoM DiseAses of Pulse CRoPs in AusTRAliA | 103 | GRDC
For Australia, the five major diseases by average annual present loss on a per hectare basis and their total cost to the industry are:
Disease $/ha $ million
damping off and seed aflatoxin 114.40 1.4
late leaf spot 33.82 0.4
rust 23.05 0.3
Cylindrocladium black rot 21.17 0.3
early leaf spot 10.13 0.1
Total losses from others 20.32 0.2
Total Present loss 233.41 2.7
Collectively, present average annual losses from the necrotrophic leaf fungi were $0.6 million, biotrophic leaf fungi $0.3 million, root and crown fungi $1.8 million, nematodes nil, bacteria nil, viruses $0.02 million and Phytoplasmas nil.
10.6 Value of control of peanut diseasesThe value of present controls of peanut diseases is the difference between the potential average annual loss when current control practices were not in place and the present average annual loss with current controls in place. Estimates of the value of control for each disease surveyed on a per hectare basis and the total value for the Northern Region, Western Region (Katherine) and Australia are in Table 10.9.
For diseases with high potential loss and effective control, the value of control is high. For Australia, the four leading diseases in terms of value of control are late leaf spot ($2.8 million), damping off/seed aflatoxin ($2.1 million), rust ($1.9 million) and early leaf spot ($0.4 million).
The regional and national values are of primary consideration by funding bodies to determine the return on investment for development of a control. However, for farmers, the cost of using a control needs to be weighed against the return. Here, the per hectare cost is often more useful. The foliar diseases can be controlled with fungicide sprays. The current average value of control is $228/ha for late leaf spot and $169/ha for rust.
For the survey, control measures were grouped in three broad categories: breeding (resistant cultivars); cultural practices including stubble management, tillage and crop rotation; and pesticides, including fungicides applied to the seed, in fertilisers and by spraying, and insecticides to control vectors. The proportion of control contributed by each category and its value are in Table 10.10.
Breeding and the use of genetic resistance provided more than 90 per cent of the control of Cylindrocladium black rot. Breeding was not used as a major control for any of the other diseases (Table 10.10).
Cultural practices contributed 50 per cent or more of the control for 13 diseases and more than 25 per cent for a further five. The top four average annual values for this control were: damping off/seed aflatoxin, $2.1 million; late leaf spot, $1.0 million; rust, $0.6 million; and early leaf spot, $0.2 million (Table 10.10).
Pesticides, mainly fungicides, contributed more than 50 per cent of the control for five diseases and 25 per cent or more for a further five. The top three average annual values for control with pesticides were: late leaf spot, $1.5million; rust, $1.0 million; and early leaf spot, $0.2 million (Table 10.10).
10.7 use of pesticides for control of peanut diseases
Peanuts were grown predominantly in the Northern Region, with only a small quantity produced in the Northern Territory (allocated to the Western Region). Fungicides were considered an essential input for production of peanuts. The total expenditure on this crop is estimated at $2.4 million per year. The main expenditure was for foliar fungicides ($1.9 million), with only $0.1 million spent on seed treatment. The costs of fungicide applications to peanut crops averaged $200.92/ha/year, the highest for any pulse crop. Only 9 per cent of the peanut crop did not receive any fungicide (Table 10.11).
10.8 Discussion and ConclusionsDiseases have a high potential to damage peanut crops but are generally controlled at present, with total present losses of $2.7 million or 28.1 per cent of the gross value of production. On average, the current average annual losses from peanut diseases are $222/ha. The five major diseases of peanuts in Australia in order of potential and present losses are:
Rank By potential loss By present loss
1 damping off and seed aflatoxin damping off and seed aflatoxin
2 late leaf spot late leaf spot
3 rust rust
4 early leaf spot Cylindrocladium black rot
5 Cylindrocladium black rot early leaf spot
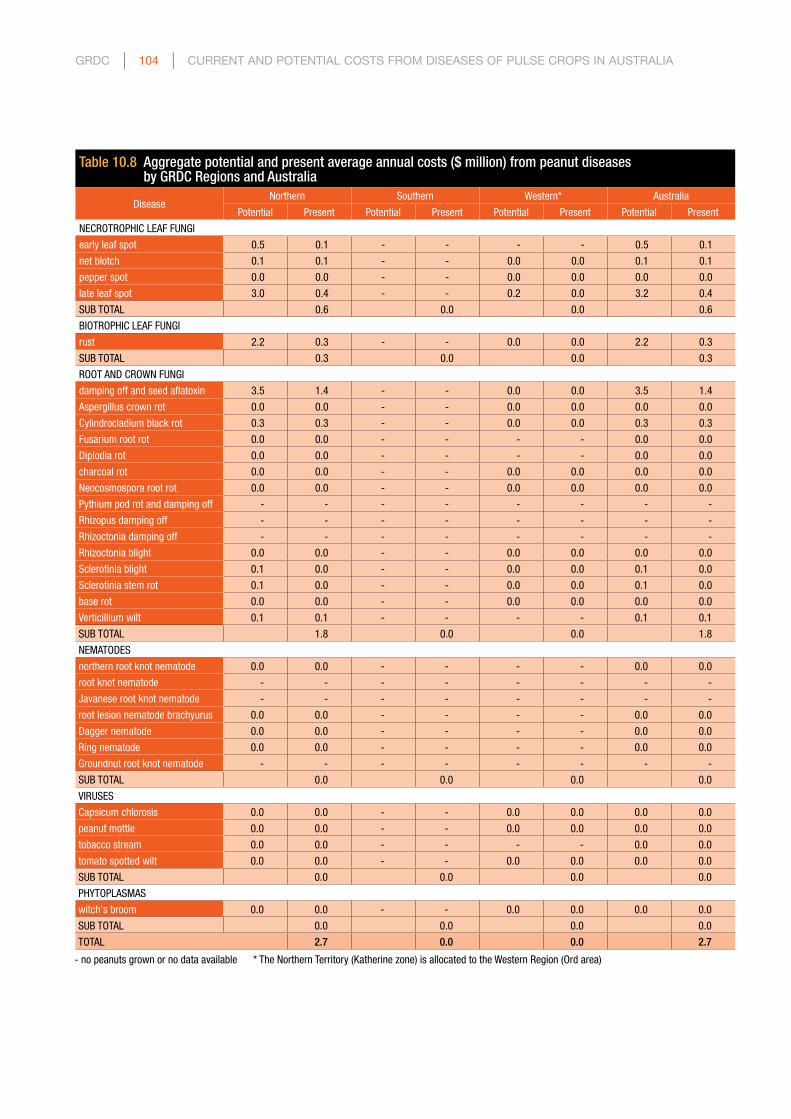
GRDC | 104 | CuRRenT AnD PoTenTiAl CosTs fRoM DiseAses of Pulse CRoPs in AusTRAliA
Table 10.8 Aggregate potential and present average annual costs ($ million) from peanut diseases by GRDC Regions and Australia
DiseaseNorthern Southern Western* Australia
Potential Present Potential Present Potential Present Potential Present
NECROTROPHIC LEAF FUNGI
early leaf spot 0.5 0.1 - - - - 0.5 0.1
net blotch 0.1 0.1 - - 0.0 0.0 0.1 0.1
pepper spot 0.0 0.0 - - 0.0 0.0 0.0 0.0
late leaf spot 3.0 0.4 - - 0.2 0.0 3.2 0.4
SUB TOTAL 0.6 0.0 0.0 0.6
BIOTROPHIC LEAF FUNGI
rust 2.2 0.3 - - 0.0 0.0 2.2 0.3
SUB TOTAL 0.3 0.0 0.0 0.3
ROOT AND CROWN FUNGI
damping off and seed aflatoxin 3.5 1.4 - - 0.0 0.0 3.5 1.4
Aspergillus crown rot 0.0 0.0 - - 0.0 0.0 0.0 0.0
Cylindrocladium black rot 0.3 0.3 - - 0.0 0.0 0.3 0.3
Fusarium root rot 0.0 0.0 - - - - 0.0 0.0
Diplodia rot 0.0 0.0 - - - - 0.0 0.0
charcoal rot 0.0 0.0 - - 0.0 0.0 0.0 0.0
Neocosmospora root rot 0.0 0.0 - - 0.0 0.0 0.0 0.0
Pythium pod rot and damping off - - - - - - - -
Rhizopus damping off - - - - - - - -
Rhizoctonia damping off - - - - - - - -
Rhizoctonia blight 0.0 0.0 - - 0.0 0.0 0.0 0.0
Sclerotinia blight 0.1 0.0 - - 0.0 0.0 0.1 0.0
Sclerotinia stem rot 0.1 0.0 - - 0.0 0.0 0.1 0.0
base rot 0.0 0.0 - - 0.0 0.0 0.0 0.0
Verticillium wilt 0.1 0.1 - - - - 0.1 0.1
SUB TOTAL 1.8 0.0 0.0 1.8
NEMATODES
northern root knot nematode 0.0 0.0 - - - - 0.0 0.0
root knot nematode - - - - - - - -
Javanese root knot nematode - - - - - - - -
root lesion nematode brachyurus 0.0 0.0 - - - - 0.0 0.0
Dagger nematode 0.0 0.0 - - - - 0.0 0.0
Ring nematode 0.0 0.0 - - - - 0.0 0.0
Groundnut root knot nematode - - - - - - - -
SUB TOTAL 0.0 0.0 0.0 0.0
VIRUSES
Capsicum chlorosis 0.0 0.0 - - 0.0 0.0 0.0 0.0
peanut mottle 0.0 0.0 - - 0.0 0.0 0.0 0.0
tobacco stream 0.0 0.0 - - - - 0.0 0.0
tomato spotted wilt 0.0 0.0 - - 0.0 0.0 0.0 0.0
SUB TOTAL 0.0 0.0 0.0 0.0
PHYTOPLASMAS
witch's broom 0.0 0.0 - - 0.0 0.0 0.0 0.0
SUB TOTAL 0.0 0.0 0.0 0.0
TOTAL 2.7 0.0 0.0 2.7
- no peanuts grown or no data available * The Northern Territory (Katherine zone) is allocated to the Western Region (Ord area)
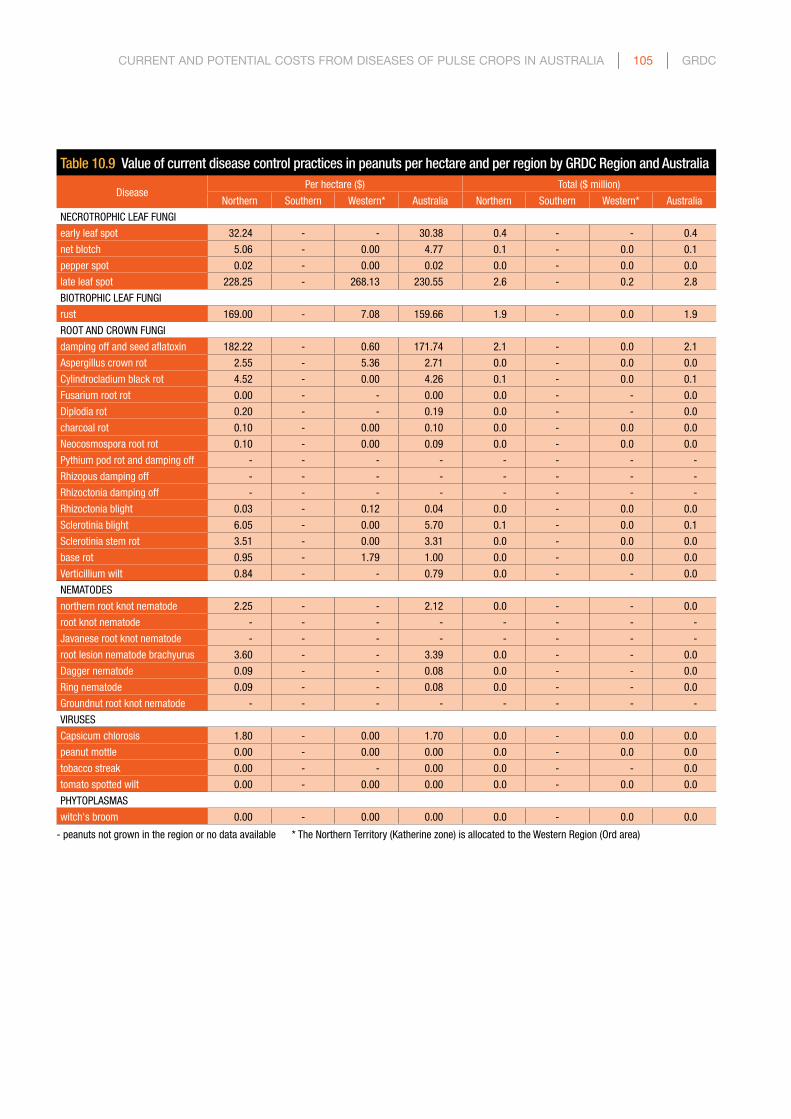
CuRRenT AnD PoTenTiAl CosTs fRoM DiseAses of Pulse CRoPs in AusTRAliA | 105 | GRDC
Table 10.9 Value of current disease control practices in peanuts per hectare and per region by GRDC Region and Australia
DiseasePer hectare ($) Total ($ million)
Northern Southern Western* Australia Northern Southern Western* Australia
NECROTROPHIC LEAF FUNGI
early leaf spot 32.24 - - 30.38 0.4 - - 0.4
net blotch 5.06 - 0.00 4.77 0.1 - 0.0 0.1
pepper spot 0.02 - 0.00 0.02 0.0 - 0.0 0.0
late leaf spot 228.25 - 268.13 230.55 2.6 - 0.2 2.8
BIOTROPHIC LEAF FUNGI
rust 169.00 - 7.08 159.66 1.9 - 0.0 1.9
ROOT AND CROWN FUNGI
damping off and seed aflatoxin 182.22 - 0.60 171.74 2.1 - 0.0 2.1
Aspergillus crown rot 2.55 - 5.36 2.71 0.0 - 0.0 0.0
Cylindrocladium black rot 4.52 - 0.00 4.26 0.1 - 0.0 0.1
Fusarium root rot 0.00 - - 0.00 0.0 - - 0.0
Diplodia rot 0.20 - - 0.19 0.0 - - 0.0
charcoal rot 0.10 - 0.00 0.10 0.0 - 0.0 0.0
Neocosmospora root rot 0.10 - 0.00 0.09 0.0 - 0.0 0.0
Pythium pod rot and damping off - - - - - - - -
Rhizopus damping off - - - - - - - -
Rhizoctonia damping off - - - - - - - -
Rhizoctonia blight 0.03 - 0.12 0.04 0.0 - 0.0 0.0
Sclerotinia blight 6.05 - 0.00 5.70 0.1 - 0.0 0.1
Sclerotinia stem rot 3.51 - 0.00 3.31 0.0 - 0.0 0.0
base rot 0.95 - 1.79 1.00 0.0 - 0.0 0.0
Verticillium wilt 0.84 - - 0.79 0.0 - - 0.0
NEMATODES
northern root knot nematode 2.25 - - 2.12 0.0 - - 0.0
root knot nematode - - - - - - - -
Javanese root knot nematode - - - - - - - -
root lesion nematode brachyurus 3.60 - - 3.39 0.0 - - 0.0
Dagger nematode 0.09 - - 0.08 0.0 - - 0.0
Ring nematode 0.09 - - 0.08 0.0 - - 0.0
Groundnut root knot nematode - - - - - - - -
VIRUSES
Capsicum chlorosis 1.80 - 0.00 1.70 0.0 - 0.0 0.0
peanut mottle 0.00 - 0.00 0.00 0.0 - 0.0 0.0
tobacco streak 0.00 - - 0.00 0.0 - - 0.0
tomato spotted wilt 0.00 - 0.00 0.00 0.0 - 0.0 0.0
PHYTOPLASMAS
witch's broom 0.00 - 0.00 0.00 0.0 - 0.0 0.0
- peanuts not grown in the region or no data available * The Northern Territory (Katherine zone) is allocated to the Western Region (Ord area)

GRDC | 106 | CuRRenT AnD PoTenTiAl CosTs fRoM DiseAses of Pulse CRoPs in AusTRAliA
Table 10.10 Value of different forms of peanut disease control in Australia
DiseaseCost/value ($ million) Contribution (%) Contribution ($ million)
Potential Present Control Breeding Cultural Pesticide Breeding Cultural Pesticide
NECROTROPHIC LEAF FUNGI
early leaf spot 0.5 0.1 0.4 10 45 45 0.0 0.2 0.2
net blotch 0.1 0.1 0.1 5 50 45 0.0 0.0 0.0
pepper spot 0.0 0.0 0.0 5 50 45 0.0 0.0 0.0
late leaf spot 3.2 0.4 2.8 13 34 52 0.4 1.0 1.5
BIOTROPHIC LEAF FUNGI
rust 2.2 0.3 1.9 17 33 49 0.3 0.6 1.0
ROOT AND CROWN FUNGI
damping off and seed aflatoxin 3.5 1.4 2.1 0 100 0 0.0 2.1 0.0
Aspergillus crown rot 0.0 0.0 0.0 0 0 100 0.0 0.0 0.0
Cylindrocladium black rot 0.3 0.3 0.1 90 10 0 0.0 0.0 0.0
Fusarium root rot 0.0 0.0 0.0 0.0 0.0 0.0
Diplodia rot 0.0 0.0 0.0 0 100 0 0.0 0.0 0.0
charcoal rot 0.0 0.0 0.0 0 100 0 0.0 0.0 0.0
Neocosmospora root rot 0.0 0.0 0.0 0 100 0 0.0 0.0 0.0
Pythium pod rot and damping off - - - - - -
Rhizopus damping off - - - - - -
Rhizoctonia damping off - - - - - -
Rhizoctonia blight 0.0 0.0 0.0 0 20 80 0.0 0.0 0.0
Sclerotinia blight 0.1 0.0 0.1 0 75 25 0.0 0.1 0.0
Sclerotinia stem rot 0.1 0.0 0.0 0 47 53 0.0 0.0 0.0
base rot 0.0 0.0 0.0 0 30 70 0.0 0.0 0.0
Verticillium wilt 0.1 0.1 0.0 0 100 0 0.0 0.0 0.0
NEMATODES
northern root knot nematode 0.0 0.0 0.0 0 100 0 0.0 0.0 0.0
root knot nematode - - - - - -
Javanese root knot nematode - - - - - -
root lesion nematode brachyurus 0.0 0.0 0.0 0 100 0 0.0 0.0 0.0
Dagger nematode 0.0 0.0 0.0 0 100 0 0.0 0.0 0.0
Ring nematode 0.0 0.0 0.0 0 100 0 0.0 0.0 0.0
Groundnut root knot nematode - - - - - -
VIRUSES
Capsicum chlorosis 0.0 0.0 0.0 0 100 0 0.0 0.0 0.0
peanut mottle 0.0 0.0 0.0 0.0 0.0 0.0
tobacco stream 0.0 0.0 0.0 0.0 0.0 0.0
tomato spotted wilt 0.0 0.0 0.0 0.0 0.0 0.0
PHYTOPLASMAS
witch's broom 0.0 0.0 0.0 0.0 0.0 0.0
- no data available
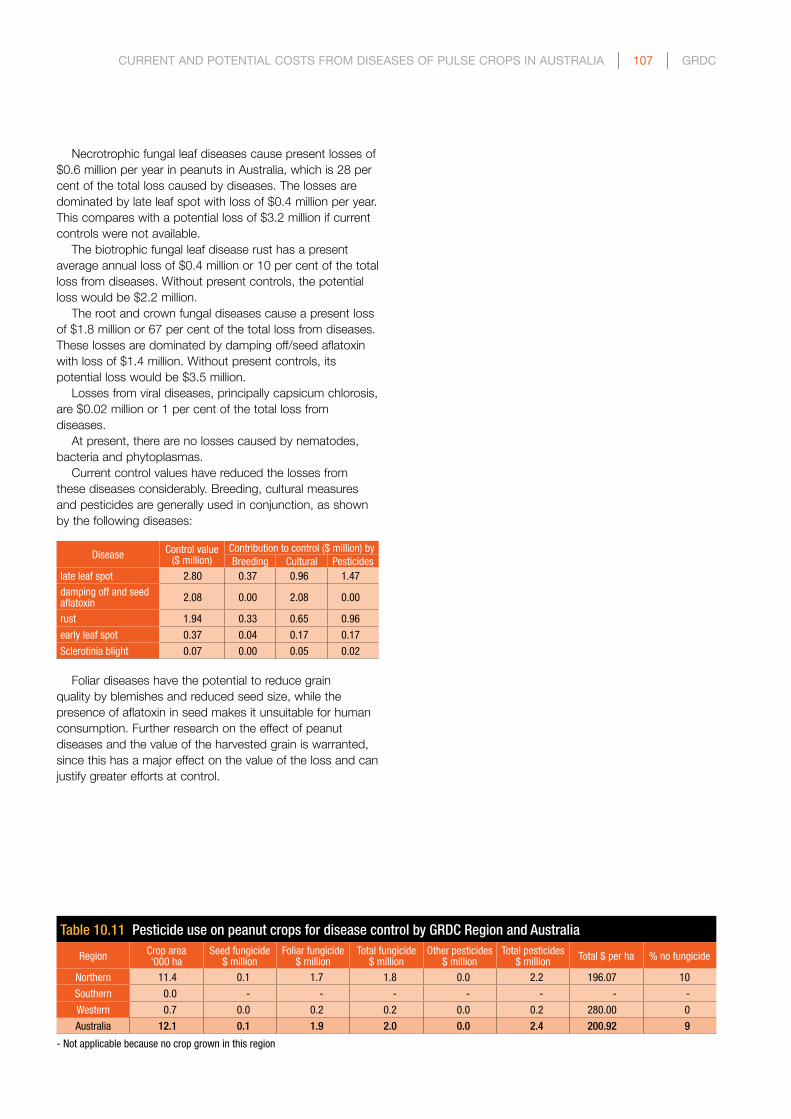
CuRRenT AnD PoTenTiAl CosTs fRoM DiseAses of Pulse CRoPs in AusTRAliA | 107 | GRDC
Table 10.11 Pesticide use on peanut crops for disease control by GRDC Region and Australia
Region Crop area‘000 ha
Seed fungicide$ million
Foliar fungicide$ million
Total fungicide$ million
Other pesticides$ million
Total pesticides$ million Total $ per ha % no fungicide
Northern 11.4 0.1 1.7 1.8 0.0 2.2 196.07 10
Southern 0.0 - - - - - - -
Western 0.7 0.0 0.2 0.2 0.0 0.2 280.00 0
Australia 12.1 0.1 1.9 2.0 0.0 2.4 200.92 9
- Not applicable because no crop grown in this region
Necrotrophic fungal leaf diseases cause present losses of $0.6 million per year in peanuts in Australia, which is 28 per cent of the total loss caused by diseases. The losses are dominated by late leaf spot with loss of $0.4 million per year. This compares with a potential loss of $3.2 million if current controls were not available.
The biotrophic fungal leaf disease rust has a present average annual loss of $0.4 million or 10 per cent of the total loss from diseases. Without present controls, the potential loss would be $2.2 million.
The root and crown fungal diseases cause a present loss of $1.8 million or 67 per cent of the total loss from diseases. These losses are dominated by damping off/seed aflatoxin with loss of $1.4 million. Without present controls, its potential loss would be $3.5 million.
Losses from viral diseases, principally capsicum chlorosis, are $0.02 million or 1 per cent of the total loss from diseases.
At present, there are no losses caused by nematodes, bacteria and phytoplasmas.
Current control values have reduced the losses from these diseases considerably. Breeding, cultural measures and pesticides are generally used in conjunction, as shown by the following diseases:
Disease Control value ($ million)
Contribution to control ($ million) byBreeding Cultural Pesticides
late leaf spot 2.80 0.37 0.96 1.47
damping off and seed aflatoxin 2.08 0.00 2.08 0.00
rust 1.94 0.33 0.65 0.96
early leaf spot 0.37 0.04 0.17 0.17
Sclerotinia blight 0.07 0.00 0.05 0.02
Foliar diseases have the potential to reduce grain quality by blemishes and reduced seed size, while the presence of aflatoxin in seed makes it unsuitable for human consumption. Further research on the effect of peanut diseases and the value of the harvested grain is warranted, since this has a major effect on the value of the loss and can justify greater efforts at control.

GRDC | 108 | CuRRenT AnD PoTenTiAl CosTs fRoM DiseAses of Pulse CRoPs in AusTRAliA
11.1 introductionMungbeans are grown to a large extent in Queensland and northern New South Wales. There are two species, green (Vigna radiata) and black (Vigna mungo), both of which can be used for human consumption. The crop is sown in winter and harvested in late spring.
This section contains:n average area, production, yield and value of mungbeans
over a recent five-year period;n a list of the diseases of mungbeans that were considered;n the incidence and severity of the diseases in each
production area;n the potential and present yield loss as a percentage of
yield, effect on quality and the value of this loss;n overall control methods and their value for each disease;
andn the present level of expenditure on fungicides on the crop.
11.2 Mungbean productionEstimation of the value of disease losses depends on base data on the area, yield and value of the crop. The production data for mungbeans are for the year 2008-09. The average data for the five years ending in that year were calculated as representative of current production. Mungbean production data were obtained from Pulse Australia.
The average area, yield, production and value of mungbeans in each agro-ecological zone are shown in Table 11.1 (see Appendix A for more detail). For the period 2004-05 to 2008-09, the average annual area of mungbeans sown in Australia was 40,000 hectares producing an average of 50,000 tonnes, with an overall average yield of 1.25t/ha.
The mean unit value of mungbeans over the five-year period was $294/t, giving an average gross value of production of $32.5 million per year.
Mungbean production was mostly in the Northern Region with 90 per cent of the crop area, with 10 per cent of the crop area in the Southern Region and none in the Western Region.
11 CuRRenT AnD PoTenTiAl losses fRoM DiseAses of MunGBeAns
Table 11.1 Mean mungbean area, yield, production and value by agro-ecological zone and GRDC region, 2004-05 to 2008-09
Area (‘000 ha) Yield (t/ha) Production (‘000 t) Gross value ($ million)
Queensland Burdekin 0.8 1.25 1.0 0.7
Queensland Atherton 0.0 0.00 0.0 0.0
Queensland Central* 10.4 1.35 14.0 9.1
NSW North-East/Queensland South-East* 20.0 1.25 25.0 16.3
NSW North-West/Queensland South-West* 4.8 1.04 5.0 3.3
TOTAL NORTHERN REGION 36.0 1.25 45.0 29.3
NSW Central 4.0 1.25 5.0 3.3
NSW–Victoria Slopes 0.0 0.00 0.0 0.0
Victoria High Rainfall 0.0 0.00 0.0 0.0
SA–Victoria Mallee 0.0 0.00 0.0 0.0
SA–Victoria Border–Wimmera 0.0 0.00 0.0 0.0
SA Mid-North/Lower Yorke, Eyre 0.0 0.00 0.0 0.0
Tasmania Grain Growing 0.0 0.00 0.0 0.0
TOTAL SOUTHERN REGION 4.0 1.25 5.0 3.3
WA Northern 0.0 0.00 0.0 0.0
WA Central 0.0 0.00 0.0 0.0
WA Eastern 0.0 0.00 0.0 0.0
WA Sandplain–Mallee 0.0 0.00 0.0 0.0
WA Ord 0.0 0.00 0.0 0.0
Northern Territory Central (Katherine) 0.0 0.00 0.0 0.0
TOTAL WESTERN REGION 0.0 0.00 0.0 0.0
TOTAL AUSTRALIA 40.0 1.25 50.0 32.5* Disease data obtained for this zone

CuRRenT AnD PoTenTiAl CosTs fRoM DiseAses of Pulse CRoPs in AusTRAliA | 109 | GRDC
11.3 Diseases of mungbeans11.3.1 Mungbean diseases and their pathogensThere were 19 diseases of mungbeans considered in this survey, comprising two necrotrophic leaf fungal diseases, one biotrophic leaf disease, seven root and crown fungal diseases, two nematode diseases, three bacterial diseases, three viral diseases and one phytoplasma disease (Table 11.2). These diseases were caused by 10 fungi, two nematodes, three bacteria, three viruses and one phytoplasma.
Because several species of the Pratylenchus nematodes attack crops and pastures, the species named ‘thornei’ was added to the common name ‘root lesion nematode’ for clarity.
Data on disease incidence, severity and control measures were obtained for three of the four zones in the Northern Region, which was 98 per cent of the mungbean area in the region. No data were obtained from the zones in the Southern Region, which had 10 per cent of the Australian mungbean area. There was no production in the Western Region (Table 11.1). Disease information and the respondents for each zone are in Appendix B.
11.3.2 Distribution of the pathogens in AustraliaFifteen of the 19 diseases surveyed were reported as present in the Northern Region: one necrotrophic fungal disease, one biotrophic fungal disease, six root and crown fungal diseases, one nematode, three bacterial, two viral and one phytoplasma disease (Table 11.2).
No assessments were made for the small area of mungbeans in the Southern Region and no mungbeans were grown in the Western Region.
Table 11.2 Mungbean diseases in this survey, their pathogens and their presencea in the GRDC Regions and AustraliaPathogen Disease Northern Southern Western Australia
NECROTROPHIC LEAF FUNGI
Alternaria sp. Alternaria leaf spot Y - - Y
Cercospora canescens Cercospora leaf spot U - - U
BIOTROPHIC LEAF FUNGI
Podosphaera fusca powdery mildew Y - - Y
ROOT AND CROWN FUNGI
Fusarium oxysporum Fusarium root rot Y - - Y
Macrophomina phaseolina charcoal rot Y - - Y
Pythium sp. Pythium root rot Y - - Y
Rhizoctonia sp. Rhizoctonia root rot Y - - Y
Sclerotinia sclerotiorum Sclerotinia stem rot N - - N
Sclerotium rolfsii basal rot Y - - Y
Sclerotinia minor Sclerotinia crown rot Y - - Y
NEMATODES
Meloidogyne javanica root knot nematode N - - N
Pratylenchus thornei root lesion nematode thornei Y - - Y
BACTERIA
Curtobacterium flaccumfaciens pv. flaccumfaciens leaf scorch Y - - Y
Pseudomonas syringae pv. phaseolicola halo blight Y - - Y
Xanthomonas axonopodis pv. phaseoli bacterial blight Y - - Y
VIRUSES
Alfalfa mosaic virus alfalfa mosaic Y - - Y
Bean common mosaic virus bean common mosaic Y - - Y
Tobacco streak virus tobacco streak N - - N
PHYTOPLASMAS
Tomato big bud phytoplasma big bud Y - - Y
a Y= present in region N = not recorded in region U = unknown status - no mungbeans grown or no data available

GRDC | 110 | CuRRenT AnD PoTenTiAl CosTs fRoM DiseAses of Pulse CRoPs in AusTRAliA
Table 11.3 Incidence of mungbean diseases as a proportion of years when disease occurs (%) and as a proportion of the crop area affected when the disease develops (%) in the GRDC Regions and Australia
DiseaseNorthern Southern Western Australia
Years Area Years Area Years Area Years Area
NECROTROPHIC LEAF FUNGI
Alternaria leaf spot 2.8 0.6 - - - - 2.8 0.6
Cercospora leaf spot - - - - - - - -
BIOTROPHIC LEAF FUNGI
powdery mildew 56.8 28.4 - - - - 56.8 28.4
ROOT AND CROWN FUNGI
Fusarium root rot 5.7 0.6 - - - - 5.7 0.6
charcoal rot 28.4 5.7 - - - - 28.4 5.7
Pythium root rot 5.7 0.6 - - - - 5.7 0.6
Rhizoctonia root rot 5.7 0.6 - - - - 5.7 0.6
Sclerotinia stem rot 0.0 0.0 - - - - 0.0 0.0
basal rot 11.4 0.6 - - - - 11.4 0.6
Sclerotinia crown rot 5.7 0.6 - - - - 5.7 0.6
NEMATODES
root knot nematode 0.0 0.0 - - - - 0.0 0.0
root lesion nematode thornei 100.0 42.1 - - - - 100.0 42.1
BACTERIA
leaf scorch 56.8 5.7 - - - - 56.8 5.7
halo blight 56.8 11.4 - - - - 56.8 11.4
bacterial blight 28.4 2.8 - - - - 28.4 2.8
VIRUSES
alfalfa mosaic 28.4 0.6 - - - - 28.4 0.6
bean common mosaic 28.4 0.6 - - - - 28.4 0.6
tobacco streak 0.0 0.0 - - - - 0.0 0.0
PHYTOPLASMAS
big bud 56.8 0.6 - - - - 56.8 0.6
- no crop grown or no data available
11.4 incidence and severity of mungbean diseases
11.4.1 incidence of mungbean diseasesIncidence was assessed as the proportion of years that favoured development of the disease in each zone, and as the proportion of the crop area in the zone affected when the disease developed. These values were averaged for the region by weighting the area sown to the crop in each zone for which disease data were available, and are shown in Table 11.3. As no disease assessments were made in the Southern Region, the values calculated for the Northern Region are also the estimates for Australia.
Within the Northern Region, there were nine diseases that occurred with a yearly incidence of 25 per cent or greater. Root lesion nematode thornei occurred every year with powdery mildew, leaf scorch, halo blight and big bud the next most common. Two diseases occurred over 25 per cent of the crop area in years favourable for their development. The highest was root lesion nematode thornei followed by powdery mildew, halo blight, charcoal rot and leaf scorch.
11.4.2 severity of mungbean diseasesSeverity was assessed as the percentage yield loss that occurred in affected crops in the zone in years favourable for development of the disease. Two assessments were made. The first was the potential severity, that is, the severity that would occur if current controls were not applied. The second was the present severity, when current controls are in place. These assessments were made at the zone level and aggregated to the region by weighting as in 11.4.1 (Table 11.4). Assessments were only made for zones in the Northern Region.
In the Northern Region, four diseases had potential severity of more than 10 per cent yield loss in years when they developed. The highest was root lesion nematode thornei (34 per cent) followed by Fusarium root rot, leaf scorch and halo blight. Fusarium root rot had the highest present yield loss of 11 per cent, followed by halo blight, root lesion nematode thornei and leaf scorch.

CuRRenT AnD PoTenTiAl CosTs fRoM DiseAses of Pulse CRoPs in AusTRAliA | 111 | GRDC
11.5 losses from mungbean diseases11.5.1 Potential and present percentage yield
lossesThe average annual yield loss was calculated from the incidence and severity data (see Section 2.5 for the method). The potential severity was used to calculate the potential losses if current controls were not used and the present severity to calculate present losses with current control measures. Assessments were only made for the Northern Region for mungbeans.
In the Northern Region, one disease, root lesion nematode thornei, had a potential average annual yield loss of more than 10 per cent. It was followed by powdery mildew, halo blight and leaf scorch. With current disease controls, root lesion nematode thornei was the highest with 2 per cent present average annual loss, followed by halo blight and leaf scorch (Table 11.5).
Total present average annual loss from all diseases was 4.9 per cent. Nematodes caused a present average annual loss of 2.4 per cent, bacteria 2.3 per cent and root and crown fungi 0.2 per cent. There were no present losses from necrotrophic and biotrophic leaf fungi, viruses and phytoplasmas (Table 11.5)
11.5.2 Quality effects of diseases on mungbeansMungbeans are grown for human consumption. There are high standards for appearance so any diseases that reduce appearance, reduce the value of the grain. There is a nil tolerance for charcoal rot (presumably caused by Macrophomina phaseoli) but this disease was not considered in this report. No diseases were identified as causing quality loss in mungbeans.
11.5.3 Value of losses from mungbean diseasesThe value of these yield losses was calculated by relating the percentage losses to the gross value of mungbean production in each zone, using the average value of mungbeans, over a five-year period (see Section 11.2). These losses were calculated on a per hectare basis and on an aggregate basis for each zone, then for each GRDC region and nationally. Assessments were only made for the Northern Region for mungbeans so estimates for this region are also the estimates for Australia.
The potential losses estimated for each disease are in Table 11.6 ($ per hectare) and Table 11.7 (aggregate losses). For the Northern Region, the five major diseases by potential
Table 11.4 Potential and present severity of mungbean diseases (% yield loss in years suitable for disease development) in the GRDC Regions and Australia
DiseaseNorthern Southern Western Australia
Potential Present Potential Present Potential Present Potential Present
NECROTROPHIC LEAF FUNGI
Alternaria leaf spot 0.0 0.0 - - - - 0.0 0.0
Cercospora leaf spot - - - - - - - -
BIOTROPHIC LEAF FUNGI
powdery mildew 5.7 0.0 - - - - 5.7 0.0
ROOT AND CROWN FUNGI
Fusarium root rot 11.4 11.4 - - - - 11.4 11.4
charcoal rot 5.7 2.8 - - - - 5.7 2.8
Pythium root rot 0.0 0.0 - - - - 0.0 0.0
Rhizoctonia root rot 0.0 0.0 - - - - 0.0 0.0
Sclerotinia stem rot 0.0 0.0 - - - - 0.0 0.0
basal rot 0.0 0.0 - - - - 0.0 0.0
Sclerotinia crown rot 5.7 2.8 - - - - 5.7 2.8
NEMATODES
root knot nematode 0.0 0.0 - - - - 0.0 0.0
root lesion nematode thornei 33.6 5.7 - - - - 33.6 5.7
BACTERIA
leaf scorch 11.4 5.7 - - - - 11.4 5.7
halo blight 11.4 8.5 - - - - 11.4 8.5
bacterial blight 5.7 2.8 - - - - 5.7 2.8
VIRUSES
alfalfa mosaic 0.6 0.6 - - - - 0.6 0.6
bean common mosaic 0.6 0.6 - - - - 0.6 0.6
tobacco streak 0.0 0.0 - - - - 0.0 0.0
PHYTOPLASMAS
big bud 0.6 0.6 - - - - 0.6 0.6
- no crop grown or no data available
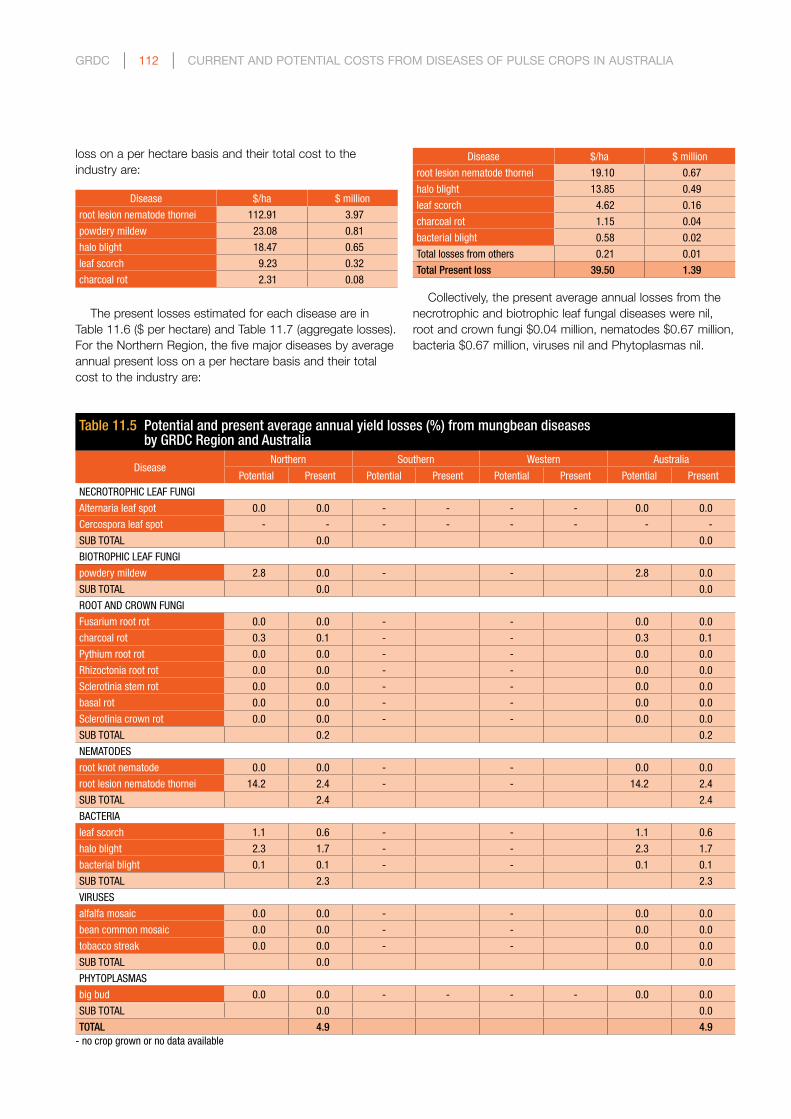
GRDC | 112 | CuRRenT AnD PoTenTiAl CosTs fRoM DiseAses of Pulse CRoPs in AusTRAliA
Table 11.5 Potential and present average annual yield losses (%) from mungbean diseases by GRDC Region and Australia
DiseaseNorthern Southern Western Australia
Potential Present Potential Present Potential Present Potential Present
NECROTROPHIC LEAF FUNGI
Alternaria leaf spot 0.0 0.0 - - - - 0.0 0.0
Cercospora leaf spot - - - - - - - -
SUB TOTAL 0.0 0.0
BIOTROPHIC LEAF FUNGI
powdery mildew 2.8 0.0 - - 2.8 0.0
SUB TOTAL 0.0 0.0
ROOT AND CROWN FUNGI
Fusarium root rot 0.0 0.0 - - 0.0 0.0
charcoal rot 0.3 0.1 - - 0.3 0.1
Pythium root rot 0.0 0.0 - - 0.0 0.0
Rhizoctonia root rot 0.0 0.0 - - 0.0 0.0
Sclerotinia stem rot 0.0 0.0 - - 0.0 0.0
basal rot 0.0 0.0 - - 0.0 0.0
Sclerotinia crown rot 0.0 0.0 - - 0.0 0.0
SUB TOTAL 0.2 0.2
NEMATODES
root knot nematode 0.0 0.0 - - 0.0 0.0
root lesion nematode thornei 14.2 2.4 - - 14.2 2.4
SUB TOTAL 2.4 2.4
BACTERIA
leaf scorch 1.1 0.6 - - 1.1 0.6
halo blight 2.3 1.7 - - 2.3 1.7
bacterial blight 0.1 0.1 - - 0.1 0.1
SUB TOTAL 2.3 2.3
VIRUSES
alfalfa mosaic 0.0 0.0 - - 0.0 0.0
bean common mosaic 0.0 0.0 - - 0.0 0.0
tobacco streak 0.0 0.0 - - 0.0 0.0
SUB TOTAL 0.0 0.0
PHYTOPLASMAS
big bud 0.0 0.0 - - - - 0.0 0.0
SUB TOTAL 0.0 0.0
TOTAL 4.9 4.9- no crop grown or no data available
loss on a per hectare basis and their total cost to the industry are:
Disease $/ha $ million
root lesion nematode thornei 112.91 3.97
powdery mildew 23.08 0.81
halo blight 18.47 0.65
leaf scorch 9.23 0.32
charcoal rot 2.31 0.08
The present losses estimated for each disease are in Table 11.6 ($ per hectare) and Table 11.7 (aggregate losses). For the Northern Region, the five major diseases by average annual present loss on a per hectare basis and their total cost to the industry are:
Disease $/ha $ million
root lesion nematode thornei 19.10 0.67
halo blight 13.85 0.49
leaf scorch 4.62 0.16
charcoal rot 1.15 0.04
bacterial blight 0.58 0.02
Total losses from others 0.21 0.01
Total Present loss 39.50 1.39
Collectively, the present average annual losses from the necrotrophic and biotrophic leaf fungal diseases were nil, root and crown fungi $0.04 million, nematodes $0.67 million, bacteria $0.67 million, viruses nil and Phytoplasmas nil.

CuRRenT AnD PoTenTiAl CosTs fRoM DiseAses of Pulse CRoPs in AusTRAliA | 113 | GRDC
Table 11.6 Potential and present average annual costs ($/ha) from mungbean diseases by GRDC Region and Australia
DiseaseNorthern Southern Western Australia
Potential Present Potential Present Potential Present Potential Present
NECROTROPHIC LEAF FUNGI
Alternaria leaf spot 0.00 0.00 - - - - 0.00 0.00
Cercospora leaf spot - - - - - - - -
SUB TOTAL 0.00 0.0
BIOTROPHIC LEAF FUNGI
powdery mildew 23.08 0.00 - - - - 23.08 0.00
SUB TOTAL 0.00 0.00
ROOT AND CROWN FUNGI
Fusarium root rot 0.09 0.09 - - - - 0.09 0.09
charcoal rot 2.31 1.15 - - - - 2.31 1.15
Pythium root rot 0.00 0.00 - - - - 0.00 0.00
Rhizoctonia root rot 0.00 0.00 - - - - 0.00 0.00
Sclerotinia stem rot 0.00 0.00 - - - - 0.00 0.00
basal rot 0.00 0.00 - - - - 0.00 0.00
Sclerotinia crown rot 0.05 0.02 - - - - 0.05 0.02
SUB TOTAL 1.27 1.27
NEMATODES
root knot nematode 0.00 0.00 - - - - 0.00 0.00
root lesion nematode thornei 112.91 19.10 - - - - 112.91 19.10
SUB TOTAL 19.10 19.10
BACTERIA
leaf scorch 9.23 4.62 - - - - 9.23 4.62
halo blight 18.47 13.85 - - - - 18.47 13.85
bacterial blight 1.15 0.58 - - - - 1.15 0.58
SUB TOTAL 19.04 19.04
VIRUSES
alfalfa mosaic 0.02 0.02 - - - - 0.02 0.02
bean common mosaic 0.02 0.02 - - - - 0.02 0.02
tobacco streak 0.00 0.00 - - - - 0.00 0.00
SUB TOTAL 0.05 0.05
PHYTOPLASMAS
big bud 0.05 0.05 - - - - 0.05 0.05
SUB TOTAL 0.05 0.05
TOTAL 39.50 39.50- no crop grown or no data available
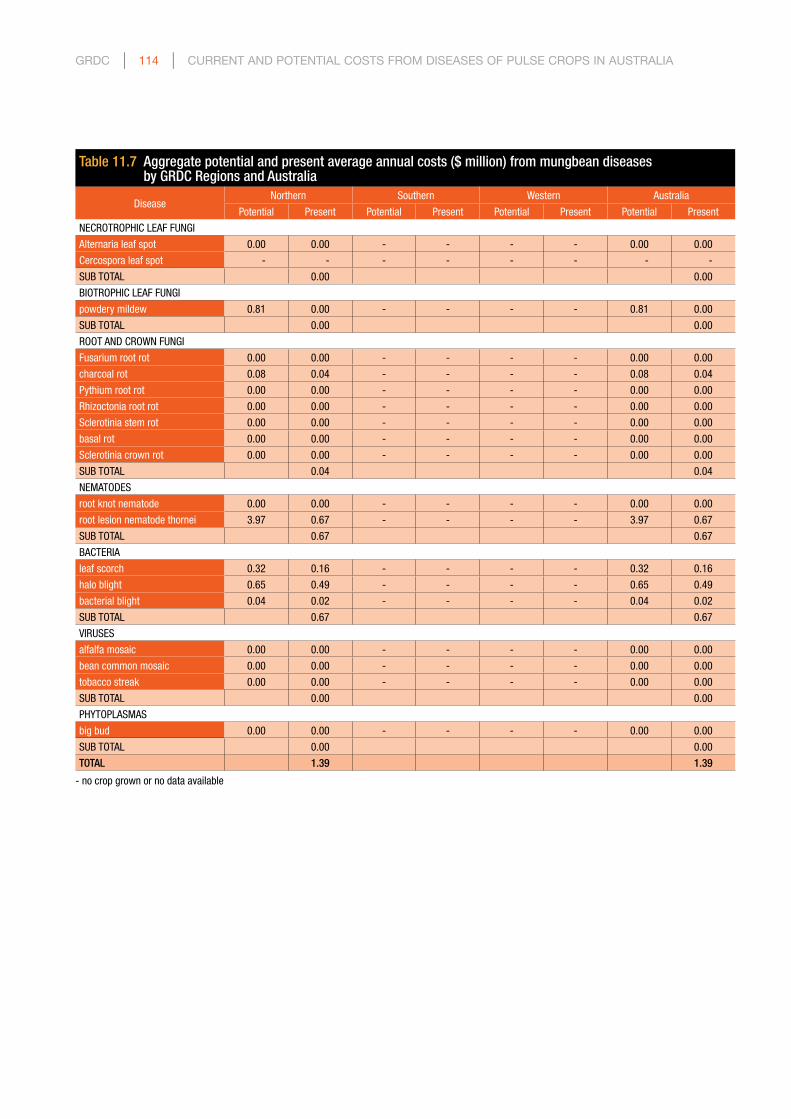
GRDC | 114 | CuRRenT AnD PoTenTiAl CosTs fRoM DiseAses of Pulse CRoPs in AusTRAliA
Table 11.7 Aggregate potential and present average annual costs ($ million) from mungbean diseases by GRDC Regions and Australia
DiseaseNorthern Southern Western Australia
Potential Present Potential Present Potential Present Potential Present
NECROTROPHIC LEAF FUNGI
Alternaria leaf spot 0.00 0.00 - - - - 0.00 0.00
Cercospora leaf spot - - - - - - - -
SUB TOTAL 0.00 0.00
BIOTROPHIC LEAF FUNGI
powdery mildew 0.81 0.00 - - - - 0.81 0.00
SUB TOTAL 0.00 0.00
ROOT AND CROWN FUNGI
Fusarium root rot 0.00 0.00 - - - - 0.00 0.00
charcoal rot 0.08 0.04 - - - - 0.08 0.04
Pythium root rot 0.00 0.00 - - - - 0.00 0.00
Rhizoctonia root rot 0.00 0.00 - - - - 0.00 0.00
Sclerotinia stem rot 0.00 0.00 - - - - 0.00 0.00
basal rot 0.00 0.00 - - - - 0.00 0.00
Sclerotinia crown rot 0.00 0.00 - - - - 0.00 0.00
SUB TOTAL 0.04 0.04
NEMATODES
root knot nematode 0.00 0.00 - - - - 0.00 0.00
root lesion nematode thornei 3.97 0.67 - - - - 3.97 0.67
SUB TOTAL 0.67 0.67
BACTERIA
leaf scorch 0.32 0.16 - - - - 0.32 0.16
halo blight 0.65 0.49 - - - - 0.65 0.49
bacterial blight 0.04 0.02 - - - - 0.04 0.02
SUB TOTAL 0.67 0.67
VIRUSES
alfalfa mosaic 0.00 0.00 - - - - 0.00 0.00
bean common mosaic 0.00 0.00 - - - - 0.00 0.00
tobacco streak 0.00 0.00 - - - - 0.00 0.00
SUB TOTAL 0.00 0.00
PHYTOPLASMAS
big bud 0.00 0.00 - - - - 0.00 0.00
SUB TOTAL 0.00 0.00
TOTAL 1.39 1.39
- no crop grown or no data available

CuRRenT AnD PoTenTiAl CosTs fRoM DiseAses of Pulse CRoPs in AusTRAliA | 115 | GRDC
11.6 Value of control of mungbean diseases
The value of present controls of mungbean diseases is the difference between the potential average annual loss when current control practices were not in place and the present average annual loss with current controls in place. Estimates of the value of control for each disease surveyed on a per hectare basis and the total value for the Northern Region and Australia are in Table 11.8.
In the Northern Region, the highest control value was for root lesion nematode thornei ($3.3 million), followed by powdery mildew ($0.8 million), and leaf scorch and halo blight (each $0.2 million). Because the production of mungbeans is small relative to other pulses, the national values for control are small. However, on a per hectare basis, the value of control is high for some diseases. In the Northern Region, the control of root lesion nematode thornei is worth $93.81/ha and powdery mildew control is worth $23.08/ha (Table 11.8).
For the survey, control measures were grouped in three broad categories: breeding (resistant cultivars); cultural practices including stubble management, tillage and crop rotation; and pesticides, including fungicides applied to the seed, in fertilisers and by spraying, and insecticides to control vectors. The proportion of control contributed by
Table 11.8 Value of current disease control practices in mungbeans per hectare and by GRDC Region and Australia
DiseasePer hectare ($) Total ($ million)
Northern Southern Western Australia Northern Southern Western Australia
NECROTROPHIC LEAF FUNGI
Alternaria leaf spot 0.00 - - 0.00 0.00 - - 0.00
Cercospora leaf spot - - - - - - - -
BIOTROPHIC LEAF FUNGI
powdery mildew 23.08 - - 23.08 0.81 - - 0.81
ROOT AND CROWN FUNGI
Fusarium root rot 0.00 - - 0.00 0.00 - - 0.00
charcoal rot 1.15 - - 1.15 0.04 - - 0.04
Pythium root rot 0.00 - - 0.00 0.00 - - 0.00
Rhizoctonia root rot 0.00 - - 0.00 0.00 - - 0.00
Sclerotinia stem rot 0.00 - - 0.00 0.00 - - 0.00
basal rot 0.00 - - 0.00 0.00 - - 0.00
Sclerotinia crown rot 0.02 - - 0.02 0.00 - - 0.00
NEMATODES
root knot nematode 0.00 - - 0.00 0.00 - - 0.00
root lesion nematode thornei 93.81 - - 93.81 3.30 - - 3.30
BACTERIA
leaf scorch 4.62 - - 4.62 0.16 - - 0.16
halo blight 4.62 - - 4.62 0.16 - - 0.16
bacterial blight 0.58 - - 0.58 0.02 - - 0.02
VIRUSES
alfalfa mosaic 0.00 - - 0.00 0.00 - - 0.00
bean common mosaic 0.00 - - 0.00 0.00 - - 0.00
tobacco streak 0.00 - - 0.00 0.00 - - 0.00
PHYTOPLASMAS
big bud 0.00 - - 0.00 0.00 - - 0.00
- no crop grown or no data available
each category and its value are in Table 11.9.Breeding and the use of genetic resistance provided 50
per cent or more of the control of four diseases. The top four control values from breeding were $2.0 million for root lesion nematode thornei, $0.6 million for powdery mildew, and $0.1 million for leaf scorch and halo blight (Table 11.9).
Cultural practices contributed 50 per cent or more of the control for four diseases and more than 25 per cent for another one. The top control values from cultural methods were $1.3 million for root lesion nematode thornei and $0.1 million for halo blight (Table 11.9).
Pesticides, mainly fungicides, contributed 25 per cent of the control for powdery mildew and were worth $0.2 million (Table 11.9).
11.7 use of pesticides for control of mungbean diseases
No data were obtained in the survey on pesticide use on mungbean crops.
11.8 Discussion and ConclusionsDiseases have a high potential to damage mungbean crops but are well controlled at present, with total present losses of $1.4 million or 4.4 per cent of the gross value of production.

GRDC | 116 | CuRRenT AnD PoTenTiAl CosTs fRoM DiseAses of Pulse CRoPs in AusTRAliA
Table 11.9 Value of different forms of mungbean disease control in Australia
DiseaseCost/value ($ million) Contribution (per cent) Contribution ($ million)
Potential Present Control Breeding Cultural Pesticide Breeding Cultural Pesticide
NECROTROPHIC LEAF FUNGI
Alternaria leaf spot 0.0 0.0 0.0 0.0 0.0 0.0
Cercospora leaf spot - - - - - -
BIOTROPHIC LEAF FUNGI
powdery mildew 0.8 0.0 0.8 75 0 25 0.6 0.0 0.2
ROOT AND CROWN FUNGI
Fusarium root rot 0.0 0.0 0.0 0.0 0.0 0.0
charcoal rot 0.1 0.0 0.0 0 100 0 0.0 0.0 0.0
Pythium root rot 0.0 0.0 0.0 0.0 0.0 0.0
Rhizoctonia root rot 0.0 0.0 0.0 0.0 0.0 0.0
Sclerotinia stem rot 0.0 0.0 0.0 0.0 0.0 0.0
basal rot 0.0 0.0 0.0 0.0 0.0 0.0
Sclerotinia crown rot 0.0 0.0 0.0 0 100 0 0.0 0.0 0.0
NEMATODES
root knot nematode 0.0 0.0 0.0 0.0 0.0 0.0
root lesion nematode thornei 4.0 0.7 3.3 61 39 0 2.0 1.3 0.0
BACTERIA
leaf scorch 0.3 0.2 0.2 80 20 0 0.1 0.0 0.0
halo blight 0.7 0.5 0.2 50 50 0 0.1 0.1 0.0
bacterial blight 0.0 0.0 0.0 0 100 0 0.0 0.0 0.0
VIRUSES
alfalfa mosaic 0.0 0.0 0.0 0.0 0.0 0.0
bean common mosaic 0.0 0.0 0.0 0.0 0.0 0.0
tobacco streak 0.0 0.0 0.0 0.0 0.0 0.0
PHYTOPLASMAS
big bud 0.0 0.0 0.0 0.0 0.0 0.0
- no data available
On average, the current average annual losses from mungbean diseases are $35/ha. The five major diseases of field peas in Australia in order of potential and present losses are:
Rank By potential loss By present loss
1 root lesion nematode thornei root lesion nematode thornei
2 powdery mildew halo blight
3 halo blight leaf scorch
4 leaf scorch charcoal rot
5 charcoal rot bacterial blight
Nematode and bacterial diseases each cause present average annual losses of $0.7 million, or 48 per cent each of the total disease loss. The main nematode disease is root lesion nematode thornei with present losses of $0.7 million per year, which compares with its potential loss of $4.0 million if not controlled. The main bacterial disease is halo blight with a present loss of $0.5 million, compared with its potential to cause $0.7 million without present controls.
Present losses from root and crown fungi are minor at $0.04 million or 3 per cent of the total disease loss. There are no present losses from the necrotrophic and biotrophic leaf fungal, viral and phytoplasma diseases.
Current control values have reduced the losses from these diseases considerably. Breeding, cultural measures and pesticides are generally used in conjunction, as shown for the following diseases:
Disease Control value ($ million)
Contribution to control ($ million) byBreeding Cultural Pesticides
root lesion nematode thornei 3.30 2.02 1.28 0.00
powdery mildew 0.81 0.61 0.00 0.20
halo blight 0.16 0.08 0.08 0.00
leaf scorch 0.16 0.13 0.03 0.00
charcoal rot 0.04 0.00 0.04 0.00
Some diseases have the potential to reduce grain quality by blemishes and reduced seed size. There is a nil tolerance for charcoal rot. Further research on the effect of mungbean diseases and the value of the harvested grain is warranted, since this is likely to have an effect on the value of the loss and could justify greater efforts at control.

CuRRenT AnD PoTenTiAl CosTs fRoM DiseAses of Pulse CRoPs in AusTRAliA | 117 | GRDC
12.1 Production of pulse crops in AustraliaPulse crops are grown throughout the cropping areas of Australia. For the five years ending 2008-09, their average gross value of production (GVP) was $503 million per year from an average area of 1.5 million hectares (Table 12.1). This compares with the gross value of wheat of $4,680 million per year from 11.9 million hectares per year (Murray and Brennan 2009) and barley of $1,289 million per year from 3.8 million hectares per year (Murray and Brennan 2009) for the 10 years ending 2007-08.
The largest area of pulse crops is in the GRDC Southern Region with 786,000ha per year producing a gross value of $249 million per year. The Western Region has 420,000ha with GVP of $103 million and the Northern Region has 281,000ha with a GVP of $151 million (Table 12.1).
Nationally, chickpeas have the highest gross value of $151 million from 300,000ha. Although narrowleaf lupins and field peas have higher areas of 498,000ha and 303,000ha, respectively, their gross values of $112 million and $78 million are lower. These values are followed by lentils ($62 million), faba beans ($41 million), mungbeans ($33 million), albus lupins ($12 million), peanuts ($10 million) and vetch ($5 million) (Table 12.1).
Only four of the nine pulse crops are grown in the Northern Region. Chickpeas are the dominant pulse crop with 78 per cent of the pulse area worth $109 million per
year. These are followed by mungbeans, peanuts and faba beans in value.
Eight of the nine pulse crops are grown in the Southern Region. Field peas have the highest area of 30 per cent of the pulse area followed by narrowleaf lupins (19 per cent), lentils (16 per cent), faba beans (16 per cent), chickpeas (10 per cent), vetch (5 per cent), albus lupins (4 per cent) and mungbeans (0.5 per cent). Lentils and field peas have the highest gross values ($62 million per year), followed by chickpeas ($39 million), faba beans ($36 million), narrowleaf lupins ($31 million), albus lupins ($11 million), vetch ($5 million) and mungbeans ($3 million) (Table 12.1).
Six of the pulse crops are grown in the Western Region. Narrowleaf lupins are the dominant pulse, with 83 per cent of the pulse area, followed by field peas (15 per cent), with small amounts of chickpeas, faba beans, peanuts and albus lupins (all less than 1 per cent of the pulse area). Narrowleaf lupins have the highest gross value ($82 million per year) followed by field peas ($16 million) and chickpeas ($3 million), with the others less than $1 million per year (Table 12.1).
12.2 Diseases of pulse crops in AustraliaThe total present loss from diseases in pulse crops averages $74 million per year, or 14.8 per cent of the gross value of pulse production. Within crops, the highest losses occur
12 DiseAse losses To AusTRAliAn Pulse CRoPs: DisCussion AnD ConClusions
Table 12.1 Production of pulse crops in the GRDC Regions and Australia
Field peas Narrowleaf lupins
Albus lupins Chickpeas Faba beans Lentils Vetch Peanuts Mungbeans Total pulse
crops
Northern Region
area (’000 ha) 0.0 0.0 0.0 220.1 13.9 0.0 0.0 11.4 36.0 281.4
yield (t/ha) 1.00 0.00 0.00 1.22 1.19 0.00 0.00 2.56 1.25 1.28
production (’000 t) 0.0 0.0 0.0 268.7 16.5 0.0 0.0 29.3 45.0 359.4
gross value ($ million) 0.0 0.0 0.0 109.0 4.1 0.0 0.0 8.7 29.3 151.1
Southern Region
area (’000 ha) 239.3 149.2 31.2 75.7 122.0 122.2 42.2 0.0 4.0 785.8
yield (t/ha) 0.99 0.88 0.91 0.99 1.19 0.78 0.37 0.00 1.25 0.93
production (’000 t) 237.5 131.1 28.2 75.0 145.1 95.2 15.6 0.0 5.0 732.8
gross value ($ million) 61.8 30.9 11.3 39.0 36.3 61.9 4.7 0.0 3.3 249.0
Western Region
area (’000 ha) 63.6 348.2 0.6 3.8 2.8 0.0 0.0 0.7 0.0 419.8
yield (t/ha) 0.99 1.02 0.91 1.23 1.19 0.00 1.00 4.00 0.00 1.02
production (’000 t) 63.1 354.5 0.6 4.7 3.3 0.0 0.0 2.8 0.0 429.0
gross value ($ million) 16.4 81.5 0.3 3.4 0.8 0.0 0.0 0.8 0.0 103.3
Australia
area (’000 ha) 302.9 497.5 31.8 299.7 138.6 122.2 42.2 12.1 40.0 1487.0
yield (t/ha) 0.99 0.98 0.91 1.16 1.19 0.78 0.37 2.65 1.25 1.02
production (’000 t) 300.7 485.6 28.8 348.4 164.9 95.2 15.6 32.1 50.0 1521.3
gross value ($ million) 78.2 112.4 11.6 151.3 41.2 61.9 4.7 9.6 32.5 503.4

GRDC | 118 | CuRRenT AnD PoTenTiAl CosTs fRoM DiseAses of Pulse CRoPs in AusTRAliA
in chickpeas and field peas, each with a present average annual loss of $24 million, and narrowleaf lupins ($15 million) (Table 12.2). Based on percentage loss, field peas have the highest present losses (32 per cent of the crop value) followed by peanuts (28 per cent), chickpeas (16 per cent), narrowleaf lupins (14 per cent) and faba beans (11 per cent). Other crops (lentils, mungbeans, albus lupins and vetch) have losses under 5 per cent of the crop value (Table 12.2).
The highest per hectare loss occurs in peanuts ($222/ha), followed by chickpeas ($81/ha)) and field peas ($78/ha) (Table 12.2).
These losses, although high in many cases, would be far higher if current controls were not in place. The per hectare potential and present costs of the disease with highest potential loss in each crop illustrate the value of these controls (Table 12.3).
Damping off and seed aflatoxin in peanuts had both the highest potential annual loss per hectare ($286/ha) and highest value of control ($172/ha), worth $2.1 million to the peanut industry. Average annual potential losses from the disease with highest potential also exceeded $100/ha in narrowleaf lupins, chickpeas, lentils and mungbeans but in these crops all present losses from these diseases were less than $20/ha (Table 12.3).
12.3 Contribution of major disease groups to losses
Diseases were classified into seven groups: necrotrophic leaf fungi, biotrophic leaf fungi, root and crown fungi, nematodes, bacteria, viruses and phytoplasmas. The relative importance
of these disease groups varied.Necrotrophic leaf fungal diseases were important
contributors to yield loss in all crops except albus lupins and mungbeans. Root and crown fungal diseases were also very important for narrowleaf lupins, albus lupins, chickpeas and peanuts. Biotrophic leaf fungal diseases were only important in faba beans and peanuts, nematodes in chickpeas and mungbeans, bacteria in mungbeans and field peas and viruses in chickpeas, faba beans and lentils. Phytoplasmas were not important at present in any crop (Table 12.3).
12.3.1 necrotrophic fungal leaf diseasesThe present average annual loss to the Australian pulse industry from necrotrophic fungal leaf diseases is $36.2 million with $20.5 million of this occurring in the Southern Region, $11.1 million in the Western Region and $4.4 million in the Northern Region. These diseases had the greatest effect on field peas, which had 55 per cent of the loss (Table 12.5).
The present loss per hectare was greatest on chickpeas in the Western Region ($119/ha) followed by field peas also in the Western Region ($80/ha) and field peas in the Southern Region ($62/ha) (Table 12.5).
Although the present losses are high, the potential loss from the major necrotrophic fungal leaf disease on each pulse is higher than the combined losses of all necrotrophic fungal leaf diseases at present.
Closely related fungi cause the Ascochyta blight and black spot diseases of field peas, chickpeas, faba beans, lentils and vetch, although each is specific to its own host.
Table 12.3 Potential and present average annual loss ($/ha) and the control value ($/ha and $ million) of the disease with highest potential loss of each pulse crop for Australia
Crop Highest potential diseaseLoss ($/ha) Control value
Potential Present ($/ha) ($ million)
Field peas Mycosphaerella black spot 60 18 42 12.7
Narrowleaf lupins brown leaf spot 165 8 157 78.0
Albus lupins Pleiochaeta root rot 5 2 3 0.1
Chickpeas Ascochyta blight 134 16 118 34.9
Faba beans Ascochyta blight 67 8 60 8.3
Lentils Ascochyta blight 133 7 126 15.3
Vetch Ascochyta blight 15 0 15 0.6
Peanuts damping off/seed aflatoxin 286 114 172 2.1
Mungbeans root lesion nematode thornei 113 19 94 3.3
Table 12.2 Values of present average annual losses caused by diseases to pulse crops in AustraliaCrop Present loss/hectare ($) Total present disease loss ($ million) Loss as proportion of gross value of crop (%)
Field peas 78.35 23.7 31.6
Narrowleaf lupins 30.73 15.3 13.6
Albus lupins 4.35 0.1 1.2
Chickpeas 81.07 24.0 15.9
Faba beans 31.43 4.4 10.6
Lentils 21.76 2.7 4.3
Vetch 0.73 0.03 0.6
Peanuts 221.79 2.7 28.1
Mungbeans 39.50 1.4 4.3

CuRRenT AnD PoTenTiAl CosTs fRoM DiseAses of Pulse CRoPs in AusTRAliA | 119 | GRDC
Table 12.4 Present average annual yield losses caused by the major groups of plant diseases as a proportion of yield of each pulse crop (%) and as a proportion of the total present annual yield loss for each pulse crop (%) for Australia
Crop Necrotrophic leaf fungi
Biotrophic leaf fungi
Root and crown fungi Nematodes Bacteria Viruses Phytoplasmas All diseases
Present losses ($ million)
Field peas 20.0 1.4 0.9 0.1 0.9 0.5 0.0 23.7
Narrowleaf lupins 5.6 0.0 9.7 0.0 0.0 0.0 0.0 15.3
Albus lupins 0.0 0.0 0.1 0.0 0.0 0.0 0.0 0.1
Chickpeas 5.2 0.0 8.9 7.8 0.0 2.1 0.0 24.0
Faba beans 2.9 0.9 0.0 0.0 0.0 0.5 0.0 4.4
Lentils 1.9 0.0 0.0 0.0 0.0 0.8 0.0 2.7
Vetch 0.0 0.0 0.0 0.0 0.0 0.0 0.0 0.0
Peanuts 0.6 0.3 1.8 0.0 0.0 0.0 0.0 2.7
Mungbeans 0.0 0.0 0.0 0.7 0.7 0.0 0.0 1.4
TOTAL PULSE CROPS 36.2 2.6 21.5 8.5 1.6 3.9 0.0 74.3
Present losses (% of total disease loss)
Field peas 84 6 4 0 4 2 0 100
Narrowleaf lupins 36 0 64 0 0 0 0 100
Albus lupins 0 0 100 0 0 0 0 100
Chickpeas 22 0 37 32 0 9 0 100
Faba beans 67 21 1 0 0 11 0 100
Lentils 72 0 0 0 0 28 0 100
Vetch 99 0 1 0 0 0 0 100
Peanuts 22 10 67 0 0 1 0 100
Mungbeans 0 0 3 48 48 0 0 100
TOTAL PULSE CROPS 49 3 29 11 2 5 0 100
Present yield losses (%)
Field peas 25.0 1.6 1.1 0.1 1.1 0.7 0.0 29.6
Narrowleaf lupins 4.6 0.0 8.3 0.0 0.0 0.0 0.0 13.0
Albus lupins 0.0 0.0 1.2 0.0 0.0 0.0 0.0 1.2
Chickpeas 3.3 0.0 6.3 5.4 0.0 1.3 0.0 16.2
Faba beans 6.1 2.1 0.1 0.0 0.0 1.1 0.0 9.4
Lentils 1.9 0.0 0.0 0.0 0.0 1.2 0.0 3.1
Vetch 0.7 0.0 0.0 0.0 0.0 0.0 0.0 0.7
Peanuts 6.2 2.6 12.1 0.0 0.0 0.2 0.0 21.1
Mungbeans 0.0 0.0 0.2 2.4 2.3 0.0 0.0 4.9
Table 12.5 Present average annual losses in pulse crops from necrotrophic fungal leaf diseases in the GRDC Regions and Australia ($/ha and $ million)
Pulse cropPresent Loss ($/ha) Present loss ($ million)
Northern Southern Western Australia Northern Southern Western Australia
Field peas 0 62 80 66 0.0 14.9 5.1 20.0
Narrowleaf lupins 0 0 16 11 0.0 0.0 5.5 5.6
Albus lupins 0 0 0 0 0.0 0.0 0.0 0.0
Chickpeas 17 16 119 18 3.6 1.2 0.3 5.2
Faba beans 16 21 61 21 0.2 2.5 0.2 2.9
Lentils 0 16 0 16 0.0 1.9 0.0 1.9
Vetch 0 1 0 1 0.0 0.0 0.0 0.0
Peanuts 50 0 30 49 0.6 0.0 0.0 0.6
Mungbeans 0 0 0 0 0.0 0.0 0.0 0.0
TOTAL PULSE CROPS 4.4 20.7 11.1 36.2
The diseases have similar disease cycles and within the crops, their spores are splash dispersed. The fungicides and the spray schedules and methods are similar in each crop.
One fungal pathogen, Botrytis cinerea, causes grey mould,
seedling damping off and root rot on field peas, narrowleaf lupins, albus lupins, chickpeas, faba beans, lentils and vetch. Another Botrytis sp., B. fabae, also causes grey mould and root rot on faba beans, lentils and vetch.

GRDC | 120 | CuRRenT AnD PoTenTiAl CosTs fRoM DiseAses of Pulse CRoPs in AusTRAliA
12.3.2 Biotrophic fungal leaf diseasesThe present average annual loss to the Australian pulse industry from biotrophic fungal leaf diseases is $2.6 million with $1.2 million of this occurring in both the Northern and Western Regions and $0.2 million in the Southern Region. These diseases had the greatest effect on field peas, which had 54 per cent of the loss (Table 12.6).
The present loss per hectare was greatest on faba beans in the Northern Region ($66/ha) followed by peanuts also in the Northern Region ($24/ha) and field peas in the Western Region ($19/ha). Losses on these crops were much less in other regions and the biotrophic fungal leaf diseases caused little or no loss on the other crops (Table 12.6).
The biotrophic fungal leaf diseases contain fungi of two quite different types: the rusts and powdery mildews, which are “true” fungi, and the downy mildews, which are more closely related to some algae than to the higher fungi. This is reflected in their different responses to fungicides and this form of control must consider the sensitivity of the disease to the fungicide.
Although these diseases share common names, the causal fungi are highly host specific.
The potential loss from the major biotrophic fungal leaf diseases on field peas, faba beans, peanuts and mungbeans is high. Rusts have potential losses approaching $200/ha on faba beans and peanuts in the Northern Region while the potential loss from powdery mildew is $182/ha on field peas
in that region. However, current controls are very effective for these diseases. The exception is downy mildew which has a potential loss of almost $20/ha in the Western Region and there are no present effective controls.
12.3.3 Root and crown fungal diseasesThe present average annual loss to the Australian pulse industry from root and crown fungal diseases is $21.4 million with $10.0 million of this occurring in the Western Region, $7.2 million in the Northern Region and $4.1 million in the Southern Region. These diseases had the greatest loss in narrowleaf lupins and chickpeas, which had 45 and 42 per cent of the loss, respectively (Table 12.7).
The present loss per hectare was greatest on peanuts in the Northern Region ($157/ha) followed by chickpeas in the Southern Region ($46/ha) and narrowleaf lupins in the Western Region ($28/ha). These diseases cause present losses on all pulse crops except lentils and vetch (Table 12.7).
A wide range of fungi causes the root and crown diseases that damage pulses. Various anastomosis groups of Rhizoctonia solani affect all the pulses with these being most damaging in the Western Region. Other fungi with wide host ranges are Sclerotinia sclerotiorum and S. minor, which cause stem rot and crown rot. Although all pulses can be attacked, losses are generally small, the exception being Sclerotinia crown rot on chickpeas in the Western Region.
Table 12.6 Present average annual losses in pulse crops from biotrophic fungal leaf diseases in the GRDC Regions and Australia ($/ha and $ million)
Pulse cropPresent loss ($/ha) Present loss ($ million)
Northern Southern Western Australia Northern Southern Western Australia
Field peas 0 1 19 5 0.0 0.2 1.2 1.4
Narrowleaf lupins 0 0 0 0 0.0 0.0 0.0 0.0
Albus lupins 0 0 0 0 0.0 0.0 0.0 0.0
Chickpeas 0 0 0 0 0.0 0.0 0.0 0.0
Faba beans 66 0 0 7 0.9 0.0 0.0 0.9
Lentils 0 0 0 0 0.0 0.0 0.0 0.0
Vetch 0 0 0 0 0.0 0.0 0.0 0.0
Peanuts 24 0 1 23 0.3 0.0 0.0 0.3
Mungbeans 0 0 0 0 0.0 0.0 0.0 0.0
TOTAL 1.2 0.2 1.2 2.6
Table 12.7 Present average annual losses in pulse crops from root and crown fungal diseases in the GRDC Regions and Australia ($/ha and $ million)
Pulse cropPresent loss ($/ha) Present loss ($ million)
Northern Southern Western Australia Northern Southern Western Australia
Field peas 0 2 7 3 0.0 0.4 0.4 0.9
Narrowleaf lupins 0 1 28 20 0.0 0.1 9.6 9.7
Albus lupins 0 4 0 4 0.0 0.1 0.0 0.1
Chickpeas 25 46 10 30 5.4 3.5 0.0 8.9
Faba beans 0 0 5 0 0.0 0.0 0.0 0.0
Lentils 0 0 0 0 0.0 0.0 0.0 0.0
Vetch 0 0 0 0 0.0 0.0 0.0 0.0
Peanuts 157 0 1 148 1.8 0.0 0.0 1.8
Mungbeans 1 0 0 1 0.0 0.0 0.0 0.0
TOTAL 7.2 4.2 10.1 21.5

CuRRenT AnD PoTenTiAl CosTs fRoM DiseAses of Pulse CRoPs in AusTRAliA | 121 | GRDC
The unspecialised charcoal rot pathogen can probably affect all the pulses but was only recorded as causing loss on mungbeans. Other root and crown pathogens are highly host specific, such as the pathogen causing Phytophthora root rot of chickpeas.
The potential loss from the major root and crown fungal leaf diseases can be high on all pulses except vetch and mungbeans. The highest per hectare loss occurred on peanuts in the Northern Region ($304/ha), followed by Pleiochaeta root rot on narrowleaf lupins in the Western Region ($218/ha) and Phytophthora root rot on chickpeas in the Southern Region ($87/ha). Current controls are generally very effective for these diseases, although the loss in peanuts from damping off remains over $100/ha in the Northern Region.
12.3.4 nematode diseasesThe present average annual loss to the Australian pulse industry from nematode diseases is $8.6 million with almost all of this occurring in the Northern Region on chickpeas (Table 12.8).
The present loss per hectare was greatest on chickpeas in the Northern Region ($35/ha) followed by mungbeans also in the Northern Region ($19/ha). Losses on other crops were nil or very low (Table 12.8).
The potential loss from the major nematode diseases can be high on chickpeas and mungbeans, low on field peas, faba beans and peanuts, and negligible on narrowleaf lupins, albus lupins, lentils and vetch. The highest potential per hectare loss occurred with root lesion nematode thornei on mungbeans ($113/ha) and chickpeas ($80/ha), followed by root lesion nematode neglectus on chickpeas ($26/ha), all in the Northern Region. Current controls are generally very effective for these diseases, although the loss from root lesion nematode thornei in chickpeas and mungbeans remains around $20/ha in the Northern Region.
This study sought information on 16 species of nematodes over the nine pulse crops: 11 were reported as present on one or more pulses with data on incidence and severity supplied for eight. The largest number of nematode species reported was seven on chickpeas, followed by
four on field peas, narrowleaf lupins and peanuts. Only one species was reported on each of faba beans, lentils and mungbeans, while none were reported on albus lupins and vetch (Table 12.9).
The root lesion nematode Pratylenchus thornei was present on four pulses: field peas, chickpeas, lentils and mungbeans. Two other root lesion nematodes, P. penetrans and P. teres, and the burrowing nematode Radopholus sp., were reported on three pulses: field peas, narrowleaf lupins and chickpeas (Table 12.9).
The results for nematodes on pulses and the resulting damage is preliminary information. Apart from the major losses recorded on chickpeas and mungbeans, very little work has been completed on this group of pathogens. Current work will provide more information. The role of pulse crops in the epidemiology of nematodes, particularly the root lesion nematodes, may be important for their impact on subsequent crops in the rotation.
12.3.5 Bacterial diseasesSee Table 12.10.
12.3.6 Viral diseasesThe present average annual loss to the Australian pulse industry from viral diseases is $3.9 million with about half of this occurring on chickpeas in the Southern Region (Table 12.11).
The present loss per hectare was greatest on faba beans in the Northern Region ($34/ha) followed by chickpeas in the Southern Region ($26/ha) and field peas in the Northern Region ($25/ha). There were no present losses from viral diseases estimated on narrowleaf lupins, albus lupins, vetch and mungbeans (Table 12.11).
Fifteen viruses were reported to be present on one or more of the pulse crops in Australia. The largest number of viruses reported was on field peas and faba beans, with nine on each, followed by chickpeas (8), lentils (8), peanuts (4), narrowleaf lupins (3) and mungbeans (2). No viruses were reported on albus lupins and vetch (Table 12.12). The lack of reporting of viruses on some pulses probably reflects the lack of research on these crops.
Table 12.8 Present average annual losses in pulse crops from nematode diseases in the GRDC Regions and Australia ($/ha and $ million)
Pulse cropPresent loss ($/ha) Present loss ($ million)
Northern Southern Western Australia Northern Southern Western Australia
Field peas 0 0 1 0 0.0 0.0 0.1 0.1
Narrowleaf lupins 0 0 0 0 0.0 0.0 0.0 0.0
Albus lupins 0 0 0 0 0.0 0.0 0.0 0.0
Chickpeas 35 1 0 26 7.7 0.1 0.0 7.8
Faba beans 0 0 0 0 0.0 0.0 0.0 0.0
Lentils 0 0 0 0 0.0 0.0 0.0 0.0
Vetch 0 0 0 0 0.0 0.0 0.0 0.0
Peanuts 0 0 0 0 0.0 0.0 0.0 0.0
Mungbeans 19 0 0 19 0.7 0.0 0.0 0.7
TOTAL 8.4 0.1 0.1 8.5

GRDC | 122 | CuRRenT AnD PoTenTiAl CosTs fRoM DiseAses of Pulse CRoPs in AusTRAliA
Table 12.10 Present average annual losses in pulse crops from bacterial diseases in the GRDC Regions and Australia ($/ha and $ million)
Pulse cropPresent loss ($/ha) Present loss ($ million)
Northern Southern Western Australia Northern Southern Western Australia
Field peas 0 4 0 3 0.0 0.9 0.0 0.9
Narrowleaf lupins 0 0 0 0 0.0 0.0 0.0 0.0
Albus lupins 0 0 0 0 0.0 0.0 0.0 0.0
Chickpeas 0 0 0 0 0.0 0.0 0.0 0.0
Faba beans 0 0 0 0 0.0 0.0 0.0 0.0
Lentils 0 0 0 0 0.0 0.0 0.0 0.0
Vetch 0 0 0 0 0.0 0.0 0.0 0.0
Peanuts 0 0 0 0 0.0 0.0 0.0 0.0
Mungbeans 19 0 0 19 0.7 0.0 0.0 0.7
TOTAL PULSE CROPS 0.7 0.9 0.0 1.6
- no crop grown or no estimates available
Table 12.9 Nematode pathogens of pulse crops in Australia
Virus Field peas Narrowleaf lupins Albus lupins Chickpeas Faba beans Lentils Vetch Peanuts Mungbeans
Cricomella sp. - - - - - - - Y -
Ditylenchus dipsaci N - - Y Y U U - -
Meloidogyne arenaria - - - - - - - U -
Meloidogyne hapla - - - - - - - Y -
Meloidogyne incognita N - - - - - - U -
Meloidogyne javanica - - - - - - - U N
Meloidogyne sp. - - - - - - U - -
Merlinius brevidens - - - Y - - - - -
Pratylenchus brachyurus - U - - - - - Y -
Pratylenchus crenatus - - - - U - - - -
Pratylenchus neglectus U Y - Y U - U - -
Pratylenchus penetrans Y P - P U - - - -
Pratylenchus teres P P - P U - - - -
Pratylenchus thornei Y U - Y U P - - Y
Radopholus sp. P P - P U - - - -
Xiphenema elongatum - - - - - - - Y -
Y = present with assessment of incidence and severity in at least one region P = present but no assessment of incidence and severity N = not present on this crop U = status on this crop unknown - no assessment of presence made
Alfalfa mosaic and cucumber mosaic were each reported present on five pulse crops, followed by bean yellow mosaic, beet western yellows, pea seed-borne mosaic and tomato spotted wilt of four, and bean leafroll and subterranean clover stunt on three (Table 12.12). Further research would most likely find wider host ranges on the pulse crops for several viruses.
The wide host range of several viruses means that pulse crops form reservoirs of viral diseases that can affect other pulse crops, and in the case of viruses such as beet western yellows virus and alfalfa mosaic virus, other important broadleaf crops as well. The effect of the proximity of host crops to each other on the epidemiology of viral diseases should be considered.
12.3.7 Phytoplasma diseasesPhytoplasma diseases were reported on chickpeas, faba beans, peanuts and mungbeans but caused little or no loss.
12.4 Control of pulse diseasesFarmers use three main types of controls to reduce losses from crop diseases: resistant cultivars produced by plant breeding; cultural methods including crop rotation, paddock preparation, stubble management and sowing time; and application of pesticides.
Field peas with 28 diseases had the highest number of diseases for which controls were attempted, while vetch and mungbeans with seven each had the lowest (Table 12.13).
Cultural methods were the most widely used controls for all pulse crops. This control was used for all diseases. Control was attempted in narrowleaf lupins, albus lupins, faba beans and lentils. It was least used in vetch crops, but even with these it was used for 71 per cent of diseases controlled (Table 12.13).
Pesticides were the next most widely used form of control, ranging from 86 per cent of diseases controlled in vetch to 14 per cent in mungbeans. Breeding or the

CuRRenT AnD PoTenTiAl CosTs fRoM DiseAses of Pulse CRoPs in AusTRAliA | 123 | GRDC
Table 12.11 Present average annual losses in pulse crops from viral diseases in the GRDC Regions and Australia ($/ha and $ million)
Pulse cropPresent loss ($/ha) Present loss ($ million)
Northern Southern Western Australia Northern Southern Western Australia
Field peas 25 0 7 2 0.0 0.1 0.4 0.5
Narrowleaf lupins 0 0 0 0 0.0 0.0 0.0 0.0
Albus lupins 0 0 0 0 0.0 0.0 0.0 0.0
Chickpeas 1 26 14 7 0.1 1.9 0.0 2.1
Faba beans 34 0 4 3 0.5 0.0 0.0 0.5
Lentils 0 6 0 6 0.0 0.8 0.0 0.8
Vetch 0 0 0 0 0.0 0.0 0.0 0.0
Peanuts 2 0 0 2 0.0 0.0 0.0 0.0
Mungbeans 0 0 0 0 0.0 0.0 0.0 0.0
TOTAL PULSE CROPS 0.6 2.8 0.5 3.9
Table 12.12 Virus pathogens of pulse crops in Australia
Virus Field peas Narrowleaf lupins Albus lupins Chickpeas Faba beans Lentils Vetch Peanuts Mungbeans
alfalfa mosaic Y P U Y U Y U - Y
bean common mosaic U - - - - - - - Y
bean leafroll Y - - Y N Y U - -
bean yellow mosaic Y P U Y N Y U - -
beet western yellows Y - - Y Y Y - - -
broad bean wilt - U U - Y - - - -
capsicum chlorosis - - - - - - - Y -
chickpea chlorotic stunt - - - N - - - - -
clover yellow vein U - - N Y U U - -
cucumber mosaic Y Y U Y Y Y U - -
lettuce necrotic yellows - U U N - - - - -
pea seed-borne mosaic Y - - Y Y Y U - -
peanut mottle - - - - - - - Y -
soybean dwarf Y - - Y Y Y - - -
subterranean clover red leaf - U U - Y - U - -
subterranean clover stunt Y - - P Y U - - -
tobacco streak - - - N - - - Y N
tomato spotted wilt Y - - N Y Y U Y -
turnip mosaic - - - N - - - - -
Y = present with assessment of incidence and severity in at least one region P = present but no assessment of incidence and severity N = not present on this crop U = status on this crop unknown - no assessment of presence made
Table 12.13 The total number of diseases for which control is attempted and the proportion (%) of these diseases for which breeding, cultural methods and pesticides are used for pulse crops in Australia
Pulse crop Diseases controlledProportion of diseases controlled contributed by
Breeding Cultural methods Pesticides
Field peas 28 43 89 64
Narrowleaf lupins 19 16 100 63
Albus lupins 14 21 100 64
Chickpeas 24 17 96 71
Faba beans 21 52 100 62
Lentils 15 20 100 62
Vetch 7 14 71 86
Peanuts 21 29 95 48
Mungbeans 7 57 86 14
GRDC | 124 | CuRRenT AnD PoTenTiAl CosTs fRoM DiseAses of Pulse CRoPs in AusTRAliA
use of resistant cultivars ranged from 57 per cent of diseases controlled in mungbeans to 14 per cent in vetch (Table 12.13).
Integrated control, where combinations of control methods were used to manage diseases, was common and was used against an average of 68 per cent of pulse diseases for which control was attempted. This ranged from 86 per cent of controlled diseases on faba beans to 48 per cent on peanuts. The most common combination was cultural methods and pesticides (38 per cent) followed by all three methods (15 per cent) and breeding plus cultural methods (13 per cent).
12.5 ConclusionsDiseases remain a major threat to pulse crop production in Australia but are generally well controlled at present. The current average annual loss from diseases of pulse crops was estimated to be $74 million, made up of $23 million in the Northern, $29 million in the Southern, and $23 million in the Western Region. This compares with a potential average loss nationally of $82 million from a single disease, brown leaf spot of narrowleaf lupins, which is reduced to $4 million by current controls.
On average, the current national losses from diseases average $50/ha across all pulse crops, ranging from $1/ha for vetch to $222/ha for peanuts. In the Northern Region, the losses average $80/ha, while they are $37/ha in the Southern Region and $55/ha in the Western Region.
CaveatsThere are four major cautions that need to be considered when using and assessing these findings.1. The incidence and severity figures that form the basis
of these estimates are assumed to be independent. No attempt was made to change the incidence value for different levels of severity. It is likely that for some diseases, an increase in level of disease will result in higher inoculum levels for the next season, and thus increase the incidence. Changing the severity may alter the area sown to the pulse crop. For example, if an alternative to control for Pleiochaeta root rot in albus lupins by rotation were available, it may increase the area of this crop. Similarly, the development of a new form of genetic resistance for a disease may increase the area sown.
2. MacKenzie (1983) has cautioned that “the interpretation of information for several pests requires more sophisticated methods rather than just simple addition”. This is particularly so if no disease controls are applied when significant interaction between the diseases would occur. We did not sum the total potential loss, since each subsequent disease affecting the crop during its growth would have a reducing effect on yield. Such interaction is less likely with current controls in place, so on that basis we have summed the total present loss.
3. The level of aggregation of these estimates at the zone and then the regional levels will result in some errors if
there are variations of incidence or severity within regions. The agro-ecological zones were selected to encompass areas within the cropping area of Australia with similar soils and climate. The danger remains that a disease that is severe in a small area of a zone could be overlooked. The other danger is that these estimates will only be used at the regional level, when diseases important in one or more zones will be undervalued over the whole region.
4. The loss estimates are for average annual losses. In years favourable to disease development the loss will be higher while in unfavourable seasons, the converse will apply.Overall, pulse diseases have the potential to cause very
significant costs for farmers. Measures to overcome those potential costs, including varietal choice, cultural practices, crop rotations and the use of fungicides, play an important role in the location and nature of pulse production in Australia. Even after these measures have been taken to reduce losses, Australian farmers still suffer significant losses each year from pulse diseases. These present average annual losses of $74 million are 14.8 per cent of the average value of the pulse production over recent years. This relative loss is less than that found for wheat (19.5 per cent) and barley (19.5 per cent) diseases (Murray and Brennan 2009a, b).
As diseases change, whether through changing climatic conditions or because of changing technologies and costs of available options, the pulse industry also changes. In this report, detailed information on the present costs of diseases and the potential costs if current control measures are not maintained has been presented. Awareness of those costs will allow decision-makers to allocate the research and development resources to most effective use, while farmers will also be in a position to make better-informed judgments about the type and levels of controls to apply on their farms. Further work will be needed to ensure that these estimates do not become out-dated as circumstances change in the future.
This report presents estimates of the status of disease losses for pulse crops in the early years of the 21st century. It provides a benchmark to judge future changes.

CuRRenT AnD PoTenTiAl CosTs fRoM DiseAses of Pulse CRoPs in AusTRAliA | 125 | GRDC
Brennan JP, Murray GM (1989) Australian wheat diseases: Assessing their economic importance. Agricultural Science 2(1), 26–35.
Brennan JP, Murray GM (1998) Economic Importance of Wheat Diseases in Australia. (NSW Agriculture, Wagga Wagga.)
Brown JF (1975) ‘Diseases of wheat – their incidence and control.’ In Lazenby A, Matheson EM (eds) Australian Field Crops, Volume I: Wheat and Other Temperate Cereals pp. 304–363 (Angus and Robertson, Sydney.)
James WC (1974) Assessment of plant diseases and losses. Annual Review of Phytopathology 12, 27–48.
MacKenzie DR (1983) ‘Toward the management of crop losses.’ In Kommedahl T, Williams PH (eds) Challenging Problems in Plant Health pp. 82–92. (American Phytopathological Society, Minnesota, USA.)
Murray GM, Brennan JP (2009a) The current and potential costs of diseases of wheat in Australia. (Grains Research and Development Corporation, Barton, ACT, Australia.)
Murray GM, Brennan JP (2009b) The current and potential costs of diseases of barley in Australia. (Grains Research and Development Corporation, Barton, ACT, Australia.)
Murray GM, Brennan JP (2009c) Estimating disease losses to the Australian wheat industry. Australasian Plant Pathology 38, 558–570.
Murray GM, Brennan JP (2010) Estimating disease losses to the Australian barley industry. Australasian Plant Pathology 398, (in press).
Zadoks JC, Schein RD (1979) Epidemiology and Plant Disease Management. (Oxford University Press, New York, USA.)
13 RefeRenCes

GRDC | 126 | CuRRenT AnD PoTenTiAl CosTs fRoM DiseAses of Pulse CRoPs in AusTRAliA
The area, yield and production data for most pulse crops were supplied by Pulse Australia; data for other crops were supplied by Neil Clark and Associates, drawn from the Australian Bureau of Statistics. Some regional data for peanuts were provided by The Australian Peanut Company Ltd. The unit value of production of pulse crops is from the Australian Bureau of Agricultural Resource Economics and Sciences.
APPenDix A PRoDuCTion DATA foR The Pulse CRoPs
a. field peas
Table A.a Area, yield, production and price data for field peas by agro-ecological zone (mean of 5 years to 2008-09)
Northern Region Southern Region Western Region
TOTAL
Qld
Bur
Qld
Ath
Qld
Cen
NNEQ
SE
NNW
QSW
N Ce
n
NV S
lp
Vic
HR
SV M
all
SV B
Wim
SMNL
YE
Tas
WA
N
W C
en
WA
E
W S
andM
WA
Ord
NT K
ath
Field peas a a a
Area (‘000 ha) 0.0 0.0 6.1 45.4 15.1 36.3 30.3 106.0 0.0 3.0 3.0 45.4 12.1 302.9
Yield (t/ha) 1.00 1.00 0.99 0.79 1.19 0.99 1.09 1.02 1.00 0.99 0.99 0.99 0.99 0.99
Production (‘000 t) 0.0 0.0 6.0 36.1 18.0 36.1 33.1 108.2 0.0 3.0 3.0 45.1 12.0 300.7
Unit value ($/t) $260 $260 $260 $260 $260 $260 $260 $260 $260 $260 $260 $260 $260 $260
Gross value ($ m) $0.0 $0.0 $1.6 $9.4 $4.7 $9.4 $8.6 $28.1 $0.0 $0.8 $0.8 $11.7 $3.1 $78.2a Nominal area and production estimated for this zone Source: Pulse Australia; Australian Bureau of Agricultural Resource Economics and Sciences
b. narrowleaf lupins
Table A.b Area, yield, production and price data for narrowleaf lupins by agro-ecological zone (mean of 5 years to 2008-09)
Northern Region Southern Region Western Region
TOTAL
Qld
Bur
Qld
Ath
Qld
Cen
NNEQ
SE
NNW
QSW
N Ce
n
NV S
lp
Vic
HR
SV M
all
SV B
Wim
SMNL
YE
Tas
WA
N
W C
en
WA
E
W S
andM
WA
Ord
NT K
ath
Narrowleaf lupins a a
Area (‘000 ha) 0.0 29.8 5.0 39.8 39.8 34.8 0.0 174.1 99.5 24.9 49.7 497.5
Yield (t/ha) 1.00 0.65 0.98 0.85 0.98 0.98 1.00 1.06 0.98 0.98 0.98 0.98
Production ('000 t) 0.0 19.4 4.9 34.0 38.9 34.0 0.0 184.5 97.1 24.3 48.6 485.6
Unit value ($/t) $230 $260 $260 $230 $230 $230 $230 $230 $230 $230 $230 $232
Gross value ($m) $0.0 $5.1 $1.3 $7.8 $8.9 $7.8 $0.0 $42.4 $22.3 $5.6 $11.2 $112.4a Nominal area and production estimated for this zone Source: Pulse Australia; Australian Bureau of Agricultural Resource Economics and Sciences
c. Albus lupins
Table A.c Area, yield, production and price data for albus lupins by agro-ecological zone (mean of 5 years to 2008-09)
Northern Region Southern Region Western Region
TOTAL
Qld
Bur
Qld
Ath
Qld
Cen
NNEQ
SE
NNW
QSW
N Ce
n
NV S
lp
Vic
HR
SV M
all
SV B
Wim
SMNL
YE
Tas
WA
N
W C
en
WA
E
W S
andM
WA
Ord
NT K
ath
Albus Lupins a a a a
Area (000 ha) 16.2 14.9 0.0 0.0 0.0 0.0 0.6 31.8
Yield (t/ha) 1.07 0.73 1.00 1.00 1.00 1.00 0.91 0.91
Production ('000 t) 17.3 10.9 0.0 0.0 0.0 0.0 0.6 28.8
Unit value ($/t) $400 $400 $400 $400 $400 $400 $600 $404
Gross value ($m) $6.9 $4.4 $0.0 $0.0 $0.0 $0.0 $0.3 $11.6a Nominal area and production estimated for this zone Source: Pulse Australia; Australian Bureau of Agricultural Resource Economics and Sciences

CuRRenT AnD PoTenTiAl CosTs fRoM DiseAses of Pulse CRoPs in AusTRAliA | 127 | GRDC
e. faba beans
Table A.e Area, yield, production and price data for faba beans by agro-ecological zone (mean of 5 years to 2008-09)
Northern Region Southern Region Western Region
TOTAL
Qld
Bur
Qld
Ath
Qld
Cen
NNEQ
SE
NNW
QSW
N Ce
n
NV S
lp
Vic
HR
SV M
all
SV B
Wim
SMNL
YE
Tas
WA
N
W C
en
WA
E
W S
andM
WA
Ord
NT K
ath
Faba beans a a a
Area (‘000 ha) 8.3 5.5 34.7 2.8 8.3 6.9 34.7 34.7 0.0 0.7 0.0 2.1 0.0 138.6
Yield (t/ha) 1.39 0.89 1.19 1.19 0.79 0.95 1.24 1.28 1.00 1.19 1.00 1.19 1.00 1.19
Production (‘000 t) 11.5 4.9 41.2 3.3 6.6 6.6 42.9 44.5 0.0 0.8 0.0 2.5 0.0 164.9
Unit value ($/t) $250 $250 $250 $250 $250 $250 $250 $250 $250 $250 $250 $250 $250 $250
Gross value ($m) $2.9 $1.2 $10.3 $0.8 $1.6 $1.6 $10.7 $11.1 $0.0 $0.2 $0.0 $0.6 $0.0 $41.2a Nominal area and production estimated for this zone Source: Pulse Australia; Australian Bureau of Agricultural and Resources Economics
d. Chickpeas
Table A.d Area, yield, production and price data for chickpeas by agro-ecological zone (mean of 5 years to 2008-09)
Northern Region Southern Region Western Region
TOTAL
Qld
Bur
Qld
Ath
Qld
Cen
NNEQ
SE
NNW
QSW
N Ce
n
NV S
lp
Vic
HR
SV M
all
SV B
Wim
SMNL
YE
Tas
WA
N
W C
en
WA
E
W S
andM
WA
Ord
NT K
ath
Desi chickpeas a a a
Area (‘000 ha) 2.7 32.6 86.9 95.1 32.6 2.7 2.7 5.4 2.7 5.4 2.7 0.0 0.0 0.0 271.7
Yield (t/ha) 1.19 1.39 1.30 1.09 1.19 1.19 0.00 0.60 1.19 1.19 1.19 1.00 1.00 1.00 1.19
Production ('000 t) 3.2 45.3 113.3 103.6 38.8 3.2 0.0 3.2 3.2 6.5 3.2 0.0 0.0 0.0 323.7
Unit value ($/t) $400 $400 $400 $400 $400 $400 $400 $400 $400 $400 $400 $400 $400 $400 $400
Gross value ($m) $1.3 $18.1 $45.3 $41.4 $15.5 $1.3 $0.0 $1.3 $1.3 $2.6 $1.3 $0.0 $0.0 $0.0 $129.5
Kabuli chickpeas
Area (‘000 ha) 0.8 1.7 0.3 0.3 2.0 0.3 10.4 11.2 1.1 28.0
Yield (t/ha) 1.17 1.17 0.88 0.88 0.75 0.88 0.88 0.79 1.32 0.88
Production ('000 t) 1.0 2.0 0.2 0.2 1.5 0.2 9.1 8.9 1.5 24.6
Unit value ($/t) $900 $850 $850 $850 $850 $850 $850 $850 $1400 $885
Gross value ($m) $0.9 $1.7 $0.2 $0.2 $1.3 $0.2 $7.8 $7.5 $2.1 $21.8
Total chickpeas
Area (‘000 ha) 2.7 33.4 88.6 95.4 32.9 4.7 3.0 15.8 13.9 5.4 2.7 0.0 0.0 0.0 1.1 299.7
Yield (t/ha) 1.19 1.38 1.30 1.09 1.19 1.01 0.08 0.78 0.87 1.19 1.19 1.00 1.00 1.00 1.32 1.16
Production ('000 t) 3.2 46.3 115.3 103.8 39.1 4.7 0.2 12.4 12.1 6.5 3.2 0.0 0.0 0.0 1.5 348.4
Unit value ($/t) $400 $411 $408 $401 $403 $541 $850 $732 $730 $400 $400 $400 $400 $400 $1400 $434
Gross value ($m) $1.3 $19.0 $47.0 $41.6 $15.7 $2.6 $0.2 $9.0 $8.8 $2.6 $1.3 $0.0 $0.0 $0.0 $2.1 $151.3a Nominal area and production estimated for this zone Source: Pulse Australia; Australian Bureau of Agricultural Resource Economics and Sciences
f. lentils
Table A.f Area, yield, production and price data for lentils by agro-ecological zone (mean of 5 years to 2008-09)
Northern Region Southern Region Western Region
TOTAL
Qld
Bur
Qld
Ath
Qld
Cen
NNEQ
SE
NNW
QSW
N Ce
n
NV S
lp
Vic
HR
SV M
all
SV B
Wim
SMNL
YE
Tas
WA
N
W C
en
WA
E
W S
andM
WA
Ord
NT K
ath
Lentils a
Area (‘000 ha) 0.0 12.2 48.9 61.1 122.2
Yield (t/ha) 1.00 0.55 0.55 1.01 0.78
Production (‘000 t) 0.0 6.7 26.7 61.9 95.2
Unit value ($/t) $650 $650 $650 $650 $650
Gross value ($m) $0.0 $4.3 $17.3 $40.2 $61.9a Nominal area and production estimated for this zone Source: Pulse Australia; Australian Bureau of Agricultural Resource Economics and Sciences

GRDC | 128 | CuRRenT AnD PoTenTiAl CosTs fRoM DiseAses of Pulse CRoPs in AusTRAliA
i. Mungbeans
Table A.i Area, yield, production and price data for mungbeans by agro-ecological zone (mean of 5 years to 2008-09)
Mungbeans
Northern Region Southern Region Western Region
TOTAL
Qld
Bur
Qld
Ath
Qld
Cen
NNEQ
SE
NNW
QSW
N Ce
n
NV S
lp
Vic
HR
SV M
all
SV B
Wim
SMNL
YE
Tas
WA
N
W C
en
WA
E
W S
andM
WA
Ord
NT K
ath
Area (‘000 ha) 0.8 10.4 20.0 4.8 4.0 40.0
Yield (t/ha) 1.25 1.35 1.25 1.04 1.25 1.25
Production (‘000 t) 1.0 14.0 25.0 5.0 5.0 50.0
Unit value ($/t) $650 $650 $650 $650 $650 $650
Gross value ($m) $0.7 $9.1 $16.3 $3.3 $3.3 $32.5
Source: Pulse Australia; Australian Bureau of Agricultural and Resources Economics
g. Vetch
Table A.g Area, yield, production and price data for vetch by agro-ecological zone (mean of 5 years to 2008-09)
Vetch
Northern Region Southern Region Western Region
TOTAL
Qld
Bur
Qld
Ath
Qld
Cen
NNEQ
SE
NNW
QSW
N Ce
n
NV S
lp
Vic
HR
SV M
all
SV B
Wim
SMNL
YE
Tas
WA
N
W C
en
WA
E
W S
andM
WA
Ord
NT K
ath
Area (‘000 ha) 0.2 0.5 17.3 14.1 10.3 42.2
Yield (t/ha) 0.04 0.18 0.23 0.39 0.59 0.37
Production (‘000 t) 0.0 0.1 4.0 5.4 6.1 15.6
Unit value ($/t) $302 $302 $302 $302 $302 $302
Gross value ($m) $0.0 $0.0 $1.2 $1.6 $1.8 $4.7
Source: Neil Clark and Associates, drawing from Australian Bureau of Statistics; Australian Bureau of Agricultural Resource Economics and Sciences
h. Peanuts
Table A.h Area, yield, production and price data for peanuts by agro-ecological zone (mean of 5 years to 2008-09)
Northern Region Southern Region Western Region
TOTAL
Qld
SC
Qld
Ath
Qld
Cen
NNEQ
SE
NNW
QSW
N Ce
n
NV S
lp
Vic
HR
SV M
all
SV B
Wim
SMNL
YE
Tas
WA
N
W C
en
WA
E
W S
andM
WA
Ord
NT K
ath
Peanuts b a b
Area (‘000 ha) 1.4 2.1 0.4 7.5 0.0 0.7 12.1
Yield (t/ha) 4.86 3.66 4.37 1.72 1.0 4.00 2.65
Production (‘000 t) 6.9 7.7 1.8 12.9 0.0 2.8 32.1
Unit value ($/t) $298 $298 $298 $298 $298 $298 $298
Gross value ($m) $2.1 $2.3 $0.6 $3.8 $0.0 $0.8 $9.6
a Nominal area and production estimated for this zoneb Estimates from Pat Harden, Peanut Company of Australia Ltd
Source: Neil Clark and Associates, drawing from Australian Bureau of Statistics; Pat Harden, Peanut Company of Australia Ltd; Australian Bureau of Agricultural Resource Economics and Sciences

CuRRenT AnD PoTenTiAl CosTs fRoM DiseAses of Pulse CRoPs in AusTRAliA | 129 | GRDC
APPenDix B DiseAse DATA foR The Pulse CRoPs By AGRo-eColoGiCAl zone
The following tables give the data on disease incidence and severity, the derived losses, and the contribution to control for each of the pulse crops for each agro-ecological zone from which data were collected. Where more than one return was received for a disease for the zone, the values are the average of the returns. Contributors of the data are given as footnotes to each table.
The tables are:
The assessments were made for the period 2000 to 2009.
Presence within a zone is recorded as: Y = present in zone and estimates of incidence and severity available; P = present in zone but no or incomplete estimates of incidence and severity; N = not recorded in zone; U = status unknown.
Incidence is the frequency with which environmental conditions enable the disease to reach its maximum severity in that zone; it is assessed as the frequency of years that favour development of the disease to damaging levels, and then as the proportion of the crop area in the zone affected when the disease develops.
Severity is the level of damage caused when the environmental conditions are favourable for development; it is assessed assuming that present controls are not applied (potential severity), and then with present controls applied (present severity).
The contribution to control by breeding, cultural methods and pesticides was assessed as a proportion of the control achieved.
Zone a.Field peas
b. Narrowleaf
lupins
c.Albuslupins
d.Chickpeas
e.Faba beans
f.Lentils
g.Vetch
h.Peanuts
i.Mungbeans
1 Qld Burdekin
2 Qld Atherton X
3 Qld Central X X X
4 NSW NE/Qld SE X X X X X
5 NSW NW/Qld SW X X X X X
6 NSW Central X X X X X
7 NSW Vic Slopes X X X X X X
8 Vic High Rainfall X X X X X
9 SA Vic Mallee X X X X X X X
10 SA Vic Border Wimmera X X X X X X X
11 SA Mid N/Lower Yorke, Eyre X X X X X
12 Tas X X X X
13 WA Northern X X X
14 WA Central X X X X
15 WA Eastern X X
16 WA Sandplain-Mallee X X X
17 WA Ord
18 NT Katherine X
19 Qld SouthCoast X

GRDC | 130 | CuRRenT AnD PoTenTiAl CosTs fRoM DiseAses of Pulse CRoPs in AusTRAliA
a. field peas
Table B.a.4 Presence, incidence, severity and contribution to control estimates of diseases of field peas in the NSW North East/Queensland South East Zone
Disease Present in zone
Incidence Severity Contribution to control (%)
% of years % area affected
No control ControlBreeding Cultural Pesticide
% loss % loss
Necrotrophic leaf fungi
leaf and pod spot Y 10 5 10 0 50 50 0
grey mould Y 10 5 10 0 50 50 0
pepper spot U
Phoma black spot Y 10 5 10 0 50 50 0
Koolunga black spot U
Mycosphaerella black spot Y 10 5 10 0 50 50 0
Septoria blotch Y 10 5 10 0 50 50 0
black spot complex P
Biotrophic leaf fungi
powdery mildew Y 100 100 80 0 100 0 0
downy mildew Y 10 5 5 0 50 50 0
Root and crown fungi
Aphanomyces root rot P
Bot damping off, root rot P
Fusarium wilt U
charcoal rot U
Mycosphaerella foot rot U
Phoma foot rot U
Pyth damping off/root rot U
Rhizoc seed and stem rot Y 100 1 50 1 0 100 0
bare patch U
epicotyl rot U
Sclerotinia stem rot Y 100 1 50 1 0 100 0
Nematodes
stem nematode U
root knot nematode U
root lesion nem neglectus U
root lesion nem penetrans U
root lesion nem teres U
root lesion nem thornei U
burrowing nematode U
Bacteria
pisi bacterial blight Y 10 10 20 1 50 50 0
syringae bacterial blight Y 10 10 20 1 50 50 0
Viruses
alfalfa mosaic Y 50 10 20 5 50 50 0
bean common mosaic U
bean leafroll Y 75 75 100 20 90 10 0
bean yellow mosaic Y 10 10 10 0 100 0 0
beet western yellows Y 50 75 0 0 0 0 0
clover yellow vein U
cucumber mosaic Y 25 5 100 5 50 50 0
pea seedborne mosaic Y 100 100 30 0 100 0 0
soybean dwarf Y 25 50 50 1 75 25 0
subterranean clover stunt Y 5 1 0 0 0 0 0
tomato spotted wilt Y 5 1 0 0 0 0 0
Y= present in region P = present in region but no or incomplete data on incidence and severity U = unknown statusContributor: Joop van Leur

CuRRenT AnD PoTenTiAl CosTs fRoM DiseAses of Pulse CRoPs in AusTRAliA | 131 | GRDC
Table B.a.5 Presence, incidence, severity and contribution to control estimates of diseases of field peas in the NSW North West/Queensland South West Zone
Disease Present in zone
Incidence Severity Contribution to control (%)
% of years % area affected
No control ControlBreeding Cultural Pesticide
% loss % loss
Necrotrophic leaf fungi
leaf and pod spot Y 5 1 5 0 50 50 0
grey mould Y 5 1 5 0 50 50 0
pepper spot U
Phoma black spot Y 5 1 5 0 50 50 0
Koolunga black spot U
Mycosphaerella black spot Y 5 1 5 0 50 50 0
Septoria blotch Y 5 1 5 0 50 50 0
black spot complex P
Biotrophic leaf fungi
powdery mildew Y 75 100 80 0 100 0 0
downy mildew Y 5 1 5 0 50 50 0
Root and crown fungi
Aphanomyces root rot P
Bot damping off, root rot P
Fusarium wilt U
charcoal rot U
Mycosphaerella foot rot U
Phoma foot rot U
Pyth damping off/root rot U
Rhizoc seed and stem rot Y 100 1 50 1 0 100 0
bare patch U
epicotyl rot U
Sclerotinia stem rot Y 100 1 50 1 0 100 0
Nematodes
stem nematode U
root knot nematode U
root lesion nem neglectus U
root lesion nem penetrans U
root lesion nem teres U
root lesion nem thornei U
burrowing nematode U
Bacteria
pisi bacterial blight Y 5 5 5 1 50 50 0
syringae bacterial blight Y 5 5 5 1 50 50 0
Viruses
alfalfa mosaic Y 25 5 20 5 50 50 0
bean common mosaic U
bean leafroll Y 50 75 100 20 90 10 0
bean yellow mosaic Y 5 1 10 0 100 0 0
beet western yellows Y 25 50 0 0 0 0 0
clover yellow vein U
cucumber mosaic Y 10 1 100 5 50 50 0
pea seedborne mosaic Y 100 100 30 0 100 0 0
soybean dwarf Y 10 50 50 1 75 25 0
subterranean clover stunt Y 5 1 0 0 0 0 0
tomato spotted wilt Y 5 1 0 0 0 0 0
Y= present in region P = present in region but no or incomplete data on incidence and severity U = unknown statusContributor: Joop van Leur

GRDC | 132 | CuRRenT AnD PoTenTiAl CosTs fRoM DiseAses of Pulse CRoPs in AusTRAliA
Table B.a.6 Presence, incidence, severity and contribution to control estimates of diseases of field peas in the NSW Central Zone
Disease Present in zone
Incidence Severity Contribution to control (%)
% of years % area affected
No control ControlBreeding Cultural Pesticide
% loss % loss
Necrotrophic leaf fungi
leaf and pod spot Y 5 10 5 0 0 60 40
grey mould Y 5 10 5 0 0 70 30
pepper spot U
Phoma black spot Y 50 20 30 10 20 50 30
Koolunga black spot U
Mycosphaerella black spot Y 50 20 30 10 20 50 30
Septoria blotch Y 20 10 5 0 10 60 30
black spot complex P
Biotrophic leaf fungi
powdery mildew Y 15 10 10 0 80 10 10
downy mildew Y 15 15 10 0 80 10 10
Root and crown fungi
Aphanomyces root rot U
Bot damping off, root rot Y 5 5 10 0 0 50 50
Fusarium wilt Y 5 5 10 5 0 50 50
charcoal rot U
Mycosphaerella foot rot Y 20 10 10 5 10 60 30
Phoma foot rot Y 20 10 10 5 10 60 30
Pyth damping off/root rot Y 15 10 10 5 0 80 20
Rhizoc seed and stem rot Y 10 10 10 5 0 80 20
bare patch U
epicotyl rot U
Sclerotinia stem rot Y 15 5 10 5 0 80 20
Nematodes
stem nematode U
root knot nematode U
root lesion nem neglectus U
root lesion nem penetrans U
root lesion nem teres U
root lesion nem thornei U
burrowing nematode U
Bacteria
pisi bacterial blight U
syringae bacterial blight U
Viruses
alfalfa mosaic U
bean common mosaic U
bean leafroll U
bean yellow mosaic U
beet western yellows U
clover yellow vein U
cucumber mosaic U
pea seedborne mosaic U
soybean dwarf U
subterranean clover stunt U
tomato spotted wilt U
Y = present in region P = present but no assessment of incidence and severity U = status on this crop unknown Contributor: Kurt Lindbeck

CuRRenT AnD PoTenTiAl CosTs fRoM DiseAses of Pulse CRoPs in AusTRAliA | 133 | GRDC
Table B.a.7 Presence, incidence, severity and contribution to control estimates of diseases of field peas in the NSW-Victorian Slopes Zone
Disease Present in zone
Incidence Severity Contribution to control (%)
% of years % area affected
No control ControlBreeding Cultural Pesticide
% loss % loss
Necrotrophic leaf fungi
leaf and pod spot Y 5 10 5 0 0 60 40
grey mould Y 5 10 5 0 0 70 30
pepper spot U
Phoma black spot Y 70 20 30 10 20 50 30
Koolunga black spot U
Mycosphaerella black spot Y 70 20 30 10 20 50 30
Septoria blotch Y 40 10 5 0 10 60 30
black spot complex
Biotrophic leaf fungi
powdery mildew Y 10 10 10 0 80 10 10
downy mildew Y 15 15 10 0 80 10 10
Root and crown fungi
Aphanomyces root rot U
Bot damping off, root rot Y 5 5 10 0 0 50 50
Fusarium wilt Y 5 5 10 5 0 50 50
charcoal rot U
Mycosphaerella foot rot Y 20 10 10 5 10 60 30
Phoma foot rot Y 20 10 10 5 10 60 30
Pyth damping off/root rot Y 15 10 10 5 0 80 20
Rhizoc seed and stem rot Y 10 10 10 5 0 80 20
bare patch
epicotyl rot
Sclerotinia stem rot Y 15 5 10 5 0 80 20
Nematodes
stem nematode U
root knot nematode U
root lesion nem neglectus U
root lesion nem penetrans U
root lesion nem teres U
root lesion nem thornei U
burrowing nematode U
Bacteria
pisi bacterial blight Y 30 15 30 15 30 70 0
syringae bacterial blight Y 30 15 30 15 30 70 0
Viruses
alfalfa mosaic U
bean common mosaic U
bean leafroll U
bean yellow mosaic U
beet western yellows U
clover yellow vein U
cucumber mosaic U
pea seedborne mosaic U
soybean dwarf U
subterranean clover stunt U
tomato spotted wilt UY = present in region P = present but no assessment of incidence and severity U = status on this crop unknown Contributor: Kurt Lindbeck

GRDC | 134 | CuRRenT AnD PoTenTiAl CosTs fRoM DiseAses of Pulse CRoPs in AusTRAliA
Table B.a.8 Presence, incidence, severity and contribution to control estimates of diseases of field peas in the Victorian High Rainfall Zone
Disease Present in zone
Incidence Severity Contribution to control (%)
% of years % area affected
No control ControlBreeding Cultural Pesticide
% loss % loss
Necrotrophic leaf fungi
leaf and pod spot Y 5 13 8 0 0 60 40
grey mould Y 5 10 5 0 0 70 30
pepper spot U 0 0 0
Phoma black spot Y 70 25 28 10 20 55 25
Koolunga black spot U 0 0 0
Mycosphaerella black spot Y 70 20 33 10 20 50 30
Septoria blotch Y 35 10 5 0 8 63 30
black spot complex P
Biotrophic leaf fungi
powdery mildew Y 8 5 10 0 80 10 10
downy mildew Y 5 5 10 0 80 10 10
Root and crown fungi
Aphanomyces root rot U
Bot damping off, root rot Y 8 5 10 0 0 50 50
Fusarium wilt Y 5 5 10 5 0 50 50
charcoal rot U
Mycosphaerella foot rot Y 23 10 10 5 13 58 30
Phoma foot rot Y 23 10 10 5 13 58 30
Pyth damping off/root rot Y 13 10 10 5 0 80 20
Rhizoc seed and stem rot Y 8 10 10 5 0 80 20
bare patch U
epicotyl rot U
Sclerotinia stem rot Y 13 5 10 5 0 80 20
Nematodes
stem nematode U
root knot nematode U
root lesion nem neglectus U
root lesion nem penetrans U
root lesion nem teres U
root lesion nem thornei U
burrowing nematode U
Bacteria
pisi bacterial blight Y 25 23 55 20 15 85 0
syringae bacterial blight Y 25 23 55 20 28 73 0
Viruses
alfalfa mosaic U
bean common mosaic U
bean leafroll U
bean yellow mosaic U
beet western yellows U
clover yellow vein U
cucumber mosaic U
pea seedborne mosaic U
soybean dwarf U
subterranean clover stunt U
tomato spotted wilt U
Y = present in region P = present but no assessment of incidence and severity U = status on this crop unknown Contributors: Kurt Lindbeck, Helen Richardson

CuRRenT AnD PoTenTiAl CosTs fRoM DiseAses of Pulse CRoPs in AusTRAliA | 135 | GRDC
Table B.a.9 Presence, incidence, severity and contribution to control estimates of diseases of field peas in the South Australian-Victorian Mallee Zone
Disease Present in zone
Incidence Severity Contribution to control (%)
% of years % area affected
No control ControlBreeding Cultural Pesticide
% loss % loss
Necrotrophic leaf fungi
leaf and pod spot Y 5 5 5 0 0 60 40
grey mould Y 23 10 8 0 0 35 65
pepper spot Y 75 100 1 0 0 0 100
Phoma black spot Y 75 59 14 8 14 61 25
Koolunga black spot Y 100 75 50 15 0 75 25
Mycosphaerella black spot Y 75 59 30 10 15 61 24
Septoria blotch Y 26 30 11 5 4 33 64
black spot complex P
Biotrophic leaf fungi
powdery mildew Y 19 53 18 0 65 5 30
downy mildew Y 24 35 30 0 65 5 30
Root and crown fungi
Aphanomyces root rot N
Bot damping off, root rot Y 5 8 5 0 0 50 50
Fusarium wilt Y 5 5 5 0 0 50 50
charcoal rot U
Mycosphaerella foot rot Y 20 13 13 5 10 64 26
Phoma foot rot Y 20 13 11 5 10 64 26
Pyth damping off/root rot Y 13 10 13 4 0 40 60
Rhizoc seed and stem rot Y 20 16 19 5 0 79 21
bare patch U
epicotyl rot U
Sclerotinia stem rot Y 7 8 8 2 0 40 60
Nematodes
stem nematode N
root knot nematode N
root lesion nem neglectus U
root lesion nem penetrans N
root lesion nem teres U
root lesion nem thornei N
burrowing nematode U
Bacteria
pisi bacterial blight Y 21 18 36 14 8 93 0
syringae bacterial blight Y 23 15 49 15 14 86 0
Viruses
alfalfa mosaic Y 20 1 0 0 0 100 0
bean common mosaic U
bean leafroll Y 42 12 4 2 0 50 50
bean yellow mosaic Y 12 10 2 2 0 100 0
beet western yellows Y 25 15 4 2 0 50 50
clover yellow vein U
cucumber mosaic Y 12 12 2 0 0 100 0
pea seedborne mosaic Y 70 43 8 0 0 100 0
soybean dwarf U
subterranean clover stunt P
tomato spotted wilt U
Y = present in region P = present but no assessment of incidence and severity U = status on this crop unknown N = not present on this cropContributors: Jenny Davidson, Angela Freeman, Rohan Kimber, Kurt Lindbeck, Helen Richardson

GRDC | 136 | CuRRenT AnD PoTenTiAl CosTs fRoM DiseAses of Pulse CRoPs in AusTRAliA
Table B.a.10 Presence, incidence, severity and contribution to control estimates of diseases of field peas in the South Australian-Victorian Border Wimmera Zone
Disease Present in zone
Incidence Severity Contribution to control (%)
% of years % area affected
No control ControlBreeding Cultural Pesticide
% loss % loss
Necrotrophic leaf fungi
leaf and pod spot Y 8 10 8 0 0 60 40
grey mould Y 24 10 6 0 0 35 65
pepper spot Y 75 100 1 0 0 0 100
Phoma black spot Y 85 60 24 10 14 61 25
Koolunga black spot Y 100 75 50 15 0 75 25
Mycosphaerella black spot Y 85 60 40 13 15 61 24
Septoria blotch Y 31 26 9 3 3 33 65
black spot complex
Biotrophic leaf fungi
powdery mildew Y 21 54 21 0 63 8 30
downy mildew Y 23 39 29 0 63 8 30
Root and crown fungi
Aphanomyces root rot N
Bot damping off, root rot Y 5 5 10 0 0 50 50
Fusarium wilt Y 5 5 10 5 0 50 50
charcoal rot U
Mycosphaerella foot rot Y 21 13 15 8 10 64 26
Phoma foot rot Y 21 13 14 8 10 64 26
Pyth damping off/root rot Y 13 10 15 6 0 40 60
Rhizoc seed and stem rot Y 14 10 16 5 0 79 21
bare patch U
epicotyl rot U
Sclerotinia stem rot Y 13 8 8 4 0 40 60
Nematodes
stem nematode U
root knot nematode N
root lesion nem neglectus U
root lesion nem penetrans N
root lesion nem teres U
root lesion nem thornei N
burrowing nematode U
Bacteria
pisi bacterial blight Y 29 21 40 16 8 93 0
syringae bacterial blight Y 30 19 53 18 14 86 0
Viruses
alfalfa mosaic Y 20 1 0 0 0 100 0
bean common mosaic U
bean leafroll Y 42 12 4 2 0 50 50
bean yellow mosaic Y 12 10 2 2 0 100 0
beet western yellows Y 25 15 4 2 0 50 50
clover yellow vein U
cucumber mosaic Y 12 12 2 0 0 100 0
pea seedborne mosaic Y 70 43 8 0 0 100 0
soybean dwarf U
subterranean clover stunt P
tomato spotted wilt U
Y = present in region P = present but no assessment of incidence and severity U = status on this crop unknown Contributors: Jenny Davidson, Angela Freeman, Rohan Kimber, Kurt Lindbeck, Helen Richardson

CuRRenT AnD PoTenTiAl CosTs fRoM DiseAses of Pulse CRoPs in AusTRAliA | 137 | GRDC
Table B.a.11 Presence, incidence, severity and contribution to control estimates of diseases of field peas in the South Australian Mid-North/Lower Yorke, Eyre Zone
Disease Present in zone
Incidence Severity Contribution to control (%)
% of years % area affected
No control ControlBreeding Cultural Pesticide
% loss % loss
Necrotrophic leaf fungi
leaf and pod spot U
grey mould Y 40 10 5 0 0 0 100
pepper spot Y 75 100 1 0 0 0 100
Phoma black spot Y 100 100 18 10 5 75 20
Koolunga black spot Y 100 75 50 15 0 75 25
Mycosphaerella black spot Y 100 100 50 15 8 75 18
Septoria blotch Y 30 43 13 5 0 0 100
black spot complex U
Biotrophic leaf fungi
powdery mildew Y 30 95 30 0 50 0 50
downy mildew Y 30 60 45 0 50 0 50
Root and crown fungi
Aphanomyces root rot N
Bot damping off, root rot U
Fusarium wilt U
charcoal rot U
Mycosphaerella foot rot Y 25 15 20 10 10 68 23
Phoma foot rot Y 25 15 18 10 10 68 23
Pyth damping off/root rot Y 10 10 20 8 0 0 100
Rhizoc seed and stem rot Y 20 13 23 5 0 78 23
bare patch U
epicotyl rot U
Sclerotinia stem rot Y 10 10 5 3 0 0 100
Nematodes
stem nematode U
root knot nematode N
root lesion nem neglectus U
root lesion nem penetrans N
root lesion nem teres U
root lesion nem thornei N
burrowing nematode U
Bacteria
pisi bacterial blight Y 28 20 25 13 0 100 0
syringae bacterial blight Y 30 15 50 15 0 100 0
Viruses
alfalfa mosaic N
bean common mosaic U
bean leafroll Y 13 13 3 3 0 0 0
bean yellow mosaic Y 13 13 3 3 0 0 0
beet western yellows Y 13 13 3 3 0 0 0
clover yellow vein U
cucumber mosaic Y 13 13 3 0 0 100 0
pea seedborne mosaic Y 68 50 10 0 0 100 0
soybean dwarf U
subterranean clover stunt U
tomato spotted wilt U
Y = present in region U = status on this crop unknown N = not present on this cropContributors: Jenny Davidson, Rohan Kimber

GRDC | 138 | CuRRenT AnD PoTenTiAl CosTs fRoM DiseAses of Pulse CRoPs in AusTRAliA
Table B.a.12 Presence, incidence, severity and contribution to control estimates of diseases of field peas in the Tasmanian Zone
Disease Present in zone
Incidence Severity Contribution to control (%)
% of years % area affected
No control ControlBreeding Cultural Pesticide
% loss % loss
Necrotrophic leaf fungi
leaf and pod spot
grey mould
pepper spot
Phoma black spot
Koolunga black spot
Mycosphaerella black spot Y 40 80 40 10 0 90 10
Septoria blotch Y 10 10 5 1 0 80 20
black spot complex
Biotrophic leaf fungi
powdery mildew Y 90 20 30 5 50 10 40
downy mildew Y 10 10 5 1 0 80 20
Root and crown fungi
Aphanomyces root rot
Bot damping off, root rot
Fusarium wilt P
charcoal rot
Mycosphaerella foot rot P
Phoma foot rot P
Pyth damping off/root rot
Rhizoc seed and stem rot
bare patch
epicotyl rot
Sclerotinia stem rot
Nematodes
stem nematode
root knot nematode
root lesion nem neglectus
root lesion nem penetrans
root lesion nem teres
root lesion nem thornei
burrowing nematode
Bacteria
pisi bacterial blight P
syringae bacterial blight P
Viruses
alfalfa mosaic
bean common mosaic
bean leafroll
bean yellow mosaic
beet western yellows
clover yellow vein
cucumber mosaic
pea seedborne mosaic
soybean dwarf
subterranean clover stunt
tomato spotted wiltY = present in region P = present but no assessment of incidence and severity Contributor: Geoff Dean

CuRRenT AnD PoTenTiAl CosTs fRoM DiseAses of Pulse CRoPs in AusTRAliA | 139 | GRDC
Table B.a.14 Presence, incidence, severity and contribution to control estimates of diseases of field peas in the Western Australian Central Zone
Disease Present in zone
Incidence Severity Contribution to control (%)
% of years % area affected
No control ControlBreeding Cultural Pesticide
% loss % loss
Necrotrophic leaf fungi
leaf and pod spot P
grey mould P
pepper spot U
Phoma black spot P
Koolunga black spot N
Mycosphaerella black spot P
Septoria blotch Y 100 60 5 3 0 100 0
black spot complex Y 100 100 100 30 0 100 0
Biotrophic leaf fungi
powdery mildew Y 10 10 2 2 100 0 0
downy mildew Y 100 50 15 15 50 50 0
Root and crown fungi
Aphanomyces root rot N
Bot damping off, root rot N
Fusarium wilt U
charcoal rot N
Mycosphaerella foot rot N
Phoma foot rot N
Pyth damping off/root rot Y 10 10 3 3 0 0 0
Rhizoc seed and stem rot U
bare patch Y 100 10 5 2 0 100 0
epicotyl rot Y 70 35 2 2 0 0 0
Sclerotinia stem rot Y 10 1 0 0 0 0 0
Nematodes
stem nematode N
root knot nematode U
root lesion nem neglectus U
root lesion nem penetrans Y 100 10 30 5 0 100 0
root lesion nem teres P
root lesion nem thornei Y 50 2 1 1 0 100 0
burrowing nematode P
Bacteria
pisi bacterial blight Y 20 25 2 2 0 100 0
syringae bacterial blight U
Viruses
alfalfa mosaic U
bean common mosaic U
bean leafroll U
bean yellow mosaic P
beet western yellows P
clover yellow vein U
cucumber mosaic U
pea seedborne mosaic Y 50 90 10 1 0 100 0
soybean dwarf U
subterranean clover stunt U
tomato spotted wilt UY = present in region P = present but no assessment of incidence and severity U = status on this crop unknown N = not present on this cropContributor: Bill Macleod

GRDC | 140 | CuRRenT AnD PoTenTiAl CosTs fRoM DiseAses of Pulse CRoPs in AusTRAliA
Table B.a.16 Presence, incidence, severity and contribution to control estimates of diseases of field peas in the Western Australian Sandplain-Mallee Zone
Disease Present in zone
Incidence Severity Contribution to control (%)
% of years % area affected
No control ControlBreeding Cultural Pesticide
% loss % loss
Necrotrophic leaf fungi
leaf and pod spot P
grey mould P
pepper spot U
Phoma black spot P
Koolunga black spot N
Mycosphaerella black spot P
Septoria blotch Y 100 30 5 3 0 100 0
black spot complex Y 100 100 100 30 0 100 0
Biotrophic leaf fungi
powdery mildew Y 10 10 2 2 100 0 0
downy mildew Y 100 50 15 15 50 50 0
Root and crown fungi
Aphanomyces root rot N
Bot damping off, root rot N
Fusarium wilt U
charcoal rot N
Mycosphaerella foot rot N
Phoma foot rot N
Pyth damping off/root rot Y 10 10 3 3 0 0 0
Rhizoc seed and stem rot U
bare patch Y 100 40 15 7 0 100 0
epicotyl rot Y 50 5 2 2 0 0 0
Sclerotinia stem rot Y 10 1 2 2 0 0 0
Nematodes
stem nematode N
root knot nematode U
root lesion nem neglectus U
root lesion nem penetrans Y 100 10 30 5 0 100 0
root lesion nem teres P
root lesion nem thornei Y 50 2 1 1 0 100 0
burrowing nematode P
Bacteria
pisi bacterial blight Y 20 25 2 2 0 100 0
syringae bacterial blight U
Viruses
alfalfa mosaic U
bean common mosaic U
bean leafroll U
bean yellow mosaic P
beet western yellows P
clover yellow vein U
cucumber mosaic U
pea seedborne mosaic Y 65 90 45 5 0 100 0
soybean dwarf U
subterranean clover stunt U
tomato spotted wilt U
Y = present in region P = present but no assessment of incidence and severity U = status on this crop unknown N = not present on this cropContributor: Bill Macleod
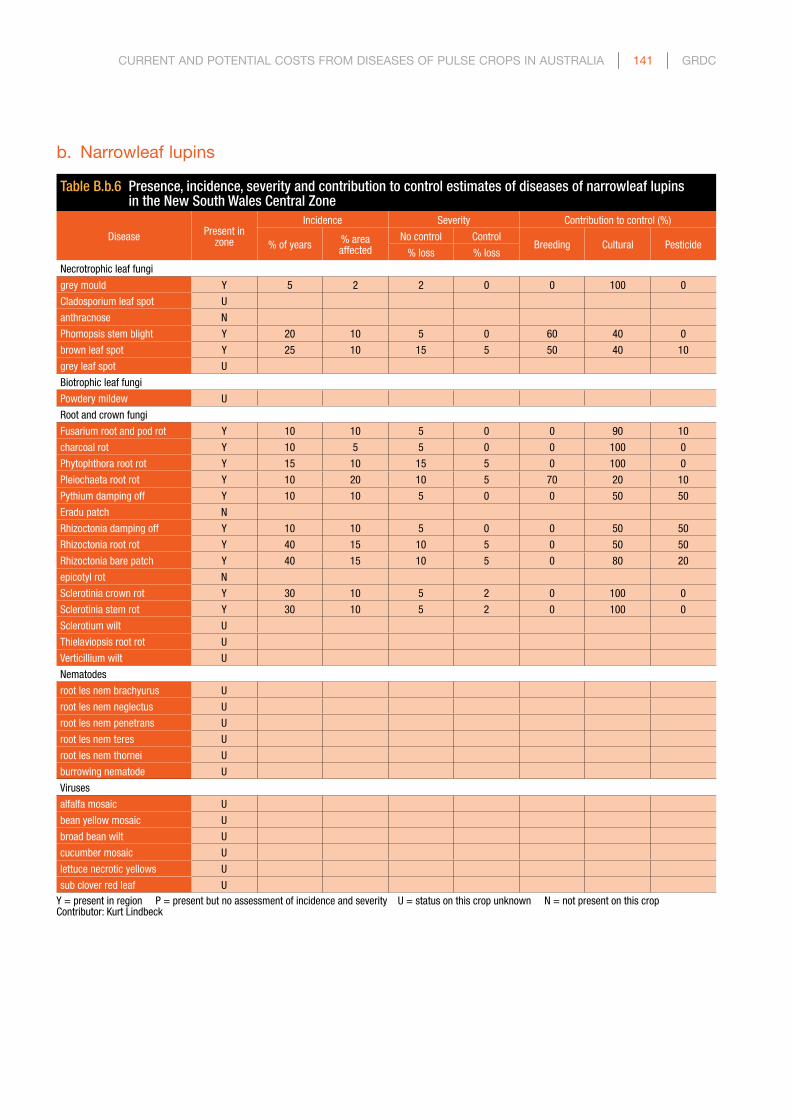
CuRRenT AnD PoTenTiAl CosTs fRoM DiseAses of Pulse CRoPs in AusTRAliA | 141 | GRDC
b. narrowleaf lupins
Table B.b.6 Presence, incidence, severity and contribution to control estimates of diseases of narrowleaf lupins in the New South Wales Central Zone
Disease Present in zone
Incidence Severity Contribution to control (%)
% of years % area affected
No control ControlBreeding Cultural Pesticide
% loss % loss
Necrotrophic leaf fungi
grey mould Y 5 2 2 0 0 100 0
Cladosporium leaf spot U
anthracnose N
Phomopsis stem blight Y 20 10 5 0 60 40 0
brown leaf spot Y 25 10 15 5 50 40 10
grey leaf spot U
Biotrophic leaf fungi
Powdery mildew U
Root and crown fungi
Fusarium root and pod rot Y 10 10 5 0 0 90 10
charcoal rot Y 10 5 5 0 0 100 0
Phytophthora root rot Y 15 10 15 5 0 100 0
Pleiochaeta root rot Y 10 20 10 5 70 20 10
Pythium damping off Y 10 10 5 0 0 50 50
Eradu patch N
Rhizoctonia damping off Y 10 10 5 0 0 50 50
Rhizoctonia root rot Y 40 15 10 5 0 50 50
Rhizoctonia bare patch Y 40 15 10 5 0 80 20
epicotyl rot N
Sclerotinia crown rot Y 30 10 5 2 0 100 0
Sclerotinia stem rot Y 30 10 5 2 0 100 0
Sclerotium wilt U
Thielaviopsis root rot U
Verticillium wilt U
Nematodes
root les nem brachyurus U
root les nem neglectus U
root les nem penetrans U
root les nem teres U
root les nem thornei U
burrowing nematode U
Viruses
alfalfa mosaic U
bean yellow mosaic U
broad bean wilt U
cucumber mosaic U
lettuce necrotic yellows U
sub clover red leaf UY = present in region P = present but no assessment of incidence and severity U = status on this crop unknown N = not present on this cropContributor: Kurt Lindbeck
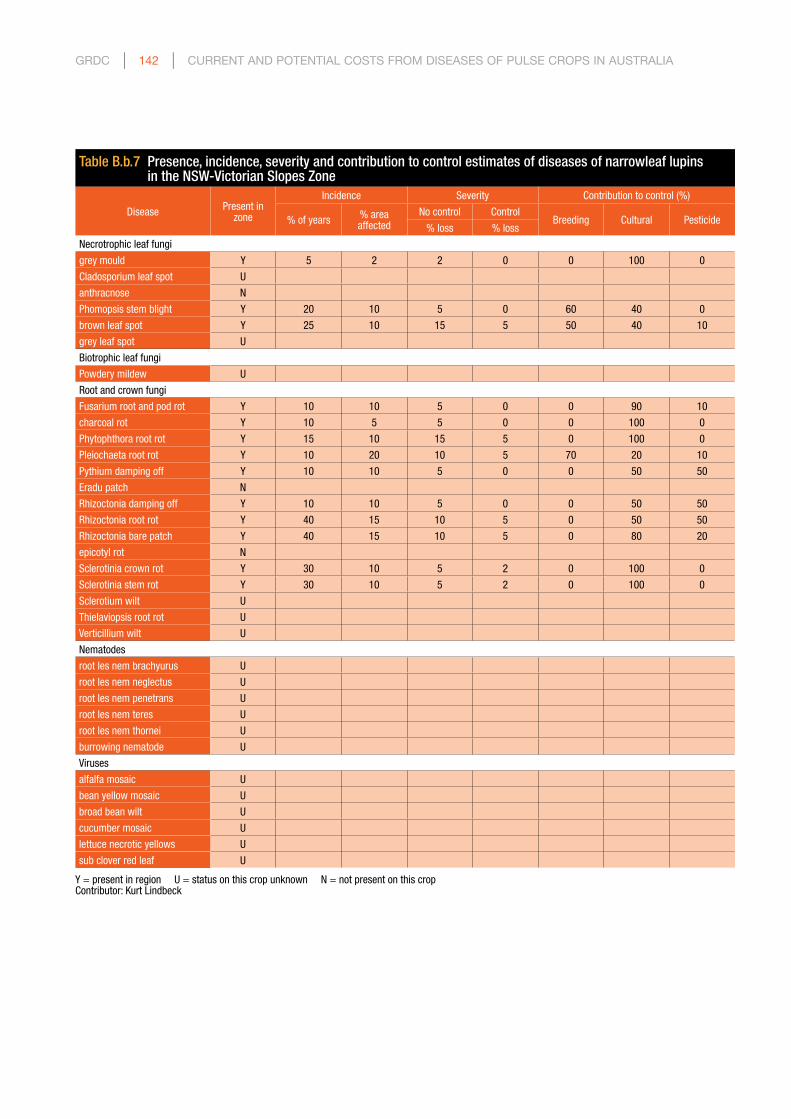
GRDC | 142 | CuRRenT AnD PoTenTiAl CosTs fRoM DiseAses of Pulse CRoPs in AusTRAliA
Table B.b.7 Presence, incidence, severity and contribution to control estimates of diseases of narrowleaf lupins in the NSW-Victorian Slopes Zone
Disease Present in zone
Incidence Severity Contribution to control (%)
% of years % area affected
No control ControlBreeding Cultural Pesticide
% loss % loss
Necrotrophic leaf fungi
grey mould Y 5 2 2 0 0 100 0
Cladosporium leaf spot U
anthracnose N
Phomopsis stem blight Y 20 10 5 0 60 40 0
brown leaf spot Y 25 10 15 5 50 40 10
grey leaf spot U
Biotrophic leaf fungi
Powdery mildew U
Root and crown fungi
Fusarium root and pod rot Y 10 10 5 0 0 90 10
charcoal rot Y 10 5 5 0 0 100 0
Phytophthora root rot Y 15 10 15 5 0 100 0
Pleiochaeta root rot Y 10 20 10 5 70 20 10
Pythium damping off Y 10 10 5 0 0 50 50
Eradu patch N
Rhizoctonia damping off Y 10 10 5 0 0 50 50
Rhizoctonia root rot Y 40 15 10 5 0 50 50
Rhizoctonia bare patch Y 40 15 10 5 0 80 20
epicotyl rot N
Sclerotinia crown rot Y 30 10 5 2 0 100 0
Sclerotinia stem rot Y 30 10 5 2 0 100 0
Sclerotium wilt U
Thielaviopsis root rot U
Verticillium wilt U
Nematodes
root les nem brachyurus U
root les nem neglectus U
root les nem penetrans U
root les nem teres U
root les nem thornei U
burrowing nematode U
Viruses
alfalfa mosaic U
bean yellow mosaic U
broad bean wilt U
cucumber mosaic U
lettuce necrotic yellows U
sub clover red leaf U
Y = present in region U = status on this crop unknown N = not present on this cropContributor: Kurt Lindbeck

CuRRenT AnD PoTenTiAl CosTs fRoM DiseAses of Pulse CRoPs in AusTRAliA | 143 | GRDC
Table B.b.8 Presence, incidence, severity and contribution to control estimates of diseases of narrowleaf lupins in the Victorian High Rainfall Zone
Disease Present in zone
Incidence Severity Contribution to control (%)
% of years % area affected
No control ControlBreeding Cultural Pesticide
% loss % loss
Necrotrophic leaf fungi
grey mould Y 5 2 1 0 0 100 0
Cladosporium leaf spot U
anthracnose N
Phomopsis stem blight Y 20 10 5 0 60 40 0
brown leaf spot Y 25 10 10 5 50 40 10
grey leaf spot U
Biotrophic leaf fungi
Powdery mildew U
Root and crown fungi
Fusarium root and pod rot Y 10 10 5 0 0 90 10
charcoal rot Y 10 5 5 0 0 100 0
Phytophthora root rot Y 20 10 10 5 0 100 0
Pleiochaeta root rot Y 20 10 10 5 70 20 10
Pythium damping off Y 10 10 5 0 0 50 50
Eradu patch N
Rhizoctonia damping off Y 10 10 5 0 0 50 50
Rhizoctonia root rot Y 30 10 10 0 0 50 50
Rhizoctonia bare patch Y 30 10 10 0 0 80 20
epicotyl rot N
Sclerotinia crown rot Y 30 10 10 2 0 100 0
Sclerotinia stem rot Y 30 10 10 2 0 100 0
Sclerotium wilt U
Thielaviopsis root rot U
Verticillium wilt U
Nematodes
root les nem brachyurus U
root les nem neglectus U
root les nem penetrans U
root les nem teres U
root les nem thornei U
burrowing nematode U
Viruses
alfalfa mosaic U
bean yellow mosaic U
broad bean wilt U
cucumber mosaic U
lettuce necrotic yellows U
sub clover red leaf U
Y = present in region U = status on this crop unknown N = not present on this cropContributor: Kurt Lindbeck

GRDC | 144 | CuRRenT AnD PoTenTiAl CosTs fRoM DiseAses of Pulse CRoPs in AusTRAliA
Table B.b.9 Presence, incidence, severity and contribution to control estimates of diseases of narrowleaf lupins in the South Australian-Victorian Mallee Zone
Disease Present in zone
Incidence Severity Contribution to control (%)
% of years % area affected
No control ControlBreeding Cultural Pesticide
% loss % loss
Necrotrophic leaf fungi
grey mould Y 6 5 5 0 0 33 67
Cladosporium leaf spot U 0 0 0
anthracnose N 0 0 0
Phomopsis stem blight Y 20 13 2 0 53 47 0
brown leaf spot Y 52 27 22 0 37 33 30
grey leaf spot Y 23 10 10 10 0 0 0
Biotrophic leaf fungi
Powdery mildew U
Root and crown fungi
Fusarium root and pod rot Y 5 5 5 0 0 90 10
charcoal rot Y 5 5 5 0 0 100 0
Phytophthora root rot Y 5 5 5 0 0 100 0
Pleiochaeta root rot Y 20 13 20 0 57 7 37
Pythium damping off Y 2 2 2 0 0 50 50
Eradu patch N 0 0 0
Rhizoctonia damping off Y 3 3 3 0 0 50 50
Rhizoctonia root rot Y 13 10 5 0 0 50 50
Rhizoctonia bare patch Y 25 20 10 0 0 80 20
epicotyl rot Y 0 0 0 0 0 0 0
Sclerotinia crown rot Y 5 10 5 0 0 90 10
Sclerotinia stem rot Y 5 10 5 0 0 90 10
Sclerotium wilt Y 5 13 5 0 0 80 20
Thielaviopsis root rot Y 25 15 25 10 0 100 0
Verticillium wilt U 5 5 5 0 0 0 0
Nematodes
root les nem brachyurus U
root les nem neglectus U
root les nem penetrans U
root les nem teres U
root les nem thornei U
burrowing nematode U
Viruses
alfalfa mosaic U
bean yellow mosaic U
broad bean wilt U
cucumber mosaic Y 100 10 15 0 0 100 0
lettuce necrotic yellows U
sub clover red leaf U
Y = present in region U = status on this crop unknown N = not present on this cropContributors: Jenny Davidson, Rohan Kimber, Kurt Lindbeck

CuRRenT AnD PoTenTiAl CosTs fRoM DiseAses of Pulse CRoPs in AusTRAliA | 145 | GRDC
Table B.b.10 Presence, incidence, severity and contribution to control estimates of diseases of narrowleaf lupins in the South Australian-Victorian Border Wimmera Zone
Disease Present in zone
Incidence Severity Contribution to control (%)
% of years % area affected
No control ControlBreeding Cultural Pesticide
% loss % loss
Necrotrophic leaf fungi
grey mould Y 5 5 5 0 0 100 0
Cladosporium leaf spot
anthracnose N
Phomopsis stem blight Y 20 20 5 0 60 40 0
brown leaf spot Y 25 20 10 0 50 40 10
grey leaf spot U
Biotrophic leaf fungi
Powdery mildew U
Root and crown fungi
Fusarium root and pod rot Y 5 5 5 0 0 90 10
charcoal rot Y 5 5 5 0 0 100 0
Phytophthora root rot Y 5 5 5 0 0 100 0
Pleiochaeta root rot Y 10 20 10 0 70 20 10
Pythium damping off Y 5 5 5 0 0 50 50
Eradu patch N
Rhizoctonia damping off Y 5 5 5 0 0 50 50
Rhizoctonia root rot Y 25 20 10 0 0 50 50
Rhizoctonia bare patch Y 25 20 10 0 0 80 20
epicotyl rot N
Sclerotinia crown rot Y 5 5 5 0 0 100 0
Sclerotinia stem rot Y 5 5 5 0 0 100 0
Sclerotium wilt U
Thielaviopsis root rot U
Verticillium wilt U
Nematodes
root les nem brachyurus U
root les nem neglectus U
root les nem penetrans U
root les nem teres U
root les nem thornei U
burrowing nematode U
Viruses
alfalfa mosaic U
bean yellow mosaic U
broad bean wilt U
cucumber mosaic U
lettuce necrotic yellows U
sub clover red leaf U
Y = present in region U = status on this crop unknown N = not present on this cropContributor: Kurt Lindbeck

GRDC | 146 | CuRRenT AnD PoTenTiAl CosTs fRoM DiseAses of Pulse CRoPs in AusTRAliA
Table B.b.12 Presence, incidence, severity and contribution to control estimates of diseases of narrowleaf lupins in the Tasmanian Zone
Disease Present in zone
Incidence Severity Contribution to control (%)
% of years % area affected
No control ControlBreeding Cultural Pesticide
% loss % loss
Necrotrophic leaf fungi
grey mould P
Cladosporium leaf spot U
anthracnose Y 5 1 90 80 0 100 0
Phomopsis stem blight U
brown leaf spot Y 30 20 5 1 50 40 10
grey leaf spot U
Biotrophic leaf fungi
Powdery mildew U
Root and crown fungi
Fusarium root and pod rot U
charcoal rot U
Phytophthora root rot U
Pleiochaeta root rot U
Pythium damping off U
Eradu patch U
Rhizoctonia damping off U
Rhizoctonia root rot U
Rhizoctonia bare patch U
epicotyl rot U
Sclerotinia crown rot U
Sclerotinia stem rot U
Sclerotium wilt U
Thielaviopsis root rot U
Verticillium wilt U
Nematodes
root les nem brachyurus U
root les nem neglectus U
root les nem penetrans U
root les nem teres U
root les nem thornei U
burrowing nematode U
Viruses
alfalfa mosaic U
bean yellow mosaic U
broad bean wilt U
cucumber mosaic U
lettuce necrotic yellows U
sub clover red leaf U
Y = present in region P = present but no assessment of incidence and severity U = status on this crop unknown Contributor: Geoff Dean

CuRRenT AnD PoTenTiAl CosTs fRoM DiseAses of Pulse CRoPs in AusTRAliA | 147 | GRDC
Table B.b.13 Presence, incidence, severity and contribution to control estimates of diseases of narrowleaf lupins in the Western Australian Northern Zone
Disease Present in zone
Incidence Severity Contribution to control (%)
% of years % area affected
No control ControlBreeding Cultural Pesticide
% loss % loss
Necrotrophic leaf fungi
grey mould P
Cladosporium leaf spot U
anthracnose Y 50 40 100 10 75 15 10
Phomopsis stem blight P
brown leaf spot Y 100 100 100 5 5 65 30
grey leaf spot P
Biotrophic leaf fungi
Powdery mildew P
Root and crown fungi
Fusarium root and pod rot U
charcoal rot Y 5 1 0 0
Phytophthora root rot U
Pleiochaeta root rot Y 100 100 100 10 0 100 0
Pythium damping off P
Eradu patch Y 100 10 10 7 0 100 0
Rhizoctonia damping off U
Rhizoctonia root rot P
Rhizoctonia bare patch Y 100 25 10 5 0 100 0
epicotyl rot Y 100 50 50 1 0 90 10
Sclerotinia crown rot Y 50 0.5 20 20 0 0 0
Sclerotinia stem rot Y 50 0.5 20 20 0 0 0
Sclerotium wilt N
Thielaviopsis root rot N
Verticillium wilt N
Nematodes
root les nem brachyurus U
root les nem neglectus Y 100 0 0 0 0 100 0
root les nem penetrans P
root les nem teres P
root les nem thornei U
burrowing nematode P
Viruses
alfalfa mosaic P
bean yellow mosaic P
broad bean wilt U
cucumber mosaic P
lettuce necrotic yellows U
sub clover red leaf U
Y = present in region P = present but no assessment of incidence and severity U = status on this crop unknown Contributor: Bill Macleod

GRDC | 148 | CuRRenT AnD PoTenTiAl CosTs fRoM DiseAses of Pulse CRoPs in AusTRAliA
Table B.b.14 Presence, incidence, severity and contribution to control estimates of diseases of narrowleaf lupins in the Western Australian Central Zone
Disease Present in zone
Incidence Severity Contribution to control (%)
% of years % area affected
No control ControlBreeding Cultural Pesticide
% loss % loss
Necrotrophic leaf fungi
grey mould P
Cladosporium leaf spot U
anthracnose Y 50 40 100 10 75 15 10
Phomopsis stem blight P 100 100 na na 100 0 0
brown leaf spot Y 100 100 100 5 5 65 30
grey leaf spot P
Biotrophic leaf fungi
Powdery mildew P
Root and crown fungi
Fusarium root and pod rot U
charcoal rot Y 5 1 0 0
Phytophthora root rot U
Pleiochaeta root rot Y 100 100 100 10 0 100 0
Pythium damping off P
Eradu patch Y 100 10 10 7 0 100 0
Rhizoctonia damping off U
Rhizoctonia root rot P
Rhizoctonia bare patch Y 100 25 10 5 0 100 0
epicotyl rot Y 100 50 50 1 0 90 10
Sclerotinia crown rot Y 50 0.5 20 20 0 0 0
Sclerotinia stem rot Y 50 0.5 20 20 0 0 0
Sclerotium wilt N
Thielaviopsis root rot N
Verticillium wilt N
Nematodes
root les nem brachyurus U
root les nem neglectus Y 100 0 0 0 0 100 0
root les nem penetrans P
root les nem teres P
root les nem thornei U
burrowing nematode P
Viruses
alfalfa mosaic P
bean yellow mosaic P
broad bean wilt U
cucumber mosaic P
lettuce necrotic yellows U
sub clover red leaf U
Y = present in region P = present but no assessment of incidence and severity U = status on this crop unknown N = not present on this cropContributor: Bill Macleod

CuRRenT AnD PoTenTiAl CosTs fRoM DiseAses of Pulse CRoPs in AusTRAliA | 149 | GRDC
Table B.b.15 Presence, incidence, severity and contribution to control estimates of diseases of narrowleaf lupins in the Western Australian Eastern Zone
Disease Present in zone
Incidence Severity Contribution to control (%)
% of years % area affected
No control ControlBreeding Cultural Pesticide
% loss % loss
Necrotrophic leaf fungi
grey mould P
Cladosporium leaf spot U
anthracnose Y 0 0 0 0 75 15 10
Phomopsis stem blight P
brown leaf spot Y 100 100 100 5 5 65 30
grey leaf spot Y 0 0 0 0 100 0 0
Biotrophic leaf fungi
Powdery mildew P
Root and crown fungi
Fusarium root and pod rot U
charcoal rot P
Phytophthora root rot U
Pleiochaeta root rot Y 100 100 100 10 0 100 0
Pythium damping off P
Eradu patch U
Rhizoctonia damping off U
Rhizoctonia root rot P
Rhizoctonia bare patch Y 100 25 10 5 0 100 0
epicotyl rot Y 10 1 50 1 0 90 10
Sclerotinia crown rot N
Sclerotinia stem rot N
Sclerotium wilt N
Thielaviopsis root rot N
Verticillium wilt N
Nematodes
root les nem brachyurus U
root les nem neglectus Y 100 0 0 0 0 100 0
root les nem penetrans P
root les nem teres P
root les nem thornei U
burrowing nematode P
Viruses
alfalfa mosaic U
bean yellow mosaic U
broad bean wilt U
cucumber mosaic U
lettuce necrotic yellows U
sub clover red leaf U
Y = present in region P = present but no assessment of incidence and severity U = status on this crop unknown N = not present on this cropContributor: Bill Macleod

GRDC | 150 | CuRRenT AnD PoTenTiAl CosTs fRoM DiseAses of Pulse CRoPs in AusTRAliA
Table B.b.16 Presence, incidence, severity and contribution to control estimates of diseases of narrowleaf lupins in the Western Australian Sandplain-Mallee Zone
Disease Present in zone
Incidence Severity Contribution to control (%)
% of years % area affected
No control ControlBreeding Cultural Pesticide
% loss % loss
Necrotrophic leaf fungi
grey mould P
Cladosporium leaf spot U
anthracnose Y 5 1 70 10 75 15 10
Phomopsis stem blight P
brown leaf spot Y 100 100 100 5 5 65 30
grey leaf spot P
Biotrophic leaf fungi
Powdery mildew P
Root and crown fungi
Fusarium root and pod rot U
charcoal rot U
Phytophthora root rot U
Pleiochaeta root rot Y 100 100 50 5 0 100 0
Pythium damping off P
Eradu patch U
Rhizoctonia damping off U
Rhizoctonia root rot P
Rhizoctonia bare patch Y 100 50 20 5 0 100 0
epicotyl rot Y 100 5 10 0.5 0 90 10
Sclerotinia crown rot Y 80 0.5 20 20 0 0 0
Sclerotinia stem rot Y 30 0.5 20 20 0 0 0
Sclerotium wilt N
Thielaviopsis root rot N
Verticillium wilt N
Nematodes
root les nem brachyurus U
root les nem neglectus Y 100 0 0 0 0 100 0
root les nem penetrans P
root les nem teres P
root les nem thornei U
burrowing nematode P
Viruses
alfalfa mosaic U
bean yellow mosaic U
broad bean wilt U
cucumber mosaic U
lettuce necrotic yellows U
sub clover red leaf U
Y = present in region P = present but no assessment of incidence and severity U = status on this crop unknown N = not present on this cropContributor: Bill Macleod

CuRRenT AnD PoTenTiAl CosTs fRoM DiseAses of Pulse CRoPs in AusTRAliA | 151 | GRDC
c. Albus lupins
Table B.c.6 Presence, incidence, severity and contribution to control estimates of diseases of albus lupins in the NSW Central Zone
Disease Present in zone
Incidence Severity Contribution to control (%)
% of years % area affected
No control ControlBreeding Cultural Pesticide
% loss % loss
Necrotrophic leaf fungi
grey mould Y 5 5 5 0 0 90 10
anthracnose N
Phomopsis stem blight Y 50 20 5 0 80 20 0
brown leaf spot Y 20 20 5 0 80 20 0
Biotrophic leaf fungi
powdery mildew N
Root and crown fungi
Fusarium root and pod rot Y 10 10 5 0 0 80 20
charcoal rot Y 10 5 5 0 0 100 0
Pleiochaeta root rot Y 60 15 15 5 50 40 10
Pythium damping off Y 20 10 10 0 0 80 20
Eradu patch N
Rhizoctonia damping off Y 20 10 10 5 0 80 20
Rhizoctonia root rot Y 30 20 10 5 0 80 20
Rhizoctonia bare patch Y 30 20 10 5 0 80 20
Sclerotinia crown rot Y 10 5 5 0 0 70 30
Sclerotinia stem rot Y 10 5 5 0 0 70 30
Sclerotium wilt U
sudden death Y 10 10 15 5 0 100 0
Viruses
alfalfa mosaic U
bean yellow mosaic U
broad bean wilt U
cucumber mosaic U
lettuce necrotic yellows U
sub clover red leaf U
Y = present in region U = status on this crop unknown N = not present on this cropContributor: Kurt Lindbeck

GRDC | 152 | CuRRenT AnD PoTenTiAl CosTs fRoM DiseAses of Pulse CRoPs in AusTRAliA
Table B.c.7 Presence, incidence, severity and contribution to control estimates of diseases of albus lupins in the NSW-Victorian Slopes Zone
Disease Present in zone
Incidence Severity Contribution to control (%)
% of years % area affected
No control ControlBreeding Cultural Pesticide
% loss % loss
Necrotrophic leaf fungi
grey mould Y 5 5 5 0 0 90 10
anthracnose N
Phomopsis stem blight Y 50 20 5 0 80 20 0
brown leaf spot Y 20 20 5 0 80 20 0
Biotrophic leaf fungi
powdery mildew N
Root and crown fungi
Fusarium root and pod rot Y 10 10 5 0 0 80 20
charcoal rot Y 10 5 5 0 0 100 0
Pleiochaeta root rot Y 60 15 15 5 50 40 10
Pythium damping off Y 20 10 10 0 0 80 20
Eradu patch N
Rhizoctonia damping off Y 20 10 10 5 0 80 20
Rhizoctonia root rot Y 30 20 10 5 0 80 20
Rhizoctonia bare patch Y 30 20 10 5 0 80 20
Sclerotinia crown rot Y 10 5 5 0 0 70 30
Sclerotinia stem rot Y 10 5 5 0 0 70 30
Sclerotium wilt U
sudden death Y 10 10 15 5 0 100 0
Viruses
alfalfa mosaic U
bean yellow mosaic U
broad bean wilt U
cucumber mosaic U
lettuce necrotic yellows U
sub clover red leaf U
Y = present in region U = status on this crop unknown N = not present on this cropContributor: Kurt Lindbeck

CuRRenT AnD PoTenTiAl CosTs fRoM DiseAses of Pulse CRoPs in AusTRAliA | 153 | GRDC
Table B.c.8 Presence, incidence, severity and contribution to control estimates of diseases of albus lupins in the Victorian High Rainfall Zone
Disease Present in zone
Incidence Severity Contribution to control (%)
% of years % area affected
No control ControlBreeding Cultural Pesticide
% loss % loss
Necrotrophic leaf fungi
grey mould Y 5 5 5 0 0 90 10
anthracnose N
Phomopsis stem blight Y 50 20 20 0 80 20 0
brown leaf spot Y 20 20 20 0 80 20 0
Biotrophic leaf fungi
powdery mildew N
Root and crown fungi
Fusarium root and pod rot Y 10 10 10 0 0 80 20
charcoal rot Y 10 5 5 0 0 100 0
Pleiochaeta root rot Y 50 20 20 5 50 40 10
Pythium damping off Y 20 20 20 5 0 80 20
Eradu patch N
Rhizoctonia damping off Y 20 10 10 5 0 80 20
Rhizoctonia root rot Y 20 10 10 5 0 80 20
Rhizoctonia bare patch Y 20 10 10 5 0 80 20
Sclerotinia crown rot Y 15 5 5 0 0 70 30
Sclerotinia stem rot Y 15 10 10 5 0 70 30
Sclerotium wilt U
sudden death Y 10 15 15 5 0 100 0
Viruses
alfalfa mosaic U
bean yellow mosaic U
broad bean wilt U
cucumber mosaic U
lettuce necrotic yellows U
sub clover red leaf U
Y = present in region U = status on this crop unknown N = not present on this cropContributor: Kurt Lindbeck

GRDC | 154 | CuRRenT AnD PoTenTiAl CosTs fRoM DiseAses of Pulse CRoPs in AusTRAliA
Table B.c.9 Presence, incidence, severity and contribution to control estimates of diseases of albus lupins in the South Australian-Victorian Mallee Zone
Disease Present in zone
Incidence Severity Contribution to control (%)
% of years % area affected
No control ControlBreeding Cultural Pesticide
% loss % loss
Necrotrophic leaf fungi
grey mould Y 5 5 5 0 0 90 10
anthracnose N
Phomopsis stem blight Y 10 10 5 0 80 20 0
brown leaf spot Y 15 10 5 0 80 20 0
Biotrophic leaf fungi
powdery mildew N
Root and crown fungi
Fusarium root and pod rot Y 10 5 5 0 0 80 20
charcoal rot U 0 100 0
Pleiochaeta root rot Y 20 10 15 5 50 40 10
Pythium damping off Y 10 5 5 0 0 80 20
Eradu patch N
Rhizoctonia damping off Y 10 10 5 0 0 80 20
Rhizoctonia root rot Y 20 10 10 5 0 80 20
Rhizoctonia bare patch Y 20 15 10 5 0 80 20
Sclerotinia crown rot Y 5 5 5 0 0 70 30
Sclerotinia stem rot Y 5 5 5 0 0 70 30
Sclerotium wilt U
sudden death U
Viruses
alfalfa mosaic U
bean yellow mosaic U
broad bean wilt U
cucumber mosaic U
lettuce necrotic yellows U
sub clover red leaf U
Y = present in region U = status on this crop unknown N = not present on this cropContributor: Kurt Lindbeck

CuRRenT AnD PoTenTiAl CosTs fRoM DiseAses of Pulse CRoPs in AusTRAliA | 155 | GRDC
Table B.c.10 Presence, incidence, severity and contribution to control estimates of diseases of albus lupins in the South Australian-Victorian Wimmera Zone
Disease Present in zone
Incidence Severity Contribution to control (%)
% of years % area affected
No control ControlBreeding Cultural Pesticide
% loss % loss
Necrotrophic leaf fungi
grey mould Y 5 5 5 0 0 90 10
anthracnose N
Phomopsis stem blight Y 20 10 5 0 80 20 0
brown leaf spot Y 30 10 5 0 80 20 0
Biotrophic leaf fungi
powdery mildew N
Root and crown fungi
Fusarium root and pod rot Y 10 10 5 0 0 80 20
charcoal rot Y 5 5 5 2 0 100 0
Pleiochaeta root rot Y 30 10 10 0 50 40 10
Pythium damping off Y 15 10 10 0 0 80 20
Eradu patch N
Rhizoctonia damping off Y 20 10 10 5 0 80 20
Rhizoctonia root rot Y 20 20 10 5 0 80 20
Rhizoctonia bare patch Y 20 20 10 5 0 80 20
Sclerotinia crown rot Y 15 10 5 0 0 70 30
Sclerotinia stem rot Y 15 10 5 0 0 70 30
Sclerotium wilt U
sudden death U
Viruses
alfalfa mosaic U
bean yellow mosaic U
broad bean wilt U
cucumber mosaic U
lettuce necrotic yellows U
sub clover red leaf U
Y = present in region U = status on this crop unknown N = not present on this cropContributor: Kurt Lindbeck

GRDC | 156 | CuRRenT AnD PoTenTiAl CosTs fRoM DiseAses of Pulse CRoPs in AusTRAliA
Table B.c.12 Presence, incidence, severity and contribution to control estimates of diseases of albus lupins in the Tasmanian Zone
Disease Present in zone
Incidence Severity Contribution to control (%)
% of years % area affected
No control ControlBreeding Cultural Pesticide
% loss % loss
Necrotrophic leaf fungi
grey mould U
anthracnose Y 5 1 90 80 0 100 0
Phomopsis stem blight U
brown leaf spot Y 40 50 5 1 80 20 0
Biotrophic leaf fungi
powdery mildew U
Root and crown fungi
Fusarium root and pod rot U
charcoal rot U
Pleiochaeta root rot Y 40 50 5 1 0 0 100
Pythium damping off U
Eradu patch U
Rhizoctonia damping off U
Rhizoctonia root rot U
Rhizoctonia bare patch U
Sclerotinia crown rot U
Sclerotinia stem rot U
Sclerotium wilt U
sudden death U
Viruses
alfalfa mosaic U
bean yellow mosaic U
broad bean wilt U
cucumber mosaic U
lettuce necrotic yellows U
sub clover red leaf U
Y = present in region U = status on this crop unknown Contributor: Geoff Dean
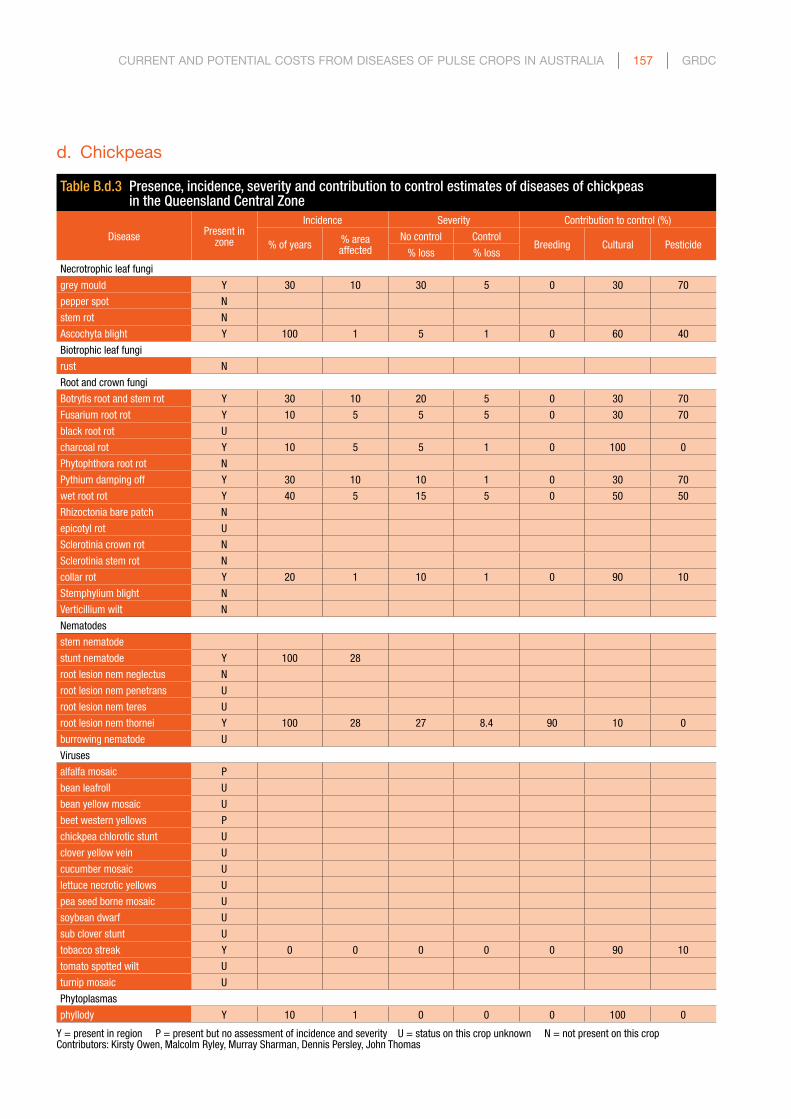
CuRRenT AnD PoTenTiAl CosTs fRoM DiseAses of Pulse CRoPs in AusTRAliA | 157 | GRDC
d. Chickpeas
Table B.d.3 Presence, incidence, severity and contribution to control estimates of diseases of chickpeas in the Queensland Central Zone
Disease Present in zone
Incidence Severity Contribution to control (%)
% of years % area affected
No control ControlBreeding Cultural Pesticide
% loss % loss
Necrotrophic leaf fungi
grey mould Y 30 10 30 5 0 30 70
pepper spot N
stem rot N
Ascochyta blight Y 100 1 5 1 0 60 40
Biotrophic leaf fungi
rust N
Root and crown fungi
Botrytis root and stem rot Y 30 10 20 5 0 30 70
Fusarium root rot Y 10 5 5 5 0 30 70
black root rot U
charcoal rot Y 10 5 5 1 0 100 0
Phytophthora root rot N
Pythium damping off Y 30 10 10 1 0 30 70
wet root rot Y 40 5 15 5 0 50 50
Rhizoctonia bare patch N
epicotyl rot U
Sclerotinia crown rot N
Sclerotinia stem rot N
collar rot Y 20 1 10 1 0 90 10
Stemphylium blight N
Verticillium wilt N
Nematodes
stem nematode
stunt nematode Y 100 28
root lesion nem neglectus N
root lesion nem penetrans U
root lesion nem teres U
root lesion nem thornei Y 100 28 27 8.4 90 10 0
burrowing nematode U
Viruses
alfalfa mosaic P
bean leafroll U
bean yellow mosaic U
beet western yellows P
chickpea chlorotic stunt U
clover yellow vein U
cucumber mosaic U
lettuce necrotic yellows U
pea seed borne mosaic U
soybean dwarf U
sub clover stunt U
tobacco streak Y 0 0 0 0 0 90 10
tomato spotted wilt U
turnip mosaic U
Phytoplasmas
phyllody Y 10 1 0 0 0 100 0
Y = present in region P = present but no assessment of incidence and severity U = status on this crop unknown N = not present on this cropContributors: Kirsty Owen, Malcolm Ryley, Murray Sharman, Dennis Persley, John Thomas

GRDC | 158 | CuRRenT AnD PoTenTiAl CosTs fRoM DiseAses of Pulse CRoPs in AusTRAliA
Table B.d.4 Presence, incidence, severity and contribution to control estimates of diseases of chickpeas in the NSW North East/Queensland South East Zone
Disease Present in zone
Incidence Severity Contribution to control (%)
% of years % area affected
No control ControlBreeding Cultural Pesticide
% loss % loss
Necrotrophic leaf fungi
grey mould Y 20 10 25 5 0 25 75
pepper spot N
stem rot Y 10 1 10 1 0 80 20
Ascochyta blight Y 95 38 85 13 35 25 40
Biotrophic leaf fungi
rust Y 5 1 1 1 0 100 0
Root and crown fungi
Botrytis root and stem rot Y 20 10 15 3 0 15 85
Fusarium root rot Y 10 5 5 5 0 30 70
black root rot N
charcoal rot Y 10 5 5 1 0 100 0
Phytophthora root rot Y 35 30 75 35 50 50 0
Pythium damping off Y 20 13 18 13 0 40 60
wet root rot Y 20 5 10 1 0 30 70
Rhizoctonia bare patch N
epicotyl rot U
Sclerotinia crown rot Y 10 6 3 1 0 100 0
Sclerotinia stem rot Y 10 10 5 0 0 100 0
collar rot Y 10 1 10 1 0 90 10
Stemphylium blight N
Verticillium wilt N
Nematodes
stem nematode U
stunt nematode P 100 73
root lesion nem neglectus Y 100 32 20 7.9 90 10 0
root lesion nem penetrans U
root lesion nem teres U
root lesion nem thornei Y 100 67 27 8.4 90 10 0
burrowing nematode U
Viruses
alfalfa mosaic Y 10 10 10 5 0 100 0
bean leafroll Y 10 10 10 5 0 100 0
bean yellow mosaic U
beet western yellows Y 10 10 10 5 0 100 0
chickpea chlorotic stunt U
clover yellow vein U
cucumber mosaic Y 5 5 10 5 0 100 0
lettuce necrotic yellows U
pea seed borne mosaic Y 5 5 1 1 0 100 0
soybean dwarf U
sub clover stunt U
tobacco streak U
tomato spotted wilt U
turnip mosaic U
Phytoplasmas
phyllody Y 100 1 1 1 0 100 0
Y = present in region U = status on this crop unknown N = not present on this cropContributors: Kevin Moore, Kirsty Owen, Malcolm Ryley

CuRRenT AnD PoTenTiAl CosTs fRoM DiseAses of Pulse CRoPs in AusTRAliA | 159 | GRDC
Table B.d.5 Presence, incidence, severity and contribution to control estimates of diseases of chickpeas in the NSW North West/Queensland South West Zone
Disease Present in zone
Incidence Severity Contribution to control (%)
% of years % area affected
No control ControlBreeding Cultural Pesticide
% loss % loss
Necrotrophic leaf fungi
grey mould Y 18 8 20 5 0 25 75
pepper spot N
stem rot N
Ascochyta blight Y 75 30 75 13 35 25 40
Biotrophic leaf fungi
rust U
Root and crown fungi
Botrytis root and stem rot Y 18 8 13 3 0 15 85
Fusarium root rot Y 10 5 5 5 0 30 70
black root rot N
charcoal rot Y 10 5 5 1 0 100 0
Phytophthora root rot Y 40 43 75 35 50 50 0
Pythium damping off Y 25 15 18 13 0 40 60
wet root rot Y 20 5 10 1 0 30 70
Rhizoctonia bare patch N
epicotyl rot U
Sclerotinia crown rot Y 10 10 5 0 0 100 0
Sclerotinia stem rot Y 10 10 5 0 0 100 0
collar rot Y 10 1 10 1 0 90 10
Stemphylium blight N
Verticillium wilt N
Nematodes
stem nematode U
stunt nematode Y 100 73
root lesion nem neglectus Y 100 32 20 7.9 90 10 0
root lesion nem penetrans U
root lesion nem teres U
root lesion nem thornei Y 100 67 27 8.4 90 10 0
burrowing nematode U
Viruses
alfalfa mosaic Y 10 10 10 5 0 100 0
bean leafroll Y 10 10 10 5 0 100 0
bean yellow mosaic U
beet western yellows Y 10 10 10 5 0 100 0
chickpea chlorotic stunt U
clover yellow vein U
cucumber mosaic Y 5 5 10 5 0 100 0
lettuce necrotic yellows U
pea seed borne mosaic Y 5 5 1 1 0 100 0
soybean dwarf U
sub clover stunt U
tobacco streak U
tomato spotted wilt U
turnip mosaic U
Phytoplasmas
phyllody Y 100 1 1 1 0 100 0
Y = present in region U = status on this crop unknown N = not present on this cropContributors: Kevin Moore, Kirsty Owen, Malcolm Ryley

GRDC | 160 | CuRRenT AnD PoTenTiAl CosTs fRoM DiseAses of Pulse CRoPs in AusTRAliA
Table B.d.6 Presence, incidence, severity and contribution to control estimates of diseases of chickpeas in the NSW Central Zone
Disease Present in zone
Incidence Severity Contribution to control (%)
% of years % area affected
No control ControlBreeding Cultural Pesticide
% loss % loss
Necrotrophic leaf fungi
grey mould Y 5 5 10 5 0 20 80
pepper spot U
stem rot U
Ascochyta blight Y 50 50 100 15 50 10 40
Biotrophic leaf fungi
rust U
Root and crown fungi
Botrytis root and stem rot Y 5 5 5 0 0 0 100
Fusarium root rot U
black root rot N
charcoal rot U
Phytophthora root rot Y 50 80 100 50 25 75 0
Pythium damping off Y 20 20 25 25 0 50 50
wet root rot N
Rhizoctonia bare patch U
epicotyl rot
Sclerotinia crown rot Y 10 10 5 0 0 100 0
Sclerotinia stem rot Y 10 10 5 0 0 100 0
collar rot U
Stemphylium blight N
Verticillium wilt N
Nematodes
stem nematode U
stunt nematode U
root lesion nem neglectus U
root lesion nem penetrans U
root lesion nem teres U
root lesion nem thornei U
burrowing nematode U
Viruses
alfalfa mosaic Y 10 10 10 5 0 100 0
bean leafroll Y 10 10 10 5 0 100 0
bean yellow mosaic U
beet western yellows Y 10 10 10 5 0 100 0
chickpea chlorotic stunt U
clover yellow vein U
cucumber mosaic Y 5 5 10 5 0 100 0
lettuce necrotic yellows U
pea seed borne mosaic Y 5 5 1 1 0 100 0
soybean dwarf U
sub clover stunt U
tobacco streak U
tomato spotted wilt U
turnip mosaic U
Phytoplasmas
phyllody N
Y = present in region U = status on this crop unknown N = not present on this cropContributor: Kevin Moore

CuRRenT AnD PoTenTiAl CosTs fRoM DiseAses of Pulse CRoPs in AusTRAliA | 161 | GRDC
Table B.d.7 Presence, incidence, severity and contribution to control estimates of diseases of chickpeas in the NSW-Victorian Slopes Zone
Disease Present in zone
Incidence Severity Contribution to control (%)
% of years % area affected
No control ControlBreeding Cultural Pesticide
% loss % loss
Necrotrophic leaf fungi
grey mould Y 10 10 20 5 0 20 80
pepper spot U
stem rot Y 10 10 15 5 0 80 20
Ascochyta blight Y 70 35 65 10 60 15 25
Biotrophic leaf fungi
rust N
Root and crown fungi
Botrytis root and stem rot Y 10 10 13 0
Fusarium root rot Y 10 10 5 0
black root rot N
charcoal rot U
Phytophthora root rot Y 40 25 100 50
Pythium damping off Y 10 13 15 13
wet root rot N
Rhizoctonia bare patch Y 20 10 10 0
epicotyl rot U
Sclerotinia crown rot Y 10 10 5 0
Sclerotinia stem rot Y 10 10 8 0
collar rot U
Stemphylium blight N
Verticillium wilt N
Nematodes
stem nematode U
stunt nematode U
root lesion nem neglectus U
root lesion nem penetrans U
root lesion nem teres U
root lesion nem thornei U
burrowing nematode U
Viruses
alfalfa mosaic Y 10 10 10 5 0 100 0
bean leafroll Y 10 10 10 5 0 100 0
bean yellow mosaic U
beet western yellows Y 10 10 10 5 0 100 0
chickpea chlorotic stunt U
clover yellow vein U
cucumber mosaic Y 5 5 10 5 0 100 0
lettuce necrotic yellows U
pea seed borne mosaic Y 5 5 1 1 0 100 0
soybean dwarf U
sub clover stunt U
tobacco streak U
tomato spotted wilt U
turnip mosaic U
Phytoplasmas
phyllody N
Y = present in region U = status on this crop unknown N = not present on this cropContributors: Kurt Lindbeck, Kevin Moore

GRDC | 162 | CuRRenT AnD PoTenTiAl CosTs fRoM DiseAses of Pulse CRoPs in AusTRAliA
Table B.d.8 Presence, incidence, severity and contribution to control estimates of diseases of chickpeas in the Victorian High Rainfall Zone
Disease Present in zone
Incidence Severity Contribution to control (%)
% of years % area affected
No control ControlBreeding Cultural Pesticide
% loss % loss
Necrotrophic leaf fungi
grey mould Y 10 10 20 5 0 20 80
pepper spot U
stem rot Y 10 10 15 5 0 80 20
Ascochyta blight Y 70 20 30 5 50 20 30
Biotrophic leaf fungi
rust N
Root and crown fungi
Botrytis root and stem rot Y 13 13 15 0 0 40 60
Fusarium root rot Y 10 10 5 0 0 45 55
black root rot U
charcoal rot U
Phytophthora root rot N
Pythium damping off Y 13 10 5 0 0 40 60
wet root rot U
Rhizoctonia bare patch Y 20 10 10 0 0 40 60
epicotyl rot U
Sclerotinia crown rot U
Sclerotinia stem rot Y 10 10 10 0 0 80 20
collar rot U
Stemphylium blight U
Verticillium wilt U
Nematodes
stem nematode U
stunt nematode U
root lesion nem neglectus U
root lesion nem penetrans U
root lesion nem teres U
root lesion nem thornei U
burrowing nematode U
Viruses
alfalfa mosaic U
bean leafroll U
bean yellow mosaic U
beet western yellows U
chickpea chlorotic stunt U
clover yellow vein U
cucumber mosaic U
lettuce necrotic yellows U
pea seed borne mosaic U
soybean dwarf U
sub clover stunt U
tobacco streak U
tomato spotted wilt U
turnip mosaic U
Phytoplasmas
phyllody U
Y = present in region U = status on this crop unknown N = not present on this cropContributors: Kurt Lindbeck, Helen Richardson

CuRRenT AnD PoTenTiAl CosTs fRoM DiseAses of Pulse CRoPs in AusTRAliA | 163 | GRDC
Table B.d.9 Presence, incidence, severity and contribution to control estimates of diseases of chickpeas in the South Australian-Victorian Mallee Zone
Disease Present in zone
Incidence Severity Contribution to control (%)
% of years % area affected
No control ControlBreeding Cultural Pesticide
% loss % loss
Necrotrophic leaf fungi
grey mould Y 23 30 14 0 0 10 90
pepper spot Y 50 50 1 0 0 0 100
stem rot Y 16 15 16 4 0 40 60
Ascochyta blight Y 78 56 66 3 60 13 28
Biotrophic leaf fungi
rust N
Root and crown fungi
Botrytis root and stem rot Y 8 10 16 0 0 20 80
Fusarium root rot Y 9 9 13 3 0 20 80
black root rot Y 10 20 15 5 0 0 100
charcoal rot U
Phytophthora root rot N
Pythium damping off Y 10 10 11 0 0 20 80
wet root rot Y 10 10 13 5 0 60 40
Rhizoctonia bare patch Y 13 10 15 3 0 53 48
epicotyl rot U
Sclerotinia crown rot Y 10 13 6 2 0 65 35
Sclerotinia stem rot Y 5 5 5 0 0 80 20
collar rot P
Stemphylium blight U
Verticillium wilt N
Nematodes
stem nematode N
stunt nematode U
root lesion nem neglectus Y 23 23 25 5 30 70 0
root lesion nem penetrans U
root lesion nem teres U
root lesion nem thornei Y 23 23 10 5 30 70 0
burrowing nematode U
Viruses
alfalfa mosaic Y 83 50 5 2 0 100 0
bean leafroll Y 50 40 4 2 0 50 50
bean yellow mosaic Y 50 35 4 2 0 67 33
beet western yellows Y 83 75 22 12 0 50 50
chickpea chlorotic stunt N
clover yellow vein U
cucumber mosaic Y 100 50 18 2 0 100 0
lettuce necrotic yellows U
pea seed borne mosaic Y 50 7 3 0 0 100 0
soybean dwarf Y 10 1 0 0 0 50 50
sub clover stunt U
tobacco streak U
tomato spotted wilt U
turnip mosaic U
Phytoplasmas
phyllody U
Y = present in region P = present but no assessment of incidence and severity U = status on this crop unknown N = not present on this cropContributors: Jenny Davidson, Angela Freeman, Rohan Kimber, Kurt Lindbeck, Helen Richardson

GRDC | 164 | CuRRenT AnD PoTenTiAl CosTs fRoM DiseAses of Pulse CRoPs in AusTRAliA
Table B.d.10 Presence, incidence, severity and contribution to control estimates of diseases of chickpeas in the South Australian-Victorian Border Wimmera Zone
Disease Present in zone
Incidence Severity Contribution to control (%)
% of years % area affected
No control ControlBreeding Cultural Pesticide
% loss % loss
Necrotrophic leaf fungi
grey mould Y 26 39 21 3 0 10 90
pepper spot Y 50 50 1 0 0 0 100
stem rot Y 21 21 21 6 0 40 60
Ascochyta blight Y 95 66 73 5 58 15 28
Biotrophic leaf fungi
rust N
Root and crown fungi
Botrytis root and stem rot Y 10 9 21 0 0 15 85
Fusarium root rot Y 10 9 10 3 0 20 80
black root rot P
charcoal rot U
Phytophthora root rot N
Pythium damping off Y 11 10 9 0 0 18 83
wet root rot Y 10 10 13 5 0 60 40
Rhizoctonia bare patch Y 8 10 12 2 0 70 30
epicotyl rot U
Sclerotinia crown rot Y 10 15 10 2 0 60 40
Sclerotinia stem rot Y 8 10 10 0 0 70 30
collar rot P
Stemphylium blight Y 20 10 0 0 0 70 30
Verticillium wilt N
Nematodes
stem nematode N
stunt nematode U
root lesion nem neglectus Y 23 23 25 5 30 70 0
root lesion nem penetrans U
root lesion nem teres U
root lesion nem thornei Y 23 13 10 5 30 70 0
burrowing nematode U
Viruses
alfalfa mosaic Y 83 50 5 2 0 100 0
bean leafroll Y 50 40 4 2 0 50 50
bean yellow mosaic Y 50 35 4 2 0 67 33
beet western yellows Y 83 75 22 12 0 50 50
chickpea chlorotic stunt N
clover yellow vein U
cucumber mosaic Y 100 50 18 2 0 100 0
lettuce necrotic yellows U
pea seed borne mosaic Y 50 7 3 0 0 100 0
soybean dwarf Y 10 1 0 0 0 50 50
sub clover stunt U
tobacco streak U
tomato spotted wilt U
turnip mosaic U
Phytoplasmas
phyllody Y 10 10 23 10 0 50 50
Y = present in region P = present but no assessment of incidence and severity U = status on this crop unknown N = not present on this cropContributors: Jenny Davidson, Angela Freeman, Rohan Kimber, Kurt Lindbeck, Helen Richardson
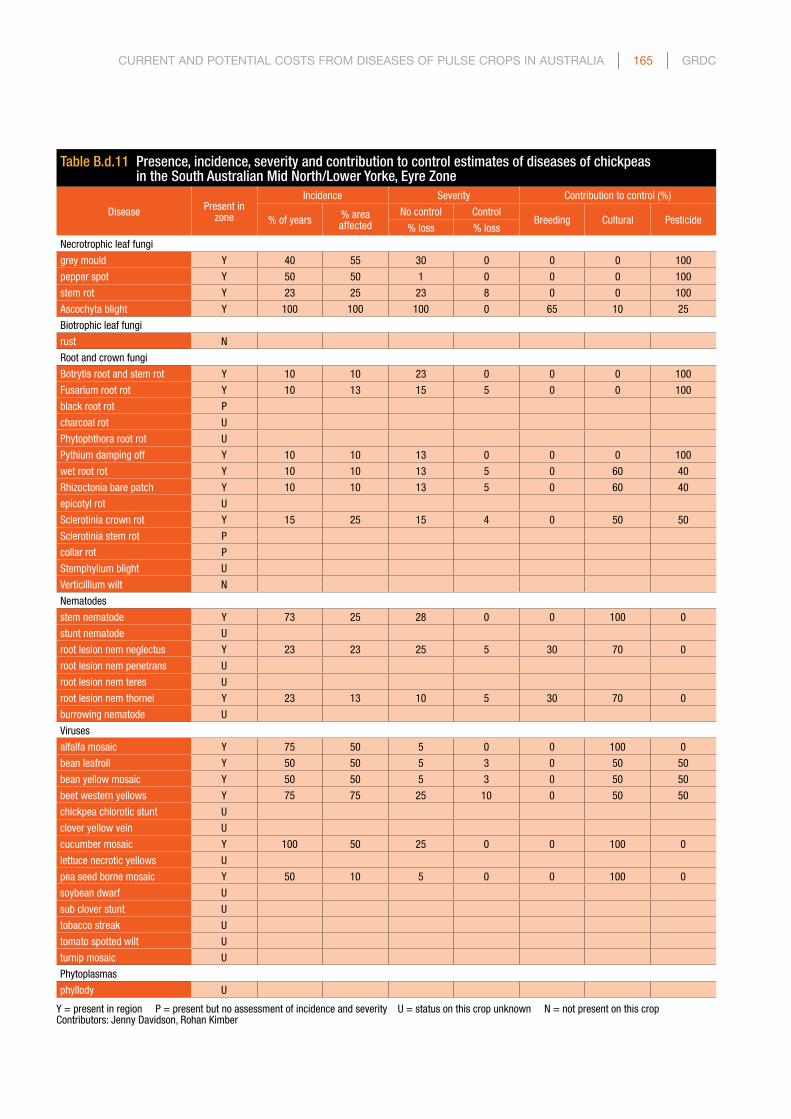
CuRRenT AnD PoTenTiAl CosTs fRoM DiseAses of Pulse CRoPs in AusTRAliA | 165 | GRDC
Table B.d.11 Presence, incidence, severity and contribution to control estimates of diseases of chickpeas in the South Australian Mid North/Lower Yorke, Eyre Zone
Disease Present in zone
Incidence Severity Contribution to control (%)
% of years % area affected
No control ControlBreeding Cultural Pesticide
% loss % loss
Necrotrophic leaf fungi
grey mould Y 40 55 30 0 0 0 100
pepper spot Y 50 50 1 0 0 0 100
stem rot Y 23 25 23 8 0 0 100
Ascochyta blight Y 100 100 100 0 65 10 25
Biotrophic leaf fungi
rust N
Root and crown fungi
Botrytis root and stem rot Y 10 10 23 0 0 0 100
Fusarium root rot Y 10 13 15 5 0 0 100
black root rot P
charcoal rot U
Phytophthora root rot U
Pythium damping off Y 10 10 13 0 0 0 100
wet root rot Y 10 10 13 5 0 60 40
Rhizoctonia bare patch Y 10 10 13 5 0 60 40
epicotyl rot U
Sclerotinia crown rot Y 15 25 15 4 0 50 50
Sclerotinia stem rot P
collar rot P
Stemphylium blight U
Verticillium wilt N
Nematodes
stem nematode Y 73 25 28 0 0 100 0
stunt nematode U
root lesion nem neglectus Y 23 23 25 5 30 70 0
root lesion nem penetrans U
root lesion nem teres U
root lesion nem thornei Y 23 13 10 5 30 70 0
burrowing nematode U
Viruses
alfalfa mosaic Y 75 50 5 0 0 100 0
bean leafroll Y 50 50 5 3 0 50 50
bean yellow mosaic Y 50 50 5 3 0 50 50
beet western yellows Y 75 75 25 10 0 50 50
chickpea chlorotic stunt U
clover yellow vein U
cucumber mosaic Y 100 50 25 0 0 100 0
lettuce necrotic yellows U
pea seed borne mosaic Y 50 10 5 0 0 100 0
soybean dwarf U
sub clover stunt U
tobacco streak U
tomato spotted wilt U
turnip mosaic U
Phytoplasmas
phyllody U
Y = present in region P = present but no assessment of incidence and severity U = status on this crop unknown N = not present on this cropContributors: Jenny Davidson, Rohan Kimber
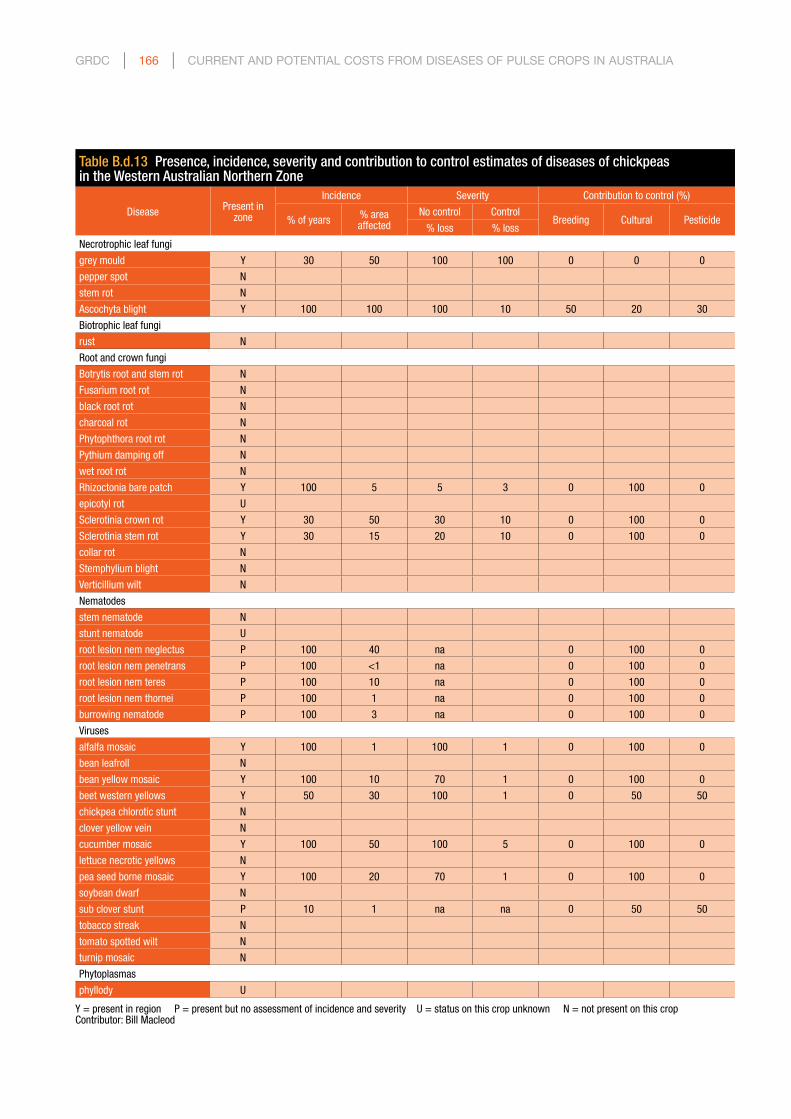
GRDC | 166 | CuRRenT AnD PoTenTiAl CosTs fRoM DiseAses of Pulse CRoPs in AusTRAliA
Table B.d.13 Presence, incidence, severity and contribution to control estimates of diseases of chickpeas in the Western Australian Northern Zone
Disease Present in zone
Incidence Severity Contribution to control (%)
% of years % area affected
No control ControlBreeding Cultural Pesticide
% loss % loss
Necrotrophic leaf fungi
grey mould Y 30 50 100 100 0 0 0
pepper spot N
stem rot N
Ascochyta blight Y 100 100 100 10 50 20 30
Biotrophic leaf fungi
rust N
Root and crown fungi
Botrytis root and stem rot N
Fusarium root rot N
black root rot N
charcoal rot N
Phytophthora root rot N
Pythium damping off N
wet root rot N
Rhizoctonia bare patch Y 100 5 5 3 0 100 0
epicotyl rot U
Sclerotinia crown rot Y 30 50 30 10 0 100 0
Sclerotinia stem rot Y 30 15 20 10 0 100 0
collar rot N
Stemphylium blight N
Verticillium wilt N
Nematodes
stem nematode N
stunt nematode U
root lesion nem neglectus P 100 40 na 0 100 0
root lesion nem penetrans P 100 <1 na 0 100 0
root lesion nem teres P 100 10 na 0 100 0
root lesion nem thornei P 100 1 na 0 100 0
burrowing nematode P 100 3 na 0 100 0
Viruses
alfalfa mosaic Y 100 1 100 1 0 100 0
bean leafroll N
bean yellow mosaic Y 100 10 70 1 0 100 0
beet western yellows Y 50 30 100 1 0 50 50
chickpea chlorotic stunt N
clover yellow vein N
cucumber mosaic Y 100 50 100 5 0 100 0
lettuce necrotic yellows N
pea seed borne mosaic Y 100 20 70 1 0 100 0
soybean dwarf N
sub clover stunt P 10 1 na na 0 50 50
tobacco streak N
tomato spotted wilt N
turnip mosaic N
Phytoplasmas
phyllody U
Y = present in region P = present but no assessment of incidence and severity U = status on this crop unknown N = not present on this cropContributor: Bill Macleod

CuRRenT AnD PoTenTiAl CosTs fRoM DiseAses of Pulse CRoPs in AusTRAliA | 167 | GRDC
Table B.d.14 Presence, incidence, severity and contribution to control estimates of diseases of chickpeas in the Western Australian Central Zone
Disease Present in zone
Incidence Severity Contribution to control (%)
% of years % area affected
No control ControlBreeding Cultural Pesticide
% loss % loss
Necrotrophic leaf fungi
grey mould Y 20 20 100 100 0 0 0
pepper spot N
stem rot N
Ascochyta blight Y 100 100 100 10 50 20 30
Biotrophic leaf fungi
rust N
Root and crown fungi
Botrytis root and stem rot N
Fusarium root rot N
black root rot N
charcoal rot N
Phytophthora root rot N
Pythium damping off N
wet root rot N
Rhizoctonia bare patch Y 100 5 5 3 0 100 0
epicotyl rot U
Sclerotinia crown rot Y 30 30 30 10 0 100 0
Sclerotinia stem rot Y 30 10 20 10 0 100 0
collar rot N
Stemphylium blight N
Verticillium wilt N
Nematodes
stem nematode N
stunt nematode U
root lesion nem neglectus P 100 40 na 0 100 0
root lesion nem penetrans P 100 <1 na 0 100 0
root lesion nem teres P 100 10 na 0 100 0
root lesion nem thornei P 100 1 na 0 100 0
burrowing nematode P 100 3 na 0 100 0
Viruses
alfalfa mosaic Y 100 1 100 1 0 100 0
bean leafroll N
bean yellow mosaic Y 100 10 70 1 0 100 0
beet western yellows Y 50 30 100 1 0 50 50
chickpea chlorotic stunt N
clover yellow vein N
cucumber mosaic Y 100 50 100 5 0 100 0
lettuce necrotic yellows N
pea seed borne mosaic Y 100 20 70 1 0 100 0
soybean dwarf N
sub clover stunt P 10 1 na na 0 50 50
tobacco streak N
tomato spotted wilt N
turnip mosaic N
Phytoplasmas
phyllody U
Y = present in region P = present but no assessment of incidence and severity U = status on this crop unknown N = not present on this cropContributor: Bill Macleod

GRDC | 168 | CuRRenT AnD PoTenTiAl CosTs fRoM DiseAses of Pulse CRoPs in AusTRAliA
Table B.d.15 Presence, incidence, severity and contribution to control estimates of diseases of chickpeas in the Western Australian Eastern Zone
Disease Present in zone
Incidence Severity Contribution to control (%)
% of years % area affected
No control ControlBreeding Cultural Pesticide
% loss % loss
Necrotrophic leaf fungi
grey mould Y 5 5 50 50 0 0 0
pepper spot N
stem rot N
Ascochyta blight Y 100 100 50 2 50 20 30
Biotrophic leaf fungi
rust N
Root and crown fungi
Botrytis root and stem rot N
Fusarium root rot N
black root rot N
charcoal rot N
Phytophthora root rot N
Pythium damping off N
wet root rot N
Rhizoctonia bare patch Y 100 2 5 3 0 100 0
epicotyl rot U
Sclerotinia crown rot Y 5 5 30 10 0 100 0
Sclerotinia stem rot Y 5 5 20 10 0 100 0
collar rot N
Stemphylium blight N
Verticillium wilt N
Nematodes
stem nematode N
stunt nematode U
root lesion nem neglectus P 100 40 na 0 100 0
root lesion nem penetrans P 100 <1 na 0 100 0
root lesion nem teres P 100 10 na 0 100 0
root lesion nem thornei P 100 1 na 0 100 0
burrowing nematode P 100 3 na 0 100 0
Viruses
alfalfa mosaic Y 100 1 100 1 0 100 0
bean leafroll N
bean yellow mosaic Y 100 10 70 1 0 100 0
beet western yellows Y 50 30 100 1 0 50 50
chickpea chlorotic stunt N
clover yellow vein N
cucumber mosaic Y 100 50 100 5 0 100 0
lettuce necrotic yellows N
pea seed borne mosaic Y 100 20 70 1 0 100 0
soybean dwarf N
sub clover stunt P 0 0 NA NA 0 50 50
tobacco streak N
tomato spotted wilt N
turnip mosaic N
Phytoplasmas
phyllody U
Y = present in region P = present but no assessment of incidence and severity U = status on this crop unknown N = not present on this cropContributor: Bill Macleod

CuRRenT AnD PoTenTiAl CosTs fRoM DiseAses of Pulse CRoPs in AusTRAliA | 169 | GRDC
e. faba beans
Table B.e.4 Presence, incidence, severity and contribution to control estimates of diseases of faba beans in the NSW North East/Queensland South East Zone
Disease Present in zone
Incidence Severity Contribution to control (%)
% of years % area affected
No control ControlBreeding Cultural Pesticide
% loss % loss
Necrotrophic leaf fungi
Alternaria leaf spot U
Ascochyta blight Y 10 5 10 1 50 25 25
Bot grey mould, root rot Y 5 1 5 0 25 25 50
chocolate spot Y 10 75 100 75 25 25 50
Cercospora leaf spot Y 0 0 0 0 0 0 0
anthracnose U
Phoma spot U
Biotrophic leaf fungi
rust Y 90 90 90 30 50 25 25
Root and crown fungi
Aphanomyces root rot Y 50 1 50 10 50 50
Fus avenaceum root rot U
Fus solani root rot Y 50 1 0 0 0 0 0
charcoal rot U
Pythium root rot Y 10 1 5 0 100
foot rot Y 10 1 5 0 100
Rhizoctonia bare patch Y 10 1 5 0 100
Sclerotinia crown rot Y 20 1 5 0 100
Sclerotinia stem rot Y 20 1 5 0 100
trifoliorum stem rot U
Nematodes
stem nematode U
root lesion nem crenatus U
root lesion nem neglectus U
root lesion nem penetrans U
root lesion nem teres U
root lesion nem thornei U
burrowing nematode U
Viruses
alfalfa mosaic Y 50 10 20 5 50 50 0
bean leaf roll Y 75 75 100 20 90 10 0
bean yellow mosaic Y 50 50 20 5 50 50 0
beet western yellows Y 50 50 0 0 0 0 0
broad bean wilt Y 10 1 0 0 0 0 0
clover yellow vein Y 10 1 0 0 0 0 0
cucumber mosaic Y 25 5 10 1 50 50 0
pea seedborne mosaic Y 100 1 10 0 0 100 0
soybean dwarf Y 75 25 100 5 25 75 0
sub clover red leaf U
sub clover stunt Y 10 25 100 5 25 75 0
tomato spotted wilt Y 75 5 5 5
Phytoplasmas
tomato big bud Y 50 1 0 0
Y = present in region P = present but no assessment of incidence and severity U = status on this crop unknown Contributor: Joop van Leur

GRDC | 170 | CuRRenT AnD PoTenTiAl CosTs fRoM DiseAses of Pulse CRoPs in AusTRAliA
Table B.e.5 Presence, incidence, severity and contribution to control estimates of diseases of faba beans in the NSW North West/Queensland South West Zone
Disease Present in zone
Incidence Severity Contribution to control (%)
% of years % area affected
No control ControlBreeding Cultural Pesticide
% loss % loss
Necrotrophic leaf fungi
Alternaria leaf spot U
Ascochyta blight Y 10 1 10 1 50 25 25
Bot grey mould, root rot Y 5 1 5 0 25 25 50
chocolate spot Y 10 50 100 75 25 25 50
Cercospora leaf spot Y 0 0 0 0 0 0 0
anthracnose U
Phoma spot U
Biotrophic leaf fungi
rust Y 75 75 90 30 50 25 25
Root and crown fungi
Aphanomyces root rot Y 50 1 50 10 50 50 0
Fus avenaceum root rot U
Fus solani root rot Y 50 1
charcoal rot U
Pythium root rot Y 10 1 5 0 0 100 0
foot rot Y 10 1 5 0 0 100 0
Rhizoctonia bare patch Y 10 1 5 0 0 100 0
Sclerotinia crown rot Y 20 1 5 0 0 100 0
Sclerotinia stem rot Y 20 1 5 0 0 100 0
trifoliorum stem rot U
Nematodes
stem nematode U
root lesion nem crenatus U
root lesion nem neglectus U
root lesion nem penetrans U
root lesion nem teres U
root lesion nem thornei U
burrowing nematode U
Viruses
alfalfa mosaic Y 25 5 20 5 50 50 0
bean leaf roll Y 50 50 100 20 90 10 0
bean yellow mosaic Y 25 50 20 5 50 50 0
beet western yellows Y 50 50 0 0 0 0 0
broad bean wilt Y 10 1 0 0 0 0 0
clover yellow vein Y 10 1 0 0 0 0 0
cucumber mosaic Y 10 5 10 1 50 50 0
pea seedborne mosaic Y 100 1 10 0 0 100 0
soybean dwarf Y 75 10 100 5 25 75 0
sub clover red leaf U
sub clover stunt Y 10 10 100 5 25 75 0
tomato spotted wilt Y 75 5 5 5 0 0 0
Phytoplasmas
tomato big bud Y 50 1 0 0 0 0 0
Y = present in region U = status on this crop unknown Contributor: Joop van Leur

CuRRenT AnD PoTenTiAl CosTs fRoM DiseAses of Pulse CRoPs in AusTRAliA | 171 | GRDC
Table B.e.6 Presence, incidence, severity and contribution to control estimates of diseases of faba beans in the NSW Central Zone
Disease Present in zone
Incidence Severity Contribution to control (%)
% of years % area affected
No control ControlBreeding Cultural Pesticide
% loss % loss
Necrotrophic leaf fungi
Alternaria leaf spot U
Ascochyta blight Y 80 70 20 5 60 10 30
Bot grey mould, root rot Y 60 80 20 5 30 20 50
chocolate spot Y 60 80 40 5 30 20 50
Cercospora leaf spot Y 30 20 5 0 0 20 80
anthracnose U
Phoma spot Y 20 30 5 0 0 80 20
Biotrophic leaf fungi
rust Y 20 30 10 0 20 0 80
Root and crown fungi
Aphanomyces root rot U
Fus avenaceum root rot U
Fus solani root rot Y 10 10 5 0 0 90 10
charcoal rot U
Pythium root rot Y 10 10 5 0 0 90 10
foot rot Y 10 10 5 0 0 90 10
Rhizoctonia bare patch Y 10 10 5 0 0 90 10
Sclerotinia crown rot Y 15 10 10 0 0 100 0
Sclerotinia stem rot Y 15 10 10 0 0 100 0
trifoliorum stem rot U
Nematodes
stem nematode U
root lesion nem crenatus U
root lesion nem neglectus U
root lesion nem penetrans U
root lesion nem teres U
root lesion nem thornei U
burrowing nematode U
Viruses
alfalfa mosaic U
bean leaf roll U
bean yellow mosaic U
beet western yellows U
broad bean wilt U
clover yellow vein U
cucumber mosaic U
pea seedborne mosaic U
soybean dwarf U
sub clover red leaf U
sub clover stunt U
tomato spotted wilt U
Phytoplasmas
tomato big bud U
Y = present in region U = status on this crop unknown Contributor: Kurt Lindbeck

GRDC | 172 | CuRRenT AnD PoTenTiAl CosTs fRoM DiseAses of Pulse CRoPs in AusTRAliA
Table B.e.7 Presence, incidence, severity and contribution to control estimates of diseases of faba beans in the NSW–Victorian Slopes Zone
Disease Present in zone
Incidence Severity Contribution to control (%)
% of years % area affected
No control ControlBreeding Cultural Pesticide
% loss % loss
Necrotrophic leaf fungi
Alternaria leaf spot U
Ascochyta blight Y 80 60 20 5 60 10 30
Bot grey mould, root rot Y 60 60 20 5 30 20 50
chocolate spot Y 60 60 20 5 30 20 50
Cercospora leaf spot Y 30 30 5 0 0 20 80
anthracnose U
Phoma spot Y 20 30 5 0 0 80 20
Biotrophic leaf fungi
rust Y 10 10 10 0 20 0 80
Root and crown fungi
Aphanomyces root rot U
Fus avenaceum root rot U
Fus solani root rot Y 10 10 5 0 0 90 10
charcoal rot U
Pythium root rot Y 10 10 5 0 0 90 10
foot rot Y 10 10 5 0 0 90 10
Rhizoctonia bare patch Y 10 10 5 0 0 90 10
Sclerotinia crown rot Y 15 10 10 0 0 100 0
Sclerotinia stem rot Y 15 10 10 0 0 100 0
trifoliorum stem rot U
Nematodes
stem nematode U
root lesion nem crenatus U
root lesion nem neglectus U
root lesion nem penetrans U
root lesion nem teres U
root lesion nem thornei U
burrowing nematode U
Viruses
alfalfa mosaic U
bean leaf roll U
bean yellow mosaic U
beet western yellows U
broad bean wilt U
clover yellow vein U
cucumber mosaic U
pea seedborne mosaic U
soybean dwarf U
sub clover red leaf U
sub clover stunt U
tomato spotted wilt U
Phytoplasmas
tomato big bud UContributor: Kurt Lindbeck

CuRRenT AnD PoTenTiAl CosTs fRoM DiseAses of Pulse CRoPs in AusTRAliA | 173 | GRDC
Table B.e.8 Presence, incidence, severity and contribution to control estimates of diseases of faba beans in the Victorian High Rainfall Zone
Disease Present in zone
Incidence Severity Contribution to control (%)
% of years % area affected
No control ControlBreeding Cultural Pesticide
% loss % loss
Necrotrophic leaf fungi
Alternaria leaf spot U
Ascochyta blight Y 80 65 23 5 55 10 35
Bot grey mould, root rot Y 55 65 18 8 30 20 50
chocolate spot Y 65 70 20 10 30 20 50
Cercospora leaf spot Y 35 28 5 0 0 20 80
anthracnose U
Phoma spot Y 20 28 5 0 0 75 25
Biotrophic leaf fungi
rust Y 10 10 10 0 20 0 80
Root and crown fungi
Aphanomyces root rot U
Fus avenaceum root rot U
Fus solani root rot Y 10 10 5 0 0 88 13
charcoal rot U
Pythium root rot Y 10 10 5 0 0 90 10
foot rot Y 10 13 5 0 0 90 10
Rhizoctonia bare patch Y 10 5 5 0 0 90 10
Sclerotinia crown rot Y 20 10 10 0 0 100 0
Sclerotinia stem rot Y 20 10 10 0 0 100 0
trifoliorum stem rot U
Nematodes
stem nematode U
root lesion nem crenatus U
root lesion nem neglectus U
root lesion nem penetrans U
root lesion nem teres U
root lesion nem thornei U
burrowing nematode U
Viruses
alfalfa mosaic U
bean leaf roll U
bean yellow mosaic U
beet western yellows U
broad bean wilt U
clover yellow vein U
cucumber mosaic U
pea seedborne mosaic U
soybean dwarf U
sub clover red leaf U
sub clover stunt U
tomato spotted wilt U
Phytoplasmas
tomato big bud UContributors: Kurt Lindbeck, Helen Richardson

GRDC | 174 | CuRRenT AnD PoTenTiAl CosTs fRoM DiseAses of Pulse CRoPs in AusTRAliA
Table B.e.9 Presence, incidence, severity and contribution to control estimates of diseases of faba beans in the South Australian-Victorian Mallee Zone
Disease Present in zone
Incidence Severity Contribution to control (%)
% of years % area affected
No control ControlBreeding Cultural Pesticide
% loss % loss
Necrotrophic leaf fungi
Alternaria leaf spot P
Ascochyta blight Y 40 20 17 3 60 10 30
Bot grey mould, root rot Y 18 13 10 0 27 17 57
chocolate spot Y 18 13 13 0 23 17 60
Cercospora leaf spot Y 17 13 5 0 0 37 63
anthracnose N
Phoma spot Y 5 2 2 0 0 80 20
Biotrophic leaf fungi
rust Y 5 7 10 0 23 0 77
Root and crown fungi
Aphanomyces root rot U
Fus avenaceum root rot P
Fus solani root rot Y 5 5 5 0 0 90 10
charcoal rot P
Pythium root rot Y 5 5 5 0 0 85 15
foot rot Y 5 5 5 0 0 85 15
Rhizoctonia bare patch Y 5 8 8 0 0 85 15
Sclerotinia crown rot Y 5 5 5 0 0 100 0
Sclerotinia stem rot Y 5 5 5 0 0 100 0
trifoliorum stem rot U
Nematodes
stem nematode U
root lesion nem crenatus U
root lesion nem neglectus U
root lesion nem penetrans U
root lesion nem teres U
root lesion nem thornei P
burrowing nematode U
Viruses
alfalfa mosaic Y 20 1 0 0 0 100 0
bean leaf roll Y 50 10 1 0 0 50 50
bean yellow mosaic Y 50 1 0 0 0 100 0
beet western yellows Y 100 50 10 0 0 50 50
broad bean wilt Y 20 1 0 0 0 100 0
clover yellow vein U
cucumber mosaic Y 100 10 1 0 0 100 0
pea seedborne mosaic Y 20 1 0 0 0 100 0
soybean dwarf Y 20 1 0 0 0 50 50
sub clover red leaf U
sub clover stunt Y 75 10 20 0 0 50 50
tomato spotted wilt Y 20 1 0 0 0 50 50
Phytoplasmas
tomato big bud UY = present in region P = present but no assessment of incidence and severity U = status on this crop unknown N = not present on this cropContributors: Angela Freeman, Rohan Kimber, Kurt Lindbeck, Helen Richardson

CuRRenT AnD PoTenTiAl CosTs fRoM DiseAses of Pulse CRoPs in AusTRAliA | 175 | GRDC
Table B.e.10 Presence, incidence, severity and contribution to control estimates of diseases of faba beans in the South Australian-Victorian Border Wimmera Zone
Disease Present in zone
Incidence Severity Contribution to control (%)
% of years % area affected
No control ControlBreeding Cultural Pesticide
% loss % loss
Necrotrophic leaf fungi
Alternaria leaf spot P
Ascochyta blight Y 79 83 34 4 58 13 30
Bot grey mould, root rot Y 63 60 14 3 20 18 63
chocolate spot Y 63 60 34 8 20 20 60
Cercospora leaf spot Y 78 65 10 0 8 36 56
anthracnose N
Phoma spot Y 35 15 5 0 0 75 25
Biotrophic leaf fungi
rust Y 20 25 18 0 33 0 68
Root and crown fungi
Aphanomyces root rot Y 10 10 10 10 0 0 0
Fus avenaceum root rot P
Fus solani root rot Y 10 10 5 0 0 90 10
charcoal rot P
Pythium root rot Y 10 10 5 0 0 90 10
foot rot Y 10 10 5 0 0 90 10
Rhizoctonia bare patch Y 10 10 5 0 0 90 10
Sclerotinia crown rot Y 13 10 6 1 0 75 25
Sclerotinia stem rot Y 15 10 8 0 0 100 0
trifoliorum stem rot U
Nematodes
stem nematode Y 10 7 8 0 0 93 7
root lesion nem crenatus U
root lesion nem neglectus U
root lesion nem penetrans U
root lesion nem teres U
root lesion nem thornei P
burrowing nematode U
Viruses
alfalfa mosaic Y 20 1 0 0 0 100 0
bean leaf roll Y 50 10 1 0 0 50 50
bean yellow mosaic Y 50 1 0 0 0 100 0
beet western yellows Y 100 50 10 0 0 50 50
broad bean wilt Y 20 1 0 0 0 100 0
clover yellow vein U
cucumber mosaic Y 50 5 1 0 0 100 0
pea seedborne mosaic Y 10 1 5 0 0 100 0
soybean dwarf Y 20 1 0 0 0 50 50
sub clover red leaf U
sub clover stunt Y 75 10 20 0 0 50 50
tomato spotted wilt Y 20 1 0 0 0 50 50
Phytoplasmas
tomato big bud U
Y = present in region P = present but no assessment of incidence and severity U = status on this crop unknown N = not present on this cropContributors: Jenny Davidson, Angela Freeman, Rohan Kimber, Kurt Lindbeck, Helen Richardson
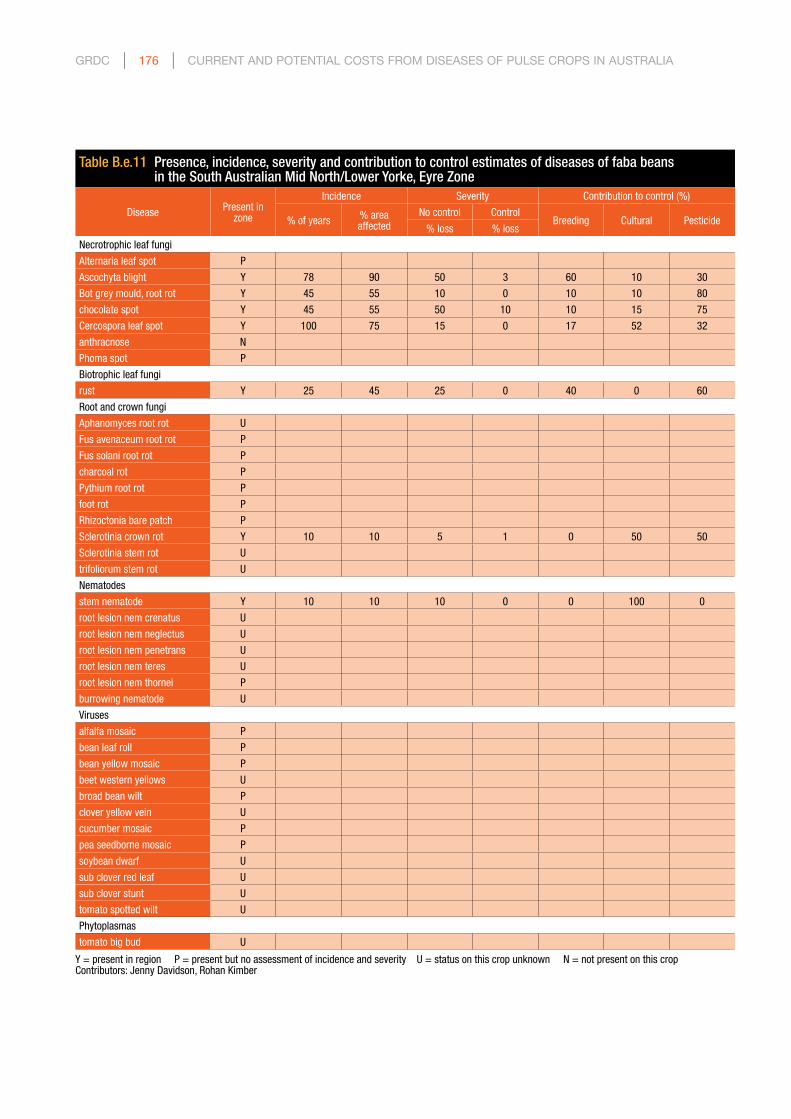
GRDC | 176 | CuRRenT AnD PoTenTiAl CosTs fRoM DiseAses of Pulse CRoPs in AusTRAliA
Table B.e.11 Presence, incidence, severity and contribution to control estimates of diseases of faba beans in the South Australian Mid North/Lower Yorke, Eyre Zone
Disease Present in zone
Incidence Severity Contribution to control (%)
% of years % area affected
No control ControlBreeding Cultural Pesticide
% loss % loss
Necrotrophic leaf fungi
Alternaria leaf spot P
Ascochyta blight Y 78 90 50 3 60 10 30
Bot grey mould, root rot Y 45 55 10 0 10 10 80
chocolate spot Y 45 55 50 10 10 15 75
Cercospora leaf spot Y 100 75 15 0 17 52 32
anthracnose N
Phoma spot P
Biotrophic leaf fungi
rust Y 25 45 25 0 40 0 60
Root and crown fungi
Aphanomyces root rot U
Fus avenaceum root rot P
Fus solani root rot P
charcoal rot P
Pythium root rot P
foot rot P
Rhizoctonia bare patch P
Sclerotinia crown rot Y 10 10 5 1 0 50 50
Sclerotinia stem rot U
trifoliorum stem rot U
Nematodes
stem nematode Y 10 10 10 0 0 100 0
root lesion nem crenatus U
root lesion nem neglectus U
root lesion nem penetrans U
root lesion nem teres U
root lesion nem thornei P
burrowing nematode U
Viruses
alfalfa mosaic P
bean leaf roll P
bean yellow mosaic P
beet western yellows U
broad bean wilt P
clover yellow vein U
cucumber mosaic P
pea seedborne mosaic P
soybean dwarf U
sub clover red leaf U
sub clover stunt U
tomato spotted wilt U
Phytoplasmas
tomato big bud U
Y = present in region P = present but no assessment of incidence and severity U = status on this crop unknown N = not present on this cropContributors: Jenny Davidson, Rohan Kimber

CuRRenT AnD PoTenTiAl CosTs fRoM DiseAses of Pulse CRoPs in AusTRAliA | 177 | GRDC
Table B.e.12 Presence, incidence, severity and contribution to control estimates of diseases of faba beans in the Tasmanian Zone
Disease Present in zone
Incidence Severity Contribution to control (%)
% of years % area affected
No control ControlBreeding Cultural Pesticide
% loss % loss
Necrotrophic leaf fungi
Alternaria leaf spot U
Ascochyta blight Y 90 70 60 10 40 20 40
Bot grey mould, root rot P
chocolate spot Y 50 70 50 10 20 20 60
Cercospora leaf spot U
anthracnose
Phoma spot P
Biotrophic leaf fungi
rust Y 5 5 5 2 10 0 90
Root and crown fungi
Aphanomyces root rot U
Fus avenaceum root rot U
Fus solani root rot U
charcoal rot U
Pythium root rot U
foot rot P
Rhizoctonia bare patch U
Sclerotinia crown rot U
Sclerotinia stem rot P
trifoliorum stem rot U
Nematodes
stem nematode U
root lesion nem crenatus P
root lesion nem neglectus U
root lesion nem penetrans U
root lesion nem teres U
root lesion nem thornei U
burrowing nematode U
Viruses
alfalfa mosaic U
bean leaf roll U
bean yellow mosaic Y 20 5 50 50 0 0 0
beet western yellows P
broad bean wilt U
clover yellow vein U
cucumber mosaic U
pea seedborne mosaic U
soybean dwarf U
sub clover red leaf U
sub clover stunt U
tomato spotted wilt U
Phytoplasmas
tomato big bud U
Y = present in region P = present but no assessment of incidence and severity U = status on this crop unknown N = not present on this cropContributor: Geoff Dean

GRDC | 178 | CuRRenT AnD PoTenTiAl CosTs fRoM DiseAses of Pulse CRoPs in AusTRAliA
Table B.e.13 Presence, incidence, severity and contribution to control estimates of diseases of faba beans in the Western Australian Northern Zone
Disease Present in zone
Incidence Severity Contribution to control (%)
% of years % area affected
No control ControlBreeding Cultural Pesticide
% loss % loss
Necrotrophic leaf fungi
Alternaria leaf spot U
Ascochyta blight Y 5 1 5 1 40 30 30
Bot grey mould, root rot N
chocolate spot Y 30 50 100 30 20 50 30
Cercospora leaf spot Y 50 50 5 1 0 20 80
anthracnose U
Phoma spot N
Biotrophic leaf fungi
rust N
Root and crown fungi
Aphanomyces root rot N
Fus avenaceum root rot U
Fus solani root rot N
charcoal rot N
Pythium root rot N
foot rot N
Rhizoctonia bare patch Y 100 5 2 1 0 100 0
Sclerotinia crown rot N
Sclerotinia stem rot Y 10 5 2 2 0 0 0
trifoliorum stem rot N
Nematodes
stem nematode N
root lesion nem crenatus U
root lesion nem neglectus P 100 40 na na 0 100 0
root lesion nem penetrans P 100 <1 na na 0 100 0
root lesion nem teres P 100 10 na na 0 100 0
root lesion nem thornei P 100 1 na na 0 100 0
burrowing nematode P 100 3 na na 0 100 0
Viruses
alfalfa mosaic P 50 20 na na 0 100 0
bean leaf roll P 50 20 na na 0 100 0
bean yellow mosaic Y 100 50 50 1 0 100 0
beet western yellows P 100 10 na na 0 50 50
broad bean wilt N
clover yellow vein N
cucumber mosaic P 100 10 na na 0 100 0
pea seedborne mosaic Y 100 100 80 1 0 100 0
soybean dwarf N
sub clover red leaf U
sub clover stunt N
tomato spotted wilt N
Phytoplasmas
tomato big bud U
Y = present in region P = present but no assessment of incidence and severity U = status on this crop unknown N = not present on this cropContributor: Bill Macleod

CuRRenT AnD PoTenTiAl CosTs fRoM DiseAses of Pulse CRoPs in AusTRAliA | 179 | GRDC
Table B.e.14 Presence, incidence, severity and contribution to control estimates of diseases of faba beans in the Western Australian Central Zone
Disease Present in zone
Incidence Severity Contribution to control (%)
% of years % area affected
No control ControlBreeding Cultural Pesticide
% loss % loss
Necrotrophic leaf fungi
Alternaria leaf spot U
Ascochyta blight Y 70 30 10 2 40 30 30
Bot grey mould, root rot N
chocolate spot Y 30 60 100 30 20 50 30
Cercospora leaf spot Y 50 50 5 1 0 20 80
anthracnose U
Phoma spot N
Biotrophic leaf fungi
rust Y 30 5 5 2 30 0 70
Root and crown fungi
Aphanomyces root rot N
Fus avenaceum root rot U
Fus solani root rot N
charcoal rot N
Pythium root rot N
foot rot N
Rhizoctonia bare patch Y 100 5 2 1 0 100 0
Sclerotinia crown rot N
Sclerotinia stem rot Y 15 5 2 2 0 0 0
trifoliorum stem rot N
Nematodes
stem nematode N
root lesion nem crenatus U
root lesion nem neglectus P 100 40 na na 0 100 0
root lesion nem penetrans P 100 <1 na na 0 100 0
root lesion nem teres P 100 10 na na 0 100 0
root lesion nem thornei P 100 1 na na 0 100 0
burrowing nematode P 100 3 na na 0 100 0
Viruses
alfalfa mosaic P 50 20 na na 0 100 0
bean leaf roll P 50 20 na na 0 100 0
bean yellow mosaic Y 100 50 50 1 0 100 0
beet western yellows P 100 10 na na 0 50 50
broad bean wilt N
clover yellow vein N
cucumber mosaic P 100 10 na na 0 100 0
pea seedborne mosaic Y 100 100 80 1 0 100 0
soybean dwarf N
sub clover red leaf U
sub clover stunt N
tomato spotted wilt N
Phytoplasmas
tomato big bud U
Y = present in region P = present but no assessment of incidence and severity U = status on this crop unknown N = not present on this cropContributor: Bill Macleod

GRDC | 180 | CuRRenT AnD PoTenTiAl CosTs fRoM DiseAses of Pulse CRoPs in AusTRAliA
Table B.e.16 Presence, incidence, severity and contribution to control estimates of diseases of faba beans in the Western Australian Sandplain-Mallee Zone
Disease Present in zone
Incidence Severity Contribution to control (%)
% of years % area affected
No control ControlBreeding Cultural Pesticide
% loss % loss
Necrotrophic leaf fungi
Alternaria leaf spot U
Ascochyta blight Y 100 50 50 10 40 30 30
Bot grey mould, root rot N
chocolate spot Y 100 60 100 30 20 50 30
Cercospora leaf spot Y 50 50 5 1 0 20 80
anthracnose U
Phoma spot N
Biotrophic leaf fungi
rust Y 50 15 5 2 30 0 70
Root and crown fungi
Aphanomyces root rot N
Fus avenaceum root rot U
Fus solani root rot N
charcoal rot N
Pythium root rot N
foot rot N
Rhizoctonia bare patch Y 100 40 20 5 0 100 0
Sclerotinia crown rot N
Sclerotinia stem rot Y 50 5 2 2 0 0 0
trifoliorum stem rot N
Nematodes
stem nematode N
root lesion nem crenatus U
root lesion nem neglectus P 100 40 na na 0 100 0
root lesion nem penetrans P 100 <1 na na 0 100 0
root lesion nem teres P 100 10 na na 0 100 0
root lesion nem thornei P 100 1 na na 0 100 0
burrowing nematode P 100 3 na na 0 100 0
Viruses
alfalfa mosaic P 50 20 na na 0 100 0
bean leaf roll P 50 20 na na 0 100 0
bean yellow mosaic Y 100 50 50 1 0 100 0
beet western yellows P 100 10 na na 0 50 50
broad bean wilt N
clover yellow vein N
cucumber mosaic P 100 10 na na 0 100 0
pea seedborne mosaic Y 100 100 80 1 0 100 0
soybean dwarf N
sub clover red leaf U
sub clover stunt N
tomato spotted wilt N
Phytoplasmas
tomato big bud U
Y = present in region P = present but no assessment of incidence and severity U = status on this crop unknown N = not present on this cropContributor: Bill Macleod
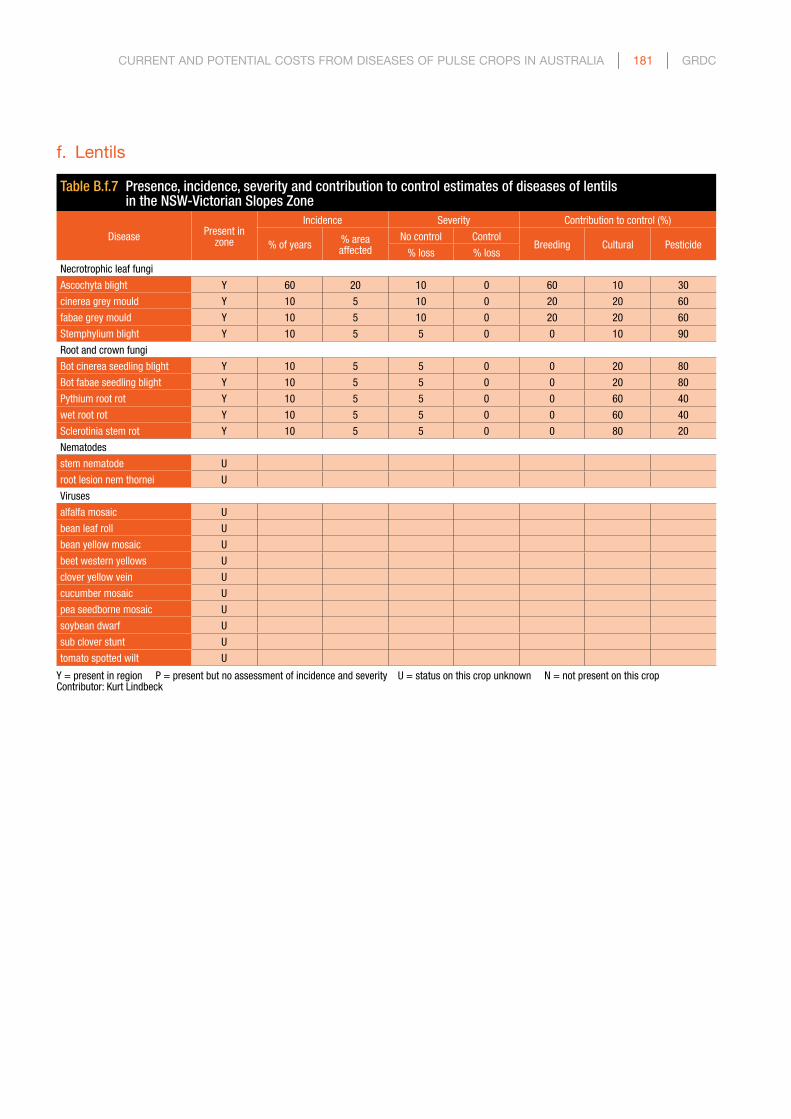
CuRRenT AnD PoTenTiAl CosTs fRoM DiseAses of Pulse CRoPs in AusTRAliA | 181 | GRDC
f. lentils
Table B.f.7 Presence, incidence, severity and contribution to control estimates of diseases of lentils in the NSW-Victorian Slopes Zone
Disease Present in zone
Incidence Severity Contribution to control (%)
% of years % area affected
No control ControlBreeding Cultural Pesticide
% loss % loss
Necrotrophic leaf fungi
Ascochyta blight Y 60 20 10 0 60 10 30
cinerea grey mould Y 10 5 10 0 20 20 60
fabae grey mould Y 10 5 10 0 20 20 60
Stemphylium blight Y 10 5 5 0 0 10 90
Root and crown fungi
Bot cinerea seedling blight Y 10 5 5 0 0 20 80
Bot fabae seedling blight Y 10 5 5 0 0 20 80
Pythium root rot Y 10 5 5 0 0 60 40
wet root rot Y 10 5 5 0 0 60 40
Sclerotinia stem rot Y 10 5 5 0 0 80 20
Nematodes
stem nematode U
root lesion nem thornei U
Viruses
alfalfa mosaic U
bean leaf roll U
bean yellow mosaic U
beet western yellows U
clover yellow vein U
cucumber mosaic U
pea seedborne mosaic U
soybean dwarf U
sub clover stunt U
tomato spotted wilt U
Y = present in region P = present but no assessment of incidence and severity U = status on this crop unknown N = not present on this cropContributor: Kurt Lindbeck

GRDC | 182 | CuRRenT AnD PoTenTiAl CosTs fRoM DiseAses of Pulse CRoPs in AusTRAliA
Table B.f.9 Presence, incidence, severity and contribution to control estimates of diseases of lentils in the South Australian-Victorian Mallee Zone
Disease Present in zone
Incidence Severity Contribution to control (%)
% of years % area affected
No control ControlBreeding Cultural Pesticide
% loss % loss
Necrotrophic leaf fungi
Ascochyta blight Y 65 18 10 3 60 10 30
cinerea grey mould Y 13 8 10 1 20 20 60
fabae grey mould Y 13 8 10 1 20 20 60
Stemphylium blight Y 10 5 5 0 0 15 85
Root and crown fungi
Bot cinerea seedling blight Y 5 5 5 0 0 20 80
Bot fabae seedling blight Y 5 5 5 0 0 20 80
Pythium root rot Y 8 5 5 0 0 60 40
wet root rot Y 8 5 5 0 0 60 40
Sclerotinia stem rot Y 5 5 5 0 0 80 20
Nematodes
stem nematode U
root lesion nem thornei U
Viruses
alfalfa mosaic Y 100 5 1 1 0 0 0
bean leaf roll Y 30 10 5 5 0 0 0
bean yellow mosaic Y 10 0 0 0 0 0 0
beet western yellows Y 30 10 5 5 0 0 0
clover yellow vein U
cucumber mosaic Y 100 25 1 1 0 0 0
pea seedborne mosaic Y 10 0 0 0 0 0 0
soybean dwarf Y 10 0 0 0 0 0 0
sub clover stunt U
tomato spotted wilt Y 10 0 0 0 0 0 0
Y = present in region U = status on this crop unknown Contributors: Angela Freeman, Kurt Lindbeck, Helen Richardson

CuRRenT AnD PoTenTiAl CosTs fRoM DiseAses of Pulse CRoPs in AusTRAliA | 183 | GRDC
Table B.f.10 Presence, incidence, severity and contribution to control estimates of diseases of lentils in the South Australian-Victorian Border Wimmera Zone
Disease Present in zone
Incidence Severity Contribution to control (%)
% of years % area affected
No control ControlBreeding Cultural Pesticide
% loss % loss
Necrotrophic leaf fungi
Ascochyta blight Y 88 41 33 2 58 10 33
cinerea grey mould Y 25 20 33 1 33 13 55
fabae grey mould Y 25 20 33 1 33 13 55
Stemphylium blight Y 23 15 5 0 0 7 93
Root and crown fungi
Bot cinerea seedling blight Y 18 15 18 0 0 10 90
Bot fabae seedling blight Y 18 15 18 0 0 10 90
Pythium root rot Y 10 5 5 0 0 60 40
wet root rot Y 10 5 5 0 0 60 40
Sclerotinia stem rot Y 10 5 5 0 0 75 25
Nematodes
stem nematode U
root lesion nem thornei P
Viruses
alfalfa mosaic Y 100 15 3 1 0 100 0
bean leaf roll Y 30 13 5 4 0 50 50
bean yellow mosaic Y 20 5 3 2 0 50 50
beet western yellows Y 30 43 8 5 0 50 50
clover yellow vein U
cucumber mosaic Y 100 38 8 1 0 100 0
pea seedborne mosaic Y 20 5 3 0 0 100 0
soybean dwarf Y 10 0 0 0 0 0 0
sub clover stunt U
tomato spotted wilt Y 10 0 0 0 0 0 0
Y = present in region P = present but no assessment of incidence and severity U = status on this crop unknown Contributors: Jenny Davidson, Angela Freeman, Rohan Kimber, Kurt Lindbeck, Helen Richardson

GRDC | 184 | CuRRenT AnD PoTenTiAl CosTs fRoM DiseAses of Pulse CRoPs in AusTRAliA
Table B.f.11 Presence, incidence, severity and contribution to control estimates of diseases of lentils in the South Australian Mid North/Lower Yorke, Eyre Zone
Disease Present in zone
Incidence Severity Contribution to control (%)
% of years % area affected
No control ControlBreeding Cultural Pesticide
% loss % loss
Necrotrophic leaf fungi
Ascochyta blight Y 100 63 50 3
cinerea grey mould Y 45 63 50 3
fabae grey mould Y 45 63 50 3
Stemphylium blight Y 30 25 5 0
Root and crown fungi
Bot cinerea seedling blight Y 25 25 30 0
Bot fabae seedling blight Y 25 25 30 0
Pythium root rot P
wet root rot P
Sclerotinia stem rot P
Nematodes
stem nematode U
root lesion nem thornei P
Viruses
alfalfa mosaic Y 100 25 5 0
bean leaf roll Y 30 15 5 3
bean yellow mosaic Y 30 10 5 3
beet western yellows Y 30 75 10 5
clover yellow vein U
cucumber mosaic Y 100 100 15 0
pea seedborne mosaic Y 30 10 5 0
soybean dwarf U
sub clover stunt U
tomato spotted wilt U
Y = present in region P = present but no assessment of incidence and severity U = status on this crop unknown Contributors: Jenny Davidson, Rohan Kimber

CuRRenT AnD PoTenTiAl CosTs fRoM DiseAses of Pulse CRoPs in AusTRAliA | 185 | GRDC
g. Vetch
Table B.g.9 Presence, incidence, severity and contribution to control estimates of diseases of vetch in the South Australian-Victorian Mallee Zone
Disease Present in zone
Incidence Severity Contribution to control (%)
% of years % area affected
No control ControlBreeding Cultural Pesticide
% loss % loss
Necrotrophic leaf fungi
Ascochyta blight Y 78 70 25 0 45 5 50
chocolate spot (cinerea) Y 25 65 25 0 0 28 73
chocolate spot (fabae) Y 25 65 33 3 0 28 73
anthracnose U
Phoma spot Y 28 30 8 5 0 75 25
Septoria blight U
Biotrophic leaf fungi
downy mildew Y 10 23 13 0 0 0 100
rust Y 30 28 15 0 0 0 100
Root and crown fungi
Aphanomyces root rot U
Rhizoctonia root rot Y 10 10 5 1 0 100 0
Sclerotinia stem rot U
Nematodes
stem nematode U
root knot nematode U
root lesion nem neglectus U
Bacteria
bacterial blight U
Viruses
alfalfa mosaic U
bean leaf roll U
bean yellow mosaic U
clover yellow vein U
cucumber mosaic U
pea seedborne mosaic U
sub clover red leaf U
tomato spotted wilt U
Y = present in region U = status on this crop unknown Contributors: Jenny Davidson, Rohan Kimber

GRDC | 186 | CuRRenT AnD PoTenTiAl CosTs fRoM DiseAses of Pulse CRoPs in AusTRAliA
Table B.g.10 Presence, incidence, severity and contribution to control estimates of diseases of vetch in the South Australian-Victorian Border Wimmera Zone
Disease Present in zone
Incidence Severity Contribution to control (%)
% of years % area affected
No control ControlBreeding Cultural Pesticide
% loss % loss
Necrotrophic leaf fungi
Ascochyta blight Y 73 73 28 0 50 0 50
chocolate spot (cinerea) Y 33 60 30 0 0 28 73
chocolate spot (fabae) Y 33 65 33 3 0 28 73
anthracnose U
Phoma spot Y 30 30 8 3 0 75 25
Septoria blight U
Biotrophic leaf fungi
downy mildew Y 10 23 13 0 0 0 100
rust Y 30 28 15 0 0 0 100
Root and crown fungi
Aphanomyces root rot U
Rhizoctonia root rot Y 10 10 5 1 0 100 0
Sclerotinia stem rot U
Nematodes
stem nematode U
root knot nematode U
root lesion nem neglectus U
Bacteria
bacterial blight U
Viruses
alfalfa mosaic U
bean leaf roll U
bean yellow mosaic U
clover yellow vein U
cucumber mosaic U
pea seedborne mosaic U
sub clover red leaf U
tomato spotted wilt U
Y = present in region U = status on this crop unknown Contributors: Jenny Davidson, Rohan Kimber

CuRRenT AnD PoTenTiAl CosTs fRoM DiseAses of Pulse CRoPs in AusTRAliA | 187 | GRDC
Table B.g.11 Presence, incidence, severity and contribution to control estimates of diseases of vetch in the South Australian Mid North/Lower Yorke, Eyre Zone
Disease Present in zone
Incidence Severity Contribution to control (%)
% of years % area affected
No control ControlBreeding Cultural Pesticide
% loss % loss
Necrotrophic leaf fungi
Ascochyta blight Y 73 70 25 0 45 5 50
chocolate spot (cinerea) Y 35 60 28 0 0 28 73
chocolate spot (fabae) Y 35 60 35 0 0 28 73
anthracnose U
Phoma spot Y 25 30 8 5 0 75 25
Septoria blight U
Biotrophic leaf fungi
downy mildew Y 10 23 13 0 0 0 100
rust Y 30 33 15 0 0 0 100
Root and crown fungi
Aphanomyces root rot U
Rhizoctonia root rot Y 10 10 5 1 0 100 0
Sclerotinia stem rot U
Nematodes
stem nematode U
root knot nematode U
root lesion nem neglectus U
Bacteria
bacterial blight U
Viruses
alfalfa mosaic U
bean leaf roll U
bean yellow mosaic U
clover yellow vein U
cucumber mosaic U
pea seedborne mosaic U
sub clover red leaf U
tomato spotted wilt U
Y = present in region U = status on this crop unknown Contributors: Jenny Davidson, Rohan Kimber

GRDC | 188 | CuRRenT AnD PoTenTiAl CosTs fRoM DiseAses of Pulse CRoPs in AusTRAliA
h. Peanuts
Table B.h.2 Presence, incidence, severity and contribution to control estimates of diseases of peanuts in the Queensland Atherton Zone
Disease Present in zone
Incidence Severity Contribution to control (%)
% of years % area affected
No control ControlBreeding Cultural Pesticide
% loss % loss
Necrotrophic leaf fungi
early leaf spot Y 5 1 1 0 10 45 45
net blotch Y 100 50 10 5 5 50 45
pepper spot Y 100 1 1 0 5 50 45
late leaf spot Y 100 100 80 10 10 30 60
Biotrophic leaf fungi
rust Y 100 50 80 10 10 30 60
Root and crown fungi
damping off and aflatoxin Y 0 0 0 0 0 0 100
Aspergillus crown rot Y 10 1 10 5 0 0 100
Cylindrocladium black rot Y 90 25 60 50 90 10 0
Fusarium root rot U
Diplodia rot Y 0 0 0 0 0 100 0
charcoal rot Y 5 1 5 2 0 100 0
Neocosmospora root rot Y 0 0 0 0 0 100 0
Pyt pod rot/damping off U 20 80
Rhizopus damping off U
Rhizoctonia damping off U
Rhizoctonia blight Y 10 2 10 5 0 20 80
Sclerotinia blight Y 5 1 30 20 0 75 25
Sclerotinia stem rot Y 20 25 30 10 0 25 75
base rot Y 25 5 20 5 0 30 70
Verticillium wilt Y 33 10 60 60 0 100 0
Nematodes
northern root knot nem. Y 10 1 30 30 0 100 0
root knot nematode U
Javanese root knot nem. U
root les nem brachyurus Y 10 1 20 20 0 100 0
dagger nematode U
ring nematode U
groundnut root knot nem. U
Viruses
capsicum chlorosis P
peanut mottle U
tobacco streak U
tomato spotted wilt Y 5 0 1 1 0 0 0
Phytoplasmas
witch’s broom Y 0 0 0 0 0 0 0
Y = present in region P = present but no assessment of incidence and severity U = status on this crop unknown Contributors: Malcolm Ryley, Dennis Persley, Murray Sharman, Jeff Tatnell, John Thomas, Peter Trevorrow, Graeme Wright

CuRRenT AnD PoTenTiAl CosTs fRoM DiseAses of Pulse CRoPs in AusTRAliA | 189 | GRDC
Table B.h.3 Presence, incidence, severity and contribution to control estimates of diseases of peanuts in the Queensland Central Zone
Disease Present in zone
Incidence Severity Contribution to control (%)
% of years % area affected
No control ControlBreeding Cultural Pesticide
% loss % loss
Necrotrophic leaf fungi
early leaf spot Y 5 0.5 5 1 10 45 45
net blotch Y 5 0.5 5 1 5 50 45
pepper spot U
late leaf spot Y 100 50 30 5 10 45 45
Biotrophic leaf fungi
rust Y 100 40 30 5 10 45 45
Root and crown fungi
damping off and aflatoxin Y 10 1 50 0 0 0 100
Aspergillus crown rot Y 100 1 50 5 0 0 100
Cylindrocladium black rot N
Fusarium root rot U
Diplodia rot U
charcoal rot Y 10 1 5 5 0 100 0
Neocosmospora root rot Y 10 20 50 40 0 100 0
Pyt pod rot/damping off U
Rhizopus damping off U
Rhizoctonia damping off U
Rhizoctonia blight Y 5 1 10 0 0 20 80
Sclerotinia blight N
Sclerotinia stem rot N
base rot Y 20 5 20 5 0 30 70
Verticillium wilt U
Nematodes
northern root knot nem. U
root knot nematode U
Javanese root knot nem. U
root les nem brachyurus U
dagger nematode U
ring nematode U
groundnut root knot nem. U
Viruses
capsicum chlorosis N
peanut mottle Y 100 1 2 2 0 100 0
tobacco streak Y 0 0 0 0 0 90 10
tomato spotted wilt Y 5 1 2 2 30 70 0
Phytoplasmas
witch’s broom Y 0 0 0 0 0 100 0
Y = present in region U = status on this crop unknown N = not present on this cropContributors: Malcolm Ryley, Dennis Persley, Murray Sharman, Jeff Tatnell, John Thomas, Peter Trevorrow, Graeme Wright

GRDC | 190 | CuRRenT AnD PoTenTiAl CosTs fRoM DiseAses of Pulse CRoPs in AusTRAliA
Table B.h.4 Presence, incidence, severity and contribution to control estimates of diseases of peanuts in the NSW North East/Queensland South East Zone
Disease Present in zone
Incidence Severity Contribution to control (%)
% of years % area affected
No control ControlBreeding Cultural Pesticide
% loss % loss
Necrotrophic leaf fungi
early leaf spot Y 40 80 40 10 10 45 45
net blotch Y 10 5 5 1 5 50 45
pepper spot Y 0 0 0 0 5 50 45
late leaf spot Y 100 50 30 5 10 45 45
Biotrophic leaf fungi
rust Y 80 50 30 5 10 45 45
Root and crown fungi
damping off and aflatoxin Y 75 90 50 20 0 100 0
Aspergillus crown rot Y 100 1 50 5 0 0 100
Cylindrocladium black rot N
Fusarium root rot U
Diplodia rot Y 20 10 5 2 0 100 0
charcoal rot Y 20 5 5 2 0 100 0
Neocosmospora root rot Y 30 5 2 2 0 100 0
Pyt pod rot/damping off U
Rhizopus damping off U
Rhizoctonia damping off U
Rhizoctonia blight U
Sclerotinia blight Y 20 30 50 20 0 75 25
Sclerotinia stem rot Y 15 20 30 15 0 75 25
base rot Y 20 5 20 5 0 30 70
Verticillium wilt Y 50 10 10 5 0 100 0
Nematodes
northern root knot nem. U
root knot nematode U
Javanese root knot nem. U
root les nem brachyurus U
dagger nematode U
ring nematode U
groundnut root knot nem. U
Viruses
capsicum chlorosis Y 100 20 20 20 0 100 0
peanut mottle Y 100 1 2 2 0 100 0
tobacco streak U
tomato spotted wilt Y 60 13 13 13 15 85 0
Phytoplasmas
witch’s broom Y 0 0 0 0 0 0 0
Y = present in region U = status on this crop unknown N = not present on this cropContributors: Malcolm Ryley, Dennis Persley, Murray Sharman, Jeff Tatnell, John Thomas, Peter Trevorrow, Graeme Wright
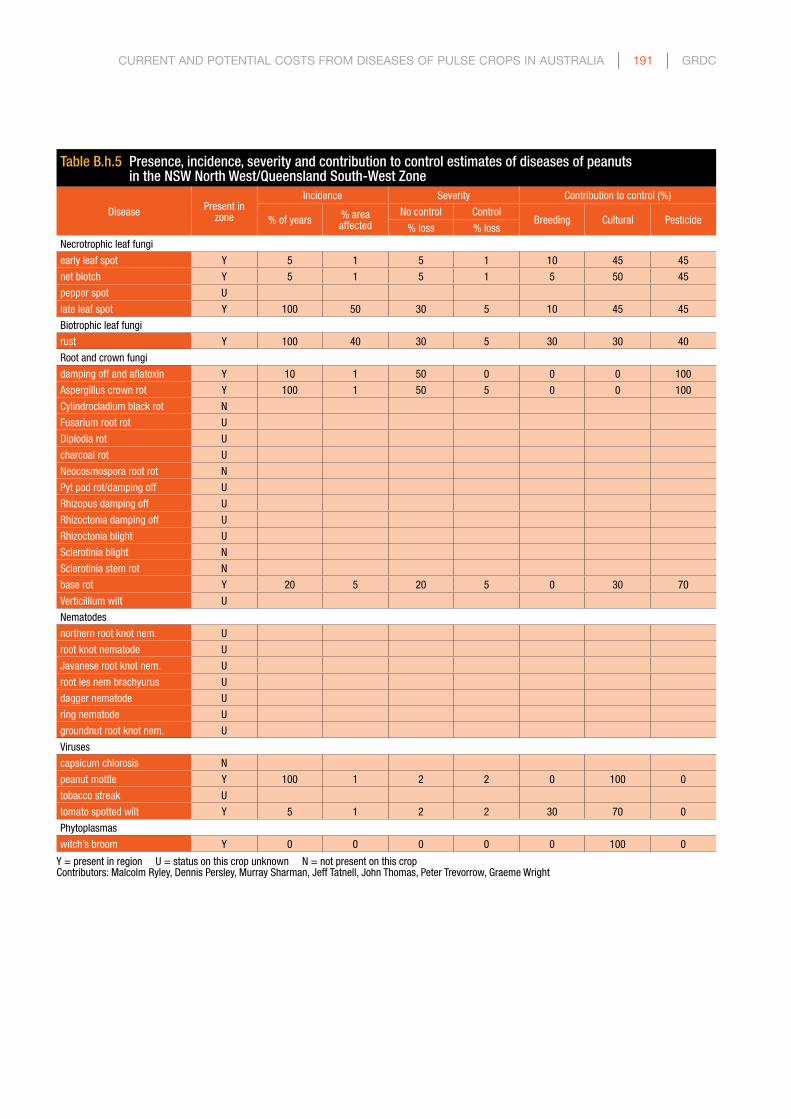
CuRRenT AnD PoTenTiAl CosTs fRoM DiseAses of Pulse CRoPs in AusTRAliA | 191 | GRDC
Table B.h.5 Presence, incidence, severity and contribution to control estimates of diseases of peanuts in the NSW North West/Queensland South-West Zone
Disease Present in zone
Incidence Severity Contribution to control (%)
% of years % area affected
No control ControlBreeding Cultural Pesticide
% loss % loss
Necrotrophic leaf fungi
early leaf spot Y 5 1 5 1 10 45 45
net blotch Y 5 1 5 1 5 50 45
pepper spot U
late leaf spot Y 100 50 30 5 10 45 45
Biotrophic leaf fungi
rust Y 100 40 30 5 30 30 40
Root and crown fungi
damping off and aflatoxin Y 10 1 50 0 0 0 100
Aspergillus crown rot Y 100 1 50 5 0 0 100
Cylindrocladium black rot N
Fusarium root rot U
Diplodia rot U
charcoal rot U
Neocosmospora root rot N
Pyt pod rot/damping off U
Rhizopus damping off U
Rhizoctonia damping off U
Rhizoctonia blight U
Sclerotinia blight N
Sclerotinia stem rot N
base rot Y 20 5 20 5 0 30 70
Verticillium wilt U
Nematodes
northern root knot nem. U
root knot nematode U
Javanese root knot nem. U
root les nem brachyurus U
dagger nematode U
ring nematode U
groundnut root knot nem. U
Viruses
capsicum chlorosis N
peanut mottle Y 100 1 2 2 0 100 0
tobacco streak U
tomato spotted wilt Y 5 1 2 2 30 70 0
Phytoplasmas
witch’s broom Y 0 0 0 0 0 100 0
Y = present in region U = status on this crop unknown N = not present on this cropContributors: Malcolm Ryley, Dennis Persley, Murray Sharman, Jeff Tatnell, John Thomas, Peter Trevorrow, Graeme Wright

GRDC | 192 | CuRRenT AnD PoTenTiAl CosTs fRoM DiseAses of Pulse CRoPs in AusTRAliA
Table B.h.18 Presence, incidence, severity and contribution to control estimates of diseases of peanuts in the Northern Territory Katherine Zone
Disease Present in zone
Incidence Severity Contribution to control (%)
% of years % area affected
No control ControlBreeding Cultural Pesticide
% loss % loss
Necrotrophic leaf fungi
early leaf spot U
net blotch N
pepper spot N
late leaf spot Y 100 50 50 5 10 50 40
Biotrophic leaf fungi
rust Y 33 10 20 2 10 45 45
Root and crown fungi
damping off and aflatoxin Y 10 1 50 0 0 0 100
Aspergillus crown rot Y 100 1 50 5 0 0 100
Cylindrocladium black rot N
Fusarium root rot U
Diplodia rot U
charcoal rot Y 10 1 5 5 0 100 0
Neocosmospora root rot N
Pyt pod rot/damping off U
Rhizopus damping off U
Rhizoctonia damping off U
Rhizoctonia blight Y 10 1 10 0 0 20 80
Sclerotinia blight N
Sclerotinia stem rot N
base rot Y 20 5 20 5 0 30 70
Verticillium wilt U
Nematodes
northern root knot nem. U
root knot nematode U
Javanese root knot nem. U
root les nem brachyurus U
dagger nematode U
ring nematode U
groundnut root knot nem. U
Viruses
capsicum chlorosis N
peanut mottle Y 100 1 2 2 0 100 0
tobacco streak U
tomato spotted wilt Y 5 1 2 2 30 70 0
Phytoplasmas
witch’s broom Y 0 0 0 0 0 100 0
Y = present in region U = status on this crop unknown N = not present on this cropContributors: Malcolm Ryley, Dennis Persley, Murray Sharman, Jeff Tatnell, John Thomas, Peter Trevorrow, Graeme Wright

CuRRenT AnD PoTenTiAl CosTs fRoM DiseAses of Pulse CRoPs in AusTRAliA | 193 | GRDC
Table B.h.19 Presence, incidence, severity and contribution to control estimates of diseases of peanuts in the Queensland South Coast Zone
Disease Present in zone
Incidence Severity Contribution to control (%)
% of years % area affected
No control ControlBreeding Cultural Pesticide
% loss % loss
Necrotrophic leaf fungi
early leaf spot Y 5 0.5 5 1 10 45 45
net blotch Y 5 0.5 5 1 5 50 45
pepper spot U
late leaf spot Y 100 50 50 5 30 30 40
Biotrophic leaf fungi
rust Y 100 75 50 5 30 30 40
Root and crown fungi
damping off and aflatoxin Y 10 1 50 0 0 0 100
Aspergillus crown rot Y 100 1 50 5 0 0 100
Cylindrocladium black rot Y 5 1 30 0 20 30 50
Fusarium root rot Y 50 5 10 10 0 100 0
Diplodia rot U
charcoal rot U
Neocosmospora root rot N
Pyt pod rot/damping off U
Rhizopus damping off U
Rhizoctonia damping off U
Rhizoctonia blight Y 5 1 10 0 0 20 80
Sclerotinia blight N
Sclerotinia stem rot N
base rot Y 5 1 10 5 0 30 70
Verticillium wilt U
Nematodes
northern root knot nem. Y 100 25 5 0 0 100 0
root knot nematode N
Javanese root knot nem. N
root les nem brachyurus Y 100 40 5 0 0 100 0
dagger nematode Y 100 5 1 0 0 100 0
ring nematode Y 100 5 1 0 0 100 0
groundnut root knot nem. N
Viruses
capsicum chlorosis Y 100 10 20 10 0 100 0
peanut mottle Y 100 1 2 2 0 100 0
tobacco streak U
tomato spotted wilt Y 5 1 2 2 30 70 0
Phytoplasmas
witch’s broom Y 0 0 0 0 0 100 0
Y = present in region U = status on this crop unknown N = not present on this cropContributors: Malcolm Ryley, Dennis Persley, Murray Sharman, Graham Stirling, Jeff Tatnell, John Thomas, Peter Trevorrow, Graeme Wright

GRDC | 194 | CuRRenT AnD PoTenTiAl CosTs fRoM DiseAses of Pulse CRoPs in AusTRAliA
i. Mungbeans
Table B.i.3 Presence, incidence, severity and contribution to control estimates of diseases of mungbeans in the Queensland Central Zone
Disease Present in zone
Incidence Severity Contribution to control (%)
% of years % area affected
No control ControlBreeding Cultural Pesticide
% loss % loss
Necrotrophic leaf fungi
Alternaria leaf spot U
Cercospora leaf spot U
Biotrophic leaf fungi
powdery mildew U
Root and crown fungi
Fusarium root rot U
charcoal rot U
Pythium root rot U
Rhizoctonia root rot U
Sclerotinia stem rot U
basal rot U
Sclerotinia crown rot U
Nematodes
root knot nematode U
root lesion nem thornei Y 100 28 31 6 90 10 0
Bacteria
leaf scorch U
halo blight U
bacterial blight U
Viruses
alfalfa mosaic Y 0 0 0 0 0 100 0
bean common mosaic Y 0 0 0 0 0 100 0
tobacco streak Y 100 50 70 30 0 90 10
Phytoplasmas
big bud Y 10 10 1 0 0 0 100
Y = present in region U = status on this crop unknown Contributors: Kirsty Owen, Murray Sharman, Dennis Persley, John Thomas

CuRRenT AnD PoTenTiAl CosTs fRoM DiseAses of Pulse CRoPs in AusTRAliA | 195 | GRDC
Table B.i.4 Presence, incidence, severity and contribution to control estimates of diseases of mungbeans in the NSW North East/Queensland South East Zone
Disease Present in zone
Incidence Severity Contribution to control (%)
% of years % area affected
No control ControlBreeding Cultural Pesticide
% loss % loss
Necrotrophic leaf fungi
Alternaria leaf spot Y 5 1 0 0 0 100 0
Cercospora leaf spot U
Biotrophic leaf fungi
powdery mildew Y 100 50 10 0 75 0 25
Root and crown fungi
Fusarium root rot Y 10 1 20 20 0 0 0
charcoal rot Y 50 10 10 5 0 100 0
Pythium root rot Y 10 1 0 0 0 0 0
Rhizoctonia root rot Y 10 1 0 0 0 0 0
Sclerotinia stem rot N
basal rot Y 20 1 0 0 0 0 0
Sclerotinia crown rot Y 10 1 10 5 0 100 0
Nematodes
root knot nematode N
root lesion nem thornei Y 100 44 36 6 45 55 0
Bacteria
leaf scorch Y 100 10 20 10 80 20 0
halo blight Y 100 20 20 15 50 50 0
bacterial blight Y 50 5 10 5 0 100 0
Viruses
alfalfa mosaic Y 25 1 1 1 0 50 0
bean common mosaic Y 50 1 1 1 0 0 0
tobacco streak N
Phytoplasmas
big bud Y 50 1 1 1 0 0 50
Y = present in region U = status on this crop unknown N = not present on this cropContributors: Kirsty Owen, Malcolm Ryley, Murray Sharman, Dennis Persley, John Thomas

GRDC | 196 | CuRRenT AnD PoTenTiAl CosTs fRoM DiseAses of Pulse CRoPs in AusTRAliA
Table B.i.5 Presence, incidence, severity and contribution to control estimates of diseases of mungbeans in the NSW North West/Queensland South West Zone
Disease Present in zone
Incidence Severity Contribution to control (%)
% of years % area affected
No control ControlBreeding Cultural Pesticide
% loss % loss
Necrotrophic leaf fungi
Alternaria leaf spot U
Cercospora leaf spot U
Biotrophic leaf fungi
powdery mildew U
Root and crown fungi
Fusarium root rot U
charcoal rot U
Pythium root rot U
Rhizoctonia root rot U
Sclerotinia stem rot U
basal rot U
Sclerotinia crown rot U
Nematodes
root knot nematode U
root lesion nem thornei Y 100 67 31 6 90 10 0
Bacteria
leaf scorch U
halo blight U
bacterial blight U
Viruses
alfalfa mosaic U
bean common mosaic U
tobacco streak U
Phytoplasmas
big bud U
Y = present in region U = status on this crop unknown Contributor: Kirsty Owen
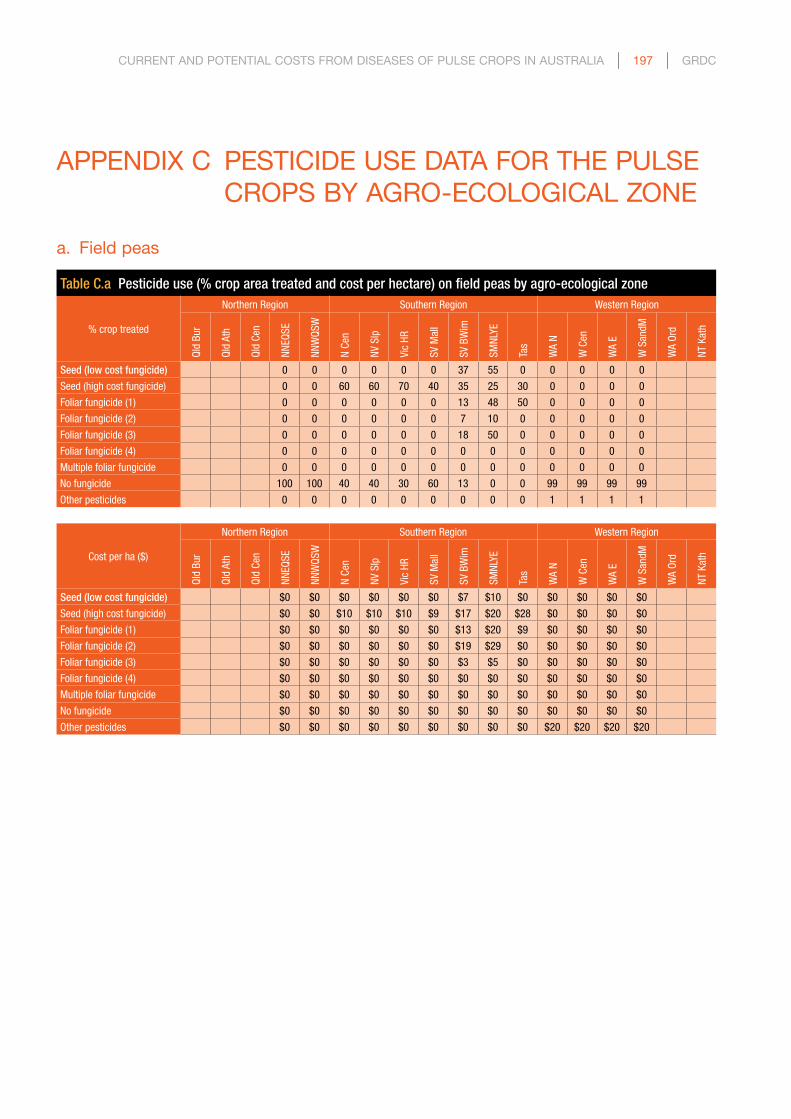
CuRRenT AnD PoTenTiAl CosTs fRoM DiseAses of Pulse CRoPs in AusTRAliA | 197 | GRDC
APPenDix C PesTiCiDe use DATA foR The Pulse CRoPs By AGRo-eColoGiCAl zone
a. field peas
Table C.a Pesticide use (% crop area treated and cost per hectare) on field peas by agro-ecological zone
% crop treated
Northern Region Southern Region Western Region
Qld
Bur
Qld
Ath
Qld
Cen
NNEQ
SE
NNW
QSW
N Ce
n
NV S
lp
Vic
HR
SV M
all
SV B
Wim
SMNL
YE
Tas
WA
N
W C
en
WA
E
W S
andM
WA
Ord
NT K
ath
Seed (low cost fungicide) 0 0 0 0 0 0 37 55 0 0 0 0 0
Seed (high cost fungicide) 0 0 60 60 70 40 35 25 30 0 0 0 0
Foliar fungicide (1) 0 0 0 0 0 0 13 48 50 0 0 0 0
Foliar fungicide (2) 0 0 0 0 0 0 7 10 0 0 0 0 0
Foliar fungicide (3) 0 0 0 0 0 0 18 50 0 0 0 0 0
Foliar fungicide (4) 0 0 0 0 0 0 0 0 0 0 0 0 0
Multiple foliar fungicide 0 0 0 0 0 0 0 0 0 0 0 0 0
No fungicide 100 100 40 40 30 60 13 0 0 99 99 99 99
Other pesticides 0 0 0 0 0 0 0 0 0 1 1 1 1
Cost per ha ($)
Northern Region Southern Region Western Region
Qld
Bur
Qld
Ath
Qld
Cen
NNEQ
SE
NNW
QSW
N Ce
n
NV S
lp
Vic
HR
SV M
all
SV B
Wim
SMNL
YE
Tas
WA
N
W C
en
WA
E
W S
andM
WA
Ord
NT K
ath
Seed (low cost fungicide) $0 $0 $0 $0 $0 $0 $7 $10 $0 $0 $0 $0 $0
Seed (high cost fungicide) $0 $0 $10 $10 $10 $9 $17 $20 $28 $0 $0 $0 $0
Foliar fungicide (1) $0 $0 $0 $0 $0 $0 $13 $20 $9 $0 $0 $0 $0
Foliar fungicide (2) $0 $0 $0 $0 $0 $0 $19 $29 $0 $0 $0 $0 $0
Foliar fungicide (3) $0 $0 $0 $0 $0 $0 $3 $5 $0 $0 $0 $0 $0
Foliar fungicide (4) $0 $0 $0 $0 $0 $0 $0 $0 $0 $0 $0 $0 $0
Multiple foliar fungicide $0 $0 $0 $0 $0 $0 $0 $0 $0 $0 $0 $0 $0
No fungicide $0 $0 $0 $0 $0 $0 $0 $0 $0 $0 $0 $0 $0
Other pesticides $0 $0 $0 $0 $0 $0 $0 $0 $0 $20 $20 $20 $20

GRDC | 198 | CuRRenT AnD PoTenTiAl CosTs fRoM DiseAses of Pulse CRoPs in AusTRAliA
b. narrowleaf lupins
Table C.b Pesticide use (% crop area treated and cost per hectare) on narrowleaf lupins by agro-ecological zone
% crop treated
Northern Region Southern Region Western RegionQl
d Bu
r
Qld
Ath
Qld
Cen
NNEQ
SE
NNW
QSW
N Ce
n
NV S
lp
Vic
HR
SV M
all
SV B
Wim
SMNL
YE
Tas
WA
N
W C
en
WA
E
W S
andM
WA
Ord
NT K
ath
Seed (low cost fungicide) 0 0 0 0 0 0 0 0 0 0 0
Seed (high cost fungicide) 60 60 70 45 60 45 10 0 0 0 0
Foliar fungicide (1) 0 0 0 0 0 0 0 0 0 0 0
Foliar fungicide (2) 0 0 0 0 0 0 0 0 0 0 0
Foliar fungicide (3) 0 0 0 0 0 0 0 0 0 0 0
Foliar fungicide (4) 0 0 0 0 0 0 0 0 0 0 0
Multiple foliar fungicide 0 0 0 0 0 0 0 0 0 0 0
No fungicide 40 40 30 55 40 55 0 0 0 0 0
Other pesticides 0 0 0 0 0 0 0 0 0 0 0
Cost per ha ($)
Northern Region Southern Region Western Region
Qld
Bur
Qld
Ath
Qld
Cen
NNEQ
SE
NNW
QSW
N Ce
n
NV S
lp
Vic
HR
SV M
all
SV B
Wim
SMNL
YE
Tas
WA
N
W C
en
WA
E
W S
andM
WA
Ord
NT K
ath
Seed (low cost fungicide) $0 $0 $0 $0 $0 $0 $0 $0 $0 $0 $0
Seed (high cost fungicide) $7 $7 $7 $13 $7 $13 $25 $0 $0 $0 $0
Foliar fungicide (1) $0 $0 $0 $0 $0 $0 $0 $0 $0 $0 $0
Foliar fungicide (2) $0 $0 $0 $0 $0 $0 $0 $0 $0 $0 $0
Foliar fungicide (3) $0 $0 $0 $0 $0 $0 $0 $0 $0 $0 $0
Foliar fungicide (4) $0 $0 $0 $0 $0 $0 $0 $0 $0 $0 $0
Multiple foliar fungicide $0 $0 $0 $0 $0 $0 $0 $0 $0 $0 $0
No fungicide $0 $0 $0 $0 $0 $0 $0 $0 $0 $0 $0
Other pesticides $0 $0 $0 $0 $0 $0 $0 $0 $0 $0 $0
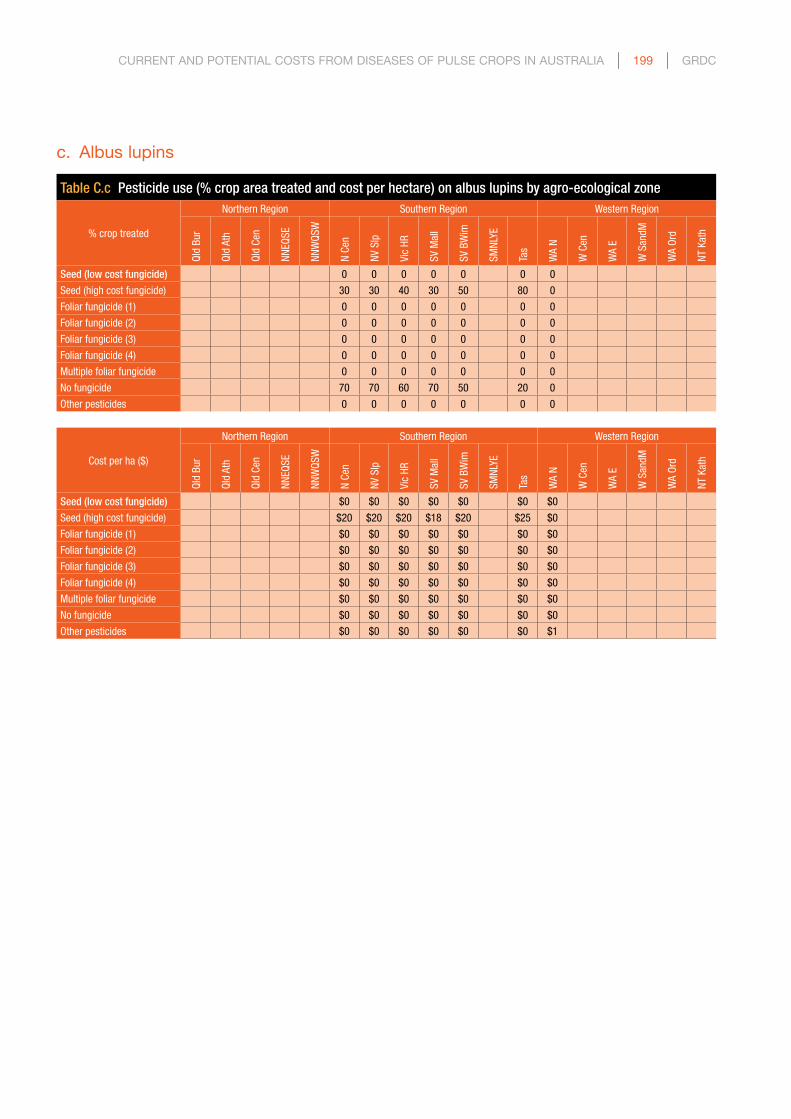
CuRRenT AnD PoTenTiAl CosTs fRoM DiseAses of Pulse CRoPs in AusTRAliA | 199 | GRDC
c. Albus lupins
Table C.c Pesticide use (% crop area treated and cost per hectare) on albus lupins by agro-ecological zone
% crop treated
Northern Region Southern Region Western RegionQl
d Bu
r
Qld
Ath
Qld
Cen
NNEQ
SE
NNW
QSW
N Ce
n
NV S
lp
Vic
HR
SV M
all
SV B
Wim
SMNL
YE
Tas
WA
N
W C
en
WA
E
W S
andM
WA
Ord
NT K
ath
Seed (low cost fungicide) 0 0 0 0 0 0 0
Seed (high cost fungicide) 30 30 40 30 50 80 0
Foliar fungicide (1) 0 0 0 0 0 0 0
Foliar fungicide (2) 0 0 0 0 0 0 0
Foliar fungicide (3) 0 0 0 0 0 0 0
Foliar fungicide (4) 0 0 0 0 0 0 0
Multiple foliar fungicide 0 0 0 0 0 0 0
No fungicide 70 70 60 70 50 20 0
Other pesticides 0 0 0 0 0 0 0
Cost per ha ($)
Northern Region Southern Region Western Region
Qld
Bur
Qld
Ath
Qld
Cen
NNEQ
SE
NNW
QSW
N Ce
n
NV S
lp
Vic
HR
SV M
all
SV B
Wim
SMNL
YE
Tas
WA
N
W C
en
WA
E
W S
andM
WA
Ord
NT K
ath
Seed (low cost fungicide) $0 $0 $0 $0 $0 $0 $0
Seed (high cost fungicide) $20 $20 $20 $18 $20 $25 $0
Foliar fungicide (1) $0 $0 $0 $0 $0 $0 $0
Foliar fungicide (2) $0 $0 $0 $0 $0 $0 $0
Foliar fungicide (3) $0 $0 $0 $0 $0 $0 $0
Foliar fungicide (4) $0 $0 $0 $0 $0 $0 $0
Multiple foliar fungicide $0 $0 $0 $0 $0 $0 $0
No fungicide $0 $0 $0 $0 $0 $0 $0
Other pesticides $0 $0 $0 $0 $0 $0 $1

GRDC | 200 | CuRRenT AnD PoTenTiAl CosTs fRoM DiseAses of Pulse CRoPs in AusTRAliA
d. Chickpeas
Table C.d Pesticide use (% crop area treated and cost per hectare) on chickpeas, by agro-ecological zone
% crop treated
Northern Region Southern Region Western RegionQl
d Bu
r
Qld
Ath
Qld
Cen
NNEQ
SE
NNW
QSW
N Ce
n
NV S
lp
Vic
HR
SV M
all
SV B
Wim
SMNL
YE
Tas
WA
N
W C
en
WA
E
W S
andM
WA
Ord
NT K
ath
Seed (low cost fungicide) 0 18 35 40 65 33 0 60 60 90 0 0 0 0 0
Seed (high cost fungicide) 0 2 16 16 30 60 90 20 30 0 0 0 0 0 0
Foliar fungicide (1) 0 1 38 28 45 63 80 77 87 90 0 0 0 0 0
Foliar fungicide (2) 0 0 24 18 34 17 80 17 43 25 0 0 0 0 0
Foliar fungicide (3) 0 0 8 5 10 5 0 0 0 0 0 0 0 0 0
Foliar fungicide (4) 0 0 5 4 5 3 0 0 0 0 0 0 0 0 0
Multiple foliar fungicide 0 0 19 10 1 1 0 0 0 0 0 0 0 0 0
No fungicide 0 79 5 28 5 8 10 13 2 0 0 0 0 0 0
Other pesticides 0 0 0 0 0 0 0 0 0 0 0 0 0 0 0
Cost per ha ($)
Northern Region Southern Region Western Region
Qld
Bur
Qld
Ath
Qld
Cen
NNEQ
SE
NNW
QSW
N Ce
n
NV S
lp
Vic
HR
SV M
all
SV B
Wim
SMNL
YE
Tas
WA
N
W C
en
WA
E
W S
andM
WA
Ord
NT K
ath
Seed (low cost fungicide) $0 $8 $9 $9 $10 $5 $0 $7 $7 $10 $0 $0 $0 $0 0
Seed (high cost fungicide) $0 $15 $15 $15 $15 $12 $9 $3 $3 $0 $0 $0 $0 $0 0
Foliar fungicide (1) $0 $20 $16 $16 $12 $26 $40 $28 $40 $40 $0 $0 $0 $0 0
Foliar fungicide (2) $0 $32 $28 $28 $24 $12 $40 $7 $20 $10 $0 $0 $0 $0 0
Foliar fungicide (3) $0 $44 $40 $40 $36 $18 $0 $0 $0 $0 $0 $0 $0 $0 0
Foliar fungicide (4) $0 $27 $38 $38 $48 $24 $0 $0 $0 $0 $0 $0 $0 $0 0
Multiple foliar fungicide $0 $0 $12 $32 $48 $24 $0 $0 $0 $0 $0 $0 $0 $0 0
No fungicide $0 $0 $0 $0 $0 $0 $0 $0 $0 $0 $0 $0 $0 $0 0
Other pesticides $0 $0 $0 $0 $0 $0 $0 $0 $0 $0 $0 $0 $0 $0 0

CuRRenT AnD PoTenTiAl CosTs fRoM DiseAses of Pulse CRoPs in AusTRAliA | 201 | GRDC
e. faba beans
Table C.e Pesticide use (% crop area treated and cost per hectare) on faba beans, by agro-ecological zone
% crop treated
Northern Region Southern Region Western RegionQl
d Bu
r
Qld
Ath
Qld
Cen
NNEQ
SE
NNW
QSW
N Ce
n
NV S
lp
Vic
HR
SV M
all
SV B
Wim
SMNL
YE
Tas
WA
N
W C
en
WA
E
W S
andM
WA
Ord
NT K
ath
Seed (low cost fungicide) 0 0 0 0 0 0 0 0 0 0 0 0 0
Seed (high cost fungicide) 0 0 0 0 0 0 0 0 0 0 0 0 0
Foliar fungicide (1) 25 25 40 40 40 20 63 80 90 0 0 0 0
Foliar fungicide (2) 50 50 60 60 70 25 33 20 20 0 0 0 0
Foliar fungicide (3) 15 0 0 0 0 0 17 20 0 0 0 0 0
Foliar fungicide (4) 0 0 0 0 0 0 23 35 0 0 0 0 0
Multiple foliar fungicide 0 0 0 0 0 0 0 0 0 0 0 0 0
No fungicide 10 25 5 5 5 3 0 0 0 0 0 0 0
Other pesticides 0 0 0 0 0 0 0 0 0 0 0 0 0
Cost per ha ($)
Northern Region Southern Region Western Region
Qld
Bur
Qld
Ath
Qld
Cen
NNEQ
SE
NNW
QSW
N Ce
n
NV S
lp
Vic
HR
SV M
all
SV B
Wim
SMNL
YE
Tas
WA
N
W C
en
WA
E
W S
andM
WA
Ord
NT K
ath
Seed (low cost fungicide) $0 $0 $0 $0 $0 $0 $0 $0 $0 $0 $0 $0 $0
Seed (high cost fungicide) $0 $0 $0 $0 $0 $0 $0 $0 $0 $0 $0 $0 $0
Foliar fungicide (1) $20 $20 $19 $19 $19 $18 $20 $20 $45 $0 $0 $0 $0
Foliar fungicide (2) $40 $40 $40 $40 $40 $20 $20 $10 $59 $0 $0 $0 $0
Foliar fungicide (3) $60 $0 $0 $0 $0 $0 $20 $28 $0 $0 $0 $0 $0
Foliar fungicide (4) $0 $0 $0 $0 $0 $0 $17 $23 $0 $0 $0 $0 $0
Multiple foliar fungicide $0 $0 $0 $0 $0 $0 $0 $0 $0 $0 $0 $0 $0
No fungicide $0 $0 $0 $0 $0 $0 $0 $0 $0 $0 $0 $0 $0
Other pesticides $0 $0 $0 $0 $0 $0 $0 $0 $0 $0 $0 $0 $0

GRDC | 202 | CuRRenT AnD PoTenTiAl CosTs fRoM DiseAses of Pulse CRoPs in AusTRAliA
f. lentils
Table C.f Pesticide use (% crop area treated and cost per hectare) on lentils, by agro-ecological zone
% crop treated
Northern Region Southern Region Western RegionQl
d Bu
r
Qld
Ath
Qld
Cen
NNEQ
SE
NNW
QSW
N Ce
n
NV S
lp
Vic
HR
SV M
all
SV B
Wim
SMNL
YE
Tas
WA
N
W C
en
WA
E
W S
andM
WA
Ord
NT K
ath
Seed (low cost fungicide) 0 0 60 90
Seed (high cost fungicide) 80 80 27 0
Foliar fungicide (1) 50 40 57 75
Foliar fungicide (2) 0 0 47 75
Foliar fungicide (3) 0 0 0 0
Foliar fungicide (4) 0 0 0 0
Multiple foliar fungicide 0 0 0 75
No fungicide 10 30 0 0
Other pesticides 0 0 0 0
Cost per ha ($)
Northern Region Southern Region Western Region
Qld
Bur
Qld
Ath
Qld
Cen
NNEQ
SE
NNW
QSW
N Ce
n
NV S
lp
Vic
HR
SV M
all
SV B
Wim
SMNL
YE
Tas
WA
N
W C
en
WA
E
W S
andM
WA
Ord
NT K
ath
Seed (low cost fungicide) $0 $0 $7 $10
Seed (high cost fungicide) $5 $5 $2 $0
Foliar fungicide (1) $40 $15 $25 $18
Foliar fungicide (2) $0 $0 $25 $18
Foliar fungicide (3) $0 $0 $0 $0
Foliar fungicide (4) $0 $0 $0 $0
Multiple foliar fungicide $0 $0 $0 $50
No fungicide $0 $0 $0 $0
Other pesticides $0 $0 $0 $0

CuRRenT AnD PoTenTiAl CosTs fRoM DiseAses of Pulse CRoPs in AusTRAliA | 203 | GRDC
g. Vetch
Table C.g Pesticide use (% crop area treated and cost per hectare) on vetch by agro-ecological zone
% crop treated
Northern Region Southern Region Western RegionQl
d Bu
r
Qld
Ath
Qld
Cen
NNEQ
SE
NNW
QSW
N Ce
n
NV S
lp
Vic
HR
SV M
all
SV B
Wim
SMNL
YE
Tas
WA
N
W C
en
WA
E
W S
andM
WA
Ord
NT K
ath
Seed (low cost fungicide) 0 0 0
Seed (high cost fungicide) 0 0 0
Foliar fungicide (1) 0 0 0
Foliar fungicide (2) 0 0 0
Foliar fungicide (3) 0 0 0
Foliar fungicide (4) 0 0 0
Multiple foliar fungicide 0 0 0
No fungicide 0 0 0
Other pesticides 0 0 0
Cost per ha ($)
Northern Region Southern Region Western Region
Qld
Bur
Qld
Ath
Qld
Cen
NNEQ
SE
NNW
QSW
N Ce
n
NV S
lp
Vic
HR
SV M
all
SV B
Wim
SMNL
YE
Tas
WA
N
W C
en
WA
E
W S
andM
WA
Ord
NT K
ath
Seed (low cost fungicide) $0 $0 $0
Seed (high cost fungicide) $0 $0 $0
Foliar fungicide (1) $0 $0 $0
Foliar fungicide (2) $0 $0 $0
Foliar fungicide (3) $0 $0 $0
Foliar fungicide (4) $0 $0 $0
Multiple foliar fungicide $0 $0 $0
No fungicide $0 $0 $0
Other pesticides $0 $0 $0

GRDC | 204 | CuRRenT AnD PoTenTiAl CosTs fRoM DiseAses of Pulse CRoPs in AusTRAliA
h. Peanuts
Table C.h Pesticide use (% crop area treated and cost per hectare) on peanuts by agro-ecological zone
% crop treated
Northern Region Southern Region Western RegionQl
d Bu
r
Qld
Ath
Qld
Cen
NNEQ
SE
NNW
QSW
N Ce
n
NV S
lp
Vic
HR
SV M
all
SV B
Wim
SMNL
YE
Tas
WA
N
W C
en
WA
E
W S
andM
WA
Ord
NT K
ath
Seed (low cost fungicide) 100 100 100 100 100 100
Seed (high cost fungicide) 0 0 0 0 0 0
Foliar fungicide (1) 0 0 0 0 0 0
Foliar fungicide (2) 0 0 0 0 0 0
Foliar fungicide (3) 0 0 0 0 0 0
Foliar fungicide (4) 0 0 0 0 0 0
Multiple foliar fungicide 20 100 100 100 100 100
No fungicide 80 0 0 0 0 0
Other pesticides 0 0 0 0 0 0
Cost per ha ($)
Northern Region Southern Region Western Region
Qld
Bur
Qld
Ath
Qld
Cen
NNEQ
SE
NNW
QSW
N Ce
n
NV S
lp
Vic
HR
SV M
all
SV B
Wim
SMNL
YE
Tas
WA
N
W C
en
WA
E
W S
andM
WA
Ord
NT K
ath
Seed (low cost fungicide) $10 $14 $10 $10 $10 $10
Seed (high cost fungicide) $0 $0 $0 $0 $0 $0
Foliar fungicide (1) $0 $0 $0 $0 $0 $0
Foliar fungicide (2) $0 $0 $0 $0 $0 $0
Foliar fungicide (3) $0 $0 $0 $0 $0 $0
Foliar fungicide (4) $0 $0 $0 $0 $0 $0
Multiple foliar fungicide $270 $450 $160 $80 $160 $270
No fungicide $380 $0 $0 $0 $0 $0
Other pesticides $0 $0 $0 $0 $0 $0

CuRRenT AnD PoTenTiAl CosTs fRoM DiseAses of Pulse CRoPs in AusTRAliA | 205 | GRDC
i. Mungbeans
Table C.i Pesticide use (% crop area treated and cost per hectare) on mungbeans by agro-ecological zone
% crop treated
Northern Region Southern Region Western RegionQl
d Bu
r
Qld
Ath
Qld
Cen
NNEQ
SE
NNW
QSW
N Ce
n
NV S
lp
Vic
HR
SV M
all
SV B
Wim
SMNL
YE
Tas
WA
N
W C
en
WA
E
W S
andM
WA
Ord
NT K
ath
Seed (low cost fungicide) 0 0 0 0
Seed (high cost fungicide) 0 0 0 0
Foliar fungicide (1) 0 0 0 0
Foliar fungicide (2) 0 0 0 0
Foliar fungicide (3) 0 0 0 0
Foliar fungicide (4) 0 0 0 0
Multiple foliar fungicide 0 0 0 0
No fungicide 0 0 0 0
Other pesticides 0 0 0 0
Cost per ha ($)
Northern Region Southern Region Western Region
Qld
Bur
Qld
Ath
Qld
Cen
NNEQ
SE
NNW
QSW
N Ce
n
NV S
lp
Vic
HR
SV M
all
SV B
Wim
SMNL
YE
Tas
WA
N
W C
en
WA
E
W S
andM
WA
Ord
NT K
ath
Seed (low cost fungicide) $0 $0 $0 $0
Seed (high cost fungicide) $0 $0 $0 $0
Foliar fungicide (1) $0 $0 $0 $0
Foliar fungicide (2) $0 $0 $0 $0
Foliar fungicide (3) $0 $0 $0 $0
Foliar fungicide (4) $0 $0 $0 $0
Multiple foliar fungicide $0 $0 $0 $0
No fungicide $0 $0 $0 $0
Other pesticides $0 $0 $0 $0


GRDC, Po Box 5367, kingston ACT 2604 T 02 6166 4500 f 02 6166 4599