the cranberry industry and ocean spray cooperative: lessons in cooperative governance
TRANSCRIPT

FSRG Monographs
The Cranberry Industry andOcean Spray Cooperative:Lessons in Cooperative Governance
Edward V. Jesse and Richard T. Rogers
FSRG Monograph Series, #19, January 2006
Food SystemResearch Group

F S R G M o n o g r a p h s
The Cranberry Industry and Ocean Spray Cooperative:
Lessons in Cooperative Governance
by
Edward V. Jesse Professor, Department of Agricultural and Applied Economics,
University of Wisconsin-Madison
Richard T. Rogers
Professor, Department of Resource Economics, University of Massachusetts, Amherst
FSRG Monograph Series, #19, January 2006

ii
Edward V. Jesse [email protected]
Richard T. Rogers [email protected]
The authors acknowledge, with gratitude, financial support for this research from the Food System Research Group, University of Wisconsin-Madison, the Cooperative State Research, Extension, Education Service, U.S. Department of Agriculture, the Massachusetts Agricultural Experiment
Station and the Food Marketing Policy Center, University of Connecticut, Storrs, CT.
The authors also sincerely thank the following reviewers for their constructive comments: Professor Michael Boland, Associate Director of the Arthur Capper Cooperative Center, Kansas State University; Dr. Kevin Kesecker, Economist, Economic Analysis and Program Planning Branch, Fruit
and Vegetable Programs, Agricultural Marketing Service, U.S. Department of Agriculture; and Assistant Professor Kimberly Zeuli, Department of Agricultural and Applied Economics, University
of Wisconsin-Madison. The authors bear sole responsibility for errors in fact or logic.
Food System Research Group Department of Agricultural and Applied Economics
University of Wisconsin-Madison http://www.aae.wisc.edu/fsrg/
All views, interpretations, recommendations, and conclusions expressed in
this document are those of the authors and not necessarily those of the supporting or cooperating organizations.
Copyright © by the authors. All rights reserved.
Readers may make verbatim copies of this document for noncommercial purposes by any means, provided that this
copyright notice appears on all such copies.

iii
Table of Contents
Page
TABLE OF CONTENTS III
INTRODUCTION 1
EVOLUTION AND CURRENT STATE OF THE U.S. CRANBERRY INDUSTRY 2 Early History 2 The Beginning of Cranberry Processing 3 The 1959 Cancer Scare 4 Enter: Blended Cranberry Juices 4 The Bubble Bursts 6 The Rise of Northland 7 Current Industry Conditions 9 Short-term Industry Economic Outlook 14
CRANBERRY SUPPLY AND PRICE RELATIONSHIPS 16 Producer Supply Response 16 Price Response 20 What Might Have Been 22
THE EVOLUTION OF OCEAN SPRAY 25 The Early Years 25 Diversification, Consolidation, and Turmoil 25 The Thorkilsen Era 27 The Llewellyn Era 31 Bullock, Hawthorne, and a Crisis of Confidence 36
OCEAN SPRAY AND THE CRANBERRY MARKETING ORDER 41 Implementation and Early Use of the Cranberry Marketing Order 41 The 2000 Regulation 42 The 2001 Regulation 43 The 2002 Non-Regulation 45 The Cranberry Marketing Order: Industry or Firm Marketing Tool? 47
REDIRECTION AND THE ROAD TO RECOVERY 48
SUMMARY AND CASE QUESTIONS 52
REFERENCES 56
1
The Cranberry Industry and Ocean Spray Cooperative: Lessons in Cooperative Governance
Edward V. Jesse and Richard T. Rogers
Introduction
This report is an industry case study of Ocean Spray Cooperative, one of the great success stories in agricultural marketing cooperatives. We identify several key industry and cooperative events dating to the late 1980s that, in combination, resulted in a crisis of confidence within the Ocean Spray membership, a degradation of market position, a loss of equity in the cooperative, and substantial financial losses to members. We then review Ocean Spray’s evolving plans for recovery.
Our principal objective is to identify lessons that can be learned from the manner in which firms deal with profound industry changes. In that light, we attempt to understand Ocean Spray’s strategic behavior and corporate objectives over the last two decades, when several events substantially altered the cranberry industry. We are particularly interested in how Ocean Spray used—or did not use—its market leadership position to either create or respond to those events and how its organization as a cooperative may have affected firm behavior.
Our analysis is a synthesis of primary and secondary information. Primary information included observations from extensive personal interviews with current and former Ocean Spray members in Massachusetts and Wisconsin, several of whom served on the Ocean Spray board of directors. However, we emphasize that what follows is our interpretation of the events and may not reflect the views of everyone we interviewed. Secondary sources included Ocean Spray annual reports, press accounts, internet sites, and USDA (including the Cranberry Marketing Committee) agency reports and data.
We begin this report with an historical review and contemporary overview of the U.S. cranberry industry. This is followed by a statistical analysis of grower-level cranberry supply and demand and derivation of “what if” scenarios pertaining to the boom and bust period of the late 1990s. Next, we trace the history of Ocean Spray, concentrating on significant events in the last two decades. We then review Ocean Spray’s role in the administration and deployment of the Cranberry Marketing Order. We conclude by first reviewing the current status of the cooperative, then summarizing and critiquing Ocean Spray’s management challenges during the “boom and bust” era of the cranberry industry and finally posing a set of questions to stimulate further discussion about issues related to cooperative management.

2
Evolution and Current State of the U.S. Cranberry Industry
Early History1
Cultivated cranberry production in the United States is commonly traced to the early 1800s. Ship captain and Cape Cod resident, Henry Hall, is purported to have fed his crew wild cranberries to prevent scurvy. Noting that the wild cranberries flourished when sand blew over them, he transplanted vines to what he called “cranberry yards” and manually spread sand to encourage growth. This practice proved successful, and by the 1850s, cranberry production had expanded both on the Cape and into neighboring Plymouth County.
Within a few years after commercialization of cranberries in Massachusetts, marshes were established in the “Pine Barrens” of New Jersey; an area with environmental characteristics similar to those on and near Cape Cod. The first cultivated variety (Howes—still harvested today) was planted in 1843.
The first commercial marshes in Wisconsin were established in the 1860s near Berlin by cultivating native cranberry vines. In the late 19th and early 20th centuries, production expanded rapidly in the natural wetland areas near the central part of the state. Later, marshes were developed in the north around Manitowish Waters, Eagle River, Spooner, and Hayward.
By 1885, cranberry production had spread to the West Coast. Early bogs in Oregon were developed by Massachusetts immigrants in search of warmer climates. Around the same time, Washington cranberries made their first appearance. Pacific County was the site of the state’s first bog, but eventually growers emerged in Gray’s Harbor and Whatcom counties.
By the end of the 19th century, cranberry growers were sharing their knowledge and otherwise working together through formal growers associations. The American Cranberry Growers’ Association was formed in New Jersey in 1873 and the Cape Cod Cranberry Growers’ Association began in Massachusetts in 1888.
The early 20th century brought the first cranberry marketing cooperative and the associated pooling of revenues. Headed by A.U. Chaney and Judge Gaynor, the Wisconsin Sales Company enrolled almost all of Wisconsin’s growers in 1906, its first year of operation. Chaney and Gaynor promoted the cooperative concept in eastern cranberry areas, leading to creation of the New England Cranberry Sales Company in Massachusetts and the New Jersey Cranberry Sales Company in 1907.
Within a short time, the three cooperatives merged to form the National Fruit Exchange, with Chaney as general manager. In 1910, the National Fruit Exchange merged with the Growers’ Cranberry Company to form the American Cranberry Exchange (ACE). ACE was a powerful organization. Its grower members signed contracts that committed their entire crop to affiliated sales companies, while ACE handled promotion, placement, and sales. Cranberries
1 This section draws heavily on Lambert.

3
were separately pooled by grade, type, and state and sold under the “Eatmor” brand name. The net proceeds from the pool were divided based on the quantity and quality of the berries that each grower delivered.
The Beginning of Cranberry Processing
In the early years of the U.S. cranberry industry, the crop was marketed exclusively as fresh fruit. Fresh cranberries cannot be stored for more than a few weeks, and most of the crop was sold shortly after harvest for consumption during the Thanksgiving and Christmas holidays. Production was heavily concentrated in the Northeast, so differences in weather led to substantial variability in production and price. Between 1910 and 1929, annual cranberry production ranged from less than 300,000 barrels to more than 750,000 barrels and season-average grower prices ranged from $4 to $14 per barrel (Figure 1).
Figure 1. Cranberry Price Volatility: 1910-1929
0.0
100.0
200.0
300.0
400.0
500.0
600.0
700.0
800.0
1910 1912 1914 1916 1918 1920 1922 1924 1926 1928
Prod
uctio
n - 1
,000
Bar
rels
0.00
2.00
4.00
6.00
8.00
10.00
12.00
14.00
16.00
Pric
e - $
/Bar
rel
Source: USDA, Statistical Reporting Service
Production(Left Axis)
Grower Price(Right Axis)
This extreme price volatility motivated efforts to preserve cranberries as a way to extend their marketing season. Marcus Urann, a member of the ACE board of directors, was reportedly the first person to attempt commercial canning of cranberries. He began experimenting with

4
making whole cranberry sauce in his home kitchen in 1912, nearly a century after the first cultivation of the crop. Urann’s experiments were successful, eventually leading to a commercial venture in which he processed and marketed cranberry sauce under the name “Ocean Spray.”
Urann’s successful canning venture spawned several competitors. Competition among canners and between the canning and fresh market sectors of the industry ultimately led to the creation of Cranberry Canners, Inc., the predecessor of Ocean Spray Cooperative, in 1930 (see subsequent section).
World War II military needs prompted expansion of processing into dehydrated cranberries and other processed forms. Post-war R&D by Cranberry Canners, Inc., led to other new products including frozen cranberries, cranberry relish, and cranberry cocktail beverages. Fresh consumption continued to outpace processed usage until the 1950s, but cranberry processing increasingly became an important outlet for excess and unusable fresh fruit.
The 1959 Cancer Scare
The cranberry industry suffered a major setback in 1959. In early November, the U.S. Department of Health, Education and Welfare, announced that the herbicide, aminotriazole, which was used on cranberries in Oregon and Washington, had been found to cause cancer in mice. Fresh cranberries treated with the herbicide had already been distributed into the Thanksgiving market and could not be separated from cranberries grown without aminotriazole. Consumer confidence plummeted—USDA reported fresh cranberry sales in 1959 as zero.
Under a special federal program, cranberry growers were ultimately indemnified about $8.00 per barrel for losses experienced in 1959 (compared to the market price of $9.00). But consumer confidence continued to be weak despite an immediate halt in the use of aminotriazole. At the same time, production continued to expand due to earlier plantings, leading to oversupply and low prices. The industry successfully sought a marketing order that authorized the use of volume control to assist in adjusting cranberry production to diminished demand. The final order was implemented on August 15, 1962, and volume control was used to limit cranberry sales from the 1962 crop.2
Enter: Blended Cranberry Juices
The cranberry industry matured in the 1960s. Acreage grew slowly in response to relatively favorable and steady prices during the decade. Yields increased by about 30 barrels per acre (50 percent) due to improved production techniques and varieties. Mechanical dry picking
2 The Cranberry Marketing Order and Ocean Spray’s role in administration are discussed in detail in a subsequent section of this report.

5
replaced the use of scoops for fresh fruit and wet harvesting became common for fruit destined for processing.
On the demand side, sales of cranberry cocktail were increasing, and Ocean Spray introduced Cran-Apple and other cranberry juice blends. This growing juice market meant that the volume of cranberries destined for processing continued to climb while the volume used for the fresh market remained flat.
Nevertheless, the early years of the 1970s suffered a persistent oversupply of cranberries. Higher yields and expanded bearing acreage in every producing state resulted in large crops exceeding the slowly growing demand, creating large inventories of frozen fruit and low grower prices. The industry turned again to marketing order volume control in the 1970 and 1971 crop years. Despite order-imposed sales restrictions, grower prices were below $11.00 per barrel for both years compared to an average $16.00 during the pervious five years.
By the late 1970s, increasing consumption of cranberry juice blends allowed demand to not only catch up with but to overtake increasing supplies.3 Prices rose rapidly, to more than $40 per barrel by the early 1980s.
Expanding cranberry juice sales and related higher juice prices also attracted Ocean Spray competitors—Clement Pappas, Clermont, Cliffstar, Decas and Hiller. These smaller firms were able to make inroads in an essentially homogeneous product market by undercutting Ocean Spray’s concentrate prices to private label blenders. Later, some began producing their own private label blends for retail sale.
Demand continued to outpace supply through the 1980s and into the 1990s. These were good years for cranberry growers. Grower prices yielded very profitable returns, leading to expansion by current growers and to entry by new growers. Bearing cranberry acreage grew by nearly 20 percent between 1980 and 1990 and by another 35 percent between 1990 and 1999 (Figure 2). Growers replanted older low-yielding varieties with new hybrids, bumping yields by 50 percent between 1970 and 1990, and leading to a doubling of production in 20 years. Despite this increase in production, shifting demand kept prices increasing, further stimulating grower entry and expanding the production base.
3 Between 1970 and 1980, per capita consumption of fruit juices in the United States rose 45 percent, from 5.5 gallons to 7.4 gallons [USDA-ERS].

6
Figure 2. U.S. Cranberries: Harvested Acreage and Yield
0
5
10
15
20
25
30
35
40
45
1934 1939 1944 1949 1954 1959 1964 1969 1974 1979 1984 1989 1994 1999 2004
1,00
0 A
cres
0
20
40
60
80
100
120
140
160
180
Bar
rels
per
Acr
e
Source: USDA-NASS
Acreage(Left Axis)
Yield(Right Axis
While all producing regions showed increased acreage, growth in acreage and yield in Wisconsin surpassed other regions. The state enjoyed lower costs of production than other regions, largely because of newer, larger marshes that facilitated mechanized cultural practices. During much of the 1990s, harvested acreage in Wisconsin grew at the rate of 1,000 acres per year. Wisconsin, with half as many growers as Massachusetts, overtook the Bay State in 1995 as the leading cranberry producing state and never looked back.
The Bubble Bursts
During the cranberry euphoria of the mid-1990s, a serious market disequilibrium was building. Fundamental supply and demand factors—amplified by changes in industry structure and behavior—led to a collapse in prices.
The fundamental factors leading to the price collapse were related principally to the nature of cranberry culture. Cranberries are a perennial crop. While a commercial crop can be harvested two years after planting (and sometimes after only one year), beds do not reach full bearing potential until five to seven years after planting. Cranberries have a bearing life approaching infinity (some active, productive bogs are more than 100 years old). New plantings in the 1990s were mostly of hybrid varieties with yields double to triple average yields. Bed development costs are $25,000-$40,000 per acre, several times the annual

7
cultural costs. Development costs are “sunk costs”—since the asset is highly specialized, the cost can only be fully recovered by utilizing the asset in its specialized application.
These characteristics led to the following sequence of events: Existing and new cranberry growers responded to attractive prices of the 1980s and early 1990s by making large, long-term investments in bog development. Between the long period between planting and first commercial harvest, market conditions deteriorated badly. The decision to invest in developing cranberry beds was no longer justified. But the large investments already made represented sunk costs, and the annual cultural and harvest costs were still less than the depreciated crop value. So there was no economic incentive to abandon marshes.
With respect to fundamental demand factors, cranberry juice blends retained their popularity into the 1990s. In fact, highly-publicized medical research in 1994 demonstrating the efficacy of cranberry juice in preventing urinary tract infection (UTI) further boosted demand. But cranberry juice faced increasing competition from other fruit juices. And the demand boost from perceived health effects proved to be one-time. The market was becoming saturated.
The Rise of Northland
The market structure and firm behavior factors leading to the crash largely began with the departure in 1993 of Northland Cranberries, Inc., a large Ocean Spray member that eventually challenged Ocean Spray in the branded juice segment. Northland was Ocean Spray’s largest member in terms of volume, representing about 200,000 barrels of fruit. Donna Jeffords, another large grower representing about 100,000 barrels, left Ocean Spray in the same year. The combined volume of Northland and Jeffords accounted for nearly 8 percent of Ocean Spray’s volume.
Initially, Jeffords’ fruit was contracted with Clermont, a handler that later declared bankruptcy and went out of business—a victim of subsequent price escalation. Northland initially contracted with Cliffstar and Clement Pappas (both of whom had previously acquired fruit from Ocean Spray) to provide processing fruit at prices exceeding $65 per barrel for three years. Even before these contracts expired, Northland built processing capacity, and began handling all of its own fruit in 1996. Northland subsequently contracted with other growers to expand its fruit supply, and soon became the second largest U.S. cranberry handler, marketing fresh fruit and juices under the Northland label.
Northland’s termination of its supply contracts resulted in Cliffstar and Pappas scrambling for fruit by to meet contractual commitments for private label juice. Their attempts to secure grower contracts led to a major buildup in grower prices in 1996 and 1997.
The badly overheated market crashed rapidly. Crop years 1997 and 1998 brought record crops (5.5 million barrels), and sales remained under 1994’s 5.2 million barrels. As a result, year-end cranberry inventories by 1998 jumped from their normal 20-30 percent of sales to more than 50 percent. U.S. season average grower prices fell from $63.70 in 1997 to $38.80 per barrel in 1998 (Figure 3).

8
Figure 3. U.S. Cranberries: Production and Grower Price
0
1,000
2,000
3,000
4,000
5,000
6,000
7,000
1934 1939 1944 1949 1954 1959 1964 1969 1974 1979 1984 1989 1994 1999 2004
1,00
0 B
arre
ls
0
10
20
30
40
50
60
70
$/B
arre
l
Domestic Production (Left Axis)
Grower Price (Right Axis)
Source: USDA-NASS
The 1999 crop year brought another production record of almost 6.4 million barrels. Wisconsin, with most of the newer cranberry acreage, produced 40 percent more cranberries than in 1998. Sales continued to slump, and by the end of harvest, it became clear that ending inventories would approach an entire year’s sales. Season average grower prices fell to $17.20 per barrel.
The industry implemented production constraints via the Cranberry Marketing Order during the 2000 and 2001 crop years in an effort to balance supply and demand. The second year of volume regulation combined with large government purchases brought inventories down to 2,500 barrels by the end of the 2001 season. While stocks were still excessive by historical standards, the Cranberry Marketing Committee resisted a third year of volume regulation in 2002. A comparatively small crop held supply in check in 2002, and no regulation has been recommended since 2001.

9
Figure 4. U.S. Cranberries: Acquisitions versus Sales
-1,500
-500
500
1,500
2,500
3,500
4,500
5,500
6,500
7,500
1944 1949 1954 1959 1964 1969 1974 1979 1984 1989 1994 1999 2004
1,00
0 B
arre
ls
AcquisitionsSalesChange in Inventory
Source: USDA-NASS and Cranberry Marketing Committee
Current Industry Conditions
Domestic Production Sector U.S. cranberries are grown primarily in five states: Wisconsin, Massachusetts, New Jersey, Oregon and Washington.4 Production characteristics for the major producing states are shown in Table 1 and relative production shares are shown in Figure 5. 5
4 USDA does not routinely report cranberry production data from states other than the five principal producing states. The 2002 Census of Agriculture reported 25 growers in Maine, 8 in Michigan, 5 in Rhode Island, 2 in New York, and 7 in other states. 5 The cranberry cost of production figures shown in the table are taken from a survey of cranberry growers conducted by Farm Credit Services. They are shown to demonstrate differences in cultural costs across states and do not represent the full economic cost of production. Moreover, cultural costs in 2002 were likely abnormally low because of low cranberry returns in the previous two years. Cost do not include depreciation or interest expense, which together averaged $6.86 per barrel across all states but were not reported separately by state. Costs also exclude interest on equity capital and return to management, which were not recorded in the survey. The sample of growers was selected from among Farm Credit borrowers, Ocean Spray members, and subscribers to Cranberries Magazine. Consequently, the sample is not random.

10
Table 1. Characteristics of Cranberry Production by State
2002 Census of Agriculture 2002 First Pioneer FC**
2004 National Ag Statistics Service
State Farms Acres Acres per
Farm Cost of Production Harvested Acres
Yield per Acre
Total Production
$ per Bbl. Bbl. 1,000 Bbl
Massachusetts 482 14,707 30.5 24.78 14,100 128.2 1,808
New Jersey 41 3,105 75.7 15.02 3,100 129.7 394
Oregon 161 2,958 18.4 18.86 2,900 170.7 495
Washington 131 2,001 15.3 26.48 1,700 100.0 170
Wisconsin 237 17,494 73.8 16.27 17,400 189.4 3,295
Other States 47 420 8.9 NA NA NA NA
Total/Avg. 1,099 40,685 37.0 19.72 39,200 150.8 5,684 *Source: USDA-NASS, July 2005
** First Pioneer Farm Credit, ACA
Figure 5. U.S. Cranberry Production by State
0.0
0.5
1.0
1.5
2.0
2.5
3.0
3.5
4.0
4.5
5.0
5.5
6.0
6.5
7.0
1954
1956
1958
1960
1962
1964
1966
1968
1970
1972
1974
1976
1978
1980
1982
1984
1986
1988
1990
1992
1994
1996
1998
2000
2002
2004
Mill
ion
Bar
rels
Washington
Oregon
New Jersey
Wisconsin
Massachusetts
Source: USDA-NASS

11
• Wisconsin is the leading producing state with over 60 percent of total U.S. production in 2004. Most of the recent growth in acreage has occurred in Wisconsin, and a substantial portion of new acreage is located outside natural wetland areas. In general, Wisconsin growers are larger than the U.S. average, are more likely to be full-time growers, and enjoy lower costs of production than most other states. There remains considerable growth potential in the state.
• Massachusetts, the second leading state with about 32 percent of 2004 production, has exhibited constant to declining production over the last ten years. Massachusetts bogs are mainly on or near Cape Cod in natural wetland areas. Bogs tend to be small and irregular in shape, which results in higher costs to apply fertilizer and chemicals. Massachusetts has nearly half of all U.S. cranberry growers and probably more than half of these would be considered part-time growers. There is strong development potential for much of the land devoted to growing cranberries, and as a result, acreage is expected to decline.
• New Jersey production (7 percent of the 2004 total) has been in decline, more sharply recently when the largest grower (De Marco) deeded his cranberry acreage to a preserve. New Jersey has the fewest growers among states and the largest average acreage per farm. Production costs are very low. New Jersey bogs are in the Pinelands area, which is protected from residential development, but there is limited expansion potential in the area because of competition with blueberry production.
• Oregon cranberry production was 9 percent of the U.S. total in 2004. Production has about doubled over the last ten years. Production is confined to a small coastal area near Coos Bay. Further significant expansion potential is believed to be limited.
• Washington produced 3 percent of the 2004 cranberry crop. Growers are small. Production is highly concentrated in the Grayland area and as a result, production has been highly variable depending on local weather conditions. There is no trend in production and growth potential is believed to be limited.
The domestic cranberry production sector remains financially distressed from several years of very low prices. Grower prices averaging under $18 per barrel in 1999 and 2000 were below the cash costs of production for most growers. Prices have since recovered, but remain well below those experienced in the early to mid 1990s. USDA reported U.S. average grower prices for the 2002-2004 crops ranging from $32 to $35 per barrel, which is believed to be close to full production costs (including “normal” returns to management and equity) for a majority of U.S. growers but too low to stimulate growth in plantings. Virtually all growers have cut labor and other inputs, which has kept yields below trend. Part-time growers have increasingly subsidized their cranberry operations with off-farm income and personal savings. Larger, full-time growers have assumed additional debt, which lenders have—at least so far—been willing to extend. Attrition has been slow despite poor returns.

12
Foreign Suppliers Customs reports show fresh and frozen cranberry imports in 2004 of 45,300 metric tons, nearly all from Canada (Figure 6). This converts to 1 million barrels. The U.S. also imports cranberry concentrate, which, unfortunately, is not separated out from other fruit juices in trade reporting.
Figure 6. U.S. Imports of Fresh and Frozen Cranberries from Canada
0
200
400
600
800
1000
1200
1989 1990 1991 1992 1993 1994 1995 1996 1997 1998 1999 2000 2001 2002 2003 2004
1,00
0 B
arre
ls
Source: USDA-Foreign Ag. Service
U.S. imports from Canada are almost entirely in the form of production contracted by U.S. handlers. Ocean Spray’s Canadian members are believed to have the same share of production as U.S. members, about 70 percent. Canadian production, which is grown mainly in British Columbia and Quebec has increased faster than U.S. production. Canadian exports of fresh cranberries to the U.S. grew four-fold between 1989 and 2004. In 2004, Canada supplied almost as many barrels to U.S. handlers as the states of New Jersey and Oregon combined (Table 2). Canadian cranberry production and exports to the U.S., especially from Quebec, are expected to increase (Table 3).

13
Table 2. 2004 Canadian Cranberry Production
Province Bearing Acres
Yield (Bbl/A)
Production (1,000 Bbl)
Farm Price ($CDN/Bbl)
Farm Value ($CDN1,000)
Nova Scotia 110 55.5 6.1 88.52 540New Brunswick 360 157.2 56.6 41.52 2,350Quebec 2,650 203.8 540.0 41.30 22,300British Columbia 3,860 222.5 859.0 39.50 33,930Other Provinces 65 69.2 4.5 51.11 230Total Canada 7,045 208.1 1,466.2 40.48 59,350
Source: Statistics Canada.
Table 3. Canadian Cranberry Acreage, 2002-2005
Province Acres 2002 2003 2004 2005
Bearing 2,300 2,370 2,650 3,050Non-Bearing 300 130 650 750
Quebec
Total 2,600 2,500 3,300 3,800 Bearing 3,600 3,800 3,860 3,535Non-Bearing 400 300 240 365
British Columbia
Total 4,000 4,100 4,100 3,900 Bearing 335 575 535 550Non-Bearing 335 105 155 130
Other Provinces
Total 670 680 690 680 Bearing 6,235 6,745 7,045 7,135Non-Bearing 1,035 535 1,045 1,245
Total Canada
Total 7,270 7,280 8,090 8,380Source: Statistics Canada.

14
Significant cranberry acreage was planted in Chile in the 1990s. In its web site, Cran Chile reports 1,025 harvested acres under intensive cultivation, which would suggest production of 150-200 thousand barrels by this company alone. Since Cran Chile operates a processing facility, U.S. imports from Chile are mostly in the form of concentrate. Future levels of imports from Chile are uncertain, but are not expected to exceed 15-20 percent of those from Canada.
Handlers6 An estimated 95 percent of the cranberries grown in the United States and Canada are contracted by four handlers. The remaining fruit is marketed by forty or more smaller producer-handlers, most of whom deal principally in fresh fruit. In addition, the Wisconsin Cranberry Cooperative collectively markets fruit for a small number of Wisconsin growers by negotiating spot market sales of fresh and frozen cranberries with independent handlers and some industrial users
Ocean Spray is believed to control about 70 percent of cranberry production. Its share of industry sales is less, since it sells part of its members’ fruit to other handlers.
The major remaining independent handlers are Cliffstar, Clement-Pappas, and Decas. Cliffstar Corporation is a highly diversified juice company; cranberry juices are believed to represent a small percentage of its total sales. In its web site (www.cliffstar.com) , Cliffstar claims to be, “The nations’ largest independent private label juice company.” Cliffstar is believed to contract with growers for about 70 percent of its fruit needs, obtaining the remaining 30 percent from other handlers.
Clement-Pappas Corporation (www.clementpappas.com) specializes in cranberry products but also distributes other juices. It distributes under private label and through food service outlets, but sells some cranberry juice under its Ruby Kist label.
Decas Cranberry Products (www.decascranberry.com) markets only cranberry products in fresh, semi-processed, and fully-processed forms. Major products are cranberry concentrate and sweetened-dried cranberries. Decas’ fruit is a combination of production from company-owned and contracted acres.
Short-term Industry Economic Outlook
Sales of cranberry products translated to barrels of raw product have shown a fairly steady upward trend since 1977 (Figure 7). Notable exceptions were sales below trend in 1997-99 and sales buttressed by government purchases above trend in 2000 and 2001. This predictability suggests that, absent more aggressive marketing or major demand shifts, the industry can expect sales growth of about 165,000 barrels per year. 6 The term, handler, refers to a receiver of cranberries for subsequent sale as fresh or processed products who is subject to regulation under the Cranberry Marketing Order. Handlers include producers who market their own fruit (producer-handlers).

15
On the supply side, U.S. average cranberry yields are increasing at the rate of about 2.5 barrels per acre per year due to higher-yielding varieties in the acreage base and improved cultural practices. Current bearing and potential bearing acreage is approximately 41,000 acres. Applying trend increase yield to current acreage shows domestic production increasing by about 100,000 barrels per year with no change in bearing acreage, less than trend increase in sales. But increasing Canadian acquisitions suggest the possibility of a surplus in the near term if sales remain at or below trend.
Figure 7. Cranberry Sales by U.S. Handlers
0.0
1,000.0
2,000.0
3,000.0
4,000.0
5,000.0
6,000.0
7,000.0
8,000.0
1977
1979
1981
1983
1985
1987
1989
1991
1993
1995
1997
1999
2001
2003
2005
2007
2009
1,00
0 B
arre
ls
Actual Sales
1977-2004Trend Sales
Source: USDA-NASS and Cranberry Marketing Committee

16
Cranberry Supply and Price Relationships
The market factors underlying the cranberry boom and bust period from the late 1970s though the early 21st century can be incorporated into statistical supply and price models. These models, in turn, can be used to simulate alternate scenarios—what might have happened with more disciplined price expectations.
Producer Supply Response
Because cranberry is a perennial crop, decisions to plant are long-term in nature. Growers make large one-time investments in bog/marsh development that will yield no return for the first two or three years, followed by an income stream over many years. Investors must be confident that the discounted value of the net (of annual cultural and harvest costs) income stream over the anticipated life of the investment will be greater than or equal to the investment costs.
Accordingly, expectations regarding price are formed over a longer time horizon than for annual crops. The variability in observed prices is also important. High returns sustained over several years would be expected to generate new plantings while low and volatile returns would lead to limited investment and temporary or permanent bog/marsh abandonment.
Cranberry yields are also hypothesized to be sensitive to price, but the time frame is shorter. During good times, growers tend to use better cultural practices, both because they have the money to do so and because they expect that continued high per unit returns will more than offset higher costs.
The effect of price levels and variability on cranberry production was explored using alternative regression specifications that included weighted average prices and standard deviation of price as explanatory variables. Separate specifications were developed for harvested acreage and yield. The acreage specification ultimately selected was:
∆ Harvested Acreaget = f(Average pricet-2), SD pricet-2, MO dummyt, Post-MO Dummyt) where: ∆ Harvested Acreaget = Year-to-year change in reported U.S. harvested cranberry
acreage Average Pricet-2 = Real (deflated) 10-year weighted moving average grower price,
U.S., lagged two years. Weights are sequentially declining integers (10, 9, 8,…1); e.g., for year t, the season average grower price for year t-2 is weighted by 10 and the price for year t-11 is weighted by 1. The price deflator is the Index of Prices Received by Farmers, all commodities, 1990-92=100.

17
SD Pricet-2 = Moving 10-year standard deviation of real grower price, lagged two years.
MO Dummyt = Dummy variable equal to 1 minus the allotment percentage
applied under the Cranberry Marketing Order, zero in other years.7 The value of this variable is 0.15 in 2000 and 0.35 in 2001.
Post-MO Dummyt = Dummy variable equal to 1 in 2002.
This specification hypothesizes that growers look at prices over a ten year span in making planting decisions, and that more recent years have a proportionally larger influence. The two-year lag corresponds to the minimum time between planting and first harvest. While the assumption that growers use several years experience and weight more recent years’ prices heavier than those from more distant years is intuitively plausible, there is little basis for specifying a priori the appropriate lag structure (number of years and weights). The particular structure used is admittedly arbitrary and was selected after experimenting with various lags and weights.
Price variability is measured by the standard deviation of grower prices over the 10 years preceding planting. The marketing order dummy is included to reflect acreage that was temporarily not harvested when allotments were imposed under the cranberry order. Many, if not most, growers met their allotment quota by not harvesting some bearing acreage rather than altering cultural practices to reduce yields.
The 2002 dummy is included to capture an abnormally large increase in bearing acreage between 2001 and 2002 that is not related to the other explanatory variables. Bearing acreage jumped by 5,100 acres in 2002. This huge jump exceeds the second largest year-to-year increase of 1,700 acres by a factor of three. This unusual increase is partly the result of two successive years of regulation and the related acreage suppression noted above. The marketing order dummy is intended to measure this suppression, but there is evidence that a considerable amount of non-bearing acreage was allowed to mature for one or two years when the order was in effect. The marketing order encouraged this by granting an artificially large sales history to new acreage (see section on the marketing order). Many growers with both non-bearing and bearing acreage had an incentive to leave non-bearing acreage mature and use the assigned allotment to cover production from bearing acreage. This incentive disappeared when the marketing order restrictions were lifted in 2002.
Because of the perennial nature of cranberry production, current bearing acreage is expected to heavily influence subsequent year’s acreage. The equation was estimated in first difference
7 The handler withholding (set-aside) provision of the Cranberry Marketing Order was used in 1962, 1963, 1970 and 1971. This provision is not hypothesized to affect harvested acreage because the set-aside restriction was applied at the handler level.

18
form to avoid the autocorrelation problems that are usually encountered when lagged acreage is included as an independent variable.
The results of estimating this specification over the period 1954-2002 are shown in Table 4:
Table 4. Regression Statistics: Acreage Response
Adjusted R Squared 0.82
Standard Error 424.9
Observations 51
Coefficients Standard Error t Stat
Intercept -550.64 283.14 -1.94
Lagged Weighted Price 35.54 6.94 5.12
Standard Deviation of Price -47.98 11.25 -4.26
Marketing Order Dummy -8,561.67 1,175.38 -7.28
2002 Season Dummy 4,963.71 437.75 11.34
These results confirm that acreage is positively related to weighted average grower returns per barrel over the last ten years and negatively related to the variability in returns. The coefficient for average price can be interpreted as follows: Other things held constant, a $1 per barrel increase in the 10-year weighted average grower price would increase harvested acreage by about 35 acres per year. Stated differently, a grower price averaging $40 per barrel over 10 years would result in about 3,500 more harvested acres than an average price of $30 per barrel.
The coefficient for the 10-year standard deviation of price confirms that planting decisions depend on the stability of prices over time. Other things held constant, a 10-year standard deviation of $10 per barrel would be expected to result in about 250 fewer acres per year than a 10-year standard deviation of $5.8
The coefficient for the marketing order dummy indicates a predicted acreage reduction of about 1,300 acres in 2000, when the allotment percentage was 85 percent of sales history, and 3,100 acres in 2001, when the allotment percentage was 65 percent. The 2002 Post-marketing 8 Over the period of estimation, the mean 10-year weighted average price was $36.71 and the mean 10-year standard deviation was 9.88.

19
order dummy suggests about a 5,000 acre marketing order acreage suppression beyond that captured by the marketing order dummy and other explanatory variables.
The cranberry yield specification was:
Yieldt = f(2-year average pricet-1, Trendt) Where: Yieldt = U.S. average yield in barrels per harvested acre 2-year average pricet-1 = Real 2-year simple moving average grower price, U.S., lagged
one year. The price deflator is the Index of Prices Received by Farmers, all commodities, 1990-92=100.
Trendt = Time trend measured by year.
This specification hypothesizes that current year yield is influenced by the average price experienced over the past two years and trend. The price variable captures both the incentive and the ability to bump yields when prices are strong. Trend reflects yield-enhancing improvements in cultural practices and cranberry varieties that are related to time.
The regression results for the yield relationship estimated over the 1954-2004 period is shown in Table 5:
Table 5. Regression Statistics: Yield Response
Adjusted R Squared 0.95
Standard Error 8.57
Observations 51
Coefficients Standard Error t Stat
Intercept -4,562.38 176.47 -25.85
2-year average price 0.28 0.12 2.38
Trend 2.35 0.09 26.15

20
Cranberry yields are shown to be positively related to the mean price over the previous two years; the coefficient shows a price gain of $10 per barrel was associated with a 2.8 barrel yield increase. The trend variable coefficient indicates yields, on average, increase by 2.35 barrels per year due to the adoption of high-yielding hybrid varieties and improved bog/marsh management practices.
Price Response
Estimation of grower price relationships for cranberries is made difficult by the large increases in cranberry demand that occurred during the 1980s and early 1990s. Price and total cranberry supply both increased during this period. Previous work has used a short period of estimation following the demand shifts or combined before and after periods [Jesse].
Another way of dealing with the anomalous period is to use intercept and/or slope shift variables to capture the increase in demand. The following specification is based on evaluating scatter plots and experimenting with alternative shift variables:9
Pricet = f(PC-Supplyt, PC-DispInct, D1977-84, D1985-90, D1991-2004) Where: Pricet = Real U.S. season-average grower cranberry price per barrel as reported by the
National Agricultural Statistics Service. The price deflator is the Index of Prices Received by Farmers, all commodities, 1990-92=100.
PC-Supplyt = Per capita cranberry supply defined as the sum of current year domestic
production, beginning inventory (all forms), and foreign acquisition of cranberries by U.S. handlers divided by U.S. total mid-year population. Total supply is adjusted for reported shrink from 1970.
PC-DispInct = Real per capita U.S. disposable personal income in $1,000 units, deflated using
the CPI-U, 1982-84 = 100. D1980-84 = Intercept shift variable equal to 1 for 1980-84 and 0 otherwise. D1985-90 = Intercept shift variable equal to 1 for 1985-90 and 0 otherwise D1991-2002 = Intercept shift variable equal to 1 for 1991-2004 and 0 otherwise
9 Prices of substitutes and complements would usually be included as explanatory variables in a demand relationship. Experimentation with per-capita supplies of possible substitute fruit juices failed to divulge significance and complements to cranberry juice are not obvious.

21
This specification represents a simple demand relationship assuming that supply is exogenously determined. This assumption is reasonable in light of the multi-year lag between planting of cranberries and first commercial harvest. In other words, there is no contemporaneous relationship between quantity supplied and price. The binary variables depict discrete parallel shifts in demand.
This specification estimated over the 1954-2004 period yielded the results shown in Table 6.
Table 6. Regression Statistics: Price Response
Adjusted R Squared 0.73
6.23 Standard Error
Observations 51.00
Coefficients Standard Error t Stat
Intercept 32.95 6.40 5.15
Per Capita Total Supply -29.71 3.99 -7.45
Per Capita Disposable Income 2.88 1.01 2.85
1980-84 Intercept Shift 24.02 3.50 6.87
1985-90 Intercept Shift 35.99 4.06 8.87
1991-04 Intercept Shift 50.24 5.47 9.18
All of the variable coefficients have the expected signs and are significantly different from zero at the 95 percent level of confidence. The total supply coefficient can be more easily interpreted by converting it to represent total barrels rather than per capita pounds. Using 2004 U.S. population of 294 million, the coefficient implies that a 1 million barrel year-to-year change in total cranberry supply would change grower price by about $10 per barrel in the opposite direction. The price flexibility based on mean price and total supply over the entire 1954-2004 period is -1.4, indicating an inelastic demand. Demand is increasingly inelastic over time. Using intra-period means, price flexibility is calculated as -1.0 from 1954 to 1979 and -2.1 from 1991 to 2004.
The income coefficient suggests that an increase in per capita disposable income of $1,000 would increase grower price by about $3 per barrel. The associated very high income

22
elasticity of 0.9 likely means that the income variable is likely picking up a trend effect beyond what is captured by the intercept shift variables.
The binary variable coefficients show how demand shifted over time. At any given level of supply and income, deflated grower prices are shown to be $24 per barrel higher than 1954-79 in 1980-84; $36 higher in 1985-90; and $50 higher in 1991-2004.10
What Might Have Been
The rapid price escalation in the 1980s and early 1990s and the related excess profitability induced excessive cranberry plantings. Higher grower prices were justified in part by market conditions—more fruit was needed to meet growing demand, underlying fundamental market growth. But the behavior of competing handlers resulted in an undisciplined situation that elevated prices above what were necessary to meet the growing demand.
To evaluate the effect of excess profitability on cranberry acreage and production, prices can be constrained at specified levels within the acreage model. Figure 8 shows the effect of fixing grower price at $40 per barrel from 1991 through 2004.11
Figure 8. U.S. Cranberry Production: Constrained Grower Prices*
3.0
3.2
3.4
3.6
3.8
4.0
4.2
4.4
4.6
4.8
5.0
5.2
5.4
5.6
5.8
6.0
6.2
6.4
6.6
1991 1992 1993 1994 1995 1996 1997 1998 1999 2000 2001 2002 2003 2004
Mill
ion
Bar
rels
Actual production
Simulated Production
*Grower price fixed at $40/Bbl from 1991 through 2004;Actual yields applied to simulated bearing acreage
10 Of course, using the same supply and income levels over the entire period is inappropriate since both were increasing over time. 11 A grower price of $40 per barrel would generate normal profits or greater for most cranberry growers.

23
Simulated production was calculated by applying actual yields to harvested acreage generated by the acreage equation.12 The simulation assumes that volume control under the marketing order was not used in 2000 and 2001; i.e., neither the Marketing Order dummy nor the Post-Marketing Order dummy were applied in calculating simulated bearing acreage.
Simulated production remains close to actual until 1995, when the gap begins to widen. By 1999, simulated production is about 800,000 barrels less than actual. In 2001, when the marketing order was used with a producer allotment of 65 percent, the simulated and actual series converge. Actual production was about 360,000 barrels less than simulated production in 2004.13
The actual price pattern between 1991 and 2004 resulted in the addition of 13,500 bearing acres. With the fixed $40 per barrel price, simulated bearing acreage in 2004 is 37,000 acres, 2,200 acres (6 percent) less than reported bearing acreage of 39,200.
The grower price relationship can be used to assess the price levels that would have likely occurred if acreage had not expanded as rapidly as it did. To simulate the effect of constrained acreage, harvested acreage was increased by 700 acres per year starting in 1994, when actual acreage began to escalate. The resulting simulated acreage in 2004 was 37,100 (the same ending acreage as generated in the fixed price simulation) compared to reported acreage of 39,200. Annual cranberry production was simulated by applying actual yields to simulated acreage. Reported shrink, foreign acquisitions, and sales were used to calculate simulated total available supply, but sales were adjusted by subtracting government purchases made during 1999-2002. Volume control under the marketing order was assumed not to be used in 2000 and 2001.
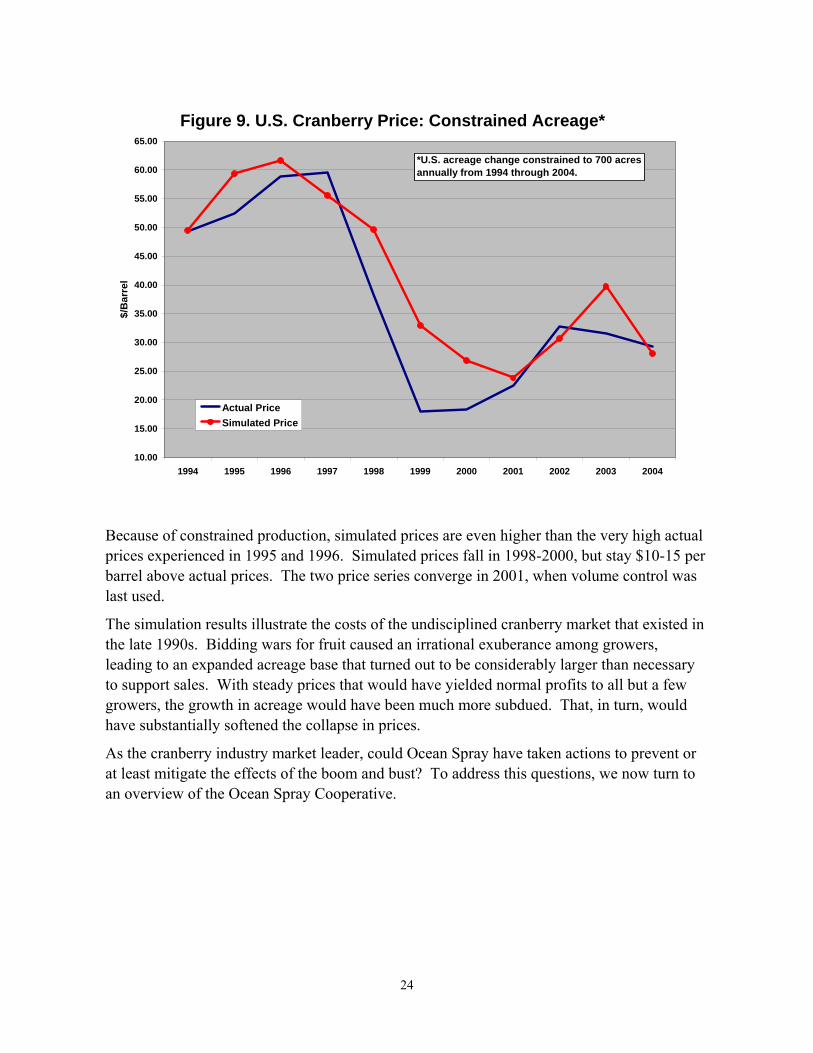
The resulting simulated prices are shown in Figure 9:
12 Using predicted yields would have captured the effect of lower prices than actually experienced. But at the same time, it would have ignored actual weather conditions giving rise to abnormally high or low yields. 13 Fixing grower price at $40 per barrel reduces the variance of the simulated price series, and the standard deviation becomes zero in 2002. In other words, the negative effect of price variability on simulated plantings is much less than where price is allowed to vary.
24
Figure 9. U.S. Cranberry Price: Constrained Acreage*
10.00
15.00
20.00
25.00
30.00
35.00
40.00
45.00
50.00
55.00
60.00
65.00
1994 1995 1996 1997 1998 1999 2000 2001 2002 2003 2004
$/B
arre
l
Actual PriceSimulated Price
*U.S. acreage change constrained to 700 acresannually from 1994 through 2004.
Because of constrained production, simulated prices are even higher than the very high actual prices experienced in 1995 and 1996. Simulated prices fall in 1998-2000, but stay $10-15 per barrel above actual prices. The two price series converge in 2001, when volume control was last used.
The simulation results illustrate the costs of the undisciplined cranberry market that existed in the late 1990s. Bidding wars for fruit caused an irrational exuberance among growers, leading to an expanded acreage base that turned out to be considerably larger than necessary to support sales. With steady prices that would have yielded normal profits to all but a few growers, the growth in acreage would have been much more subdued. That, in turn, would have substantially softened the collapse in prices.
As the cranberry industry market leader, could Ocean Spray have taken actions to prevent or at least mitigate the effects of the boom and bust? To address this questions, we now turn to an overview of the Ocean Spray Cooperative.

25
The Evolution of Ocean Spray
The Early Years
Ocean Spray Cooperative was created in 1930 as Cranberry Canners, Incorporated (CCI). Three large cranberry growers—Marcus Urann and A.D. Makepeace, Inc., from Massachusetts and Barbara Lee from New Jersey—constituted the original membership. Initially, the exclusive purpose of the cooperative was to process cranberries that were either unsuitable for marketing as fresh fruit or that represented a price-depressing surplus to the fresh market. Processed products were sold under the Ocean Spray label, which Urann had previously used for his canning company.
The creation of CCI followed several years of destructive competition and price-cutting among independent cranberry processors, with the effects spilling over into the fresh fruit market. CCI was the brainchild of Urann, a strong believer in cooperation, who served as the CEO and board president of the cooperative for 24 years. During the early years of CCI, annual reports often dealt more with the need for cooperation than with the status of the cooperative. Common to this era, the cooperative was perceived as a social/political institution at least as much as an economic entity.
CCI grew to encompass several other cooperatives engaged in marketing fresh fruit as members, thus becoming a quasi-federation. By 1942, four such cooperatives accounted for 75 percent of CCI’s deliveries. Member cooperatives continued to market their fresh fruit under their respective labels and used CCI as an outlet for processing.
In the early years of the cooperative, strong emphasis was placed on expanding consumer demand for cranberry sauce and, later, cranberry cocktail, by keeping store prices low. In 1950, the cooperative boasted that sales had reached the level of one can of cranberry sauce per U.S. household and set a new goal of one can per person.
Diversification, Consolidation, and Turmoil
By 1945, CCI was poised to expand beyond processing. It commissioned a study by a prominent management consulting firm that recommended the formation of a consolidated national cooperative via a merger of CCI with the American Cranberry Exchange (ACE), the largest fresh fruit cooperative at that time. While CCI strongly endorsed the concept, ACE never committed to the merger.
In 1947, CCI changed its name to the National Cranberry Association (NCA). NCA assumed the business plan of the proposed consolidated national cooperative. NCA announced its intent to package fresh cranberries under the Ocean Spray label. However, fresh sales were suspended until 1954.
The announced intent to market fresh cranberries was apparently muscle-flexing by NCA to force a merger with ACE. Because of ACE’s resistance to a merger, the two cooperatives

26
agreed to form the Cranberry Growers Council in 1950. The purpose of the Council was to coordinate marketing of the cranberry crop between the fresh market (ACE) and processing (NCA). It had powers to allocate collective supplies between the two outlets.
The Cranberry Growers Council dissolved in 1953 because of pronounced differences between NCA and ACE concerning distribution of the crop. Bad blood led to both cooperatives deciding to abandon informal and formal agreements to specialize in fresh and processed cranberries. ACE subsequently folded after the New England Cranberry Sales Company, a large member of ACE, disbanded and sold its assets to NCA, and the A.D. Makepeace Company withdrew from ACE and contracted to market 100 percent of its fruit through NCA.
After abandoning all conciliatory efforts in 1954, NCA sold 186,000 barrels of Ocean Spray fresh fruit. That volume represented about one third of total fresh market sales. In the same year, NCA expanded its processing offerings to frozen products (cranberry-orange relish and frozen whole cranberries) and began to heavily promote cranberry cocktail. Cocktail sales doubled between 1953 and 1957, but cranberry sauce remained the dominant product.
In 1957, NCA finally became Ocean Spray and adopted its widely-recognized “wave” trademark for all fresh and processed products. The cooperative emerged from the 1950s battle of the Titans as king of the cranberry hill.
The failure of the Cranberry Growers Council reflected deeper divisions within the cranberry industry, especially when faced with the challenge of marketing abnormally large crops. An unpublished 1955 report describes the schisms in the industry at that time—and is eerily prophetic about much later developments:
“With the breakup of the Growers Council in the fall of 1953 and Eatmor (ed. note: Eatmor was ACE’s brand) and National (ed. note: NCA) each marketing both fresh and processed cranberries, it became perfectly obvious that competition and rivalries between these two organizations would increase in the immediate future. Several significant changes are anticipated to take place in the cranberry industry with the expansion of production occurring in the Midwest and a contraction of production occurring in eastern states. The marketing of large crops has always presented problems, however, these problems were greatly intensified by the actions of the people within the industry. The cranberry industry has been dominated by a few individuals whose actions apparently were not always for the common good of the industry. The problems between the national cooperatives are accentuated by the clash of personalities of their leaders [Kross] (emphasis added).”
Ocean Spray members in the late 1950s were a fairly homogeneous lot. More than half of the cooperative’s members delivered less than 200 barrels per year—about the yield of a single acre of hybrid cranberries in 2005. At the same time, distinctions among members and regions were emerging. Wisconsin members produced nearly three times the average production of Massachusetts members, and about 15 percent of the cooperative’s members

27
produced 75 percent of the total crop. This disparity created internal disputes, later to intensify, concerning the cooperative’s governance, especially its one-member/one vote policy.14
The cranberry “cancer scare” in 1959 altered the U.S. cranberry industry and Ocean Spray in several ways. Diminished demand was followed by large crops, leading to oppressive inventories of processed products and low grower prices. Ocean Spray led industry efforts to create a federal marketing order that authorized handler “set-asides,” and to encourage government purchases of cranberries for feeding programs (see subsequent section on Ocean Spray and the marketing order). The cooperative also expanded advertising in an effort to buttress demand. But it was not until 1965 that the industry weaned itself of government purchases.
During the mid-1960s, Ocean Spray began introducing new cranberry products. Ed Gelsthorpe, appointed CEO in 1963, was a strong proponent of cranberry juices and juice blends as a means of expanding cranberry sales.15 In 1964, cranberry cocktail was finally distributed nationally, and the cooperative began producing sliced cranberries and cranberry relish as industrial products. A year later, cranberry-orange relish was released into national retail markets along with “low-cal” versions of sauce and cocktail. In 1966, Ocean Spray began national distribution of cran-apple juice, its first blended juice product, which was followed in 1967 by cran-prune, a product that achieved only limited success and was later dropped.
Ocean Spray entered the 1970s as a powerful industry leader. The cooperative’s share of the total cranberry crop exceeded 90 percent. But the early 1970s proved challenging to Ocean Spray and the entire industry. Sales were affected by macroeconomic factors, including recession, high interest rates, and rapid inflation followed by price and wage controls. A federal ban on cyclamate, an artificial sweetener, limited sales of low-calorie items and eroded inventory value. At the same time, production continued to grow, leading to burdensome inventories and low grower prices.
The Thorkilsen Era
Harold (Hal) Thorkilsen became the fourth chief executive officer of Ocean Spray in 1972, during this period of industry turmoil. Ocean Spray growers had netted less than $10 per barrel in 1970 and 1971, compared to consistently more than $14 in 1964-69. Thorkilsen’s predecessor had held office for only three years. The members were clearly restless.
Thorkilsen proved to be an enormously successful leader of Ocean Spray, moving the cooperative from a cranberry cooperative with a well-recognized brand name to a Fortune 500 14 Growing membership diversity commonly creates management problems for cooperatives [Sexton; Staatz, Staatz (1987a) and Staatz (1987b)]. 15 Until 1957, the chairman of Ocean Spray’s predecessor Boards of Directors simultaneously served as general manager. The first separate General Manager/CEO was Ambrose Stevens, followed by Gelsthorpe.

28
company playing a strong leadership role in the juice aisle. Thorkilsen was a bold manager with sound ideas that he was capable of selling to his elected board. He hired well-qualified department managers. He knew the value of research and development and advertising. Indeed, no agricultural cooperative even came close to the consumer-oriented media advertising by Ocean Spray during Thorkilsen’s tenure when it ranked among the top 50 food advertisers in the USA [Rogers].
During his 15 years as the Ocean Spray CEO, Thorkilsen’s accomplishments included:
• Negotiated co-packing arrangements with Sunsweet and other companies, which helped to even out processing schedules and minimize seasonal capacity constraints.
• Expanded the cooperative to the grapefruit juice market, which spread fixed costs and extended the strong Ocean Spray brand name.
• Redirected the cooperative’s primary market development and advertising efforts to blended juices, developing and promoting juice products that exploited consumers’ strong demand for beverages perceived to be healthy and “natural.”
• Aggressively developed international markets for Ocean Spray products.
• Invested extensively in new processing capacity and state-of-the-art processing equipment and methods.
• Developed and adopted aseptic processing techniques (shelf-stable juice boxes) to expand single-serve sales.
Thorkilsen made financially successful marketing investments. During his 15-year tenure as Ocean Spray’s CEO (1972-1987), selling, marketing, and administrative expenses increased steadily and rapidly, from $16 million to $184 million. But over the same period, the cooperative’s sales increased from $87 million to $736 million, and net proceeds (grower returns) grew from $23 million to $207 million (Figures 10 and 11).
Thorkilsen’s investments paid off handsomely. He became almost a cult icon among Ocean Spray members, who saw their per barrel returns grow by leaps and bounds. With few exceptions, Ocean Spray board members were happy to serve as passive observers of a profitably unfolding scene. Anecdotes relate Thorkilsen’s orientation of new board members as his telling them to judge him on his performance: “If I increase your net proceeds by $2.00 per year, then don’t get in my way.” He did and, for the most part, they didn’t.

29
Figure 10. Ocean Spray Sales and Net Proceeds:Thorkilsen Era
0
100
200
300
400
500
600
700
800
1972 1973 1974 1975 1976 1977 1978 1979 1980 1981 1982 1983 1984 1985 1986 1987
Mill
ion
Dol
lars
Sales
Net Proceeds
Source: Ocean Spray Annual Reports
Figure 11. Ocean Spray Net Proceeds and Sales Expense: Thorkilsen Era
0
20
40
60
80
100
120
140
160
180
200
220
1972 1973 1974 1975 1976 1977 1978 1979 1980 1981 1982 1983 1984 1985 1986 1987
Mill
ion
Dol
lars
Net Proceeds
Adv., Marketing, and Admin.
Source: Ocean Spray Annual Reports

30
Thorkilsen’s enormous success at Ocean Spray created two problems, one external to the cooperative and one internal. The external problem was the encouragement of competitors. The popularity of cranberry juice blends along with the absence of patented technologies to protect ‘recipes’ made it possible for independent processors to make inroads through private label sales, undercutting Ocean Spray prices. While Ocean Spray could control its own supply through its membership and contracting policies, it could not control the supply of cranberries to independent processors. And since growing cranberries had become very profitable, expanding the independent supply was not difficult. Ocean Spray’s market share of both cranberry deliveries and sales of cranberry products began to slip.
The internal problem involved Thorkilsen, himself. Given his success, he grew weary of dealing with an unwieldy 25-member board of directors consisting exclusively of grower-members selected by a popular vote among members. The board members nearly always approved his recommendations. Nonetheless, decision-making was slower than he liked. Some directors felt compelled by their very board membership to question management policies; others had more substantive disagreements with certain actions.16 Thorkilsen coveted greater independence in managing and growing Ocean Spray.
In 1986, Thorkilsen initiated action to streamline Ocean Spray management in collaboration with a few of the largest Ocean Spray members. A plan was developed to reduce the size of the board of directors to 13 members: nine growers, three outside members, and the CEO. A meeting was arranged in Chicago to finalize the plan for inclusion as a resolution at the upcoming annual meeting. The Chicago meeting was not officially noticed in accordance with Ocean Spray bylaws.
Word of the planned meeting leaked, and there was a subsequent uproar among Ocean Spray members who viewed the action as a power play designed to diminish grower control. The Chicago meeting was cancelled, and there was no resolution to alter the composition of the board at the subsequent annual meeting.
But the damage had been done. Thorkilsen announced his retirement in 1986 to be effective on December 31, 1987. Stuart Pedersen, the president of the board of directors was replaced at the 1987 annual meeting. The Thorkilsen era was over.
The “Chicago Plan” was adopted almost intact 14 years later. But in 1986, it was viewed as contrary to the general concept of cooperative management. There was sufficient member opposition not only to prevent its consideration but also to cause the premature departure of an otherwise highly successful CEO.
In retrospect, perhaps Thorkilsen’s only major flaw was his inability to read Ocean Spray membership. He consistently made money for Ocean Spray members, and was frustrated by what he perceived as the board’s tinkering with his plans and by the difficulty in moving 16 For example, the decision to expand the cooperative to include grapefruit was strongly opposed by some board members. Thorkilsen was a strong believer in multiple pools (“disciplined diversification”) [Christian Science Monitor, March 25, 1982], but tentative plans to add other commodity pools were squelched by this opposition.

31
forward quickly on new initiatives. He saw a smaller, more cohesive board of directors as the way to achieve greater managerial independence—not just for himself but for his successors and for the good of the company.
The stockholders of Ocean Spray and of any cooperative are not merely stockholders. Their interests go beyond making a profit on their investment. They are suppliers to as well as owners of their company. They have the right and the responsibility to manage the company. They hire professional management to carry out their objectives, not to independently operate the company. Many Ocean Spray members believed the proposed restructuring of their board of directors would limit their control and result in their disenfranchisement.
The incident brought to light deeper-seated divisions within the cooperative that would become more pronounced later. In the minds of many members, the board was too large, too unwieldy, and too grower-focused. Growth of the cooperative required a common market-focused vision. Other members believed that the principal—if not exclusive —function of the board was to ensure grower returns that exceeded returns to non-members.
These positions might have been difficult to compromise. But restructuring might have been pursued in a manner that would not have alienated members, perhaps in stages: First, get members to approve outside board members. Some large cooperatives use outside board members to provide a broader business perspective, and promoting the concept should have been an easy sell. Next, develop and discuss proposals for downsizing the board, re-assigning seats to maintain equity among regions. The key element in restructuring the board would have seemed to be involving members throughout the process.
The Llewellyn Era
John S. (Jack) Llewellyn, Jr., succeeded Thorkilsen as the Ocean Spray CEO on January 1, 1988 and held the top management post for nine years. Llewellyn’s more flamboyant management style contrasted with Thorkilsen’s. He was adept in working with the board of directors—perhaps to a fault in the sense of relying too heavily on the diverse board for management direction instead of presenting creative marketing and strategic business strategies for their consideration. In particular, he failed to provide sound arguments to counter board actions that may have pleased some individual board members but that were clearly not in the best interest of the cooperative as a business entity.
Ocean Spray continued to face competitive challenges during the Llewellyn era. The rate of growth in sales remained strong, increasing from less than $800 million in 1988 to more than $1.4 billion in 1996. But sales were not matching long-term projections, and the cost of achieving higher sales increased at the same rate, leaving net proceeds flat (Figures 12 and 13). Competitors made further inroads into blended juice sales, eroding Ocean Spray’s market share. Ocean Spray’s member base also eroded as competitors seduced some members to jump ship.

32
Figure 12. Ocean Spray Sales and Net Proceeds: Llewelyn Era
0
200
400
600
800
1,000
1,200
1,400
1,600
1988 1989 1990 1991 1992 1993 1994 1995 1996
$Mill
ion
SalesNet Proceeds
Source: Ocean Spray Annual Reports
Figure 13. Ocean Spray Net Proceeds and Administrative Costs: Llewelyn Era
0
50
100
150
200
250
300
350
400
1988 1989 1990 1991 1992 1993 1994 1995 1996
$Mill
ion
Net ProceedsAdm. Costs
Source: Ocean Spray Annual Reports

33
Two events during the Llewellyn era were especially important to the evolution of Ocean Spray, the short-lived Pepsi alliance and the departure of Northland as a member of the cooperative.
The Pepsi Alliance. In 1991, Ocean Spray signed an exclusive distribution agreement with Pepsico [New York Times, November 19, 1991]. Pepsi became the sole distributor of Ocean Spray single-serve juice products and Pepsi and Ocean Spray agreed to jointly develop new juice-based single serve products. The alliance was hailed in the business press as the ultimate win-win partnership: Pepsi gained a prominent juice name to add to its full service line of single serve beverages and the potential to add more juices under the Ocean Spray brand. Ocean Spray gained access to about one million convenience stores, vending machines, and other single serve outlets.
Sales of Ocean Spray single serve juices doubled in the first years of the agreement and by 1995, single serve represented one third of total company sales in the juice category. Ocean Spray Splash®, Breakers®, and lemonade had been added to the cooperative’s single serve line through joint Ocean Spray-Pepsi product development.
In 1995, the alliance was modified to exclude product development because of apparent differences of opinion about control over the jointly-developed brands [New York Times, June 28, 1997]. The distribution agreement was extended until May 1998. In mid-1997, Pepsi announced it would not renew the distribution agreement when it expired. Pepsi’s stated reason for ending the arrangement was that it intended to develop and distribute its own juice brands. Before the termination date, however, Pepsi rescinded, and the two companies agreed to continue doing business through 2000—Pepsi would continue to distribute Ocean Spray juices along with other drink brands [Boston Globe, April 1, 1998].
Within months of the extension, Pepsi announced its purchase of Tropicana from Seagram. Ocean Spray quickly sued to enjoin Pepsi from distributing Tropicana single serve juices on grounds that Pepsi was restricted by the agreement from distributing directly-competing brands. Pepsi countered that there was no exclusivity, and that it was not restricted from distributing its own brands along with Ocean Spray brands [New York Times, August 13, 1998]. The dispute appeared to hinge on orange juice, which was Tropicana’s principal claim to fame, but which had also become Ocean Spray’s best selling single serve product
Ocean Spray’s suit lost in district court, lost on appeal, and was eventually dropped in 2000, when the cooperative quit using Pepsi as its single serve distributor [Wall Street Journal, March 13, 2000]. Attempts to negotiate a similar arrangement with other national distributors failed and single serve sales plummeted.
Could or should the Pepsi alliance have been salvaged? Ocean Spray’s strongest advantage over its competitors was its brand. That advantage was subject to attack in the at home juice category though lower-priced private labels. It was nearly impervious to attack in the single serve category, especially when the brand was supported by the extensive Pepsi distribution system. Hence, the alliance was critical to Ocean Spray.

34
Ocean Spray appeared to see the alliance as a means of extending its own juice line. Pepsi saw it as a way of filling out its beverage line. So the issue became one of whether Ocean Spray could be content with jointly developing and putting its label on juice-based beverages that Pepsi needed to sustain its growth as a full service beverage supplier.
The Departure of Northland. Northland Cranberries, Inc., was formed as a publicly-traded cranberry grower in 1987 through the consolidation of five limited partnerships and the purchase of additional marshes through a stock offering. The corporation signed a standard 3-year membership contract with Ocean Spray that was renewed for another three years in 1990. Northland grew rapidly through purchases of marshes and became Ocean Spray’s largest member by 1993, marketing over 200,000 barrels of fruit annually. This represented about 5 percent of Ocean Spray’s crop.
Northland did not renew its Ocean Spray marketing contract in 1993. It began marketing fresh fruit under the Northland label in 1994 and sold cranberries for processing to Cliffstar and Clement Pappas under three-year supply contracts.
Ocean Spray’s response to Northland’s departure seemed to be one of relief. John Swendrowski, Northland’s CEO, had ruffled the feathers of several board members. Northland’s supply contracts with Cliffstar and Clement-Pappas meant that Ocean Spray would not have to sell fruit to these competitors, meaning that the net fruit loss to the cooperative would be negligible. Planting grants—grower authorization to plant with a guarantee that Ocean Spray would market the fruit—were stepped up to offset the loss in member acreage and to accommodate long-term plans to substantially increase sales.
In 1994, Northland completed construction of a processing facility and a year later rolled out branded 100% juice cranberry blends.17 Production was initially limited to fruit in excess of the volume tied up in supply contracts, but by 1997, Northland 100% juices were in national distribution and represented a rapidly growing segment of the at-home cranberry juice category.
Ocean Spray was slow to respond to the popularity of 100% juice, apparently misreading consumers’ demand for “natural” beverages without added sweeteners. After realizing that 100% juice was not a passing fad and that Northland was eating up market share, Ocean Spray began marketing a 100% juice product in 1998. But the juice was sold under the Wellfleet Farms label, which Ocean Spray had acquired in 1996 to market cranberry-based food products. The apparent rationale for selling 100% juice under the Wellfleet label was to avoid calling attention to the low fruit juice and high water content of juice products labeled as Ocean Spray.
Wellfleet 100% juice flopped [New York Times, September 22, 1999]. It was pulled from the market in 1999 and replaced by Ocean Spray Premium 100% juice. Northland attempted to 17 Because of the inherent tartness of cranberries, cranberry juice blends contain a relatively small percentage of cranberry juice. Pear, apple, or grape juice comprises the bulk of 100% cranberry juice blends, often accompanied by small amounts of other berry juices (e.g., raspberry, blueberry, peach).

35
further differentiate its 100% juices in 2000 by upping cranberry juice content to 27% and stressing the health benefits of the higher level of cranberry. Ocean Spray did not counter with a comparable product, instead shifting its competitive strategy to aggressive promotion, discounting and trade deals.
In a 2002 lawsuit, Northland alleged that Ocean Spray acted illegally to foreclose Northland juices from retail shelves [Northland Cranberries, Inc., and Cleremont, Inc. v. Ocean Spray Cranberries, Inc., 1:03-CV-10734 (JLT)). That suit was dropped as part of the conditions of a partial sale of Northland assets to Ocean Spray in 2004. That sale was preceded by a Northland offer to purchase Ocean Spray in 2002. Northland sold its remaining handling and marketing assets, including its brand name, in 2005. The company currently exists as a contract supplier of cranberries to Ocean Spray and other processors and a supplier of cranberry concentrate to Apple and Eve, which purchased the Northland brand and other brands owned and licensed by Northland.
Ocean Spray’s evolving response to Northland’s competition was a combination of overconfidence, misreading, and overreaction. Initially, Ocean Spray was confident that Northland would fail, apparently based on Ocean Spray’s previous successes in dealing with competitors and its long-standing near monopoly in cranberry products. Ocean Spray was increasingly concerned about private label juice competition and the threat of entry into cranberry juice categories by large national beverage companies. But it did not believe that a small branded competitor in the at-home category was a credible threat. This belief was grounded partly in some board members’ erroneous perception of the Northland CEO’s business acumen and partly in Ocean Spray’s misreading of the potential market for 100% juice products.18 The cooperative’s ineffectual replication of Northland’s successful new product was followed by expensive efforts to suppress it in the marketplace. Peaceful coexistence and joint efforts to collectively expand category sales was apparently not considered an option. Instead, brutal price competition ultimately drove Northland out of business but proved very costly for Ocean Spray in terms of substandard financial performance and related member unrest. Ocean Spray won the battle, but suffered serious setbacks in the war.
*****
Several critical issues for Ocean Spray surfaced during the Llewelyn era and he retired before many of them had run their full course. Ocean Spray’s experience with the Pepsi alliance showed the vital importance of a strong distribution and marketing system to promote growth. It also showed that it is difficult for a cooperative to generate enough capital to independently build that system. Northland’s entry and growth illustrated the vulnerability of Ocean Spray to aggressive competitors and the need to anticipate and respond to emerging growth markets. 18 It is noteworthy that Ocean Spray had aggressively fought labeling requirements that would have divulged the specific juice content of fruit juice drinks. See “Ocean Spray’s Little Secret,” Boston Globe, October 9, 1988, and “Fruit juice by the numbers; Ocean Spray loses long fight to block labeling of beverage content,” Boston Globe, July 3, 1991.

36
Ocean Spray during the Llewelyn era was slow to exploit other market opportunities, some of which it had created. Ocean Spray funded a Harvard Medical School study that in 1994 demonstrated the efficacy of cranberry juice in preventing UTI. It did not use the study in advertising the health benefits of its juice products; others did. Ocean Spray commercialized sweetened dried cranberries (Craisins®) in the late 1980s, but did not move to national distribution as a snack food for 10 years. This gave private label competitors a long period to create similar products and seize market opportunities.
While sales grew steadily during Llewelyn’s nine-year tenure, they did not match corporate projections, which called for $750 million in international sales and $3 billion in total sales by the early 2000s. These optimistic sales projections were used to schedule cranberry plantings to meet anticipated fruit needs. When these needs did not materialize, inventories began to build.
When grower prices skyrocketed in the late 1990s in response to market disruptions, especially some independent handlers’ fruit shortages, Ocean Spray could have used its growing inventories to meet these shortages. Such an action would have sent a disciplining signal to the market. For whatever reason, it declined to assume that industry responsibility and contributed to the dramatic decline in grower prices.
Bullock, Hawthorne, and a Crisis of Confidence
John Llewelyn retired from Ocean Spray on December 31, 1996. His successor was Tom Bullock, who had been selected 18 months earlier. Bullock, like Llewelyn, was an Ocean Spray insider, previously holding the position of senior vice president for operations and planning. As the new Ocean Spray CEO, he expressed a commitment to cutting costs and keeping grower returns above prices being paid by competitors. During his tenure, total Ocean Spray employment was cut from about 2,600 to 1,900. But sales flattened and, despite the reduced work force, administrative costs continued to rise rapidly. Since its payout to members was based on its net proceeds, Ocean Spray could not match pay prices of competitors (Figures 14 and 15).

37
Figure 14. Ocean Spray Sales and Net Proceeds: 1997-2004
0
200
400
600
800
1,000
1,200
1,400
1,600
1997 1998 1999 2000 2001 2002 2003 2004
$Mill
ion
SalesNet Proceeds
Sales from 1999 on are not comparable topre-1999 sales due to accounting changesthat adjusted gross sales for certainselling expenses previously inlcluded ascosts. Source: Ocean Spray annual reports.
Figure 15. Ocean Spray Net Proceeds and Administrative Costs: 1997-2004
0
50
100
150
200
250
300
350
400
450
500
1997 1998 1999 2000 2001 2002 2003 2004
$Mill
ion
Net ProceedsAdm Costs
Adm. Costs from 1999-2004 do notinclude certain selling epenses thatare deducted from gross sales.Source: Ocean Spray annual reports

38
Pools closed late and the estimated pool payout was often adjusted downward.19 The 1998 pool distribution was estimated at $56-$61 per barrel in December 1998, $42-$48 in February 1999, and $18-$22 in March 2000. Later in March 2000, Ocean Spray notified members that the actual 1998 pool earnings were $20.73, but that $28.98 had been paid out. Hence, the overpayment of $8.25 would need to be recovered from the next four crop year pools. Since the 1999 pool value was estimated at less than $20 per barrel, Ocean Spray members were understandably upset.
The situation came to a head in 1999 with a massive crop, a bleak sales outlook, rapidly rising inventories, low projected pool prices and increasing member attrition. Bullock resigned under fire mid-year, but agreed to remain in an interim capacity until a new CEO was appointed [Boston Globe, June 18, 1999]. The board began to openly discuss options to sell or merge part of the company as a way of generating revenue for beleaguered members. Whether or not to sell the Ocean Spray brand became a divisive issue for Ocean Spray for the next several years.
In late 1999, consultants were retained to advise on whether and how to proceed on a sale. Prominent Harvard Agribusiness professor, Ray Goldberg, assessed issues related to the ability of cooperatives in general and Ocean Spray in particular to compete in markets dominated by large international publicly-held companies. Bain and Company prepared a discussion document on the merits of a sale versus remaining independent that was to be the focal point in discussions with growers [New York Times, September 10, 1999]. Merrill-Lynch appraised the value of the cooperative and identified potential buyers [Wall Street Journal, September 22, 1999].
Goldberg reportedly urged the board to “run, don’t walk” to talk with potential buyers [Amanor-Boadu, Boland and Barton]. The Bain report was used internally and at a meeting with Massachusetts growers. Subsequently, Ocean Spray diligently preserved its confidentiality, thus engendering rumors about its contents.
Those familiar with the Bain report indicate that it (1) laid out the necessary conditions for Ocean Spray to return to profitability, many of which would have been difficult to achieve; (2) assessed the implications of major changes in the competitive environment for juice drinks and estimated the probabilities of their occurrence; (3) provided recommendations on essential company restructuring if there was no sale; (4) concluded that a buyer could achieve higher returns than Ocean Spray; (5) indicated that a sale would definitely be recommended if Ocean Spray were a publicly-held company but that its organization as a cooperative put the decision in the hands of members; and (6) identified criteria that individual members needed
19 Cooperative pooling in general, and Ocean Spray pooling in particular, involves aggregating total sales from current year fruit receipts, netting out costs, and distributing the net proceeds to growers in proportion to deliveries to the cooperative (with appropriate adjustments for quality). If crop year fruit receipts are very large or sales fall off, fruit in excess of sales is inventoried as frozen cranberries or concentrate and sold in subsequent crop years. Consequently, the total pool value may not be known for some time. Advance payments are made based on the estimated final pool value.

39
to weigh in order to make a decision about selling, explicitly recognizing that such weighting would not be homogeneous across members.
The Ocean Spray board of directors was split on pursuing a sale, and eventually decided not to include the issue on the agenda of the annual meeting to be held in February 2000. But the board did adopt Bain’s recommendations regarding board restructuring. On the annual meeting agenda was a proposal to reduce the size of the board from 25 to 15 seats, with the 15 seats to include the CEO and three outside members. To facilitate the transition, the current board resigned—with one exception. Chester DeMarco, a large New Jersey grower-member refused to resign, and was subsequently dismissed under a bylaw adopted at the February 2000 meeting that allowed removal of directors without cause.
The 2000 annual meeting was a confusing affair. There were two opposing slates of candidates for the 11 grower-member director seats. One slate was selected in the traditional manner that involved popular voting for candidates representing Massachusetts members. The alternate slate was selected by the previous board, and replaced two of the popularly-nominated candidates with two who opposed selling the company. The alternate slate was approved by a majority of shares, resulting in a new board of directors committed to keeping Ocean Spray independent [Wall Street Journal, January 17, 2001].
One month before the 2000 annual meeting, Rob Hawthorne was named Ocean Spray’s new CEO. Hawthorne was previously the CEO of Select Comfort Corporation, an air bed and mattress company. He also had executive experience with Pillsbury and General Mills of Canada. Hawthorne was the first external CEO of Ocean Spray and the first without previous experience in managing a cooperative. His selection was consistent with a Bain and Company recommendation to refocus Ocean Spray on marketing and sales.
Hawthorne developed a “turnaround plan” that accelerated Ocean Spray’s aggressive competition to regain lost market share. But heavy price cutting hurt both sales revenue and net proceeds, increasing pressure from many members’ to sell or merge the company. In late 2000, three large Ocean Spray members (including DeMarco, who was ousted as a director at the 2000 annual meeting) filed suit against the board of directors charging that it failed to perform its fiduciary responsibilities by refusing to consider a sale. A resolution to pursue a sale was on the agenda for the 2001 annual meeting. The resolution was defeated by a 2 to 1 margin, offering the board another clear mandate to remain independent (The Middleboro Gazette, January 25, 2001].
But member unrest continued, particularly over the self-selection process that the board used to nominate new board candidates. Dissident cooperative members argued that the current board uniformly opposed a sale and was in a position to perpetuate that opposition by refusing to consider candidates who favored a sale. A resolution to reinstate popular selection of candidates for the board was introduced at the 2002 annual meeting. Since the board opposed the resolution, unreturned proxy ballots were counted against it and the resolution was defeated. Hawthorne resigned in late 2002. Outside board member Barbara Thomas was named interim CEO [Boston Globe, November 7, 2002].
40
In early 2003, the Grower Information Coalition (GIC) was formed by Ocean Spray members dissatisfied with the current board makeup. The GIC was able to get a resolution on the agenda for the 2003 annual meeting that would reduce the size of the board from 15 to 12 directors and replace all but three existing directors with Coalition nominees. The GIC promoted its commitment to exploring sale and merger options and promised a stockholder vote on a specific company restructuring arrangement within one year if its resolution passed. The GIC also indicated a commitment to reinstating grower nomination of directors if desired by members in certain regions.
The current board strongly opposed the resolution. A proxy fight ensued with each side vigorously soliciting the voting of member shares for and against the resolution. The resolution narrowly passed, and the new board began a systematic process of soliciting and evaluating various sales options.
Barbara Thomas was one of the Ocean Spray directors ousted in the GIC board takeover. She resigned as interim CEO shortly after the 2003 annual meeting, replaced by Randy Papadellis, the cooperative’s president and chief operating officer selected by Rob Hawthorne. Papadellis was named permanent CEO in June 2003.
Prior to the 2004 annual meeting, a group consisting of larger grower-members opposed to a sale of the Ocean Spray brand formed the Committee for a Strong Ocean Spray (CSOS). CSOS claimed sufficient stock to place a resolution on the 2004 agenda to reduce the size of the board to 11 members and replace all of the members seated in 2003. A compromise was reached that involved increasing the board’s size back to 15 seats, adding five CSOS members to the 9 current grower members, retaining one current outside member and eliminating 2. The compromise slate was approved. But CSOS later complained that its supporters should have been granted more seats on the restructured board.
A member vote on a joint venture with Pepsi was conducted in mid-2004. The arrangement would have had Pepsi assume ownership and control of Ocean Spray’s juice business, including the Ocean Spray brand. Ocean Spray would be the exclusive supplier of cranberries to Pepsi and continue to manufacture and market non-juice cranberry products under the Ocean Spray label. The proposal was voted down 52 to 48 percent. The expanded board then shifted direction away from a sale toward revitalizing the brand and increasing member revenue.
During this same difficult period of excess supply, depressed prices and management and board turmoil Ocean Spray faced several critical votes regarding the use of the Cranberry Marketing order. Ocean Spray’s positions coincided with their corporate strategy of the times.
41
Ocean Spray and the Cranberry Marketing Order
Agriculture is entitled to use industry tools that other industries cannot legally utilize to affect industry supply and demand conditions. Among the most powerful tools are Federal and State marketing orders. Marketing orders permit various means of regulating the quality and quantity of products marketed. Quality controls typically specify minimum sizes or grades for domestic marketings.20 Quantity controls include producer allotments (grower delivery quotas), reserve pools, handler withholding (set-asides), and shipping prorates (flow to market controls) [USDA-AMS].
Implementation and Early Use of the Cranberry Marketing Order
The Cranberry Marketing Order, one of more than 30 Federal marketing orders for fruits, vegetables and specialty crops, was created in response to the “cancer scare” of 1959. Ocean Spray led an industry effort to seek a marketing order as a way to limit cranberry production to accommodate the short-term reduction in demand. The final order was implemented on August 15, 1962.
The order is administered via the Cranberry Marketing Committee (CMC), a grower committee that makes recommendations to the Secretary of Agriculture. The initial CMC consisted of seven growers or representatives of growers and seven alternate members. The composition of the Committee changed with the addition of an eighth “public” member and alternate in the late 1960s. Four of the eight seats were assigned to Ocean Spray Cooperative, which held a market share believed to be about 85-90 percent in 1962.
Ocean Spray management assigns members and alternates to its seats on the CMC; members do not elect their CMC representatives. Independent grower member and alternate seats are filled though nominating caucuses and subsequent elections among independent growers in the designated producing areas.
The original cranberry marketing order used handler withholding, or “set-aside” as the sole method of controlling supply. Under handler withholding, the CMC could set (with the approval of the Secretary of Agriculture) “free” and “restricted” percentages of total handler fruit receipts during a crop year. The free percentage could be marketed in any outlet. The restricted percentage could only be sold in specified noncompetitive outlets (primarily export), used for research purposes, donated to charitable organizations, or destroyed.
Following its implementation, the cranberry order’s authorization for volume control was used sparingly. A set-aside of 12 percent of handler receipts was recommended and approved by the Secretary of Agriculture for the 1962 crop year (September 1–August 31) immediately after the order was initiated. A five-percent set-aside was approved for the 1963 crop year, 20 Under Section 8(e) of the Agricultural Marketing Agreement Act of 1937, as amended, size and grade restrictions imposed under specified fruit, vegetable, and special crops orders also apply to imports of the same commodity.

42
but later rescinded upon recommendation of the CMC because of a short crop. Set-asides of 10 and 12 percent, respectively, were approved for the 1970 and 1971 crop years. After 1971, the Cranberry Marketing Order became semi-dormant. The CMC continued to meet, but made no recommendations to the Secretary of Agriculture pertaining to volume control.
Despite its dormancy, the order was kept reasonably up-to-date through periodic amendments. In the 1980s, authorization for use of producer allotments as well as handler withholding to control supply was sought and approved by USDA. If invoked, allotments were to be tied to a grower’s “base quantity,” which represented cranberry sales during a specified historical period. Later, the CMC became concerned about capitalization of base quantities (even though the allotment provision had never been invoked) and amended the order to adopt “sales history” as the base for applying allotment percentages.
In contrast to the fixed base quantity, sales history represented actual sales, updated annually to reflect new acreage, new growers, and changes in yields. With regulation by producer allotments, an industry “marketable quantity,” reflecting desired crop year sales, is specified by the committee. The ratio of marketable quantity to total sales history becomes the allotment percentage.
The 2000 Regulation
Following the record cranberry crops of 1998 and 1999 and a precipitous fall in grower prices, the CMC began to seriously consider invoking volume regulation for the 2000 crop. In late 1999, the CMC chair appointed a subcommittee to recommend the appropriate form of volume control (withholding or allotments). The subcommittee supported producer allotments on grounds that not growing part of a crop made more sense than growing and throwing that part away. In particular, the subcommittee concluded that the large volume of fruit that would likely be destroyed under handler withholding would create both environmental and public relations problems.
In March 2000, the CMC met for a contentious two days to deliberate a volume control recommendation. Ocean Spray’s grower members on the committee wanted to limit crop-year 2000 grower deliveries to 65-75 percent of sales histories. Independent members were split. Some favored no regulation.21 Northland Cranberries, Inc., in a unique position of being simultaneously the largest U.S. cranberry grower and the second largest cranberry handler, wanted to use allotments only as a means to prevent a re-occurrence of the huge 1999 crop. Because a recommendation to use volume control under the order at that time required six concurring votes (5 if the public member did not vote), neither the independent nor OSC
21 Part of the reticence to using volume control was the inability to regulate producers in Canada. Some committee members feared that reduced production in the U.S. would be offset by increased Canadian production. British Columbia, the largest cranberry-producing province with a large majority of production by Ocean Spray members, ultimately agreed to use its marketing board to impose the same supply restrictions as were adopted under the marketing order.
43
members could muster a sufficient majority for their respective position, and the meeting ended without a recommendation.
Following a request by some members to reconsider, the CMC met again in late March and quickly approved a recommendation (with one dissenting independent vote) for an allotment representing 85 percent of sales history. USDA approved the recommendation, but not until mid-July, following another June meeting of the CMC to deliberate several controversial issues in the proposed rules.
Probably the most controversial issue was USDA’s insistence that “new” acreage (acreage harvested for four years or less) receive additional sales history because the productive capacity of recent plantings had not been manifested in actual sales. Some committee members argued that new acreage planted in response to supra-normal profits should not be given deferential treatment—that those speculative plantings were the very cause of the oversupply problem.
The final rule allowed growers with newer acreage to use their best year’s sales on that acreage since it was first harvested as their sales history rather than average sales. This required the formation of an appeals subcommittee to review information submitted by growers to verify when new acreage was planted and to segregate reported deliveries from new acreage from total deliveries.
The late approval of the allotment regulation prevented many growers from taking the cultural measures necessary to limit yields or temporarily abandon acreage. And USDA’s ruling granting additional sales history for acreage harvested four years or less added substantially to the allotment base. The result was unused allotment for every handler and allotments that were non-binding for many if not most growers. Nonetheless, production in 2000 fell 11 percent from the record high 1999 crop.
The 2001 Regulation
Continued sluggish sales combined with a 2000 crop larger than the intended marketable quantity (before new acreage allotments) kept inventories high and grower prices low. The industry prepared for an even more restrictive allotment for the 2001 crop.
In late 2000 and early 2001, industry outlook meetings sponsored by the CMC and state cranberry trade associations were held and formal and informal grower surveys were conducted. The battle lines became clear. Grower surveys indicated strong support for a highly restrictive allotment program that would eliminate excess inventories in a single year. Ocean Spray management favored a lighter allotment on grounds that it needed substantially more fruit than it held in inventory to supply planned new product markets. Independent handlers generally opposed any regulation. The exception was Northland, which put on its grower hat in supporting a highly restrictive allotment.

44
The Ocean Spray and Northland positions had reversed from 2000, but the manner in which these positions could be resolved had also changed in that Northland no longer had a representative on the CMC.
The CMC met in early February to deliberate the possible use of volume control for the 2001 crop year. As expected, no agreement was reached. Ocean Spray first proposed a producer allotment regulation with a marketable quantity of 5.0 million barrels, representing about 75 percent of sales history. The motion was defeated after lengthy debate. The vote was along party lines. Only the four Ocean Spray representatives voted for the motion.
An independent grower member then proposed a withholding regulation at 50 percent—handlers could only market half of their cranberry receipts in unrestricted outlets. That motion was defeated 2-6. At that point, the CMC chair called it a night. Before the CMC retired to the lounge, the chair announced that another meeting would be held within 30 days.
The chair also named a grower subcommittee to deal with a possible handler equity issue. Ocean Spray and Northland held the bulk of the industry’s inventory. At least part of the other handlers’ opposition to an allotment regulation was related to that disparity. A restrictive allotment program could leave those handlers who did not have inventories at risk of losing market share. Their argument was that, to meet sales commitments that exceeded their contracted growers’ allotment, they would be compelled to purchase cranberries from their competitors, Ocean Spray and Northland. These competitors would either refuse to sell or charge exorbitant prices in order to capture the markets that could not be satisfied.
The grower subcommittee met in mid-February to consider several possible options to address the inventory disparity issue. These included using handler withholding, which allows handlers to “buy back” their restricted fruit,22 establishing an inventory pool within the order, and encouraging handlers to create an inventory pool outside the order. After consultation with handlers and USDA staff, the subcommittee recommended that handlers devise a means of equitably sharing fruit between surplus and deficit handlers outside the marketing order. The subcommittee further recommended that the CMC approve a recommendation to the Secretary of Agriculture for a producer allotment regulation with a marketable quantity of 4 million barrels and no exemption for fresh fruit.
The CMC reconvened in early March. The grower subcommittee’s recommendation was offered as a motion and defeated. Ocean Spray then proposed a producer allotment regulation with a marketable quantity of 4.7 million barrels with fresh fruit exempt. This represented a 35 percent reduction from estimated sales history. The motion passed when an independent
22 Under the buy-back provision, a handler who wishes to convert restricted cranberries to free supply cranberries makes a specified deposit per barrel to the CMC. The CMC then attempts to purchase an equivalent volume from the free supply of other handlers. If successful, the selling handler(s) receives the deposit and agrees to dispose of the purchase volume in noncompetitive outlets. If the CMC cannot acquire free supply fruit to offset the buy-back, the deposit is returned to all handlers in proportion to their share of the total restricted supply.
45
producer-handler with significant fresh fruit interests and the public member voted with the four Ocean Spray members.
In an unusual proposed rule, USDA invited public comment not only on the regulation agreed to by the CMC, but also on two other options: no regulation and a producer allotment with a marketable quantity of 4 million barrels. Offering three choices precipitated a flurry of comments, Ocean Spray member form letters, and visits to USDA offices. In June, USDA issued its final rule adopting the CMC recommendation modified slightly to recognize smaller USDA Section 32 cranberry purchases than had been anticipated when the CMC developed its marketing policy statement. The final rule also adopted a “ramp-up” procedure for assigning sales history to acreage that had not yet reached maturity. The ramp-up added about 1 million barrels of sales history to sales actually experienced, reducing the effective supply reduction to about 15 percent of the CMC’s estimate of the “normal” 2001 crop.23
Growing conditions during 2001 were sub-par and many growers had limited operating capital to fund normal cultural practices because of large back-to-back losses. Combined with the restrictive allotment, these conditions resulted in a 2001 crop (utilized production) of 4.8 million barrels. This was larger than the marketable quantity because of the fresh fruit exemption and the ramp-up addition to sales history, but under 2000 utilized production by about 650,000 barrels. Most handlers had unused allotment, and about 80,000 barrels of allotment were transferred to a handler with excess cranberries.24
The 2002 Non-Regulation
Sales in 2001 were up, due mainly to an estimated 500,000 barrels of cranberry products purchased by USDA. The short crop and expanded sales cut into inventories, lessening the pressure to use volume restrictions in 2002. But despite a better supply and demand balance, grower prices remained very low by historical standards. Plus a mild winter and maturing new acreage, mainly in Wisconsin, caused many growers to worry about a potentially massive crop and a reversion to burdensome, price-depressing inventory levels.
At the February 2002 CMC meeting, the committee projected a 2002 domestic crop (without regulation) of 5.7 million barrels, imports of 0.9 million barrels, and August 31, 2002, inventory of 2.3 million barrels. Combined with anticipated shrink and projected sales of 6.7 million barrels, ending inventory was projected at 2.2 million barrels. This was smaller than actual ending inventories since 1997. 23 The final rule applied a marketable quantity of 4.7 million barrels to an estimated sales history (including ramp-up) of 7.1 million barrels of processing fruit, yielding an allotment percentage of 65 percent. Applied to the CMC 2001crop estimate without regulation of 5.5 million barrels yields an effective allotment percentage of 85 percent. 24 The order allows handlers to offset grower deliveries exceeding allotment with unused allotment from growers who deliver less fruit than their allotment permits. If a handler ends the season with total deliveries less than the combined allotment of all growers delivering to that handler, then the excess is transferred to the CMC for redistribution to handlers who may have receipts in excess of their combined allotment.
46
Based on these optimistic projections, an Ocean Spray member of the CMC moved to invoke no volume regulation for 2002. The motion yielded a 4-4 vote, with all Ocean Spray members voting in favor and all other members opposed. Citing the need to prevent a possible bumper 2002 crop from keeping prices depressed, the independent Wisconsin member then moved adoption of a 70 percent handler withholding regulation with a buy-back price floor of $30 per barrel. That motion was defeated 3-5, with the independent Massachusetts member joining Ocean Spray members in opposition. A subsequent motion for a 70 percent handler withholding regulation but no buy-back price floor was defeated by the same vote. Finally, a motion to commission and fund a panel of independent economists to advise the committee on a volume regulation was also defeated 3-5. The meeting was adjourned with no specific recommendation to the Secretary, which is tantamount to recommending no volume regulation.
Since 2002, utilizing volume control under the marketing order has never been seriously considered by the CMC. Supply and sales projections made at the spring and summer meetings have yielded projected inventory levels that were apparently not especially burdensome by historical standards.
In 2004, growers approved order amendments that, among other things, restructured the CMC to broaden grower participation, better reflect the regional distribution of cranberry production, and clarify rules pertaining to the assignment of Ocean Spray seats on the committee. The current committee makeup consists of 14 member and 10 alternate member seats assigned according to producing region and cooperative (Ocean Spray) versus non-cooperative affiliation. There are four designated producing areas: Massachusetts, New Jersey, Wisconsin, and Washington/Oregon.25 Wisconsin and Massachusetts are each assigned four member seats—two to Ocean Spray grower members and two to growers affiliated with independent handlers—and two alternate member seats—one each to Ocean Spray and independents. New Jersey and Oregon/Washington each have two member and two alternate member seats, assigned equally to Ocean Spray and independent growers. There is one public member and one alternate public member seat. The remaining member and alternate member seats are assigned “at large” (i.e., without regard to region) to either Ocean Spray or independents, depending on which grower group accounted for the simple majority of the total marketable cranberry crop in the year preceding member nominations (every two years). Under this configuration, Ocean Spray grower-members currently control 7 of 14 votes. Passage of any motion before the committee requires 11 concurring votes; 10 if the public member does not vote.
25 The Massachusetts region also includes Rhode Island and Connecticut; Wisconsin includes Michigan and Minnesota; and New Jersey includes Long Island in the State of New York.

47
The Cranberry Marketing Order: Industry or Firm Marketing Tool?
• Ocean Spray was a key player in the creation of the cranberry marketing order. This is consistent with how many other orders were created in fruit and specialty crop markets characterized by the presence of a dominant marketing cooperative. Also like other such orders, the cranberry order provides special treatment to the cooperative with respect to voting arrangements and seats on the administrative committee. Ocean Spray has guaranteed veto power on the CMC, but at the same time, it cannot pass any motion without the support of at least one member representing independents. Ocean Spray’s members are named by the management of the cooperative; they are not nominated or elected by grower-members. In all recent marketing order votes and in nearly every other vote, Ocean Spray CMC members voted en bloc regardless of the differing opinions held by grower/members.
• Ocean Spray’s corporate selection of CMC members rather than election by members means that appointed representatives are not directly accountable to grower-members. Consequently, many members feel left out in decisions that affect their farm businesses, leaving their cooperative behaving more like an investor-owned firm in that the interests of the handler/processor is placed above the growers’ interests.
• Ocean Spray’s corporate position with respect to utilizing the marketing order for volume control changed between 2000 and 2001. During the 2000 volume regulation debate, Ocean Spray appeared to view using the order as a means of getting industry-wide assistance in reducing the cooperative’s excessive inventories and promoted aggressive supply reductions. With the appointment of Rob Hawthorne as CEO in 2001and the rollout of his turnaround plan, Ocean Spray supported only a modest supply reduction. The cooperative professed the need to maintain large inventories in order to develop and service new and expanding product markets without risking stock-outs. That makes good business sense. But there is an alternative interpretation: Large inventories gave Ocean Spray greater opportunity to regain lost market share by undercutting competitors’ prices and having the fruit available to support the added sales. Sales did not grow in 2001 except for sales to the USDA, lending credence to the alternative interpretation.

48
Redirection and the Road to Recovery
When Ocean Spray purchased Northland’s cranberry processing and receiving facilities along with purchase options on 14 of Northland’s 17 corporate-owned marshes in September 2004 it marked the end of a decade-old struggle as to how best to deal with Northland. Under the agreement, Northland withdrew its antitrust suit against Ocean Spray. In February 2005, Northland sold its brand and its remaining tangible assets (except cranberry marshes) to Apple and Eve, thus ending its run at becoming a major fruit juice processor.
A month after the Northland purchase, Ocean Spray sold Milne Fruit Products, a Washington State processor of fruit preparations. The sale yielded proceeds approximately equal to the Northland purchase. Ocean Spray ultimately exercised the options on 9 of the marsh properties, which it then sold to four of its grower-members in early 2005. The Northland purchase agreement included a toll processing arrangement wherein OSC will receive and custom process into concentrate cranberries grown by Northland and growers contracted with Northland.
Ocean Spray’s purchase of Northland accomplished several very important objectives for the cooperative:
• It removed the potential major financial liability and ongoing legal costs of the Northland lawsuit.
• It gave Ocean Spray its first cranberry processing facility in Wisconsin, the leading state in cranberry production.26
• It expanded Ocean Spray members’ cranberry acreage in Wisconsin.
• It allowed the cooperative’s attention to swing away from crushing a competitor toward more productive endeavors.
The decision to remain independent made at its 2004 annual meeting followed by the purchase of Northland seemed to mark the end of a tumultuous era of member unrest and financial difficulties for Ocean Spray and the beginning of what appears to be an era of regrouping, realism, redirection, and guarded optimism. In Ocean Spray’s 2004 annual report, President and CEO, Randy Papadellis, and Board Chair, Robert Rosbe, began their letter to members as follows:
“A year ago, when we issued our Fiscal 2003 report, we were in the midst of deliberation as to whether Ocean Spray should preserve its independent ownership of the branded business or put its future in the hands of a strategic partner; a buyer, a financial investor or someone else who would take the Ocean Spray brand to the next level. After months of spirited debate and thoughtful analysis, you the grower-owners elected to leave the stewardship of
26 Ocean Spray has operated a bottling plant in Kenosha for many years.

49
the brand to your current Management team. But it was by no means an act of blind faith. It was a narrow vote, and you made it very clear to us that business as usual was unacceptable, that going it alone was not an option, that change—substantive change in how we go to market—was imperative.” [p. 1]
The cooperative developed a long-range plan that focuses on revitalizing Ocean Spray’s core businesses and capitalizing on its brand name. The 2004 annual report lists five strategic objectives within the plan. In general, these goals seem reasonable and realistic. More important, they unambiguously indicate a change in direction from past strategies that proved costly and unproductive—both to the industry and to its growers who make up over half of the industry’s growers. Ocean Spray’s progress and plans regarding implementing these goals follow.
(1) Generate total returns consistently above $40 per barrel.
Ocean Spray’s 2002 cranberry pool yielded $35.05 per barrel to growers. The 2003, 2004, and 2005 pools are projected to return $35.00, $41.00, and $44.50 per barrel, respectively.
The $40 per barrel commitment is an obvious and logical response to grower-member demands during recent years. Many Ocean Spray members view the $40 per barrel bar as minimally acceptable based on precedent and their related expectations about the profitability of cranberry production. However, there is a difficult question of what is the “right” price. A $40 per barrel price may be necessary for some Ocean Spray members to remain in business. But a $40 per barrel price will provide an incentive for other members to expand acreage. If the cooperative intends to maintain grower returns above $40, then it must consider methods to limit membership or otherwise control members’ supply.
(2) Drive growth of the branded business through continued innovation and expanded distribution in single-serve and other channels.
Ocean Spray has begun to more aggressively exploit its market position and brand identity in sweetened-dried cranberries (Craisins®), marketing an expanded mix of consumer-packaged flavored varieties and trail mixes and linking up with other food manufacturers to augment ingredient usage. It has test-marketed cranberry sauce in squeezable packets as a means of boosting flat sales of the product that started the company. Squeezable cranberry sauce would appear to have considerable potential, especially as a single-use package (along with the ubiquitous foil packets of ketchup, mustard, soy sauce and salad dressings) in fast food outlets featuring fried chicken and turkey sandwiches.
Ocean Spray’s 2004 annual report states,
50
“While the shareholder referendum in June 2004 preserved Ocean Spray’s independence as a grower-owned cooperative and brand, we harbor no illusions that we can go it or grow it alone.” [p. 14]
Specifically with regard to single-serve distribution, the report notes that,
“In the area of distribution, a clear point of concern since we left PepsiCo’s single-serve distribution system in 2002, we initiated talks in 2004 with several potential partners interested in adding Ocean Spray to their distribution portfolio. This time, the partnership possibilities go far beyond single-serve, and could include fast-food fountains and other high-volume channels.” [p.15]
Who Ocean Spray decides to collaborate with in distributing its juice drinks in the massive single-serve market and the nature of that collaboration remain to be seen. But these statements appropriately stress that partnering will occur. And lessons learned from past experience ought to strengthen any partnership.
(3) Increase fruit utilization, with a primary focus on international expansion as the driver of that usage.
International sales increased 10-fold between 1995 and 2004 and showed back-to-back gains of more than 10 percent in 2003 and 2004. While much of the recent growth is due to weakening of the U.S. dollar, investments made in international marketing are beginning to pay off.27
The question remains whether Ocean Spray can continue to profitably cultivate overseas juice drink markets independently. Ocean Spray has distribution arrangements with Gerber Foods Soft Drinks in the UK and Sopporo Beverage Company in Japan and is apparently seeking other international partners to increase distribution. But this seems to be a piecemeal approach. Global soft drink distributors like Pepsi and Coke spend vast sums in developing and maintaining extensive distribution networks. Riding the coattails of a major global distributor would appear to be a more efficient approach than cultivating partners country-by-country.
(4) Achieve grower alignment around our strategic objectives.
This is a critical goal that explicitly recognizes the vital importance of bringing members together around a common purpose and implicitly acknowledges member unrest of the past. We note that while there may be quibbling about specifics, it would seem difficult for members to challenge the basic thrust of the strategic objectives regardless of their size or location.
27 These investments include not only Ocean Spray’s direct foreign development expenditures, but also leveraged funds from USDA-FAS’s foreign market development program (MAP) and generic market development funding through the Cranberry Marketing Committee.
51
(5) Provide leadership for the cranberry industry as a whole.
In our judgment, this is the most important of the five strategic objectives and perhaps the clearest departure from previous long-range plans that were more internally focused. It is also the hardest objective to measure achievement. But for a venerable agricultural marketing cooperative, it is certainly a worthy objective justifying a prominent place in the strategic thinking of current management.
In their 2004 member letter, Papadellis and Rosbe note:
“Clearly, in the recent past Ocean Spray has faced challenges as a Cooperative: large crops, a series of marketing miscues, and in some respects, a lack of unified vision.” [p. 3]
This is a refreshingly honest assessment; one that engenders considerable confidence that Ocean Spray has emerged from the past decade of turmoil with a better understanding of what it means to be a market leader, of what it needs to do to be an effective competitor, and of what it means to be a cooperative.

52
Summary and Case Questions
In this section, we briefly summarize Ocean Spray management issues and difficulties over the past two decades. These are grouped into three categories. Our discussion is followed by a set of questions regarding management options that might have avoided pitfalls in the past and that might strengthen the cooperative in the future.
Ocean Spray did not demonstrate industry leadership. Ocean Spray held a virtual monopoly in cranberry products for many years. This changed with the growth in blended cranberry juice products, which represented a much larger market than cranberry sauce and cocktail and a market for which consumers’ brand loyalty was less pronounced. While Ocean Spray’s share of the rapidly expanding cranberry juice market declined, its absolute growth in juice sales vastly exceeded that of its competitors.
As the industry category leader, Ocean Spray had the opportunity and perhaps the responsibility to accommodate and manage industry growth as part of managing its own growth. This meant:
• Ensuring that new cranberry growers would join the cooperative and that existing members would remain as members. Provide a stable market with consistently profitable (but not excessively profitable) returns in order to demonstrate the advantages of Ocean Spray membership.
• Ensuring that competitors did not develop their own cranberry supply line. Provide competitors with cranberries or cranberry concentrate at reasonable prices even though they would be used to produce products in competition with Ocean Spray.
• Using the cranberry marketing order to help manage industry supply when there was a temporary surplus. Assure broad-based industry participation and consensus in marketing order decisions.
• Assuming responsibility for promoting market stability. Discourage price run-ups by supplying fruit as necessary to competitors, even if it means scaling back sales goals.
Ocean Spray’s behavior was often not consistent with these principles. Its response to competition was to fight it rather than accommodate it. The cooperative seemed to be much more concerned about maintaining its share of a rapidly expanding market than about maintaining its own rapid rate of growth. Five-year plans were wildly optimistic, showing sales goals as much as twice what actually materialized. Ocean Spray apparently believed that it could regain eroding market share by expanding the total market and picking up all of the growth for itself. Members were offered planting grants based on unrealistic sales goals. The resulting excess production contributed materially to the late 1990s market collapse.
After making little or no effort to retain Northland as a member, Ocean Spray seemed preoccupied with eliminating Northland as a competitor. The Northland battle proved very

53
expensive for Ocean Spray, not only in terms of the costs of price competition but also in terms of lost opportunities.
The selection of Rob Hawthorne as CEO in 2000 was part of a strategy to reposition the cooperative closer to a stockholder model of operation. Hawthorne had no background or understanding of cooperatives. He was hired to turn around the company. His turnaround plan failed because there was insufficient working capital to fully support it and because sales expectations continued to be unrealistic. Moreover, the turnaround strategy was incompatible with the cooperative objective of maximizing returns to members.
Ocean Spray’s actions on the CMC also reflected a failure to demonstrate industry-wide leadership. Ocean Spray attempted to use the cranberry order to its corporate advantage rather than as an industry tool. Corporate selection of CMC members and bloc voting does not reflect the diversity of the cooperative’s members.
Questions:
1. Ocean Spray had huge advantages over its smaller competitors in terms of a strong branded product, large-scale, efficient processing facilities, supporting distribution logistics, etc. Why was the cooperative unable to out-pay competitors?
2. Why was Ocean Spray unwilling to accommodate competitors’ needs for cranberries and cranberry concentrate?
3. What actions might Ocean Spray have taken to retain Northland as a member of the cooperative?
4. Once Northland left the cooperative, what actions might Ocean Spray have taken to accommodate new competition?
5. Why did Ocean Spray introduce its 100% juice under the Wellfleet label and why was the introduction unsuccessful?
Ocean Spray did not adequately represent the diversity of member interests on its board of directors. Wholesale restructuring of the Ocean Spray board of directors (1986, 2000, 2003, and 2004) highlighted industry discord related to region, grower size, and commitment to remain a cooperative. The earliest (attempted) restructuring in 1986 also surfaced problems associated with managing a cooperative that is characterized by a diverse membership. Diversity leads to tradeoffs and conflicts between achieving broad member representation on a cooperative’s Board of Directors and promoting speed and flexibility in executive decision-making.
These conflicts are certainly not unique to Ocean Spray. But in the 2000 restructuring, Ocean Spray abandoned attempts to compromise conflicts by adopting board nomination of director candidates. This solidified members’ divergent positions on the future of the cooperative. Growers opposed to any kind of sale gained control of the board. Many other growers were financially struggling, and wanted to know what a sale would mean to them—to be able to weigh possible benefits against the costs of a reconfigured Ocean Spray. These growers saw

54
the board’s rejection of the Bain and Company recommendations as clear evidence that management was unwilling to look at options. Worse, the new board appeared willing to tolerate the elimination of excess capacity through attrition.
Limiting the participation of grower-members in nominating board candidates ultimately led to overthrow of the board by the GIC in 2003 and the subsequent power struggle between the recent outs against the new ins that further restructured the board in 2004. Ocean Spray reached a state where board selection was accomplished by actual or threatened proxy fights rather than by broad member participation in the nomination process.
Members of a cooperative need to have a sense of control. Directors need to be accountable to members. Cooperative board needs to be representative of the full range of membership. Allowing the board to nominate successor members absent well-defined qualification standards that ensure broad representation and member accountability was, in our judgment, a serious mistake.
The divergent interests of Ocean Spray members make it increasingly difficult to achieve compromise. The economic interest of members in expanding, lower-cost regions like Wisconsin, Quebec and British Columbia favors lower prices if accompanied by larger volume. A large share of Ocean Spray members are in Massachusetts, with higher costs of production and more limited opportunities to expand. Their economic interest favors higher prices and less volume. It seems imperative that Ocean Spray, assisted by appropriate business consultants, engage in a concerted effort to identify common ground.
Questions:
1. What actions might Ocean Spray take to ensure that its board of directors:
a. is accountable to members
b. represents the diversity of the cooperative’s membership
c. works harmoniously with management
2. How can internal conflicts among the economic interests of Ocean Spray’s members be reconciled?
3. What criteria should be used to establish the size of Ocean Spray’s board of directors?
4. Should Ocean Spray establish eligibility criteria for prospective board members? If so, what qualifications for board membership would you propose?
5. What membership communication strategies might Ocean Spray use to promote unity among members?
Ocean Spray did not exploit market opportunities that were compatible with its strengths and weaknesses Ocean Spray’s greatest strength is its widely-recognized brand name. Its greatest weakness is its inability, as a cooperative and as a relatively small player in the beverage market, to

55
generate the equity capital necessary to exploit its greatest strength. Ocean Spray must continue to explore strategic options that will allow its brand to be more effectively exploited.
The Pepsi single-serve distribution agreement was extremely important to Ocean Spray’s bottom line. It also expanded recognition of the cooperative’s brand, probably increasing sales of other Ocean Spray products and the value of licensing arrangements. It was clearly in Ocean Spray’s best interests to cultivate and strengthen the alliance. The deterioration and ultimate collapse of the alliance lead us to conclude that Ocean Spray did not sufficiently recognize its value and was, therefore, uncompromising in its negotiations with Pepsi.28
The Pepsi alliance illustrates that strategic options to more effectively exploit the Ocean Spray brand do not necessarily mean the brand must be sold. But neither should sale options be excluded from consideration. It is the responsibility of the board of directors to explore a full range of options that will increase the benefits of membership in the cooperative. This analysis should consider the experience of other major agricultural cooperatives in hybrid organizational models.
Questions:
1. What kinds of strategic alliances should Ocean Spray explore and with whom?
2. Under what conditions can Ocean Spray achieve sustained sales and revenue growth if it retains its current business organization?
3. Should Ocean Spray members sell their cooperative?
4. How could the market value of the Ocean Spray brand be measured?
5. How could Ocean Spray obtain more equity capital to expand markets?
28 When Pepsi first announced plans to terminate the distribution agreement in 1997, an Ocean Spray spokesman was quoted as saying, “The effect on sales will be practically nil.” [Boston Globe, June 28, 1997]
56
References29
Amanor-Boadu, Vincent, Michael Boland and David Barton. Ocean Spray Cranberries at the Crossroads. Arthur Capper Cooperative Center Case Study Series No. 03-01. Agricultural Marketing Resource Center, Department of Agricultural Economics, Kansas State University, 2003.
Brown, Hal, Cranberry Stressline (http://www.cranberrystressline.com/index.html), last accessed August 29, 2005.
Cranberry Marketing Committee, Cranberry Inventory Web Site (http://www.uscranberries.com/eng/industry/inventory.cfm), last accessed August 29, 2005
First Pioneer Farm Credit, ACA. The North American Cranberry Cost of Production Study. Enfield, CT. 2002.
Jesse, E.V. Cranberry Price Forecasting. Staff Paper No. 459. Department of Agricultural & Applied Economics, University of Wisconsin-Madison. March 2003.
Kross, John R. Economic Analysis of (the) Cranberry Industry. Department of Agricultural Economics, University of Wisconsin. Unpublished manuscript. June 1955.
Lambert, Matthew P. Supply Response for U.S. Cranberry Producers: 1965-2001. M.S. Thesis. Department of Resource Economics, University of Massachusetts Amherst. May 2003.
Ocean Spray (and predecessors). Annual Reports, 1941-2004.
Statistics Canada. Fruit and Vegetable Production, Vol. 74, No. 1, June 2005.
Rogers, Richard T. “Advertising Strategies by Agricultural Cooperatives in Branded Food Products, 1967 and 1987.” A chapter in New Strategic Directions for Agricultural Marketing Cooperatives, edited by Ronald W. Cotterill. Westview Press: 1994. pp. 59-97.
Royer, Jeffrey S., editor. Cooperative Theory: New Approaches. United States Department of Agriculture, Agricultural Cooperative Service. ACS Service Report Number 18. Washington, DC: July 1987.
Sexton, Richard T. “The Formation of Cooperatives: A Game-Theoretic Approach with Implications for Cooperative Finance, Decision Making, and Stability.” American Journal of Agricultural Economics 68 No. 2 (May 1986):214-25.
Staatz, John M. 1983. “The Cooperative as a Coalition: A Game-Theoretic Approach.” American Journal of Agricultural Economics 65 No. 5 (December 1983):214-25.
29 Authors’ Note: This report was drafted over a period of several years, resulting in the precise source of some information becoming obscure and some newspaper articles and other materials accessed electronically becoming dead links. The Cranberry Stressline provided links to a wealth of print articles on conditions in the cranberry industry.

57
Staatz, John M. 1987a. “Farmers Incentives to Take Collective Action via Cooperatives: A Transaction-Cost Approach.” In Royer. (1987) pp. 87-107.
Staatz, John M. 1987b. “A Game-Theoretic Analysis of Decision-making in Farmer Cooperatives.” In Royer. (1987) pp. 117-47.
U.S. Department of Agriculture, Agricultural Marketing Service [referenced: USDA-AMS]. Marketing Agreements and Orders for Fruits and Vegetables. PA 1095. January 1991.
U.S. Department of Agriculture, Economic Research Service [referenced: USDA-ERS]. Food Consumption Data System (http://ers.usda.gov/data/foodconsumption), last accessed November 14, 2005.
U.S. Department of Agriculture, Foreign Agricultural Service. U.S. Trade Internet System (http://www.fas.usda.gov/ustrade/), last accessed July 1, 2005.
U.S. Department of Agriculture, National Agricultural Statistics Service (formerly Statistical Reporting Service) [referenced: USDA-NASS]. Noncitrus Fruits and Nuts. Various annual summaries.