the costs of missing the millennium development goals on gender equity
TRANSCRIPT
The Costs of Missing the Millennium Development Goal on Gender Equity Dina Abu-Ghaida and Stephan Klasen
Discussion paper 2003-01 January 2003 Department of Economics, University of Munich Volkswirtschaftliche Fakultät Ludwig-Maximilians-Universität München
An electronic version of this paper is downloadable from http://epub.ub.uni-muenchen.de

1
The Costs of Missing the Millennium Development Goal on Gender Equity
Dina Abu-Ghaida World Bank
Stephan Klasen University of Munich
November 2002
Abstract At the Millennium Summit, the world community pledged to promote gender equality and chose as a specific target the achievement of gender equity in primary and secondary education by the year 2005 in every country of the world. Based on the findings from a growing empirical literature that suggests that gender equity in education promotes economic growth and reduce fertility, child mortality, and undernutrition, we estimate what the costs in terms of growth, and forgone fertility, mortality and undernutrition reduction, will be for the 45 countries that are, on current projections, unlikely to meet the target. Our estimates suggest that, by 2005, the countries that are off track are likely to suffer 0.1-0.3 percentage points lower per capita growth rates as a result and will have 0.1-0.4 more children per woman, and, by 2015, an average of 14 per 1000 higher rates of under five mortality and 2.4 percentage points higher prevalence of underweight children under five. Sensitivity analyses suggest that the results are quite robust to using different specifications and approaches to estimating these losses. JEL: I2, J7, J16 Acknowledgements We want to thank Andrew Clark, Luis Crouch, Shantayanan Devarajan, Ruth Kagia, Elizabeth King, Stephen Knowles, Dorian Owen, Paul Schultz, Carolyn Winter, and participants at a seminar at the University of Munich for helpful comments on earlier versions of this paper. We also thank Jong-Wha Lee for providing us with enrolment figures that were used for their assessment of schooling attainments. Funding from the World Bank in support of this work is gratefully acknowledged. E-mail Address of Corresponding author: [email protected]

2
1. Introduction
Apart from its intrinsic value as a crucial development goal (Sen, 1999), education is also central to one’s ability to respond to the opportunities that development presents. Currently, there are significant gender disparities in education that remain in several regions of the developing world (World Bank, 2001). Disparities persist in enrolment rates, which capture education flows, in average years of schooling, which represent the stock of education in the population, in quality and type of education, and in subject matters studied.
The gender gap and the low level of girls’ educational participation and performance are the result of the combined effects of supply and demand factors and the ways these interact with the policy, economic, and sociocultural environments (e.g. Alderman et al., 1995). Supply-side factors include the availability of schools, the quality of services they provide, and the extent to which the services are adapted to the special needs of girls. Demand-side factors relate to how girls and their families respond to the kinds of schooling made available by the state and by religious and private groups. Important determinants include the direct costs (e.g. fees, uniforms, transport, books) and opportunity costs of education to the family.
In addition, the decision to send girls may further be influenced by the family's perception of the value of education, both for the girls themselves as well as for the parents to the extent that they expect some support from their children in old age and during adverse economic times (Hill and King, 1993). In cultures where girls marry early, settle with their husband’s family, where their access to the labour market is constrained and available jobs are unattractive, parents are more reluctant to send girls to school.1
Nonetheless, female primary and secondary enrolment rates and have generally risen over time and there has been a corresponding rise in attainments (see Table A). Gender equality in school enrolments and average years of schooling has also improved since the 1970s as girls’ schooling has generally increased faster than boys’ (World Bank, 2001). However, there is variation in the gender disparity and the speed in closing gender gaps, with East Asia and the Pacific, Latin America, and Europe and Central Asia exhibiting the highest gender equality in education. As of 1999, primary enrolment rates had flattened out at high levels in these three regions, with gross enrolment rates for females reaching or surpassing 100 percent. Furthermore, average female secondary enrolment rates equal or exceed male rates in Europe and Central Asia and Latin America and women average about 90 percent as many years of schooling as men. Within these regions, there are, however, diverging trends. While in most of Latin America and Eastern Europe, girls’ enrolment rates have remained high in absolute terms, and relative to boys’, in some Central Asian countries, girls’ enrolment rates are now trailing boys’ and a widening gender gap has been observed in some countries (see Table 1 in the annex). Starting from lower initial levels of gender equality, South Asia, Sub-Saharan Africa, and the Middle East and North Africa all registered noteworthy declines in gender disparities in primary and secondary enrolments between 1975 and 1999. Nonetheless, South Asia’s gender equality in education is the lowest, with women in South Asia averaging only about half as many years of education as men, and female enrolment rates at the secondary level only two-thirds of male rates. Moreover, South Asia’s gender inequalities in education are larger than in other developing regions where absolute levels of female education are lower. In Sub-Saharan Africa, the increases in gender equality in enrolment rates at the primary level between 1980 and 1990 often tended to reflect absolute declines in boys’ enrolment rates rather than improvements in girls’. Moreover Sub-Saharan Africa made no real progress in closing the gender gap in average years of schooling between
1 The willingness to invest in a daughter’s education can also depend on the perceived value of education for the daughter’s marriage options, particularly the possibility to have them marry someone of higher perceived social or economic status.

3
1970 and 1995, so that absolute levels of female enrolment and schooling remain lower in Sub-Saharan Africa than in other developing regions.
Table A: Gross Enrolment Rates Education Attainment, by Region
While there has been a clear trend toward gender equality in education since 1970, the
gains have been slow and uneven for the poorest regions. As a result of these persistent gaps, the world community pledged at the Millennium Summit to promote gender equality and empower women, with particular emphasis on gender equality in education. The chosen target was to eliminate gender disparities in primary and secondary education by 2005, and all levels of education no later than 2015 (United Nations, 2000).
There are several rationales for this goal and one has to distinguish between intrinsic and instrumental concerns. On the intrinsic aspects, if our concern is with aggregate well-being as measured by, for example, Sen’s notion of ‘capabilities’ (Sen, 1999), then we should view the important capabilities of education as critical constituent elements in well-being. Gender inequality will reduce aggregate well-being two-fold. First, there is likely to be a declining marginal well-being effect of education so that gains for the high education of boys will be smaller than the associated losses suffered by the lower education of girls. Second, societies and individuals have been found to exhibit inequality aversion in the sense that societies with the same average achievement, but lower inequality, are preferred to societies with the same achievement and larger gaps2.
In addition, one may be concerned about gender equity as a development goal in its own right (apart from its beneficial impact on other development goals) as has been, for example, recognized in the Convention on the Elimination of All Forms of Discrimination against Women (CEDAW), signed and ratified by a majority of developing countries.
Apart from these intrinsic disadvantages of gender inequality, one may be concerned about instrumental effects of gender inequality in education. Gender inequality in education may have adverse impacts on a number of valuable development goals. First, gender inequality in education may prevent the reduction of child mortality, fertility, and undernutrition, as well as reduce the education gains of the next generation. To the extent that these linkages exist, gender bias in education may thus generate instrumental problems for development policy-makers as it compromises progress in other important development goals,
2 This has, for example, been recognized in the creation of UNDP’s Gender-Related Development Index which, derived from a notion of aversion to inequality, suggests that a country with higher gender inequality achieves a lower level of aggregate well-being compared to another with equal average achievements, but lower gender gaps (UNDP, 1995). This is achieved using an Atkinson-type inequality measure. For a further discussion, see Grün and Klasen (2000) and Bardhan and Klasen (1999, 2000).
Region Females Males Females Males Females Males Females Males Females Males Females MalesEast Asia & Pacific 108 121 106 105 35 49 60 65 3.06 4.54 5.85 6.84Europe & Central Asia .. .. 93 95 .. .. 80 81 8.09 8.93 9.67 9.20Latin America & Caribbean 97 100 130 133 34 35 87 80 3.52 4.14 5.58 5.91Middle East & North Africa 64 99 91 99 24 44 67 72 1.39 2.75 4.21 5.74South Asia 58 91 91 110 15 33 41 57 1.08 2.95 2.94 5.31
Sub-Saharan Africa a 45 66 73 85 6 13 23 28 1.56 2.60 2.82 3.98a Latest available data on primary GERs are from 1998 and on secondary GERs from 1996.b Attainment data include schooling beyond secondary. Since data are from Barro and Lee (2000), the regional classification includessome countries with per capita incomes too high to be included in the World Bank's database (the one used for the GERs).Source: World Development Indicators central database and Barro and Lee (2000).
Average Years of Attainment b
1970 1995Primary Gross Enrolment Rate Secondary Gross Enrolment Rate
1975 19751999 1999

4
including other Millennium Development Goals, particularly the ones relating to child mortality, maternal mortality, poverty, and universal primary education.
Secondly, it may be the case that gender inequality in education reduces economic growth. This is an important issue to the extent that economic growth furthers improvement in well-being (or, at least, enables improvement in well-being). That economic growth, on average, furthers well-being (measured through indicators such as longevity, literacy, and reduced poverty) has been demonstrated many times, although not all types of growth do so to the same extent (Drèze and Sen, 1989; UNDP, 1996; Bruno et al., 1996; Pritchett and Summers, 1996). Thus, policies that further economic growth (and do not harm other important development goals) should be of great interest to policy-makers all over the world.
This paper is concerned with the instrumental impact of countries failing to meet the Millennium Development Goal (MDG) on gender equality. The prospect of countries failing to meet the MDG is not just a theoretical possibility but, given our assessment of current trends, a likely outcome for some 45 countries for which data exist. The purpose of the paper is therefore to estimate to what extent these countries will suffer losses in terms of economic growth, as well as foregone reductions in fertility, child mortality, and undernutrition. Conversely, it will allow countries to assess the potential gains from adopting policies that bring them closer to meeting the goal.
The paper does not present new estimates on the impact of gender inequality in education on economic growth but instead relies primarily on two recent studies (Klasen, 2002 and Knowles et al., 2002). It does present estimates of the impact of gender inequality on fertility and child mortality, but also uses other studies that have estimated these impacts (Gatti, 1999; Murthi and Dreze, 2001; Schultz, 1994; Summers, 1994).
The main contribution of the paper is therefore to link the data about current trends in gender inequality in education with the results of studies that have estimated the impact of gender inequality on these various development outcomes. We will show that countries that fail to meet the MDG on gender inequality will have to face considerable costs in terms of foregone economic growth, as well as reductions in fertility, child mortality, and undernutrition. These costs will already be apparent by 2005, but will mount thereafter. While we are able to present point estimates (with confidence intervals) of these costs, one should treat these point estimates with caution and instead consider the entire range of estimates that we provide.
The paper is organized as follows. The next section discusses theoretical reasons for presuming that gender inequality might compromise progress in these various development outcomes. The following section will present the data on current trends in enrolments and transform them into the educational attainment variables that were used in the studies examining the costs of gender inequality. The next section will present the main results on the costs, while the conclusion summarizes the main findings. 2. Gender Inequality, Growth, Fertility, Child Mortality, and Undernutrition: Theoretical Considerations
A. Economic Growth In line with the theoretical and the empirical literature on economic growth, one can
postulate the following linkages between the gender gap in education and economic growth:
a) Lowering the Average Level of Human Capital Assuming that boys and girls have a similar distribution of innate abilities and that those
at the upper end of the ability distribution of each sex are more likely to get educated, gender inequality in education must mean that less able boys than girls get the chance to be educated, and, more importantly, that the average innate ability of those who get educated is lower than

5
would be the case if boys and girls received equal educational opportunities. This lowers the average level of human capital in the economy and thus reduces economic growth3. It should also lower the impact male education has on economic growth and raise the impact of female education, as found by Dollar and Gatti (1999) or Knowles et al. (2002). This effect could reduce economic growth directly through lowering the level of human capital. In addition, it can also reduce the investment rate as the return on investments is lower in a country with poorer human capital. Illustrative calculations suggest that this type of effect alone could depress per capita growth by some 0.3 percentage points per year in a country where gender inequality in education is similar to the levels observed in Sub-Saharan Africa today.4
A similar effect of lowering the level of human capital would appear if one considers male and female human capital as imperfect substitutes and posits declining marginal returns to education as done by Knowles et al. (2002). Then the impact of diminishing returns on the higher male education (rather than the selection of less able males) would lower the average level of human capital and thus economic growth.
Both effects are plausible and supported empirically. Micro studies show that the marginal private rate of return to educating girls is larger in many developing countries which is likely due to this selection effect as well as declining marginal returns to education (Hill and King, 1995; World Bank, 2001; Alderman et al., 1995; Alderman et al., 1996).5 Similarly, there is considerable evidence for the imperfect substitutability of male and female labor in many settings and simulation studies have shown that a more equal allocation of male and female labor among industries would indeed boost economic growth (World Bank, 2001; Tzannatos, 1999).
b) The Combined Effect of Gender Inequality in Education and Wage Discrimination In most countries of the world, females experience some wage discrimination in formal
sector employment which shows up as the unexplained portion of the female-male wage gap in earnings regressions (e.g. Horton, 1999; Tzannatos, 1999; World Bank, 2001). Such wage discrimination can boost investment in industries that employ female labor, provided that females have enough education to effectively participate in the formal labor market. Reducing gender inequality in education may thus enable employers to benefit from employing relatively cheaper female labor and they may respond by higher investment in such female-intensive employment.
3 One may object that many educated women might not be formally employed so that their human capital cannot contribute to economic growth. Several avenues do, however, point to the effect of greater female human capital. First, more educated women have a much higher chance of being employed so that their human capital tends to be used in the formal economy. Second, even the tasks they perform outside of the formal economy will be greatly influenced by their human capital so that also here we would expect an effect. 4 The calculations assume that innate abilities are normally distributed and compares two possible distributions of the student population. In one, 50 percent of an age cohort get educated and half are male and half are female. In the other, 50 percent get educated and 70 percent are male and 30 percent are female. It turns out that the average human capital (which is defined simply as the Z-score of the standardized normal distribution multiplied by the 0-1 variable for getting educated) would be some 12 percent lower in the second scenario. Using the regression coefficient on human capital from Mankiw et al. (1992) would yield some 0.3 percentage points difference in annual growth. 5 These studies only consider the private marginal returns. It is important to point out that this is the case even when the private returns to the same level of education are larger for boys (as is often the case as men have higher labor force participation rates and tend to earn more than women). This is due to the fact that, due to gender gaps in education, an extra (i.e. marginal) year of schooling for an average girl refers to a lower level of education where returns are generally much higher, while an additional year of schooling for boys will be at a higher level where returns are much lower. For a discussion, see World Bank (2001) and Alderman et al. (1995). If one included positive externalities of female education (e.g. the effects on fertility, undernutrition, and child mortality) and thus considered marginal social returns, the difference between marginal female and male returns would be even larger.
6
Here too, there is some empirical support for this type of effect. A significant portion of high growth in many developing countries, particularly in Asia, has been based on the use of female labor in export-oriented manufacturing industries. This was particularly the case in many Asian economies where female education was rapidly improving while there were also sizeable wage gaps between females and males favoring female employment and the development of female-intensive industries by domestic and foreign investors (Standing, 1999; Seguino, 2000).6
c) The ‘Direct’ Externality Factor of Gender Inequality in Education Lower gender inequality in education effectively means greater female education at each
level of male education. If it is the case that female education has positive external effects on the quality of overall education (and male education does not, or not to the same extent), then reduced gender inequality should promote a higher quality of education and thus promote economic growth. As female education is believed to promote the quantity and quality of education of children (through the support and general environment educated mothers can provide their children), this positive externality is likely to exist (World Bank, 2001).
Moreover, to the extent that similarity in education levels in the household generates positive external effects on the quality of education, reduced gender inequality may be one way to promote such external effects. For example, it is likely that equally educated siblings can strengthen each other’s educational success through direct support and play inspired by educational activities. Similarly, couples with similar education levels may promote each other’s life-long learning.7
Higher human capital associated with this process can increase economic growth directly by increasing the productivity of workers. But it can also have an indirect effect by increasing the rate of return to physical investment which, in turn, raises investment rates and, through the effect of investment on economic growth, also increases economic growth.
d) The Indirect Externality Operating via Demographic Effects Three mechanisms are believed to be at the center of this demographic impact on
economic growth. They all are related to the fact that fertility decline will reduce the share of children and consequently increase the share of workers in the total population. First, reduced fertility lowers the dependency burden, thereby increasing the supply of savings in an economy which in turn promotes economic growth. Second, a large number of people entering the workforce as the result of previously high population growth will boost investment demand for capital equipment and social overhead investments (housing, etc.). If this higher demand is met by the increased domestic savings and/or capital inflows, these two factors will allow investments to expand which should boost growth (Bloom and Williamson, 1998). Third, a lowering of fertility rates will increase the share of the working age population in the total population. If all the growth in the labor force is absorbed in increased employment, then per capita economic growth will increase even if wages and productivity remain the same. This is due to the fact that more workers have to share their wages with fewer dependents, thereby boosting average per capita incomes.8 All of these effects are
6 Over time, this effect will erode as the increased demand for female employment will help reduce the gender gaps in pay as has been shown in the rapidly growing Asian economies (World Bank, 2001; Tzannatos, 1999; Horton, 1999). But the unexplained portion of the gender gaps has far from disappeared so that this erosion appears to take a long time. 7 Even if people have a preference for marrying someone with similar education levels (as appears to be the case), gender inequality in education will force the marriage of educated men with uneducated females and thus may prevent the spillover. For a discussion of these and related issues, see Baliga et al. (1999). 8 The following calculation illustrates the point. If 100 workers have to care for 100 dependants, then their average wage of $1000 a year will translate into $500 per capita income ((100*$1000)/200). If, however, 150

7
temporary (referred to by Bloom and Williamson as a ‘demographic gift’) since after a few decades the growth in the working age population will fall while the number of the elderly will rise, thereby leading to an increasing dependency burden. This temporary effect is believed to have contributed considerably to the high growth rates in East and Southeast Asia (Young, 1995; Bloom and Williamson, 1998; ADB, 1997, see below). In fact, Bloom and Williamson estimate that 1.4-1.9 percentage points of high annual per capita growth in East Asia (and 1.1-1.8 percentage points in Southeast Asia) was due to this demographic gift. To the extent that high female education was among the most important causal factors bringing about this fertility decline, it could account for a considerable share of the economic boon generated by this demographic gift.9
B. Fertility, Child Mortality, and Undernutrition Economic models of fertility find the opportunity cost of women’s time as well as the
bargaining power of women to be important determinants of the fertility rate (Becker, 1981; Schultz, 1993; Sen, 1999). Greater female education, and particularly lower gender inequality in education, is thus likely to lead to reduced fertility.
Similarly, models of health production at the household level emphasize the importance of the mother’s education as well as her bargaining power. Greater education increases her health knowledge which improves her ability to promote the health of her children (World Bank, 1993), gives her greater ability to deal with adverse shocks (World Bank, 2001), and greater bargaining power increases her say over household resources which often leads to greater allocations to child health and nutrition. For example, Thomas (1990) found that the impact of unearned income on child survival was 20 times greater if the income was brought in by the mother than if it was brought in by the father (see World Bank 2001 for a survey). Both effects are likely to assist in lowering undernutrition and in reducing child mortality rates. Since reducing educational disparities is one of the most powerful ways of increasing the bargaining power of women (World Bank, 2001), promoting gender equity in education would thus be expected to promote the reduction of fertility, undernutrition, and child mortality directly and indirectly via the effect on bargaining power. 3. Empirical Estimates of the Effects of Gender Bias in Education on Growth, Fertility, Child Mortality, and Undernutrition
The above theoretical linkages have also been investigated empirically. Here we review the most important studies and then concentrate on the ones that we are going to use for the estimation of the costs of failing to achieve the gender equity MDG. They are summarized in Table B. In many of these studies, the impact of female education rather than gender workers have to care for only 50 dependants, then the average wage of $1000 a year will translate into $750 per capita income ((150*$1000)/200). 9 A fourth factor described by Lagerlöf (1999) suggests that there is an interaction between gender inequality in education, high fertility, low overall investments in human capital, and therefore economic growth. Here the impact of fertility operates mainly via human capital investments for the next generation. Lagerlöf’s model shows that initial gender inequality in education can lead to a self-perpetuating equilibrium of continued gender inequality in education, with the consequences of high fertility and low economic growth. In this model, gender inequality in education may generate a poverty trap which would justify public action to escape this low-level equilibrium with self-perpetuating gender gaps in education. Galor and Weil (1996) generate a similar poverty trap by postulating that economic growth reduces the gender gap in earnings, and the reduced gender gap reduces fertility, which again furthers economic growth. Countries with low initial incomes may find themselves in a position of high gender gaps in earnings, high fertility, and low economic growth. A related demographic effect may operate through the health of the next generation. It has been shown that educated women have healthier children and thus indirectly promote economic growth through producing a healthier, more educated and more productive workforce (Klasen, 1999; Summers, 1994). These effects will only appear with some lags and are therefore often quite difficult to measure.

8
inequality in education per se is considered. But since most of these studies simultaneously include male education in the analysis, they implicitly consider the impact of gender inequality in education (see Knowles et al, 2002). Also, since our policy exercise is to compare current projected paths of female enrolments with target paths that would allow countries to meet the goal, while not altering the projected levels of male enrolments, we are mainly concerned with the increase in female education that would happen as a result of meeting the goal.
A. Gender Inequality in Education and Economic Growth There have been comparatively few studies that have explicitly considered the impact of
gender inequality on economic growth. Barro and Lee (1994) and Barro and Sala-i-Martin (1995) report the ‘puzzling’ finding that in regressions including male and female years of schooling the coefficient on female primary and secondary years of schooling is negative. They suggest that a large gap in male and female schooling may signify backwardness and may therefore be associated with lower economic growth.
There are reasons to question this result, however. Dollar and Gatti (1999) show that the result disappears once a dummy variable for Latin America is included suggesting that the ‘puzzling’ effect may be due to the combination of low growth and comparatively high female education in Latin America.10
The ‘puzzling’ finding may also be related to multicollinearity. In most countries, male and female schooling are closely correlated which makes it difficult to empirically identify the effects of each individually. The correlation coefficient between male and female total years of schooling and similar attainment measures (such as the share of the adult population that has achieved secondary education) is consistently above 0.9 for a large sample of countries considered by Barro and also in this study. Large standard errors on male and female education and the sudden reversal of this finding in different specifications is further evidence of this problem (Lorgelly and Owen, 1999; Knowles et al. 2002).
Hill and King (1995) study the impact of gender differences in education on income. Instead of trying to account for growth of GDP, they relate levels of GDP to gender inequality in education. They find that a low female-male enrollment ratio is associated with a lower level of GDP per capita, over and above the impact of levels of female education on GDP per capita.
Knowles et al. (2002) also estimate the impact of gender inequality in education on levels of GDP per capita in an explicit Solow framework, treating adult male and female levels of education as separate factors of production. Their study is based on estimating the impact of male and female education on the long-run (or steady-state level) of GDP. They estimate these long run level relationships based on average GDP per capita (in log form) for 1960 to 1990 which they relate to average levels of male and female education (and other averaged covariates) for the same time period.11 With that they can then derive an elasticity for female and male education on GDP which conveys by how many percent a 1 percent increase in female or male education would increase the long-run level of GDP. They find that female education has a significant positive impact on average GDP levels while male education only has an insignificant impact. The estimated elasticity of the preferred specification is 0.37, i.e. a 1 percent increase in female education would increase the average level of GDP by 0.37 10 Moreover, as argued by Knowles et al (2002), the use of base-period values for human capital in their growth regression also contributes to this effect as the high growth Asian economies had large initial gender gaps in 1960 that were only closed subsequently so that the coefficient on female education might pick up East Asia’s initial gaps as growth-enhancing. Inclusion of regional dummy variables should deal with this problem as well. Finally, Lorgelly and Owen (1999) suggest that it may also partially be due to the impact of some outliers. 11 Given that there might be reverse causality involved in the relationship between these averaged variables, they also use instrumental variable procedures to control for this endogeneity, which does not qualitatively affect their results. If anything, the effects of female education are now larger.

9
percent.12 The male elasticity is found to be insignificant. In different parametrizations of the model, including one taken from Klasen (1999), they also show that gender inequality itself (modelled as a ratio) significantly reduces per capita income levels. Finally, they also investigate the matter in a growth regression framework to study the influence of female education on average growth between 1960 and 1990. There, they find an semi-elasticity of 0.21, suggesting that a 1 percent increase in female education would increase growth by over 0.2 percentage points.13 Below, we will use both their level as well as their growth regressions, but focus on their level results as they are based on their preferred specification.
Dollar and Gatti (1999) also examine the relationship between gender inequality in education and growth. They try to explain five-year growth intervals (1975 to 1990) and attempt to control for the possible endogeneity between education and growth using instrumental variable estimation.14 In contrast to Barro, they find that female secondary education achievement (measured as the share of the adult population that have achieved some secondary education) is positively associated with growth, while male secondary achievement is negatively associated with growth. In the full sample, both effects are insignificant, but it turns out that in countries with low female education, furthering female education does not significantly promote economic growth, while in countries with higher female education levels, promoting female education has a sizeable and significant positive impact on economic growth. But these results appear to be partly driven by the choice of time period (1975-1990), very short panels (5-year), and the use of an unusual and arguably problematic education variable (see Klasen, 2002).
Finally, Klasen (2002) investigates the impact of gender inequality on economic growth, using the total years of schooling of male adults and the female-male ratio of that schooling as the variables capturing the effect of gender inequality. These two variables are used both in initial levels (in 1960) as well as in changes. The latter variable is the female-male ratio of the (absolute) growth in the years of schooling between 1960 and 1990. The analysis considers possible endogeneities using instrumental variables, panel data analysis, and other techniques. It also examines specifically different pathways by which gender inequality might influence economic growth. Apart from a direct impact, gender inequality might also indirectly affect economic growth through the effect it has on population growth, labor force growth, and the investment rate, as discussed above. In addition, the analysis generates reduced form estimates that measure the total impact of gender inequality on economic growth. Those regressions show that both the initial ratio of female to male education has a significant positive impact on subsequent growth as does the female to male ratio of the growth of education (even if one controls for endogeneity). The point estimate for the initial ratio is 1.64 (i.e. had the female-male ratio in a country been 0.6 instead of 0.5, growth would have been 0.16% faster) and for the ratio of the growth it is 0.75 (i.e. had the ration of female
12 Two points are worth noting here. Knowles et al (2002) use the average income of 1960-1990 as the dependent variable to determine a long-term steady state relationship between male and female education levels and per capita income. To do that, they want to estimate the relationship over as long a time period as possible in order to assess the long-term steady state relationship. 1960-1990 is the longest time span for which they have data. Their interpretation is thus focused on the long-run steady state relationship between the two variables rather than on deriving a particular point estimate for the impact of education on average incomes in the time period chosen. Second, they and the other cross-country studies report an average effect of all countries included and it is not clear that this average effect will be the same for each individual country. Barring country-level data, these average effects are the best guess of individual country effects so we rely on them for our analysis. 13 One should point out that their growth specification is merely done to compare results with other findings in the literature. They do not control for endogeneity and do not place high confidence on this result’s point estimate. 14 In particular, they use religion and civil liberty variables as instruments for explaining male and female educational achievement. This would work if both of these variables are uncorrelated with economic growth. The latter, however, has been used in a variety of growth regressions and does indeed appear to be associated with economic growth (Taylor, 1998; Sachs and Warner, 1995).

10
to male expansion been 1.2 instead of 0.7, annual growth would have been nearly 0.4% faster). The findings are robust to various specifications and the use of different education variables.
The paper also reconciles its results with other studies’ and finds them to be similar to Knowles et al., while it is possible to show that the Barro results are indeed driven by multicollinearity and the absence of regional dummy variables. Using the data by Dollar and Gatti but a different (and arguably more plausible) specification, Klasen (2002) is able to show that then gender inequality will have a negative impact on growth in rich and poor countries alike. 15
Thus our reading of the existing studies is that the negative impact of gender inequality in education on growth has been substantiated in studies that use a growth regression framework (Klasen, 2002) and a Solow framework (Knowles et al., 2002) while the studies finding different results have all been shown to be problematic in one respect or another. We will therefore primarily rely on Klasen (2002) for the estimate of the effects. We will also compare the results to the point estimates by Knowles et al. (2002). The two results are not likely to lead to quantitatively similar results due to the large differences in specification and estimation strategy. We will therefore mainly look for qualitative similarity between the two findings.16
15 Klasen (2002) differs from Dollar and Gatti (1999) in using a longer growth interval (under the presumption that human capital pays off only in the long term), a longer time period (beginning in 1960 rather than 1975), a different measure of human capital, and in trying to deal with the multicollinearity problem. When trying to reconcile the differences between Dollar and Gatti (1999) and Klasen (2002), Klasen finds that the differences are largely driven by the former using a different education variable which is not very plausible (the share of the population that has exactly achieved some secondary education; those who have achieved more than that will be treated identically to those that have achieved no education at all !) and that the former study uses a much shorter and arguably less appropriate time interval (1975-1990) where many developing countries were facing severe economic crises. For details, refer to Klasen (2002). 16 Forbes (2000) also examines the impact of male and female education on economic growth using panel data with five-year intervals and a GMM estimator, a version of fixed effects. In most specifications, female education has a significant positive impact on economic growth, while male education has an insignificant (and usually slightly negative) impact on economic growth, thus providing very similar results to Knowles et al. (2002) and Klasen (2002). Appiah and McMahon (2002) examine the impact of male and female education on growth, fertility, mortality, and other social and political indicators in Africa and then estimate a structural equation system to investigate all the feedback systems. Their findings support both the sizable effect of average education and the particularly important impact of female education on growth, where indirect effects operating via fertility and child mortality play a particularly important role in the case of female education. It may also be useful to briefly discuss two studies that might question some of the findings of the studies discussed above. First, Pritchett (2001) suggests that the expansion of education during the past 30 years has had a negligible (or possibly even negative) impact on economic growth, particularly in Africa. His growth accounting framework does not explicitly address the conditional convergence typical of growth models and does not include many variables that might have accounted for growth differences. In Klasen (2002) the change in educational capital, a similar variable used by Pritchett, shows a clear positive and significant impact on economic growth. The difference might be due to the fact that Klasen (2002) additionally controls for initial levels of education and not only changes thereof, suggesting that there might be a complementarity between initial levels and subsequent growth rates. Also, we focus on female education which, according to the studies above, appears to have had a larger effect than male levels, and Prtichett’s results on average levels might be influenced by the smaller impact of male levels. Second, Devarajan et al. (2001) find that investment in Africa might not be very productive and thus Klasen’s finding that reduced gender inequality in education boosts investment rates might not do much for growth there. Klasen (2002) ran a separate growth regression for Africa and indeed also found that the impact of investment rates on growth was small and insignificant. On the other hand, the total impact of gender inequality on economic growth was somewhat larger in Africa than elsewhere, suggesting that the direct effect and other pathways more than off-set the causal chain involving the investment rate. But the general implication of both studies, that the effects of education and gender gaps in education differ from country to country, is clearly valid and our exercise is one that is based on average effects that might be larger or smaller in any individual country.

11
Table B: Empirical Results Used in Analysis Growth Regressions Fertility, Child Mortality, Undernutrition Source Klasen (2002) Knowles et al.
(2002) Abu-Ghaida and Klasen (2002)
Schultz (1994) Smith and Haddad (1999)
Regression Framework
Cross-Country and Panel Growth Regression
Cross-Country Level and Growth Regression
Cross-Country Fertility and Child Mortality Regression
Panel Fertility and Child Mortality Regressions
Panel Undernutrition Regressions with fixed effects
Education Variable
Initial Female Male Ratio Gap in Total Years of Schooling and FMR of growth of schooling
Log of female and male years of schooling
Two specifications: (1) Male and female years of schooling (2) male and female-male ratio of years of schooling
Male and female years of schooling
Female secondary school enrolment rate
Control Variables
Average education, growth of average education, openness, regional dummies, initial income
Investment rates, population growth, country-specific technology levels
Per capita income, regional dummy variables
Family planning score, trade surplus in fuels, urbanization, agricultural share of labor force, calories per capita
Access to safe water, female-male life expectancy ratio, calories per capita
Preferred Point Estimate (standard error)
Initial Gap: 1.64 (0.73) Gap of Ed. Growth: 0.75 (0.26)
Level Regression: 0.37 (0.103) Growth Regression: 0.21 (0.07)
(1) Fertility: -0.358 (0.130) Child mortality: -18.102 (6.259) (2) Fertility: -2.619 (0.496) Child mortality: -142.377 (29.264)
TFR (pooled): -0.0824 (0.013) TFR (fixed effects): -0.131 (0.025) Child Survival: 0.145 (0.0033)
-0.167 (0.0633)
Endogeneity Controls
Yes Yes No No Yes
Estimation Procedure
OLS and TSLS OLS and TSLS OLS OLS with fixed effects
OLS and TSLS
B. Fertility, Child Mortality, and Undernutrition There is a large number of empirical studies that have demonstrated the effect of female
education, or gender inequality in education, on fertility. Using macro level cross-country data, Subbarao and Raney (1995) find large negative effects of female enrollment rates in 1970 on fertility in 1985 in models that control for a large number of other variables. Similarly, Schultz (1994) also uses cross-country panel data (with 2-3 observations per country) and finds that that the adult female years of schooling has a sizeable negative impact on fertility levels between 1972 and 1989. He uses the dependent variable in a log form (while the independent variables are not in logs) and a pooled panel as well as a fixed effects specification. His results suggests that a 1-year increase in the adult female years of schooling will reduce fertility by 8 percent in the pooled cross-section and by 13 percent in the fixed effects specification, which he prefers based on the relevant econometric tests. Schultz (1997) uses the same data but a number of different specifications (including fixed effects, reduced form estimates, instrumental variable estimation, with and without family planning scores) and finds that in most of the specifications one more year of female education reduces the total fertility rate by about 0.5 children per woman.

12
Gatti (1999) also uses cross-country panel data (which are more recent than Schultz’s) and finds that 1 year of female schooling reduces the total fertility rate by 0.32. Klasen (1999) finds an effect of 0.23 in a cross-section regression for 1990. In Table 5, we show a new specification of that model (where we exclude child mortality as a determinant of fertility in order to measure the total effect of female education on fertility, including the one operating via child mortality)17 and find that a 1-year increase in female years of schooling in 1990 reduces the total fertility rate by 0.36, which is very close to the results found by Gatti (1999). When we use the ratio of female to male educational attainment instead of female education (to avoid the multicollinearity problem), the fit of the regression becomes considerably better as shown by the higher adjusted R-squared. Increasing this ratio by 10 percentage points (e.g. from 60 percent to 70 percent) would reduce fertility by 0.26 children per woman.
Thus the cross-country evidence is remarkably consistent with suggesting that one more year of female schooling reduces fertility by 0.3-0.5 children per woman and thus we are quite comfortable with using the estimates presented in Table 5 which are within this range.18 Male education, on the other hand, tends to have an insignificant or positive effect on fertility so that reducing the gender inequality by boosting female education is indeed the most important factor influencing fertility (Schultz, 1997).
Apart from these cross-country studies, within-country studies have found similar effects. For example, Murthi et al. (1995) and Dreze and Murthi (2001) find that female education (they use female literacy as the indicator) has a significant effect on district-specific total fertility rates in India. Moving from a female literacy rate of 22 percent to 65 percent would reduce total fertility by 1 child per woman (Dreze and Murthi, 2001).
Finally, micro level studies have also supported this effect of female education on fertility. For example, data from the World Fertility Surveys shows that women with more than seven years of education have between 2-4 fewer children than women with no education (Summers, 1994; Schultz, 1997).19
As we are here estimating impacts at the country level, it is probably most appropriate to rely on the cross-country estimates for measuring the effects of failing to meet the targets for gender equality in education. Consequently, we will rely on the estimates presented in Table 5 for our primary estimate but also compare the results to findings from Schultz (1994).
Regarding child mortality (we use the under-five mortality rate as the indicator), there is also ample empirical evidence that higher female education reduces child mortality. Using cross-country data for 1990, Klasen (1999) finds that the ratio of female to male total years of schooling has a highly significant and negative impact on the child mortality rate. Using the same data, Table 5 shows that one more year of female education reduces the child mortality rate by 18.1 per 1000 in 1990. Using the ratio of female to male schooling once again demonstrates a better fit and suggests that increasing the ratio of female to male educational attainment by 10 percentage points would reduce under-five mortality by 14.2 per 1000.20 Schultz (1994) also uses his same panel data set to look at child survival rates (which is one minus the under-five mortality rate, expressed in percent)21 and finds that a 1-year increase in female educational attainment would increase child survival by about 1.5 percent. Below we
17 In Klasen (1999), child mortality was included as an independent variable. As shown in Table 5, child mortality itself is influenced by the gender gap in education so that the coefficient of 0.23 only measures the direct impact of the gender gap on fertility and omits the indirect linkage via child mortality. By excluding child mortality, we thereby measure the total impact of the gender gap on fertility. 18 They clearly do not represent the econometrically most sophisticated approach but yield results that are remarkably similar to much more sophisticated analyses on the subject. 19 For a review of other studies documenting this linkage, see World Bank (2001). 20 Klasen (2000), using female literacy as the educational variable, has very similar findings. 21 For example, if the under five mortality rate was 100/1000, the child survival rate would be 900/1000; expressed in percent, this would be 90%.

13
will use his estimates as an alternative way to assess the costs.22 Schultz (1997) again uses different specifications which yield quite similar estimates suggesting that an additional year of female education reduces child mortality by 12-14/1000.
Similarly strong evidence of the impact of female education on child mortality come from district-based data in India, presented by Murthi et al. (1995) and Dreze and Murthi (2001). Using micro data, Summers (1994) reports that the difference in under-five mortality rates between women with more than seven years of education and those with none is between 80 and 120, which incidentally is quite consistent with the findings below in Table 5, which will form the basis for our estimation of the losses of failing to meet the goal on gender equality.23
Regarding undernutrition, which is closely linked to child mortality, there is also considerable evidence that better female education reduces child undernutrition. Smith and Haddad (1999), for example, show that female secondary school enrolments is significantly correlated with lower rates of childhood underweight (the share of children that are moderately or severely underweight) using cross-country panel data. Using a specification with country fixed effects, 1 percentage point higher female secondary enrollment rate reduces the share of children who are underweight by 0.17 percentage points. Klasen (2000) generates similar findings for the impact of female literacy on child undernutrition using cross-country panel data. This linkage has also been found using micro data where gender inequality in education is an important part of overall female status which was found to be significantly and strongly (negatively) correlated with undernutrition rates (Smith et al., 2001).
In sum, the theoretical and empirical literature discussed above suggests that there are plausible theoretical reasons and significant empirical support for the claim that reducing gender bias in education would enhance economic growth, and promote reductions in fertility, child mortality, and undernutrition. Conversely, countries that do not make progress on closing the existing gaps are likely to suffer costs and improvements in these dimensions will be slower than they would be if they succeeded in closing the gaps. The task is now to estimate these costs based on the findings above which is taken up in the next section. 4. Current Status of Countries’ Progress towards the MDG on Gender Equality
While ideally one would measure achievement of the MDG based on educational outcome measures (such as test scores or functional capacities of males and females) or at least output measures (such as completion rates), the most consistent, recent, and widely available data refers to school attendance and the resulting gross enrolment rates that can be calculated.
The World Bank, as part of a larger exercise tracking progress towards all MDGs, uses the ratio of girls to boys in primary and secondary education (where available) and then linearly projects the growth of enrolment that was achieved in the nineties up until 2005. It then classifies developing countries according to whether they are on track (rank 1), slightly off track (rank 2), off track (rank 3), or seriously off track (rank 4) in terms of the achievement of gender parity in enrolments (see Table 1).24 Out of a total of 155 countries, 77 countries were found to be on track, 33 off track (ranging from slightly to seriously), and 45 lacked the necessary data. Thus, approximately half of developing countries are indeed on track towards 22 We this time only use the results from the pooled panel data, not the fixed effects estimates which Schultz claims are poorly specified. For a discussion, see Schultz (1994). 23 For other studies, please refer to World Bank (2001). 24 With some modifications, the World Bank classified countries as on track if the ratio of the number of years required to reach the goal to the number of years remaining was between 0 and 1; slightly off track if this ratio was between 1 and 2; off track if this ratio exceeded 2; and seriously off track if the country exhibited a decline in the ratio of girls to boys in school. For example, if the latest available data for a country are from 1998 and so it has 7 years to reach the goal, and based on its 1990-98 growth rate for the ratio of girls to boys in school it would require 10 years to achieve gender parity, it would be classified as slightly off track (rank 2).

14
meeting this goal or already have equity in enrolments. However, a significant portion of countries, approximately half the countries in each of the Middle East and North Africa, South Asia, and Sub-Saharan Africa, are on current trends unlikely to meet this goal and would have to, in some cases drastically, expand female enrolments to reach the goal by 2005.
Table 1 also reports the latest available (mostly 1999) and projected 2005 gross enrolment rates at the primary and secondary levels for boys and girls, as well as the female to male ratios in enrolment. Enrolments in 2005 are projected using the growth rate in enrolments between 1990 and 1999 (or the earliest and latest available UNESCO data in this range) with annual compounding. We amend the World Bank’s assessment in two ways. First, we do not use the ratio of girls to boys in school but the ratio of gross enrolment rates. While the two methods are quite related (after all, our method divides by the number of boys and girls of school-going age and the differences in the number of boys and girls of school-going age in most countries are quite small), they differ in that the World Bank method also implicitly includes the problems of gender disparities at birth and in childhood in its assessment. If a country like China has a large excess of males at birth (partly due to sex-specific abortions, see Klasen and Wink, 2002) and also some excess female mortality in childhood, there will be up to 15 percent more boys of school-going age than girls. Requiring parity of the absolute number of girls and boys in school, as implicitly done in the World Bank method, would require higher enrolment rates for girls as there are fewer girls to start with. While sex-selective abortions and gender bias in mortality is a very serious problem that needs to be addressed in its own right (see Klasen and Wink, 2002), it appears problematic to conflate this with the MDG on gender equity in education. Thus, we stick to the ratio of enrolment rates as our measure for the goal.25
Secondly, we extend the analysis to countries that were not rated by the World Bank but for which the data on enrolments exist and we simply apply the World Bank’s method of rating but use the ratio of gross enrolment rates. This way, we are able to rate another 25 countries and find another 8 countries to be slightly off track and another 4 off-track. Thus, we have a total of 22 countries that are slightly off-track, 14 that are off-track, and 9 countries that are seriously off-track, while the majority of developing countries (90) are actually projected to meet the goal.
The finding that the majority of developing countries are projected to reach the goal is somewhat surprising but quite heartening. Not only virtually all transition countries (with the exception of Tajikistan and Lithuania), but also almost all countries in Latin America and the Caribbean, in East Asia and the Pacific, the majority of countries in the Middle East and North Africa, half the countries in South Asia, and one-third of countries in Sub-Saharan Africa are projected to reach the goal. Within South Asia, Bangladesh and Sri Lanka are projected to reach the goal, as is China in East Asia and Egypt and Saudi Arabia in the Middle East.26
Several caveats are in order. First, we are using gross enrolment rates, defined as the number of pupils in a school form (e.g. primary or secondary school) divided by the number of children in the relevant age group (e.g. 6-12 for primary, 13-18 for secondary school). It is easily possible, and in fact occurs frequently, for gross enrolment rates to exceed 100 percent, either due to poor progress within school, or late (early) entry of overage (underage) children 25 Since we are using gross enrolment rates, a few caveats regarding our projected enrolments are in order. Countries with positive growth rates in enrolments are assumed not to exceed the gross enrolment rate of 115, which is deemed a rate compatible with universal enrolment. In addition, countries with initial and final actual enrolment rates exceeding 100 that exhibit negative growth are assumed not to fall below the enrolment rate of 100. The assumption here is that these countries are moving closer to reducing repetition and over-aged enrolment and should not be penalized for this in the projections. 26 The World Bank classified China, Egypt, and Saudi Arabia as a 2 while, based on our indicator, they are projected to meet the goal, and thus are rated 1. The difference is precisely in the male excess in the school-age population in these countries due to a large excess of males at birth and some excess female mortality post-birth.

15
into school. Thus, gender equity in gross enrolment rates could in theory be achieved by boys entering school on time and progressing quickly while girls enter later and progress poorly but nevertheless show a high gross enrolment rate. Using net enrolment rates would address this matter but these are unfortunately not available in many countries.27
Second, high enrolment rates (even net enrolment rates) do not have a one-to-one correspondence with subsequent high attainment rates. The attainment rates are based on years passed and thus are an output measure of the educational process while the enrolment rates are merely an input measure. High enrolment in the face of high failure rates will not boost attainment as much as high enrolment rates with low failure rates.
Third, none of this says much about educational quality. High enrolment rates can be accompanied by high or poor educational quality. In fact, one can easily imagine that countries boosting enrolment rates (e.g. through the dropping of user fees as recently done in Lesotho or in Malawi in the early 1990s) may successfully raise enrolment rates but may face as a consequence declining quality as class sizes increase, resources per pupil fall, and the learning environment deteriorates. Some of this might show up in attainment rates, but even those will not fully control for differences in educational quality. We will not be able to say much about this issue in this paper but it is an important caveat to bear in mind. In particular, it should caution against mechanically trying to reach the gross enrolment goals without ensuring that quality stays the same (or preferably improves), which will typically involve additional spending to match the increased enrolment rates.
Fourth, many countries ranked as 1 (expected to meet the goal) have, in the past few years, expanded female enrolments considerably, often far more than male enrolments. In this assessment, we are assuming that this differential expansion will continue for the coming years at the same pace as it has in the past 10 years. This is not guaranteed and will therefore require constant monitoring and continuing effort to stay on this path towards meeting the goal. In particular, specific additional policies may be required for those countries that are within 5 percentage points or less of reaching the goal. To take an extreme example, female secondary enrolments in Bangladesh grew at 16.5 percent per year between 1990 and 1999 while male secondary enrolments grew at 8.0 percent. Bangladesh is meeting the goal if it continues this massive and female-biased expansion, but that will be far from given and one will have to monitor the countries ranked as 1 just as closely as those ranked 2, 3, and 4 since many might easily deviate from their projected path.
Lastly, we focus here exclusively on the ability to reach gender equity in education, not on the development of overall education. Some countries are reaching gender equity in education through declines in enrolments that are faster for males than females. This is allowing them to meet the goal of gender equity, but takes them further from reaching the goal of education for all. As such, they will suffer serious economic consequences of these reduced overall education levels.28 Thus, it is important to also investigate whether countries are experiencing rising or falling enrolment rates for both sexes. We will comment on this below.
With these caveats in mind, we will focus on those countries that are currently projected to fail to meet the MDG on gender equity for which we have complete data available (see below). The vast majority of those come from Sub-Saharan Africa (17), with 4 countries from South Asia, and 1 from each of East Asia, Europe and Central Asia, and Latin America and the Caribbean, and Middle East and North Africa. When assessing the costs of failing to meet the MDG on gender equality, it is clear that enrolment gaps per se do not impose
27 Even with gross enrolment rates, there are questions about data reliability. Sometimes there are unusual jumps in gross enrolment rates and it is not always clear that they come from a consistent source. Thus, the data will have to be scrutinized on an on-going basis. 28 Klasen (2002) would allow an estimation of these effects as well since average education is included in the assessment. But such an assessment is beyond the scope of this paper.

16
significant costs to society.29 It is the resulting gaps in educational attainment of the adult population that are the cause of the most significant costs, as all studies have found that the gap in educational attainment of adults is the factor that reduces economic growth, or compromises progress on reducing fertility, undernutrition, and child mortality.
Thus it is critical to estimate the impact of gaps in enrolments on subsequent gaps in achievement. Given that gaps in enrolment will only over time lead to gaps in achievement, the failure to meet the MDG on gender equity in enrolments is imposing costs that will materialize with a delay. Only when these uneducated girls turn into uneducated women do these costs begin to mount. Thus, one would not expect very large costs to occur by 2005, the date when the goal is supposed to be met, but in the periods thereafter when uneducated female cohorts enter the adult age groups.
Bearing the above in mind, our exercise must rely on the most widely available and current data, i.e. gross enrolment ratios, to derive education attainment data that can then be used in estimating the effects of the gender disparity in education on economic growth, fertility, and child mortality. In order to establish the relationship between gross enrolment rates and education attainment, we use Barro and Lee’s latest (2000) education attainment and gross enrolment data, while restricting our analysis to the 78 developing countries in the dataset (as defined by the World Bank). Barro and Lee’s enrolment figures are based on UNESCO data and are available at five-yearly intervals for 1960-95.30 Their attainment data, available at five-yearly intervals for 1960-2000, cover the female and male average years of primary and secondary schooling of the population aged 15 and over.31 We posit that, for females and males separately, current educational attainment of the adult population is a function of lagged education attainment, lagged enrolment rates, and the difference in current and lagged enrolment rates. Therefore, we regress available attainment data on the above variables, allowing additionally for variation across countries and over time. Unfortunately, we do not have attainment data for all the countries for which we have enrolment data and a ranking so that this assessment and our subsequent analysis of the costs can only be done for those countries with complete attainment data.
Table 2a reports the results of these regressions, showing that for primary education, five-year lagged attainment, ten-year lagged enrolments, and the difference between current and ten-year lagged enrolments are excellent predictors (adjusted R-squared of 0.96-0.98) of current attainment. Even without any country or year fixed effects, we already are able to
29 In principle, one could think of some costs of these gaps in enrolment per se. They could include that girls out of school are likely to marry earlier (possibly immediately after leaving school early) and thus have more children (see Baliga et al., 1999), or that girls out of school could be socially disruptive in some ways. Conversely, girls out of school could assist parents with generating income or helping in the household so that there might be some off-setting benefits. But clearly the main issue is not the gaps in enrolment per se but the result of these gaps, which are gaps in attainment of adult women. 30 Jong-Wha Lee kindly provided the average and female enrolment figures, and we generated the male enrolment figures using these and the sex ratio of the population aged below 15 years. In their analysis, Barro and Lee cap their gross enrolment rates at 100 percent, but we use the uncapped data as we believe that enrolments above 100 percent will also impact attainments. One should point out that the UNESCO figures that Barro and Lee employ are not identical to the UNESCO enrolment figures that the World Bank uses for assessing progress towards the MDGs. The differences are based on revisions done by UNESCO and the World Bank. While we think it best to use Barro and Lee’s enrolment figures to estimate the effects on attainment (for purposes of internal consistency), we apply the World Bank data as described above to project enrolments into the future and then estimate the costs. 31 We should point out that we omit tertiary education in the assessment although the studies that estimated the impact of gender gaps in schooling always used total years of schooling of the adult population, which includes tertiary education. We did this because the MDG is focused on gender gaps in primary and secondary education. Moreover, the data on tertiary education enrolments are scarce and not easily comparable across countries. But this should not affect our results significantly as the average number of tertiary years of schooling of the adult population in virtually all developing countries is very small, certainly when compared to the much larger number of years of primary and secondary education.

17
explain virtually all variation in attainment rates, although adding country and year fixed effects improves our fit. The coefficients are also highly significant and plausible in magnitude.32 For secondary education (Table 2b), five-year lags for enrolments are intuitively more appropriate (as it takes fewer years until they join the population of 15 and above) and fit the data considerably better. In general, the regressions including the year effects mostly show lower coefficients on the regressors and therefore our projections will differ depending on the specification we use, although it is unclear whether these differences have an impact on the ratios of female to male schooling. We will therefore use two specifications, i.e. those that only include country fixed effects and those that also include year fixed effects, and omit the simple regression since both country and year effects are significant and add to the explanatory power of our regression, which plausibly suggests that countries differ in translating enrolments into attainments.33 Tables 2a and 2b therefore provide us with the required link, by means of the coefficients on regressors, between education enrolment and attainment that we can now use to project attainment.
In order to assess the impact of failing to achieve the gender equality MDG, it is necessary to project two scenarios for female education: the first relies on existing trends in enrolment and simply projects enrolment as described above and attainment using the regressions in Tables 2a and 2b. The second scenario assumes the achievement of the MDG, stipulating that the average growth rate in female primary and secondary enrolment between 1995 and 2005 is such that female enrolment is equal to male enrolment by 2005 and remains so thereafter. As mentioned above, gross enrolment data are available until 1999 at best, so that our first exercise is to project enrolment in 2000, 2005, 2010, and 2015, adhering, where relevant, to the upper and lower bounds (see footnote 25). Based on these projected enrolments and the regression results in Tables 2a and 2b, Tables 3a and 3b provide total projected primary and secondary years of schooling for males and females (using both country effects only as well as country and year effects combined) as well as target female years of schooling.
Focusing first on the table for males (Table 3a) which reports actual 2000 total years of schooling as well as 2005 and 2015 projected years, there are, as expected, some differences in these projections depending on whether we use the regression with country effects only or additionally include year effects.34 The specification with country and year effects leads to slightly lower projected attainments in about 60 percent of the countries. But in both specifications, there is a worryingly large number of countries that are projected to have declining educational attainment for males. Therefore, of the 25 countries that are projected to be off-track and where data are complete, and accounting for country effects only, 6 countries exhibit declining total male years of schooling: Cameroon, Democratic Republic of Congo, Republic of Congo, Zambia, and Central African Republic in Sub-Saharan Africa; and Iraq in the Middle East. Male total years of schooling is projected to increase in the remaining 18 countries, roughly doubling between 2000 and 2015 in the case of Afghanistan, and tripling in the case of Mali and Guinea-Bissau. 32 Given that the right-hand side of the regression contains a lagged dependent variable, the error terms might be correlated with the lagged dependent variable thus biasing the coefficients. Simulation studies have shown, however, that this bias largely affects the coefficient on the lagged dependent variable, but not the other regressors. As our results depend on the coefficients on lagged enrolments and change in enrolments, this econometric problem has little impact on our results. For a discussion, see Forbes 2000. 33 It is interesting to note that the year fixed effects mostly suggest that the attainments in later years are higher than in earlier years, even when controlling for the other covariates, suggesting that countries are increasingly better at turning enrolments into achievements which might be an indication of increasing productivity (i.e. declining failure and repetition rates) of the educational system. When projecting forward attainments, we will assume that the year effects will be 0 in coming years, i.e. the educational productivity does not increase further beyond the left-out categories, which are 1995 and 2000. 34 Please also note that there is some discontinuity between the 2000 attainment and the 2005 and 2015 projections in a couple of countries. This is probably due to the fact that our projections are based on the revised and updated UNESCO data and not the enrolment data Barro-Lee used in their attainment calculations.

18
Turning to Table 3b on female total years of schooling, the same countries exhibiting declining male total years of schooling (with the exception of Iraq) are also projected to experience declining female attainment. For all of these countries, target female total years of schooling are higher than projected years, for both 2005 and 2015. For 2005, target years of schooling are higher than projected years for the remaining countries as well, i.e. those with projected increased female schooling. In the case of the Gambia, Nepal, Sierra Leone, and Liberia, the target female attainment is actually slightly smaller than the projected attainment.35 This is due to the fact that these countries show massive enrolment growth rates in the late 1990s. Both this huge growth rate (mostly due to recent 1999 figures) is suspect, as is the assumption that it would continue unchanged until 2005, so that it is likely that these countries will continue to exhibit gender gaps in education. However, the magnitude of these gaps is difficult to assess without resorting to essentially arbitrary alternative assumptions about the true enrolment figures for 1999 and their growth thereafter. We therefore retain these countries as countries likely to fail to meet the MDG and suffer costs, but cannot assess the magnitude of these costs. Additionally, for 2015, Ghana and Pakistan exhibit target schooling years that are lower than projected years, i.e. they will overshoot the goal of gender parity in education between 2005 and 2015. Therefore, for the countries that are overshooting the target by 2005 (i.e., the Gambia, Nepal, Sierra Leone, and Liberia) or 2015 (Ghana and Pakistan additionally), it will not be necessary to calculate the costs of failing to meet the goal for these years.
5. Costs of Failing to Meet the MDG on Gender Equality
A. Economic Growth It may be important to preface the presentation of the results with some caveats regarding
the interpretation of the expected effects. First, these estimates are based on average effects found in cross-country regressions. While they would thus be a plausible projection of effects for any individual country, it may well be that the actual effect may be larger or smaller for any individual country. Deviations from the these average expected effects are also not likely to be random but related to the policy, educational, and institutional environment of a country. For example, in countries where the overall policy and institutional environment is not conducive to economic growth, more female education is unlikely to deliver much higher growth either.36 Similarly, in countries where female employment and economic activities are highly circumscribed, the positive effects of female education might not materialize to the same extent. Conversely, in countries where the policy and institutional environment is conducive to economic growth, removing the bottleneck of poor female human capital might well have a much larger effect than estimated here. After all, the effects are estimated based on the policy and institutional setting from 1960-1990 and thus the average effect include many countries with poor policies and institutional frameworks as well as high growth countries.
Secondly, as these effects are based on historical assessment of the impact of female and male education on economic growth, they implicitly take into account differences in type or
35 The reason these countries are still rated a 2 or 3 is the fact that enrolment rates in 2005, while exceeding 100 percent for both females and males, are still significantly larger for males. But since we cap enrolments at 115 percent for both before calculating the costs, there are no gender differences and thus no costs. 36 For a discussion of this and related issues see Pritchett (2001) and Devarajan et al. (2001). There is some interesting evidence, however, that greater female education as well as women’s economic and political participation might actually improve the institutional environment (and particularly reduce corruption) which might help improve the overall growth performance. For evidence, see World Bank (2001).

19
quality of education, including particularly also gender-streaming into fields of study within educational systems in many countries. If the female expansion in education implied by the target scenario would be entirely constrained to typical female occupations, one might expect that the growth effects will materialize to a lesser extent; conversely, if this expansion allows women to enter all fields of education and occupations, the effects may well be significantly larger.
Based on Klasen (2002) and Knowles et al. (2002), as discussed above, Tables 4a-d outline the impact on economic growth of achieving gender parity in education. Due to missing data on attainments, we are only able to project the effects for 25 countries. In Tables 4a-b, we use the projected attainments based on the country effects only regression in Tables 2a and 2b (and thus the corresponding attainment figures from Tables 3a and 3b). For the estimates based on Klasen (2002) we use the coefficient from the reduced form regression of the ratio of female to male expansion of education (0.75) to see whether a faster growth of female attainment, that would be consistent with meeting the target, would lead to higher growth in the period 1995-2005.37 To estimate the impact of meeting the target between 2005 and 2015, we calculate the effect that would obtain from already having a higher ratio of female to male attainment in 2005, and of possibly having a higher female to male ratio in the growth of education between 2005 and 2015. For the effects based on Knowles et al. (2002), we use the impact higher female education would have on long-term per capita GDP. As they used a 30-year time span to estimate these long-run relationships, we similarly use such a time span and thus estimate the effect of reduced gender gaps in education on average income levels between 1975-2005 and on growth between 1975 and 2005, and do the same for the period 1985-2015. We list the countries according to their rank. We are expecting the largest effects in the countries ranked as a 4, and progressively smaller effects for countries ranked 3 or 2.
Beginning with column 3 in Table 4a, we find that the growth effects of meeting the goal are considerable in the countries that are currently off-track. Most countries in categories 3 and 4 would have grown faster by 0.1-0.3 percentage points between 1995 and 2005 if they had embarked on a path to meet the goal in 1995. In the period 2005-2015, the effects become significantly larger, averaging around 0.4 percentage points per year for countries in categories 3 and 4.38
In short, we are observing sizable losses for countries that are failing to meet the goal of gender equity in education by 2005. If these figures of 0.1-0.3 percent in annual growth appear small, one has to remember the power of compounding. A country with a PPP-GDP per capita of $1500 in 1995 and a projected per capita growth rate of 1 percent per year (both typical values for many countries in Sub-Saharan Africa) between 1995 and 2015 would have 10 percent higher income in 2015 if the effect of failing to meet the goal was 0.4 percentage points in both 10-year periods. Also, one should bear in mind that many countries in Sub-Saharan Africa have experienced no or negative growth in the past. In that context, even such a seemingly small effect would ensure that many countries could return to positive growth or significantly increase their existing growth potential.
37 We do not have to consider the impact of a higher initial ratio for this time period as the ratio in 1995 is the same regardless of whether countries embark after 1995 to reach the goal or not. 38 We do not report the results for Iraq for 1995-2005 and for India between 2005-2015 since they are implausibly large due to a peculiarity of the construction of the gender gap variable in Klasen (2002). The reason for this is that the projected male expansion of schooling 1995-2005 (2005-2015) is very small so that increasing the female expansion has a huge impact on the female-male ratio of expansion of education and thus generates a huge growth effect. Thus, these results are entirely driven by the use of the ratio in the regression and the very small denominator and should therefore be discounted. This problem also appears, to a lesser extent, in Cameroon for 1995-2005, and in Turkey for both periods. Thus, those effects should be treated with some caution and may well be biased upward.
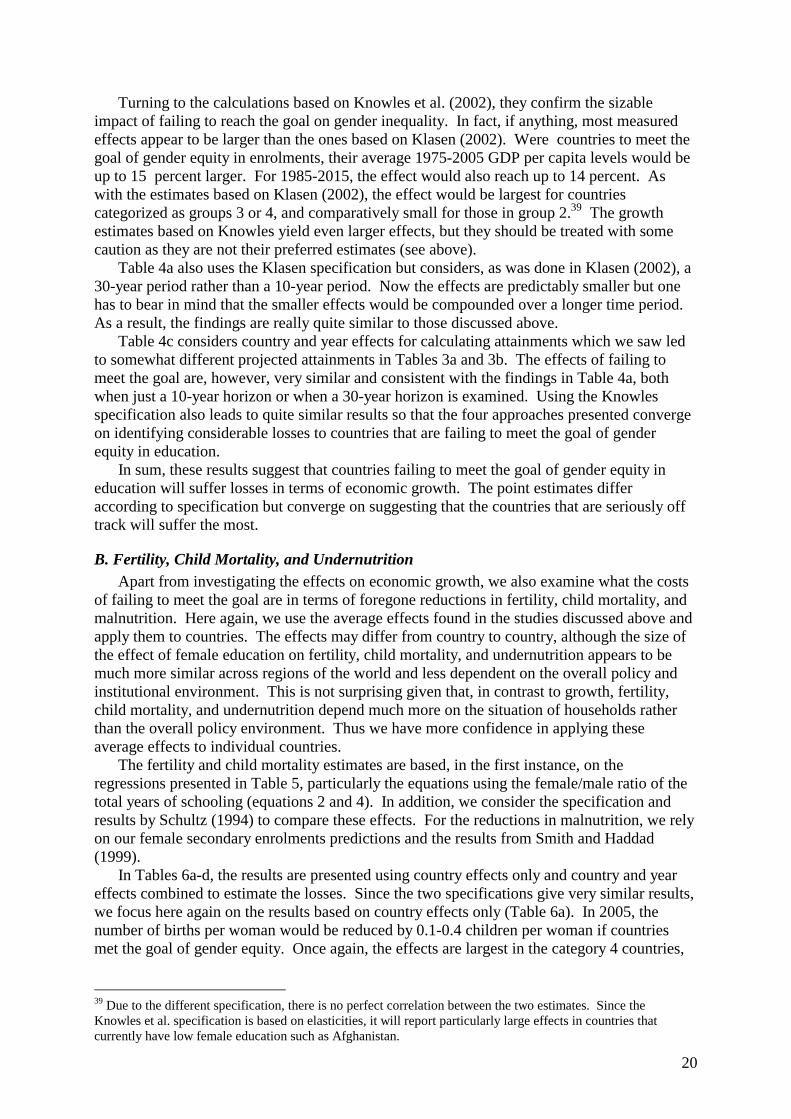
20
Turning to the calculations based on Knowles et al. (2002), they confirm the sizable impact of failing to reach the goal on gender inequality. In fact, if anything, most measured effects appear to be larger than the ones based on Klasen (2002). Were countries to meet the goal of gender equity in enrolments, their average 1975-2005 GDP per capita levels would be up to 15 percent larger. For 1985-2015, the effect would also reach up to 14 percent. As with the estimates based on Klasen (2002), the effect would be largest for countries categorized as groups 3 or 4, and comparatively small for those in group 2.39 The growth estimates based on Knowles yield even larger effects, but they should be treated with some caution as they are not their preferred estimates (see above).
Table 4a also uses the Klasen specification but considers, as was done in Klasen (2002), a 30-year period rather than a 10-year period. Now the effects are predictably smaller but one has to bear in mind that the smaller effects would be compounded over a longer time period. As a result, the findings are really quite similar to those discussed above.
Table 4c considers country and year effects for calculating attainments which we saw led to somewhat different projected attainments in Tables 3a and 3b. The effects of failing to meet the goal are, however, very similar and consistent with the findings in Table 4a, both when just a 10-year horizon or when a 30-year horizon is examined. Using the Knowles specification also leads to quite similar results so that the four approaches presented converge on identifying considerable losses to countries that are failing to meet the goal of gender equity in education.
In sum, these results suggest that countries failing to meet the goal of gender equity in education will suffer losses in terms of economic growth. The point estimates differ according to specification but converge on suggesting that the countries that are seriously off track will suffer the most.
B. Fertility, Child Mortality, and Undernutrition Apart from investigating the effects on economic growth, we also examine what the costs
of failing to meet the goal are in terms of foregone reductions in fertility, child mortality, and malnutrition. Here again, we use the average effects found in the studies discussed above and apply them to countries. The effects may differ from country to country, although the size of the effect of female education on fertility, child mortality, and undernutrition appears to be much more similar across regions of the world and less dependent on the overall policy and institutional environment. This is not surprising given that, in contrast to growth, fertility, child mortality, and undernutrition depend much more on the situation of households rather than the overall policy environment. Thus we have more confidence in applying these average effects to individual countries.
The fertility and child mortality estimates are based, in the first instance, on the regressions presented in Table 5, particularly the equations using the female/male ratio of the total years of schooling (equations 2 and 4). In addition, we consider the specification and results by Schultz (1994) to compare these effects. For the reductions in malnutrition, we rely on our female secondary enrolments predictions and the results from Smith and Haddad (1999).
In Tables 6a-d, the results are presented using country effects only and country and year effects combined to estimate the losses. Since the two specifications give very similar results, we focus here again on the results based on country effects only (Table 6a). In 2005, the number of births per woman would be reduced by 0.1-0.4 children per woman if countries met the goal of gender equity. Once again, the effects are largest in the category 4 countries,
39 Due to the different specification, there is no perfect correlation between the two estimates. Since the Knowles et al. specification is based on elasticities, it will report particularly large effects in countries that currently have low female education such as Afghanistan.

21
while they are smaller in the other countries. By 2015, the effects would rise to up to 0.6 fewer children per woman.
In terms of child mortality, the effects are also sizable. Meeting the goal would reduce child mortality by up to 24 children per 1000 in Afghanistan (a seriously off-track country) in 2005. By 2015 the effects would mount to 20-32 children per 1000 in a number of countries. Thus, meeting the goal would greatly assist countries in meeting the MDG on child mortality, which, for some countries, might be very difficult to reach without the help of having first eliminated the gender gap in schooling. For example, in Afghanistan and Mali, where the effect of gender equity in education in 2005 leads to a reduction of child mortality by 24 and 14 children per 1000 respectively, the achievement of the goal would save the lives of approximately 110,000 children in Afghanistan and 35,000 children in Mali (based on current UN projections for the population aged 0-4 years, and assuming constant fertility rates40). In India, the number of children whose death could be averted reaches 435,000 per year, based on a reduction of child mortality by 3 deaths per 1000.
In Tables 7a-b, we use the Schultz (1994) specification to examine the impact of meeting the goal on fertility and child mortality. The results of the fertility regression are larger when the fixed effect specification is used. Overall they are remarkably similar to the findings in Tables 6a and 6b and also suggest considerable costs in terms of fertility for failing to meet the goal. The results for child mortality show somewhat smaller effects but still on the order of magnitude suggested by the earlier results. In terms of annually averted child deaths, given current demographic conditions, the number for Afghanistan is 31,000, for Mali 5,000, and for India 240,000.
The effects of closing the gender gap on malnutrition rates (i.e. the share of children under five years of age who are moderately or severely underweight) are particularly large, as shown in Table 8. If countries would meet the MDG on gender equity by 2005, malnutrition rates would be lower by several percentage points already in 2005 in half the countries, and the effect would be even larger thereafter. Also here, those most seriously off-track would benefit the most from boosting female education. Closing the gender gap in education would therefore play a significant role in helping to meet the MDG on poverty, which includes halving the proportion of people who suffer from hunger as its second target, and specifically the prevalence of underweight children.41
Clearly, failing to meet the goal of gender equity in education will not only hurt the girls who lose an opportunity for an education, but also impose societal costs in terms of lower growth, higher fertility, child mortality, and malnutrition. There are likely to be other losses in areas not investigated here, such as curtailing educational investments of the next generation and reducing girls’ vulnerability to HIV/AIDS, given that girls and young women are highly vulnerable to HIV/AIDS, and a lack of education makes them more so.42 40 Of course, the same expansion in female education might lead to a change in the demographic conditions by 2005 and thus change the actual number of excess deaths in the countries missing the target. 41 The undernutrition estimate is based on a different educational variable than the one used for the other effects. While the others all refer to the gender gap in schooling attainments, the undernutrition result is based on a study that uses female secondary enrolments (Smith and Haddad, 1999). The advantage of this is that it is available for more countries. The disadvantage is that secondary enrolments are used as a proxy for educational attainment as it is likely that not enrolments per se but higher attainment among adult women will lead to reduced undernutrition. Since change in enrolments is only an imperfect proxy of change in attainment, these results should be treated with some caution. 42 Girls are at greater risk than boys because of gender inequalities in status, power, and access to resources, and they are particularly vulnerable to contracting AIDS for social, cultural, economic, and even physiological reasons (World Bank, 2002). Of course, the epidemic also reduces girls’ access to education, since girls are more likely than boys to be retained at home for domestic work when household income drops due to AIDS deaths, or to care for sick relatives. Yet girls’ education can go far in slowing and reversing the spread of HIV by contributing to female empowerment and economic independence, delayed marriage, and family planning.

22
6. Conclusion
In this paper, we took the insights of recent findings about the effects of gender gaps in education on economic growth and on fertility, child mortality, and undernutrition to estimate the losses that countries are likely to suffer if they do not meet the MDG of equity in primary and secondary education by 2005. Using different specifications and different ways to translate the failure to reach the enrolment goal into attainment gaps, we find that the countries failing to meet the goal will indeed suffer significant losses in terms of foregone economic growth as well as smaller progress in reducing levels of fertility, child mortality, and undernutrition. Point estimates suggest that the countries that are currently seriously off track might lose 0.1-0.3 percentage points in annual economic growth between 1995 and 2005, and an average of 0.4 percentage points between 2005 and 2015. In addition, failing to meet the goal would lead to 0.1-0.6 more children per woman by 2015 and to higher child mortality of up to 32 per 1000 depending on how far the countries are from meeting the goal. Sensitivity analyses using results from different studies show that these results are quite robust to different specifications of the effects as well as to different approaches of turning enrolments into educational attainments. Thus, promoting female education to close these gaps is not only intrinsically valuable for the girls who would benefit and would further an important aspect of gender equity in developing countries, but it would assist in the overall development of these countries as well. From this point of view, there are high returns to investing heavily to meet this goal and ensure that it is not only met in its quantitative dimensions but also will be accompanied by improvements in completion rates and the quality of education made available.
While there are other valuable investment opportunities for public funds, investing in female education to reduce the existing gender gaps is one of the most worthwhile investments available to governments. This is not only shown by the results above but also by analyses of rates of return which show that the marginal social rates of return to female education are very large, and in fact considerably larger than the marginal returns of investing in male education in countries exhibiting considerable gender gaps.43 Recent studies by the World Bank (2001) and Bruns and Mingat (2002) also show that this goal is, given some increased donor support, affordable even for poor developing countries, suggesting that it is not only worthwhile but within reach for policy-makers in countries that are currently not likely to meet it.
While focusing on gender equity in education as a high priority, one should not lose sight of overall educational achievements. As shown above, many countries are currently experiencing stagnating or even declining educational enrolments. Reaching gender equity in the face of these declining overall enrolments is valuable, but clearly the goal must be to push for gender equity at high overall levels of enrolments. Thus for those countries, the decline in enrolments must be halted and reversed and educational opportunities must be expanded for all, but the expansion should be faster for females than for males to close the remaining gaps.
43 This is shown, for example, in Alderman et al. (1995) and in other studies summarized by World Bank (2001). These studies show that even the marginal private returns are larger for girls’ than for boys’ education in countries with considerable gender gaps in education. While the private returns to the same level of education are typically larger for boys, the marginal returns are still higher for girls as they are at a much lower level of education and there is clear evidence of diminishing returns. When the indirect effects of female education are considered, the marginal social returns of female education increase considerably. For a discussion, see Alderman et al. (1995) and World Bank (2001).

23
Table 1: Latest Available and Projected 2005 Primary and Secondary Gross Enrolment Rates for Boys and Girls
CountryMeeting goal? *
Revised Ranking**
Female primary enrolment
Male primary enrolment
Female secondary enrolment
Male secondary enrolment
Female/male primary ratio
Female/male secondary ratio
Female primary enrolment
Male primary enrolment
Female secondary enrolment
Male secondary enrolment
Female/male primary ratio
Female/male secondary ratio
Afghanistan 4 4 34 69 12 32 0.50 0.36 83 115 31 115 0.72 0.27Albania 1 1 109 110 77 75 0.99 1.03 115 115 80 69 1.00 1.17Algeria 1 1 110 119 69 65 0.92 1.07 115 115 82 63 1.00 1.30American Samoa .. .. .. .. .. .. .. .. .. .. .. .. .. ..Angola .. 2 60 69 13 18 0.87 0.77 46 56 17 19 0.83 0.85Antigua and Barbuda 1 .. .. .. .. .. .. .. .. .. .. .. .. ..Argentina 1 1 119 119 97 91 1.00 1.07 115 115 115 107 1.00 1.07Armenia .. 1 90 85 79 100 1.06 0.79 73 62 56 115 1.17 0.49Azerbaijan 1 1 99 97 80 80 1.02 1.00 91 88 75 74 1.04 1.01Bahrain 1 1 103 102 105 99 1.00 1.06 100 100 108 100 1.00 1.08Bangladesh 1 1 105 108 56 52 0.97 1.08 115 115 115 84 1.00 1.37Belarus 1 1 109 112 93 96 0.98 0.97 115 115 91 99 1.00 0.92Belize 1 1 125 130 72 72 0.96 1.00 115 115 99 108 1.00 0.92Benin .. 3 69 103 14 30 0.67 0.45 102 115 21 44 0.89 0.48Bhutan .. .. 19 22 8 10 0.85 0.80 .. .. .. .. .. ..Bolivia .. 1 115 117 76 81 0.98 0.93 115 115 115 115 1.00 1.00Bosnia and Herzegovina .. 1 74 74 69 69 1.00 1.00 80 79 75 75 1.01 1.00Botswana 1 1 109 109 85 78 1.00 1.09 102 109 115 115 0.94 1.00Brazil 1 1 162 170 109 98 0.95 1.11 115 115 115 115 1.00 1.00Bulgaria 1 1 102 105 91 93 0.97 0.98 106 109 102 109 0.97 0.94Burkina Faso 3 3 35 51 8 12 0.70 0.64 43 58 11 15 0.75 0.72Burundi 2 2 56 69 6 8 0.80 0.75 49 63 9 9 0.78 0.94Cambodia .. 2 95 109 12 22 0.87 0.55 87 100 9 14 0.87 0.64Cameroon 2 2 84 98 17 22 0.85 0.78 78 92 13 16 0.85 0.85Cape Verde .. 1 143 145 51 52 0.98 0.97 115 115 115 115 1.00 1.00Central African Republic .. 3 45 68 6 14 0.66 0.41 41 59 4 10 0.69 0.45Chad 4 4 53 87 5 18 0.61 0.28 72 96 8 22 0.75 0.36Chile 1 1 105 109 88 87 0.96 1.02 108 115 97 99 0.94 0.98China 2 1 108 105 60 66 1.02 0.90 100 100 75 74 1.00 1.02Colombia 1 1 112 113 75 67 1.00 1.11 114 115 94 86 1.00 1.10Comoros .. 2 76 91 18 23 0.84 0.82 87 94 22 24 0.93 0.95Congo, Dem. Rep. 2 2 44 49 13 24 0.90 0.52 34 32 11 20 1.07 0.56Congo, Rep. 2 2 79 88 43 60 0.90 0.72 59 65 43 57 0.91 0.75Costa Rica 1 1 106 109 54 48 0.97 1.12 110 114 63 54 0.96 1.17Cote d'Ivoire .. 3 66 88 15 28 0.74 0.53 73 95 16 27 0.77 0.58Croatia 1 1 89 91 86 83 0.99 1.04 93 94 90 90 0.98 1.00Cuba 1 1 102 106 84 80 0.96 1.04 106 111 77 78 0.95 0.98Czech Republic 1 1 104 104 89 87 0.99 1.02 109 110 88 84 0.99 1.05Djibouti 4 2 31 43 17 13 0.73 1.29 31 41 24 12 0.75 2.02Dominica 1 .. .. .. .. .. .. .. .. .. .. .. .. ..Dominican Republic 1 1 123 126 73 60 0.97 1.22 115 115 100 87 1.00 1.15Ecuador 1 1 114 114 57 56 0.99 1.02 112 112 58 57 1.00 1.01
1999 or latest available 2005 projections

24
CountryMeeting goal? *
Revised Ranking**
Female primary enrolment
Male primary enrolment
Female secondary enrolment
Male secondary enrolment
Female/male primary ratio
Female/male secondary ratio
Female primary enrolment
Male primary enrolment
Female secondary enrolment
Male secondary enrolment
Female/male primary ratio
Female/male secondary ratio
Egypt, Arab Rep. 2 1 96 104 81 86 0.93 0.94 103 105 90 88 0.98 1.03El Salvador 1 1 109 113 50 50 0.97 0.99 115 115 84 90 1.00 0.94Equatorial Guinea 4 .. 112 137 19 43 0.82 0.44 .. .. .. .. .. ..Eritrea 4 4 55 67 23 33 0.82 0.70 71 85 35 59 0.83 0.59Estonia 1 1 101 105 108 105 0.96 1.03 100 100 110 111 1.00 0.99Ethiopia 4 4 57 85 4 6 0.67 0.68 95 115 2 3 0.82 0.62Fiji .. 1 110 111 70 70 0.99 1.01 100 100 96 99 1.00 0.97Gabon 1 1 151 152 51 58 0.99 0.87 .. .. .. .. .. ..Gambia, The 2 2 71 79 23 31 0.90 0.74 88 81 35 36 1.09 0.97Georgia 1 1 98 99 78 77 1.00 1.02 99 99 70 67 1.00 1.05Ghana .. 2 74 82 33 42 0.89 0.78 79 83 37 40 0.95 0.94Grenada 1 .. .. .. .. .. .. .. .. .. .. .. .. ..Guatemala 2 2 94 105 30 35 0.89 0.87 112 115 38 44 0.97 0.87Guinea 4 4 51 75 7 20 0.68 0.36 84 97 10 26 0.87 0.39Guinea-Bissau .. 3 66 99 14 26 0.67 0.54 94 115 26 43 0.82 0.61Guyana 1 1 115 117 82 80 0.98 1.02 115 115 78 80 1.00 0.97Haiti .. 1 155 153 28 30 1.01 0.92 115 115 46 52 1.00 0.88Honduras .. 1 110 107 35 29 1.03 1.23 108 108 33 27 1.00 1.20Hungary 1 1 103 104 99 98 0.98 1.01 108 111 115 114 0.97 1.01India 3 3 92 109 40 59 0.85 0.68 99 108 46 62 0.91 0.75Indonesia 1 1 106 110 54 56 0.97 0.95 101 105 65 62 0.96 1.05Iran, Islamic Rep. 2 1 86 89 77 83 0.96 0.92 75 74 107 99 1.00 1.08Iraq 3 4 91 111 29 47 0.82 0.62 85 106 25 41 0.80 0.60Isle of Man .. .. .. .. .. .. .. .. .. .. .. .. .. ..Jamaica 1 1 102 96 82 85 1.07 0.96 103 92 94 103 1.12 0.91Jordan 1 1 101 101 89 86 1.00 1.03 115 115 115 115 1.00 1.00Kazakhstan 1 1 96 96 87 87 1.01 1.01 103 102 80 81 1.01 0.99Kenya 1 1 90 91 28 31 0.98 0.90 87 87 37 35 1.00 1.05Kiribati 1 .. .. .. .. .. .. .. .. .. .. .. .. ..Korea, Dem. Rep. .. .. .. .. .. .. .. .. .. .. .. .. .. ..Korea, Rep. 1 1 99 98 97 98 1.01 1.00 95 94 104 102 1.02 1.01Kyrgyz Republic 1 1 100 103 84 82 0.97 1.03 100 100 71 70 1.00 1.03Lao PDR 3 2 106 124 29 42 0.85 0.70 115 115 39 51 1.00 0.77Latvia 1 1 100 102 90 88 0.98 1.03 105 107 88 85 0.98 1.04Lebanon 1 1 98 102 82 75 0.96 1.09 87 100 86 78 0.87 1.10Lesotho 1 1 108 99 32 24 1.09 1.37 100 98 34 26 1.02 1.29Liberia .. 3 99 137 18 27 0.73 0.69 115 115 32 33 1.00 1.00Libya 1 1 116 118 84 75 0.99 1.11 115 115 80 68 1.00 1.19Lithuania 1 4 100 101 71 115 0.99 0.61 109 107 59 115 1.02 0.52Macedonia, FYR 1 1 102 104 80 82 0.98 0.97 105 109 115 115 0.97 1.00Madagascar 1 1 100 104 14 15 0.96 0.96 98 105 11 12 0.93 0.95Malawi .. 1 158 158 40 50 1.00 0.80 115 115 115 115 1.00 1.00Malaysia 1 1 100 102 104 94 0.98 1.10 105 109 115 115 0.97 1.00
1999 or latest available 2005 projections

25
CountryMeeting goal? *
Revised Ranking**
Female primary enrolment
Male primary enrolment
Female secondary enrolment
Male secondary enrolment
Female/male primary ratio
Female/male secondary ratio
Female primary enrolment
Male primary enrolment
Female secondary enrolment
Male secondary enrolment
Female/male primary ratio
Female/male secondary ratio
Maldives 1 1 134 133 44 41 1.01 1.07 115 132 40 37 0.87 1.10Mali 3 3 45 65 10 20 0.70 0.52 95 115 21 38 0.83 0.54Marshall Islands 1 .. .. .. .. .. .. .. .. .. .. .. .. ..Mauritania 1 2 82 87 15 21 0.94 0.72 115 115 23 23 1.00 0.96Mauritius 1 1 109 108 106 108 1.00 0.98 108 108 115 115 1.00 1.00Mayotte .. .. .. .. .. .. .. .. .. .. .. .. .. ..Mexico 1 1 113 114 75 72 0.99 1.04 113 113 94 88 1.00 1.06Micronesia, Fed. Sts. .. .. .. .. .. .. .. .. .. .. .. .. .. ..Moldova 1 1 97 98 82 79 0.99 1.03 103 106 80 83 0.97 0.96Mongolia 1 1 100 97 71 58 1.04 1.23 102 97 62 48 1.05 1.29Morocco 2 2 83 98 35 44 0.84 0.80 109 113 39 46 0.96 0.85Mozambique 4 3 73 98 11 17 0.75 0.68 86 115 18 24 0.74 0.76Myanmar 1 1 91 91 35 35 0.99 1.00 82 82 51 51 1.01 1.01Namibia 1 1 114 112 63 56 1.02 1.12 102 106 75 72 0.96 1.04Nepal 2 2 112 140 45 62 0.80 0.72 115 115 78 76 1.00 1.02Nicaragua .. 1 105 104 65 55 1.01 1.19 111 114 82 76 0.97 1.08Niger 3 3 26 39 5 8 0.67 0.65 30 40 6 7 0.75 0.89Nigeria .. 2 74 89 27 33 0.83 0.82 68 72 40 42 0.95 0.94Oman 1 1 71 75 67 68 0.95 0.98 65 66 95 83 0.98 1.15Pakistan .. 3 74 117 32 46 0.63 0.70 113 115 53 61 0.98 0.87Palau .. .. .. .. .. .. .. .. .. .. .. .. .. ..Panama .. 1 108 111 71 67 0.97 1.07 111 113 76 71 0.98 1.06Papua New Guinea 3 2 80 88 18 24 0.91 0.78 94 97 32 35 0.97 0.89Paraguay 1 1 111 115 58 56 0.97 1.04 115 115 87 84 1.00 1.04Peru 1 1 127 128 78 83 0.99 0.94 115 115 94 96 1.00 0.98Philippines .. 1 113 113 79 73 1.00 1.09 115 113 86 72 1.01 1.19Poland 1 1 99 102 98 99 0.97 0.99 101 105 109 114 0.96 0.96Puerto Rico .. 1 129 129 68 63 1.00 1.08 115 115 76 70 1.00 1.08Romania 1 1 101 103 81 80 0.98 1.01 108 112 74 72 0.97 1.03Russian Federation .. 1 84 85 85 79 0.99 1.07 71 72 78 72 0.99 1.08Rwanda 1 1 121 124 12 12 0.98 0.95 115 115 17 15 1.00 1.11Samoa 1 1 101 104 80 73 0.97 1.09 100 100 115 115 1.00 1.00Sao Tome and Principe .. .. .. .. .. .. .. .. .. .. .. .. .. ..Saudi Arabia 2 1 67 70 65 72 0.96 0.90 66 65 91 94 1.03 0.97Senegal 3 3 68 78 15 24 0.87 0.64 83 86 20 26 0.97 0.76Seychelles 1 .. .. .. .. .. .. .. .. .. .. .. .. ..Sierra Leone .. 2 63 68 22 26 0.92 0.82 83 74 31 30 1.12 1.04Slovak Republic 1 1 102 103 87 86 0.99 1.02 103 109 88 85 0.94 1.03Solomon Islands .. 2 92 102 14 22 0.91 0.65 115 115 21 30 1.00 0.69Somalia .. 4 7 13 4 7 0.52 0.53 6 11 3 6 0.53 0.53South Africa 1 1 117 121 95 86 0.96 1.10 114 120 106 99 0.95 1.07Sri Lanka 1 1 104 107 74 70 0.97 1.07 104 108 72 69 0.97 1.05St. Kitts and Nevis .. .. .. .. .. .. .. .. .. .. .. .. .. ..
1999 or latest available 2005 projections

26
CountryMeeting goal? *
Revised Ranking**
Female primary enrolment
Male primary enrolment
Female secondary enrolment
Male secondary enrolment
Female/male primary ratio
Female/male secondary ratio
Female primary enrolment
Male primary enrolment
Female secondary enrolment
Male secondary enrolment
Female/male primary ratio
Female/male secondary ratio
St. Lucia 1 1 111 117 104 85 .. .. .. .. .. .. .. ..St. Vincent & the Grenadi .. .. .. .. .. .. .. .. .. .. .. .. .. ..Sudan 2 1 51 59 36 22 0.85 1.67 55 59 52 19 0.93 2.76Suriname .. .. .. .. .. .. .. .. .. .. .. .. .. ..Swaziland 1 1 121 128 60 60 0.95 1.01 115 115 80 77 1.00 1.04Syrian Arab Republic 2 1 99 108 39 44 0.91 0.89 96 103 36 34 0.93 1.05Tajikistan .. 4 101 109 70 82 0.93 0.86 108 115 54 71 0.94 0.77Tanzania 1 1 63 63 5 6 1.00 0.86 60 58 5 6 1.02 0.98Thailand 1 1 91 96 80 78 0.95 1.02 87 93 115 115 0.94 1.00Togo 3 3 109 139 22 50 0.78 0.44 115 115 34 64 1.00 0.53Tonga 1 .. .. .. .. .. .. .. .. .. .. .. .. ..Trinidad and Tobago 1 1 103 105 82 75 0.99 1.09 108 110 82 73 0.98 1.12Tunisia 1 1 115 121 76 73 0.95 1.04 115 115 115 94 1.00 1.22Turkey 3 2 96 106 48 67 0.91 0.71 96 108 57 75 0.89 0.76Turkmenistan .. 1 109 109 112 112 1.00 0.99 115 115 115 115 1.00 1.00Uganda .. 2 136 146 10 16 0.93 0.59 115 115 9 15 1.00 0.65Ukraine 1 1 81 82 99 87 0.99 1.15 74 76 103 83 0.98 1.24Uruguay 1 1 111 113 99 84 0.99 1.17 114 115 105 94 0.99 1.11Uzbekistan .. 1 79 81 89 100 0.97 0.89 77 81 80 94 0.96 0.85Vanuatu 1 1 122 113 26 31 1.08 0.83 115 115 38 43 1.00 0.88Venezuela, RB 1 1 101 103 65 54 0.98 1.19 104 109 89 82 0.95 1.08Vietnam .. 1 104 111 61 68 0.94 0.91 107 115 97 109 0.94 0.89West Bank and Gaza .. .. .. .. .. .. .. .. .. .. .. .. .. ..Yemen, Rep. 4 3 56 98 25 69 0.56 0.37 88 115 32 52 0.77 0.62Yugoslavia, Fed. Rep. 1 1 67 65 62 59 1.02 1.05 63 62 60 57 1.02 1.06Zambia .. 2 76 81 22 29 0.94 0.77 66 70 26 28 0.94 0.95Zimbabwe 1 1 95 98 43 48 0.97 0.88 84 87 40 45 0.96 0.90* As assessed by the World Bank, based on the ratio of girls to boys in primary and secondary education, where "1" denotes on track, "2" slightly off track, "3" off track, and "4" seriously off track.The World Bank's methodology uses, with some modification, the ratio of years it takes to reach the goal divided by the years available (i.e. between latest data and 2005). If this ratio is >0 and <1, the ranking is "1", if >1 and <2, the ranking is "2", if >2, the ranking is "3", and if the ratio of girls to boys in school is declining, the ranking is "4". ** Based on the ratio for girls to boys of gross enrollment rates in primary and secondary education, and otherwise following the World Bank's methodology. Since we apply this approach to the ratio of enrollment rates rather than the ratio of students in school, any discrepancies in ranking are the result of the slight difference in the number of boys and girls of school-going age in most countries.Since the ratio is an average for primary and secondary enrollment, in the following cases it masks large discrepancies between the primary and secondary levels:Armenia, Cambodia, Democratic Republic of Congo, Eritrea, Guinea, Iraq, Lithuania, Tajikistan, Uganda. However, only in the case of Armenia does it lead to an "on track" rankingwhere not both the primary and secondary level are on track separately.Source: World Development Indicators central database and authors' calculations.
1999 or latest available 2005 projections

27
Table 2a: Primary LevelDependent variable: average years of primary schooling in population aged 15 or above
Constant 0.026 0.163 *** 0.806 * 0.082 0.414 * 1.598 *(0.039) (0.089) (0.178) (0.065) (0.146) (0.240)
Five-year lagged attainment 0.952 * 0.767 * 0.635 * 0.941 * 0.693 * 0.476 *(0.012) (0.035) (0.047) (0.013) (0.038) (0.050)
Ten-year lagged enrolment 0.379 * 0.771 * 0.503 * 0.336 * 0.779 * 0.404 **(0.066) (0.141) (0.149) (0.081) (0.181) (0.184)
Difference between current and 0.402 * 0.417 * 0.234 *** 0.413 * 0.589 * 0.358 **ten-year lagged enrolment (0.088) (0.119) (0.122) (0.099) (0.147) (0.145)Year 1970 -0.271 * -0.443 *
(0.073) (0.081)Year 1975 -0.247 * -0.366 *
(0.063) (0.069)Year 1980 -0.095 *** -0.186 *
(0.055) (0.062)Year 1985 -0.126 * -0.142 *
(0.047) (0.054)Year 1990 0.002 -0.024 *
(0.044) (0.052)
No. of observations 409 409 409 404 404 404Adjusted R-squared 0.977 0.979 0.980 0.956 0.960 0.964F test, country effects jointly zero 1.445 ** 1.757 * 1.534 * 2.159 *
* significant at 1%, ** significant at 5%, *** significant at 10%, standard errors in parenthesesOmitted years are 1995 and 2000.
Inc. CountryEffects
nc. Country andYear Effects
Females MalesSimple
RegressionInc. Country
EffectsInc. Country and
Year EffectsSimple
Regression

28
Table 2b: Secondary LevelDependent variable: average years of secondary schooling in population aged 15 or above
Constant 0.013 0.010 0.044 0.025 0.004 0.175 **(0.010) (0.015) (0.041) (0.017) (0.028) (0.070)
Five-year lagged attainment 0.926 * 0.744 * 0.754 * 0.931 * 0.715 * 0.689 *(0.023) (0.033) (0.035) (0.022) (0.036) (0.039)
Five-year lagged enrolment 0.466 * 0.872 * 0.759 * 0.425 * 1.001 * 0.726 *(0.055) (0.080) (0.096) (0.058) (0.113) (0.137)
Difference between current and 0.505 * 0.510 * 0.436 * 0.537 * 0.666 * 0.537 *five-year lagged enrolment (0.098) (0.103) (0.108) (0.108) (0.118) (0.124)Year 1965 -0.049 -0.149 *
(0.035) (0.051)Year 1970 -0.010 -0.082 ***
(0.033) (0.047)Year 1975 -0.016 -0.090 **
(0.030) (0.043)Year 1980 0.026 -0.020
(0.027) (0.039)Year 1985 -0.030 -0.081 **
(0.026) (0.037)Year 1990 0.026 0.022
(0.025) (0.036)
No. of observations 467 467 467 464 464 464Adjusted R-squared 0.941 0.952 0.953 0.912 0.924 0.927F test, country effects jointly zero 2.360 * 2.330 * 1.996 * 2.059 *
* significant at 1%, ** significant at 5%, *** significant at 10%, standard errors in parenthesesOmitted years are 1995 and 2000.
Inc. CountryEffects
nc. Country andYear Effects
Females MalesSimple
RegressionInc. Country
EffectsInc. Country and
Year EffectsSimple
Regression

29
Table 3a: Total Primary and Secondary Years of Schooling for Off-Track Countries, Males
Revised 2000 2005 2015 2005 2015Country Ranking Actual Projected Projected Projected ProjectedCameroon 2 4.03 3.81 3.38 3.97 3.78Congo, Dem. Rep. 2 4.08 3.35 2.17 3.63 3.13Congo, Rep. 2 5.55 5.09 4.13 5.20 4.74Gambia, The 2 2.98 3.13 3.43 2.94 3.06Ghana 2 5.63 6.01 6.46 6.02 6.40Guatemala 2 3.66 4.13 5.01 4.01 4.56Nepal 2 3.26 3.66 4.49 3.43 3.90Papua New Guinea 2 3.23 3.45 4.19 3.33 3.81Sierra Leone 2 3.08 3.36 3.89 3.32 3.67Turkey 2 5.90 6.01 6.36 5.92 6.17Uganda 2 4.28 4.55 4.97 4.33 4.38Zambia 2 5.91 5.61 5.04 5.77 5.55Benin 3 3.25 3.66 4.68 3.41 3.96Central African Republic 3 3.34 2.99 2.43 3.12 2.87Guinea-Bissau 3 0.94 1.56 3.00 1.45 2.43India 3 6.14 6.14 6.21 5.99 5.98Liberia 3 3.23 3.44 4.13 3.50 3.96Mali 3 1.17 1.90 3.60 1.79 2.85Mozambique 3 1.37 1.72 2.49 1.79 2.36Niger 3 1.36 1.41 1.49 1.52 1.65Pakistan 3 5.02 5.58 6.80 5.33 6.01Senegal 3 3.05 3.31 3.83 3.39 3.79Togo 3 4.52 4.77 5.38 4.59 5.03Afghanistan 4 2.49 3.76 5.76 3.48 4.68Iraq 4 4.30 4.09 3.72 4.12 3.86
Source: Barro-Lee data (2000) and authors' calculations.
Country Effects Country and Year Effects

30
Table 3b: Total Primary and Secondary Years of Schooling for Off-Track Countries, Females
Revised 2000Country Ranking Actual Projected Target Projected Target Projected Target Projected TargetCameroon 2 2.94 2.89 2.97 2.71 2.92 2.92 2.97 2.81 2.94Congo, Dem. Rep. 2 1.95 1.79 1.85 1.36 1.45 1.93 1.98 1.77 1.87Congo, Rep. 2 4.54 4.41 4.58 3.83 4.19 4.48 4.62 4.15 4.44Gambia, The 2 1.63 2.08 2.06 3.29 2.86 1.93 1.92 2.73 2.44Ghana 2 2.14 2.67 2.69 3.53 3.49 2.70 2.71 3.48 3.45Guatemala 2 3.03 3.50 3.55 4.50 4.64 3.41 3.44 4.14 4.26Nepal 2 1.45 2.33 2.32 4.31 4.04 2.14 2.12 3.63 3.40Papua New Guinea 2 2.42 2.70 2.72 3.66 3.65 2.58 2.60 3.24 3.24Sierra Leone 2 1.70 2.13 2.07 3.37 2.90 2.08 2.04 3.00 2.69Turkey 2 4.17 4.43 4.61 4.95 5.44 4.33 4.46 4.71 5.08Uganda 2 2.72 3.12 3.15 3.96 3.97 2.93 2.96 3.35 3.38Zambia 2 4.94 4.94 4.96 4.84 4.85 4.88 4.90 4.78 4.76Benin 3 1.38 1.82 2.01 2.96 3.61 1.69 1.84 2.46 3.00Central African Republic 3 1.70 1.66 1.77 1.53 1.85 1.70 1.78 1.66 1.87Guinea-Bissau 3 0.74 1.13 1.31 2.45 2.97 1.04 1.17 1.99 2.41India 3 3.66 3.99 4.13 4.66 4.97 3.83 3.94 4.22 4.48Liberia 3 1.51 1.94 1.92 3.59 3.10 1.90 1.89 3.20 2.82Mali 3 0.56 1.05 1.23 2.46 3.11 0.98 1.11 2.01 2.55Mozambique 3 0.84 0.99 1.14 1.73 2.07 1.01 1.10 1.62 1.83Niger 3 0.66 0.76 0.80 1.01 1.09 0.81 0.84 1.05 1.10Pakistan 3 2.48 3.23 3.27 5.19 5.12 3.05 3.09 4.52 4.46Senegal 3 1.93 2.28 2.33 3.16 3.18 2.26 2.29 2.89 2.92Togo 3 2.08 2.58 2.76 3.69 4.22 2.45 2.61 3.26 3.72Afghanistan 4 0.79 1.28 1.91 2.96 4.27 1.20 1.70 2.44 3.53Iraq 4 3.18 3.23 3.43 3.22 3.81 3.16 3.31 3.09 3.51Source: Barro-Lee data (2000) and authors' calculations.
Country Effects Country and Year Effects20152005 2005 2015

31
Table 4a: Effect on Economic Growth of Gender Parity in Education, Country Effects, Using Klasen (2002)Revised
Country Ranking
Cameroon * 2 0.7 0.2 1.1 0.2 0.1 0.3 0.1 0.0 0.1 2.8 0.9 4.7Congo, Dem. Rep. * 2 0.1 0.0 0.1 0.0 0.0 0.0 0.0 0.0 0.1 0.0 0.0 0.1Congo, Rep. * 2 0.3 0.1 0.5 0.1 0.0 0.1 na na na 0.1 0.0 0.2Gambia, The ** 2 .. .. .. .. .. .. .. .. .. .. .. ..Ghana ** 2 .. .. .. .. .. .. .. .. .. .. .. ..Guatemala 2 0.1 0.0 0.1 0.1 0.0 0.2 0.0 0.0 0.0 0.1 0.0 0.1Nepal ** 2 .. .. .. .. .. .. .. .. .. .. .. ..Papua New Guinea ** 2 .. .. .. .. .. .. .. .. .. .. .. ..Sierra Leone ** 2 .. .. .. .. .. .. .. .. .. .. .. ..Turkey 2 0.7 0.2 1.2 0.7 0.2 1.2 0.1 0.0 0.1 0.2 0.1 0.3Uganda 2 0.1 0.0 0.1 0.0 0.0 0.0 0.0 0.0 0.0 0.0 0.0 0.0Zambia * 2 0.1 0.0 0.2 0.0 0.0 0.1 0.0 0.0 0.0 0.1 0.0 0.1Benin 3 0.2 0.1 0.4 0.4 0.1 0.7 0.1 0.0 0.1 0.2 0.1 0.3Central African Republic * 3 0.3 0.1 0.5 0.2 0.1 0.3 0.1 0.0 0.1 1.1 0.4 1.9Guinea-Bissau 3 0.2 0.1 0.4 0.4 0.1 0.7 na na na 0.2 0.1 0.3India *** 3 0.2 0.1 0.4 .. .. .. 0.0 0.0 0.1 0.2 0.1 0.3Liberia ** 3 .. .. .. .. .. .. .. .. .. .. .. ..Mali 3 0.2 0.1 0.3 0.4 0.1 0.6 0.1 0.0 0.2 0.2 0.1 0.3Mozambique 3 0.3 0.1 0.4 0.3 0.1 0.6 0.2 0.1 0.3 0.2 0.1 0.3Niger 3 0.2 0.1 0.4 0.5 0.1 0.8 0.1 0.0 0.1 0.1 0.0 0.2Pakistan ** 3 0.1 0.0 0.1 .. .. .. 0.0 0.0 0.0 0.0 0.0 0.0Senegal 3 0.1 0.0 0.2 0.0 0.0 0.0 0.1 0.0 0.1 0.0 0.0 0.0Togo 3 0.3 0.1 0.5 0.5 0.1 0.8 0.0 0.0 0.1 0.3 0.1 0.4Afghanistan 4 0.3 0.1 0.5 0.5 0.1 0.9 0.3 0.1 0.4 0.3 0.1 0.4Iraq *, *** 4 .. .. .. 0.7 0.2 1.2 0.1 0.0 0.2 0.5 0.2 0.9"na" not available* In these countries, male and female educational attainment are projected to fall. If countries meet the target, the female fall would be smaller, but then the female-male ratio of the growthin attainment would also (implausibly) be smaller (as a smaller negative number is divided by the same negative number yielding a smaller positive number). To correct for this, the sign of the growth effect was reversed.** In these countries, the target attainment for females is indistinguishable or even smaller than the projected attainment. This is due to huge jumps in enrolments in the late 1990sand consequent high imputed growth rates in enrolments. Once these are extrapolated to 2005 (or 2015), they suggest no gender gaps and associated costs. Thus, we do not estimate costs for these countries. But since we question the accuracy of the latest enrolment figures as well as the extrapolation of high enrolment growth, we believethat the costs will be similar to other countries' in the same rank.***In these countries, the growth effect of meeting the goal was estimated to be implausibly high due to the very small denominator of the male educational contraction and thus the hugeimpact of changing the target expansion of female education. Similarly, the effects for Turkey and Cameroon suffer from this problem to a lesser extent and the results should be treated with somecaution.
30-Year Impact on Growth1995-2005
95% Confidence Interval
10-Year Impact on Growth2005-2015
95% Confidence Interval 95% Confidence Interval 95% Confidence Interval1975-2005 1985-2015

32
Table 4b: Effect on Economic Growth of Gender Parity in Education, Country Effects, Using Knowles et al. (2002) Revised 1975-2005 1985-2015 Country Ranking GDP Change (%) Growth Effect GDP Change (%) Growth Effect 95% Confidence Interval 95% Confidence Interval 95% Confidence Interval 95% Confidence IntervalCameroon 2 0.7 0.3 1.0 0.4 0.2 0.6 1.7 0.8 2.6 1.0 0.6 1.4 Congo, Dem. Rep. 2 0.8 0.4 1.3 0.5 0.3 0.7 1.2 0.5 1.9 0.7 0.4 1.0 Congo, Rep. 2 na na na na na na 1.7 0.8 2.6 1.0 0.6 1.5 Gambia, The ** 2.. .. .. .. .. .. .. .. .. .. .. .. Ghana ** 2 0.2 0.1 0.3 0.1 0.1 0.2.. .. .. .. .. .. Guatemala 2 0.3 0.2 0.5 0.2 0.1 0.3 0.7 0.3 1.1 0.4 0.2 0.6 Nepal ** 2.. .. .. .. .. .. .. .. .. .. .. .. Papua New Guinea ** 2 0.2 0.1 0.4 0.1 0.1 0.2.. .. .. .. .. .. Sierra Leone ** 2.. .. .. .. .. .. .. .. .. .. .. .. Turkey 2 1.0 0.5 1.6 0.6 0.3 0.9 2.4 1.1 3.8 1.4 0.8 2.1 Uganda 2 0.3 0.1 0.5 0.2 0.1 0.3 0.1 0.0 0.1 0.1 0.0 0.1 Zambia 2 0.1 0.1 0.2 0.1 0.0 0.1 0.0 0.0 0.0 0.0 0.0 0.0 Benin 3 3.2 1.5 4.9 1.9 1.1 2.7 6.3 2.8 9.7 3.7 2.1 5.3 Central African Republic 3 2.0 0.9 3.0 1.2 0.7 1.7 4.9 2.2 7.5 2.9 1.6 4.1 Guinea-Bissau 3 na na na na na na 6.9 3.1 10.6 4.1 2.3 5.8 India 3 1.0 0.4 1.5 0.6 0.3 0.8 1.6 0.7 2.5 1.0 0.5 1.4 Liberia ** 3.. .. .. .. .. .. .. .. .. .. .. .. Mali 3 5.4 2.4 8.3 3.2 1.8 4.6 8.5 3.9 13.2 5.0 2.8 7.3 Mozambique 3 4.6 2.1 7.2 2.7 1.5 4.0 5.6 2.5 8.6 3.3 1.9 4.7 Niger 3 1.9 0.8 2.9 1.1 0.6 1.6 2.4 1.1 3.7 1.4 0.8 2.0 Pakistan ** 3 0.4 0.2 0.7 0.2 0.1 0.4.. .. .. .. .. .. Senegal 3 0.5 0.2 0.7 0.3 0.2 0.4 0.1 0.0 0.2 0.1 0.0 0.1 Togo 3 2.1 0.9 3.2 1.2 0.7 1.8 3.7 1.7 5.7 2.2 1.2 3.1 Afghanistan 4 14.8 6.7 22.9 8.8 4.9 12.6 14.4 6.5 22.2 8.5 4.8 12.2 Iraq 4 1.7 0.8 2.7 1.0 0.6 1.5 4.2 1.9 6.5 2.5 1.4 3.6 "na" not available ** In these countries, the target attainment for females is indistinguishable or even smaller than the projected attainment. This is due to huge jumps in enrolments in the late 1990s and consequent high imputed growth rates in enrolments. Once these are extrapolated to 2005 (or 2015), they suggest no gender gaps and associated costs. Thus, we do not estimate costs for these countries. But since we question the accuracy of the latest enrolment figures as well as the extrapolation of high enrolment growth, we believe that the costs will be similar to other countries' in the same rank.
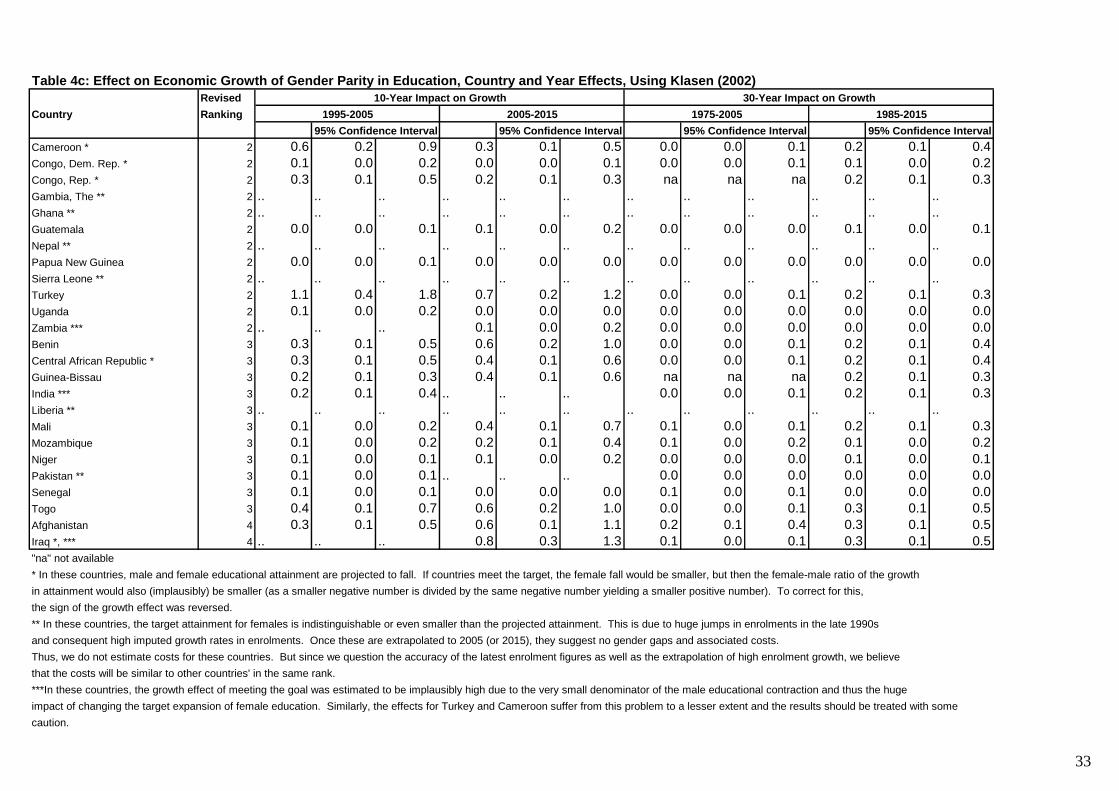
33
Table 4c: Effect on Economic Growth of Gender Parity in Education, Country and Year Effects, Using Klasen (2002)Revised
Country Ranking
Cameroon * 2 0.6 0.2 0.9 0.3 0.1 0.5 0.0 0.0 0.1 0.2 0.1 0.4Congo, Dem. Rep. * 2 0.1 0.0 0.2 0.0 0.0 0.1 0.0 0.0 0.1 0.1 0.0 0.2Congo, Rep. * 2 0.3 0.1 0.5 0.2 0.1 0.3 na na na 0.2 0.1 0.3Gambia, The ** 2 .. .. .. .. .. .. .. .. .. .. .. ..Ghana ** 2 .. .. .. .. .. .. .. .. .. .. .. ..Guatemala 2 0.0 0.0 0.1 0.1 0.0 0.2 0.0 0.0 0.0 0.1 0.0 0.1Nepal ** 2 .. .. .. .. .. .. .. .. .. .. .. ..Papua New Guinea 2 0.0 0.0 0.1 0.0 0.0 0.0 0.0 0.0 0.0 0.0 0.0 0.0Sierra Leone ** 2 .. .. .. .. .. .. .. .. .. .. .. ..Turkey 2 1.1 0.4 1.8 0.7 0.2 1.2 0.0 0.0 0.1 0.2 0.1 0.3Uganda 2 0.1 0.0 0.2 0.0 0.0 0.0 0.0 0.0 0.0 0.0 0.0 0.0Zambia *** 2 .. .. .. 0.1 0.0 0.2 0.0 0.0 0.0 0.0 0.0 0.0Benin 3 0.3 0.1 0.5 0.6 0.2 1.0 0.0 0.0 0.1 0.2 0.1 0.4Central African Republic * 3 0.3 0.1 0.5 0.4 0.1 0.6 0.0 0.0 0.1 0.2 0.1 0.4Guinea-Bissau 3 0.2 0.1 0.3 0.4 0.1 0.6 na na na 0.2 0.1 0.3India *** 3 0.2 0.1 0.4 .. .. .. 0.0 0.0 0.1 0.2 0.1 0.3Liberia ** 3 .. .. .. .. .. .. .. .. .. .. .. ..Mali 3 0.1 0.0 0.2 0.4 0.1 0.7 0.1 0.0 0.1 0.2 0.1 0.3Mozambique 3 0.1 0.0 0.2 0.2 0.1 0.4 0.1 0.0 0.2 0.1 0.0 0.2Niger 3 0.1 0.0 0.1 0.1 0.0 0.2 0.0 0.0 0.0 0.1 0.0 0.1Pakistan ** 3 0.1 0.0 0.1 .. .. .. 0.0 0.0 0.0 0.0 0.0 0.0Senegal 3 0.1 0.0 0.1 0.0 0.0 0.0 0.1 0.0 0.1 0.0 0.0 0.0Togo 3 0.4 0.1 0.7 0.6 0.2 1.0 0.0 0.0 0.1 0.3 0.1 0.5Afghanistan 4 0.3 0.1 0.5 0.6 0.1 1.1 0.2 0.1 0.4 0.3 0.1 0.5Iraq *, *** 4 .. .. .. 0.8 0.3 1.3 0.1 0.0 0.1 0.3 0.1 0.5"na" not available* In these countries, male and female educational attainment are projected to fall. If countries meet the target, the female fall would be smaller, but then the female-male ratio of the growthin attainment would also (implausibly) be smaller (as a smaller negative number is divided by the same negative number yielding a smaller positive number). To correct for this, the sign of the growth effect was reversed.** In these countries, the target attainment for females is indistinguishable or even smaller than the projected attainment. This is due to huge jumps in enrolments in the late 1990sand consequent high imputed growth rates in enrolments. Once these are extrapolated to 2005 (or 2015), they suggest no gender gaps and associated costs. Thus, we do not estimate costs for these countries. But since we question the accuracy of the latest enrolment figures as well as the extrapolation of high enrolment growth, we believethat the costs will be similar to other countries' in the same rank.***In these countries, the growth effect of meeting the goal was estimated to be implausibly high due to the very small denominator of the male educational contraction and thus the hugeimpact of changing the target expansion of female education. Similarly, the effects for Turkey and Cameroon suffer from this problem to a lesser extent and the results should be treated with somecaution.
1995-200595% Confidence Interval 95% Confidence Interval
30-Year Impact on Growth1975-2005 1985-2015
95% Confidence Interval 95% Confidence Interval2005-2015
10-Year Impact on Growth
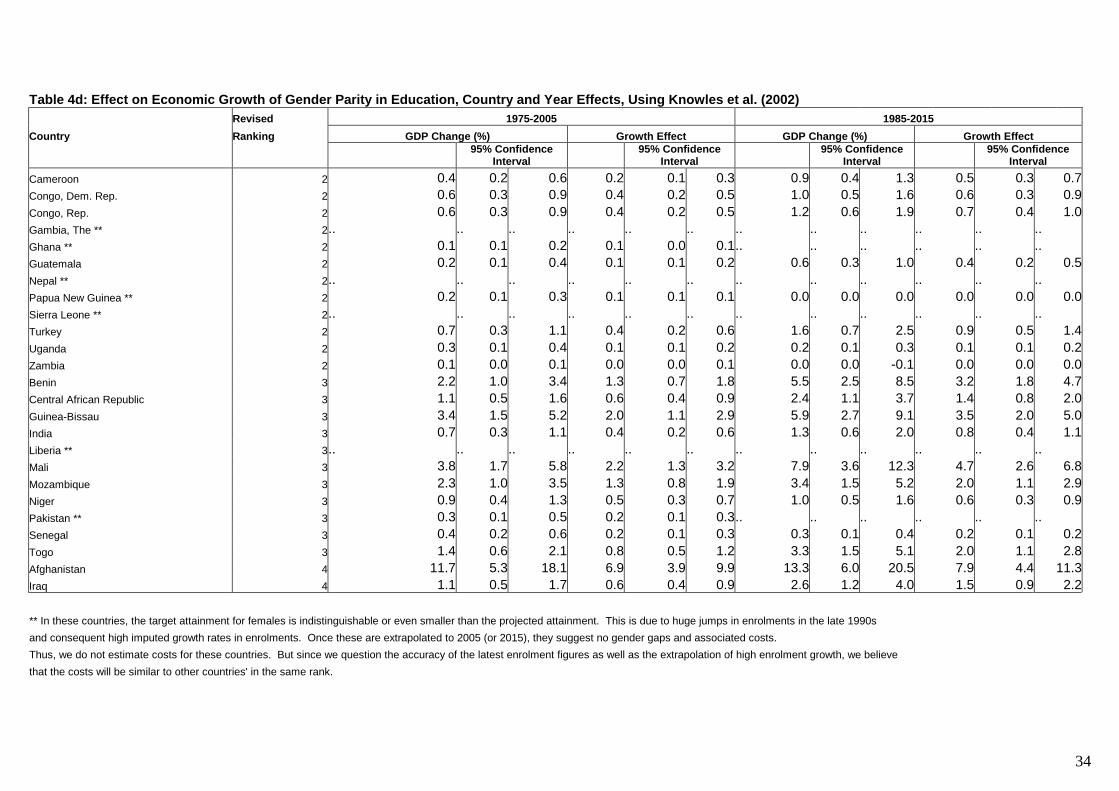
34
Table 4d: Effect on Economic Growth of Gender Parity in Education, Country and Year Effects, Using Knowles et al. (2002) Revised 1975-2005 1985-2015 Country Ranking GDP Change (%) Growth Effect GDP Change (%) Growth Effect
95% Confidence
Interval 95% Confidence
Interval 95% Confidence
Interval 95% Confidence
Interval Cameroon 2 0.4 0.2 0.6 0.2 0.1 0.3 0.9 0.4 1.3 0.5 0.3 0.7Congo, Dem. Rep. 2 0.6 0.3 0.9 0.4 0.2 0.5 1.0 0.5 1.6 0.6 0.3 0.9Congo, Rep. 2 0.6 0.3 0.9 0.4 0.2 0.5 1.2 0.6 1.9 0.7 0.4 1.0Gambia, The ** 2.. .. .. .. .. .. .. .. .. .. .. .. Ghana ** 2 0.1 0.1 0.2 0.1 0.0 0.1.. .. .. .. .. .. Guatemala 2 0.2 0.1 0.4 0.1 0.1 0.2 0.6 0.3 1.0 0.4 0.2 0.5Nepal ** 2.. .. .. .. .. .. .. .. .. .. .. .. Papua New Guinea ** 2 0.2 0.1 0.3 0.1 0.1 0.1 0.0 0.0 0.0 0.0 0.0 0.0Sierra Leone ** 2.. .. .. .. .. .. .. .. .. .. .. .. Turkey 2 0.7 0.3 1.1 0.4 0.2 0.6 1.6 0.7 2.5 0.9 0.5 1.4Uganda 2 0.3 0.1 0.4 0.1 0.1 0.2 0.2 0.1 0.3 0.1 0.1 0.2Zambia 2 0.1 0.0 0.1 0.0 0.0 0.1 0.0 0.0 -0.1 0.0 0.0 0.0Benin 3 2.2 1.0 3.4 1.3 0.7 1.8 5.5 2.5 8.5 3.2 1.8 4.7Central African Republic 3 1.1 0.5 1.6 0.6 0.4 0.9 2.4 1.1 3.7 1.4 0.8 2.0Guinea-Bissau 3 3.4 1.5 5.2 2.0 1.1 2.9 5.9 2.7 9.1 3.5 2.0 5.0India 3 0.7 0.3 1.1 0.4 0.2 0.6 1.3 0.6 2.0 0.8 0.4 1.1Liberia ** 3.. .. .. .. .. .. .. .. .. .. .. .. Mali 3 3.8 1.7 5.8 2.2 1.3 3.2 7.9 3.6 12.3 4.7 2.6 6.8Mozambique 3 2.3 1.0 3.5 1.3 0.8 1.9 3.4 1.5 5.2 2.0 1.1 2.9Niger 3 0.9 0.4 1.3 0.5 0.3 0.7 1.0 0.5 1.6 0.6 0.3 0.9Pakistan ** 3 0.3 0.1 0.5 0.2 0.1 0.3.. .. .. .. .. .. Senegal 3 0.4 0.2 0.6 0.2 0.1 0.3 0.3 0.1 0.4 0.2 0.1 0.2Togo 3 1.4 0.6 2.1 0.8 0.5 1.2 3.3 1.5 5.1 2.0 1.1 2.8Afghanistan 4 11.7 5.3 18.1 6.9 3.9 9.9 13.3 6.0 20.5 7.9 4.4 11.3Iraq 4 1.1 0.5 1.7 0.6 0.4 0.9 2.6 1.2 4.0 1.5 0.9 2.2 ** In these countries, the target attainment for females is indistinguishable or even smaller than the projected attainment. This is due to huge jumps in enrolments in the late 1990s and consequent high imputed growth rates in enrolments. Once these are extrapolated to 2005 (or 2015), they suggest no gender gaps and associated costs. Thus, we do not estimate costs for these countries. But since we question the accuracy of the latest enrolment figures as well as the extrapolation of high enrolment growth, we believe that the costs will be similar to other countries' in the same rank.

35
Table 5: Fertility and Child Mortality RegressionsDependent variables: total fertility rate and under-5 child mortality rate in 1990
Constant 4.444 * 6.316 * 145.116 * 244.727 *(0.558) (0.592) (24.682) (28.754)
Per capita GDP (1990) 0.000 ** 0.000 ** -0.001 -0.001(0.000) (0.000) (0.001) (0.001)
Male total years of schooling (1990) 0.136 -0.118 ** 2.131 -10.388 *(0.136) (0.059) (6.455) (2.653)
Female total years of schooling (1990) -0.358 * -18.102 *(0.130) (6.259)
Female/male ratio of total years of schooling (1990) -2.619 * -142.377 *(0.496) (29.264)
Sub-Saharan Africa 2.240 * 2.051 * 57.951 * 49.771 *(0.497) (0.480) (20.266) (18.785)
Latin America & Caribbean 0.512 0.650 *** -4.874 4.360(0.355) (0.332) (14.095) (13.087)
South Asia 0.672 0.461 7.287 -4.088(0.572) (0.535) (19.124) (18.548)
OECD 0.301 0.219 10.927 6.137(0.385) (0.345) (15.189) (12.595)
Middle East & North Africa 1.581 * 1.406 * -8.985 -18.826(0.472) (0.466) (16.724) (16.499)
Europe & Central Asia -0.337 -0.496 22.963 14.316(0.405) (0.380) (14.576) (12.700)
No. of observations 105 105 109 109Adjusted R-squared 0.810 0.834 0.707 0.762* significant at 1%, ** significant at 5%, *** significant at 10%, standard errors in parenthesesOmitted region is East Asia and the Pacific.
Fertility Child MortalityEquation 1 Equation 2 Equation 3 Equation 4

36
Table 6a: Impact on Fertility and Child Mortality Rates of Gender Parity in Education, Country Effects,Using Female/Male Ratio of Total Years of Schooling
RevisedCountry Ranking
Cameroon 2 -0.1 -0.1 0.0 -0.2 -0.2 -0.1 -2.9 -4.0 -1.7 -9.1 -12.7 -5.4Congo, Dem. Rep. 2 0.0 -0.1 0.0 -0.1 -0.2 -0.1 -2.6 -3.6 -1.5 -6.1 -8.5 -3.6Congo, Rep. 2 -0.1 -0.1 -0.1 -0.2 -0.3 -0.1 -4.7 -6.7 -2.8 -12.3 -17.2 -7.3Gambia, The ** 2 .. .. .. .. .. .. .. .. .. .. .. ..Ghana 2 0.0 0.0 0.0 0.0 0.0 0.0 -0.6 -0.9 -0.4 0.7 1.0 0.4Guatemala 2 0.0 0.0 0.0 -0.1 -0.1 0.0 -1.6 -2.3 -1.0 -4.0 -5.6 -2.4Nepal ** 2 .. .. .. .. .. .. .. .. .. .. .. ..Papua New Guinea 2 0.0 0.0 0.0 0.0 0.0 0.0 -1.0 -1.4 -0.6 0.2 0.3 0.1Sierra Leone ** 2 .. .. .. .. .. .. .. .. .. .. .. ..Turkey 2 -0.1 -0.1 0.0 -0.2 -0.3 -0.1 -4.1 -5.8 -2.5 -11.1 -15.6 -6.6Uganda 2 0.0 0.0 0.0 0.0 0.0 0.0 -1.0 -1.5 -0.6 -0.4 -0.5 -0.2Zambia 2 0.0 0.0 0.0 0.0 0.0 0.0 -0.6 -0.9 -0.4 -0.1 -0.1 -0.1Benin 3 -0.1 -0.2 -0.1 -0.4 -0.5 -0.2 -7.5 -10.5 -4.5 -19.6 -27.5 -11.7Central African Republic 3 -0.1 -0.1 -0.1 -0.3 -0.5 -0.2 -5.4 -7.6 -3.2 -18.9 -26.5 -11.3Guinea-Bissau 3 -0.3 -0.4 -0.2 -0.5 -0.6 -0.3 -16.5 -23.1 -9.8 -24.8 -34.8 -14.8India 3 -0.1 -0.1 0.0 -0.1 -0.2 -0.1 -3.4 -4.7 -2.0 -7.1 -9.9 -4.2Liberia ** 3 .. .. .. .. .. .. .. .. .. .. .. ..Mali 3 -0.3 -0.4 -0.2 -0.5 -0.6 -0.3 -13.9 -19.5 -8.3 -25.7 -36.1 -15.4Mozambique 3 -0.2 -0.3 -0.1 -0.3 -0.5 -0.2 -12.3 -17.2 -7.3 -19.0 -26.6 -11.3Niger 3 -0.1 -0.1 -0.1 -0.2 -0.2 -0.1 -4.6 -6.5 -2.8 -8.4 -11.7 -5.0Pakistan 3 0.0 0.0 0.0 0.0 0.0 0.0 -1.1 -1.6 -0.7 1.6 2.2 1.0Senegal 3 0.0 -0.1 0.0 0.0 0.0 0.0 -2.1 -2.9 -1.3 -0.5 -0.7 -0.3Togo 3 -0.1 -0.1 -0.1 -0.3 -0.3 -0.2 -5.2 -7.3 -3.1 -13.8 -19.4 -8.3Afghanistan 4 -0.4 -0.6 -0.3 -0.6 -0.8 -0.4 -23.9 -33.5 -14.3 -32.3 -45.2 -19.3Iraq 4 -0.1 -0.2 -0.1 -0.4 -0.6 -0.3 -7.0 -9.8 -4.2 -22.6 -31.7 -13.5
** In these countries, the target attainment for females is indistinguishable or even smaller than the projected attainment. This is due to huge jumps in enrolments in the late 1990sand consequent high imputed growth rates in enrolments. Once these are extrapolated to 2005 (or 2015), they suggest no gender gaps and associated costs. Thus, we do not estimate costs for these countries. But since we question the accuracy of the latest enrolment figures as well as the extrapolation of high enrolment growth, we believethat the costs will be similar to other countries' in the same rank.
95% Confidence Interval 95% Confidence Interval95% Confidence Interval2005 2015
95% Confidence Interval
Fertility Impact Child Mortality Impact2005 2015

37
Table 6b: Impact on Fertility and Child Mortality Rates of Gender Parity in Education, Country Effects,Using Female Total Years of Schooling
RevisedCountry Ranking
Cameroon 2 0.0 0.0 0.0 -0.1 -0.1 0.0 -1.4 -2.3 -0.4 -3.9 -6.5 -1.3Congo, Dem. Rep. 2 0.0 0.0 0.0 0.0 -0.1 0.0 -1.1 -1.8 -0.4 -1.7 -2.8 -0.5Congo, Rep. 2 -0.1 -0.1 0.0 -0.1 -0.2 0.0 -3.1 -5.1 -1.0 -6.4 -10.8 -2.1Gambia, The ** 2 .. .. .. .. .. .. .. .. .. .. .. ..Ghana 2 0.0 0.0 0.0 0.0 0.0 0.0 -0.5 -0.8 -0.2 0.6 1.0 0.2Guatemala 2 0.0 0.0 0.0 -0.1 -0.1 0.0 -0.8 -1.4 -0.3 -2.5 -4.2 -0.8Nepal ** 2 .. .. .. .. .. .. .. .. .. .. .. ..Papua New Guinea 2 0.0 0.0 0.0 0.0 0.0 0.0 -0.5 -0.8 -0.1 0.1 0.2 0.0Sierra Leone ** 2 .. .. .. .. .. .. .. .. .. .. .. ..Turkey 2 -0.1 -0.1 0.0 -0.2 -0.3 -0.1 -3.1 -5.3 -1.0 -9.0 -15.1 -2.9Uganda 2 0.0 0.0 0.0 0.0 0.0 0.0 -0.6 -1.0 -0.2 -0.2 -0.4 -0.1Zambia 2 0.0 0.0 0.0 0.0 0.0 0.0 -0.5 -0.8 -0.1 -0.1 -0.1 0.0Benin 3 -0.1 -0.1 0.0 -0.2 -0.4 -0.1 -3.5 -5.8 -1.1 -11.7 -19.6 -3.8Central African Republic 3 0.0 -0.1 0.0 -0.1 -0.2 0.0 -2.0 -3.4 -0.7 -5.8 -9.8 -1.9Guinea-Bissau 3 -0.1 -0.1 0.0 -0.2 -0.3 -0.1 -3.3 -5.5 -1.1 -9.5 -15.9 -3.1India 3 -0.1 -0.1 0.0 -0.1 -0.2 0.0 -2.6 -4.4 -0.9 -5.6 -9.4 -1.8Liberia ** 3 .. .. .. .. .. .. .. .. .. .. .. ..Mali 3 -0.1 -0.1 0.0 -0.2 -0.4 -0.1 -3.4 -5.7 -1.1 -11.8 -19.7 -3.8Mozambique 3 -0.1 -0.1 0.0 -0.1 -0.2 0.0 -2.7 -4.5 -0.9 -6.0 -10.1 -1.9Niger 3 0.0 0.0 0.0 0.0 -0.1 0.0 -0.8 -1.4 -0.3 -1.6 -2.6 -0.5Pakistan 3 0.0 0.0 0.0 0.0 0.0 0.0 -0.8 -1.3 -0.3 1.4 2.3 0.4Senegal 3 0.0 0.0 0.0 0.0 0.0 0.0 -0.9 -1.5 -0.3 -0.2 -0.4 -0.1Togo 3 -0.1 -0.1 0.0 -0.2 -0.3 -0.1 -3.2 -5.3 -1.0 -9.5 -15.9 -3.0Afghanistan 4 -0.2 -0.4 -0.1 -0.5 -0.8 -0.1 -11.4 -19.2 -3.7 -23.6 -39.6 -7.6Iraq 4 -0.1 -0.1 0.0 -0.2 -0.4 -0.1 -3.6 -6.1 -1.2 -10.7 -17.9 -3.4
** In these countries, the target attainment for females is indistinguishable or even smaller than the projected attainment. This is due to huge jumps in enrolments in the late 1990sand consequent high imputed growth rates in enrolments. Once these are extrapolated to 2005 (or 2015), they suggest no gender gaps and associated costs. Thus, we do not estimate costs for these countries. But since we question the accuracy of the latest enrolment figures as well as the extrapolation of high enrolment growth, we believethat the costs will be similar to other countries' in the same rank.
95% Confidence Interval 95% Confidence Interval 95% Confidence Interval 95% Confidence Interval
Fertility Impact Child Mortality Impact2005 2015 2005 2015
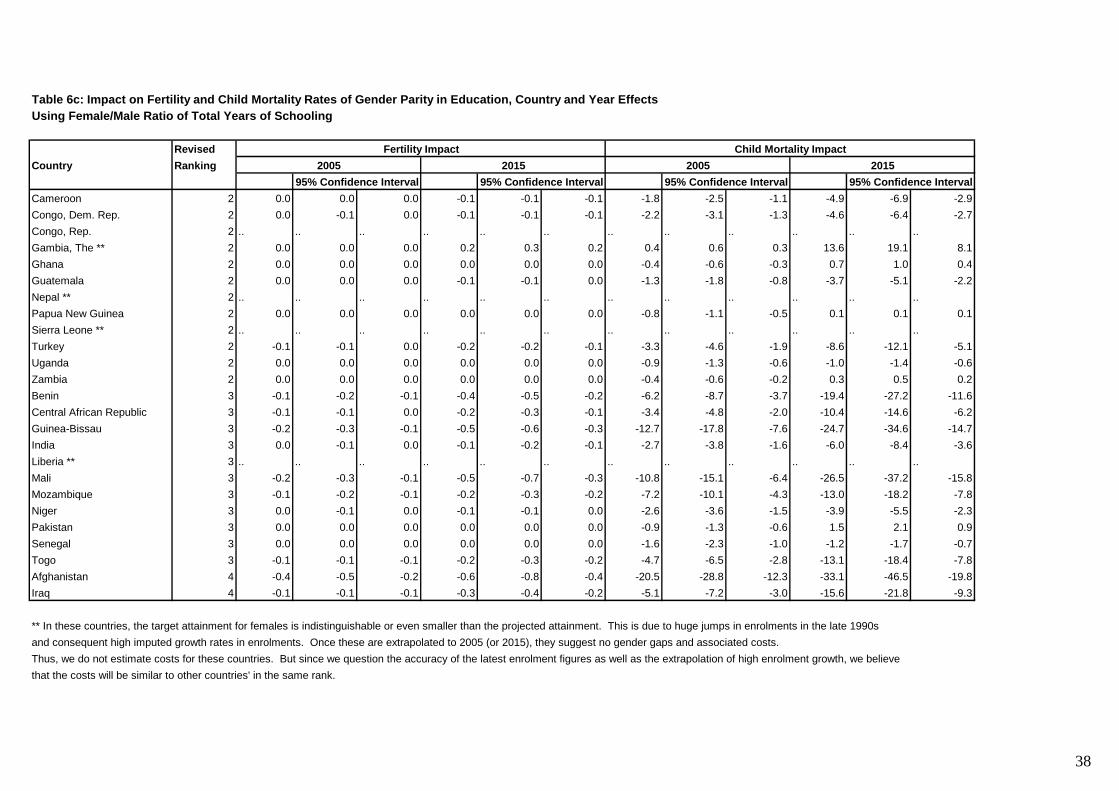
38
Table 6c: Impact on Fertility and Child Mortality Rates of Gender Parity in Education, Country and Year EffectsUsing Female/Male Ratio of Total Years of Schooling
RevisedCountry Ranking
Cameroon 2 0.0 0.0 0.0 -0.1 -0.1 -0.1 -1.8 -2.5 -1.1 -4.9 -6.9 -2.9Congo, Dem. Rep. 2 0.0 -0.1 0.0 -0.1 -0.1 -0.1 -2.2 -3.1 -1.3 -4.6 -6.4 -2.7Congo, Rep. 2 .. .. .. .. .. .. .. .. .. .. .. ..Gambia, The ** 2 0.0 0.0 0.0 0.2 0.3 0.2 0.4 0.6 0.3 13.6 19.1 8.1Ghana 2 0.0 0.0 0.0 0.0 0.0 0.0 -0.4 -0.6 -0.3 0.7 1.0 0.4Guatemala 2 0.0 0.0 0.0 -0.1 -0.1 0.0 -1.3 -1.8 -0.8 -3.7 -5.1 -2.2Nepal ** 2 .. .. .. .. .. .. .. .. .. .. .. ..Papua New Guinea 2 0.0 0.0 0.0 0.0 0.0 0.0 -0.8 -1.1 -0.5 0.1 0.1 0.1Sierra Leone ** 2 .. .. .. .. .. .. .. .. .. .. .. ..Turkey 2 -0.1 -0.1 0.0 -0.2 -0.2 -0.1 -3.3 -4.6 -1.9 -8.6 -12.1 -5.1Uganda 2 0.0 0.0 0.0 0.0 0.0 0.0 -0.9 -1.3 -0.6 -1.0 -1.4 -0.6Zambia 2 0.0 0.0 0.0 0.0 0.0 0.0 -0.4 -0.6 -0.2 0.3 0.5 0.2Benin 3 -0.1 -0.2 -0.1 -0.4 -0.5 -0.2 -6.2 -8.7 -3.7 -19.4 -27.2 -11.6Central African Republic 3 -0.1 -0.1 0.0 -0.2 -0.3 -0.1 -3.4 -4.8 -2.0 -10.4 -14.6 -6.2Guinea-Bissau 3 -0.2 -0.3 -0.1 -0.5 -0.6 -0.3 -12.7 -17.8 -7.6 -24.7 -34.6 -14.7India 3 0.0 -0.1 0.0 -0.1 -0.2 -0.1 -2.7 -3.8 -1.6 -6.0 -8.4 -3.6Liberia ** 3 .. .. .. .. .. .. .. .. .. .. .. ..Mali 3 -0.2 -0.3 -0.1 -0.5 -0.7 -0.3 -10.8 -15.1 -6.4 -26.5 -37.2 -15.8Mozambique 3 -0.1 -0.2 -0.1 -0.2 -0.3 -0.2 -7.2 -10.1 -4.3 -13.0 -18.2 -7.8Niger 3 0.0 -0.1 0.0 -0.1 -0.1 0.0 -2.6 -3.6 -1.5 -3.9 -5.5 -2.3Pakistan 3 0.0 0.0 0.0 0.0 0.0 0.0 -0.9 -1.3 -0.6 1.5 2.1 0.9Senegal 3 0.0 0.0 0.0 0.0 0.0 0.0 -1.6 -2.3 -1.0 -1.2 -1.7 -0.7Togo 3 -0.1 -0.1 -0.1 -0.2 -0.3 -0.2 -4.7 -6.5 -2.8 -13.1 -18.4 -7.8Afghanistan 4 -0.4 -0.5 -0.2 -0.6 -0.8 -0.4 -20.5 -28.8 -12.3 -33.1 -46.5 -19.8Iraq 4 -0.1 -0.1 -0.1 -0.3 -0.4 -0.2 -5.1 -7.2 -3.0 -15.6 -21.8 -9.3
** In these countries, the target attainment for females is indistinguishable or even smaller than the projected attainment. This is due to huge jumps in enrolments in the late 1990sand consequent high imputed growth rates in enrolments. Once these are extrapolated to 2005 (or 2015), they suggest no gender gaps and associated costs. Thus, we do not estimate costs for these countries. But since we question the accuracy of the latest enrolment figures as well as the extrapolation of high enrolment growth, we believethat the costs will be similar to other countries' in the same rank.
2015Fertility Impact Child Mortality Impact
2005 2015 200595% Confidence Interval 95% Confidence Interval 95% Confidence Interval 95% Confidence Interval
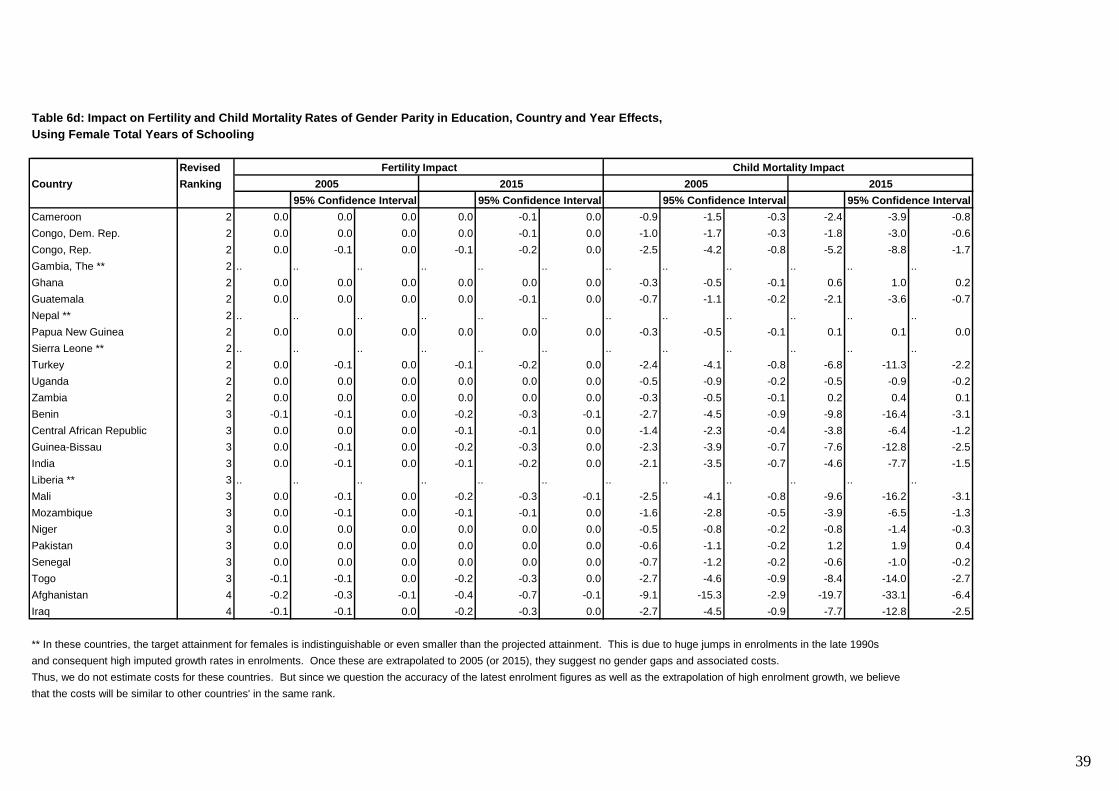
39
Table 6d: Impact on Fertility and Child Mortality Rates of Gender Parity in Education, Country and Year Effects,Using Female Total Years of Schooling
RevisedCountry Ranking
Cameroon 2 0.0 0.0 0.0 0.0 -0.1 0.0 -0.9 -1.5 -0.3 -2.4 -3.9 -0.8Congo, Dem. Rep. 2 0.0 0.0 0.0 0.0 -0.1 0.0 -1.0 -1.7 -0.3 -1.8 -3.0 -0.6Congo, Rep. 2 0.0 -0.1 0.0 -0.1 -0.2 0.0 -2.5 -4.2 -0.8 -5.2 -8.8 -1.7Gambia, The ** 2 .. .. .. .. .. .. .. .. .. .. .. ..Ghana 2 0.0 0.0 0.0 0.0 0.0 0.0 -0.3 -0.5 -0.1 0.6 1.0 0.2Guatemala 2 0.0 0.0 0.0 0.0 -0.1 0.0 -0.7 -1.1 -0.2 -2.1 -3.6 -0.7Nepal ** 2 .. .. .. .. .. .. .. .. .. .. .. ..Papua New Guinea 2 0.0 0.0 0.0 0.0 0.0 0.0 -0.3 -0.5 -0.1 0.1 0.1 0.0Sierra Leone ** 2 .. .. .. .. .. .. .. .. .. .. .. ..Turkey 2 0.0 -0.1 0.0 -0.1 -0.2 0.0 -2.4 -4.1 -0.8 -6.8 -11.3 -2.2Uganda 2 0.0 0.0 0.0 0.0 0.0 0.0 -0.5 -0.9 -0.2 -0.5 -0.9 -0.2Zambia 2 0.0 0.0 0.0 0.0 0.0 0.0 -0.3 -0.5 -0.1 0.2 0.4 0.1Benin 3 -0.1 -0.1 0.0 -0.2 -0.3 -0.1 -2.7 -4.5 -0.9 -9.8 -16.4 -3.1Central African Republic 3 0.0 0.0 0.0 -0.1 -0.1 0.0 -1.4 -2.3 -0.4 -3.8 -6.4 -1.2Guinea-Bissau 3 0.0 -0.1 0.0 -0.2 -0.3 0.0 -2.3 -3.9 -0.7 -7.6 -12.8 -2.5India 3 0.0 -0.1 0.0 -0.1 -0.2 0.0 -2.1 -3.5 -0.7 -4.6 -7.7 -1.5Liberia ** 3 .. .. .. .. .. .. .. .. .. .. .. ..Mali 3 0.0 -0.1 0.0 -0.2 -0.3 -0.1 -2.5 -4.1 -0.8 -9.6 -16.2 -3.1Mozambique 3 0.0 -0.1 0.0 -0.1 -0.1 0.0 -1.6 -2.8 -0.5 -3.9 -6.5 -1.3Niger 3 0.0 0.0 0.0 0.0 0.0 0.0 -0.5 -0.8 -0.2 -0.8 -1.4 -0.3Pakistan 3 0.0 0.0 0.0 0.0 0.0 0.0 -0.6 -1.1 -0.2 1.2 1.9 0.4Senegal 3 0.0 0.0 0.0 0.0 0.0 0.0 -0.7 -1.2 -0.2 -0.6 -1.0 -0.2Togo 3 -0.1 -0.1 0.0 -0.2 -0.3 0.0 -2.7 -4.6 -0.9 -8.4 -14.0 -2.7Afghanistan 4 -0.2 -0.3 -0.1 -0.4 -0.7 -0.1 -9.1 -15.3 -2.9 -19.7 -33.1 -6.4Iraq 4 -0.1 -0.1 0.0 -0.2 -0.3 0.0 -2.7 -4.5 -0.9 -7.7 -12.8 -2.5
** In these countries, the target attainment for females is indistinguishable or even smaller than the projected attainment. This is due to huge jumps in enrolments in the late 1990sand consequent high imputed growth rates in enrolments. Once these are extrapolated to 2005 (or 2015), they suggest no gender gaps and associated costs. Thus, we do not estimate costs for these countries. But since we question the accuracy of the latest enrolment figures as well as the extrapolation of high enrolment growth, we believethat the costs will be similar to other countries' in the same rank.
Fertility Impact Child Mortality Impact2005 2015 2005 2015
95% Confidence Interval 95% Confidence Interval 95% Confidence Interval 95% Confidence Interval

40
Table 7a: Impact on Fertility and Child Mortality Rates of Gender Parity in Education, Country Effects, Sensitivity Analysis (Schultz, 1994)
RevisedCountry Ranking
Cameroon 2 0.0 0.0 0.0 -0.1 -0.1 -0.1 -0.1 -0.1 0.0 -0.1 -0.2 -0.1 -0.9 -0.5 -1.4 -2.6 -1.5 -3.8Congo, Dem. Rep. 2 0.0 0.0 0.0 0.0 -0.1 0.0 -0.1 -0.1 0.0 -0.1 -0.1 -0.1 -0.7 -0.4 -1.1 -1.1 -0.6 -1.6Congo, Rep. 2 -0.1 -0.1 -0.1 -0.2 -0.2 -0.1 -0.1 -0.2 -0.1 -0.3 -0.4 -0.2 na na na na na naGambia, The ** 2 .. .. .. .. .. .. .. .. .. .. .. .. na na na na na naGhana 2 0.0 0.0 0.0 0.0 0.0 0.0 0.0 0.0 0.0 0.0 0.0 0.0 -0.3 -0.2 -0.5 0.4 0.2 0.6Guatemala 2 0.0 0.0 0.0 -0.1 -0.1 0.0 0.0 0.0 0.0 -0.1 -0.1 -0.1 -0.6 -0.4 -0.9 -1.9 -1.1 -2.8Nepal ** 2 .. .. .. .. .. .. .. .. .. .. .. .. .. .. .. .. .. ..Papua New Guinea 2 0.0 0.0 0.0 0.0 0.0 0.0 0.0 0.0 0.0 0.0 0.0 0.0 -0.3 -0.2 -0.5 0.1 0.0 0.1Sierra Leone ** 2 .. .. .. .. .. .. .. .. .. .. .. .. .. .. .. .. .. ..Turkey 2 0.0 0.0 0.0 -0.1 -0.1 -0.1 -0.1 -0.1 0.0 -0.2 -0.2 -0.1 -2.4 -1.3 -3.5 -6.9 -3.8 -9.9Uganda 2 0.0 0.0 0.0 0.0 0.0 0.0 0.0 0.0 0.0 0.0 0.0 0.0 -0.4 -0.2 -0.6 -0.2 -0.1 -0.2Zambia 2 0.0 0.0 0.0 0.0 0.0 0.0 0.0 0.0 0.0 0.0 0.0 0.0 -0.3 -0.2 -0.4 0.0 0.0 -0.1Benin 3 -0.1 -0.1 -0.1 -0.3 -0.4 -0.2 -0.2 -0.2 -0.1 -0.5 -0.7 -0.3 -2.4 -1.3 -3.4 -8.0 -4.4 -11.5Central African Republic 3 0.0 -0.1 0.0 -0.1 -0.2 -0.1 -0.1 -0.1 0.0 -0.2 -0.3 -0.1 -1.4 -0.8 -2.0 -4.0 -2.2 -5.7Guinea-Bissau 3 -0.1 -0.1 -0.1 -0.3 -0.3 -0.2 -0.1 -0.2 -0.1 -0.4 -0.6 -0.3 -2.0 -1.1 -2.9 -5.9 -3.3 -8.6India 3 0.0 -0.1 0.0 -0.1 -0.1 -0.1 -0.1 -0.1 0.0 -0.1 -0.2 -0.1 -1.9 -1.1 -2.8 -4.0 -2.2 -5.8Liberia ** 3 .. .. .. .. .. .. .. .. .. .. .. .. .. .. .. .. .. ..Mali 3 -0.1 -0.1 -0.1 -0.4 -0.5 -0.2 -0.2 -0.2 -0.1 -0.6 -0.8 -0.4 -2.1 -1.1 -3.0 -7.2 -4.0 -10.4Mozambique 3 -0.1 -0.1 0.0 -0.2 -0.2 -0.1 -0.1 -0.1 -0.1 -0.2 -0.3 -0.2 -1.7 -1.0 -2.5 -3.9 -2.1 -5.6Niger 3 0.0 0.0 0.0 -0.1 -0.1 0.0 0.0 -0.1 0.0 -0.1 -0.1 -0.1 -0.5 -0.3 -0.7 -0.9 -0.5 -1.4Pakistan 3 0.0 0.0 0.0 0.0 0.0 0.0 0.0 0.0 0.0 0.1 0.1 0.0 -0.6 -0.3 -0.8 1.0 0.5 1.4Senegal 3 0.0 0.0 0.0 0.0 0.0 0.0 0.0 0.0 0.0 0.0 0.0 0.0 -0.6 -0.3 -0.9 -0.2 -0.1 -0.2Togo 3 -0.1 -0.1 -0.1 -0.2 -0.3 -0.2 -0.1 -0.2 -0.1 -0.4 -0.5 -0.2 -2.2 -1.2 -3.1 -6.5 -3.6 -9.4Afghanistan 4 -0.4 -0.5 -0.2 -0.7 -1.0 -0.5 -0.6 -0.8 -0.4 -1.2 -1.6 -0.7 -6.6 -3.7 -9.5 -13.6 -7.5 -19.7Iraq 4 -0.1 -0.1 -0.1 -0.2 -0.3 -0.2 -0.1 -0.2 -0.1 -0.4 -0.5 -0.2 -2.6 -1.4 -3.7 -7.5 -4.2 -10.9** In these countries, the target attainment for females is indistinguishable or even smaller than the projected attainment. This is due to huge jumps in enrolments in the late 1990sand consequent high imputed growth rates in enrolments. Once these are extrapolated to 2005 (or 2015), they suggest no gender gaps and associated costs. Thus, we do not estimate costs for these countries. But since we question the accuracy of the latest enrolment figures as well as the extrapolation of high enrolment growth, we believethat the costs will be similar to other countries' in the same rank.
95% Confidence 95% Confidence95% Confidence 95% Confidence 95% Confidence 95% Confidence
Fertility Impact Child Mortality Impact
2005 2015Pooled Regression
2005 2015Fixed Effects Regression
2005 2015
Interval IntervalInterval Interval Interval Interval
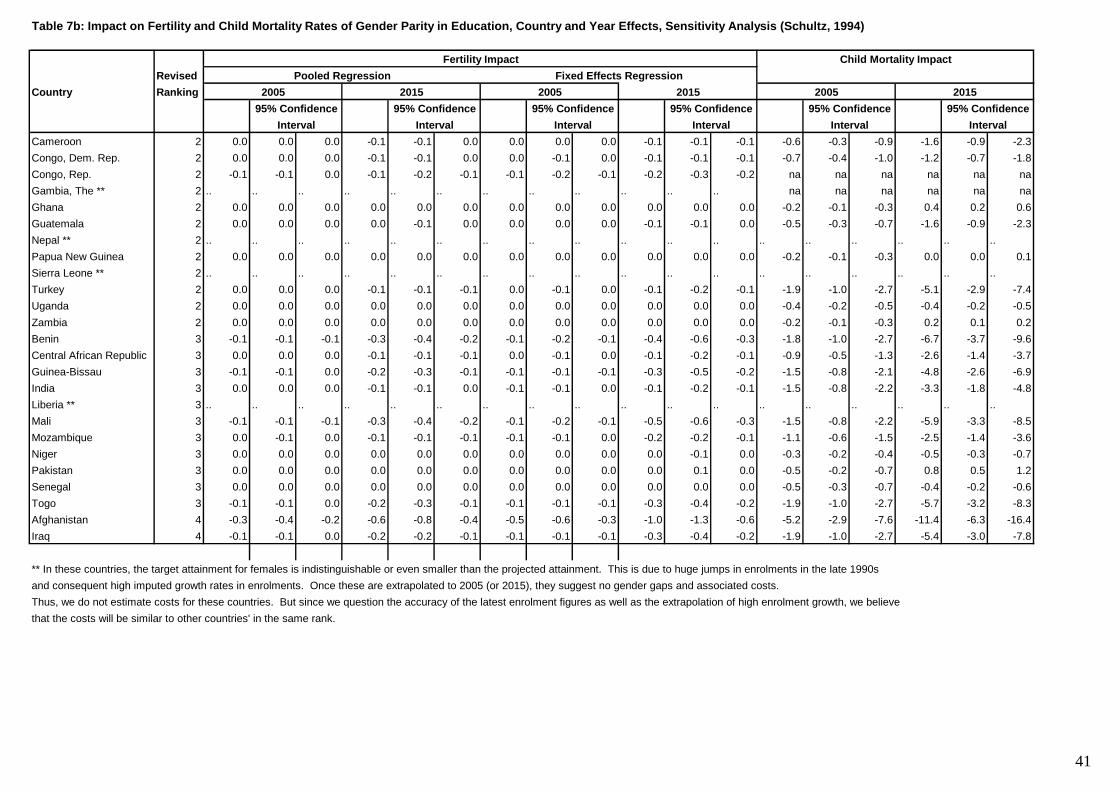
41
Table 7b: Impact on Fertility and Child Mortality Rates of Gender Parity in Education, Country and Year Effects, Sensitivity Analysis (Schultz, 1994)
RevisedCountry Ranking
Cameroon 2 0.0 0.0 0.0 -0.1 -0.1 0.0 0.0 0.0 0.0 -0.1 -0.1 -0.1 -0.6 -0.3 -0.9 -1.6 -0.9 -2.3Congo, Dem. Rep. 2 0.0 0.0 0.0 -0.1 -0.1 0.0 0.0 -0.1 0.0 -0.1 -0.1 -0.1 -0.7 -0.4 -1.0 -1.2 -0.7 -1.8Congo, Rep. 2 -0.1 -0.1 0.0 -0.1 -0.2 -0.1 -0.1 -0.2 -0.1 -0.2 -0.3 -0.2 na na na na na naGambia, The ** 2 .. .. .. .. .. .. .. .. .. .. .. .. na na na na na naGhana 2 0.0 0.0 0.0 0.0 0.0 0.0 0.0 0.0 0.0 0.0 0.0 0.0 -0.2 -0.1 -0.3 0.4 0.2 0.6Guatemala 2 0.0 0.0 0.0 0.0 -0.1 0.0 0.0 0.0 0.0 -0.1 -0.1 0.0 -0.5 -0.3 -0.7 -1.6 -0.9 -2.3Nepal ** 2 .. .. .. .. .. .. .. .. .. .. .. .. .. .. .. .. .. ..Papua New Guinea 2 0.0 0.0 0.0 0.0 0.0 0.0 0.0 0.0 0.0 0.0 0.0 0.0 -0.2 -0.1 -0.3 0.0 0.0 0.1Sierra Leone ** 2 .. .. .. .. .. .. .. .. .. .. .. .. .. .. .. .. .. ..Turkey 2 0.0 0.0 0.0 -0.1 -0.1 -0.1 0.0 -0.1 0.0 -0.1 -0.2 -0.1 -1.9 -1.0 -2.7 -5.1 -2.9 -7.4Uganda 2 0.0 0.0 0.0 0.0 0.0 0.0 0.0 0.0 0.0 0.0 0.0 0.0 -0.4 -0.2 -0.5 -0.4 -0.2 -0.5Zambia 2 0.0 0.0 0.0 0.0 0.0 0.0 0.0 0.0 0.0 0.0 0.0 0.0 -0.2 -0.1 -0.3 0.2 0.1 0.2Benin 3 -0.1 -0.1 -0.1 -0.3 -0.4 -0.2 -0.1 -0.2 -0.1 -0.4 -0.6 -0.3 -1.8 -1.0 -2.7 -6.7 -3.7 -9.6Central African Republic 3 0.0 0.0 0.0 -0.1 -0.1 -0.1 0.0 -0.1 0.0 -0.1 -0.2 -0.1 -0.9 -0.5 -1.3 -2.6 -1.4 -3.7Guinea-Bissau 3 -0.1 -0.1 0.0 -0.2 -0.3 -0.1 -0.1 -0.1 -0.1 -0.3 -0.5 -0.2 -1.5 -0.8 -2.1 -4.8 -2.6 -6.9India 3 0.0 0.0 0.0 -0.1 -0.1 0.0 -0.1 -0.1 0.0 -0.1 -0.2 -0.1 -1.5 -0.8 -2.2 -3.3 -1.8 -4.8Liberia ** 3 .. .. .. .. .. .. .. .. .. .. .. .. .. .. .. .. .. ..Mali 3 -0.1 -0.1 -0.1 -0.3 -0.4 -0.2 -0.1 -0.2 -0.1 -0.5 -0.6 -0.3 -1.5 -0.8 -2.2 -5.9 -3.3 -8.5Mozambique 3 0.0 -0.1 0.0 -0.1 -0.1 -0.1 -0.1 -0.1 0.0 -0.2 -0.2 -0.1 -1.1 -0.6 -1.5 -2.5 -1.4 -3.6Niger 3 0.0 0.0 0.0 0.0 0.0 0.0 0.0 0.0 0.0 0.0 -0.1 0.0 -0.3 -0.2 -0.4 -0.5 -0.3 -0.7Pakistan 3 0.0 0.0 0.0 0.0 0.0 0.0 0.0 0.0 0.0 0.0 0.1 0.0 -0.5 -0.2 -0.7 0.8 0.5 1.2Senegal 3 0.0 0.0 0.0 0.0 0.0 0.0 0.0 0.0 0.0 0.0 0.0 0.0 -0.5 -0.3 -0.7 -0.4 -0.2 -0.6Togo 3 -0.1 -0.1 0.0 -0.2 -0.3 -0.1 -0.1 -0.1 -0.1 -0.3 -0.4 -0.2 -1.9 -1.0 -2.7 -5.7 -3.2 -8.3Afghanistan 4 -0.3 -0.4 -0.2 -0.6 -0.8 -0.4 -0.5 -0.6 -0.3 -1.0 -1.3 -0.6 -5.2 -2.9 -7.6 -11.4 -6.3 -16.4Iraq 4 -0.1 -0.1 0.0 -0.2 -0.2 -0.1 -0.1 -0.1 -0.1 -0.3 -0.4 -0.2 -1.9 -1.0 -2.7 -5.4 -3.0 -7.8
** In these countries, the target attainment for females is indistinguishable or even smaller than the projected attainment. This is due to huge jumps in enrolments in the late 1990sand consequent high imputed growth rates in enrolments. Once these are extrapolated to 2005 (or 2015), they suggest no gender gaps and associated costs. Thus, we do not estimate costs for these countries. But since we question the accuracy of the latest enrolment figures as well as the extrapolation of high enrolment growth, we believethat the costs will be similar to other countries' in the same rank.
95% Confidence 95% Confidence95% Confidence 95% Confidence 95% Confidence 95% Confidence
Child Mortality Impact
2005 20152005 2015
Fertility Impact
2005 2015Pooled Regression Fixed Effects Regression
Interval IntervalInterval Interval Interval Interval

42
Table 8: Impact of Gender Parity in Education on Child Malnutrition (Smith and Haddad, 1999)
RevisedCountry Ranking
Angola * 2 -0.5 -0.8 -0.1 .. .. ..Burundi * 2 -0.1 -0.2 0.0 .. .. ..Cambodia 2 -0.8 -1.4 -0.2 -0.2 -0.3 0.0Cameroon 2 -0.4 -0.7 -0.1 -0.1 -0.1 0.0Comoros * 2 -0.2 -0.3 0.0 .. .. ..Congo, Dem. Rep. 2 -1.5 -2.6 -0.4 -1.0 -1.7 -0.3Congo, Rep. 2 -2.4 -4.2 -0.6 -2.0 -3.4 -0.5Djibouti * 2 .. .. .. .. .. ..Gambia, The * 2 -0.2 -0.3 0.0 .. .. ..Ghana * 2 -0.4 -0.7 -0.1 .. .. ..Guatemala 2 -0.9 -1.6 -0.2 -1.3 -2.2 -0.3Lao PDR 2 -2.0 -3.5 -0.5 -1.4 -2.4 -0.3Mauritania * 2 -0.2 -0.3 0.0 .. .. ..Morocco 2 -1.1 -1.9 -0.3 -0.4 -0.8 -0.1Nepal * 2 .. .. .. .. .. ..Nigeria * 2 -0.4 -0.7 -0.1 .. .. ..Papua New Guinea * 2 -0.6 -1.1 -0.2 .. .. ..Sierra Leone * 2 .. .. .. .. .. ..Solomon Islands 2 -1.6 -2.7 -0.4 -1.9 -3.4 -0.5Turkey 2 -3.0 -5.1 -0.8 -2.1 -3.6 -0.5Uganda 2 -0.9 -1.5 -0.2 -0.6 -1.1 -0.2Zambia * 2 -0.2 -0.4 -0.1 1.3 2.2 0.3Benin 3 -3.8 -6.7 -1.0 -6.4 -11.2 -1.6Burkina Faso 3 -0.7 -1.2 -0.2 -0.4 -0.6 -0.1Central African Republic 3 -0.9 -1.6 -0.2 -0.6 -1.0 -0.2Cote d'Ivoire 3 -1.9 -3.3 -0.5 -1.4 -2.5 -0.4Guinea-Bissau 3 -2.8 -4.9 -0.7 -4.3 -7.5 -1.1India 3 -2.6 -4.6 -0.7 -1.5 -2.6 -0.4Liberia * 3 .. .. .. .. .. ..Mali 3 -2.9 -5.1 -0.8 -7.0 -12.2 -1.8Mozambique 3 -0.9 -1.6 -0.2 -0.5 -0.9 -0.1Niger * 3 -0.1 -0.2 0.0 .. .. ..Pakistan * 3 -1.3 -2.3 -0.3 .. .. ..Senegal 3 -1.0 -1.8 -0.3 -0.2 -0.3 0.0Togo 3 -5.0 -8.7 -1.3 -4.5 -7.9 -1.2Yemen, Rep. * 3 -3.3 -5.7 -0.8 .. .. ..Afghanistan 4 -14.1 -24.5 -3.6 -3.9 -6.9 -1.0Chad 4 -2.4 -4.1 -0.6 -2.5 -4.3 -0.6Eritrea 4 -4.0 -7.0 -1.0 -7.3 -12.7 -1.9Ethiopia 4 -0.2 -0.4 -0.1 -0.1 -0.2 0.0Guinea 4 -2.6 -4.6 -0.7 -3.5 -6.2 -0.9Iraq 4 -2.7 -4.8 -0.7 -2.3 -4.1 -0.6Lithuania 4 -9.3 -16.2 -2.4 -11.8 -20.6 -3.0Somalia 4 -0.5 -0.8 -0.1 -0.4 -0.7 -0.1Tajikistan 4 -2.7 -4.7 -0.7 -3.2 -5.7 -0.8* These countries are projected to have higher female than male secondary enrolments either already by 2005 or by 2015,so it is not appropriate to report the costs of failing to achieve the gender equity goal.
Percentage Point Change in Prevalence of Underweight
95% Confidence Interval 95% Confidence Interval2005 2015

43
6. Bibliography Ahuja, V. and D. Filmer. 1995. “Educational Attainment in Developing Countries: New Estimates and Projections Disaggregated by Gender.” Policy Research Working Paper No. 1489, Background paper for World Development Report 1995, Washington, DC: the World Bank. Alderman, H., J. Behrman, S. Khan, D. Ross and R. Sabot. 1995. “Public Schooling in Rural Pakistan: Efficiently Targeting Girls in a Lagging Region” in D. Van de Walle and K. Nead (editors) Public Spending and the Poor, Baltimore: Johns Hopkins Press. Alderman, H., J. Behrman, D. Ross, and R. Sabot. 1996. “Decomposing the Gender Gap in Cognitive Skills in a Poor Rural Economy” Journal of Human Resources 31: 229-54. Appiah, E. N. and W. McMahon. 2002. “The Social Outcomes of Education and Feedbacks on Growth in Africa” Journal of Development Studies 38: 27-68. Asian Development Bank. 1997. Emerging Asia. Manila: Asian Development Bank. Baliga, S., S. Goyal, and S. Klasen. 1999. “Education and Marriage Age: Theory and Evidence” Department of Economics, University of Munich Discussion Papers, Munich. Bardhan, K. and S. Klasen. 1999. “UNDP’s Gender Related Indices: A Critical Review” World Development 27: 985-1010. -----. 2000. “On UNDP’s Revisions to the Gender-Related Development Index” Journal of Human Development 1: 191-195. Barro, R. 1991. “Economic Growth in a Cross-Section of Countries” Quarterly Journal of Economics 106: 407-443. Barro, R. and J. Lee. 1996. “International Measures of Educational Achievement” American Economic Review 86: 218-223. Barro, R. and X. Sala-i-Martin 1995. Economic Growth. New York, NY: McGraw-Hill. Becker, G. 1991. A Treatise on the Family. Cambridge, MA: Harvard University Press. Bellew, R. T. and E. M. King. 1993. "Educating Women: Lessons from Experience." In Elizabeth King and Anne Hill (editors) Women's Education in Developing Countries: Barriers, Benefits and Policies. Baltimore: Johns Hopkins University Press. Bloom, D. and J. Williamson. 1998. “Demographic Transition and Economic Miracles in Emerging Asia.” World Bank Economic Review 12: 419-455. Bruno, M., L. Squire, and M. Ravallion. 1996. “Equity and Growth in Developing Countries.” Policy Research Working Paper No. 1563. Washington, DC: The World Bank. Bruns, B. and A. Mingat 2002. The Chance for Every Child: Achieving Universal Primary Education by 2015. Washington, D.C: The World Bank. Devarajan, S. W. Easterly, and H. Pack. 2001. “Is Investment in Africa too High or too Low? Macro- and Micro- Evidence.” Journal of African Economies 10(0, Supplement 2, Sep 2001):81-108.
44
Dollar, D. and R. Gatti. 1999. “Gender Inequality, Income, and Growth: Are Good Times good for Women?” Mimeographed. Washington DC: The World Bank. Drèze, J. and A. Sen. 1989. Hunger and Public Action. New York: Clarendon Press. Filmer, D., E. M. King, and L. Pritchett. 1998. “Gender Disparity in South Asia: Comparisons between and within Countries.” Policy Research Working Paper 1867. World Bank, Development Research Group, Washington, D.C. Forbes, K. 2000. “A Reassessment of the Relationship between Inequality and Growth.” American Economic Review 90: 869-887. Galor, O. and D.N Weil. 1996. “The Gender Gap, Fertility, and Growth.” American Economic Review 86: 374-387. Gatti, R. 1999. “A Cross-Country Analysis of Fertility Determinants.” Mimeographed. Washington DC: The World Bank. Grün, C. und S. Klasen. 2000. “Growth, Inequality, and Well-Being: Comparisons Across Space and Time.” Mimeographed. Munich: University of Munich. Horton, S. 1999. “Marginalization Revisited: Women’s Market Work and Pay, and Economic Development.” World Development 27: 571-582. King, E. and A. Hill. 1993. Women’s Education in Developing Countries: Barriers, Benefits, and Policies. Baltimore: Johns Hopkins University Press. Klasen, S. 1999. “Does Gender Inequality Reduce Growth and Development? Evidence from Cross-Country Regressions.” World Bank Policy Research Report Working Paper No. 7. Washington, DC: The World Bank. ----------. 2002. “Does Gender Inequality in Education Reduce Growth and Development? Evidence from Cross-Country Regressions.” World Bank Economic Review (forthcoming). Klasen and Wink 2002. “Is there a Turning Point in Gender Bias in Mortality? An Update on the Number of ‘Missing Women’.” Population and Development Review (forthcoming). Knowles, S., P.K. Lorgelly, and P.D. Owen. 2002. “Are Educational Gender Gaps a Brake on Economic Development? Some Cross-Country Empirical Evidence.” Oxford Economic Papers 54: 118-149. Lagerlöf, N. 1999. “Gender Inequality, Fertility, and Growth.” Mimeographed. Department of Economics, University of Sydney. Lorgelly, P.K. and P.D. Owen. 1999. “The Effect of Female and Male Schooling on Economic Growth in the Barro-Lee Model.” Empirical Economics 24: 537-557. Mankiw, N.G., D. Roemer, and D. Weil. 1992. “A Contribution to the Empirics of Economic Growth.” Quarterly Journal of Economics 107: 407-437. Murthi, M., A-C. Guio, and J. Drèze. 1995. “Mortality, Fertility, and Gender Bias in India: A District-Level Analysis.” Population and Development Review 21: 745-782. Murthi, M. and J. Drèze. 2001. “Fertility, Education, and Development: Evidence from India.” Population and Development Review 27: 33-63. Pritchett, L. 2001. “Where Has All the Education Gone?” World Bank Economic Review 15: 367-391.

45
Pritchett, L. and L. Summers. 1996. “Wealthier is Healthier.” Journal of Human Resources 31: 841-868. Sachs, J. and M. Warner. 1995. “Natural Resource Abundance and Economic Growth.” National Bureau of Economic Research Working Paper No. 5398, Cambridge, MA. ----------. 1997. “Source of Slow Growth in African Economies.” Journal of African Economies. 6: 335-76. Schultz, T. P. 1994. “Human Capital, Family Planning, and their Effects on Population Growth.” American Economic Review 84: 255-260. ----------. 1997. “Demand for Children in Low Income Countries” in M. Rosenzweig and O. Stark (editors) Handbook of Population and Family Economics. Amsterdam: Elsevier. Seguino, S. 2000. “Gender Inequality and Economic Growth: A Cross-Country Analysis.” World Development 28: 1211-1230. Sen, A. 1999. Development as Freedom. New York: Knopf. Smith, L. and L. Haddad. 1999. “Explaining Child Malnutrition in Developing Countries.” International Food Policy Research Institute Research Report No. 111. Washington DC: International Food Policy Research Institute. Smith, L., U. Ramakrishnan, L. Haddad, R. Martorell, and A. Ndiaye. 2001. “The Importance of Women’s Status for Child Nutrition in Developing Countries.” Draft Policy Report. Washington DC: International Food Policy Research Institute. Standing, G. 1999. “Global Feminization Through Flexible Labor: A Theme Revisited.” World Development 27: 583-602. Subbarao, K. And L. Raney. 1995. “Social Gains from Female Education: A Cross-national study.” Economic Development and Cultural Change 44(1): 105-28. Summers, L. 1994. “Investing in All the People.” Washington DC: The World Bank. Taylor, A. 1998. “On the Costs of Inward-looking Development.” Journal of Economic History 58: 1-28. Thomas, D. 1990. “Intrahousehold Resource Allocation: An Inferential Approach.” Journal of Human Resources 25: 634-64. ----------. 1997. “Income, Expenditures, and Health Outcomes: Evidence on Intrahousehold Resource Allocation.” In L. Haddad, J. Hoddinott, and H. Alderman (editors) Intrahousehold Resource Allocation in Developing Countries: Models, Methods, and Policy. Baltimore: Johns Hopkins University Press. Tzannatos, Z. 1999. “Women and Labor Market Changes in the Global Economy.” World Development 27: 551-570. United Nations. 2000. “Millennium Declaration.” New York: United Nations. United Nations Development Programme. 1995. Human Development Report. New York: Oxford University Press. ----------. 1996. Human Development Report. New York: Oxford University Press. World Bank. 1993. World Development Report. New York: Oxford University Press.

46
----------. 2001. Engendering Development. Washington DC: The World Bank. ----------. 2002. Education and HIV/AIDS:A Window of Hope. Washington DC: the World Bank. Young, A. 1995. “The Tyranny of Numbers: Confronting the Statistical Realities of the East Asian Growth Experience.” Quarterly Journal of Economics 110(3): 641-680.