the costing of educational plans - unesdoc...
TRANSCRIPT

The costing of educational plans
J. Vaizey J. b. Chesswas
Unesco: International Institute for Educational Planning

Fundamentals of educational planning 6

Included in the series : *
1. What is Educational Planning ? P. H. Coombs
2. The Relation of Educational Plans to Economic and Social Planning R. Poignant
3. Educational Planning and H u m a n Resource Developnient F. Harbison
4. Planning and the Educational Administrator C. E. Beeby
5. The Social Context of Educational Planning C. A. Anderson
6. The Costing of Educational Plans J. Vaizey, J. D. Chesswas
* Also published in French Other titles to appear

Published in 1967 by the United Nations Educational, Scientific and Cultural Organization Place de Fontenoy, 75 Paris-7e Printed by Ilte, Turin Cover design by Bruno Pfaffli
Q Unesco 1967 IIEP.66/11.6/A Printed in Italy

Fundamentals of educational planning
The booklets in this series are written primarily for two groups: those engaged in- or preparing for-educational planning and administration, especially in developing countries; and others, less specialized, such as senior government officials and civic leaders, who seek a more general understanding of educational planning and of how it can be of help to over-all national development. They are devised to be of use either for self-study or in formal training programmes. The modern conception of educational planning has attracted
specialists from many disciplines. Each of them tends to see planning rather differently. The purpose of some of the booklets is to help these people explain their particular points of view to one another and to the younger men and women who are being trained to replace them some day. But behind this diversity there is a new and growing unity. Specialists and administrators in developing countries are coming to accept certain basic principles and practices that owe something to the separate disciplines but are yet a unique contri- bution to knowledge by a body of pioneers who have had to attack together educational problems more urgent and difficult than any the world had ever known. So other booklets in the series represent this common experience, and provide in short compass some of the best available ideas and experience concerning selected aspects of educational planning. Since readers will vary so widely in their backgrounds, the authors
have been given the difficult task of introducing their subjects from the beginning, explaining technical terms that may be commonplace to some but a mystery to others, and yet adhering to scholarly

Fundamentals of educational planning
standards and never writing down to their readers, who, except in some particular speciality, are in no sense unsophisticated. This approach has the advantage that it makes the booklets intelligible to the general reader. Although the series, under the general editorship of Dr. C. E. Beeby,
has been planned on a definite pattern, no attempt has been made to avoid differences, or even contradictions, in the views expressed by the authors. It would be premature, in the Institute’s view, to lay down a neat and tidy official doctrine in this new and rapidly evolving field of knowledge and practice. Thus, while the views are the respon- sibility of the authors, and may not always be shared by Unesco or the Institute, they are believed to warrant attention in the interna- tional market-place of ideas. In short, this seems the appropriate moment to make visible a cross-section of the opinions of authorities whose combined experience covers many disciplines and a high pro- portion of the countries of the world.

Foreword
John Vaizey is professor of economics at Brunel University, London, Director of the Acton Society Trust, and a member of the Institute’s Council of Consultant Fellows. He has taken an active part in many conferences and meetings on educational planning organized by Unesco and OECD, and has been a member of Unesco missions to developing countries. He is a member of the United Kingdom National Commission for Unesco. He is author of a large number of books and papers, and his ‘The Costs of Education’ and ‘The Eco- nomics of Education’ are standard works on the subjects. John Chesswas spent nineteen years in the education service of
Uganda; he spent a long time as Provincial Education Officer, Buganda, and finished as Officer in Charge of the Educational Planning Unit within the Ministry of Education. He is now an associate staff member of the Institute, and recently took part in one of its missions to Africa. These writers represent the two streams of experience that have
merged to create modern educational planning. The most prolific writers in this field, understandably, are men whose home base is a university or other institution in a developed country. Many of them have had extensive experience as advisers, consultants, or research workers in a variety of places, but, with few exceptions, it is a differ- ent group of men who have struggled, over a long period of years, with the day-to-day problems of administering and planning edu- cational systems in developing countries. Obviously, both groups have a great deal to offer to the theory
and practice of educational planning, and to the training of a new generation of planners whose experience should eventually be less

Foreword
patchy than that of the pioneers. This is the first booklet in the series to be published in what might be termed a ‘double-decker’ form, in order to present both points of view on a specific problem within two covers. The first essay is a generalized treatment of costing by an authority whose experience specially fits him for the task; the second is a description of the costing of plans as it actually occurred in a developing country. It is not, be it noted, simply a matter of confronting the ‘theorist’ and the ‘practical man’. Anyone reading John Vaizey’s contribution must sense the wealth of practical experience that lies behind it, and John Chesswas is no stranger to the theory of planning. What are being brought face to face here are two different kinds of experience. Nor is the second part designed to be, in the text-book sense, an
illustration of the theories or generalized statements made in the first. That would have involved the trimming or tailoring of one part or the other to ensure a proper ‘fit’, which would have thwarted the whole purpose of the publication. Mr. Vaizey’s article is no high-flown theorizing but a generalized guide to practice, but Mr. Chesswas makes it clear in his opening paragraph that, while practice conformed to the general lines of the theory, there were many respects in which it diverged. In that particular setting, some problems in Part I did not arise; others, as he frankly states, ‘were simply never thought of‘, and sometimes, when facts were lacking, intelligent guessing took the place of calculation. Mr. Vaizey would have expected this to be so, and Mr. Chesswas makes no claim that the particular bit of costing he describes is an ideal model. He himself suggests ways in which it might have been improved, and also shows how the costing was simplified (and thereby limited) by ‘making the assumption that the education system would remain basically the same as that which existed’. The virtue of this contribution is that it is a straightforward account of how an able and experienced ministry of education in a developing country did in fact cost its plans. It seemed to the International Institute for Educational Planning
that the two statements would both gain from being presented side by side. The booklet is offered primarily for the training of planners, but, since most of us still stand in need of training in one branch or other of educational planning, it may be of interest to the seasoned as well as to the young.
C. E. BEEBY Center for Studies in Education and
Development, Harvard University

Contents
PART ONE by John Vaizey
The importance of costing . . . . . . . . . 11 H o w to cost-choosing the basis . . . . . . . . 13 What is the scope of educational costs? . . . . . . 14 Some internal problems-especially capital . . . . . . 16
The complexity of the abnormal . . . . . . . . 18 Assigning costs . . . . . . . . . . . . 17
International comparisons . . . . . . . . . 19 Deciding priorities-who does it? . . . . . . . 20 The period of costing-the main variable factors . . . . 21 Finance and accounts . . . . . . . . . . 24
PART Two by J . D . Chesswas
Introduction . . . . . . . . . . . . The administration of education and its development . . .
The financing of the education service . . . . . .
The unit . . . . . . . . . . . . . The content of unit costs Annual recurrent costs: basic course (primary) schools . . .
Annual recurrent costs: secondary schools . . . . . .
Calculation of unit costs . . . . . . . . . . Capital costs : secondary schools . . . . . . . . Appendix . . . . . . . . . . . . .
. . . . . . . . .
27 28 29 30 31 32 33 37 43 51

Part One by John Vaizey
The importance of costing An essential tool for an administrator who is running an educational system is a knowledge of the costs of alternative courses of action. Any person who takes decisions about extending or establishing an educational system has to decide whether to add to existing facilities, to complement them, or to substitute something different from what he already has. He may build a new secondary school on an existing model; he may add a recreational centre to his school system; or he may replace a series of scattered village schools by a central secondary school. He will want to know the educational and social benefits from these actions ; but essential to his task is an understanding of the costs of doing one thing rather than another. There is no administrator in the world who has more resources than he can use; and when resources are limited, choices have to be made. It is essential that these choices are based on an accurate assessment of the cost situation. An understanding of the principles of costing educational program-
mes, therefore, underlies the major part of the task which the edu- cational administrator and planner has to undertake. By an analysis of the problems involved in costing, and an understanding of the techniques which have been developed for the best methods of costing, the formulation and implementation of educational plans will be substantially improved. This part of the booklet is concerned primarily with a substantial number of practical problems which the educational planner will face. In order to understand these problems, however, a certain amount
11

The costing of educational plans
of theoretical formulation is necessary. The theory, however, is kept to a minimum because, in educational planning in the developing nations, highfalutin approaches to problems are often not suitable -the data with which the administrator has to work are crude and the methods he has to use are necessarily rough and ready. Conse- quently the formulations presented here are simple and not compli- cated, and the suggestions that are made for meeting the problems are those which will be easily available and may be used in any country. In any short period in which educational planning is being under-
taken, the greater part of educational costs are fixed. In the imme- diate future-in a year or so-the range of choice which the policy-maker has before him is necessarily very limited. He has to pay for the upkeep of his buildings, he has to pay the salaries of his teachers, he has to pay for school transport, he has to pay for educational materials and for innumerable other incidentals which running an educational system involves. He will be lucky if more than 5 per cent of his annual budget is available for any new kind of departure. Of course, the longer ahead he looks, the greater the range of choice which he has available. Over a period of several years he can hire more or fewer teachers, he can use to a greater or lesser extent new techniques like television, he can build new buildings of different types for a multiplicity of purposes and he can design different kinds of school systems. And from the point of view of the nation also, the allocation of resources as between education on the one hand and, say, health and welfare on the other becomes far more a matter of choice. W e shall indicate later on the limits and constraints which are imposed by the imperatives of social and economic development on the choices which are available. But here the point which is being made is a simple one that the further ahead an administrator looks, the greater is his range of choice. Perhaps, indeed, this idea can be stood on its head. Whenever
an administrator makes a decision, however trivial, he is in fact limiting the number of choices that he can make in the future because he will be committing some of his resources to a given path of development; a policy once inaugurated is hard to reverse; com- mitments entered into cannot easily be got out of. It therefore follows that the educational policy-maker should have a long-term strategy in mind whenever he takes a decision which involves in any significant
12

Part One - John Vaizey
respect the long-term commitment of resources. It is the aim here to try to present some of the problems that face an administrator and a planner when he is trying to devise a long-term strategy, and to suggest to him the use of tools which will enable him to make wise choices.
How to cost-choosing the basis First of all, then, how does one cost an educational programme? The main devices may be, and probably are, familiar. A unit is chosen, either the number of teachers or the number of pupils or perhaps the number of schools, as a basis for costing. On this basis, a range of data is provided-that‘is to say the cost of providing the given unit is derived from experience, and then the national unit cost is multiplied by the total number of units in the system to derive the total cost. Basically, this is the device which is used by governments and businesses throughout the world for their costing procedures. It will immediately be obvious that there are a number of major
problems which the administrator or planner has to think carefully about before he adopts his unit. Do costs vary with the number of pupils? To some extent they do. If maintenance grants are given to pupils or fees are paid to private schools on a per pupil basis, then obviously if the number of pupils increases so will the number of grants. If the school administration pays for the books used by the pupils and each pupil has a given number of books, then ob- viously expenditure on books will also rise with the number of pupils. But the administrator will immediately be aware that many educational costs are not associated with the number of pupils. They are associated rather with the number of teachers. (Incidentally, the definition of a ‘teacher’ is often not as simple as it seems at first sight.) If the number of teachers increases then the major part of educational outlay-which is teachers’ salaries and incidental associated ex- penses like superannuation-will also increase. Thus it may well be that the item to look at most carefully, when costing is being undertaken, is the number of teachers and their salaries. No one unit, however, is suitable for all purposes. For costs other than teachers’ salaries the unit to look at may well be the number of square metres of building space, because the cost of heating and
13

The costing of educational plans
cleaning and interest charges are associated more with the number and size of educational buildings than with the number of pupils or the number of teachers. Of course there is a link between the number of pupils, the number of teachers and the number of build- ings. Roughly, for educational costing purposes, it is fairly safe to assume that the crucial variable is the number of teachers. It would be unsafe, however, to assume that this is the only variable. The safest procedure is to divide educational costs into three parts- those related to pupils, those related to teachers and those related to buildings-and to adopt units for each. In a fairly steady situa- tion where things are not altering much, a composite unit, including all three, could be adopted; but most educational planners do not find themselves in steady situations. Their craft is embarked on stormy seas where change is the order of the day.
What is the scope of educational costs? Having decided what our units are to be - and we shall come back later to them in greater detail - we want to find out what the total costs of an educational programme are likely to be. To know where we are going, we have to know where we are now. What is spent at present? To know that we have to decide whether or not the figures which commonly appear upon the educational vote are all the costs that have to be considered. First let us take current outlays. If we look at these carefully it is fairly obvious that the main items which cost most-teachers’ salaries, the upkeep of buildings, the incidental cost of furniture, books, stationery, etc.-can be identified. But are the figures in these budget tables appropriate for our purpose? It may be difficult to assign expenditure to the appropriate year because there may be a difference, for instance, between the bud- getary year and the school year. (Things like this, which may seem minor points, actually make costing procedures extremely com- plicated.) Again, there may be differences in the dates at which supplies are bought and supplies are used. This may make a difference to costing, because the valuation of stocks in a period of rising or falling prices gives accountants nervous breakdowns. But taking one year with another, such problems can eventually be overcome by adopting a set of sensible rules and sticking to them. On the other hand there are other difficulties which are not so easily over-
14

Part One - John Vaizey
come. The budgetary authorities may be interested only in those costs which fall directly on them, yet in many school systems some parts of educational costs are borne by the central government and other parts of the costs by local communities. In drawing up an educational plan it would therefore be necessary to identify expen- diture undertaken both by central and by local government and to add them up. This may not be such a simple task because the regulations under which grants are paid by central governments to local governments may be exceptionally complicated. In Northern Ireland, for example, until recently some grants were paid according to the number of pupils, others to supplement teachers’ salaries, and others to meet certain other costs. These grants would appear under several headings in the accounts, and to assign them to any particular sector of education would be a very complicated task. Double counting could easily occur; both the grants paid by the central government and those received by the local authorities would appear as disbursements, and they would have to be ‘netted out’. Then there may well be private receipts in the educational system which may be of considerable importance. These private receipts may be school fees paid by families, or fees paid by private corpo- rations for the industrial or other training of their employees. There may be payments by parents or pupils for books, special lessons, meals, accommodation and other purposes which at all times ought to be included in total disbursements, but which may in fact be paid through separate accounts. There are certain types of services which may be provided to the educational system free by other departments. For example, if there is an extensive national education television service, it may not appear on the education vote, but it may appear instead under, say, the broadcasting corporation vote, or the Min- istry of Cultural Affairs. Yet, properly speaking, it is a cost of education. In addition, large parts of the educational system proper may not appear under the education vote at all, but under other votes. For example, most countries have systems of agricultural extension work which are financed by the Department of Agriculture. Education of soldiers and soldiers’ families is often borne under the defence vote, and the education provided for nurses and doctors may well appear under the medical vote. If the true cost of an educa- tional plan is to be assessed, then two things are necessary. All these expenditures have to be identified and brought together in one major central table, and then consistent definitions have to be adopted of
15

The costing of educational plans
what is to be included and what is to be excluded from education. At the same time there may be a number of items appearing under the education vote which have nothing directly to do with education. For instance, in some countries, museums, art galleries and a number of other extraneous matters (including, for example, the national broadcasting system) may be the responsibility of the Minister of Education. These services are not necessarily more related to edu- cation than they are to any other form of social activity. In all prob- ability these costs should, therefore, be subtracted from the grand central table. At this stage we have a grand national table of educational expen-
diture by all authorities- public and private - which we think ought to be included in education. We have tried to assign expen- ditures to, the year in which they actually took place. We have sought to avoid double counting. We have sought to exclude non-educa- tional items. This is the basis for our global projection of educational costs. So far as possible we should try to divide the expenditure under different headings (teachers’ salaries, other wages, maintenance of buildings, educational materials, etc.) and by different levels (primary, secondary and higher, for example). These will be basic exercises that we can go into later.
Some internal problems-especially capital Before that, however, there may well be a number of purely internal accounting problems which have to be solved, for example, the repayment and servicing of loans which have been raised for the building of schools. These should be subtracted from current costs if calculations are also to be made of real capital outlays, otherwise there would be a double counting. The point is that capital yields its services over a long period. The ‘services’ of a loan represents the yields to the community of the current age of the buildings. But if we are interested in the burden of the capital expenditure, we are also interested in the total spent this year on school building and equipment. If we include the one in our accounts, we should exclude the other. The division between capital and current expenditure is, of course,
arbitrary and depends on the accounting conventions in use at the time and place in question. (A book bought for a library may be
16

Part One - John Vaizey
classed as capital expenditure whereas a book bought for use in a class-room would be current expenditure.) All of the problems which have been described as being relevant to the current costing of educational programmes arise also on the capital side. The iden- tification of capital outlays is frequently an exceptionally complex and difficult task, particularly if there is a large system of voluntary and independent schools, because often records of this expenditure are only kept centrally in a very sketchy way. It may well be possible to reconstruct the total of capital outlay on private education by using the unit amounts which are known to be involved in the public system and multiplying them by the number of capital places known to have been provided in the independent sector, but of course the standard of cost may be very different in the two cases.
Assigning costs Let ,us now assume that on the current and capital side we have accumulated as much evidence as possible of what the actual outlays are at present, or were in a recent year. We have excluded irrelevant expenditure and included as much relevant expenditure as we can think of. The next problem is to assign each of the large global totals to particular parts of the educational system, because what we want to have is an idea of the unit cost of education at different levels, and different types of education. For example, if the education of boys and girls is conducted in separate schools, it is useful to know whether we spend more money on boys than on girls. We will want to know whether the education of 12-year-olds is two, three or four times as expensive as the education of 6-year-olds. To discover the answer to this sort of question is frequently a task of great difficulty as the expenditure is not necessarily broken down and recorded conveniently either by age group or by school. For planning purposes the usual technique for making judgements is to try to identify those costs associated with a particular age group and to construct a kind of mock accounting system for the education of a particular group of children. H o w are we to do this? Frequently, a number of schools may be
chosen as a sample to give us some idea of the expenditures involved and, provided that due care is taken to see that they are not too untypical of the system as a whole, this can give an indication of
17

The costing of educational plans
expenditures which is not terribly inaccurate. After all, let us remem- ber that the purpose of this exercise is to discover what the trends of cost are likely to be, and as long as our errors are all in the same direction it does not really matter if our unit costs are a little wrong. If the errors begin to grow, of course, the figures will be useless. When changes take place, the degree of error will change. For example, it may well be that the development of new kinds of school will involve different types of expenditure. It has been found in Eng- land and Wales that the new schools built in the last twenty years have been cheaper in capital costs, but have cost more to heat and light and clean than the older schools. (This is because the amount of space per pupil has increased compared to thirty or forty years ago.) Rather than seeking for exactly accurate data, it is things like this that have to be carefully watched if the costing of educational programmes is not to go hopelessly wrong.
The complexity of the abnormal The illustrations which have been given refer largely to a conventional school system and, of course, the problem of devising unit costs becomes increasingly difficult the more we move away from the well-understood and accepted systems of ordinary school education of school children. The problems of costing programmes of technical training are very much more complex because, for example, in a factory where some training on the job is being given, it is difficult to decide whether at any point in time a man is being taught or is taking part in production. Is his wage a cost of production or a cost of training? There may be no formal part of the factory set aside for the training; people may be given training on machines which are used at other times for ordinary production. What, then, is the capital cost of training? The people who give the instruction may be for most of the time ordinary supervisors and foremen. What are the costs of training? The allocation of costs inside any productive enterprise is an exceptionally complicated process and comparing the costs with the unit costs of instruction given inside a technical college becomes a matter of considerable complexity.
Here, too, w e get in an acute form a problem which inside the school system particularly affects secondary education. This could be presented as the system of the unit adopted for costing. In a primary
18

Part One - John Vaizey
school where the level of student wastage, especially in a more developed country, may be quite low, it may be convenient to take the student, or the student-year, as a unit of costing-‘How much does it cost per year to educate a child?’ But where there is wastage on a serious scale, as in technical education and secondary education throughout the world, and in primary education as well in some developing countries, it may be more appropriate to take costs per completed student (or per graduate) and this may completely change the comparative schedule of costs which has been derived from the raw data assembled. Some of the apparently cheaper forms of train- ing may be revealed on this basis as the most expensive in terms of completed students.
International comparisons Let us suppose, however, that we have solved, or at least coped with as best we may, the problems of identifying the units we are going to use for costing and collecting the data. W e have made all our calculations. Where are we? Of course, many of the data which we put into our system of accounts will necessarily be rough and ready estimates. In many countries, the number of students is itself a somewhat vague concept and the idea of calculating expenditures on education in the often very large private sector is necessarily something which involves a great deal of estimation on the part of the planner (‘estimation’ is the word used by adminis- trators for ‘guess’). Now we want to know whether or not our costs seem reasonable compared with the costs in other education systems with which we are familiar. The game of international com- parisons in all fields is becoming more popular than it used to be, and international comparisons provide a great deal of guidance to administrators in many fields of activity. Here we have to be excep- tionally cautious. Our purpose in accumulating these data has been to estimate the real costs of education in terms of its true burden on the national economy. When we compare two countries, what we are interested in is to compare the real burden of education in both countries. But the tools that we have for making this comparison are necessarily limited. For example, we usually make comparisons in money terms and use the conventional rate of exchange. But in a world of monetary restrictions, such as we have, the rate of
19

The costing of educational plans
exchange itself is a highly artificial concept. Consequently, the reduc- tion of all unit costs to dollar terms on the basis of the official ex- change rate may considerably distort the true picture. In addition, in some countries teachers may be relatively well paid compared with other professions while in other countries they may be poorly paid. It would follow that the country that paid its teachers relatively well would appear to devote more of its resources to education than the country which paid its teachers comparatively poorly. In one sense this would be true because the teachers would get more of the national product for their own consumption. But in another sense it would be quite untrue, because whether or not the teachers were well paid, the children in each country would still get the same amount of teaching from the teachers. Consequently, for most purposes of comparisons we have to standardize the salaries of the teachers in the two countries. In other words, we have to calculate a special rate of exchange for teaching. This is a familiar economic device which has been used in a number of fields. (It has been devel- oped particularly by Mr. Milton Gilbert and his collaborators at the Organisation for Economic Co-operation and Development.)
Deciding priorities-who does it ? Once we have assembled the data for costing a plan we then can use them to help decide priorities. Most priorities of a major kind would have been fixed on political or other grounds before the plan begins. Nevertheless, the choice of priorities will obviously be de- termined to a considerable extent by the cost of various policies and the accurate costing of possible projects will therefore play an important part in the process of choosing which projects to adopt. The costing of alternative programmes as accurately as possible over the longest possible period as a basis for reasonable compar- isons is one of the fundamental purposes of the costing procedures. Far too frequently, decisions are taken in education on grounds of what is pedagogically desirable without any prior consideration of what the costs are. The costs of doing something are the costs of not doing something else. That is the important thing to remember. Of course, what priorities are chosen and the extent to which costs will affect the priorities is partly determined by who does the costing. In a highly centralized system it will usually be the minister of edu-
20

Part One - John Vaizey
cation, whereas in a highly decentralized system it will be a local unit of authority. The task, of course, in either case is to make sure that the statistics used for any one part of the system are compared on a uniform basis with the cost of activities in other parts of the system. Further, it will be essential to have some co- operation between different governmental departments if the full range of statistics is to be made available to the planner. School building may be undertaken by the ministry of public works; the ministry of labour will probably have the up-to-date statistics on the trend of salaries and wages of the people who are not teachers; and expenditure on other departments (mainly defence, agriculture, health and welfare) will be necessary for the completion of costing returns. It is essential, therefore, for the authority concerned with the costing of educational programmes to have free access to rele- vant statistics in other departments. It is important that the data should be presented simply and
systematically. A decision-maker is not interested in costs to the nearest penny; and often to get the highest degree of accuracy in accounts takes so much time and labour that the up-to-date data are never ready. An over-all picture which draws attention is the most useful one. Yet, oddly enough, this is the most difficult thing in the world to get hold of. Clerks have been used to totting up tiny amounts. It takes an experienced planner to simplify masses of financial data, and to present it on a comparative basis.
The period of costing-the main variable factors The scope of costing has already been dealt with in terms of the range of choice of alternatives. But for most educational adminis- trators the annual budget is what determines what they can spend; in local systems they will be strictly limited by the amount of taxes that can be raised in the coming year. As we have already argued, the costs of education are largely k e d in the short run, so that the real issue that has to be faced is the problem of making cost projections for the middle and long range when choices are more open. A problem indeed, because, of course, the longer ahead that costs are estimated the more hypothetical the figures become. The amount that can be spent on education will depend upon the rate
21

The costing of educational plans
of economic growth that will take place, which is exceptionally difficult to determine. The way in which teachers’ salaries will vary will depend upon factors in the labour market which very frequently cannot be at all accurately foreseen. The development of capital costs is also exceptionally difficult to forecast. Consequently we have to be prepared to present ranges of estimates for the longer term under different hypothetical assumptions that ought to be clearly spelt out. What are the factors which are likely to affect future costs in education? Of course there are maiy. But they can be put roughly under six headings. In the first place there will be changes in the price level-and
mostly we are interested in real costs, not in purely monetary costs. The changes in the price level will affect the actual figures that we use at any point of time, but for forecasting purposes we have to standardize the price changes. The costs of items bought in educa- tion will not necessarily change in the same direction or at the same rate as the cost of other goods. The general price index is heavily weighed, for example, with the cost of food and accommodation, neither of which enters heavily into educational costs. The major item in educational costs is teachers’ salaries-and teachers’ salaries may not move in the same direction as goods in general, or even wages in general. Initially, therefore, if we are to standardize costs, it is important to devise a price index for education which is separ- ately calculated from the price index used for the economy as a whole. This is a fairly simple task with which the economists in the planning bureau will be familiar. The second factor which affects educational costs is the changes
in the relative proportions of the goods and services that enter into education, of which the chief item is teachers’ salaries. In school systems which are at a fairly primitive level of development, teachers’ salaries are a very high proportion of the total outlay-perhaps as much as 90 per cent-whereas in the more developed systems they fall to between 50 and 60 per cent on average. Even in the more developed countries, at the elementary level of education the proportion of teachers’ salaries is much higher than at the secondary and univer- sity levels. Consequently, when we look at the future trends of edu- cational cost we have to decide how far we think teachers’ salaries will remain a constant proportion of total outgoings on education, or see in which direction and how fast we think a change may take place.
22

Part One - John Vaizey
The third factor which affects educational costs is the increase in the child population. This is an aspect of projection work which is full of pitfalls. As is well known, demographic forecasting is a difficult and complex art and it becomes more difficult in countries where the statistical services are as yet relatively poorly developed. The major item affecting educational outlays in many countries is the rapid rate of growth of the child population. This is a subject which merits much more detailed consideration than the space of this booklet allows; here it is enough to mention that it is not only the total size of the child population which is relevant but its distri- bution between various age groups. A persistent trend towards a higher proportion of older children at school will raise costs far more than a simple increase in the number of younger children. The fourth factor affecting educational outlays in the future is
the rise in educational standards and in the demand for education. As soon as a school system has been established there are demands from parents, teachers and some politicians for more favourable conditions; for additions to the variety and scope of schools; and requests for a whole range of social amenities without which edu- cation is socially and pedagogically unsatisfactory. The pressure for increased educational outlays per child is very great and particularly so at times of rapid social change. A prudent administrator or planner who is making a forecast of educational costs will therefore allow a substantial weight to the demand for improvements in edu- cational standards. The fifth point which the administrator or planner who is under-
taking costing procedures should bear in mind is the raising of the school-leaving age (and possibly the lowering of the age at which compulsory attendance occurs). In the developing nations the main drive in recent years has been to enrol all children in the elementary age group, but as soon as this has been done the demand for the raising of the school-leaving age to 14, 15 or 16 becomes very strong. The education of older children is more expensive than the educa- tion of younger children (both because the teachers of the higher- age-group children tend to be paid more and because the techniques of education used for older children are more expensive) so that extending the length of school life itself raises the costs of education per child-year. This becomes especially clear, of course, when the rates of enrol-
ments in higher education are accelerated. This is the sixth point
23

The costing of educational plans
that needs much emphasis. The unit costs of higher education are many times those of elementary education and, as has been frequently argued, the development of higher education is an integral part of the development of the whole education system. Therefore, when costing educational plans for primary and secondary schools it is essential to bear in mind the rapid development of higher education and its effects on the total cost picture. In making long-term forecasts, therefore, we have both pressure
on the total number of pupils to be educated and rising unit costs. These increasing unit costs originate from the fact that the standards of education rise, that older children cost more to educate and also at the same time a shift in the cost structure of education occurs because of changes in price levels. (The changes in price levels can be analysed by use of price indices which have been described fully elsewhere.) The purpose of the operation described here is to get at the real costs of education as opposed to the money costs and these six factors will be found to be a necessary part of the whole analysis.
Finance and accounts So far we have considered outlays. But double-entry book-keeping suggests that we should check one side of the ledger with the other; we should look at receipts-at the sources of finance. Let us recap- itulate some of our problems in interpreting accounts. In con- sidering the financing of education a number of points have to be borne in mind. In the first place, governmental budgets and financial statements are drawn up for a particular administrative and political purpose, according to the constitution and to the various relevant statutes, usually to ensure that the legislative and accounting author- ities have an adequate control over the expenditure of public money. A further consideration is the avoidance of graft and peculation of
all kinds. But accounts drawn up with these considerations mainly in mind are not necessarily those which are most suitable and con- venient for people using them for administrative purposes connected with strategic decision-making and planning, any more than the statistics of school attendance, which are drawn up with the purpose of seeing that pupils are in regular attendance at school and for
24

Part One - John Vaizey
determining the payment of teachers’ salaries, are necessarily suitable for the planning of education. Consequently, the governmental statistics themselves have to be analysed with great care in order to put them in the appropriate categories for planning purposes and for economic analysis. To take a particular instance, the planner of education will be particularly interested in the division between capital and current expenditure. These categories in governmental accounts are largely a matter of convention, since the basis of the division in capital expenditures is not normally subject to annual voting by the legislative or budgetary authorities, whereas, of course, current outlays are. But the distribution between capital and current outlays which is drawn up for administrative accounting purposes is not necessarily that which is appropriate to a consideration of capital and current expenditure in the economic sense. In the eco- nomic sense capital expenditure is that outlay which yields a flow of benefits over a long period of time, whereas current expenditure is something which yields its benefits as soon as it is undertaken. Therefore, the planner may have to juggle with the accounts in order to get a proper allocation of current and capital expenditure for his purposes. It is in this sort of reallocation of the figures in the accounts
that it is useful to check expenditure figures against receipts. The receipts which go into the (usually national) fund from which edu- cation expenditures are made arise from diverse sources. Some of them have already been enumerated : central government grants, local government grants, fees, loans, payment for services rendered, deferred payments and payments in kind are some of the main examples. It is necessary to analyse the sources of receipts in order to match them against the expected pattern of future expenditure, both in order to see that the pattern of receipts is sufficient to meet the outgoings that are expected, and also to see whether the pattern of receipts in the education sector of the economy is what is socially and economically desirable. In developing nations there is a particular problem that the societies
are usually divided into two main parts-the monetized sector and the non-monetized sector. In the monetized sector, receipts and outgoings are more in cash, whereas in the other sector a high pro- portion of expenditure and of receipts may be in kind. Consequently, it may be necessary to have two completely different sets of accounts for different sectors of the economy.
25

The costing of educational plans
To summarize: we may say that any analysis of the pattern of educational expenditure now and in the future has to be set carefully against the costs that are imposed on the community by this expen- diture. For this purpose a careful analysis of the sources of educa- tional receipts is necessary.
26

Part Two by J. D. Chesswas
Introduction 1. This part of the booklet describes costing procedures in a devel- oping African country, about two-and-a-half years after indepen- dence. As will be seen, some of the principles and factors outlined in the first part were considered, and some of the possible diffi- culties were pertinent and had to be faced. Other points did not pertain: the refund of loans given specifically for education was not due to begin until some ten years afterwards; at the second level both public and private-aided schools were financed in the same way, for both capital and recurrent costs; there was no organized scheme of on-the-job education; the age-ranges at all levels were so wide that it was inappropriate to use age as a factor affecting costing-the levels and types of education were more important factors; likewise there was no ‘school-leaving age’; and the value of services rendered by communities, mainly at the primary level, was virtually impossible to assess. Other points made by John Vaizey were simply never thought of, such as: the results of the differences in dates of buying and using stock; costs of educational television; possible changes in the costs of running schools; and the possibility of a public demand for improvement in standards (the overriding current demand was for greater quantity). Different methods of achieving the same objects were discussed, but never reached the costing stage; costs of the development plan concerned were calculated on the assumption that the education system would remain basically the same as that which existed.
27

The costing of educational plans
The administration of education and its development 2. Primary education was administered by local governments and those of federated states, usually through education committees. Second-level and non-university third-level education was adminis- tered by the central government, with the exception of that in one state, which administered both primary and second-level education in its area. 3. Over-all planning of educational development, other than
university, and detailed planning of second-level and non-university third-level education was conducted by the central government, which consulted the state government on the details of development of second-level education in its area. Local governments, through their education committees, where they existed, planned the detailed development of primary education within the over-all figures given to them by the central government, and those details were subject to central approval. University expansion was planned by the uni- versity council. 4. Educational planning for the central government was carried
out by a planning unit within the Ministry of Education, which worked closely with a working party dealing with ‘education and manpower’, one of ten working parties which were drawing up plans for different sectors of public life to be moulded into an over- all development plan with a final fifteen-year objective and a first- phase five-year target for which detailed plans were to be made. The working party consisted of representatives of various min- istries and of bodies, including the university, concerned with this area.
5. The development plan was based on an estimated rate of increase in the gross domestic product (GDP). Calculations were made of the high-level manpower needed to achieve this objective, and the working party was required to draw up over-all enrolment projections for each sector of the education system so as to achieve the manpower targets at the end of the first five-year period, being allocated a proportion of the GDP and a share of the investment capital.
28

Part Two - J. D. Chesswas
The financing of the education service 6. The greater proportion of the finance for the education service, both capital and recurrent, came from central government sources. Funds which the central government gave to local or state govern- ments to assist with recurrent expenses of education formed part of over-all statutory or block grants, which passed through the votes of ministries other than that of education, and possible duplication of accounting did not, therefore, arise. 7. The financial year of the central government started on 1 July,
but that of local and state governments, as well as the academic year, started on 1 January. In addition to this complication, there were no audited accounts of local and state governments available for any period after independence, when they had all finally taken responsibility for the administration of local education services. Audited accounts for the central government were available up to the most recent completed financial year. 8. Government estimates and accounts for education, both central
and local, were cast in a form which made extraction of expenditure on various levels and types of education easy. Votes for capital and recurrent expenditure were kept separate. 9. Income to meet the recurrent costs of running the schools
came from public funds and fees (the latter being sometimes paid in the form of a scholarship or a bursary). Any other income, such as gifts, was negligible. Teachers’ salaries and allowances were paid from public funds. Other recurrent expenses were paid, for the first six years of education, completely from fees, and for subsequent education (upper basic course, second-level and third-level non-uni- versity education) from a combination of fees and block, course and per capita grants, all of which grants came from public funds. University education was financed by direct grants from the central government to the university, and scholarships and bursaries given by both central and local governments; income from these two sources covered virtually all costs, i.e., university education could be deemed ‘free’, as also could the two-year upper stage of the secondary course, for which local government scholarships and bursaries were automatic. Fortunately, votes for scholarships and bursaries were kept separate, and duplication of accounting could therefore easily be avoided. 10. The central government gave local and state governments
29

The costing of educational plans
small grants to help with capital costs of expansion of primary schools, and some of the richer local governments supplemented these grants from their own funds, but the main burden of capital development at the primary level fell on communities, who con- tributed either money or labour towards the provision of premises which could at the best be described as semi-permanent. Funds for capital development at levels above the first came almost com- pletely from central government or external aid sources.
11. Capital costs were deemed to cover: (a) initial payments in respect of the site (e.g., compensation to evicted tenants) ; (b) survey, design, drawing and supervisory charges for site, buildings and works ; (c) contract costs for all buildings and works, including labour and materials; (d) furniture and all equipment which was deemed to serve for more than the first year (thus an initial capital grant would be given for such things as a vehicle, a projector, and library and textbooks for additional classes-it was considered that textbooks should have an average life of at least three years, and the school was expected to set aside funds from its recurrent income for the purchase of replacements as they became necessary). 12. Depreciation of premises, as distinct from routine repair and
maintenance (which was included in recurrent expenditure), was not taken into account. If it became necessary, say, to replace a building, the central government normally sought additional funds for the purpose.
The unit 13. The unit on which costs were based was the ‘pupil’ for recurrent expenditure, and the ‘place’ for capital (the possibility of using the ‘teacher’ or ‘class’, as suggested in the first part of this work, was never raised). Pupil and place are not necessarily the same; places may be under-utilized or overcrowded. Erection of buildings is a commitment to accept the numbers which they can accom- modate, and it is wise to be prepared for a full enrolment. Foresight is most important when commitment to a permanent structure is being made.
30

Part Two - J. D. Chesswas
The content of unit costs
RECURRENT
14. The country’s over-all development plan was costed at rates which pertained at the beginning of the development period. A proportion of the estimated GDP for the first target year (year 5) was allotted for recurrent expenditure on education, and this rep- resented the sum, at those rates, which would be actually spent in that year. Thus, for instance, pensions payable to teachers who would be on retirement in that year would be chargeable against that allocation, but the pension element theoretically earned by local teachers still in service during that year would not; the ‘fringe’ benefits for expatriate teachers, which would be actual expenditure, would have to be included (see paragraph 26). Funds set aside for replacement of furniture and equipment would enter the costing ; depreciation of buildings would not, but the costs of their routine maintenance and repair would have to be taken into account. In the allocation of shares of the GDP, there was a ‘public services’ head; it was assumed that the administration and inspection of education services came under that head, and their costs were not therefore taken into account in assessing unit costs for the schools.
CAPITAL
15. The content of these costs has already been listed in para- graph 11. It was proposed to establish a Ministry of Education architectural and works section and it was therefore assumed that the costs of survey, design, drawing and supervision would be included in the ‘public services’ head.
MATERIAL AVAILABLE
16. Audited accounts of the central government for the financial year 1963/64 were available. For local and state governments only estimates (the latest were those of 1964) could be obtained. The school statistics for 1963 and 1964 had been summarized; those at the second and third levels of education were considered to be good; at the primary level there was more room for doubt, but it was felt
31

The costing of educational plans
that any margin of error was likely to be smaller than margins which might arise in other factors affecting the development plan. 17. The major difference in the availability of material was there-
fore as between the centrally and locally administered services. To illustrate the methods used to calculate recurrent costs, the following detailed explanation will therefore concentrate on primary schools as a locally administered service, and secondary schools as a centrally administered service. No material is available for university educa- tion, because economies were still the subject of discussion with the university authorities. 18. The main capital expenditure was to be on secondary schools,
and this section of the education system is therefore used to illustrate the method of calculation of capital unit costs.
Annual recurrent costs : basic course (primary) schools 19. These costs were made up of teachers’ salaries and allowances and capitation grants for the pupils, both paid by local governments, and fees paid by the students. It could be assumed that income was equal to expenditure, as the teachers were paid directly by the authorities, and fees and capitation grants, which met other recurrent costs, were normally fully spent. 20. There were two main problems: only estimates of expenditure
by local authorities were available, and there was no firm informa- tion about the actual collection of fees. It was known that the standard of enforcement of collection varied from area to area, and since the rates also varied very considerably, the total amount collected was largely a matter of guesswork. At the beginning of 1964 the administration of these funds had been centralized in the hands of area education officers, and when their first audited ac- counts become available, much more accurate calculations can be made. In the meantime, the figure had to be guessed (the ‘estima- tion’ mentioned on page 19 of Part One of this work). From the experience of administrators it was assumed that the average fee collection would come to about E1.3 per pupil per annum. 21. The form of local authority votes allowed administration costs
and funds for the running of the schools to be extracted easily. The total of the local government votes for the school costs for 1964
32

Part Two - J. D. Chesswas
(i.e., estimates of public expenditure only) was about &3,510,000; the total enrolment in the schools was 528,646. Thus the average cost from local government votes for the running of the schools was E6.6 per pupil, to the nearest 0.1 of a E. To this was added El.3 for fees, giving a total of E7.9 per pupil per annum at 1964rates. 22. This was the unit cost for the running of the schools, which
was required for the development plan, but as a matter of interest, the exercise can be carried a little farther. The total local adminis- tration costs were about &177,000, which gives a rate of E0.3 per pupil, making a total, including local administration, of E8.2 per pupil. In addition, a revision of salaries and allowances at 1 July 1964 (the funds for which came from the central government, and were not therefore included in the local government estimates) added about E380,OOO to the annual bill, or E0.7 per pupil, making the cost at the new rates E8.6 without local administration, and E8.9 with it.
Annual recurrent costs : secondary schools 23. The expansion of secondary education formed a major part of the development plan, and for this section of the education system fairly full and detailed information was available. For the calculations, it was decided to use only those schools administered directly by the central government, which formed about three-quarters of the service, as final accounts were available for public expenditure on these schools for the financial year 1963/64, whereas only estimates were available for the remaining quarter which were administered by a state government (see paragraph 2). 24. The secondary course was divided into a four-year lower
stage (grades 9 to 12) and a two-year upper stage (grades 13 and 14); only a proportion of students leaving the lower stage entered the upper. At the lower stage, most of the schools had double sections; a few urban day schools, which ran sessions for two sets of pupils each day, had up to twelve sections. Upper stage classes were added to the top of some of the lower stage schools, usually as double or treble sections. (In 1964, seventeen out of a total of forty-three schools had upper classes.) 25. The teaching staff consisted of a majority of graduates and
a minority of non-graduates. There were few local teachers, owing to counter-attractions in other occupations, and the bulk of the
33

The costing of educational plans
staff were therefore expatriates, most of them serving under external aid schemes. In the development plan it was proposed to produce a large number of local secondary teachers with the ultimate object of replacing all expatriates by the end of the over-all fifteen-year programme. 26. Local teachers were paid a basic salary, and those in certain
designated posts received in addition a responsibility allowance; expatriates were paid only a basic salary on a different scale, and many of them also received an overseas allowance paid by their own governments. Fortunately the local teacher’s salary plus allowance was quite
close to the expatriate’s basic salary, and since the overseas allowance was not a charge on the local economy, and did not therefore enter the calculations, the replacement of expatriates by local teachers did not introduce, on this score, any modifying factor into the costs. However, the local teacher was on pensionable terms, and the expa- triate on contract terms, with certain ‘fringe’ benefits such as passages, medical expenses and terminal gratuities, paid at the end of two years irrespective of whether the teacher renewed his con- tract. Since the cost was to be based on actual expenditure in 1971 (see paragraph 14), it had to be assumed that the costs of an expa- triate included these benefits, which amounted to about 40 per cent of the salary. 27. As the proposed teacher-training scheme fed the system,
there would be an increasing proportion of teachers on the lower points of the scale; it was anticipated that by 1971 about half of the teacher force would be local teachers with less than six years’ experience (see paragraph 33(b)); would this have any effect on the rate of teacher costs? In 1963/64 the average pay of a teacher, excluding expatriate allowances, was equal to about the fifth point on the graduates’, or the tenth point on the non-graduates’ scale. The effect of the increasing number of local teachers on lower points would tend to lower this average, but it was presumed that the expatriate section of the teaching force would have a counter-effect, and that the result might be a lowering of the average by only a point or so on the scale; the increment at these levels is about 4 per cent of the salary. It was decided not to let this factor affect the calculations. 28. In the allocation of teaching duties, the non-graduates teach
mainly in the lower classes, and graduates in the upper. Would
34

Part Two - J. D. Chesswas
it therefore be possible to differentiate between teacher costs per pupil at the two levels? The schools were run as completely integrated schools; teachers who normally taught in the upper section often gave some lessons in the lower section, especially in the last (examin- ation) year. Again, non-graduate teachers often took pupils of all levels in such extra-curricular activities as games, singing, scouting, and societies; in boarding facilities, all staff supervised pupils of all levels. To allocate costs of individual teachers according to the class levels which they normally taught would therefore be to base costs on only part of their services, and in view of the integrated nature of the schools it would be impossible to allocate teachers' services to any one sector. Average teacher costs per pupil were therefore allocated for the secondary system as a whole.' 29. It was possible, however, to differentiate non-salary costs
at the two stages. In particular, books and equipment at the upper stage were more expensive than those at the lower, a fact which was reflected in differing rates of capitation grants. As in the case of primary schools, it could be assumed that expenditure was equal to income, as schools usually spent virtually all they received, and it was therefore safe to assume that capitation grants and fees were spent on the pupils for whom they were paid. 30. Another factor which would have an effect on over-all costs
was the change in the proportion of boarding and day enrolments. For reasons which need not be explained in this booklet, it was planned that the 49 : 51 boarding to day enrolment ratio in 1964 would be changed to 70 : 30 by 1971. This would not have any effect on the rates of teacher costs, because staffing ratios and qualifi- cations were the same for both kinds of schools, but it would affect the average of capitation grants and fees, which were higher for boarding schools than for day schools.
31. Such then were the factors influencing unit costs. There were four main elements in the financing of the schools: teacher costs, capitation grants, and block grants for established non-teaching staff, all paid from government funds, and fees paid by pupils. The fee and capitation and block grant rates per pupil were all known; it remained to calculate the teacher cost per pupil, which was done by a residual process. There was a small complication due to the
1. However, see footnote 2 on page 37.
35

The costing of educational plans
fact that a dying secondary modern system was paid from the same vote, but it was so small, and the average teacher quality so little below that of the secondary schools, that it could be assumed that teacher costs for the secondary modern averaged the same as those for ordinary secondary. 32. The basic facts necessary for the calculations were as shown
in Tables 1 and 2. In secondary schools a block grant at an average of €4 per pupil
was given for established non-teaching staff costs.
TABLE 1. Enrolments
Secon- Grades 9-12 Grades 13-14 Totals of grades 9-14 dary
m o - dern
Board- Day Total Board- Day Total Board- Day Total Board- ing ing 1ng ing
Year
1963 3444 3517 6961 155 261 416 3-599 3778 7377 481
1964l 4299 4422 8721 324 336 660 4623 4758 9381 547
Average 1963/a2 3 871.5 3969.5 7841 239.5 298.5 538 4111 4268 8379 514
Projected 1971' 18 940 8 117 27 057 2 239 959 3 198 21 179 9 076 30 255 - 1. O f the day pupils in 1964, 230 were living in urban hostels detached from schools 2. Since the financial year ran from 1 July 1963 to 30 June 1964 (see paragraph 7), the enrol-
ments for the two years had to be averaged, so as to correspond to the funds expended on them
3. The 1971 projections were based on manpower forecasts made in accordance with the principles of the over-all fifteen-year development plan until 1981. The estimated. man- power needs for the first phase, 1966171, were converted into enrolments, taking repeat- ing and drop-out rates into account, and the resultant totals for 1971 were as shown in the table
TABLE 2. Annual rates of recurrent income for non-teacher costs
Grades 9-12 Grades 13-14 Secondary
Boarding Type of income modern
Boarding Day Boarding Day
€ E € € €
Capitation grant 22.5 5 40 20 10
Fees (average) 25 17 25 17 25
36

Part Two - J. D. Chesswas
The annual rate of grant for an urban hostel resident was $37.5. Total expenditure on teachers’ salaries and allowances, capitation
grants and block grants by the Ministry of Education from 1 July 1963 to 30 June 1964 was E638,378. This did not include gratuities and other fringe benefits for expatriate teachers, which were paid from other votes.
Calculation of unit costs 33. The calculation of unit costs may be broken down into three part: (a) teacher cost per pupil in 1963/64; (b) teacher cost per pupil in 1971 at 1963/64 rates; (c) total annual recurrent cost rates in 1971.
(a) Teacher cost per pupil in 1963164
In 1963164 the following capitation grants were made:
3,871.5 grades 9-12 boarding at E22.5 = E87,108.75 3,969.5 grades 9-12 day at E5 = E19,847.50 239.5 grades 13-14 boarding at E40 = E9,580.00 298.5 grades 13-14 day at E20 - - E5,970.00
€5,140.00 514 secondary modern at El0 - E2,012.50 230 hostel residents at E8.75l -
- -
together with block grants of E4 to 8,379 secondary students (.€33,516.00), giving an over-all total of E163,174.75. The total ministry expenditure was E638,378. Thus, by deducting
the above total, the expenditure on salaries and allowances is found to be &475,203.25. Dividing this figure by the total number of students, 8,893 (8,379
secondary plus 514 secondary modern) gives 553.4, the average teacher cost per pupil in respect of salaries and allowances.2 As the teachers were virtually all expatriates, this figure must be
raised by 40 per cent to allow for their fringe benefits, giving a final figure of E74.8.
1. This figure is for six months only, the annual grant being $17.5. 2. These were the calculations which were used at the time. In subsequent variations of the plan, it became necessary to look closer at the comparative lower and upper teacher costs per student on an enrolment basis (not on the
37

The costing of educational plans
(b) Teacher cost per pupil in 1971 at 1963164 rates
The planned output of local teachers for secondary schools up to the end of 1970 was 825. Statistics enabling wastage of teachers to be calculated were not available in sufficient detail, and it was therefore necessary to guess the expected loss. It was assumed that 770 local teachers would still be in service in 1971. The total number of classes planned for 1971 was: 813 for grades
9-12 and 110 for grades 13-14, a total of 923. The staffing ratio at the grade 9-12 stage was thirteen teachers
for eight classes, and at the grade 13-14 stage three teachers for two classes. Therefore the number of teachers needed in 1971 for grades 9-12
would be 813 x 13/8, i.e., 1,321; and for grades 13-14 would be 110 x 3/2, i.e., 165. There would be 68 supernumerary heads for 68 schools; therefore the total number of teachers needed would be 1,554, of whom 770 local teachers, leaving 784 expatriates. There would therefore be 770 teachers at the cost without expa-
triate fringe benefits, and 784 with them. This means that the average teacher cost per pupil would be
(770 x 100) + (784 x 140) (770 + 784)
i.e., 120 per cent of the cost without the benefits, which is 120 per cent of €53.4, giving €64.1,l at 1963/64 rates, in 1971. Thus the teacher cost per pupil, at the same rates, would drop
from E74.8 in 1963/64 to €64.1 in 1971, owing to the increasing localization of the teaching force in secondary schools.
basis of allocation of teachers of different qualifications to different sections). At a student-teacher ratio of 21.5 for the lower section, and 13.3 for the upper, the establishment of teachers would be 7,841 divided by 21.5, i.e., 365, for the lower section, and 538 divided by 13.3, i.e., 40, for the upper. One could therefore theoretically allocate the 2475,203.25 for teachers proportionately, as $428,269.59 to lower, and €46,933.65 to upper. Dividing t428,269.59 by 7,841 (average total enrolment, 1963/64) gives E54.6 per student at the lower level, and dividing &l6,933.65 by 538 (average total enrolment, 1963/64) gives g87.2 at the upper level. This method would allow for different rates of development for upper and lower stages.
1. The principles of the previous footnote apply equally here. One would also have to make an assumption about the proportions of expatriates and local teachers in each stage.
38

Part Two - J. D. Chesswas
(c) Total annual recurrent cost rates in 1971
The annual rates for each level of student, bothlboarding and day, would therefore be as shown in Table 3.
TABLE 3. Annual rates
Stage Type ofstudent Teacher Capitation Fees Block Total cost grant grant
E E f E E
( Boarding 64.1 22.5 25 4 115.6
!- Day 64.1 5 17 4 90.1 9-12
Boarding 64.1 40 25 4 133.1
Day 64.1 20 17 4 105.1 12-13
34. These final figures can now be rounded to the nearest pound. Finally, Table 4 (p. 40) shows the net result of the factors influencing the comparative over-all unit costs as between 1963/64 and 1971. Increasing localization of the teaching service reduces current expend- iture, but this is nearly counter-balanced by increases due to an increase in the proportion of boarders, and faster development of the upper section of the course, and the final result is only a small reduction of less than 4 per cent in the average cost per pupil. (This result would be a little different if the principles shown in footnote 2 on pages 37-38 were applied. Assuming an even distribution of expatriates and local teachers between the upper and lower sections in 1971, the over-all average cost per teacher would be €69.6, which would make the total figure for 1971 in the last section of Table 4 E115.2, compared with E114.3 for 1963/64, an increase of less than 1 per cent.)
39

The costing of educational plans
Q
0 0
.- E 8 4 v1
cd Q I
3.
"3
09
1
3
IA 1
0
ul 3
cn m m
2
U! d
3
'? W
$1 09 0
0, 09 m f
:
3
3

8
Part Two - J. D. Chesswas
3
c
ag
m
m
41

The costing of educational plans
r=l a
1 e
E

Part Two - J. D. Chesswas
Capital costs : secondary schools 35. Although capital works of various kinds had been undertaken at schools for many years, it was not considered appropriate to use this experience as the basis for the calculation of unit capital costs because nearly all the works had been carried out as additions to, or adaptations of, the premises of existing schools, and there was therefore little or no experience of building up the system with new schools. Also, there had been no standardizatioa; schools had em- ployed private architects, and, although the designs were subject to approval by the ministry, there was considerable variation in space, design, standards and cost rates between schools. Furthermore, concern had been expressed at rises in costs of school buildings, and it was considered necessary to try to reverse this trend. 36. It was therefore decided that all secondary-school buildings
should be built from standard plans. Arguments were raised for allowing variations in the style of buildings in different schools, but the major objective was to achieve the maximum expansion possible with the funds available, and the principle of variety as an aesthetic objective had to be sacrificed. 37. Decisions were therefore made on: (a) the rooms, buildings,
furniture and equipment which were necessary for the efficient running of a secondary school; (b) the scales on which sizes of rooms and buildings should be based and furniture and equipment supplied ; (c) a set of standard plans for the various buildings drawn up on the basis of those scales. The buildings were designed to achieve the scales laid down with as simple a structure as possible, in reasonably cheap materials, without going to the extreme of cheapening the construction at the risk of too short a life for the buildings.
It is not proposed in this booklet to go into the details of the various points which were discussed in the attempt to achieve the above objectives, although a description of such discussions might have been of some help to others seeking to arrive at the same ends; the purpose here is rather to show how unit costs were cal- culated on the basis of the scales laid down. 38. As already stated in paragraph 24, the secondary-school system
was divided into a four-year course followed after selection by a two-year course. The four-year course was a general course, which was being broadened to include agricultural biology, commercial
43

TABLE 5. Scales of rooms, buildings and furniture and equipment for secondary schools
Building or works Unit basis Scales of units
1 2 3
4
5
6 7
8
9
10 11
12
13 14 15
16 17 18 19 20 21 22
23
24
25 26
27
28 29 30 31 32
33 34
N.B.
OffiCeS Staff room Library
Class-room
Class-room stores
Geography room Art and craft room
Laboratory
Home economics combined oractical room
Complete One per school Established teacher posts x number of approved teacher posts Lower school place x number of lower school places
Upper school place x number of upper school places
Complete x 15 per cent of number of approved classes
Class-room x number of approved class-rooms Complete Complete
Complete Per single group of laboratories offer- ing physics, chemistry and biology Complete
H&ne economics model house Complete Home economics extra prac- Complete
Workshop Complete tical room
Technical drawing room Complete W.C.s (day school) Place Class-room W.C.s (boarding) Place
Dormitory Place Laundry drying area Place Students’ common-room Place Sick bay Place Matron’s quarters Complete Dining hall Place Kitchen Place
Assembly ball Place
Stores, maintenance of premises U p to 280 places Above 280 places
Head’s house Complete Teacher’s/Bursar’s house Complete
Subordinate staR housing Approved post
Water supply Sewage Electricity Other site works Initial textbooks Lower-school class
Upper-school class
school)
I (9
Other initial teaching equipment School Vehicle School
One when upper school geography begins One per schooi; a second when third
stream begins ( One per stream lower school i One per science stream upper school 1st year lower school 2nd year lower school 3rd year lower school 1st year umer school
’ Seenote - - See note See note
One of each (woodwork and metalwork) per double stream taking subject
One per double stream taking subject x number of approved places x number of approved places
x number of approved places x number of approved places x number of approved places x number of approved places One per school x number of approved places x number of approved places
x number of approved places
One per school of up to 280 One per school of above 280 One per school x number of approved teacber/bursar
x four (two cooks, one driver, one posts
quartermaster)
x number of approved lower school classes
x number of approved upper school classes
One per school One per school
In items I to 9, I1 to 13, 16, 19 to 21 super area and costs include 6 ft. wide verandah. Items 2, 3, 18,19, ZI and 22 shouldalways be designed for a minimum of 280places, and should later be expanded as the school mows. AN costs exclusive of fees for architects.
44

Works Furniture and equipment
Area (sq.ft.) Costing Floor Suoer E Der sa. ft, e per unit Nature E Der unit
~
470 790 29 49 5 6.45
7 9.11
665 910
10 ver cent of 10 Der cent of ciass-room
997 997
(1 150) 1380
810
997
Sleeping (l) 45 7 4
Sleeping (l) 2 (P) 500 10 5
10
200 400
ciass-room 1321 1321
1 843
1 824
1482 1824
1186
1321 0.8 0.4
74.61 7.35 5.20 3.88
12.37 I 5.42 )
10.54
729
23 1 441
1 600 1 400
250
1.4 1110 Furniture and equipment 220 1.4 69 Furniture 3 1.15 7.42 Furniture and equipment 0.6
1.15 10.48 Furniture and equipment 1.2 Books 2.86
Books 1.1 loo0 Furniture
10 190
1.1 10 per cent of - - 1.225 1.225
1.525
1.4
2.0 1.4
1.1
1.1 3.0 3.0
1.45 1 .o 1.15 1.45 I .45 1.5
1.2s
1.25 1.25 2.0 2.0
1.75
class-room 1 620 1 620
2 810
2 550
2 964 2 550
1 305
1453 2.4 1.2
108 7.35 6 5.63
1 060 26.7
13.175
290 550
3 200 2 800
440
Furniture and equipment Furniture and equipment
Gas installation Furniture
Teaching equipment t Furniture and equipment
Furniture Furniture and equipment
Furniture and equipment
Furniture and equipment
Furniture and equipment
(woodwork)
(metalwork)
- - Furniture
Furniture Furniture and equipment Furniture and equipment Furniture and equipment
Cooking equipment Furniture, equipment, stage
-
t Furniture and utensils lightings and fittings
Furniture and equipment Furniture and equipment
- -
450 450
270 450 500 500
1010
100 240
450
3 650
450 - - 12 - 0.65 0.6
3.5 0.85
2.15
150
(9
- - 400 300
-
Books 250
Books 300
Teaching equipment 500 Vehicle 1 300
(l) In addition, there are ablutions, W.C.s, etc. (3 That is, one bed, occupying 50 sq.ft. floor area, per 25 places (9 To be separately approved according to circumstances
45

The costing of educational plans
subjects, or woodwork and metalwork for boys, and commercial or homecraft subjects for girls. At the upper stage, students spe- cialized, and the course was split into two broad divisions: arts and science. The planned size of a class in the lower section was thirty- five, and in the upper, thirty. All upper-stage classes were organized as ‘ tops’ to lower-stage schools (see paragraph 24), and the staffing’ ratio was thirteen teachers for eight classes in the lower section, and three teachers for two in the upper. Woodwork, metalwork and homecraft subjects could be taught only to half a class at a time, and since these subjects were confined to the lower course, this had a slightly higher teacher-to-class ratio. Each school had a supernumerary head. At the time of planning. most schools were double section at the lower stage (see also paragraph 24); it was policy that, as far as the degree of expansion would allow, schools should be raised to a minimum of treble stream at the lower level. 39. All teachers had to be housed; the majority were exp.Qiates,
and they were likely to remain in the majority for some years [see paragraph 33(b)]. In any case, the national housing situation was such that the housing of local teachers also could not be avoided, especially if there was to be any stability in the staffing of schools! 40. The scales are shown in Table 5 (pages 44-45), which was issued
with detailed explanatory notes of no concern to us in this work. The costs were those which were estimated to be reasonable at the time the scales were issued. Possible variations will be dealt with later (see paragraph 46). Furniture and equipment are given in terms of money. These again were the estimated costs, at the time, of purchas- ing the items which were considered necessary. 41. Table 6 summarizes all the unit costs calculated in Tables A to F
(see Appendix). Tables A to F show examples of how these scales could be used to calculate the unit cost, i.e., cost per place, for se- lected typical schools of different sizes and for different sexes.l Table A shows a comparison of the costs of the buildings and works for boys’, girls’ and mixed double-section schools at the lower stage only; Table B shows the costs of the furniture and equipment for the same schools. Tables C and D show a similar comparison for treble-section lower-stage schools. Tables E and F show the costs of three possible schools combining lower and upper stages. 1. Table 6, as well as Tables A to F in the Appendix, should be read in conjunction
with Table 5; the figures in parentheses in these tables refer to the ‘Scale of units’ column in Table 5.
46

Part T w o - J. D. Chesswas
TABLE 6. Summary of capital costs per place
Sections: lower + upper 2 + 0 3 + 0 2’2 3+2 3-13 __ - .- Sex: Boys Girls Mixed Boys Girls Mixed Mixed Mixed Mixed
Boarding Buildings and works Furniture and equipment TOTALS
Day Buildings and works Furniture and equipment TOTALS
f e € E € f E € E
418 417
84 82 502 499
433
89
467
82 549 __
462
94
417
88 505 ~-
436
73 509 __
426
81 507
441
94 535 522 556
260
67
294 289
72
248
67 315
~-
261
52 319
~
258
59 317 --
271
72 343 __
251 251
59 63 61 314 312 321 353 361
42. A study of Table 6 reveals some interesting points. If a school has only two sections at the lower stage, the existence of girls in the school makes the capital cost per place about 5 per cent more expensive in a boarding school and about 9 per cent more in a day school; Table A shows that this is due to the costs of the buildings for the teaching of homecraft, which are not fully utilized in a school of this size; the difference disappears if the lower stagelis of three sections, because these premises are then more fully utilized (the cheaper rate of furniture and equipment for the girls’ school, as compared with the boys’ and mixed schools, is due to the he;ivy weighting of the equipment for the metal workshop in the total costs of boys’ practical work). Building and equipping a three- section school, as compared with a two-section school, is about 7 per cent cheaper per place for boarding schools and about 9.5 per cent for day schools. The addition of upper places reduces the over-all average very slightly, which means that the extra upper- stage place cost arising from more expensive teaching facilities and additional housing for staff at a higher teacher-pupil ratio is slightly more than set off by the costs arising from practical subjects in lower classes, which are not taught in upper classes. 43. This close proximity of the costs per place in an integrated
lower and upper school and those in a school which has only lower classes makes place costing for the purposes of a plan easier. F;om these figures it is reasonable to say that a secondary-school place
47

The costing of educational plans
in a development plan can be costed at E500 for a boarding place and €315 per day place, on the assumption that the plan was to be costed for new three-section schools. 44. If, however, one were expanding, say, a two-section mixed
boarding school to three sections, the costs would work out as follows: Three-section: buildings and works, €179,104; plus furniture and equipment, €33,901; a total of €213,005.
Two-section: buildings and works, €129,428; plus furniture and equipment, €26,365; a total of €155,793. The extra cost thus is €57,212, which, for 140 additional places,
would work out at E409 per extra place. This is based on the as- sumption that the buildings to be added are separate from the exist- ing buildings, and that the original two-section school is fully built and equipped. It often happens that it is not! 45. Having gone through the maze of these calculations, let us
now ask ourselves exactly what we have achieved and for what purpose. It is most important to realize the limited functions of these cost figures, and how they fit into the scheme of planning and implementing development. These figures give an approximate cost per unit which can be
used in projecting over-all enrolments and provision of places. W e could say, for instance, that a plan envisaging the addition of 185 lower-stage and 40 upper-stage secondary classes in new treble- section schools, an enrolment of 6,150 at the lower stage and 1,170 at the upper, would result in the following costs (assuming all are boarding) : Additional recurrent costs per annum when development is complete would be: lower stage, 6,150 x €116, i.e., E713,400; upper stage, 1,170 x E133, i.e., E155,610; a total of E869,OlO; or, in round figures, about €870,000.
Capital cost of developing the places (185 x 35 $I 40 x 30 x €500) would be &3,837,500, i.e., one could talk in terms of E3.8 million.
46. This is as far as these figures go, and it should not be thought that they can give any more accurate information than this. All sorts of factors can affect them: teachers’ salaries, for example, may be revised at rates which change their real value in relation to the economy of the country. An important factor in capital expenditure is the possibility of variations in building costs, depending on the changing relationship between the total construction work being
48

Part Two - J. D. Chesswas
carried out in the country and the capacity of the building industry; a few large building projects falling at the same time could saturate the capacity of the industry and raise tenders by appreciable per- centages; equally, a dearth of contracts available at any one time could, at least temporarily, pull prices down. These costings must therefore be reviewed at least annually, in the light of experience, and the whole plan, which might itself be changed in other respects, must be re-costed. Calculations of this nature can only be used to assess the order of magnitude of the cost of a plan. There are so many assumptions made in building up a plan that it would be deceptive to give too much precision to the final figure; hence the choice of, say, the round figure of E500 for the capital cost of a secondary-school boarding place. Each year the sums of money required must be estimated on the basis of the schools, teachers, and pupils known to exist; and the actual cost is not known until the last pound is spent.
49

Appendix to Part Two

The costing of educational plans
TABLE A. Costs of buildings and works for double-section lower-stage schools1
Sections: lower + upper Classes: lower + upper Places: lower + upper Sex :
ltem Building or works
1 2 3 4 5 6 7 8 9
10 11
12 13 14 15 16 17 18 19 20 21 22 24 25 26 27 28 29 30 31
Office Staff room Library Class-rooms Class-room stores Geography room Art and craft room Laboratories Home economics combined
Home economics model house Home economics extra practical room
Workshops Technical drawing room W.C.S. (day school) Class-room W.C.S. Dormitories Laundry drying area Student’s common-room Sick bay Matron’s quarter Dining hall ) Kitchen ) Stores, maintenance of premises Head’s house Teacher’s/Bursar’s houses Subordinate staff houses Water supply Sewage Electricity Other site works
practical room
2 + 0 8 + 0
280 + 0 Boys
Boarding
f
1110 (+ 13) 897
2 078 (6) 6 000
600
1 620 5 620
-
- (1 + 1) 2610
1453
336 30 240 2 058 1 680 1576 1 060 7 476
290 3 200
1760 4000 4000 1000 1500
-
(14) 39200
TOTALS
Average (cost per place)
1. Items 28 to 31 are estimated as average.
121 364
433
Day
E 1110
(+ 13) 897 2 078
(6) 6000 600
1620 5 620
-
- -
- (1 + 1) 2610
1453 672 - - - - - - - 290
3 200 (14) 39200
3000 3000 500
loo0
-
72 850
260
52

Part Two - Appendix
2 + 0 8 + 0
280 + 0 Girls
2 + 0 8 + 0
280 + 0 Mixed
Boarding
E
1110 (X 13) 897
2 078 (6) 6000
600
1 620 5 620
-
5 100 5 928
2 550 - - - 336
30 240 2 058 1680 1576 1060 7 476
290 .3 200
(14) 39200 1 760 4000 4000 1 000 1500
130 879
467
Boarding D a y
E
1110 (x 13) 897
2 078 (6) 6OOo
600
1 620 5 620
-
5 100 5 928
290 3 200
(14) 39200
3000 3000 500
lo00
-
82 365
294
E 1110
(X 13) 897 2 078
(6) 6 000 600
1620 5 620
-
2 550 2 964
2 550 (1 + 1) 2610
1 543
336 30 240 2 058 1680 1 576 1060 7 476
290 3 200
(14) 39 200 1760 4000 4000 1000 1500
-
E 1110
(X 13) 897 2 078
(6) 6 OOO 600
1620 5 620
-
2 550 2 964
2 550 (1 + 1) 2610
1453 672
290 3 200
(14) 39200
3000 3000 500
1000
-
129 428
462
80 914
289
53

The costing of educational plans
TABLE B. Costs of furniture and equipment for double-section lower-stage schools
Sections: lower + upper Classes: lower + upper Places: lower + upper Sex :
2 + 0 8 + 0
280 + 0 Boys
Item Type of furniture or equipment Boarding Day
1 2 3
4 6 7 8
9
10 11
12 13 16 18 19 20 21 22
25 26 32 33 34
Office Staff room Library : Furniture and equipment Books
Class-rooms Geography room Art and craft rooms Laboratories : Gas installation Furniture Teaching equipment
practical room Home economics combined
Home economics model house Home economics extra practical room
Workshops Technical drawing room Dormitories Students’ common-room Sick bay Matron’s quarters Dining hall Kitchen : Furniture and equipment Cooking equipment
Head’s house Teachers’/Bursar’s houses Initial textbooks Other initial teaching equipment Vehicle
TOTALS
Average (cost per place)
f
220 (x 13) 39
168 800
(6) 1 140
450 -
270 900
1800
- 4 100 450
3 360 182 168 150 980
238 1200 400
(14) 4 200 2000 500
1300
E 220
(x 13) 39
168 800
(6) 1 140
450
270 900
1800
-
- -
- 4 100 450 - - - - - - - 400
(14) 4 200 2000 500
1 300
15 015
89
18 737
67
1. The cost of cooking equipment has been assessed at about the average of the various types available.
54

Part Two - Appendix
2 + 0 2 + 0 8 + 0 8 + 0
280 + 0 280 + 0 Girls Mixed
Boarding D a y Boarding
f 220
(x 13) 39
168 800
(6) 1 140
450
270 900
1800
2 020 200
240
-
- -
3 360 182 168 150 980
238 1200 400
(14) 4 200 2000 500
1300
22 925
82
E 220
(x 13) 39
168 800
(a) 1140
450
270 900
1800
2 020 200
240
-
- - - - - - -
- - 400
(14) 4 200 2000 500
1300
16 647
59
f
220 (X 13) 39
168 800
(6) 1140
450
270 900
1800
1010 100
240 4 100 450
3 360 182 168 150 980
23 8 1 200 400
(14) 4 200 2000 500
1300
26 365
-
91
Day
E 220.
(x 13) 39
168 800
(6) 1 140
450
270 900
1800
1010 100
240 4 100 450
-
- - - - -
- - 400
(14) 4 200 2000 500
1300
20 087
72
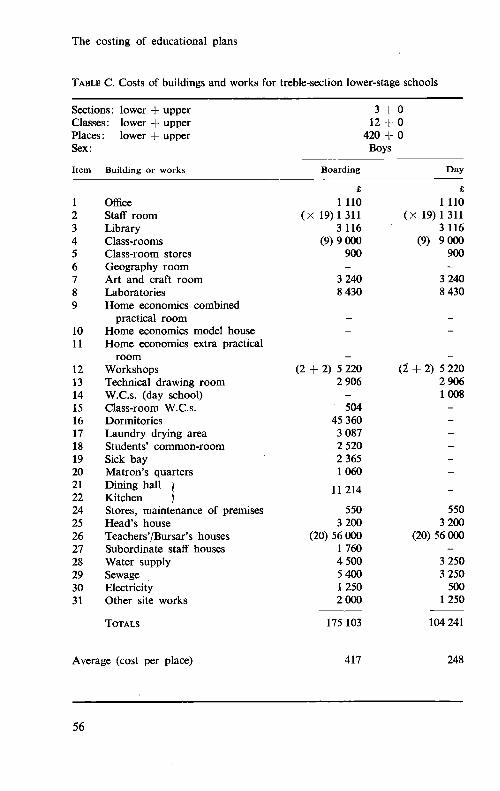
The costing of educational plans
TABLE C. Costs of buildings and works for treble-section lower-stage schools
Sections: lower + upper Classes: lower + upper Places: lower + upper sex :
Item Building or works
3 + 0 12 + 0 420 + 0 Boys
Boarding Day
1 2 3 4 5 6 7 8 9
10 11
12 13 14 15 16 17 18 19 20 21 22 24 25 26 27 28 29 30 31
OffiE Staff room Library Class-rooms Class-room stores Geography room Art and craft room Laboratories Home economics combined
Home economics model house Home economics extra practical room
Workshops Technical drawing room W.C.S. (day school) Class-room W.C.S. Dormitories Laundry drying area Students’ common-room Sick bay Matron’s quarters Dining hall Kitchen 1 Stores, maintenance of premises Head’s house Teachers’/Bursar’s houses Subordinate staff houses Water supply Sewage Electricity Other site works
TOTALS
practical room
Average (cost per place)
E 1110
(x 19) 1311 3 116
(9) 9 OOO 900
3 240 8 430
-
- -
- (2 + 2) 5 220
2 906
504 45 360 3 087 2 520 2 365 1 060
11 214
550 3 200
(20) 56 OOO 1 760 4 500 5400 1250 2000
175 103
-
417
E 1110
(x 19) 1 311 3 116
(9) 9 OOo 900
3 240 8 430
-
- -
- (2 + 2) 5 220
2 906 1 008 - - - - - - - 5 50
3 200 (20) 56 OOO
3 250 3 250 500
1250
104 241
-
248
56

Part Two - Appendix
3 + 0 12 + 0 420 + 0 Girls
Boarding Day
E 1110
(X 19) 1 311 3 116
(9) 9 OOO 900
3 240 8 430
5 100 5 928
5 100
-
- - - 504
45 360 3 087 2 520 2 365 1 om
11 214
550 3 200
(20) 56 000 1760 4 500 4 500 1 250 2000
183 105
436
E 1110
(X 19) 1 311 3 116
(9) 9 OOO 900
3 240 8 430
5 100 5 928
5 100
-
- -
1 008 - - - - - - - 550
3 200 (20) 56 OOO
3 250 3 250 500
1 250
112 243
-
267
3 + 0 12 + 0 420 + 0 Mixed
Boarding
f
1110 (x 19) 1 311
3 116 (9) 9 OOo
900
3240 8 430
2 550 2 964
2 550 (1 + 1)2610
1453
504 45 360 3 087 2 52Q 2 365 1 060
11 214
550 3 200
(20) 56 000 1 760 4 500 4 500 1250 2000
179 104
-
-
426
f
1110 (X 19) 1311
3 116 (9) 9 OOO
900
3 240 8 430
2 550 2 964
2 550 (1 + 1)2610
1453 1 008
-
- - - - - - -
550 3 200
(20) 56 OOO
3 250 3 250 500
1250
108 242
-
258
57

The costing of educational plans
TABLE D. Costs of furniture and equipment for treble-section lower-stage schools
Sections: lower + upper 3 + 0 Classes: lower + upper 12 + 0 Places: lower + upper 420 + 0 Sex :
Item Type of furniture or equipment
1 2 3
4 6 7 8
9
10 11
12 13 16 18 19 20 21 22
25 26 32 33 34
Office Staff room Library: Furniture and equipment Books
Class-rooms Geography room Art and craft rooms Laboratories : Gas installation Furniture Teaching equipment
practical room Home economics combined
Home economics model house Home economics extra practical room
Workshops Technical drawing room Dormitories Students’ common-room Sick bay Matron’s quarters Dining hall Kitchen : Furniture and equipment Cooking equipment
Head’s house Teachers’/Bursar’s houses Initial textbooks Other initial teaching equipment Vehicle
TOTALS
Boys
Boarding D a y
E 220
(X 19) 57
252 1200
(9) 1710
900
210 1350 1800
-
- -
- 8 200 900
5 040 273 252 150
1 470
357 1500 400
(20) 6 000 3000 500
1300
37 101
E 220
(x 19) 57
252 1200
(9) 1710
900
270 1350 1800
-
- -
- 8 200 900 - - - - -
- - 400
(20) 6 000 3000 500
1300
28 059
Average (cost per place) 88 67
58

Part Two - Appendix
3 + 0 3 + 0 12 + 0 420 + 0
12 + 0 420 + 0 Girls Mixed
Boarding Day Boarding D a y
e 220
(x 19) 57
252 1200
(9) 1710
900
270 1350 1800
-
2 020 200
480 - -
5 040 273 252 150
1 470
357 1500 400
(20) 6 OOO 3000 500
1300
30 701
73
e 220
(x 19) 57
252 1200
(9) 1710
900
270 1350 1800
-
2 020 200
480 - -
- 400
(20) 6 000 3000 500
1300
21 659
52
E 220
(x 19) 57
252 1 200
(9) 1710 - 900
270 1350 1800
1010 100
240 4 100 450
5040 27 3 252 150
1 470
357 1500 400
(20) 6 OOO 3000 500
1300
E 220
(x 19) 57
252 1 200
(9) 1710
900
270 1350 1800
-
1010 100
240 4 100 450
- 400
(20) 6 OOO 3000 500
1300
33 901
81
24 859
59
59

The costing of educational plans
TABLE E. Costs of buildings and works for some integrated lower- and upper-stage schools
Sections: lower + upper Classes: lower + upper 8 + 4 Places: lower + upper 280 + 120 sex : Mixed
Item Building or works Boarding Day
2 + 2 (1 arts, 1 science)
1 2 3 4 5 6 7 8 9
10 11
12 13 14 15 16 17 18 19 20 21 22 24 25 26 27 28 29 30 31
Office Staff room Library Class-rooms Class-room stores Geography room Art and craft room Laboratories Home economics combined
Home economics model house Home economics extra practical room
Workshops Technical drawing room W.C.S. (day school) Class-room W.C.S. Dormitories Laundry drying area Students’ common-room Sick bay Matron’s quarters Dining hall 1 Kitchen ) Stores, maintenance of premises Head’s house Teachers’/Bursar’s houses Subordinate staff houses Water supply Sewage Electricity Other site works
TOTALS
practical room
f 1110
(X 19) 1311 3 336
900 1 620 1620 8 430
2 550 2 964
2 550 (1 + 1)2610
1453
480 43 200 2 940 2400 2 252 1 060
10 680 550
3 200 (20) 56000
1760 4 500 4 500 1 250 2000
(9) 9 000
-
176 226
E 1110
(x 19) 1311 3 336
(9) 9 cim 900
1 620 1 620 8 430
2 550 2 964
2 550 (1 + 1)2610
1453 960 - - - - - - - 5 50
3 200 (20) 56 000
3 250 3 250 500
1 250
108 414
-
Average (cost per place) 441 27 1
60

Part Two - Appendix
3 + 2 (1 arts, 1 science) ~
3 + 3 (1 arts, 2 science) 12 + 4 420 + 120
12 + 6 420 + 180
Mixed Mixed
Boarding D a y Boarding D a y
E
1110 (x 25) 1 725
4 374
1 200 1 620 3 240
11 24Q
2 550 2 964
2 550 (1+1) 2610
1453
648 58 320 3 969 3 240 3040 1 060
14 418 550
3 200 (26) 72 800
1 760 5000 5000 1750 2 500
(12) 12 OOO
-
f 1110
(x 25) 1 725 4 374
(12) 12 OOO 1 200 1 620 3 240
11 240
2 550 2 964
2 550 (1 + 1) 2610
1453 1 296 - - - - - - - 550
3 200 (26) 72 800
3 500 3 500 750
1500
-
f
1110 (X 28) 1932
5 002 (14) 14 OOO
1400 1 620 3240 14 050
2 550 2 964
2 550 (1 + 1) 2610
1453
720 64 800 4 410 3 600 3 378 1060
16 020 550
3 200 (29) 81 200
1 760 5 500 5 500 1750 2 500
-
225 891
418
135 732
251
250 429
417
% 1110
(X 28) 1 932 5 002
(14) 14 000 1 400 1 620 3 240 14 050
2 550 2 964
2 550 (1 + 1) 2610
1453 1440 - - - - - - - 550
3 200 (29) 81 200
3 750 3 750 750
1500
150 621
-
251
61

The costing of educational plans
TABLE F. Costs of furniture and equipment for some integrated lower- and upper-stage schools
Sections: lower + upper Classes: lower + upper Places: lower + upper sex :
2 + 2 8 + 4
280 + 120 Mixed
Item Type of furniture or equipment Boarding Day
1 2 3
4 6 7 8
9
10 11
12 13 16 18 19 20 21 22
25 26 32 33 34
Office Staff room Library: Furniture and equipment Books
Class-rooms Geography room Art and craft rooms Laboratories : Gas installation Furniture Teaching equipment
practical room Home economics combined
Home economics model house Home economics extra practical room
Workshops Technical drawing room Dormitories Students' common-room Sick bay Matron's quarters Dining hall Kitchen: Furniture and equipment Cooking equipment
Head's house Teachers'/Bursar's. houses Initial textbooks Other initial teaching equipment Vehicle
TOTALS
Average (cost per place)
f
220 (x 19) 57
3 12 1600
(9) 1710 450 450
270 1350 5 100
1010 100
240 4 100 450
4 800 260 240 150
1400
340 1500 400
(20) 6 OOO 3 200 500
1300
37 509
94
f
220 ( X 19) 57
312 1600
(9) 1710 450 450
270 1350 5 loo 1010 100
240 4 100 450 - - - - -
- - 400
(20) 6 OOO 3 200 500
1300
28 819
72
62

Part Two - Appendix
3 + 2 (1 arts, 1 science) 3 + 3 (1 arts, 2 science) 12 + 4 12 + 6 420 + 120 420 + 180 Mixed Mixed
Boarding ~
f 220
(X 25) 75
396 2000
(12) 2 280 4 50 900
540 1800 5 100
1010 100
240 4 100 450
6 480 351 324 150
1890
459 1800 400
(26) 7 800 4 200 500
1300
45 315
84
Day Boarding
f E 220 220
(x 28) 84
396 468 2000 2400
(14) 2 660 450 450 900 900
(x 25) 75
(12) 2 280
540 1800 5 100
1010 100
- - 400
(26) 7 800 4 200 500
1300
33 861
540 2 250 5 100
1010 100
240 4 100 450
7 200 390 360 150
2 100
510 2000 400
(29) 8 700 4 800 500
1300
49 382
63 82
f
220 (x 28) 84
468 2400
(14) 2 660 450 900
540 2 250 5 100
1010 100
240 4 100 450 - - - - -
- - 400
(29) 8 700 4 800 500
1300
36 672
61
63

Suggestions for further reading
EDDING, F. Methods of analysing educational outlay. Paris, Unesco, 1966. HALLAK, J. ; POIGNANT, R. Les aspects financiers de I’enseignement duns
KNIGHT, J. E. The costing andfinancing of educational development in Tan-
ODDIE, G. Schoolbuilding resources and their eflectire use. Paris, OECD,
ORGANISATION FOR ECONOMIC CO-OPERATION AND DEVELOPMENT. Financing
les pays africains d’expression franqaise. Paris, Unesco/IIEP, 1966.
zania. Paris, UnescoiIIEP, 1966.
1966.
of Education for Economic Growth. Paris, OECD, 1966.

Other IIEP publications
The following publications are obtainable from Unesco and its national distributors throughout the world :
Educational Planning: a Directory of Training and Research Institutions 1964. Also available in French
Educational Planning: a Bibliography 1964. Also available in French
Educational Planning: an Inventory of Major Research Needs 1965. Also available in French
Problems and Strategies of Educational Planning: Lessons from Latin America 1965. Also available in Spanish
African Research Monographs Certain titles in the series in French only. Full current list available on request
New Educational Media in Action: Case Studies for Planners Three volumes
The New Media: M e m o to Educational Planners W. Schramm, P. H. Coombs, F. Kahnert, J. Lyle Also to be available in French and Spanish
Librairie de 1'Unesco Place de Fontenoy 75 Paris-7e France

The International Institute for Educational Planning
The International Institute for Educational Planning (IIEP) was established by Unesco to serve as an international centre for advanced training and research in the field of educational planning. Its initial basic financing was provided by Unesco, the International Bank for Reconstruction and Development and the Ford Foundation and its physical facilities by the Government of France. It has since received supplemental support from private and governmental sources. The Institute’s aim is to expand knowledge and the supply of competent experts
in educational planning in order to assist all nations to accelerate their educa- tional development as a prime requirement for general economic and social development. In this endeavour the Institute co-operates with interested training and research organizations throughout the world.
The Governing Board of the Institute (August 1966) is as follows:
Chairman Sir Sydney Caine (United Kingdom), Director, The London School of Economics
Ex oficio members Dr. Gabriel Betancur-Mejia, Assistant Director-General for Education, Unesco. Mr. David Owen, Co-Administrator, United Nations Development Programme. Mr. Richard H . Demuth, Director, Development Services, International Bank
The representative of the Director-General, United Nations Food and Agricul-
Dr. N. Prasad, Director, Asian Institute for Economic Development and Planning. Elected members Professor Hellmut Becker (Federal Republic of Germany), President, German Fe deration of Adult Education Centres; Director, Institut fur Bildungsforschung, Berlin.
and Political Science.
for Reconstruction and Development.
ture Organization.
Dr. Carlos Cueto Fernandini (Peru), Minister of Education. Mr. J. Ki-Zerbo (Upper Volta), President, National Commission of the Republic
Dr. D. S. Kothari (India), Chairman, University Grants Commission. Professor S. A. Shumovsky (1J.S.S.R ), Head, Methodological Administration Department, Ministry of Higher and Secondary Specialized Education, R.S.F.S.R.
of Upper Volta for Unesco.
Inquiries about the Institute may be addressed to: The Director, IIEP, 7 rue Eugkne-Delacroix, 75 Paris-16e

[B.2284] $1.50; 8/-(stg); 5,50 F