the cost of protein production - university of michiganzhanglab/clubpaper/02_16_2016.pdf ·...
TRANSCRIPT

Article
The Cost of Protein Produ
ctionGraphical Abstract
Highlights
d Libraries expressing increasingly high protein amounts are
extensively studied
d Processes that limit protein production vary, depending on
growth conditions
d Ribosomes are not universally limiting in rapidly growing cells
d Cells adapt by increasing their size and the abundance of
endogenous proteins
Kafri et al., 2016, Cell Reports 14, 22–31January 5, 2016 ª2016 The Authorshttp://dx.doi.org/10.1016/j.celrep.2015.12.015
Authors
Moshe Kafri, Eyal Metzl-Raz, Ghil Jona,
Naama Barkai
In Brief
Kafri et al. investigate the processes that
limit protein production. They find that
enforcing either gene transcription or
protein translation reduces growth rate,
depending on growth conditions. Cells
adapt by increasing their size and
endogenous proteome content,
suggesting that rapidly growing cells are
not resource limited.

Cell Reports
Article
The Cost of Protein ProductionMoshe Kafri,1,3 Eyal Metzl-Raz,1,3 Ghil Jona,2 and Naama Barkai1,*1Department of Molecular Genetics, Weizmann Institute of Science, Rehovot 76100, Israel2Department of Biological Services, Weizmann Institute of Science, Rehovot 76100, Israel3Co-first author
*Correspondence: [email protected]
http://dx.doi.org/10.1016/j.celrep.2015.12.015This is an open access article under the CC BY-NC-ND license (http://creativecommons.org/licenses/by-nc-nd/4.0/).
SUMMARY
The economy of protein production is central to cellphysiology, being intimately linked with cell divisionrate and cell size. Attempts to model cellular physi-ology are limited by the scarcity of experimentaldatadefining themolecular processes limitingproteinexpression.Here,wedistinguish the relativecontribu-tion of gene transcription and protein translation tothe slower proliferation of budding yeast producingexcess levels of unneeded proteins. In contrast towidely held assumptions, rapidly growing cells arenot universally limited by ribosome content. Rather,transcription dominates cost under some conditions(e.g., low phosphate), translation in others (e.g., lownitrogen), and both in other conditions (e.g., rich me-dia). Furthermore, cells adapted to enforced proteinproduction by becoming larger and increasing theirendogenous protein levels, suggesting limited com-petition for common resources. We propose thatrapidly growing cells do not exhaust their resourcesto maximize growth but maintain sufficient reservesto accommodate changing requirements.
INTRODUCTION
Protein production in living cells is tightly coordinated with
external conditions and intracellular demands. This regulation
ensures that needed proteins are produced, while those whose
function is not compatible with current needs are not. It may
also serve to minimize the cost of protein production; indeed,
making proteins consumes cellular resources by using energy
and nutrients as building blocks and also by occupying common
cellular machineries such as ribosomes, polymerases, or chap-
erones, whose abundance may be limiting. Defining the cost of
protein production, and the molecular processes limiting this
production, is a central challenge in cellular physiology, which
is relevant in particular for understanding the interplays among
cell growth, cell division, and cell size.
The cost of protein production is commonly attributed to pro-
tein translation (Andrews and Hegeman, 1976; Emilsson and
Kurland, 1990; Kurland, 1992; Marr, 1991; Molin et al., 1974;
Scott and Hwa, 2011; Scott et al., 2010; Vind et al., 1993). A ma-
22 Cell Reports 14, 22–31, January 5, 2016 ª2016 The Authors
jor fraction of the cellular GTP pool is used for amino acid poly-
merization, while significantly lower quantities are invested in
other processes including gene transcription and protein folding
(Russell and Cook, 1995; Schimmel, 1993). Ribosomes were
implicated as the major factor limiting growth of rapidly growing
cells (Dennis et al., 2004; Emilsson and Kurland, 1990; Klumpp
et al., 2013; Maaløe and Kjeldgaard, 1966; Marr, 1991; Russell
and Cook, 1995; Scott et al., 2010, 2014; Vind et al., 1993),
following the discovery that most of the cellular biosynthetic ac-
tivity is devoted to making ribosomes (Bremer and Dennis, 1996)
and the observation that ribosome content is tightly coordinated
with cell growth rate (Bremer and Dennis, 1996; Schaechter
et al., 1958; Warner, 1999). However, there is still a need for
experimental data that directly map the molecular mechanisms
limiting protein expression.
The cost of protein production was extensively studied in
E. coli. Forced overexpression of the Lac operon inmedium lack-
ing lactose leads to reduced cell growth and arrested the cell cy-
cle when reaching �30% of total proteome (Dong et al., 1995;
Horiuchi et al., 1962; Nguyen et al., 1989; Novick and Weiner,
1957; Scott et al., 2010). This reduced growth was broadly inter-
preted as the cost of protein production (Dong et al., 1995;
Klumpp et al., 2013; Scott et al., 2010; Stoebel et al., 2008; Za-
menhof and Eichhorn, 1967), although a recent study provided
an alternative interpretation (Eames and Kortemme, 2012).
Only limited data are available describing protein burden in eu-
karyotic cells (Hauf et al., 2000; Lang et al., 2009; MacLean,
2007), and it is not clear whether results inferred from one cell
type, or from specific conditions, can be generalized to other or-
ganisms and environments.
In this paper, we examined the relative contributions of gene
transcription and protein translation to the cost of protein pro-
duction in budding yeast, S. cerevisiae, and mapped the limita-
tion to the initiation versus elongation steps of each process.
We found that transcription and translation can both be limiting,
depending on the growth conditions. In particular, our data chal-
lenge the hypothesis that ribosome content is a universal limiting
factor defining growth rate of rapidly growing cells, as only slow-
growing cells appeared to be limited in ribosome content.
Notably, endogenous protein expression was increased, rather
than decreased, upon forced production of inert proteins, sug-
gesting that the protein production capacity can readily adapt
to increasing demands. We discuss the implications of our
data for describing the interplay between protein production
and cell growth.

Log 2(O
D)
Time (hours)
1 copy 18 copies
BA
WT -GFPStrain with mCherry
burden
mC
herr
yce
lls/W
T
G
0 10 20 30
25%
100%
400%
1 copy
10 copies
Generations100 102 104100
102
104
0 2 4 6 8 10 12
H
Fluorescence (A.U, x104)
% o
f WT
divi
sion
rate
(μ)
80
90
100
1
1
2
2
Copy number by FACS
Cop
y nu
mbe
r by
qPC
R
C
D
cop
y nu
mbe
r by
qW
este
rn b
lot
Copy number by FACS
By 1 7
GFP
Hog1
Fluo
resc
ence
(A.U
)
% of the proteome (PaxDB)
E
0 5 10 15 20 25
−2
0
2
Singletransforma�on
TDH3p mCherry
02468
101214
0 5 10
0
5
0
5
0
5
30
0 5 10 15 20 25 30
F
2.3%
~2% ofproteome
GFP fluorescence (A.U)
mC
herr
y flu
ores
cenc
e (A
.U)
4
0.1 1
102
103
104
Figure 1. Generating Libraries of Strains Ex-
pressing Increasing Amounts of Chromoso-
mally Integrated Fluorescence Proteins
(A) TDH3 promoter driving mCherry expression
(pTDH3-mCherry) was cloned into a plasmid that,
when transformed into yeast cells, integrates into
the genome in multiple copies (Figure S1A).
(B) mCherry expression range can be appreciated
from the differences in the colonies’ color (left
panel, natural light). Fluorescence images of indi-
vidual cells expressing low or high mCherry copies
(middle panel) and superimposed with bright light
(right panel). No aggregateswere observed in high-
burdened cells (n > 1,000 cells). Scale bar, 5 mm.
(C) Differences between colonies were quantified
using a flow cytometer (fluorescence-activated
cell sorting [FACS]) measuring mCherry fluores-
cence and by qPCR. The FACS copy number was
obtained by normalizing using the 1 copy strain
fluorescence. Error bars indicate SE of three bio-
logical repeats
(D) Quantification of the mCherry proteins using
western blots. Error bars indicate SE.
(E) Calibration curve defining the fraction of cellular
proteins made by a single pTDH3-GFP construct.
Fifteen distinctGFP-fused strains spanning a range
of abundances were chosen. Their fluorescence
levels were quantified using a flow cytometer and
plotted as a function of their protein abundance in
PPM (parts per million) as described in Supple-
mental Experimental Procedures and Figure S1C.
Horizontal error bars represent SE between
different measurements in Table S3, and vertical
error bars represent the SD between different
fluorescence measurements. Vertical dashed blue
line indicates 2.3% from the proteome.
(F) Growth curve on rich media (YPD). Shown is the log2(OD) of the low-burden (one copy) and high-burden (18 copies) strains. Data were fitted with a sigmoid fit
(Matlab function sigm_fit). Error bars indicate SD of three biological replicates.
(G) Quantifying growth fitness. Cells expressing a given level of mCherry were co-incubated with a GFP-labeled wild-type strain for �30 generations, during
which, their relative frequencies were quantified using a flow cytometer. Relative growth rate defined with respect to wild-type cells was calculated from the rate
by which the frequency of the mCherry expressing cells was reduced.
(H) The fitness cost of protein expression. The relative growth rates of mCherry-expressing cells as a function of mCherry fluorescence. Cells were grown in YPD.
The red line indicates expression levels estimated as �2% total endogenous proteins.
RESULTS
Systematic Study of Protein BurdenMicroorganisms are optimized for rapid growth. We therefore
analyzed the impact of enforcing protein production on cell
growth rate. Expressing mCherry fluorescent protein using one
of the strongest yeast promoters (pTDH3, glyceraldehyde-3-
phosphate dehydrogenase enzyme) resulted in a change in
growth rate that was below our experimental resolution (�2%).
To enforce higher expression levels, we cloned the pTDH3-
driven mCherry construct into a plasmid that integrates into
the genome in multiple copies and generated a library of strains
expressing one up to �20 copies of this construct (Figures 1A,
1B, and S1A), as measured by mCherry fluorescence and veri-
fied by qPCR of genomic DNA (Figure 1C). Proportionality be-
tween fluorescence levels and DNA copy numbers was main-
tained for the full range of integrations and was compatible
with protein abundances measured by western blots (Figures
1D and S1B). A comparable library was generated also using
GFP, giving consistent results (Figure S3B). We calibrated the
measured fluorescence levels using 15 GFP-fused proteins
and available abundances data (Figures 1E and S1C; Table S3;
Supplemental Experimental Procedures). By this, we estimate
that a single pTDH3-GFP construct contributes �2% to the
cellular proteome.
Growth Fitness Decreases in Proportion to theExpressed ProteinsWe measured the growth rate of our library strains using two
methods. First, we used direct comparison of growth curves of
strain expressing a single copy or 18 integrations of pTDH3-
mCherry. The strain with 18 copies grew �18% slower than
the stain expressing a single copy (Figure 1F). Second, relative
growth rates were quantified for the full library using a sensitive
competition assay (Figure 1G). Strains containing different inte-
gration number of pTDH3-mCherry were co-incubated with
GFP-labeled wild-type cells, and their relative abundance in
the population of growing cells was quantified at subsequent
Cell Reports 14, 22–31, January 5, 2016 ª2016 The Authors 23
A
Fluorescence (A.U, x104)0 2 4 6
80
90
100
Low NLow Pi
SC
% o
f WT
divi
sion
rate
(μ)
Tim
e (h
ours
)
B
DC
Genomic copy numberO
D, c
ont.
cultu
res
SC Low Pi Low N0
0.2
0.4
0.6
0.8
1
1.2
1.4
YPD SC Low Pi Low N
1
2
3
4
Gen
erat
ion
time
(hou
rs) 1 copy
18 copies1 copy16 copies
0 2 4 6 8 100
8
9
10
11
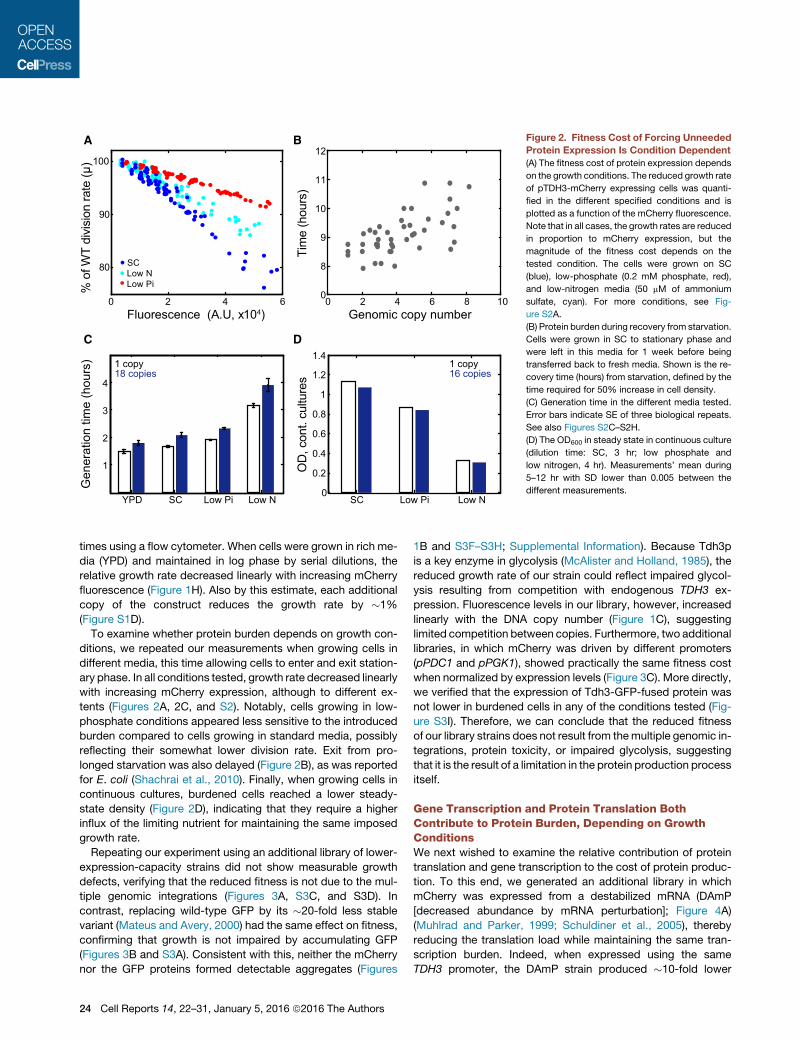
12Figure 2. Fitness Cost of Forcing Unneeded
Protein Expression Is Condition Dependent
(A) The fitness cost of protein expression depends
on the growth conditions. The reduced growth rate
of pTDH3-mCherry expressing cells was quanti-
fied in the different specified conditions and is
plotted as a function of the mCherry fluorescence.
Note that in all cases, the growth rates are reduced
in proportion to mCherry expression, but the
magnitude of the fitness cost depends on the
tested condition. The cells were grown on SC
(blue), low-phosphate (0.2 mM phosphate, red),
and low-nitrogen media (50 mM of ammonium
sulfate, cyan). For more conditions, see Fig-
ure S2A.
(B) Protein burden during recovery from starvation.
Cells were grown in SC to stationary phase and
were left in this media for 1 week before being
transferred back to fresh media. Shown is the re-
covery time (hours) from starvation, defined by the
time required for 50% increase in cell density.
(C) Generation time in the different media tested.
Error bars indicate SE of three biological repeats.
See also Figures S2C–S2H.
(D) The OD600 in steady state in continuous culture
(dilution time: SC, 3 hr; low phosphate and
low nitrogen, 4 hr). Measurements’ mean during
5–12 hr with SD lower than 0.005 between the
different measurements.
times using a flow cytometer. When cells were grown in rich me-
dia (YPD) and maintained in log phase by serial dilutions, the
relative growth rate decreased linearly with increasing mCherry
fluorescence (Figure 1H). Also by this estimate, each additional
copy of the construct reduces the growth rate by �1%
(Figure S1D).
To examine whether protein burden depends on growth con-
ditions, we repeated our measurements when growing cells in
different media, this time allowing cells to enter and exit station-
ary phase. In all conditions tested, growth rate decreased linearly
with increasing mCherry expression, although to different ex-
tents (Figures 2A, 2C, and S2). Notably, cells growing in low-
phosphate conditions appeared less sensitive to the introduced
burden compared to cells growing in standard media, possibly
reflecting their somewhat lower division rate. Exit from pro-
longed starvation was also delayed (Figure 2B), as was reported
for E. coli (Shachrai et al., 2010). Finally, when growing cells in
continuous cultures, burdened cells reached a lower steady-
state density (Figure 2D), indicating that they require a higher
influx of the limiting nutrient for maintaining the same imposed
growth rate.
Repeating our experiment using an additional library of lower-
expression-capacity strains did not show measurable growth
defects, verifying that the reduced fitness is not due to the mul-
tiple genomic integrations (Figures 3A, S3C, and S3D). In
contrast, replacing wild-type GFP by its �20-fold less stable
variant (Mateus and Avery, 2000) had the same effect on fitness,
confirming that growth is not impaired by accumulating GFP
(Figures 3B and S3A). Consistent with this, neither the mCherry
nor the GFP proteins formed detectable aggregates (Figures
24 Cell Reports 14, 22–31, January 5, 2016 ª2016 The Authors
1B and S3F–S3H; Supplemental Information). Because Tdh3p
is a key enzyme in glycolysis (McAlister and Holland, 1985), the
reduced growth rate of our strain could reflect impaired glycol-
ysis resulting from competition with endogenous TDH3 ex-
pression. Fluorescence levels in our library, however, increased
linearly with the DNA copy number (Figure 1C), suggesting
limited competition between copies. Furthermore, two additional
libraries, in which mCherry was driven by different promoters
(pPDC1 and pPGK1), showed practically the same fitness cost
when normalized by expression levels (Figure 3C). More directly,
we verified that the expression of Tdh3-GFP-fused protein was
not lower in burdened cells in any of the conditions tested (Fig-
ure S3I). Therefore, we can conclude that the reduced fitness
of our library strains does not result from themultiple genomic in-
tegrations, protein toxicity, or impaired glycolysis, suggesting
that it is the result of a limitation in the protein production process
itself.
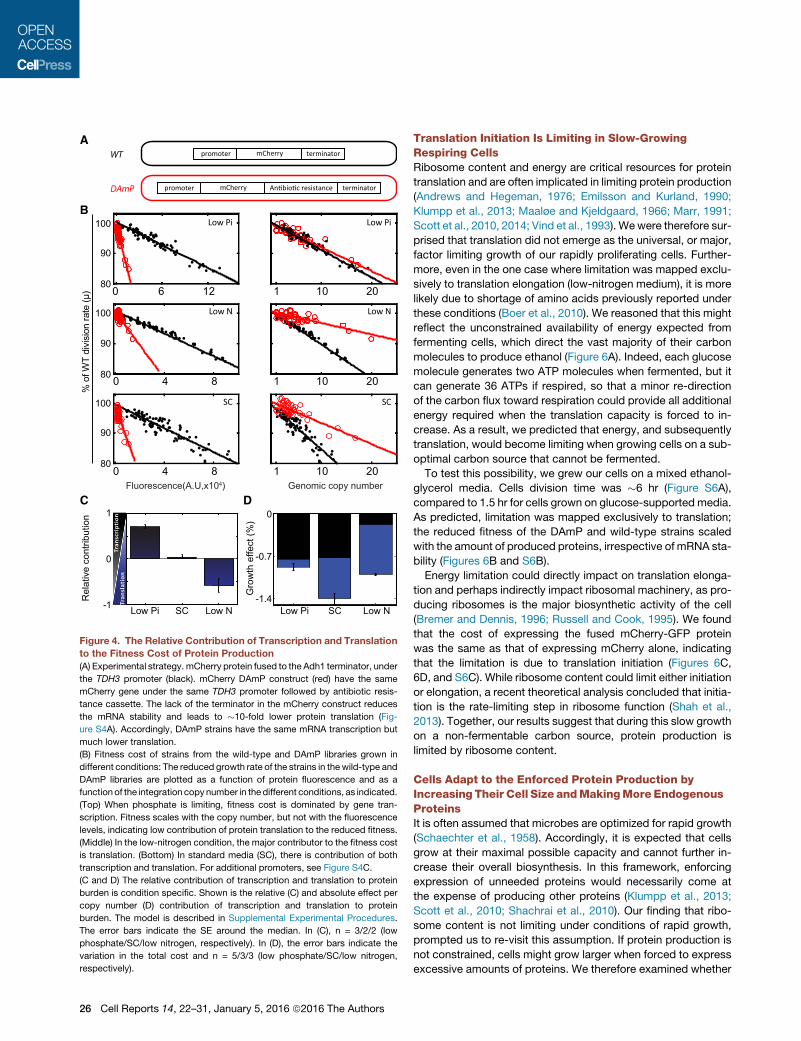
Gene Transcription and Protein Translation BothContribute to Protein Burden, Depending on GrowthConditionsWe next wished to examine the relative contribution of protein
translation and gene transcription to the cost of protein produc-
tion. To this end, we generated an additional library in which
mCherry was expressed from a destabilized mRNA (DAmP
[decreased abundance by mRNA perturbation]; Figure 4A)
(Muhlrad and Parker, 1999; Schuldiner et al., 2005), thereby
reducing the translation load while maintaining the same tran-
scription burden. Indeed, when expressed using the same
TDH3 promoter, the DAmP strain produced �10-fold lower

2 2.5 3 3.5 4 4.5 5
X2
0.20.40.60.8
1
1 2 3 4 50
0.6
0.20.4
0.81
X17
1 2 3 4 5
pTDH3X65
0.6
0.20.4
0.81
Genomic copy number0 2 4 6 8
pPGK1pTDH3pPDC1
pPGK1pTDH3pPDC1
Nor
m. c
ount
Nor
m. c
ount
Nor
m. c
ount
0 5 10 15 20Genomic copy number
GFPGFP*
GFPGFP*
A B C
80
90
100
80
90
Fluorescence(A.U,x104)
pRPS5(DAmP)
1 5 10 14
pTDH3
80
90
100
pRPS5(DAmP)
Log10(fluorescence(A.U)) Log10(fluorescence(A.U)) Log10(fluorescence(A.U))
% o
f WT
divi
sion
rate
(μ)
% o
f WT
divi
sion
rate
(μ)
% o
f WT
divi
sion
rate
(μ)
Figure 3. Fitness Cost Arises from the Pro-
tein Production Process
(A) Genomic integrations do not contribute sig-
nificantly to the measured fitness cost. Library
construction was repeated, replacing the TDH3
promoter with the weaker RPS5 promoter, without
a terminator (DAmP-RPS5, bottom). The relative
growth rates of the cells in those two libraries are
plotted as a function of the genomic copy number
(top). Note the negligible reduction in growth rate
for the DAmP-RPS5-based library (Figures S3C
and S3D).
(B) Protein toxicity does not contribute significantly
to the measured fitness cost. Library construction
was repeated, replacing the mCherry first by a
wild-type GFP and then by a destabilized version
of GFP (open gray, marked with asterisk),
which was obtained by fusing GFP to the CLN2
degradation box (Muhlrad and Parker, 1999).
When driven by the same TDH3 promoter, the
destabilized GFP fluorescence was reduced by
�20-fold (bottom). The relative growth rates of the cells in these two libraries is plotted as a function of the integration copy number, showing the same fitness cost
independently of the number of expressed GFP proteins (top). Note that the fitness cost of the pTDH3-GFP- and pTDH3-mCherry-expressing strains were
practically identical (Figure S3B). Cells were grown in SC media. For low-phosphate media see Figure S3A.
(C) Expression by different promoters results in a similar fitness cost. Two additional libraries were constructed, in which mCherry was driven by
different promoters as shown. Expression levels driven by the PDC1 promoter are similar to those of TDH3, whereas expression levels driven by the
PGK1 promoter are �2-fold lower (bottom). In this experiment, cells were grown in YPD and kept in log phase by frequent dilutions. For more conditions, see
Figure S3E.
mCherry fluorescence (Figure S4A) and �30-fold less mRNA as
measured by qPCR (not shown). The burden on the translation
machinery was thus reduced by �10-fold. By comparing fitness
cost in these two libraries, we could therefore distinguish the
cost coming from transcription from that coming from the trans-
lation process; a cost that results from burdened translation de-
pends only on the amount of mCherry produced, independently
of whether it was transcribed from wild-type or destabilized
mRNA. In contrast, the cost originating from limiting transcription
will depend on the genomic copy number (transcribed genes), ir-
respective of how many proteins were eventually produced
(Figure S4B).
We applied this approach to cells growing at three different
conditions: low phosphate, low nitrogen, and standard media
(SC). The relative contribution of transcription versus translation
to the measured burden varied depending on growth conditions.
In medium low in phosphate, the cost scaled with the genomic
copy number, indicating that transcription is limiting. In contrast,
in medium low in nitrogen, the cost scaled more with mCherry
fluorescence, indicating that translation is limiting. In standard
media (SC), both transcription and translation contributed about
equally to the fitness cost (Figures 4B–4D, S4C, and S4D).
Cells growing in low phosphate are therefore limited in their
transcription capacity, while cells growing in low nitrogen are
limited in their translation capacity. To further verify that, we
examined whether these different conditions inflict differential
sensitivity to drugs that inhibit protein translation or gene tran-
scription. Indeed, cells growing in low nitrogen were more sensi-
tive to the translation-inhibiting drug hygromycin B, while cells
growing in low phosphate were more sensitive to the transcrip-
tion-inhibiting drug phenanthroline (Figures S4E–S4I; Supple-
mental Information).
Initiation and ElongationContribute to Protein Burden ina Condition-Dependent MannerWe next wished to map the measured limitations to the initia-
tion or the elongation steps of the respective transcription/
translation processes. To this end, we generated an additional
library, in which mCherry ORF (open reading frame) was fused
to GFP ORF. The two ORFs were separated by a linker, and
were transcribed as a single unit using the TDH3 promoter (Fig-
ure 5A). mCherry fluorescence levels were invariant to the
addition of GFP (Figure S5B). Comparing the fitness of the
new library to the original mCherry library enabled us to distin-
guish the relative contribution of initiation and elongation to
protein burden. In standard media (SC), the fitness cost scaled
with mCherry fluorescence, irrespectively of GFP production,
indicating that initiation is limiting. In contrast, in medium low
in nitrogen, the cost scaled with the total length of the tran-
scribed proteins, indicating that elongation is limiting (Figures
5B and S5D).
Introducing a stop codon between the mCherry and GFP,
reduced mCherry levels, likely reflecting nonsense-mediated
mRNA decay (Hentze and Kulozik, 1999; Figures 5C, S5B,
and S5C). Fitness cost of expressing this construct in low-nitro-
gen medium still scaled with the total length of the translated
proteins (mCherry only) (Figure 5D, left). Together, this maps
the limitation in low nitrogen to translation elongation. In
contrast, when growing this library in low phosphate, fitness
cost scaled primarily with the genomic copy number and not
with protein fluorescence, consistent with transcription initia-
tion being the main limiting factor (Figure 5D, right). Fitness
cost here was still somewhat lower than that of the fused
Cherry-GFP, suggesting a minor contribution of translation
elongation.
Cell Reports 14, 22–31, January 5, 2016 ª2016 The Authors 25
Low Pi Low NSC-1
1
0
Gro
wth
effe
ct (%
)
Low Pi Low NSC-1.4
-0.7
0
A
B
C D
% o
f WT
divi
sion
rate
(μ)
Rel
ativ
e co
ntrib
utio
n
100
90
80
SC SC
1 10 200 4 8
100
90
80
Low Pi
WT
DAmP
Low Pi
1 10 200 6 12
100
90
80
Low N Low N
1 10 200 4 8
Fluorescence(A.U,x104) Genomic copy number
promoter terminatormCherry An�bio�c resistance
promoter terminatormCherry
Figure 4. The Relative Contribution of Transcription and Translation
to the Fitness Cost of Protein Production
(A) Experimental strategy. mCherry protein fused to the Adh1 terminator, under
the TDH3 promoter (black). mCherry DAmP construct (red) have the same
mCherry gene under the same TDH3 promoter followed by antibiotic resis-
tance cassette. The lack of the terminator in the mCherry construct reduces
the mRNA stability and leads to �10-fold lower protein translation (Fig-
ure S4A). Accordingly, DAmP strains have the same mRNA transcription but
much lower translation.
(B) Fitness cost of strains from the wild-type and DAmP libraries grown in
different conditions: The reduced growth rate of the strains in thewild-type and
DAmP libraries are plotted as a function of protein fluorescence and as a
function of the integration copy number in thedifferent conditions, as indicated.
(Top) When phosphate is limiting, fitness cost is dominated by gene tran-
scription. Fitness scales with the copy number, but not with the fluorescence
levels, indicating low contribution of protein translation to the reduced fitness.
(Middle) In the low-nitrogen condition, the major contributor to the fitness cost
is translation. (Bottom) In standard media (SC), there is contribution of both
transcription and translation. For additional promoters, see Figure S4C.
(C and D) The relative contribution of transcription and translation to protein
burden is condition specific. Shown is the relative (C) and absolute effect per
copy number (D) contribution of transcription and translation to protein
burden. The model is described in Supplemental Experimental Procedures.
The error bars indicate the SE around the median. In (C), n = 3/2/2 (low
phosphate/SC/low nitrogen, respectively). In (D), the error bars indicate the
variation in the total cost and n = 5/3/3 (low phosphate/SC/low nitrogen,
respectively).
26 Cell Reports 14, 22–31, January 5, 2016 ª2016 The Authors
Translation Initiation Is Limiting in Slow-GrowingRespiring CellsRibosome content and energy are critical resources for protein
translation and are often implicated in limiting protein production
(Andrews and Hegeman, 1976; Emilsson and Kurland, 1990;
Klumpp et al., 2013; Maaløe and Kjeldgaard, 1966; Marr, 1991;
Scott et al., 2010, 2014; Vind et al., 1993). Wewere therefore sur-
prised that translation did not emerge as the universal, or major,
factor limiting growth of our rapidly proliferating cells. Further-
more, even in the one case where limitation was mapped exclu-
sively to translation elongation (low-nitrogen medium), it is more
likely due to shortage of amino acids previously reported under
these conditions (Boer et al., 2010). We reasoned that this might
reflect the unconstrained availability of energy expected from
fermenting cells, which direct the vast majority of their carbon
molecules to produce ethanol (Figure 6A). Indeed, each glucose
molecule generates two ATP molecules when fermented, but it
can generate 36 ATPs if respired, so that a minor re-direction
of the carbon flux toward respiration could provide all additional
energy required when the translation capacity is forced to in-
crease. As a result, we predicted that energy, and subsequently
translation, would become limiting when growing cells on a sub-
optimal carbon source that cannot be fermented.
To test this possibility, we grew our cells on a mixed ethanol-
glycerol media. Cells division time was �6 hr (Figure S6A),
compared to 1.5 hr for cells grown on glucose-supported media.
As predicted, limitation was mapped exclusively to translation;
the reduced fitness of the DAmP and wild-type strains scaled
with the amount of produced proteins, irrespective of mRNA sta-
bility (Figures 6B and S6B).
Energy limitation could directly impact on translation elonga-
tion and perhaps indirectly impact ribosomal machinery, as pro-
ducing ribosomes is the major biosynthetic activity of the cell
(Bremer and Dennis, 1996; Russell and Cook, 1995). We found
that the cost of expressing the fused mCherry-GFP protein
was the same as that of expressing mCherry alone, indicating
that the limitation is due to translation initiation (Figures 6C,
6D, and S6C). While ribosome content could limit either initiation
or elongation, a recent theoretical analysis concluded that initia-
tion is the rate-limiting step in ribosome function (Shah et al.,
2013). Together, our results suggest that during this slow growth
on a non-fermentable carbon source, protein production is
limited by ribosome content.
Cells Adapt to the Enforced Protein Production byIncreasing Their Cell Size andMakingMoreEndogenousProteinsIt is often assumed that microbes are optimized for rapid growth
(Schaechter et al., 1958). Accordingly, it is expected that cells
grow at their maximal possible capacity and cannot further in-
crease their overall biosynthesis. In this framework, enforcing
expression of unneeded proteins would necessarily come at
the expense of producing other proteins (Klumpp et al., 2013;
Scott et al., 2010; Shachrai et al., 2010). Our finding that ribo-
some content is not limiting under conditions of rapid growth,
prompted us to re-visit this assumption. If protein production is
not constrained, cells might grow larger when forced to express
excessive amounts of proteins. We therefore examined whether

0 3 6
0 3 6
0 3 6
0 3 6
0 3 6
0 3 6
1 5 90 3 6
80
90
100
80
90
100
80
90
100
80
90
100
Low PiLow N
promoter terminatormCherry GFPSTOP
promoter terminatormCherry Linker~15 bp GFP
promoter terminatormCherrymCherry
mCherry-GFP
mCherry-Stop
Fluorescence(A.U,x104)
C
D
A
B
Genomic copy number
Norm. fluorescence to A.A (A.U)
Norm. fluorescence to A.A (A.U)
% o
f WT
divi
sion
rate
(μ)
SC SC
Low N Low N
Low Pi Low Pi
% o
f WT
divi
sion
rate
(μ)
Elongationeffect
Inititationeffect
Figure 5. The Relative Contribution of Initiation and Elongation to
the Fitness Cost of Protein Production
(A) Experimental strategy. The mCherry mRNA (black) was extended to
also code for the GFP ORF (red). The two ORFs were separated by a linker,
and an additional library was constructed. When driven by the same TDH3
promoter, cells expressing this allele showed the same mCherry fluorescence
(Figure S5B). Therefore, the mCherry and mCherry-GFP libraries posed
the same burden on the initiation process but differed in the burden on
elongation.
(B) Distinguishing the contribution of initiation versus elongation to the fitness
cost. Shown is the relative growth rate of strains in the specified libraries,
which is plotted as a function of the mCherry fluorescence (left) and as a
function of the length of the translated proteins (right). (Top) SC media. Note
that fitness cost scales with the level of mCherry fluorescence, independently
of the presence of GFP, indicating low contribution of elongation to the cost.
(Middle) Limiting nitrogen. Note that fitness cost is dominated by elongation.
(Bottom) Limiting phosphate. Note that both initiation and elongation
contribute to the fitness cost.
(C) mCherry-Stop construct. As in (B), the mCherry mRNA was extended to
code for GFP ORF. However, in this construct, the linker between the two
ORFs contains translation stop codons. An additional library was constructed
using this construct. The addition of the stop codon resulted in a lower mRNA
cell size increased in our library strains using a Coulter counter.
Indeed, cell volume increased in proportion to the produced
mCherry proteins, with cells becoming up to �40% bigger.
This increase is consistent with the estimated fraction of added
proteins and may therefore be at least partially explained by
the extra proteins being produced (Figures 7A and 7B). Note
that as a consequence of the increased cell size, cell volume in
our library is negatively correlated with the cell growth rate (Fig-
ure 7C). This negative correlation contrasts the typical positive
correlation between size and division observed upon changing
conditions (Schaechter et al., 1958) but resembles the relation-
ship observed when the influx of glucose does not match the
levels predicted by sensing the environment (Schmidt-Glene-
winkel and Barkai, 2014)
We next asked whether expression of the enforced mCherry
protein comes at the expense of endogenous protein expression.
To examine that, we selected a group of�90 GFP-fused proteins
that span a broad range of expression levels (Figure S7A; Table
S4) and used the synthetic genetic array (SGA) technique (Cohen
and Schuldiner, 2011; Tong et al., 2001) to introduce the GFP-
fused proteins into mCherry-burdened cells. In short, the SGA
technique consists of mating an haploid cell expressing a given
GFP-fused protein with a haploid cell expressing either high or
low mCherry levels, subjecting the resulting diploid to meiosis
and sporulation, germinating the spores, and selecting for hap-
loids that contain both markers. We found variable levels of
mCherry expression following SGA using the high burden strain,
indicating instability of the long tandem integrations during
meiosis (not shown). We next mixed together haploids containing
the same GFP-fused proteins but either high or lowmCherry pro-
teins, grew them to log phase, and measured their fluorescence
using flow cytometry. This provided direct comparison of the
endogenous GFP-fused protein in high- and low-burden cells
grown under the same precise conditions (Figure 7D).
Notably, expression of endogenous proteins increased, rather
than decreased, when enforcing high expression of mCherry
proteins. Furthermore, on average, the increase in expression
was proportional to the amount of enforced mCherry production
and was dependent on the growth condition. The strongest ef-
fect was observed for cells grown in standard media (SC), where
we observed an averaged �20% increase in endogenous pro-
tein expression in cells expressing �18 copies of the pTDH3-
mCherry construct. Cells growing in low phosphate or low
nitrogen also increased their endogenous protein expression
in proportion to the enforcedmCherry production, but to a signif-
icantly lower amount. In none of the cases did we observe an
levels, presumably due to nonsense mediated decay (Hentze and Kulozik,
1999; Figures S5B and S5C).
(D) Distinguishing between the contribution of transcription elongation versus
translation elongation to the fitness cost. Shown is the fitness cost of all three
libraries specified in (A) and (C). (Left) Limiting nitrogen. All phenotypic cost in
all three libraries scaled with the normalized fluorescence, indicating that
fitness cost is dominated by translation elongation. (Right) Limiting phosphate.
Strains of the mCherry (black dots) and mCherry-stop (blue dots) libraries
scale with the genomic copy number, indicating that the limitation is mainly
due transcription initiation. Strains of the mCherry-GFP library (red dots) show
a somewhat higher fitness cost when scaled with the genomic copy number,
indicated a minor contribution of translation elongation.
Cell Reports 14, 22–31, January 5, 2016 ª2016 The Authors 27

Glucose
Pyruvate
GlycolysisBiomass
Fermentation Respiration
Cytosol
GlGlucose
Pyruvate
Respiration
% o
f WT
divi
sion
rate
(μ)
0 4 8
70
85
100
Fluorescence (A.U, x104)
DAmPmCherry mCherry
B
D
C
A
Tran
scrip
tion
Tran
slat
ion
Inititation
Elongation
Low Pi
SC
YPEGLow N
% o
f WT
divi
sion
rate
(μ)
0 4 8Fluorescence (A.U, x104)
mCherry-GFPmCherry-stop
Figure 6. Translation Initiation Is Limiting in
Slow-Growing Respiring Cells
(A) Central carbon metabolism in budding yeast.
When provided with glucose as a carbon source,
cells direct more carbon into fermentation (ethanol
production) with only a minor fraction used for
respiration.
(B) Translation is limiting in YEPG-growing cells.
mCherry and DAmP libraries are plotted; they
scale with the fluorescence, indicating that the
relative growth rate affected mainly by the amount
of translated proteins.
(C) The translation initiation process is limiting in
YEPG-growing cells. mCherry and Cherry-GFP li-
braries are plotted; they scale with mCherry fluo-
rescence, indicating that the relative growth rate
affected mainly by the number of created proteins
and not by their length. The Cherry-Stop strain is
also scaled with them, indicating that translation
initiation is the limiting factor.
(D) Condition-dependent origin of protein burden.
A summary of the data from Figures 4, 5, and 6.
Error bars indicate SE.
overall decreased average expression of the endogenous pro-
teins below the low-burden GFP amounts (Figures 7E and
S7B–S7D).
DISCUSSION
Common notion holds that microorganisms, including bacteria
and yeast, are optimized for rapid growth, making the most effi-
cient use of nutrients once these become available in order to
outgrow other microorganisms that share the same habitat. Pro-
teins are the growth driving force, but their production is a major
consumer of energy and nutrients. What are the fundamental
limits on cell growth rate? What cellular resources are limiting,
and how are they distributed? What limits protein production,
and how do these limitations impact the cell division cycle?
Our study touches on these questions by systematically interro-
gating the origins and consequences of protein burden: the
reduced growth rate of cells that are forced to express increas-
ingly high amounts of inert proteins.
We report threemain results. First, we demonstrate that forcing
cells to either transcribe or translate inert proteins reduces cell
growth in proportion to the introduced burden, and we map the
relative contributions of these processes in different conditions.
Second,we find that the capacity of the cells to tolerate increased
demand for transcription or translation differs between growth
conditions, even when the growth rates themselves remain
largely similar. Finally, we show that cells adapt to the enforced
burden by increasing their size and increasing the abundances
28 Cell Reports 14, 22–31, January 5, 2016 ª2016 The Authors
of endogenous proteins, suggesting a
general adaptation of the protein produc-
tion machinery and a limited competition
for common resources.
Our results call for revisiting some com-
mon notions invoked for describing the
physiology of cell growth. The first is the
question of whether maximal growth rate is set by optimal alloca-
tion of ribosomes, dedicating the maximal possible fraction of ri-
bosomes to the task of producing new ribosomes. This notion
comes largely from the realization that cell growth is fundamen-
tally limited by ribosome translation. For example, if 50% of the
ribosomes are occupied in making new ribosomes, each one of
those ribosomes will need to translate two ribosomes within
each cell cycle. In E. coli, ribosome translation requires
6–10 min, in agreement with their 20-min minimal division time
(Scott et al., 2010). Our results imply that budding yeast does
notwork in this limit, consistent with the larger difference between
cell-cycle time (�90 min) and the time it takes to translate a eu-
karyotic ribosome (�24 min; Planta and Mager, 1998; Waldron
et al., 1977; Supplemental Information). Thus, ribosome content
was not universally limiting in the rapid growth conditions we
tested. When we grew cells in medium containing low levels of
phosphate (while maintaining rapid growth; Figure 2C), limitation
was mapped to transcription initiation. Cells growing in SC were
equally limited by transcription and translation initiation, whereas
in yeast growing in low-nitrogen conditions, limitation was map-
ped to translation elongation (Figure 6D). This may be attributed
to a shortage of ribosomes, but we find it more likely to result
from the shortage of amino acids that has been described for
this medium (Boer et al., 2010). Therefore, ribosome activity
readily adapts to the increasing translation demands, at least in
some conditions. A likely implication of our results is therefore
that rapidly growing cells do not produce proteins at their
maximal possible capacity. This, again, calls for revisiting the

A B C
D E
Figure 7. Forcing Protein Production Results in an Increased Cell Size(A–C) Increased size of burdened cells. Cell size was measured using a Coulter counter. Volume is shown as a function of the genomic copy number (A), mCherry
fluorescence (B), or growth rate (C), and the color gradient denotes the increasing copy number. Fluorescence in YPEG cannot be compared due to high auto-
fluorescence of the medium.
(D) Experimental setup for measuring GFP level with the increased burden. Low- and high-haploid-burdened strains were mated with a library of�90 GFP-fused
genes and then subjected to a SGA protocol, resulting in new haploids containing both the GFP-fused gene and our mCherry burden. The low- and high-burden
strains for each GFP gene (left and right density clouds, respectively) grew together in the same well, allowing a highly controlled comparison of the GFP levels.
Black dashed lines represent the GFP and mCherry medians of the two strains. Shown is an FACS-data example of the TSA1 gene. For a gene list, see Table S4.
(E) Protein levels increase with the increasing burden throughout the different conditions. For each mCherry copy-numbers bin, the median of GFP fluorescence
ratio (high/low) was calculated. The endogenous gene levels are shown with the binned mCherry copy number, and a linear fit was plotted (dashed line; see also
Figures S7B–S7D and Supplemental Experimental Procedures). Error bars indicate SE in the bin.
commonassumption that protein production is set bymaximizing
the use of some limiting resource, be it the ribosome, nutrient, or
any other factor. Indeed, we show that cells readily adapt to the
increased protein production by increasing in size and the
amount of endogenous proteins.
If ribosomes, or other factors, are not limiting protein produc-
tion and cell growth, what defines a cell’s growth rate, and how
does it depend on the number of proteins produced? Our data
suggest that growth control involves the coordination of a variety
of processes that function in parallel, with different growth condi-
tions altering the relative importance of these processes. Pro-
posed cell physiological models (Bremer and Dennis, 1996;
Keren et al., 2013; Klumpp et al., 2013; Scott et al., 2010; Zaslaver
et al., 2009) provide the necessary rigorous framework for formu-
lating such limitations and testing possible hypotheses about
their consequences. Still, the space of possible models is too
broad considering the scarcity of available experimental data.
The experimental setup we have described provides data essen-
tial for restricting and refining the resource allocation models to-
ward the goal of understanding cell physiology and, in particular,
the interplay among protein production, cell size, and cell growth.
Yeast, like bacteria, is a fast-growing organism. By contrast, in
higher eukaryotes, most cells grow slower. Further, while
budding yeast metabolize glucose by fermentation, respiration
is predominant in most cells predominantly. By these criteria,
these cells would be more similar to our glycerol-grown cells,
in which ribosomes appear to be limiting. It would be interesting
to extent similar studies for these different cell types.
EXPERIMENTAL PROCEDURES
Strains and Media
All of the budding yeast (S. cerevisiae) strains in this study were based on
BY4741, BY4742 (Brachmann et al., 1998), or Y8205 (Tong and Boone,
2007) laboratory strains. Manipulations were performed using a standard
PEG;LiAC;ssDNA protocol (Gietz and Woods, 2002). For strains and plasmids
Cell Reports 14, 22–31, January 5, 2016 ª2016 The Authors 29

used in this research, see Supplemental Experimental Procedures and Table
S1; for strain stability, see Supplemental Information.
Strains were grown in YPDmedium, YPEGmedium, SCmedium, or SC me-
dium depleted of a specific nutrient, as described in the main text. Glucose-
limiting media contained 0.2% glucose. For starvation experiments, cells
were grown to stationery phase in SC medium overnight (optical density
[OD]�10) and were left without shaking at 30�C for 1 week. See Supplemental
Experimental Procedures for further details.
Competition Assays
Cells were grown to stationery phase in the relevant media overnight. GFP and
mCherry strains were then co-incubated in the specified media at 30�C. Fre-quencies of GFP versus mCherry cells were measured by flow cytometry.
The cells were diluted once a day and may have reached stationary phase
(except for the YPD log experiment, in which cells were diluted every �9 hr).
For more details and calculations, see Supplemental Experimental Proce-
dures. The full list of competition experiments performed is given in Table S2.
qPCR
Cells were harvested and frozen immediately in liquid nitrogen; DNA and RNA
were extracted using MasterPure Complete DNA and RNA Purification Kit
(Epicenter, MC85200), respectively. Next, RNA was reverse-transcribed to
cDNA using M-MLV Reverse Transcriptase kit (Promega, M1701). cDNA and
DNA levels were compared to the wild-type (WT) using ACT1 gene as refer-
ence (LightCycler 480, Roche).
Lag-Time Measurements
Following starvation, cells were returned to fresh SC medium and their OD600
was measured every 10min using an absorbance reader (Sunrise, Tecan). Lag
timewas defined as the time it took the cells to increase their OD600 by 1.5-fold.
Growth Curves and Generation Time
Cells were grown overnight in the different media, then diluted to OD600 �0.1
into shake flasks. ODs were measured (Novaspec Plus, Amersham Biosci-
ences) every 90/40 min (low-nitrogen medium/other media, respectively) for
�12 hr and a final OD600 measurement after �24 hr. Next, growth curves
were plotted: log2(OD) as a function of time in hours. The generation time
was calculated as 1/s’, where s’ is the slope’s linear part in the growth curve.
Quantitative Western Blots
Post-alkaline NaOH protein extraction protocol was performed followed by
standard quantitative western blot. See Supplemental Experimental Proce-
dures for further details.
Soluble, Insoluble, and Total Protein Isolation and Relative
Quantification
Soluble, insoluble, and total protein isolation and relative quantification were
performed as previously described (Geiler-Samerotte et al., 2011). Quantita-
tive western blots were performed as described above.
Microscopy
Cells were grown overnight to stationary phase, then diluted to a final OD of
�0.5. The photos were taken by a Delta Vision 1 microscope (Applied Preci-
sion) with the following optics objective: Olympus 603/1.42, Plan Apo N.
Cell Size
All the strains were diluted after overnight growth and left growing to OD600
�0.3. Next the cultures were diluted 1:40 with 0.5 M NaCl and imme-
diately measured in a Multisizer4 Coulter counter (Beckman Coulter) (Coulter,
1953).
GFP Level Measurements
Haploids from the SGA selection, which possessed both the GFP-tagged pro-
tein and the different copies of mCherry, were grown overnight in the relevant
media. The following day, cells from each plate were diluted 203 and mixed
1:1.5 (low:high burden) and were left to grow with shaking at 30�C for �5 hr
(�6 hr for low-nitrogen medium) before analysis in the flow cytometer
(�80,000 cells per well). See Supplemental Experimental Procedures for
further details.
30 Cell Reports 14, 22–31, January 5, 2016 ª2016 The Authors
Data Analysis and Modeling
For the protein abundance calculation of one genomic copy strain, see Sup-
plemental Experimental Procedures.
For protein cost origin analysis andmodeling and GFP haploid libraries anal-
ysis, see Supplemental Experimental Procedures.
SUPPLEMENTAL INFORMATION
Supplemental Information includes Supplemental Experimental Procedures,
seven figures, and four tables and can be found with this article online at
http://dx.doi.org/10.1016/j.celrep.2015.12.015.
AUTHOR CONTRIBUTIONS
M.K. and E.M.-R. designed experiments, performed research, interpreted data
and wrote the manuscript. G.J. designed chemostat experiments and per-
formed research. N.B. designed and supervised research, interpreted data,
and wrote the manuscript.
ACKNOWLEDGMENTS
We thank N. Vardi for introducing the integrationmethod, the Schuldiner lab for
the kind help with generating the SGA protocol and for the quantitative western
blot analysis, and our lab members for the fruitful discussions. This work was
supported by the ERC and the ISF.
Received: August 12, 2015
Revised: October 13, 2015
Accepted: November 23, 2015
Published: December 24, 2015
REFERENCES
Andrews, K.J., and Hegeman, G.D. (1976). Selective disadvantage of non-
functional protein synthesis in Escherichia coli. J. Mol. Evol. 8, 317–328.
Boer, V.M., Crutchfield, C.A., Bradley, P.H., Botstein, D., and Rabinowitz, J.D.
(2010). Growth-limiting intracellular metabolites in yeast growing under diverse
nutrient limitations. Mol. Biol. Cell 21, 198–211.
Brachmann, C.B., Davies, A., Cost, G.J., Caputo, E., Li, J., Hieter, P., and
Boeke, J.D. (1998). Designer deletion strains derived from Saccharomyces
cerevisiae S288C: a useful set of strains and plasmids for PCR-mediated
gene disruption and other applications. Yeast 14, 115–132.
Bremer, H., and Dennis, P. (1996). Modulation of chemical composition and
other parameters of the cell by growth rate. In Escherichia Coli and Salmonella,
F.C. Neidhardt, ed. (ASM Press), pp. 1553–1569.
Cohen, Y., and Schuldiner, M. (2011). AdvancedMethods for High-Throughput
Microscopy Screening of Genetically Modified Yeast Libraries (Humana
Press).
Coulter, W.H. (1953). Means for counting particles suspended in a fluid. http://
www.cyto.purdue.edu/cdroms/cyto10a/seminalcontributions/media/keypapers/
2656508.pdf.
Dennis, P.P., Ehrenberg, M., and Bremer, H. (2004). Control of rRNA synthesis
in Escherichia coli: a systems biology approach. Microbiol. Mol. Biol. Rev. 68,
639–668.
Dong, H., Nilsson, L., and Kurland, C.G. (1995). Gratuitous overexpression of
genes in Escherichia coli leads to growth inhibition and ribosome destruction.
J. Bacteriol. 177, 1497–1504.
Eames, M., and Kortemme, T. (2012). Cost-benefit tradeoffs in engineered lac
operons. Science 336, 911–915.
Emilsson, V., and Kurland, C.G. (1990). Growth rate dependence of transfer
RNA abundance in Escherichia coli. EMBO J. 9, 4359–4366.
Geiler-Samerotte, K.A., Dion, M.F., Budnik, B.A., Wang, S.M., Hartl, D.L., and
Drummond, D.A. (2011). Misfolded proteins impose a dosage-dependent

fitness cost and trigger a cytosolic unfolded protein response in yeast. Proc.
Natl. Acad. Sci. USA 108, 680–685.
Gietz, R.D., and Woods, R.A. (2002). Transformation of yeast by lithium ace-
tate/single-stranded carrier DNA/polyethylene glycol method. Methods Enzy-
mol. 350, 87–96.
Hauf, J., Zimmermann, F.K., and M€uller, S. (2000). Simultaneous genomic
overexpression of seven glycolytic enzymes in the yeast Saccharomyces cer-
evisiae. Enzyme Microb. Technol. 26, 688–698.
Hentze, M.W., and Kulozik, A.E. (1999). A perfect message: RNA surveillance
and nonsense-mediated decay. Cell 96, 307–310.
Horiuchi, T., Tomizawa, J.-I., and Novick, A. (1962). Isolation and properties of
bacteria capable of high rates of b-galactosidase synthesis. Biochim. Biophys.
Acta 55, 152–163.
Keren, L., Zackay, O., Lotan-Pompan, M., Barenholz, U., Dekel, E., Sasson, V.,
Aidelberg, G., Bren, A., Zeevi, D., Weinberger, A., et al. (2013). Promoters
maintain their relative activity levels under different growth conditions. Mol.
Syst. Biol. 9, 701.
Klumpp, S., Scott, M., Pedersen, S., and Hwa, T. (2013). Molecular crowding
limits translation and cell growth. Proc. Natl. Acad. Sci. USA 110, 16754–
16759.
Kurland, C.G. (1992). Translational accuracy and the fitness of bacteria. Annu.
Rev. Genet. 26, 29–50.
Lang, G.I., Murray, A.W., and Botstein, D. (2009). The cost of gene expression
underlies a fitness trade-off in yeast. Proc. Natl. Acad. Sci. USA 106, 5755–
5760.
Maaløe, O., and Kjeldgaard, N.O. (1966). Control of macromolecular synthesis
a study of DNA, RNA, and protein synthesis in bacteria (New York: W.A.
Benjamin).
MacLean, R.C. (2007). Pleiotropy and GAL pathway degeneration in yeast.
J. Evol. Biol. 20, 1333–1338.
Marr, A.G. (1991). Growth rate of Escherichia coli. Microbiol. Rev. 55, 316–333.
Mateus, C., and Avery, S.V. (2000). Destabilized green fluorescent protein for
monitoring dynamic changes in yeast gene expression with flow cytometry.
Yeast 16, 1313–1323.
McAlister, L., and Holland, M.J. (1985). Differential expression of the three
yeast glyceraldehyde-3-phosphate dehydrogenase genes. J. Biol. Chem.
260, 15019–15027.
Molin, S., von Meyenburg, K., Gullov, K., and Maaloe, O. (1974). The size of
transcriptional units for ribosomal proteins in Escherichia coli. Mol. Gen.
Genet. 129, 11–26.
Muhlrad, D., and Parker, R. (1999). Aberrant mRNAs with extended 30 UTRsare substrates for rapid degradation by mRNA surveillance. RNA 5, 1299–
1307.
Nguyen, T.N., Phan, Q.G., Duong, L.P., Bertrand, K.P., and Lenski, R.E. (1989).
Effects of carriage and expression of the Tn10 tetracycline-resistance operon
on the fitness of Escherichia coli K12. Mol. Biol. Evol. 6, 213–225.
Novick, A., and Weiner, M. (1957). Enzyme induction as an all-or-none phe-
nomenon. Proc. Natl. Acad. Sci. USA 43, 553–566.
Planta, R.J., and Mager, W.H. (1998). The list of cytoplasmic ribosomal pro-
teins of Saccharomyces cerevisiae. Yeast 14, 471–477.
Russell, J.B., and Cook, G.M. (1995). Energetics of bacterial growth: balance
of anabolic and catabolic reactions. Microbiol. Rev. 59, 48–62.
Schaechter, M., Maaloe, O., and Kjeldgaard, N.O. (1958). Dependency onme-
dium and temperature of cell size and chemical composition during balanced
grown of Salmonella typhimurium. J. Gen. Microbiol. 19, 592–606.
Schimmel, P. (1993). GTP hydrolysis in protein synthesis: two fur Tu? Science
259, 1264–1265.
Schmidt-Glenewinkel, H., and Barkai, N. (2014). Loss of growth homeostasis
by genetic decoupling of cell division from biomass growth: implication for
size control mechanisms. Mol. Syst. Biol. 10, 769.
Schuldiner, M., Collins, S.R., Thompson, N.J., Denic, V., Bhamidipati, A.,
Punna, T., Ihmels, J., Andrews, B., Boone, C., Greenblatt, J.F., et al. (2005).
Exploration of the function and organization of the yeast early secretory
pathway through an epistatic miniarray profile. Cell 123, 507–519.
Scott, M., and Hwa, T. (2011). Bacterial growth laws and their applications.
Curr. Opin. Biotechnol. 22, 559–565.
Scott, M., Gunderson, C.W., Mateescu, E.M., Zhang, Z., and Hwa, T. (2010).
Interdependence of cell growth and gene expression: origins and conse-
quences. Science 330, 1099–1102.
Scott, M., Klumpp, S., Mateescu, E.M., and Hwa, T. (2014). Emergence of
robust growth laws from optimal regulation of ribosome synthesis. Mol.
Syst. Biol. 10, 747.
Shachrai, I., Zaslaver, A., Alon, U., and Dekel, E. (2010). Cost of unneeded pro-
teins in E. coli is reduced after several generations in exponential growth. Mol.
Cell 38, 758–767.
Shah, P., Ding, Y., Niemczyk, M., Kudla, G., and Plotkin, J.B. (2013). Rate-
limiting steps in yeast protein translation. Cell 153, 1589–1601.
Stoebel, D.M., Dean, A.M., and Dykhuizen, D.E. (2008). The cost of expression
of Escherichia coli lac operon proteins is in the process, not in the products.
Genetics 178, 1653–1660.
Tong, A.H.Y., and Boone, C. (2007). Yeast Gene Analysis, Second Edition
(Elsevier).
Tong, A.H., Evangelista, M., Parsons, A.B., Xu, H., Bader, G.D., Page, N., Rob-
inson, M., Raghibizadeh, S., Hogue, C.W., Bussey, H., et al. (2001). Systematic
genetic analysis with ordered arrays of yeast deletion mutants. Science 294,
2364–2368.
Vind, J., Sørensen, M.A., Rasmussen, M.D., and Pedersen, S. (1993). Synthe-
sis of proteins in Escherichia coli is limited by the concentration of free ribo-
somes. Expression from reporter genes does not always reflect functional
mRNA levels. J. Mol. Biol. 231, 678–688.
Waldron, C., Jund, R., and Lacroute, F. (1977). Evidence for a high proportion
of inactive ribosomes in slow-growing yeast cells. Biochem. J. 168, 409–415.
Warner, J.R. (1999). The economics of ribosome biosynthesis in yeast. Trends
Biochem. Sci. 24, 437–440.
Zamenhof, S., and Eichhorn, H.H. (1967). Study of microbial evolution through
loss of biosynthetic functions: establishment of ‘‘defective’’ mutants. Nature
216, 456–458.
Zaslaver, A., Kaplan, S., Bren, A., Jinich, A., Mayo, A., Dekel, E., Alon, U., and
Itzkovitz, S. (2009). Invariant distribution of promoter activities in Escherichia
coli. PLoS Comput. Biol. 5, e1000545.
Cell Reports 14, 22–31, January 5, 2016 ª2016 The Authors 31