the cost of hunger - documents.wfp.org · 2 the cost of hunger in africa: results from egypt the...
TRANSCRIPT

The Cost of
HUNGER in Egypt
Implications of
Child
Undernutrition
on the Social
and Economic
Development
of Egypt
The Social and Economic Impact
of Child Undernutrition in Egypt
The Egyptian Cabinet
Information and Decision
Support Center
(IDSC)

All rights reserved. No part of this publication may be reproduced, stored in a retrieval system or transmitted, in
any form or by any means, electronic, mechanical, photocopying, recording or otherwise, without prior permission.
Design: Rachel Quint, Addis Ababa, Ethiopia
Initial Funding Provided by

2
The Cost of Hunger in Africa:
Results from Egypt
The Cost of
HUNGER in Egypt
Implications of Child
Undernutrition
on the Social and Economic
Development of Egypt
Social and Economic
Impacts of Child
Undernutrition in Egypt

The Cost of Hunger
in When a child is undernourished,
the negative consequences follow
that child for his/her entire life.
These negative consequences also
have grave effects on the
economies where s/he lives, learns
and works.

4
The Cost of Hunger in Africa:
Results from Egypt
Contents Foreword ............................................................................................................................................... 6
Acknowledgements .............................................................................................................................. 8
Acronyms ............................................................................................................................................. 10
Executive Summary ............................................................................................................................ 12
Section 1: Brief Socio-Economic Background .................................................................................. 15
Section 1I: Cost of Hunger in Africa Methodology .......................................................................... 19
A. Introduction: Why is it important? ............................................................................................... 20
B. Brief description of the model ...................................................................................................... 22
i. Conceptual framework ....................................................................................................................... 22
ii. Causes of undernutrition .................................................................................................................... 23
i. Consequences of undernutrition ........................................................................................................ 24
ii. Dimensions of analysis ......................................................................................................................... 25
iii. Methodological aspects ....................................................................................................................... 26
Section III: Effects and Costs of Child Undernutrition .................................................................... 29
A. Social and economic cost of child undernutrition in the health ................................................... 30
i. Effects on Morbidity ............................................................................................................................ 30
ii. Stunting levels of the working age population .................................................................................... 31
iii. Effects on mortality ............................................................................................................................. 32
iv. Estimation of public and private health costs ...................................................................................... 33
B. Social and economic cost of child undernutrition in education ................................................... 34
i. Effects on repetition ............................................................................................................................ 35
ii. Effects on retention ............................................................................................................................. 36
iii. Estimation of public and private education costs ................................................................................ 37
C. The social and economic cost of child undernutrition in productivity ........................................ 38
i. Loss from non-manual activities due to reduced schooling ................................................................ 38
ii. Losses in manual intensive activities .................................................................................................... 40
iii. Opportunity cost due to higher mortality of undernourished children ............................................. 40
iv. Overall Productivity Losses ................................................................................................................. 41
D. Summary of effects and costs .............................................................................................................. 42
Section 1V: Analysis of Scenarios ...................................................................................................... 43
Section V: Conclusions and Recommendations ............................................................................... 47
A. Child Undernutrition: Implications for Egypt’s social and economic development ............................ 48

Contents
5
B. Recommendations of the study ........................................................................................................... 50
Section V1: Annexes ........................................................................................................................... 52
Annex 1. Glossary of Terms ..................................................................................................................... 53
Annex 2. Methods and Assumptions ....................................................................................................... 56
Annex 3. Brief Description of COHA Data Collection Process .............................................................. 60
Annex 4. Consulted References ............................................................................................................... 61

6
The Cost of Hunger in Africa:
Results from Egypt
Foreword
Over the past decade, Egypt has faced a series of shocks that have triggered a decline in food security and nutrition
trends. Alongside growing poverty and food insecurity, stunting rates due to undernutrition among children under
five have increased in the last decade to reach 28.9% in 2008, accompanied by the growing rates of anemia that
were estimated at 48.5% in 2005, according to the Demographic Health Survey. Undernutrition and related chronic
diseases, such as noncommunicable diseases that follow later in life, create a vicious circle that poses a fundamental
challenge to policy making.
According to findings in this study, undernutrition cannot be addressed through the health sector alone but rather
through consolidated efforts at the national level, requiring a comprehensive and coordinated multi-sectoral
approach. The analysis of the social and economic consequences of child undernutrition revealed a connection
between this and increased health care costs due to illness, as well as an increased educational burden due to higher
repetition and early drop-out rates which in turn contribute to reduced labour productivity. The study highlights
that long term sustainable development cannot happen without effectively combatting undernutrition and the
elimination of childhood stunting, as key elements of the social development agenda.
A reduction in the number of stunted children in Egypt will be an indicator of the effectiveness of social protection
policies which would contribute to improved living conditions as well as reduce potential cognitive, mental and
psychomotor impairment. By removing barriers caused by undernutrition, these children will have the same
opportunities for success as their counterparts, who have enjoyed healthy childhoods. Achieving this will serve as an
important element for increasing inclusive growth in the country.
This report on The Economic and Social Impact of Child Undernutrition in Egypt is part of a wider regional study
on The Cost of Hunger in Africa. We would like to acknowledge its production under the national leadership of the
Egyptian Cabinet’s Information and Decision Support Center. In the development of this study we would like to
thank the African Union Commission, the New Partnership for Africa's Development, the UN Economic
Commission for Africa and the World Food Programme for bringing this issue to the centre of the development
agenda. This report could not have been prepared without the support of Egypt’s Central Agency for Public
Mobilization and Statistics, the Ministry of Health and the Ministry of Education.

Acronyms
7

8
The Cost of Hunger in Africa:
Results from Egypt
Acknowledgements This document is based on the report “The Social and Economic Impact of Child Undernutrition in Egypt, Ethiopia,
Swaziland and Uganda”, prepared within the framework of the Memorandum of Understanding between the UN
Economic Commission for Africa (ECA) and the World Food Programme (WFP). “The Cost of Hunger in Africa:
The Economic and Social Impact of Child Undernutrition”, was coordinated by Josué Dioné, Director of the Food
Security and Sustainable Development Division at ECA, Steven Were Omamo and Abdoulaye Diop from the WFP
Liaison Office to the African Union and ECA, and Mustapha Sidiki Kaloko, Commissioner for Social Affairs at the
African Union Commission (AUC).
Special recognition has to be given to the National Implementation Team (NIT) in Egypt, as they were responsible
for collecting, processing and presenting results. The team was led by the Information and Decision Support Centre
(IDSC), particularly Dr. Nisreen Lahham (Data Analysis and Research Department, Deputy Manager), Ms. Neveen
El-Helw (Statistical Researcher), Ms. Hend Samir (Statistical Researcher), Ms. Heba Adel (Statistical Researcher), Ms.
Radwa Karam (Statistical Researcher), Ms. Heba Yousef (Economic Researcher), Dr. Mohamed Ramdan and Ms.
Nadine El-Hakeem and Jane Waite from the WFP Country Office. The regional support team was initially led by
Francisco Espejo from WFP followed by Carlos Acosta Bermudez from ECA, with the support of Rachel Quint and
Yohanan Ermias from WFP and Shewit Aseffa from ECA. and additional technical guidance from Rodrigo Martinez
and Amalia Palma, from the Social Development Division of the Economic Commission for Latin America and the
Caribbean (ECLAC).
The research team would like to sincerely thank those who gave fruitful inputs to the study either through
providing data and information or through actively participating in discussion and providing their expertise to the
research team. These people are as follows: Ms Fatma El-Ashry (CAPMAS) who provided the team with needed
data, Dr. Huda Al-Kitkat (IDSC) who provided the team with needed population projections, Ms. Samar Mahmoud
and Mr. Ahmed Soliman (former IDSC) who was part of the team at the inception of the project. They are no
longer with IDSC, but the result of their extended hours of work is more than commendable. The team would like
to further thank Ministry of Education for the extensive array of data they provided the team on such short notice.
The team is also grateful for the institutional leadership provided to this project by: Nkosazana Dlamini Zuma,
Chairperson, AUC; Carlos Lopes, Executive Secretary, ECA; Ertharin Cousin, Executive Director, WFP; and
Ibrahim Mayaki, CEO, New Partnership for Africa’s Development (NEPAD).
The design and implementation of the study was directed by a Steering Committee jointly led by Menghestab Haile
(WFP), Maurice Tankou (ECA), Ademola Olajide and Janet Byaruhanga from the Health, Nutrition and Population
Division of the Social Affairs Department at the AUC and Boitshepo Bibi Giyose from NEPAD.
The Steering Committee highlights the special contributions by the IDSC in supporting the adaptation of the Model
to Estimate the Social and Economic Impact of Child Undernutrition in Africa. Their contributions evidence Egypt’s
commitment to regional collaboration.

Acronyms
9

10
The Cost of Hunger in Africa:
Results from Egypt
Acronyms
ACGSD African Centre for Gender and Social Development
ACS African Centre for Statistics
ADFNS Africa Day for Food and Nutrition
ADS Acute Diarrheal Syndrome
AfDB African Development Bank
ARI Acute Respiratory Infection
ARNS Africa Regional Nutrition Strategy
ATYS-VMD Africa Ten Year Strategy for the Reduction of Vitamin and Mineral Deficiencies
AU African Union
AUC African Union Commission
CAADP The Comprehensive Africa Agriculture Development Programme
CAMPAS Central Agency for Public Mobilization and Statistics
CEN-SAD Community of Sahel-Saharan States
COHA Cost of Hunger in Africa
COMESA Common Market for Eastern and Southern Africa
DHS Demographic and Health Survey
ECCAS Economic Community of Central African States
ECLAC Economic Commission for Latin America and the Caribbean
ECOWAS Economic Community of West African States
EDND Economic Development and NEPAD Division/ UNECA
EGP Egyptian Pound
FAFS Framework for African Food Security
FAO Food and Agriculture Organization
FTF Feed the Future
GDP Gross Domestic Product
GNI Gross National Income
HIECS Household Income, Expenditure and Consumption Survey
ICU Intensive Care unit
IDSC Information and Decision Support Centre
IFAD International Fund for Agricultural Development
IGAD Intergovernmental Authority for Development
ILO International Labour Organization
IUGR Intra Uterine Growth Retardation
LBW Low Birth Weight
MDGs Millennium Development Goals
MENA Middle East and North Africa
NCHS National Centre for Health Statistics
NEPAD The New Partnership for Africa’s Development
NGO Non Governmental Organization
NIT National Implementation Team
NPCA NEPAD Planning and Coordinating Agency
OECD Organization for Economic Cooperation and Development
PANI Pan- African Nutrition Initiative
P4P Purchase for Progress
PSS Public Social Spending
REACH Renewed Efforts Against Child Hunger
SADC Southern African Development Community
SUN Scaling Up Nutrition
UMA Union du Maghreb Arabe

Acronyms
11
UNECA United Nations Economic Commission for Africa
UNESCO United Nations Educational, Scientific and Cultural Organization
UNICEF United Nations Children’s Fund
USAID United States Agency for International Development
WAP Working Age Population
WFP World Food Programme
WHO World Health Organization
12
The Cost of Hunger in Africa:
Results from Egypt
Executive Summary The Cost of Hunger in Africa (COHA) is an African Union Commission (AUC) led initiative through which countries are able to
estimate the social and economic impact of child undernutrition in a given year. Twelve countries are initially participating in the
study. Egypt is part of the four first-phase countries, the first to carry out the study and present results.
The COHA study illustrates that child undernutrition is not only a social, but also an economic issue, as countries are losing
significant sums of money as a result of current and past child undernutrition. To that end, in March 2012, the regional COHA
study was presented to African Ministers of Finance, Planning and Economic Development, who met in Addis Ababa, Ethiopia.
The Ministers issued a resolution confirming the importance of the study and recommending it continue beyond the initial stage.
The COHA study in Egypt is led by the Egyptian Cabinet's Information and Decision Support Centre (IDSC), with support from
the Central Agency for Public Mobilization and Statistics (CAPMAS), the Ministry of Health, the Ministry of Education, and the
World Food Programme (WFP) Egypt Country Office. At regional level, the COHA project is led by the African Union
Commission (AUC) with technical leadership from the United Nations Economic Commission for Africa (UNECA) and support
from WFP and NEPAD.
During the process, all data for the study were collected from national data sources including the 2009 CAPMAS Household
Income, Expenditure and Consumption Survey (HIECS), 2009 Labour Force Survey, 2008 DHS, the African Centre for Statistics,
and primary data collection. The data was collected and processed with support from IDSC and the WFP Egypt Country Office.
Methodology
The COHA model is used to estimate the additional cases of morbidity, mortality, school repetitions, school dropouts and
reduced physical capacity that can be directly associated with undernutrition in children under the age of five. In order to
estimate these social impacts for a single year, the model focuses on the current1 population, identifies the percentage of that
population who were undernourished before the age of five, and then estimates the associated negative impacts experienced by
the population in the current year. Using this information and economic data provided by the National Implementation Team
(NIT), the model then estimates the associated economic losses incurred by the economy in health, education, and in potential
productivity in a single year.
Trends in Child Stunting
The current levels of child undernutrition evidence the challenges in the reduction of child hunger. Egypt made important
progress reducing stunting rates from 35% in the early 90s to just over 20% in 2003. Nevertheless, the data shows that Egypt
has fallen back in this progress and that there has been an increase in the prevalence of stunted children from 17.6% (2005) to
28.9% (2008) in the last few years. This would mean that 2.7 of the 9.2 million children under the age of five in 2009 are affected
by growth retardation. Additionally, 33% of the school age population, representing 7.4 million children, and 41% of the working
age population, representing 20.4 million people, are also suffering from the consequences of childhood stunting.
Initial Results: The Social and Economic Cost of Child Undernutrition in Egypt
Overall results show that 20.3 billion Egyptian pounds (EGP) were lost in the year 2009 as a result of child undernutrition. This
is equivalent to 1.98% of GDP.
For 2009, there were an estimated 901,440 additional clinical episodes associated with undernutrition in children under
five, which incurred a cost of an estimated 1.17 billion EGP. Cases of diarrhoea, respiratory infections and anaemia
totalled 126,223 episodes in addition to the 775,217 cases of underweight children. According to the estimated data,
only 1 out of every 5 of these episodes received proper health attention.
Undernutrition was associated with 11% of all child mortalities, which represented over 6,000 child deaths in 2009, and
over 28,102 in the period from 2004 to 2009.
1 The model set 2009 as the base year, given the availability of data for that year and in order to insure the continuity of the study. As it is the
most recent possible study year, it is referred to as “current” in this report.

Section II:
Cost of Hunger in Africa Methodology
13
Stunted children have a higher grade repetition rate, at 7.4% than non-stunted children, at 5.4%. This incremental rate
generated 79,396 additional cases of grade repetition in 2009, in which the education system and families incurred a
cost of 271 million EGP.
Stunted children in Egypt are also more likely to drop out of school. Based on information from the 2009 CAPMAS
Labour survey, the model estimated that the average schooling achievement for a person who was stunted as a child is
0.2 years lower than for a person who was not stunted. This disadvantage in the labour market is estimated to have
generated private costs of 2.7 billion EGP in potential productivity for a single year.
40 percent of adults in Egypt are stunted. This represented more than 20 million people of working age that are not
able to achieve their potential, as a consequence of child undernutrition. In rural Egypt, where most people are engaged
in manual activities, it is estimated that in 2009 alone, 10.7 billion EGP were not produced due to lower physical
capacity of this group.
Lastly, an estimated 857 million working hours were lost in 2009 due to absenteeism from the workforce as a result of
nutrition-related mortalities. This represents 5.4 billion EGP which is equivalent to 0.5% of the country’s GDP.
Analysis of Scenarios
In addition to calculating a retrospective cost for 2009, the model also can highlight potential savings, based on different
scenarios. These scenarios are constructed based on the estimated net present value of the costs associated with undernutrition
of the children born in each year, from 2009 to 2025. The methodology follows each group of children and, based on each
scenario, estimates a progressive path towards its achievement.
Scenario Baseline:
The Cost of Inaction by 2025
Scenario #1:
Halving the Prevalence of Child
Undernutrition by 2025
Scenario #2.
The ‘Goal’ Scenario:
“10% and 5% by 2025”
Description
Prevalence of stunted and
underweight children stops at the
level recorded in 2009
(28.9% and 6.8% respectively)
Prevalence of underweight and
stunted children would be
reduced to half of 2009.
(14.5% and 5% respectively)
Prevalence of stunted children is
reduced to 10% and
underweight children of less
than five years of age, to 5%
Implications
No increase or decrease in
percentage points, but an increase
in total number of stunted
children and higher burden on the
society
A constant annual reduction of
0.9% points in the
prevalence of stunting is
required
A constant annual reduction
1.2% points in the
prevalence of stunting is
required
Estimated
Change in period
Cost increase of up to 32% by
2025 compared to the values in
2009
Accumulated savings of
11.7 billion EGP for the period
from 2009 to 2025
Accumulated savings of
14.5 billion EGP for the period
from 2009 to 2025
Annual Average
Savings none
EGP 732 million
($US133 million)
EGP 907 million
($US165 million)
Summary of Conclusions and Recommendations
The Cost of Hunger in Africa (COHA) study presents an opportunity to better understand the role that child nutrition can play
in maximizing the economic capacity of Egypt. In Egypt, the results of the study strongly suggest that, in order achieve the
national goals of doubling the income, eliminating unemployment, and establishing a sustained annual growth rate, special
attention must be given to addressing nutrition in the early stages of an individual’s life (in the first 1000 days). The study
estimates that child undernutrition generates health costs equivalent to 1.1 billion EGP, and that 11% of all cases of child
mortality are associated with the higher risk of undernutrition. With regards to education, the results show that 10% of all grade
repetitions in school are associated with the higher incidence of repetition experienced by stunted children. The study estimates

14
The Cost of Hunger in Africa:
Results from Egypt
the economic and social cost of child undernutrition at 20.3 billion EGP. Without measures to combat and eliminate
undernutrition, this cost is expected to increase by about 32% by 2025 to reach to 26.8 billion EGP.
Some of the key findings of the study indicate the need to review national development frameworks and develop a
comprehensive and holistic national economic and health plan that includes nutrition as a key component. Further, it is
recommended that nutrition interventions are mainstreamed within the primary health care system, with increased investment
into institutional capacity to regularly detect, monitor and address undernutrition, and clearly link findings into prevention
interventions. This requires a focus on preventative policies, as well as from therapeutic practices. In order to address some of
the consequences of undernutrition, raising awareness of nutrition is critical, particularly through schools. Lastly, it is suggested
that facilitating access to healthier food commodities, including through the food subsidy system, amended agricultural policies,
and mandatory food fortification be considered.

Section II:
Cost of Hunger in Africa Methodology
15
Section 1:
Brief Socio-
Economic
Background

16
The Cost of Hunger in Africa:
Results from Egypt
Brief Socio Economic and
Nutritional Background
The Arab Republic of Egypt (hereafter referred to as Egypt) is the largest Arab country and the third largest African country by
population. Egypt has a Gross Domestic Product (GDP) estimated at 1.042 trillion EGP2 (2009) and a per capita Gross National
Income (GNI) of approximately $US2,600, which has grown considerably in the last decade. Further, inequality and extreme
poverty rates have maintained relatively low levels in the country, with a GINI index of 30 and less than 2% of the population
living on under $US1.25 a day; however estimates for people living on under $US2.00 a day are as high as 18% for the
population.
TABLE I.1
SOCIO-ECONOMIC INDICATORS
Indicators 2000-2002 2005-2007 2009-2011
GDP, total in billions of EGP3 378.9 744.8 1042.2 (08/09)
GNI Per Capita (Atlas Method current $US) 1,370 1,560 2,600
Poverty - $1.25 a day (PPP) (% of population) 1.81 1.99 1.69
Population below the National Line (% of the Population)4 16.7 19.6 25.2
GINI Index 32.8 32.1 30.8
Labor Force, total (in millions) 20.7 25.1 27.1
Rural Population, percentage 57% 57% 57%
Percentage of Population in Agriculture 27.5% 31.7% …
Unemployment, % of total labor force 10.2% 8.9% 12%
Unemployment, youth total (% of total labor force ages 15-24) 27.1% 24.8% …
Unemployment, youth female (% of female labor force ages 15-24) 40% 47.9% …
Population Growth (Annual %) 1.85% 1.80% 1.73%
Life expectancy at birth, total (years) 70 72 73
Source if not otherwise noted: World Bank Database5
One of Egypt’s main socioeconomic challenges centres on youth employment. The national unemployment level is estimated at
12%, nevertheless, youth unemployment is 2 times higher, and nearly half of all women 15-24 are unemployed.
2 "World Economic Outlook Database October 2012," World Economic Outlook Database, October 2012,
http://www.imf.org/external/pubs/ft/weo/2012/02/weodata/index.aspx. 3 Ibid 4 CAPMAS, Statistical Yearbook 2012. (http://www.capmas.gov.eg/book.aspx) 5 "Egypt" Data accessed March 15, 2013, http://data.worldbank.org/country/egypt.

Section II:
Cost of Hunger in Africa Methodology
17
Egypt has experienced an important period of economic expansion in the last decade, with average growth rates higher than
those reported for Africa and the North Africa region. Nevertheless, this performance has slowed in the last years, largely due
to political upheaval in the wake of the 2011 revolution. According to data from the African Economic Outlook6, it is estimated
that the real GDP growth rates will range from 0.8% to 2.8% in the next two years.
FIGURE I.1
TRENDS IN REAL GDP GROWTH, 2003-2013
(In percentages)
Source: African Economic Outlook 2012, Figures for 2010 are estimates; for 2011 and later are projections.
Public investment in the social sector has also been maintained in the last decade, but is still below the average, by proportion,
compared to the Middle East and North Africa (MENA) region. Public spending in education is estimated at 11.9%, ten
percentage points below the regional average of almost 19.9%. Health expenditures are also low compared to the rest of the
region, both from a per capita perspective and as a proportion of GDP.
TABLE I.2
SOCIAL INVESTMENT INDICATORS
Indicators 2005-06 2007-08 2009-10 Middle East & North Africa *
Public spending on education, total (% of govern. Exp.) 11.9% 11.9% … 19.9%
Public spending on education, total (% of GDP) 4.0% 3.8% … 4.8%
Health expenditure per capita (current $US) 75.24 101.23 123.18 203.18
Health expenditure, total (% of GDP) 5.3% 4.8% 4.6% 5.3%
Health expenditure, public (% of total health expenditure) 44.2% 42.2% 37.4% 50.1%
Source: World Bank Database, most recent year available * Developing countries only - Latest data available
From a nutritional perspective, Egypt has maintained low levels of underweight children for the past decade. Nevertheless, based
on the application on the WHO child growth standards7, the stunting rates for children under five (0-69 months) have increased
in the same period from 20.3% to 28.9% as reported in DHS8 reports. The data reported in this source has a small variation
from the reported data on WHO9 database for child nutrition.
6 "Egypt" African Economic Outlook, 2012, http://www.africaneconomicoutlook.org/en/countries/north-africa/egypt/
7 WHO and UNICEF. (2009). WHO child growth standards and the identification of severe acute malnutrition in infants and children A Joint
Statement by the World Health Organization and the United Nations Children’s Fund.
8 El-Zanaty, Fatma and Ann Way. 2009. Egypt Demographic and Health Survey 2008. Cairo, Egypt: Ministry of Health, El-Zanaty and Associates,
and Macro International
9 "WHO Global Database on Child Growth and Malnutrition." WHO. Accessed March 13, 2013.
3.2 4.1 4.5
6.8 7.1 7.2
4.7 5.1
1.8
0.8
2.8
0.0
2.0
4.0
6.0
8.0
2003 2004 2005 2006 2007 2008 2009 2010 2011 2012 2013
Real GDP growth (%) Northern Africa - Real GDP growth (%) Africa - Real GDP growth (%)

18
The Cost of Hunger in Africa:
Results from Egypt
FIGURE 1.2
ESTIMATED UNDERNUTRITION TRENDS IN CHILDREN UNDER-FIVE, 1990-2010
(In percentages)
Source: Prepared in-house based on information from DHS 2008 and national Surveys. Complete list is annexed to report. NOTE: Data prior
to 2006, has been updated in line with new Child Growth Standards introduced by WHO in 2006 to replace the 1977 International Growth
Reference, formulated by the National Center for Health Statistics (NCHS).
The current levels of child undernutrition illustrate the challenges in the reduction of child hunger. It is estimated that 2.7 of the
9.2 million children under the age of five were affected by growth retardation and 659,000 children were underweight in 2009.
This situation is especially critical for children between 12 and 24 months, where one out of every three children is affected by
growth retardation10.
TABLE I.2
POPULATION AND CHILD UNDERNUTRITION, 2009C
(Population in thousands)
Age groups Population
size (2009)
Low Birth Weight Underweight Stunting
Population
affected
(2009)
Prevalence
(2009)b
Population
affected
(2009)
Underweight
prevalence
(2009)b
Population
affected
(2009)
Stunting
prevalence
(2009)b
Newborn (IUGR)a 1,876
117 6.2%
0 to 11 months
163 8.7% 370 19.7%
12 to 23 months 1,858
124 6.7% 641 34.5%
24 to 59 months 5,453
371 6.8% 1,734 31.8%
Total 9,187 117 6.2% 659 7.2% 2,744 28.9%
Source: Estimated based on DHS surveys 2008 and demographic projections
a In a given year, the newborn population is the same as the 0-11 month’s age group.
b Estimated on the basis of the equation of De Onis et al, 2003. c Data estimated from the most recent undernutrition prevalence figure available.
http://www.who.int/nutgrowthdb/en//.
10 El-Zanaty, Fatma and Ann Way. 2009. Egypt Demographic and Health Survey 2008. Cairo, Egypt: Ministry of Health, El-Zanaty and Associates,
and Macro International
11.8% 10.5%
8.2%
10.8%
4.3%
8.7%
5.4%
7.2%
36.6%
34.9%
31.3%
34.9%
24.6%
20.3%
23%
28.9%
0%
5%
10%
15%
20%
25%
30%
35%
40%
1985 1987 1989 1991 1993 1995 1997 1999 2001 2003 2005 2007 2009 2011
Underweight Prevelence (historical) Stunting Prevelence (historical)

Section II:
Cost of Hunger in Africa Methodology
19
Section 1I:
Cost of
Hunger in
Africa
Methodology

20
The Cost of Hunger in Africa:
Results from Egypt
Cost of Hunger in Africa
Methodology
A. Introduction: Why is it important?
Recently, Africa has been experiencing a steady economic growth that has positioned the continent as a key region for global
investment and trade. The pace of real GDP growth on the continent has doubled in the last decade and six of the world’s
fastest growing economies are in Africa.11
Growth has been despite some of the highest rates of child undernutrition in the world.
Human capital is the foundation of economic development. Improved nutritional status of people has a direct impact on
economic performance through increased productivity and enhanced national comparative advantage. In order for Africa to
maximize its present and future economic growth opportunities, increased efforts are needed for cost-effective interventions
that address the nutritional situation of the most vulnerable members of the society.
Achieving nutrition and food security would generate an immediate impact on the achievement of the Millennium Development
Goals (MDGs). If child undernutrition were reduced, there would be a direct improvement in child mortality rates, as
undernutrition is the single most important contributor to child mortality.12 If girls were not undernourished, they would be less
likely to bear underweight children. Further, healthy children would be more productive as adults and would have a higher
chance of breaking the cycle of poverty for their families.
Undernutrition leads to a significant loss in human and economic potential. The World Bank estimates that undernourished
children are at risk of losing more than 10 per cent of their lifetime earning potential, affecting thus national productivity.
Recently, a panel of expert economists at a Copenhagen Consensus Conference concluded that fighting malnourishment should
be the top priority for policy makers and philanthropists.13 At that conference, Nobel Laureate Economist, Vernon Smith noted
that: “One of the most compelling investments is to get nutrients to the worlds undernourished. The benefits from doing so – in
terms of increased health, schooling, and productivity – are tremendous.”14 Improving nutritional status is therefore a priority
area that needs urgent policy attention to accelerate socio-economic progress and development in Africa.
However, despite a compelling economic case for nutrition interventions, investments with apparent shorter term returns are
prioritized in social budgets. Hence, stronger efforts are required to sensitize the general population, policy makers and
development partners on the high cost of undernutrition, in order to strengthen national and international political and financial
commitments and to ensure that young children do not continue to suffer from undernourishment in Africa.
11 "World Economic Outlook Database October 2012", World Economic Outlook Database October 2012, October 2012,
http://www.imf.org/external/pubs/ft/weo/2012/02/weodata/index.aspx.
12 Robert E. Black et al., "Maternal and child undernutrition: global and regional exposures and health consequences," The Lancet 371, No. 9608,
2008, doi:10.1016/S0140-6736(07)61690-0.
13 Copenhagen Consensus 2012, Top economists identify the smartest investments for policy-makers and philanthropists, 14 May 2012,
http://www.copenhagenconsensus.com/Default.aspx?ID=1637.
14 Ibid.
Section II:
Cost of Hunger in Africa Methodology
21
Positioning nutrition interventions as a top priority for development and poverty reduction is often difficult, partly due to the
lack of credible country-specific data on short-term returns. There is not enough country-specific evidence to demonstrate how
improved nutrition would have a direct impact on school performance and eventually on improving opportunities in the labour
market and physical work. Additionally, nutrition is often seen as a health issue, without considering the rippling social impact
that it has on other areas of development.
Despite the aforementioned challenges, efforts continue both at continental and global levels, to address the issues of
undernutrition and hunger. At the regional level, these efforts include initiatives and strategies such as the African Regional
Nutrition Strategy, the Comprehensive Africa Agriculture Development Programme (CAADP), especially CAADP Pillar III, which
focuses on reducing hunger and improving food and nutrition security, the Pan African Nutrition Initiative (PANI), Framework for
African Food Security (FAFS), Africa Ten Year Strategy for the Reduction of Vitamin and Mineral Deficiencies (ATYS-VMD), and African
Day for Food and Nutrition Security (ADFNS). At the global level, initiatives include REACH, Purchase for Progress (P4P), Scaling
Up Nutrition (SUN), Feed the Future (FTF), the “1,000 Days” partnership, as well as the Abuja Food Security Summit of 2006. All
these efforts are designed to reduce hunger, malnutrition and vulnerability, in a bid to also achieve the MDGs.
Within the framework of the African Regional Nutrition Strategy (2005-2015)15, the objectives of the African Task Force on
Food and Nutrition Development16 and CAADP, the African Union and the New Partnership for Africa’s Development
(NEPAD) Planning and Coordinating Agency (NPCA), the United Nations Economic Commission for Africa (UNECA), and the
World Food Programme (WFP) undertook efforts to conduct the Cost of Hunger Study on the Social and Economic Impact of Child
Undernutrition in Africa. This study is built on a model developed by the United Nations Economic Commission for Latin America
and the Caribbean (ECLAC). Through a South-South collaboration agreement, ECLAC has supported the adaptation of the
model to the African context.
This study aims to generate evidence to inform key decision makers and the general public about the cost societies on the
continent are already paying for not addressing the problem of child undernutrition. The results provide compelling evidence to
guide policy dialogue and advocacy around the importance of preventing child undernutrition. Ultimately, it is expected that the
study will encourage revision of current allocation practices in each participating country to ensure provision of the human and
financial resources needed to effectively combat child undernutrition, specifically during the first 1,000 days of life when most of
the damage occurs.
15 African Regional Nutrition Strategy (2005-2015). Objectives I-III: I. To increase awareness among governments of the region, regional and
international development partners and the community on the nature and magnitude of nutrition problems in Africa and their implications
for the development of the continent and advocate for additional resources for nutrition. II. To advocate for renewed focus, attention,
commitment and a redoubling of efforts by member states, in the wake of the worsening nutrition status of vulnerable groups. III. To
stimulate action at the national and regional level that lead to improved nutrition outcome, by providing guidance on strategic areas of focus.
16 African Union, “CAHM5 Moves into gear with meeting on food and nutrition development”, 14 April 2011,
http://www.au.int/en/sites/default/files/task%20force%20on%20food%20and%20nutrition%20development.pdf

22
The Cost of Hunger in Africa:
Results from Egypt
B. Brief description of the model
i. Conceptual framework
Hunger is caused and affected by a set of contextual factors. “Hunger” is an overarching term that reflects an individual’s food
and nutrition insecurity. Food and nutrition insecurity occur when part of the population does not have assured physical, social
and economic access to safe and nutritional food to satisfy dietary needs.
DEFINITION OF TERMS
1. Chronic Hunger: The status of people, whose food intake regularly provides less than their minimum energy
requirements leading to undernutrition.17
2. Child Undernutrition: The result of prolonged low levels of food intake (hunger) and/or low absorption of
food consumed. It is generally applied to energy or protein deficiency, but it may also relate to vitamin and
mineral deficiencies. Anthropometric measurements (stunting, underweight and wasting) are the most widely
used indicators of undernutrition.18
3. Malnutrition: A broad term for a range of conditions that hinder good health caused by inadequate or
unbalanced food intake or from poor absorption of food consumed. It refers to both undernutrition (food
deprivation) and over nutrition (excessive food intake in relation to energy requirements.19
4. Food insecurity: Exists when people lack access to sufficient amounts of safe and nutritious food, and
therefore are not consuming enough for an active and healthy life. This may be due to the unavailability of
food, inadequate purchasing power or inappropriate utilization at household level.20
5. Food vulnerability: Reflects the probability of an acute decline in food access or consumption, often in
reference to some critical value that defines minimum levels of human wellbeing.21
Nutrition security thus depends on a person’s food security, as well as good health, a healthy environment, and good caring
practices. Specifically, nutrition security can be described as, “appropriate quantity and combination of food, nutrition, health
services and care taker’s time needed to ensure adequate nutrition status for an active and healthy life at all times for all
people.”22 A direct and measurable consequence is low birth weight, underweight and/or lower than normal height-for-age.
Levels of nutrition security in a country are related to epidemiological and nutritional transitions, which can be evaluated to
assess the population’s nutritional situation. Further, a person’s nutritional situation is part of a process that is expressed
differently depending on the stage of the life cycle: intrauterine and neonatal life, infancy and pre-school, school years or adult
life. This is because the nutrient requirements and the needs are different for each stage23.
Below is the discussion of the central elements, considered in the model, to estimate the effects and costs of child
undernutrition based on the concepts mentioned above, along with a brief description of the causes and consequences of
17 "Hunger statistics", FAO Hunger Portal, Undernourishment or Chronic Hunger, FAO, accessed March 14, 2013,
http://www.fao.org/hunger/en/.
18 "Hunger statistics", FAO Hunger Portal, Undernutrition, FAO, accessed March 14, 2013, http://www.fao.org/hunger/en/.
19 Ibid.
20 Ibid.
21 WFP, VAM Standard analytical framework, World Food Programme, 2002.
22 USAID, USAID Commodities reference guide, Annex I: Definitions, January 2006, ,
http://transition.usaid.gov/our_work/humanitarian_assistance/ffp/crg/annex-1.htm.
23 Rodrigo Martínez and Andrés Fernández, Model for analysing the social and economic impact of child undernutrition in Latin America, Naciones
Unidas, CEPAL, Social Development Division, Santiago De Chile, 2007.

Section II:
Cost of Hunger in Africa Methodology
23
undernutrition. The discussion also describes the dimension of analysis and the principal methodological aspects used to
interpret the results.24
ii. Causes of undernutrition
The main factors associated with undernutrition, as a public health problem, can be grouped into the following: environmental
(natural or entropic causes), sociocultural-economic (linked to poverty and inequality) and political-institutional. Together, these
factors increase or decrease biomedical and productivity vulnerabilities, through which they determine the quantity and quality
of dietary intake and the absorption capacity, which constitute the elements of undernutrition.25
Each of these factors helps increase or decrease the likelihood of a person to suffer from undernutrition. Further, the
importance of each of these factors depends on the level of the country’s demographic and epidemiological transition as well as
on the person’s current stage in the life cycle. Together these factors determine the intensity of the resulting vulnerability to
undernutrition.
FIGURE II.1
CAUSES OF UNDERNUTRTION
Source: Rodrigo Martinez and Andrés Fernández, Model for analysing the social and economic impact of child undernutrition in Latin America (see footnote)
based on consultations carried out by authors.26
Environmental factors define the surroundings in which the subject and his or her family live. These include the risks stemming
from the natural environment itself and its cycles (floods, droughts, frosts, earthquakes, and other phenomena) as well as those
produced by humans themselves (such as water and air pollution, contamination of food, expansion of agriculture etc.). The
sociocultural-economic determinants include elements associated with poverty and inequality, education and cultural norms,
employment and wages, access to social security and coverage of aid programmes. The political-institutional factors encompass
government policies and programmes aimed specifically at solving the population’s food and nutritional problems.
Production factors include those directly associated with the production and access to food by the population at risk. The
availability and autonomy of each country’s dietary energy supply depend directly on the characteristics of production processes,
the degree to which they utilize natural resources and the extent to which these processes mitigate or aggravate environmental
risks.
Finally, biomedical factors take into account the individual’s susceptibility to undernutrition, insofar as deficiencies in certain
elements limit the capacity to make biological use of the food consumed (regardless of quantity and quality).
24 A summarized version of the theoretical background and the basic characteristics considered in the model of analysis are presented. For a more detailed
discussion of the model, see Rodrigo Martínez and Andrés Fernández, Model for analysing the social and economic impact of child undernutrition in
Latin America, Naciones Unidas, CEPAL, Social Development Division, Santiago De Chile, 2007.
25 Rodrigo Martínez and Andrés Fernández, Model for analysing the social and economic impact of child undernutrition in Latin America, Naciones
Unidas, CEPAL, Social Development Division, Santiago De Chile, 2007.
26 Ibid.

24
The Cost of Hunger in Africa:
Results from Egypt
i. Consequences of undernutrition
Child undernutrition has long-term negative effects on people’s lives27, most notably in the aspects of health, education, and
productivity, quantifiable in costs and expenditures to the public and private sectors. Consequently, these effects exacerbate
problems in social integration and increase or intensify poverty. A vicious cycle is perpetuated as vulnerability to undernutrition
grows.
Undernutrition may have immediate or evolving impacts throughout a person’s lifetime, although individuals who suffered from
undernutrition during early years of their life cycle (including intrauterine) are more likely to be undernourished later in life.
Health studies have shown that undernutrition leads to increased appearance or intensified severity of specific pathologies, and
increases the chance of death during specific stages of the life cycle.28 The nature and intensity of the impact of undernutrition
on pathologies depends on the epidemiological profile of a given country.
In education, undernutrition affects student performance through disease-related weaknesses and results in limited learning
capacity associated with deficient cognitive development.29 This translates into a greater probability of starting school at a later
age, repeating grades, dropping out of school and ultimately obtaining a lower level of education.
Later in life, individuals may experience lower physical capacity in manual labour as a result of stunting.30 Stunting, which is
caused by food deprivation and nutrient deficiencies, is established by low height-for-age measurements during childhood. In
adulthood, it leads to an overall reduced body mass when compared to the full adult potential.
FIGURE II.2
CONSEQUENCES OF UNDERNUTRITION
Source: Modified from Rodrigo Martínez and Andrés Fernández, Model for analysing the social and economic impact of child undernutrition in Latin America (see footnote) based on consultations carried out by authors.31
27 Alderman H., et al., “Long-term consequences of early childhood malnutrition”, FCND Discussion Paper No. 168, IFPRI, 2003.
28 Amy L. Rice et al., "Malnutrition as an underlying cause of childhood deaths associated with infectious diseases in developing
countries," Bulletin of the World Health Organization 78, No. 2000, 2000.
29 Melissa C. Daniels and Linda S. Adair, "Growth in young Filipino children predicts schooling trajectories through high school," The Journal of
Nutrition, March 22, 2004, Jn.nutrition.org.
30 Lawrence J. Haddad and Howarth E. Bouis, "The impact of nutritional status on agricultural productivity: wage evidence from the
Philippines," Oxford Bulletin of Economics and Statistics 53, No. 1, February 1991, doi:10.1111/j.1468-0084.1991.mp53001004.x.
31 Rodrigo Martínez and Andrés Fernández, Model for analysing the social and economic impact of child undernutrition in Latin America, Naciones
Unidas, CEPAL, Social Development Division, Santiago De Chile, 2007.

Section II:
Cost of Hunger in Africa Methodology
25
Undernutrition and its effects on health and education also translate into heavy economic costs for society at large. Each of the
negative impacts in health, education, and productivity, described above, leads to a social, as well as an economic, loss to the
individual or the society.
Thus, the total cost of undernutrition (TCU) is a function of higher health-care spending (HCU), inefficiencies in education (ECU)
and lower productivity (PCU). As a result, to account for the total cost (TCU), the function can be written as:
TCU = f (HCU, ECU, PCU)
In the area of health, the high probability resulting from the epidemiological profile of individuals suffering from undernutrition
proportionally increases the costs in the health care sector (HSCU). In aggregate, this is equal to the sum of the interactions
between the probability of undernutrition in each age group, the probability that a particular group will suffer from the diseases
because of undernutrition, and the costs of treating the pathology (HSCU) that typically includes diagnosis, treatment and
control. To these are added the costs paid by individuals and their families as a result of lost time and quality of life (IHCU).
Thus, to study the variables associated with the health cost (HCU) the formula is:
HCU = f (HSCU, IHCU)
In education, the reduced attention and learning capacity of those who have suffered from child undernutrition increase costs to
the educational system (ESCU). Repeating one or more grades commensurately increases the demand that the educational
system must meet, with the resulting extra costs in infrastructure, equipment, human resources and educational inputs. In
addition, the private costs (incurred by students and their families) derived from the larger quantity of inputs, external
educational supplementation and more time devoted to solving or mitigating low performance problems (IECU) are added to the
above costs. Thus, in the case of the education cost (ECU), the formula is:
ECU = f (ESCU,IECU)
The productivity cost associated with undernutrition is equal to the loss in human capital (HK) incurred by a society, stemming
from a lower educational level achieved by malnourished individuals (ELCU), a lower productivity in manual labour experienced
by individuals who suffered from stunting (MLCU) and the loss of productive capacity resulting from a higher number of deaths
caused by undernutrition (MMCU). In the model these costs are reflected as losses in potential productivity (PCU). Thus:
PCU = f (ELCU, MLCU, MMCU)
As a result, in order to comprehensively analyse the phenomenon of undernutrition, the model considers its consequences on
health, education and productivity by translating them into costs.
ii. Dimensions of analysis
Considering that a country’s undernutrition situation and the consequences thereof reflect a specific epidemiological and
nutritional transition process, a comprehensive analysis involves estimates of the current situation extrapolated from previous
transitional stages as well as estimates of the future to predict potential cost and saving scenarios based on prospective
interventions to control or eradicate the problem.
On this basis, a two-dimensional analysis model has been developed to estimate the costs arising from the consequences of child
undernutrition in health, education and productivity:
1. Incidental retrospective dimension focuses on the population in the study year, including mortality cases of those who
would have been alive in the study year. The retrospective dimension estimates the nutritional situation of individuals
under the age of five to identify the related economic costs in the study year. Thus, it is possible to estimate the
health costs of pre-school boys and girls who suffer from undernutrition during the year of analysis, the education
costs stemming from the children currently in school who suffered from undernutrition during the first five years of
life, and the economic costs due to lost productivity by working-age individuals who were exposed to undernutrition
before the age of five.
2. Prospective or potential savings dimension. This dimension focuses on children under five in a given year and allows
analysis of the present and future losses incurred as a result of medical treatment, repetition of grades in school and
lower productivity. Based on this analysis, potential savings derived from actions taken to achieve nutritional
objectives can be estimated.

26
The Cost of Hunger in Africa:
Results from Egypt
As shown in Figure IV, the incidental retrospective dimension includes the social and economic consequences of undernutrition
in a specific year (for the purposes of this report, 2009 was set as the base year) for cohorts that have been affected (0 to 4
years of age for health, 6 to 18 years for education and 15 to 64 years for productivity). The prospective dimension on the other
hand, projects the costs and effects of undernutrition recorded in the reference year of the study. These are based on the
number of children born during the period selected in the analysis and, with the application of a discount rate, on the present
value estimates of future costs to be incurred due to the consequences of undernutrition. The prospective dimension is the
basis for establishing scenarios to estimate the economic and social savings of an improved nutritional situation.
FIGURE II.3
DIMENSIONS OF ANALYSIS BY POPULATION AGE AND YEAR WHEN EFFECTS OCCUR
Source: Rodrigo Martinez and Andrés Fernández, Model for analysing the social and economic impact of child undernutrition in Latin America (see footnote)
based on consultations carried out by authors.32
iii. Methodological aspects
The analysis focuses on undernutrition during the initial stages of the life cycle and its consequences throughout life. This limits
the study to the health of the foetus, the infant and the pre-schooler, i.e. those aged 0 to 59 months.33 Similarly, the effects on
education and productivity are analysed in the other demographic groups, i.e. 6-18 years old and 15-64 years old, respectively.
The population of children suffering from undernutrition was divided into sub-cohorts (0 to 28 days, 1 to 11 months, 12 to 23
months and 24 to 59 months) in order to highlight the specificity of certain effects during each stage of the life cycle.
The study uses undernutrition indicators that are measurable and appropriate to the different stages of an individual’s life cycle.
For intrauterine undernutrition, low birth weight (LBW) due to intrauterine growth restriction (IUGR, defined as a weight
below the tenth percentile for gestational age) is estimated. For the pre-school stage, moderate and severe stunting categories
32 Rodrigo Martínez and Andrés Fernández, Model for analysing the social and economic impact of child undernutrition in Latin America, Naciones
Unidas, CEPAL, Social Development Division, Santiago De Chile, 2007.
33 In the original design, the idea of analysing direct information on the nutritional and health situation of pregnant women was considered, but
the lack of reliable information on the incidence of undernutrition led to its exclusion from the analysis.

Section II:
Cost of Hunger in Africa Methodology
27
(weight-for-height scores below -2 standard deviations) are used, with reference, where possible, to the World Health
Organization (WHO) distribution for comparison purpose.34
Estimates of the impacts of undernutrition on health, education and productivity are based on the concept of the relative (or
differential) risk run by individuals who suffer from undernutrition during the first stages of life as compared to a healthy child.
This is valid both for the incidental-retrospective analysis and for the prospective-savings analysis; however, as its application has
specific characteristics in each case, they are detailed separately in this document.
To estimate the costs for the incidental retrospective dimension, the values occurring in the year of analysis are totalled based
on estimates of differential risks undergone by the different cohorts of the population. In the prospective analysis on the other
hand, a future cost flow is estimated and updated (to present value).
The methodological approach presented here considers the most detailed and complete set of causes and effects of child
undernutrition. Further, consideration has been made to ensure that certain causes and effects are not overemphasized or
double counted. The methodological framework is based on strong research as well as institutional support from international
organizations, and has been deemed a strong basis for the purpose of the research described in this report.
34 In the estimation of stunting, a complementary analysis is done based on NCHS Standard in order to estimate the relative risk of lower
productivity.

28
The Cost of Hunger in Africa:
Results from Egypt

Section III:
Effects and Costs of Child Undernutrition
29
Section III:
Effects and
Costs of Child
Undernutrition
30
The Cost of Hunger in Africa:
Results from Egypt
Effects and Costs of Child
Undernutrition
Undernutrition is mainly characterized by stunting (low height-for-age), wasting (low weight-for-height), and underweight (low
weight-for-age). In early childhood, undernutrition has negative life-long and intergenerational consequences; undernourished
children are more likely to require medical care as a result of undernutrition-related diseases and deficiencies. This increases the
burden on public social services and health costs incurred by the government and the affected families. Without proper care,
underweight and wasting in children results in a higher risk of mortality. During schooling years, stunted children are more likely
to repeat grades and drop out of school, reducing thus, their income-earning capability later in life. Furthermore, adults who
were stunted as children are less likely to achieve their expected physical and cognitive development, thereby impacting on their
productivity.
In addition to identifying the physical, psychological and social effects of undernutrition, the economic costs for the direct
consequences of undernutrition have been estimated for 2009. The retrospective dimension of the analysis of education, health
and productivity effects is presented below together with costs resulting from undernutrition.
A. Social and economic cost of child undernutrition in the health Undernutrition at an early age predisposes children to higher morbidity and mortality risks. The risk of becoming ill due to
undernutrition has been estimated using probability differentials, as described in the methodology. Specifically, the study has
examined medical costs associated with treating low birth weight (LBW), underweight, anaemia, acute respiratory infections
(ARI), acute diarrheal syndrome (ADS) and fever/malaria associated with undernutrition in children under the age of five.
i. Effects on Morbidity
Undernourished children are more susceptible to recurring illness35. Based on the differential probability analysis undertaken
with DHS data36, in Egypt, underweight children between 28 days and 11 months are more affected by anaemia (13.4% more),
and children between 12 and 24 months have a higher risk of diarrhea (1.42% more).
The study estimated that in 2009 in Egypt, there were more than 901,440 more episodes of illness related to diseases that could
be associated to being underweight. The biggest proportion of episodes is found in anaemia with 102,965 incremental episodes
for underweight children, followed by diarrhea with 18,342 annual episodes and acute respiratory infections were estimated at
4,915 episodes.
In addition, pathologies related to calories and protein deficiency and low birth weight associated with Intrauterine Growth
Restriction (IUGR), totaled more than 775,217 episodes in 2009 as indicated in Table III.1, while acute and chronic illness due to
diseases such as ADS, anaemia, fever and ARI, represents 126,223 episodes annually.
35 Ramachandran P. & Gopalan H., “Undernutrition & risk of infections in preschool children”, Indian J Med Res 130, November 2009, pp. 579-583.
36 El-Zanaty, Fatma and Ann Way. 2009. Egypt Demographic and Health Survey 2008. Cairo, Egypt: Ministry of Health, El-Zanaty and Associates,
and Macro International

Section III:
Effects and Costs of Child Undernutrition
31
TABLE III.1
MORBIDITIES FOR CHILDREN UNDER-FIVE ASSOCIATED WITH UNDERWEIGHT, BY PATHOLOGY,
2009
Pathology Number of Episodes Percentage of Events
Anaemia 102,965 82%
ADS 18,342 15%
ARI 4,915 4%
126,223
LBW 116,702 15%
Underweight 658,516 85%
775,217
Total 901,440
Source: Model estimations based on DHS 2008, and Demographic information.
Most episodes of incremental illness associated with undernutrition happen before the first year of life. This is the period, of the
first thousand days of life, where children are most threatened due to age-specific vulnerabilities. In Egypt, the 33% of all
incremental episodes occur in children under 12 months, with more than one third of those episodes associated with children
being born with low birth weight. This seems to indicate that preventing undernutrition and focusing on the mothers health and
nutritional education, might generate important savings by reducing the incidence of episodes.
FIGURE III.1
NUMBER OF INCREMENTAL EPISODES DUE TO UNDERNUTRITION BY AGE GROUP
(In percentage)
Source: Model estimations based on DHS 2008, and demographic information.
The number of episodes was estimated based on the differential probability that a child has of becoming ill associated with
underweight children. To estimate the costs of the pathologies, data from epidemiological follow-up studies and official health
statistics on Egypt were reviewed. In addition, interviews with national specialists provided further information. A complete list
of assumptions and sources has been annexed to this report.
ii. Stunting levels of the working age population
Undernutrition leads to stunting in children, which can impact on their productivity at later stages in life37. Egypt has made
important historical progress in reducing stunting in children; nevertheless, there has been a reported recent increase in the
37 K.G. Dewey and K. Begum, Long-term consequences of stunting in early life. Maternal and Child Nutrition (2011), 7 (Suppl. 3), pp. 5–18
0 to 11 months
33%
12 to 23 months
16%
24 to 35 months
17%
36 to 47 months
17%
48 to 59 months
17%
0% 10% 20% 30% 40% 50% 60% 70% 80% 90% 100%
Percentage of Episodes
Ep
iso
des
by A
ge
Gro
up

32
The Cost of Hunger in Africa:
Results from Egypt
prevalence of chronic undernutrition. As illustrated in Figure III.2 below, the model estimates that 20.5 million adults in the
working-age population suffered from growth retardation before reaching five years. Currently this would represent more than
over 40% of the population aged 15-64, who are in a disadvantaged position as compared to those who were not
undernourished as children.
FIGURE III.2
WORKING AGE POPULATION AFFECTED BY CHILDHOOD STUNTING, BY AGE
(In millions of people)
Source: Model estimations based on demographic information and WHO/NCHS/DHS nutritional surveys.
According to the information from the CAPMAS Labour Survey, two thirds of the working-age population in Egypt is involved in
manual activities. The physical consequences of childhood stunting have affected these adults by reducing their productive
capacity in manually intensive activities, as compared to people who were not affected by growth retardation as children.
Additionally, the proportion of the population involved in non-manual activities, who were also affected by undernutrition, tends
to have a lower educational level, and hence a lower productive level, than those who were properly nourished as children. The
effect of these stunting levels on the productive capacity of the country will be analysed in the productivity section of the report.
iii. Effects on mortality
Child undernutrition can lead to increased cases of mortality most often associated with incidences of diarrhoea, pneumonia and
malaria38
.. Nevertheless, when the cause of death is determined, it is rarely attributed to the nutritional deficit of the child, but
to the illness that the child manifested. Given this limitation in attribution, the model utilizes relative risk factors39 to estimate
the risk of increased child mortality as a result of child undernutrition. Using these factors, abridged life tables40 were used to
estimate the incidence of higher mortality risk due to undernutrition.
38 Robert E. Black et al., "Maternal and child undernutrition: global and regional exposures and health consequences," The Lancet 371, No. 9608,
2008, doi:10.1016/S0140-6736(07)61690-0.
39Ibid.
40 Data provided by the UN Population Division, http://www.un.org/esa/population/unpop.htm.
0.0 1.0 2.0 3.0 4.0 5.0 6.0 7.0 8.0 9.0
15-19
20-24
25-29
30-34
35-39
40-44
45-49
50-54
55-59
60-64
5.1
4.7
3.8
3.0
2.8
2.6
2.4
2.0
1.7
1.5
3.7
3.4
2.7
2.1
1.9
1.8
1.6
1.3
1.1
0.9
Population not affected by stunting Population Affected by Stunting
Age
Gro
ups
Millions of People of Working Age (15-64)

Section III:
Effects and Costs of Child Undernutrition
33
Undernutrition makes children significantly more vulnerable to mortality; in the last 5 years alone, it is estimated that 28,102
child deaths in Egypt were directly associated with undernutrition. These deaths represent 11% of all child mortalities for this
period. Thus, it is evident that undernutrition significantly exacerbates the rates of death among children and limits the country’s
capacity to achieve the MDGs, especially the goal to reduce child mortality.
TABLE III.2
IMPACT OF UNDERNUTRITION ON CHILD MORTALITY, ADJUSTED BY SURVIVAL RATE, 1945-2009
(In number of mortalities)
Period Number of child mortalities associated with undernutrition
1945-1994 352,813
1995-2004 79,932
2005-2009 28,102
Total 460,847
Source: ECA on the basis of life tables provided by UN Population Division41 and population data provided by CAPMAS.
This historical mortality rates will also have an impact on national productivity. The model estimates that an equivalent of 0.92%
of the current workforce has been lost due to the impact of undernutrition in increasing child mortality rates. This represents
some 353,000 people who would have between 15-64 years old, and part of the working age population of the country. In
effect, besides this problematic reality, these findings suggest that undernutrition reduces the productivity and the development
potential of the country.
iv. Estimation of public and private health costs
The treatment of undernutrition and related illness is a critical recurrent cost for the health system. Treating a severely
underweight child for example, requires a comprehensive protocol42 that is often most costly than the monetary value and effort
needed to prevent undernutrition, especially when other diseases are present in parallel. The economic cost of each episode is
often increased by inefficiencies when such cases are treated without proper guidance from a health-care professional or due to
lack of access to proper health services. These costs generate a significant important burden not just to the public sector but to
society as a whole.
It is estimated that 901,440 clinical episodes in Egypt in 2009, were associated with the higher risk present in underweight
children. A indicates in Table III.343, these episodes generated an estimated cost of 1.14 billion EGP.
TABLE III.3
HEALTH COSTS OF UNDERNUTRITION-RELATED PATHOLOGIES, 2009
(In millions of EGP)
Pathology Cost in millions of EGP % of events % of Cost
LBW/IUGR 515.8 13.7% 45.2%
Anaemia 447.7 11.3% 39.3%
ADS 32.3 2.2% 2.8%
ARI 3.0 0.6% 0.3%
Underweight 141.4 72.3% 12.4%
Total Cost 1,140
Source: Estimations based of data provided by the National Implementation Team, DHS 2008, and cost analysis carried out by NIT.
41 "World Population Prospects, the 2010 Revision," World Population Prospects, the 2010 Revision, accessed March 13, 2013,
http://esa.un.org/wpp/Model-Life-Tables/download-page.html.
42 WHO, Management of severe malnutrition: a manual for physicians and other senior health workers ISBN 92 4 154511 9, NLM Classification: WD
101, 1999.
43Estimations based on data provided by the NIT, DHS 2008, and cost analysis carried-out by NIT
34
The Cost of Hunger in Africa:
Results from Egypt
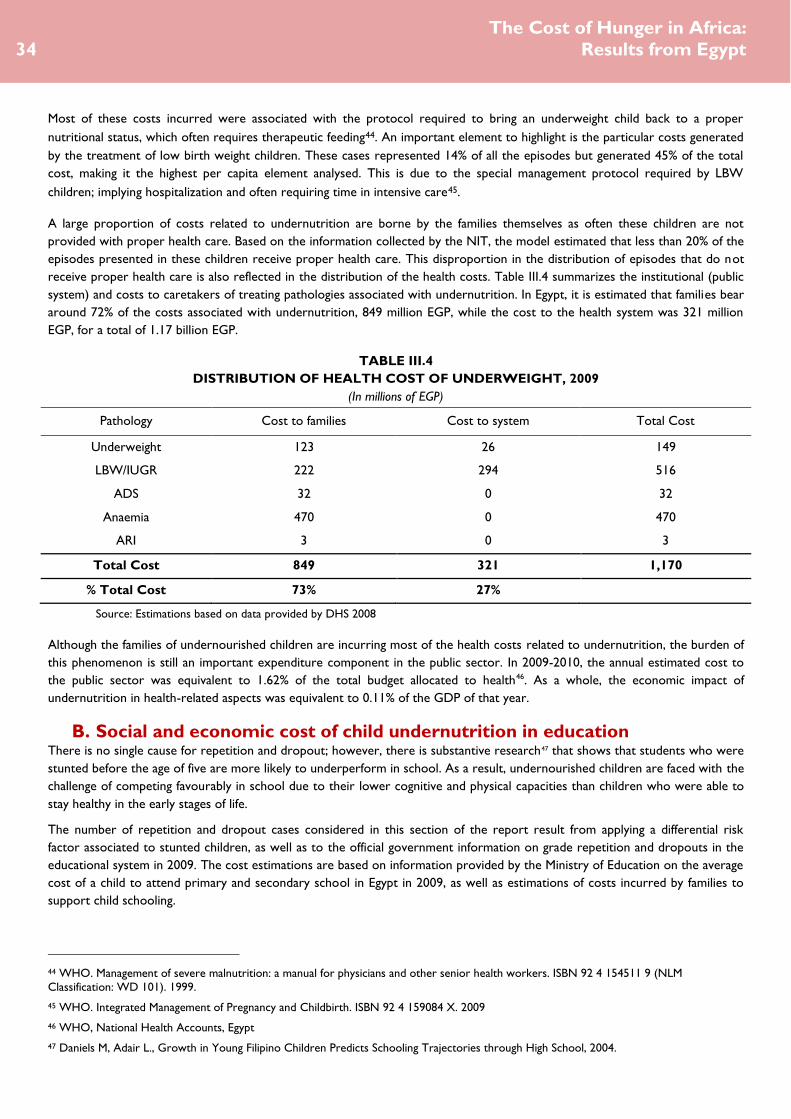
Most of these costs incurred were associated with the protocol required to bring an underweight child back to a proper
nutritional status, which often requires therapeutic feeding44. An important element to highlight is the particular costs generated
by the treatment of low birth weight children. These cases represented 14% of all the episodes but generated 45% of the total
cost, making it the highest per capita element analysed. This is due to the special management protocol required by LBW
children; implying hospitalization and often requiring time in intensive care45.
A large proportion of costs related to undernutrition are borne by the families themselves as often these children are not
provided with proper health care. Based on the information collected by the NIT, the model estimated that less than 20% of the
episodes presented in these children receive proper health care. This disproportion in the distribution of episodes that do not
receive proper health care is also reflected in the distribution of the health costs. Table III.4 summarizes the institutional (public
system) and costs to caretakers of treating pathologies associated with undernutrition. In Egypt, it is estimated that families bear
around 72% of the costs associated with undernutrition, 849 million EGP, while the cost to the health system was 321 million
EGP, for a total of 1.17 billion EGP.
TABLE III.4
DISTRIBUTION OF HEALTH COST OF UNDERWEIGHT, 2009
(In millions of EGP)
Pathology Cost to families Cost to system Total Cost
Underweight 123 26 149
LBW/IUGR 222 294 516
ADS 32 0 32
Anaemia 470 0 470
ARI 3 0 3
Total Cost 849 321 1,170
% Total Cost 73% 27%
Source: Estimations based on data provided by DHS 2008
Although the families of undernourished children are incurring most of the health costs related to undernutrition, the burden of
this phenomenon is still an important expenditure component in the public sector. In 2009-2010, the annual estimated cost to
the public sector was equivalent to 1.62% of the total budget allocated to health46. As a whole, the economic impact of
undernutrition in health-related aspects was equivalent to 0.11% of the GDP of that year.
B. Social and economic cost of child undernutrition in education There is no single cause for repetition and dropout; however, there is substantive research47 that shows that students who were
stunted before the age of five are more likely to underperform in school. As a result, undernourished children are faced with the
challenge of competing favourably in school due to their lower cognitive and physical capacities than children who were able to
stay healthy in the early stages of life.
The number of repetition and dropout cases considered in this section of the report result from applying a differential risk
factor associated to stunted children, as well as to the official government information on grade repetition and dropouts in the
educational system in 2009. The cost estimations are based on information provided by the Ministry of Education on the average
cost of a child to attend primary and secondary school in Egypt in 2009, as well as estimations of costs incurred by families to
support child schooling.
44 WHO. Management of severe malnutrition: a manual for physicians and other senior health workers. ISBN 92 4 154511 9 (NLM
Classification: WD 101). 1999.
45 WHO. Integrated Management of Pregnancy and Childbirth. ISBN 92 4 159084 X. 2009
46 WHO, National Health Accounts, Egypt
47 Daniels M, Adair L., Growth in Young Filipino Children Predicts Schooling Trajectories through High School, 2004.

Section III:
Effects and Costs of Child Undernutrition
35
i. Effects on repetition
Children who suffered from undernutrition before five years of age are more likely to repeat grades, compared to those were
not afflicted by undernutrition48. In Egypt in 2009, enrolment rates were relatively high, with an enrolment rate of 95% at
primary education and 68%49 for secondary education. Currently, there are an estimated 6.3 million stunted children of school
age, equivalent to 33% of the total population aged between 6 and 18 years in the country.
Based on information provided by the Ministry of Education, the effective average repetition rate for public schools in the
country was estimated at 6%, with over 830,603 children having repeated grades in 2009. Considering the higher risk of
undernourished children to repeat grades, the model distributed the stunted and non-stunted school aged population and
calculated the specific repetition rates for both groups. It is estimated that the repetition rate for stunted children was higher
than the national average at 7.4%, while the repetition rate for non-stunted children was estimated at 5.4%, establishing a
differential risk of 2% for stunted children to repeat.
FIGURE III.3
REPETITION RATES IN PRIMARY EDUCATION BY NUTRITIONAL STATUS, 2009
(In percentages)
Source: Estimations based on data provided by NIT (Ministry of Education – Education Statistics Annual Abstract 2008/09).
As a result, from the 830,603 cases of grade repetition reported by the Ministry of Education in the year 2009, 79,396 (9.6% of
all cases), are estimated to be associated with the higher risk of stunted children of repeating grades. These children are
currently generating an incremental cost to the education system, as they require twice as many resources having to repeat the
year. In addition, the caretakers also have to cater to their educational cost for an extra year.
As shown in Figure III.4, most of these grade repetitions happen during the period of primary and preparatory school. There
are far fewer children who repeat grades in secondary school. This is largely due to the fact that many stunted children would
have dropped out of school before reaching secondary education.
48 Daniels M, Adair L., Growth in Young Filipino Children Predicts Schooling Trajectories through High School, 2004.
49 UNESCO, Institute of Statistics, 2010.
7.4%
5.4%
0.0%
2.0%
4.0%
6.0%
8.0%
Repetition Rate of Children who were stunted as children Repetition Rate of Non-Stunted Children
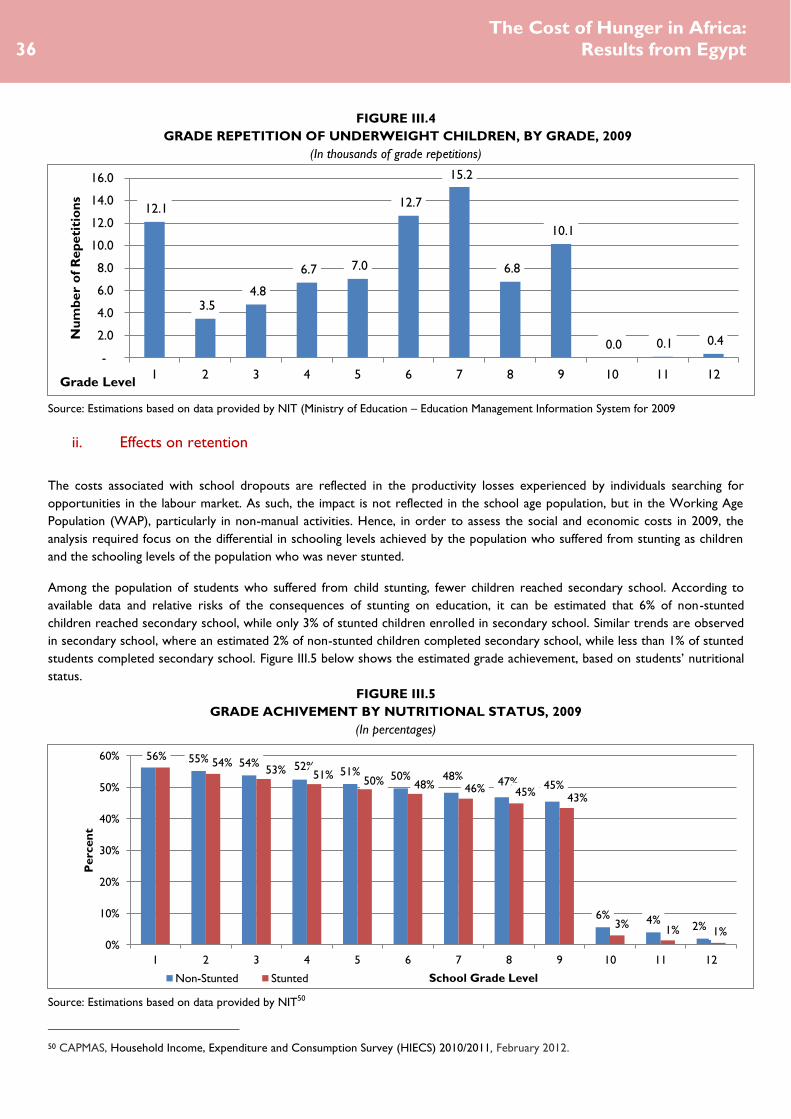
36
The Cost of Hunger in Africa:
Results from Egypt
FIGURE III.4
GRADE REPETITION OF UNDERWEIGHT CHILDREN, BY GRADE, 2009
(In thousands of grade repetitions)
Source: Estimations based on data provided by NIT (Ministry of Education – Education Management Information System for 2009
ii. Effects on retention
The costs associated with school dropouts are reflected in the productivity losses experienced by individuals searching for
opportunities in the labour market. As such, the impact is not reflected in the school age population, but in the Working Age
Population (WAP), particularly in non-manual activities. Hence, in order to assess the social and economic costs in 2009, the
analysis required focus on the differential in schooling levels achieved by the population who suffered from stunting as children
and the schooling levels of the population who was never stunted.
Among the population of students who suffered from child stunting, fewer children reached secondary school. According to
available data and relative risks of the consequences of stunting on education, it can be estimated that 6% of non-stunted
children reached secondary school, while only 3% of stunted children enrolled in secondary school. Similar trends are observed
in secondary school, where an estimated 2% of non-stunted children completed secondary school, while less than 1% of stunted
students completed secondary school. Figure III.5 below shows the estimated grade achievement, based on students’ nutritional
status.
FIGURE III.5
GRADE ACHIVEMENT BY NUTRITIONAL STATUS, 2009
(In percentages)
Source: Estimations based on data provided by NIT50
50 CAPMAS, Household Income, Expenditure and Consumption Survey (HIECS) 2010/2011, February 2012.
12.1
3.5 4.8
6.7 7.0
12.7
15.2
6.8
10.1
0.0 0.1 0.4
-
2.0
4.0
6.0
8.0
10.0
12.0
14.0
16.0
1 2 3 4 5 6 7 8 9 10 11 12
Nu
mb
er
of
Rep
eti
tio
ns
Grade Level
55% 54% 52% 51% 50% 48% 47% 45%
6% 4% 2%
56% 54%
53% 51% 50% 48% 46% 45%
43%
3% 1% 1%
0%
10%
20%
30%
40%
50%
60%
1 2 3 4 5 6 7 8 9 10 11 12
Perc
en
t
School Grade Level Non-Stunted Stunted

Section III:
Effects and Costs of Child Undernutrition
37
iii. Estimation of public and private education costs
Repetition in schooling years has direct cost implications to families and the school system. Consequently, in 2009, the 79,396
students who repeated grades due to undernourishment incurred a cost of 271 million EGP. The largest proportion of
repetitions occurred at primary school level, where the cost burden falls mostly on the public education system. However, unit
costs are significantly higher for repetitions in secondary school. The following chart summarizes the public and private
education costs associated with stunting.
TABLE III.5
COSTS OF GRADE REPETITION ASSOCIATED WITH STUNTED CHILDREN, 2009
Primary Secondary Total
Public Costs per student (EGP) 1,329.4 3,118.4
Private Costs per student (EGP) 1,344.8 1,344.8
Number of repetitions 46,762 32,634 79,396
Total Public Costs (millions of EGP) 62.2 101.8 163.9
Total Private Costs (millions of EGP) 62.9 43.9 106.8
Total (millions of EGP)
270.7
% Social expenditure on education
0.0006%
Source: Estimations based on education statistics of Ministry of Education (2009).
As in the case of health, the social cost of undernutrition in education is shared between the public sector and the families. Of
the overall costs, a total of 106 million EGP (39%) are being covered by the care takers, while 163.9 million EGP (61%) is borne
by the public education system. Nevertheless, the distribution of this cost varies depending on whether the child repeated
grades in primary or secondary education. In primary education, the families cover over 50% of the associated costs of repeating
a year, whereas in secondary the burden on the families is reduced to 30%, and the government carries the biggest proportion
(70%) of the associated cost to education.
FIGURE III.6
SOCIAL DISTRIBUTION OF COSTS FOR REPETITIONS
(In millions of EGP)
Source: Model estimations.
44
63
107
102
62
164
0% 10% 20% 30% 40% 50% 60% 70% 80% 90% 100%
Secondary
Primary
TOTAL
Cost to Caretakers/Families Cost to the Public System

38
The Cost of Hunger in Africa:
Results from Egypt
C. The social and economic cost of child undernutrition in productivity
Child undernutrition affects human capital and productivity in several dimensions51. Children who suffered from undernutrition
are more likely to achieve lower educational levels than healthy children. The low education levels attained, often makes them
less qualified for work, thus reducing their income-earning potential for non-manual work. Adults who suffered from stunting as
children tend to have less lean body mass and are therefore more likely to be less productive in manually intensive activities than
those have not been affected by growth retardation. Moreover, the population lost due to child mortality hinders economic
growth, as these people could have been healthy productive members of the society.
The estimation of the population whose labor productivity is affected as a consequence of having suffered from child
undernutrition is based on historical nutritional information, in-country demographic projections, and data reported in the Egypt
Household Income, Expenditure and Consumption Survey (HIECS) from 2009. The workforce lost due to higher mortality risk
of undernourished children is based on adjusted mortality rates estimated in the health section of this report.
The cost estimates in labor productivity are the result of the differential income associated with lower schooling in non-manual
activities, and the lower productivity associated with stunted children in manually intensive work, such as agriculture. The
opportunity cost of productivity due to mortality is based on the expected income that a healthy person would have been
earning, had he/she been part of the workforce in 2009.
i. Loss from non-manual activities due to reduced schooling
The distribution of the labor market is an important contextual element in determining the impact of undernutrition on national
productivity. As shown in Figure III.7, engagement in manual labor seem to be more common amongst younger groups (15 to 24
years), while non-manual activities seem to be more common amongst those aged 25 to 59 years old. Overall, the proportion
engaged in non-manual activities is consistently lower; in 2009, 16.7 million people were involved in non-manual activities.
FIGURE III.7
MANUAL AND NON-MANUAL LABOUR DISTRIBUTION, BY AGE, 2009
(In percentages)
Source: Estimated from Egypt Labour Force Survey 2009, CAPMAS
51 Alderman H., et al. Long-Term Consequences of Early Childhood Malnutrition. FCND Discussion Paper No. 168 IFPRI, 2003.
11%
26%
38%
40%
41%
44%
48%
48%
44%
19%
36%
89%
74%
62%
60%
59%
56%
52%
52%
56%
81%
64%
0% 10% 20% 30% 40% 50% 60% 70% 80% 90% 100%
15-19
20-24
25-29
30-34
35-39
40-44
45-49
50-54
55-59
60-64
Total
% on Non-Manual Labor % on Manual Labor

Section III:
Effects and Costs of Child Undernutrition
39
As described in the education section of this report, students who were undernourished as children complete, on average,
fewer years of schooling than students who were adequately nourished as children. This loss in educational years has a particular
impact on people who are engaged in non-manual activities, where a higher academic education represents a higher income.
Based on information from the HIECS, it is estimated that the educational gap between the stunted and non-stunted population
is 0.2 years. As shown in Figure III.8, the average schooling level of a person who has not suffered from stunting is 4.7 years,
compared to a person who suffered from childhood stunting, who would achieve on average 4.5 years of schooling. It is
important to note that the data shows that over time there has been an improvement in the average years of schooling of the
population. Whereas the cohort from 60-64 years shows an average level of school education of 1.8 years, the cohort aged 20-
24 shows an average of 7 years of education.
FIGURE III.8
AVERAGE SCHOOLING YEARS FOR STUNTED AND NON-STUNTED POPULATION
(In years of education)
Source: Estimated from Egypt HIECS 2009, CAPMAS and relative risk ratios.
The lower educational achievement of the stunted population has an impact on the expected level of income a person would
earn as an adult. A presented in table III.6, the model estimates that 7.2 million people engaged in non-manual activities suffered
from childhood stunting. This represents 6.3% of the country’s labour force that is currently less productive due to lower
schooling levels associated with stunting. The estimated annual losses in productivity for this group are 2.7 billion EGP,
equivalent to 0.3% of the GDP in 2009.
TABLE III.6
REDUCED INCOME IN NON-MANUAL INTENSIVE ACTIVITIES DUE TO STUNTING, 2009
Age in 2009
Population working in non-manual sectors who were
stunted as children
(In thousands of people)
Income Losses in non-manual labour
(In millions of EGP)
15-24 1,354 685
25-34 1,947 1,003
35-44 1,674 715
45-54 1,483 230
55-64 724 26
Total 7,182 2,659
% GDP
0.3%
Source: Model estimations based on HIECS 2009 CAPMAS and DHS 2008.
4.7 4.5
0
1
2
3
4
5
Average Schooling of Non-Stunted Population Average Schooling of Stunted Population

40
The Cost of Hunger in Africa:
Results from Egypt
ii. Losses in manual intensive activities
Manually intensive activities are mainly observed in the agricultural, forestry and fishing subsectors, which employ more than
64% of the population. In these types of activities, people who were stunted as children are less physically capable than those
who did not suffer from growth retardation. As such, those who were stunted as children are expected to be less productive52.
The model estimates that 33.5 million Egyptians are engaged in manual activities, of which 13.7 million were stunted as children.
This represented an annual loss that surpasses 10.7 billion EGP, equivalent to 1.03% of the GDP, in potential income lost due to
lower productivity (Table III.7).
TABLE III.7
LOSSES IN POTENTIAL PRODUCTIVITY IN MANUAL INTENSIVE ACTIVITIES DUE TO STUNTING, 2009
Age in 2009
Population working in manual labour who
were stunted as children
(In thousands)
Loss in productivity due to stunting
(In millions of EGP)
15-24 5,791 4,793
25-34 2,928 2,719
35-44 2,128 1,594
45-54 1,481 964
55-64 1,372 662
Total 13,701 10,732
% GDP
1.03%
Source: Estimations based on data from CAPMAS and WHO/NCHS Database information and relative risk information.
iii. Opportunity cost due to higher mortality of undernourished children
As indicated in the health section of this report, there is an increased risk of child mortality associated with undernutrition. The
model estimates that the 352,813 people from the working-age population that could have been part of the economy in 2009,
could have increased national productivity by over 857 million working hours.
Considering the productive levels of the population, by their age and sector of labour, the model estimated that in 2009, the
economic losses (measured by working hours lost due to undernutrition-related child mortality) are 5.4 billion EGP, which
represented 0.52% of the country’s GDP.
TABLE III.8
PRODUCTIVITY LOSSES DUE TO INCREMENTAL CHILD MORTALITY
Age in 2009 Working hours lost due to higher mortality of underweight children
(in million of hours)
Loss in productivity
(in millions of EGP)
15-24 317 2,250
25-34 202 1,441
35-44 159 899
45-54 107 572
55-64 71 274
Total 857 5,436
% GDP
0.52%
Source: Model estimations based on data from CAPMAS and DHS Health surveys.
52 Lawrence J. Haddad and Howarth E. Bouis, "The Impact of Nutritional Status on Agricultural Productivity: Wage Evidence from the
Philippines," Oxford Bulletin of Economics and Statistics 53, no. 1 (February 1991), doi:10.1111/j.1468-0084.1991.mp53001004.x.

Section III:
Effects and Costs of Child Undernutrition
41
iv. Overall Productivity Losses
The total losses in productivity for 2009 are estimated at approximately 18.8 billion EGP, which is equivalent to 1.8% of Egypt’s
GDP. As presented in Figure III.9, the largest share of productivity loss is due to reduced productivity in manual activities which
represents 57% of the total cost. The lost working hours due to the higher mortality risk of underweight children, represents
29% of the cost, and the income differential in manual labourdue to the lower physical and cognitive capacity of people who
suffered from growth retardation as children represents 14% of the total costs.
FIGURE III.9
DISTRIBUTION OF LOSSES IN PRODUCTIVITY, BY SECTOR, 2009
(In millions of EGP)
Source: Model Estimations
2,659 10,732 5,436
0% 10% 20% 30% 40% 50% 60% 70% 80% 90% 100%
Lower productivity in non-manual activities Lower productivity in manual activites
Economic cost of lost working hours

42
The Cost of Hunger in Africa:
Results from Egypt
D. Summary of effects and costs
The methodology adopted in this study, allowed for an analysis of the impact of child undernutrition at different stages in the life
cycle, without generating overlaps. As a result, the individual sectoral costs can be aggregated to establish a total social and
economic cost of child undernutrition.
For Egypt, the total losses associated with undernutrition are estimated at 20.3 billion EGP, or $US 3.6 billion for the year 2009.
These losses are equivalent to 1.9% of GDP for that year. The highest element in this cost is the loss in potential productivity in
manual activities associated with stunting.
Due to the multi-causal phenomenon of grade repetition, the direct costs to education tend to be the lowest of the 3 sectors.
Nevertheless, the potential gains in productivity for maintaining children in school are currently 13% of the total cost which still
indicates an important productivity gain to be made from investment in school retention mechanisms.
TABLE III.9
SUMMARY OF COSTS, 2009
Episodes
Cost in millions of
EGP
Cost in millions of
$US dollars
Percentage of
GDP
Heath Costs
LBW and Underweight 775,217 665 120.9
Increased Morbidity 126,223 505 91.8
Total for Health 901,440 1,170 213 0.11%
Education Cost
Increased Repetition - Primary 46,762 125 22.7
Increased Repetition - Secondary 32,634 146 26.5
Total for Education 79,396 271 49.2 0.03%
Productivity Costs
Non-Manual Activities 7,182,482 2,659 483.5
Manual Activities 13,700,990 10,732 1,951.3
Lost Working Hours 352,813 5,436 988.4
Total for Productivity 21,236,285 18,827 3,423 1.81%
TOTAL COSTS
20,268 3,685 1.9%
Source: Model estimations

Section IV:
Analysis of Scenarios
43
Section 1V:
Analysis of
Scenarios

44
The Cost of Hunger in Africa:
Results from Egypt
Analysis of Scenarios
The previous chapter showed the social and economic costs that affected Egypt in 2009 due to high historical trends of child
undernutrition. Many of these costs are already cemented in society and policies must be put in place to improve the lives of
those already affected by childhood undernutrition. However, it is even more important to prevent such costs in the future by
putting in place mechanisms prevent them. Currently, three out of every ten children under-five in Egypt are stunted.
This section analyses the impact that a reduction in child undernutrition could have on the socio-economic context of the
country. The results presented in this section project the additional costs to the health and education sectors as well as losses in
productivity that Egyptian children would bear in the future, and the potential savings that could be achieved. This is a call for
action to take preventive measures and reduce the number of undernourished children to avoid large future costs to society.
The model can generate a baseline for various scenarios, based on nutritional goals established in each country. These scenarios,
which are agreed upon with the NIT in Egypt, can be used to advocate for increased investment in proven nutritional
interventions.
These scenarios are constructed based on the estimated net present value of the costs of undernutrition related to the numbers
of children born in each year, from 2009 to 2025. The methodology follows each group of children and, based on each scenario,
estimates a progressive path towards its achievement.
The scenarios developed for this report are as follows:
1. Baseline. The Cost of Inaction. No action taken to halt recent rises in stunting over the last 10 years.
In this scenario, the prevalence of undernutrition remains at 2009 levels. According to the 2008 DHS the stunting rate
in children under five Egypt is 28.9% (where stunting prevalence of 20–29% is “medium”, 30–39% is “high” and 40% is
“very high” according to WHO cut-off values for public health significance). Although highly unlikely, it serves as a basis
for estimating the saving for scenarios of change.
2. Scenario #1. Cutting by Half the Prevalence of Child Undernutrition by 2025.
In this scenario, the prevalence of underweight and stunted children would be reduced to half of the 2009 value. In the
case of Egypt this would mean a constant reduction of 0.96% points annually in the stunting rate, from 30.7% (estimate
for 2009) to 15.4% in 2025. With the right combination of proven interventions, this scenario would be achievable, as
the prior rate of reduction for stunting is estimated at 0.76%, which is very close to the progress rate required in
achieving these scenarios. Nevertheless, for the period 2005-2008, the country has faced a setback in progress at a rate
of -2.3%, which appears to indicate the stronger investments are required to go back to a positive trend.
3. Scenario #2. The ‘Goal’ Scenario. Reduce Stunting to 10% and Underweight children to 5%, by 2025.
In this scenario, the prevalence of stunted children would be reduced to 10% and the prevalence of underweight
children under the age of five, to 5%. Currently, the global stunting rate is estimated at 26%, with Africa having the
highest prevalence at 36%. This Goal Scenario would require a constant reduction of 1.2% annually to be achieved.
Considering the progress that Egypt has achieved in the past, it might be a feasible goal for the near future.
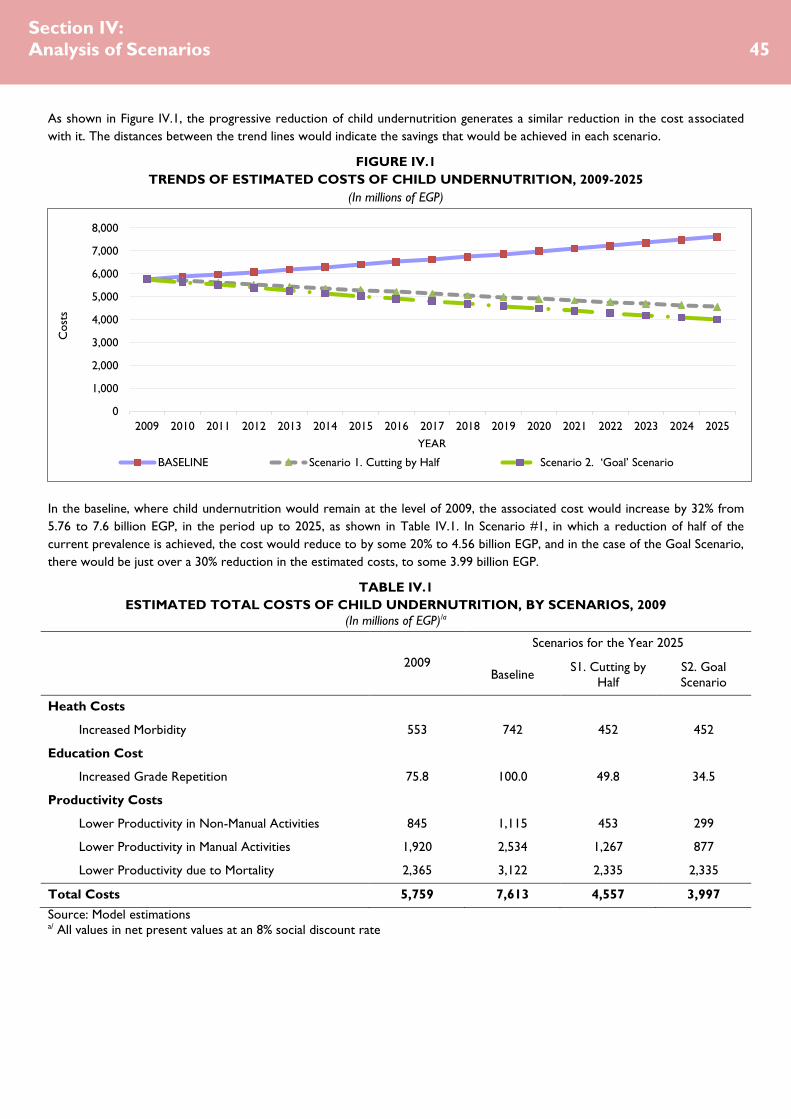
Section IV:
Analysis of Scenarios
45
As shown in Figure IV.1, the progressive reduction of child undernutrition generates a similar reduction in the cost associated
with it. The distances between the trend lines would indicate the savings that would be achieved in each scenario.
FIGURE IV.1
TRENDS OF ESTIMATED COSTS OF CHILD UNDERNUTRITION, 2009-2025
(In millions of EGP)
In the baseline, where child undernutrition would remain at the level of 2009, the associated cost would increase by 32% from
5.76 to 7.6 billion EGP, in the period up to 2025, as shown in Table IV.1. In Scenario #1, in which a reduction of half of the
current prevalence is achieved, the cost would reduce to by some 20% to 4.56 billion EGP, and in the case of the Goal Scenario,
there would be just over a 30% reduction in the estimated costs, to some 3.99 billion EGP.
TABLE IV.1
ESTIMATED TOTAL COSTS OF CHILD UNDERNUTRITION, BY SCENARIOS, 2009
(In millions of EGP)/a
2009
Scenarios for the Year 2025
Baseline S1. Cutting by
Half
S2. Goal
Scenario
Heath Costs
Increased Morbidity 553 742 452 452
Education Cost
Increased Grade Repetition 75.8 100.0 49.8 34.5
Productivity Costs
Lower Productivity in Non-Manual Activities 845 1,115 453 299
Lower Productivity in Manual Activities 1,920 2,534 1,267 877
Lower Productivity due to Mortality 2,365 3,122 2,335 2,335
Total Costs 5,759 7,613 4,557 3,997
Source: Model estimations a/ All values in net present values at an 8% social discount rate
0
1,000
2,000
3,000
4,000
5,000
6,000
7,000
8,000
2009 2010 2011 2012 2013 2014 2015 2016 2017 2018 2019 2020 2021 2022 2023 2024 2025
Cost
s
YEAR
BASELINE Scenario 1. Cutting by Half Scenario 2. ‘Goal’ Scenario

46
The Cost of Hunger in Africa:
Results from Egypt
The potential economic benefits of reducing undernutrition are a key element in making a case for nutrition investments. The
reduction in clinical cases in the health system, lowered grade repetition and improved educational performance as well as
physical capacity are elements that contribute directly to the national productivity.
As presented in Table IV.2, cutting undernutrition by half by 2025 would represent a reduction in costs of 11.7 billion EGP,
equivalent to $US2.1 billion for the period of 16 years, from 2009 to 2025. Although the tendency of savings would not be
linear, as they would increase over time as progress in being achieved, a simple average of the annual savings would represent
$US133 million per year. In the case of the Goal Scenario, the savings would increase to 14.5 billion EGP, or $US2.6 billion,
which represents a simple average of $US165 per year.
TABLE IV.2
ESTIMATED SAVINGS FOR EACH SCENARIO, 2009
(In millions of EGP) a/
Cutting Undernutrition
by Half by 2025 Goal Scenario
Heath Costs
Reduced Morbidity 1,091 1,091
Education Cost
Reduced Grade Repetition 195 270
Productivity Costs
Higher Productivity in Non-Manual Activities 2,655 3,484
Higher Productivity in Manual Activities 4,917 6,817
Increased Working Hours 2,850 2,853
Total Savings 11,709 14,515
Total Savings in millions of $US 2,129 2,639
Source: Model estimations
a/ All values in net present values at an 8% social discount rate

Section V:
Conclusions and Recommendations
47
Section V: Conclusions and
Recommendations

48
The Cost of Hunger in Africa:
Results from Egypt
Conclusions and
Recommendations
A. Child Undernutrition: Implications for Egypt’s social and economic
development
The Cost of Hunger Study is an important step forward to better understand the role that child nutrition and human
development can play as a catalyser, or as a constraint, in the social and economic transformation. This report marks the first
analysis on the social and economic impact of child undernutrition specific to Egypt, opening the way for increased understanding
of its consequences.
Its results strongly suggest that in order for the country to achieve sustainable human and economic growth, special attention
must be given to the early stages of life as the foundation of human capital. The results of the study are supported by a strong
evidence base, and a model of analysis adapted for Africa, which demonstrates the depth of the consequences of child
undernutrition in health education and labour productivity. This study further quantifies the potential gains of addressing child
undernutrition as a priority. Now, stakeholders have, not only the ethical imperative to address child nutrition as a main
concern, but a strong economic rationale to position stunting in the centre of the development agenda.
The study estimates that child undernutrition generates health costs equivalent 1.1 billion EGP (USD 213
million). These costs are due to episodes directly associated with the incremental quantity and intensity of illnesses that affect
underweight children and the protocols necessary for their treatment. It is also important to note that only 1 out of every 5
children is estimated to be receiving proper health attention. As health coverage expands to rural areas, there will be an
increase in people seeking medical attention; this can potentially affect the efficiency of the system to provide proper care
services. This study illustrates that a reduction of child undernutrition could facilitate the effectiveness of this expansion by
reducing the incremental burden generated by the health requirements of underweight children.
Furthermore, the study estimates that 11% of all cases of child mortality in Egypt are associated with the higher risk
of undernutrition. Hence, a preventive approach to undernutrition can help reduce this incremental burden to the public
sector, and also reduce the costs that are currently being covered by caretakers and families.
Increasing the educational level of the population, and maximizing the productive capacity of the population dividend, is a key
element in increase competitiveness and innovation. This represents an interesting opportunity in Egypt where the population
under 15 years is estimated to be 31% of the total population. These children and youth must be equipped with the skills
necessary for competitive labour. Thus, the underlying causes for low school performance and early dropout must be addressed.
As there is no single cause for this phenomenon, a comprehensive strategy must be put in place that looks at improving the
quality of education and the conditions required for school attendance. The study demonstrates that stunting is one of the major
contributing factors to impaired cognitive and physical development that negatively impacts academic performance, which when
addressed efficiently can improve scholastic achievements and hence individuals’ future labour opportunities.
The study estimates that children who were stunted experienced a 2% higher repetition rate in school. As a
result, 10% of all grade repetitions in school are associated to the higher incidence of repetition that is experienced by stunted

Section V:
Conclusions and Recommendations
49
children. 59% of these cases of grade repetition occur in primary school. These numbers suggest that a reduction in the stunting
prevalence could also support an improvement in schooling results, as it would reduce preventable burdens to the education
system.
On the continent, more than half of the population is expected to live in cities by 2050. An important component to prepare for
this shift is to ensure that the workforce is ready to make a transition towards a more skilled labour, and economies are able to
produce new jobs to reduce youth unemployment. By preventing child stunting and thus avoiding the associated loss in physical
and cognitive capacity that hinders individual productivity, people can be provided with a more equal opportunities for success.
The study estimates that 41% of the working age population in Egypt is stunted. This population has achieved on
average 0.2 years of lower schooling levels than those who did not experience growth retardation. As the country continues to
urbanize, and an increasing number of people participate in skilled employment, this loss in human capital will be reflected in a
reduced productive capacity of the population. Thus, it may be a particularly crucial time to address child undernutrition and
prepare future youth for better employment by prioritizing the reduction of stunting in Egypt’s transformation agenda.
The COHA model also provides and important prospective analysis that sheds light on the potential economic benefits to be
generated by a reduction in the prevalence of child undernutrition. The model estimates that, in the analysed countries, a
reduction of the prevalence to half of the current levels of child undernutrition by the year 2025 can generate
annual average savings of EGP 732 million (USD 133 million). An additional scenario shows that a reduction to 10%
stunting and 5% underweight for that same period could yield annual average savings of EGP 907 billion (USD
165 million). This economic benefit that would result from a decrease in morbidities, lower repetition rates and an increase in
manual and non-manual productivity, presents an important economic argument for the incremental investments in child
nutrition.
This study is also an important example of how South-South collaboration can work to implement cost effective activities in
development and knowledge sharing. Egypt’s participation as one of the pilot countries of the study, and its feedback in
challenges faced in collecting the data at national level was an important element in adapting the COHA methodology for Africa.
The contributions of the Egypt National Implementation Team (NIT) will serve to facilitate the expansion of this tool in the
continent.
Although the Cost of Hunger study is an important step forward in this type of analysis, there are still important questions left
unanswered. Egypt is currently facing an increased prevalence of non-communicable diseases, such as strokes, heart
attacks, and diabetes (which is also affecting children) which in many cases are a consequence of malnutrition, particularly
obesity. These consequences have not been addressed as part of this analysis which implies that the health cost of
undernutrition could have been underestimated in this framework and that the actual impact is indeed higher than the values
presented.
Lastly, this study illustrates the valuable role that data and government-endorsed research can play in shedding light
on pertinent issues on the continent, as well as informing policy. This study will help the country engage within global
nutrition movements such as the Scaling Up Nutrition (SUN) Initiative as programmes and interventions are put in place to
address stunting as a national priority.

50
The Cost of Hunger in Africa:
Results from Egypt
B. Recommendations of the study
This study presents some key initial findings of the Cost of Hunger in Egypt, as well as both challenges and opportunities to the
country regarding the reduction of child undernutrition. The study estimates the economic and social cost of child
undernutrition at 20.3 billion EGP. Without measures to combat and eliminate undernutrition, this cost is expected to
increase by about 32% by 2025 to reach to 26.8 billion EGP. That is an additional cost of an estimated 6.5 billion EGP of
not taking any steps to address undernutrition among children under five; a situation that requires urgent and systematic
response, prioritizing malnutrition in the national health agenda and within the context of a broader development framework.
A clear recommendation of this study is that Egypt must review its national development frameworks to ensure that
the reduction of the stunting prevalence is a key outcome indicator for social and economic development
policies. Chronic child undernutrition can no longer be considered a sectoral issue, as both its causes and solutions are linked
to social policies across numerous sectors. As such, stunting reduction will require interventions from the health, education,
social protection and social infrastructure perspectives. Reducing stunting can be an effective indicator of success in larger social
programs. To target stunting and ensure evidence-based responses, a better understanding of its underlying
causes is required. Stunting reduction can be an effective indicator of success in larger social programs. This study encourages
countries not to be content with “acceptable” levels of stunting; equal opportunity should be the aspiration of every country on
the continent. In this sense, it is recommended that aggressive targets are set in Egypt for the reduction of stunting
that go beyond proportional reduction, to establish an absolute value as the goal at 10% . More specifically,
investment should be increased in combatting undernutrition during the first 1000 days of a child’s life, including
through improved availability and access to nutrient-dense complementary foods for children aged 6 to 23 months old.
In order to address the multiple dimensions of child nutrition, a comprehensive response is needed. In this sense a
recommendation of the National Implementation Team (NIT) is to propose a “National Social, Economic and Health
Plan”, directly under the Prime Minister and President’s oversight, to mobilize political will in a multisectoral
effort that includes concerned public and private entities, and builds on the National Nutrition Strategy (2007-2017). It is also
important to consider the role that the Food Security Advisory Board can play in the implementation and evaluation of this plan,
expanding its approach to a more holistic nutrition security framework. This plan can be a tool to reallocate strategic funds to
the different stakeholders for malnutrition prevention and elimination programs. A critical aspect of this plan is to assign specific
institutional responsibilities of the involved institutions to ensure clear accountability and a framework of a limited number of
nationally agreed indicators of food security and nutrition that are measurable at the output, outcome and impact levels.
A priority area for enhancing the national capacity to address malnutrition is to improve monitoring and evaluation
systems and clearly link these to prevention interventions. Currently, assessments of the prevalence of child nutrition
are carried-out periodically, between every 3 to 5 years. Nevertheless, in order to be able to measure short term results in the
prevention of stunting, a more systematic approach with shorter periodicity is recommended, of 2 years between each
assessment. As the focus on the prevention of child undernutrition should target children under 2 years of age, these results will
provide information to policy makers and practitioners on the results being achieved in the implementation of social protection
and nutrition programmes. In practical terms, this may be achieved by strengthening a national nutrition surveillance system that
facilitates evidence-based interventions, and is complemented by ensuring that the effectiveness of preventative interventions is
adequately evaluated.
Another important element is to further the understanding of the determinants of child undernutrition in each context. As an
initial step, it is recommended that the assessment of child nutrition also includes information that relates the
nutritional status of the children to the livelihoods and economic activities of households, as well as access to
basic services, such as water and sanitation. This information can be used to inform programme design to ensure that
interventions effectively reach these vulnerable families with appropriate incentives and innovative approaches within social
protection schemes.
A key element of addressing stunting is prevention. It is important to consider, in high prevalence areas, increasing focus on
precautionary and prevention policies, alongside therapeutic support, to reduce the prevalence of child undernutrition.
From the health perspective, there are several actions that can be implemented or expanded to achieve this goal. Particular
attention can be given to mothers and caretakers that might improve care practices, such as providing health awareness
programs for females, particularly before marriage and pregnancy, and increasing the role of female health enumerators in rural
areas to ensure that that they transfer health and nutrition awareness for women in the pregnancy age, to protect them from
malnutrition and provide them with necessary information to prepare healthy complete meals for their families. An important

Section V:
Conclusions and Recommendations
51
action can be investing in a communication strategy and programmes for behaviour change by the Ministry of Health, that also
include messages to inform vulnerable families of nutritious low budget foods. Infant and young feeding practices should also be
considered as part of a complete health package.
Schools can also serve as good platform for behaviour change communication for future generations through
nutrition and health education, as well as for health check-ups and screening. Nutritional awareness materials can be
introduced into the school curriculum, while strengthening health and nutrition training for teachers will be key to delivering
this. More specifically, targeting school girls in this area is critical, as those girls will be future mothers and shall bear much of the
responsibility of raising a family and overseeing feeding practices for them. Additionally, periodic check-ups and screening by
health professionals on the nutritional status of children in schools, particularly for anaemia, can also help determine the
effectiveness of the interventions and the need to adjust activities. The national school feeding programme overseen by the
Ministry of Education that currently reaches 5.3 million of an estimated 17 million students, serves as a good incentive for school
enrolment and retention, as well as a safety net in food insecure communities.
To ensure the effectiveness of community interventions, it is vital to also address the institutional capacity particularly at
the local level. Establishing training programs for capacity building of employees in the health sector can be an
important opportunity, building on the widespread presence of the Ministry of Health and the health care units in various
geographical locations in Egypt. The historical collaboration between the intersectoral National Committee for Nutrition and
various concerned departments in the Government will be crucial to propose and follow up the on implementation of policies
and interventions, and obtaining the adequate allocation of funds for its implementation. Additionally, new institutional
arrangements can be proposed to coordinate the social response to the most vulnerable population, for example through the
Ministry of Planning that can guide, regulate and support short and long term policies.
From a market perspective, there are also policies that can be analysed and potentially contribute to an
enabling environment for the elimination of child undernutrition. One option to address the poor access to a diverse
diet to pregnant and lactating women in geographical areas of high vulnerability, is the provision of healthier food commodities
that supply a portion of the nutritional intake required. This could be done through monetary top-up to existing subsidized
commodities that are made available in-kind. Innovative targeting approaches should be considered including categorizing the
subsidy system to offer food baskets by beneficiary/age group, noting however that this would add an additional financial and
administrative burden to the existing subsidy system; instead index-linked cash and voucher options could be considered as a
complementary option. In a context of high volatility in the market and macroeconomic instability, mechanisms that limit the
variation of food prices can be considered, particularly for healthy foods, such as fruits, vegetables, dairy products and pulses.
As part of efforts to combat stunting during the first 1000 days of a child’s life, these market policies must consider actions to
emphasize the importance of exclusive breastfeeding for children under 6 months, and continued to 2 years, and avoid its
replacement with milk formula. A parallel focus on strengthening health education for optimal child weaning practices is critical.
From an agricultural and production perspective, it is important to revise the agriculture policies and food commodities
that are consumed by children, including ensuring basic standards are complied with in food fortification,
particularly better control in salt iodization. Outreach-oriented interventions should be encouraged and monitored in
order to assess efficiency and scalability, as well as analyse lessons learnt from programmes with food intervention components;
particularly those targeted by geographic areas, i.e. Upper Egypt, or special population groups, i.e. pregnant and lactating
mothers.
The level of engagement of the private sector in eliminating stunting can also be a factor of success. Special incentives can be
analysed to encourage Corporate Social Responsibility in supporting NGOs that are implementing effective nutrition
interventions. Additionally, encouraging the private sector and the media to develop nutrition awareness campaigns can have an
important impact in improving overall care practices. Such campaigns need to be properly guided to ensure proper messaging
and targeting for different beneficiary groups. Finally, interaction with the private sector to agree on making mandatory, by law,
the fortification of specific commodities can also represent an important mechanism to reduce vitamin and mineral deficiencies.
Lastly, Egypt can also benefit from exchanging experiences from within and outside the continent. In this sense, it is
recommended that interaction with the Scaling Up Nutrition (SUN) Initiative is reactivated to integrate national
nutritional goals within this global movement and help maintain political focus on child undernutrition as a national and
continental priority.

52
The Cost of Hunger in Africa:
Results from Egypt
Section V1:
Annexes
Section VI:
Annexes
53
Annexes
Annex 1. Glossary of Terms
1. Average number of days require for hospitalization: The average number of days a child needs to stay in a hospital
when hospitalized, to receive adequate care.
2. Average number of days required for ICU: The average number of days a child needs to stay in the ICU when put in
ICU care, to receive adequate care.
3. Average number of primary care visits per episode: When a child experiences a given pathology, he/she may require
medical care multiple times. This variable is the average number of primary (outpatient) medical care visits a child requires
per episode.
4. Average waiting time spent at primary care: When a caretaker brings a child to a primary care facility, the time the
parent and child spend at the facility for waiting and receiving care.
5. Cost of medical inputs per event during hospitalization: This variable includes the medical materials (medicines,
procedures) that are covered by the hospital for treatment of each pathology case.
6. Cost of medical inputs per event in ICU: This variable includes the medical materials (medicines, procedures) that are
covered by the hospital for treatment of each pathology case in ICU.
7. Cost of medical inputs per event in primary care: This variable includes the medical materials (medicines,
procedures) that are covered by the health facility for treatment of each pathology case.
8. Costs not covered by the health system: This variable includes the value of the inputs (i.e. medications) that are paid
for by the family.
9. Daily cost of hospital bed during hospitalization: This variable includes the total cost to the hospital calculated per
day per patient staying in the hospital. This value includes the cost of staff, facilities and equipment, as a unit cost per patient.
10. Daily cost of hospital bed in ICU: This variable includes the total cost to the hospital calculated per day per patient
staying in the ICU. This value includes the cost of staff, facilities and equipment, as a unit cost per patient.
11. Daily hours lost due to hospitalization: The number of hours the caretaker spends at the hospital each day with the
child when he/she brings a child to a primary care facility.
12. Differential Probability (DP): Refers to the difference between the probability of occurrence of a consequence (i.e.,
disease, grade repetition and lower productivity) given a specific condition. The model uses this variable specifically to
determine the risk among those suffering from undernutrition and those who are not (ECLAC).
13. Discount rate: The interest rate used to assess a present value of a future value by discounting (FAO). In the model it is
utilized to obtain the present value in the scenario section.

54
The Cost of Hunger in Africa:
Results from Egypt
14. Dropout rate per grade: Percentage of students who drop out of a grade in a given school year (UNESCO).
15. Episodes: It is the number of disease events occurring for a given pathology. In the model it is based on a 1 year period, i.e.
the number of times a specific pathology occurs in 1 year (ECLAC).
16. Food insecurity: Exists when people lack access to sufficient amount of safe and nutritious food and therefore, are not
consuming enough for an active and healthy life. This may be due to the unavailability of food, inadequate purchasing power
or inappropriate utilization at household level (FAO).
17. Food vulnerability: Reflects the probability of an acute decline in food access or consumption, often in reference to some
critical value that defines minimum levels of human wellbeing (WFP).
18. Hunger: The status of persons, whose food intake regularly provides less than their minimum energy requirements, i.e.
about 1800 kcal per day. It is operationally expressed by the undernourishment indicator (FAO).
19. Incidental retrospective dimension: Used to estimate the cost of undernutrition in a country’s population in a given
year. The model applies it by looking at the health costs of pre-school children (0 to 5-year-olds) suffering from
undernutrition, the education costs of school-age children (6 to 18-year-olds) and the economic costs resulting from lost
productivity by working-age individuals (15 to 64-year-olds) (ECLAC).
20. Intrauterine growth restriction (IUGR): Refers to the foetal weight that is below the 10th percentile for gestational
age (WHO). In the model, this is the only type of condition considered in the estimation of cost for low birth weight
children.
21. Low Birth Weight (LBW): A newborn is considered to have low birth weight when he/she weighs less than 2,500 grams
(WHO).
22. Malnutrition: A broad term for a range of conditions that hinder good health caused by inadequate or unbalanced food
intake or by poor absorption of the food consumed. It refers to both undernutrition (food deprivation) and over nutrition
(excessive food intake in relation to energy requirements) (FAO).
23. Mortality rate: The proportion of deaths per year in a given population, usually multiplied by a 10th population size so it is
expressed as the number per 1,000, 10,000, 100,000, individuals per year.
24. Percentage of cases that attend health services: The proportion of episodes for which a caretaker brings a child to a
primary health facility for treatment.
25. Productivity/Labour productivity: Measures the amount of goods and services produced by each member of the labour
force or the output per unit of labour (ILO). In the model, it refers to the average contribution that an individual can make
to the economy, measured by consumption or income, depending on data availability.
26. Proportion of episodes requiring hospitalization: When a child experiences pathology, he/she may require in-patient
care. This variable identifies the proportion of the episodes by pathology, for which a child requires hospitalization.
27. Proportion of episodes requiring ICU: When a child experiences pathology, he/she may require care in an ICU facility.
This variable identifies the proportion of the episodes by pathology, for which a child requires ICU care.
28. Prospective or potential savings dimension: This dimension makes it possible to project the present and future losses
incurred as a result of medical treatment, repetition of grades in school and lower productivity caused by undernutrition
among children under the age of five in each country, in a specific year (ECLAC).
29. Public social spending: Social expenditure is the provision by public (and private) institutions of benefits to, and financial
contributions targeted at, households and individuals in order to provide support during circumstances, which adversely
affect their welfare, provided that the provision of the benefits and financial contributions constitutes neither a direct
payment for a particular good or service nor an individual contract or transfer (OECD).
30. Relative risk: Refers to the risk of an event occurring, given a specific condition. It is expressed as a ratio of
the probability of the event occurring in the exposed group versus a non-exposed group. In the model it is used to establish
the risk level of disease, lower educational performance or lower productivity relative to exposure to undernutrition.
31. Repetition rate per grade: Number of repeaters in a given grade in a given school year, expressed as a percentage of
enrolment in that grade in the previous school year (UNESCO).

Section VI:
Annexes
55
32. Stunting: Reflects shortness-for-age; an indicator of chronic malnutrition, calculated by comparing the height-for-age of a
child with a reference population of well-nourished and healthy children (WFP). The model uses it as the indicator to
analyse the impact on educational performance and productivity.
33. Survival rate: A rate calculated for a given geographic area that presents the likelihood of a person surviving in a given
period of time.
34. Undernourishment: Food intake that is continuously insufficient to meet dietary energy requirements. This term is used
interchangeably with chronic hunger, or, in this report, hunger (FAO).
35. Undernutrition: The result of prolonged low levels of food intake and/or low absorption of food consumed
(undernourishment). It is generally applied to energy (or protein and energy) deficiency, but it may also relate to vitamin and
mineral deficiencies (FAO).
36. Underweight: Measured by comparing the weight-for-age of a child with a reference population of well-nourished and
healthy children (WFP). The model utilizes it to analyse the impact of child undernutrition on health.
37. Unit cost per attention in primary care: This variable includes the total cost to the health facility per attention,
comprising the cost of staff, facilities and equipment, as a unit cost per patient.
38. Wasting: Reflects a recent and severe process that led to substantial weight loss, usually associated with starvation and/or
disease. Wasting is calculated by comparing weight-for-height of a child with a reference population of well-nourished and
healthy children (WFP).

56
The Cost of Hunger in Africa:
Results from Egypt
Annex 2. Methods and Assumptions
Index Source
First Economic data
Gross Domestic Product International monetary fund data for 2009.
$US exchange rate International monetary fund data for 2009.
Purchasing power parity International monetary fund data for 2009.
Social Expenditure Ministry of finance, Egyptian Economic Monitor,
December 2010.
Health Expenditure World Health Organization.
Education Expenditure Ministry of finance, Egyptian Economic Monitor,
December 2010.
Average transport cost (two public transportation tickets in urban
areas in local currency)
Central Agency for Public Mobilization and Statistics
(CAPMAS), Household Income, Expenditure and
Consumption Survey (HIECS) 2008/ 2009, Table 2-2.
Minimum wage per hour
Egyptian Cabinet, Information and Decision Support
Center, Egyptian Food Observatory, the vulnerable
household’s survey.
Average wage per hour CAPMAS, Labour Force Survey (LFS), 2009.
Annual Consumer price index CAPMAS data, (data were obtained by special request).
Average income per years of schooling CAPMAS, LFS, 2009.
Annual average income related to productive work, manual
intensive activities (Agriculture, Forestry, Fishery, Mining) by age
Calculated based on CAPMAS, HIECS 2008/ 2009, and LFS
2009 data.
Annual average income related to productive work, NON manual
intensive activities (Excluding Agriculture, Forestry, Fishery,
Mining) per years of schooling and age
Calculated based on CAPMAS, HIECS 2008/ 2009, and LFS
2009 data.
Average working hours per week Calculated from LFS 2009 data.
Annual worked hours per age group Calculated from LFS 2009 data based on average working
hour per week multiplied by number of weeks in the year.
Employment rate Calculated based on CAPMAS LFS 2009 data.
Second Demographic Data
Volume of Births CAPMAS, births and deaths bulletin.
Death rate CAPMAS, births and deaths bulletin.
Distribution of workers by Manual and Non-Manual Labor per age
group Calculated from CAPMAS LFS 2009 data.
Distribution of workers by educational status Calculated from CAPMAS LFS 2009 data.
Working age population (WAP) by educational level Calculated from CAPMAS LFS 2009 data.
Third Health Data
Underweight prevalence for the year of analysis or last available. Calculated from Egypt Demographic Health Survey data,
2005 and 2008.
Stunting prevalence for the year of analysis or last available. Calculated from Egypt Demographic Health Survey data,
2005 and 2008.

Section VI:
Annexes
57
Index Source
Underweight prevalence of children under 5 years old Calculated from Egypt Demographic Health Survey data,
2005 and 2008.
Underweight mode prevalence Calculated from Egypt Demographic Health Survey data,
2005 and 2008.
Stunting prevalence of children under 5 years old Calculated from Egypt Demographic Health Survey data,
2005 and 2008.
Stunting mode prevalence Calculated from Egypt Demographic Health Survey data,
2005 and 2008.
Number of annual disease events (anaemia, ADS, ARI, Stunting,
Underweight, Wasting) by Age group
Estimated by health specialists and experts through in-
depth interview.
Average number of primary care visits for each pathology
(anaemia, ADS, ARI, Stunting, Underweight, Wasting) by Age group
Estimated by health specialists and experts through in-
depth interview.
Proportion of events of pathology (anaemia, ADS, ARI, Stunting,
Underweight, Wasting) by Age group requiring hospitalization
Estimated by health specialists and experts through in-
depth interview.
Average number of days of hospital treatment for each event
(anaemia, ADS, ARI, Stunting, Underweight, Wasting) by Age group
Estimated by health specialists and experts through in-
depth interview.
Proportion of events of pathology (anaemia, ADS, ARI, Stunting,
Underweight, Wasting) by Age group requiring intensive treatment
(ICU)
Estimated by health specialists and experts through in-
depth interview.
Average number of days of intensive treatment UTI / UCI for each
event (anaemia, ADS, ARI, Stunting, Underweight, Wasting) by Age
group
Estimated by health specialists and experts through in-
depth interview.
Average waiting time spent at primary care attention (anaemia,
ADS, ARI, Stunting, Underweight, Wasting) by Age group
Estimated by health specialists and experts through in-
depth interview.
Daily hours lost due to hospitalization (anaemia, ADS, ARI,
Stunting, Underweight, Wasting) by Age group
Estimated by health specialists and experts through in-
depth interview.
Average unit cost for attention in primary care by age group and
pathology (anaemia, ADS, ARI, Stunting, Underweight, Wasting),
for the year of analysis (x) in local currency,
Estimated by health specialists and experts through in-
depth interview.
Average cost of medical inputs for event in primary care by age
group and pathology (anaemia, ADS, ARI, Stunting, Underweight,
Wasting), for the year of analysis (x) in local currency,
Estimated by health specialists and experts through in-
depth interview.
Average unit cost for attention in hospital by age group and
pathology (anaemia, ADS, ARI, Stunting, Underweight, Wasting),
for the year of analysis (x) in local currency,
Estimated by health specialists and experts through in-
depth interview.
Average cost of medical inputs for event in hospital by age group
and pathology (anaemia, ADS, ARI, Stunting, Underweight,
Wasting), for the year of analysis (x) in local currency,
Estimated by health specialists and experts through in-
depth interview.
Average unit cost for attention in hospital intensive care unit by
age group and pathology (anaemia, ADS, ARI, Stunting,
Underweight, Wasting), for the year of analysis (x) in local
currency,
Estimated by health specialists and experts through in-
depth interview.
Average cost of medical inputs for event in hospital intensive care
unit by age group and pathology (anaemia, ADS, ARI, Stunting,
Underweight, Wasting), for the year of analysis (x) in local
currency,
Estimated by health specialists and experts through in-
depth interview.

58
The Cost of Hunger in Africa:
Results from Egypt
Index Source
Average unit private cost by age group and pathology (anaemia,
ADS, ARI, Stunting, Underweight, Wasting), for the year of analysis
(x) in local currency,
Estimated by health specialists and experts through in-
depth interview.
Average private cost of medical inputs for event by age group and
pathology (anaemia, ADS, ARI, Stunting, Underweight, Wasting),
for the year of analysis (x) in local currency,
Estimated by health specialists and experts through in-
depth interview.
Percentage of low birth weight children Egypt Demographic Health survey 2008
Proportion of events of LBW requiring/access hospitalization Estimated by health specialists and experts through in-
depth interview.
Average number of days of hospital treatment Estimated by health specialists and experts through in-
depth interview.
Proportion of events of LBW requiring intensive treatment UTI /
UCI
Estimated by health specialists and experts through in-
depth interview.
Average number of days of intensive treatment Estimated by health specialists and experts through in-
depth interview.
Average waiting time (in hours) spent by an adult accompanying a
child patient requiring hospitalization
Estimated by health specialists and experts through in-
depth interview.
Fourth Education Data
Initial enrolment by years of education Data were obtained from Ministry of Education.
Final enrolment by years of education Data were obtained from Ministry of Education.
Number of passes by years of education Data were obtained from Ministry of Education.
Number of dropouts (rate) by years of education Data were obtained from Ministry of Education.
Number of population repeating grades (rate) by years of
education Data were obtained from Ministry of Education.
Private cost per student / year by educational grade Data were obtained from CAPMAS HIECS 2008/ 2009
data and were assumed constant for different grades.
Total Number of students year 2009 Ministry of Education, Statistical Yearbook.
Public cost per student
Estimated based on “Education Public Expenditure
Tracking Survey (PETS)” prepared by ministry of finance,
ministry of education and the European Union, December
2009.
Morbidity differential probability for anaemia among healthy versus
underweight children by age groups.
Calculated from Egypt Demographic Health Survey data,
2005 and 2008.
Morbidity differential probability for ADS among healthy versus
underweight children by age groups.
Calculated from Egypt Demographic Health Survey data,
2005 and 2008.
Morbidity differential probability for ARI among healthy versus
underweight children by age groups.
Calculated from Egypt Demographic Health Survey data,
2005 and 2008.
Morbidity differential probability for anaemia among healthy versus
stunted children by age groups.
Calculated from Egypt Demographic Health Survey data,
2005 and 2008.
Morbidity differential probability for ADS among healthy versus
stunted children by age groups.
Calculated from Egypt Demographic Health Survey data,
2005 and 2008.
Morbidity differential probability for ARI among healthy versus
stunted children by age groups.
Calculated from Egypt Demographic Health Survey data,
2005 and 2008.
Probability ratio of death between those who suffered from
undernutrition
Calculated from Egypt Demographic Health Survey data
2008.

Section VI:
Annexes
59
Index Source
Probability ratio of death between those who suffered from
stunting.
Calculated from Egypt Demographic Health Survey data
2008.
Higher Probability (relative risk) of stunted of repeating grades. Calculated from SYPE 2009 data.
Higher Probability (relative risk) of stunted of dropping out. Calculated from SYPE 2009 data.
Monthly hours worked. Calculated based on Working hour average per week
which was calculated from CAPMAS LFS 2009 data.
Average travel time for ambulatory care. Calculated from SYPE 2009 data.

60
The Cost of Hunger in Africa:
Results from Egypt
Annex 3. Brief Description of COHA Data Collection Process
The process of the COHA in Egypt was initiated with a training of the National Implementation Team, held in Cairo in January
2011, with the participation of experts from IDSC, the National Nutrition Institute, Ministry of Agriculture and Ministry of
Health. The data collection, processing and analysis were led by IDSC in collaboration with CAMPAS, and with support from the
WFP Country Office. Most of the data was collected from secondary data sources; however, a survey amongst health
practitioners was conducted for the health protocols and costs portion of the model.
The data used in the study and the preliminary results were validated and nationally specific recommendations were produced,
by high-level national stakeholders at a validation workshop held in February 2013, in Cairo.

Section VI:
Annexes
61
Annex 4. Consulted References
"About." Scaling Up Nutrition. Accessed March 13, 2013. http://scalingupnutrition.org/about.
African Regional Nutrition Strategy: 2005-2015. Report. African Union, 2005.
http://www.who.int/nutrition/topics/African_Nutritional_strategy.pdf.
African Union. Directorate of Information and Communication. "CAMH5 Moves into Gear with Meeting on Food and Nutrition
Development." News release, April 14, 2011. African Union.
http://www.au.int/en/sites/default/files/task%20force%20on%20food%20and%20nutrition%20development.pdf.
Almond, Douglas. Long-term Effects of the 1959-1961 China Famine: Mainland China and Hong Kong. Working Paper 13384, (National
Bureau of Economic Research, 2007), Http://www.nber.org/papers/w13384.pdf?new_window=1.
"Birth Rate, Crude (per 1,000 People)." Data. Accessed March 14, 2013. http://data.worldbank.org/indicator/SP.DYN.CBRT.IN.
Black, Robert E., Lindsay H. Allen, Zulfiqar A. Bhutta, Laura E. Caulfield, Mercedes De Onis, Majid Ezzati, Colin Mathers, and Juan
Rivera. "Maternal and Child Undernutrition: Global and Regional Exposures and Health Consequences." The Lancet 371, no.
9608 (2008): 243-60. doi:10.1016/S0140-6736(07)61690-0.
Bryce, J., C. Boschipinto, K. Shibuya, and R. Black. "WHO Estimates of the Causes of Death in Children." The Lancet 365, no. 9465
(2005): 1147-152. Accessed March 13, 2013. doi:10.1016/S0140-6736(05)71877-8. \
CAPMAS, Labour Force Survey. 2009.
CAPMAS, Household Income, Expenditure and Consumption Survey (HIECS). 2009.
CAPMAS, Statistical Yearbook. 2012. (http://www.capmas.gov.eg/book.aspx)
"Cebu Longitudinal Health and Nutrition Survey." UNC Carolina Population Center. Accessed March 13, 2013.
http://www.cpc.unc.edu/projects/cebu/.
Coly, Aminata N., Jacqueline Milet, and Aldiouma Diallo. "Preschool Stunting, Adolescent Migration, Catch-up Growth, and Adult
Height in Young Senegalese Men and Women of Rural Origin." Journal of Nutrtion, June 10, 2008, 2412-420.
Http://jn.nutrition.org.
Crop Prospects and Food Situation. Report. FAO, 2012. http://www.fao.org/.
Daniels, Melissa C., and Linda S. Adair. "Growth in Young Filipino Children Predicts Schooling Trajectories through High School." The
Journal of Nutrtion, March 22, 2004, 1439-446. Accessed September 11, 2012. Jn.nutrition.org.
"Draft Resolution 898(XLV) The Cost of Hunger in Africa: Social and Economic Impacts of Child Undernutrition," Report of the
Committee of Experts of the Fifth Joint Annual Meetings of the AU Conference of Ministers Of Economy and Finance and ECA
Conference of African Ministers of Finance, Planning And Economic Development. Addis Ababa: African Union, 2012.
El-Zanaty, Fatma and Ann Way. 2009. Egypt Demographic and Health Survey 2008. Cairo, Egypt: Ministry of Health, El-Zanaty and
Associates, and Macro International
Abdel-Sayed H, Osman M, El-Zanaty F, Way A. Egypt demographic and health survey 1988. Demographic and Health Surveys. Egypt
National Population Council. Cairo, Egypt, 1989 (and additional analysis).
Egyptian maternal and child health survey (EMCHS). PAPCHILD Surveys. CAPMAS. Cairo, Arab Republic of Egypt, 1992 (and additional
analysis).
El-Zanaty FH, Sayed HAA, Zaky HHM, Way AA. Egypt demographic and health survey 1992. Demographic and Health Surveys. Cairo,
Egypt, 1993 (and additional analysis).
El-Zanaty F, Hussein EM, Shawsky GA, Way AA, Kishor S. Egypt demographic and health survey 1995. Demographic and Health
Surveys. National Population Council. Cairo, Egypt, 1996 (and additional analysis).
Egypt demographic and health survey 1997. Demographic and Health Surveys. El-Zanaty and Associates, Cairo, Egypt, 1998 (and
additional analysis).

62
The Cost of Hunger in Africa:
Results from Egypt
El-Zanaty et al. Egypt demographic and health survey 1998. Demographic and Health Surveys. Cairo, Egypt, 1999 (and additional
analysis).
El-Zanaty F and Way A. Egypt demographic and health survey 2000. Demographic and Health Surveys. Calverton, Maryland, USA:
Ministry of Health and Population [Egypt], National Population Council and ORC Macro, 2001 (and additional analysis).
El-Zanaty F and Way AA. 2003 Egypt interim demographic and health survey. Demographic and Health Survey. Cairo, Egypt: Ministry of
Health and Population [Egypt],National Population Council, El-Zanaty and Asociates, and ORC Macro, 2004 (and additional
analysis).
El-Zanaty F and Way A. Egypt demographic and health survey 2005. Demographic and Health Surveys. Caire, Egypt: Ministry of Health
and Population, National Population Council, El-Zanaty and Associates, and ORC Macro, 2006 (and additional analysis).
El-Zanaty F and Way A. Egypt demographic and health survey 2008. Demographic and Health Surveys. Cairo, Egypt: Ministry of Health,
2009 (and additional analysis).
Glewwe, Paul, and Hanan Jacoby. Delayed Primary School Enrollment and Childhood Malnutrition in Ghana: An Economic Analysis. Vol. 23-98.
Washington, D.C.: World Bank, 1993.
Grebmer, Klaus Von. "Financial Crisis Adding to the Vulnerabilities of the Hungry." In 2009 Global Hunger Index: The Challenge of
Hunger, Focus on Financial Crisis and Gender Inequality. Bonn: Welthungerhilfe, 2009.
Haddad, Lawrence J., and Howarth E. Bouis. "The Impact Of Nutritional Status On Agricultural Productivity: Wage Evidence From The
Philippines." Oxford Bulletin of Economics and Statistics 53, no. 1 (February 1991): 45-68. doi:10.1111/j.1468-
0084.1991.mp53001004.x.
Human Development Report 2011. Report. New York: UNDP, 2011. http://hdr.undp.org/en/reports/global/hdr2011/.
"Hunger Statistics." FAO: FAO Hunger Portal. Accessed March 14, 2013. http://www.fao.org/hunger/en/.
K.G. Dewey and K. Begum, Long-term consequences of stunting in early life. Maternal and Child Nutrition (2011), 7 (Suppl. 3), pp. 5–18
Martínez, Rodrigo, and Andrés Fernández. Model for Analysing the Social and Economic Impact of Child Undernutrition in Latin America.
Santiago De Chile: Naciones Unidas, CEPAL, Social Development Division, 2007.
"MEASURE DHS - Quality Information to Plan, Monitor and Improve Population, Health, and Nutrition Programs." MEASURE DHS -
Quality Information to Plan, Monitor and Improve Population, Health, and Nutrition Programs. Accessed March 14, 2013.
http://www.measuredhs.com/.
Ministry of Health. National Nutrition Survey, 1978. Cairo, Arab Republic of Egypt; 1978 (and additional analysis).
"Mortality Rate, Under-5 (per 1,000 Live Births)." Data. Accessed March 14, 2013. http://data.worldbank.org/indicator/SH.DYN.MORT.
"National Health Accounts: Egypt." WHO. 1995-2010. http://www.who.int/nha/country/egy/en/.
Ndaruhutse, Susy, Laura Brannelly, Michael Latham, and Jonathan Penson. Grade Repetition in Primary Schools in Sub-Saharan Africa: An
Evidence Base for Change. Report. CFBT, 2008. http://www.cfbt.com.
"Nobel Laureate Panel Findings." Nobel Laureate Panel Findings. Accessed March 13, 2013.
http://www.copenhagenconsensus.com/Default.aspx?ID=1637.
"Public Spending on Education, Total (% of GDP)." Data. Accessed March 13, 2013.
http://data.worldbank.org/indicator/SE.XPD.TOTL.GD.ZS.
Ramachandran P. & Gopalan H., “Undernutrition & risk of infections in preschool children”. Indian J Med Res 130, November 2009, pp 579-
583
Report of the Committee of Experts of the Fifth Joint Annual Meetings of the AU Conference of Ministers Of Economy and Finance and ECA
Conference of African Ministers of Finance, Planning And Economic Development. Addis Ababa: African Union, 2012.
Report on the Global AIDS Epidemic. Report. UNAIDS, 2012. http://www.unaids.org/.
Salomon, J., P. De Truchis, and J.C. Mechoir. "Nutrition and HIV Infection." British Journal of Nutrition 87, no. Suppl. 1 (2002). Cambridge
University Press.
The State of Food Insecurity in the World. Report. Rome: FAO, 2012. http://www.fao.org/docrep/016/i3027e/i3027e00.htm.
"Egypt" African Economic Outlook, 2012, http://www.africaneconomicoutlook.org/en/countries/north-africa/egypt/

Section VI:
Annexes
63
"UNESCO Institute for Statistics." UNESCO Institute for Statistics. Accessed March 13, 2013.
http://stats.uis.unesco.org/unesco/tableviewer/document.aspx?ReportId=143.
"United Nations Statistics Division - Classifications Registry." United Nations Statistics Division - Classifications Registry. 2008.
http://unstats.un.org/unsd/cr/registry/regcst.asp?Cl=27.
"Unstats, Millennium Indicators." RSS Main. July 2, 2012. Accessed March 13, 2013. http://mdgs.un.org/unsd/mdg/Data.aspx.
"USAID Commodities Reference Guide." USAID Commodities Reference Guide - Annex I: Definitions. January 2006.
http://transition.usaid.gov/our_work/humanitarian_assistance/ffp/crg/annex-1.htm.
VAM Standard Analytical Framework. World Food Programme, 2002.
Wardlaw,, Tessa, Holly Newby, David Brown, Xiaodong Cai, Mercedes De Onis, and Elaine Borghi. Levels & Trends in Child Malnutrition:
UNICEF-WHO-The World Bank Joint Child Malnutrition Estimates. Report. 2012.
http://www.who.int/nutgrowthdb/jme_unicef_who_wb.pdf.
Whaley, Shannon E., Marian Sigman, Charlotte Neumann, and Nimrob Bwibo. "The Impact of Dietary Intervention on the Cognitive
Development of Kenyan School Children." The Journal of Nutrtion 133 (2003): 3965S-971S. Accessed March 13, 2013.
Http://jn.nutrition.org.
"WHO Global Database on Child Growth and Malnutrition." WHO. Accessed March 13, 2013. http://www.who.int/nutgrowthdb/en//.
"World Economic Outlook Database October 2012." World Economic Outlook Database October 2012. October 2012.
http://www.imf.org/external/pubs/ft/weo/2012/02/weodata/index.aspx.
"World Population Prospects, the 2010 Revision." World Population Prospects, the 2010 Revision. Accessed March 13, 2013.
http://esa.un.org/wpp/Model-Life-Tables/download-page.html. http://www.who.int/nutgrowthdb/jme_unicef_who_wb.pdf.
Whaley, Shannon E., Marian Sigman, Charlotte Neumann, and Nimrob Bwibo. "The Impact of Dietary Intervention on the Cognitive
Development of Kenyan School Children." The Journal of Nutrition 133 (2003): 3965S-971S. Accessed March 13, 2013.
Http://jn.nutrition.org.
WHO. Management of severe malnutrition: a manual for physicians and other senior health workers. ISBN 92 4 154511 9 (NLM
Classification: WD 101). 1999.
WHO. Integrated Management of Pregnancy and Childbirth. ISBN 92 4 159084 X. 2009
"WHO Global Database on Child Growth and Malnutrition." WHO. Accessed March 13, 2013. http://www.who.int/nutgrowthdb/en//.
WHO and UNICEF. (2009). WHO child growth standards and the identification of severe acute malnutrition in infants and children A
Joint Statement by the World Health Organization and the United Nations Children’s Fund.
World Bank, "Egypt" Data accessed March 15, 2013, http://data.worldbank.org/country/egypt.
"World Economic Outlook Database October 2012." World Economic Outlook Database October 2012. October 2012.
http://www.imf.org/external/pubs/ft/weo/2012/02/weodata/index.aspx.
"World Population Prospects, the 2010 Revision." World Population Prospects, the 2010 Revision. Accessed March 13, 2013.
http://esa.un.org/wpp/Model-Life-Tables/download-page.html.
64
The Cost of Hunger in Africa:
Results from Egypt
COHA is supported by
African Union UN Economic Commission
for Africa
COHA Project is supported by:
Photo credits: Cover: WFP/Laura Melo; Page 3: WFP/Jacqueline Seeley; Page 6: WFP/; Page 7: WFP/Marco Frattini; Page 9: WFP/Marco Frattini; Page 11, 12: WFP Egypt, 14: WFP/Marco Frattini; Page 15: WFP/Marco Frattini; Page 19: WFP/Marco Frattini; Page 20: WFP/Laura Melo; Back cover: WFP/Marco Frattini