the cost of electoral administration in great britain · our report into the cost of electoral...
TRANSCRIPT

The cost of electoraladministration in Great Britain
Financial information surveys 2009–10 and 2010–11December 2012
Embargoed until 00:01Thursday 20 December

Translations and other formats
For information on obtaining this publication in another language or in a large-print or Braille version, please contact the Electoral Commission:
Tel: 020 7271 0500Email: [email protected]
© The Electoral Commission 2012

Contents
1 Introduction ...................................................................................................... 4
Background ............................................................................................................ 4
About this report ..................................................................................................... 5
2 Summary .......................................................................................................... 7
3 Overall spend 2007/08 to 2010/11 ................................................................... 8
Funding .................................................................................................................. 9
Overall spend ....................................................................................................... 10
Electoral registration ............................................................................................. 12
Conducting elections ............................................................................................ 13
Staffing of electoral services in Great Britain ........................................................ 14
4 Electoral registration costs in Great Britain (2009/10 and 2010/11) ............... 19
Registration during the canvass ........................................................................... 20
Registration outside the canvass .......................................................................... 24
The cost of registration and performance of EROs .............................................. 27
5 The cost of conducting elections in Great Britain (2009/10 and 2010/11) ...... 30
The cost of elections and performance of ROs .................................................... 33
6 Next steps ...................................................................................................... 36
4
1 Introduction 1.1 During the course of a financial year, significant sums are spent on electoral services across Great Britain and this report provides information on the levels and types of expenditure during the four years 2007/08 – 2010/11.
Background 1.2 The Electoral Commission has the power to collect information from Electoral Registration Officers (EROs) and Returning Officers (ROs) on the costs of delivering their statutory election and electoral registration functions.1 The Commission also has the power to set performance standards for EROs and ROs, and a duty to publish assessments of the level of performance by these officers against the standards.2
1.3 Over the past four years we have worked with the Chartered Institute of Public Finance and Accountancy (CIPFA) to develop a financial information survey to collect information on the costs of delivering elections and electoral registration and to analyse that data. We have collected data from EROs and ROs, at the end of each financial year, from 2007/8 to 2010/11. Our report into the cost of electoral administration in Great Britain covering the 2007/08 and 2008/09 financial years, published in June 2010, provided details on these first two years of data collection.3
1.4 The latest survey4 gives details of actual expenditure on electoral registration and elections work, broken down to show the categories of spend, together with information about funding sources.
1.5 In collecting this information we have aimed to ascertain the costs required to deliver electoral administration functions across Great Britain. In carrying out our analysis of this data, our key objective has been to establish a better understanding of current expenditure and levels of funding for electoral services across Great Britain. We have also sought to use this information in conjunction with our analysis of performance by EROs and ROs against our standards to understand the impact of spend on performance.5
1.6 However, variances in the quality and completeness of the information provided, coupled with the fact that in each year we have not received a full set of returns, has
1 Section 9C of PPERA the Political Parties, Elections and Referendums Act 2000 (PPERA), as inserted by Section 67 of the Electoral Administration Act 2006 (EAA). 2 Sections 9A and 9B of PPERA 3 The cost of electoral administration in Great Britain: Financial information survey 2007–8 and 2008–9, June 2010. 4 Financial information survey 2010-11. 5 Under the performance standards framework we have collected annual performance information from EROs since 2008 and ROs since 2009.

5
limited the usefulness of the data. As we have not received 100% of returns, we have used a process known as ‘grossing’6 to help complete the picture.
1.7 Although funding for some elections is provided by the UK Government and the Welsh Government, a detailed breakdown of the costs of those elections (or registration activities) is not routinely published. However, we have published a comprehensive report on the costs of administering the May 2011 UK-wide referendum on the UK Parliamentary voting system. This report provides information on the costs incurred by Counting Officers (COs) and Regional Counting Officers (RCOs), and makes a series of recommendations for improvements to the current funding framework. The UK Government has confirmed that it intends to undertake a full review of the current funding system before the European Parliamentary Elections in 2014 and we look forward to the implementation of any changes in good time for these elections.
About this report 1.8 The data collected over the last four years has created a large database of financial information relating to the levels of overall expenditure on electoral registration and elections across Great Britain.
1.9 This report provides information on the levels of expenditure and funding in 2009/10 and 2010/11, and contains a comparison of overall spend in each of the four years that we have collected this information. In addition, this report provides a comparison of spend against performance standards assessments in each of 2009/10 and 2010/11. A full breakdown of the information collected from individual ROs and EROs can be found on our website at www.electoralcommission.org.uk/performance-standards/financial-information.
1.10 While this report highlights the key changes on spending over the four year period and seeks to draw out the relationship between spend and performance against the standards, we have not been able to draw any firm conclusions about the impact of spend on performance or to fully understand the relationship between the amount spent and the precise activities it relates to.
1.11 Having collected and analysed financial data for four years, we can now take stock of what we have gathered and take the opportunity to review what and how we collect information on expenditure from EROs and ROs in the future. In particular, this report highlights how we propose to work from the basis we have now to establish a model which can provide us with more detailed information on spend and the activities it relates to, including how this impacts on performance.
1.12 The remainder of this report is divided into the following:
• Chapter 2 provides a summary of the key financial information • Chapter 3 summarises the overall spend during the period of 2007/08 to 2010/11 6 Grossing is a process where information is taken from local authorities who responded to previous years’ surveys and then trends are calculated and applied to those areas where data is missing.

6
• Chapter 4 sets out the electoral registration costs in Great Britain for 2009/10 and 2010/11 and includes a comparison of spend against ERO performance standards assessments
• Chapter 5 sets out the cost of conducting elections in Great Britain for 2009/10 and 2010/11 and includes a comparison of spend against RO performance standards assessments
• Chapter 6 summarises how the Commission intends to collect and analyse financial information going forwards

7
2 Summary • Funding of electoral administration has varied over the four years principally as a
result of the cycle of elections. Funding ranged from £133.9 million in 2008/09 to £166.8 million in 2010/11, which reflects the fact that fewer elections took place in 2008/09 compared to in 2010/11, with the UK Parliamentary general election taking place in May 2010. In all four years the majority of funding came from local authorities, with the remainder coming from other funding sources, principally provided centrally by the relevant UK Government department or, in the case of National Assembly for Wales elections, by the Welsh Government.
• Overall spend has also fluctuated year-on-year, again principally as a result of the cycle of elections, ranging from £138.2 million in 2008/09 to £192.2 million in 2010/11.
• The total expenditure is split between spending on electoral registration and conducting elections. In each year the majority of spend was on elections, with the exception of 2008/09 where the majority of spend was on electoral registration, which can be attributed to the fact that there were fewer elections held that financial year than in any other, with no elections taking place in Scotland or in some parts of England, and no scheduled combination of polls.
• Broadly a similar amount was spent on electoral registration in all four years, with the average spent being £83 million. For elections, spend ranged from £55.4 million in 2008/09 to £106.7 million in 2010/11.
• Whilst the data has provided information on levels of expenditure and funding for electoral services across Great Britain, due to the breakdown of categories of spend it has not enabled us to fully understand the relationship between the amount spent and the precise activities it relates to or to draw firm conclusions about the impact of spend on performance.
• Consequently, we now intend to review what and how we collect financial
information from EROs and ROs in the future, and aim to establish a model which can provide us with detailed information on spend and the activities it relates to, including how this impacts on performance.

8
3 Overall spend 2007/08 to 2010/11 3.1 Electoral administration activity is split across two statutory functions, electoral registration and the conduct of elections. This section of the report sets out the overall spend on electoral administration across four financial years, from 2007/08 – 2010/11, and highlights the trends and variances across this period.
3.2 The elections7 and electoral registration activities which took place in each of the four financial years are summarised in the table below.
Table 1: Elections and electoral registration activity 2007/08 – 2010/11
2007/08 2008/09 2009/10 2010/11 Elections Elections to the
Scottish Parliament8 (May 2007)
Elections to the National Assembly for Wales (May 2007)
English local elections held in 312 local authorities (not including London) (May 2007)
Mayoral elections held in 3 local authorities in England (May 2007)
English local elections held in 137 local authorities (not including London) (May 2008)
Welsh local elections (May 2008)
Greater London Authority elections (May 2008)
English local elections held in 238 local authorities (not including London) (June 2009) European Parliamentary elections (June 2009) Mayoral elections held in 3 local authorities in England (June 2009)
UK Parliamentary general Election (May 2010) English local elections held in 164 local authorities (including elections to 33 London boroughs) (May 2010) Mayoral elections held in 4 local authorities in England (May 2010)
7 This does not include any by-elections. 8 Although Scottish local government elections were held in May 2007, the provision to collect information from EROs and ROs introduced by the EAA did not apply to local government elections in Scotland. The Local Electoral Administration (Scotland) Act 2011 extended the remit of our performance standards to include local government elections in Scotland.
9
Electoral registration activity
Autumn 2007 annual canvass
Rolling registration activities throughout the year
Autumn 2008 annual canvass
Rolling registration activities throughout the year
Autumn 2009 annual canvass
Rolling registration activities throughout the year
Autumn 2010 annual canvass
Rolling registration activities throughout the year
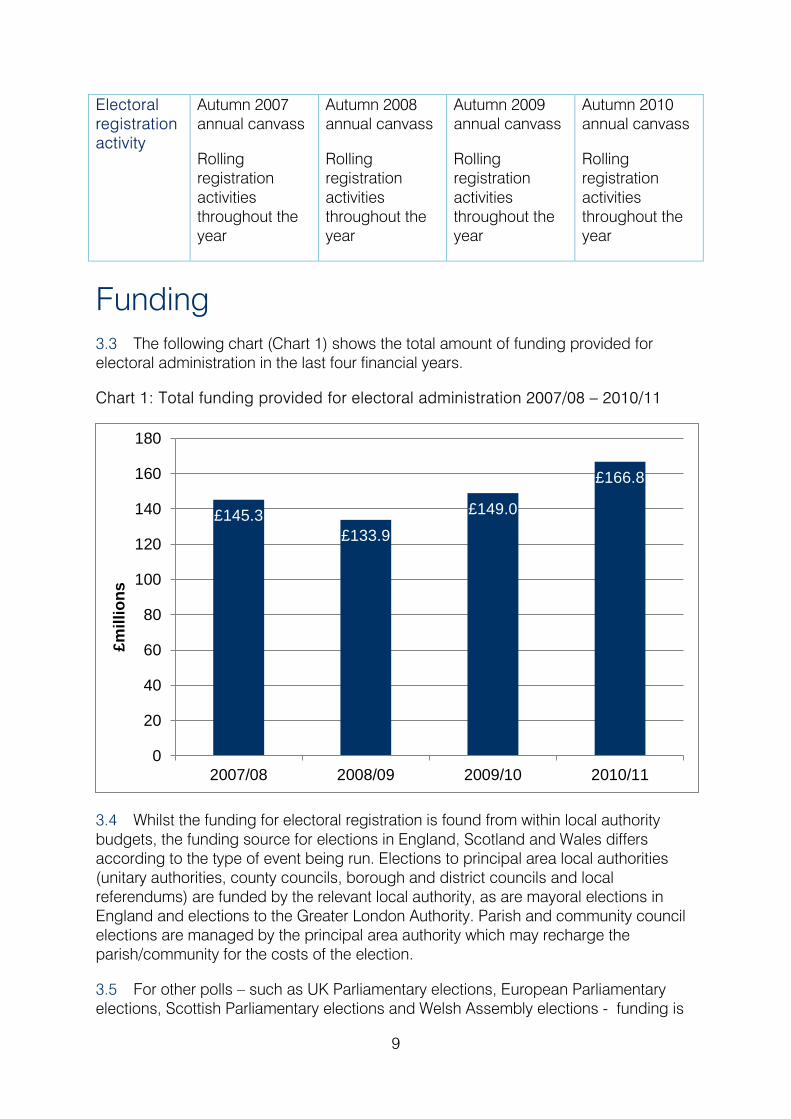
Funding 3.3 The following chart (Chart 1) shows the total amount of funding provided for electoral administration in the last four financial years.
Chart 1: Total funding provided for electoral administration 2007/08 – 2010/11
3.4 Whilst the funding for electoral registration is found from within local authority budgets, the funding source for elections in England, Scotland and Wales differs according to the type of event being run. Elections to principal area local authorities (unitary authorities, county councils, borough and district councils and local referendums) are funded by the relevant local authority, as are mayoral elections in England and elections to the Greater London Authority. Parish and community council elections are managed by the principal area authority which may recharge the parish/community for the costs of the election.
3.5 For other polls – such as UK Parliamentary elections, European Parliamentary elections, Scottish Parliamentary elections and Welsh Assembly elections - funding is
£145.3 £133.9
£149.0
£166.8
0
20
40
60
80
100
120
140
160
180
2007/08 2008/09 2009/10 2010/11
£mill
ions

10
provided centrally by the relevant UK Government department or, in the case of National Assembly for Wales elections, by the Welsh Government. This is generally applied through specific fees and charges Orders.
3.6 The following chart (Chart 2) shows the split of funding in Great Britain. The proportion of funding from additional funding sources was higher in 2009/10 and 2010/11 compared to the two previous years due to the European Parliamentary election that took place in June 2009 and the UK Parliamentary general election in May 2010.
Chart 2: Split of funding for electoral administration 2007/08 – 2010/11
Overall spend 3.7 The following chart (Chart 3) shows the total amount spent on electoral administration in the last four financial years. Spending has fluctuated year-on-year principally as a result of the cycle of elections, with different types and numbers of elections year-on-year (as set out in the table above). In each year the majority of spend was on elections, with the exception of 2008/09 where the majority of spend was on electoral registration, which is attributable to the fact that there were fewer elections held that financial year than in any other, with no elections taking place in Scotland or in some parts of England, and no scheduled combination of polls.
119m 119m 96m
112m
26m 15m 53m 54m
0
20
40
60
80
100
120
140
160
180
2007-08 2008-09 2009-10 2010-11
£milli
ons
Local Authority Additional Funding Sources
11
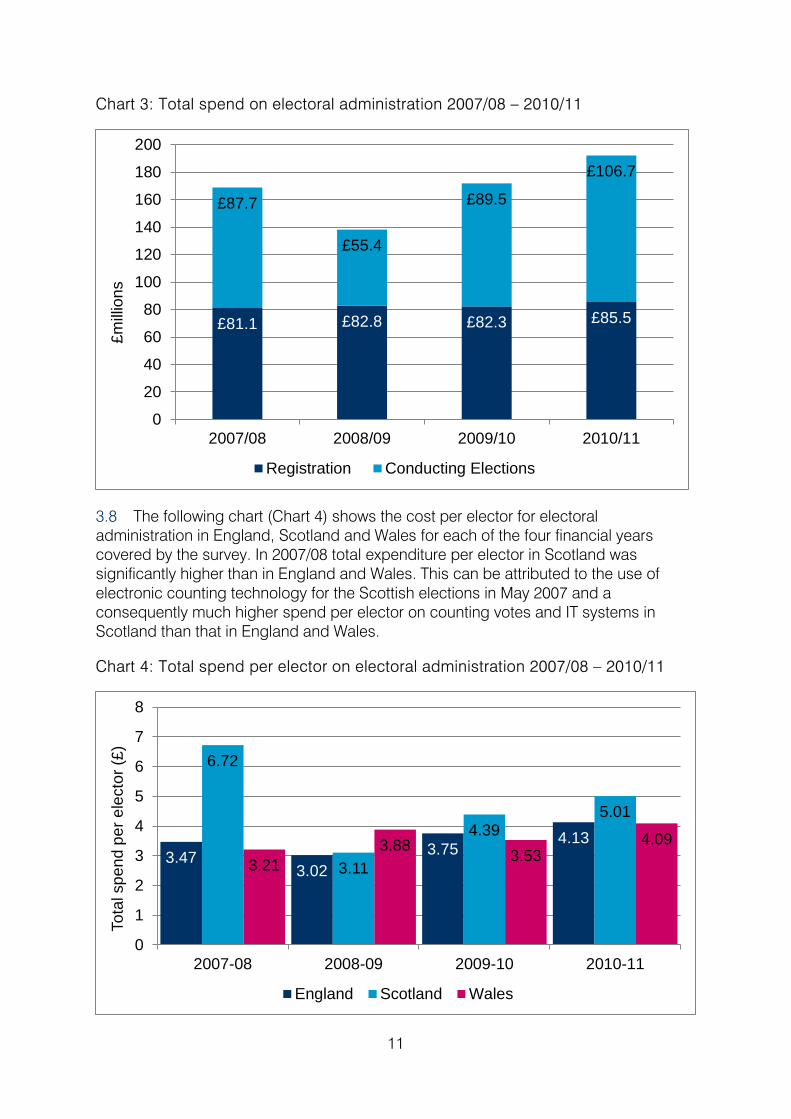
Chart 3: Total spend on electoral administration 2007/08 – 2010/11
3.8 The following chart (Chart 4) shows the cost per elector for electoral administration in England, Scotland and Wales for each of the four financial years covered by the survey. In 2007/08 total expenditure per elector in Scotland was significantly higher than in England and Wales. This can be attributed to the use of electronic counting technology for the Scottish elections in May 2007 and a consequently much higher spend per elector on counting votes and IT systems in Scotland than that in England and Wales.
Chart 4: Total spend per elector on electoral administration 2007/08 – 2010/11
£81.1 £82.8 £82.3 £85.5
£87.7
£55.4
£89.5
£106.7
0
20
40
60
80
100
120
140
160
180
200
2007/08 2008/09 2009/10 2010/11
£milli
ons
Registration Conducting Elections
3.47 3.02
3.75 4.13
6.72
3.11
4.39 5.01
3.21 3.88 3.53
4.09
0
1
2
3
4
5
6
7
8
2007-08 2008-09 2009-10 2010-11
Tota
l spe
nd p
er e
lect
or (£
)
England Scotland Wales

12
Electoral registration 3.9 The funding for all electoral registration activity is found from within local authority budgets. Broadly a similar amount was spent on electoral registration in all four years, with the average spend being £83 million. The cost of registering electors has increased by 5% from £81.1 million in 2007/08 to £85.5 million in 2010/11.
Chart 5: Registration spend 2007/08 – 2010/119
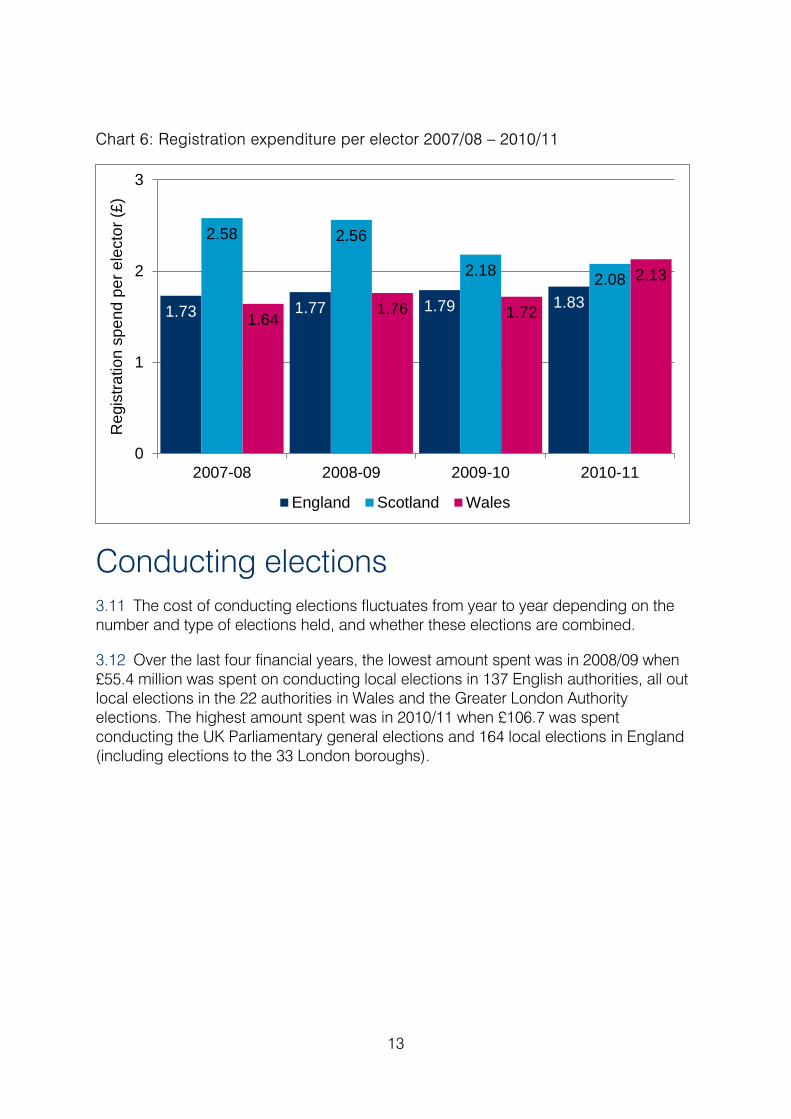
3.10 As chart 6 below shows, there was a significant difference in the amount spent per elector in Scotland in 2007/08 and 2008/09 compared to elsewhere in Great Britain. There is no clear explanation for this variation in spend, although it is notable that the percentage of the total spend which relates to core team staffing in Scotland is significantly higher than compared to elsewhere in Great Britain. The difference in the amount spent per elector was reduced in 2009/10, and again in 2010/11, when local authorities in Wales spent the highest amount on registration per elector. The increase in spend in Wales in 2010/11 may be attributable to an increase in registration activity prior to the referendum on the law-making powers of the National Assembly for Wales which was held in March 2011, but the data collected does not provide us with sufficient information to confirm this analysis.
9 We are unable to show the proportion of spend split between during the canvass and outside the canvass for all four financial years due to the differences in how the survey collected the costs in each of the financial years. We are, however, able to do this for the financial years 2009/10 and 2010/11, and this is covered in chapter 4.
£81.1 £82.8 £82.3 £85.5
0
10
20
30
40
50
60
70
80
90
2007/08 2008/09 2009/10 2010/11
£milli
ons
13
Chart 6: Registration expenditure per elector 2007/08 – 2010/11
Conducting elections 3.11 The cost of conducting elections fluctuates from year to year depending on the number and type of elections held, and whether these elections are combined.
3.12 Over the last four financial years, the lowest amount spent was in 2008/09 when £55.4 million was spent on conducting local elections in 137 English authorities, all out local elections in the 22 authorities in Wales and the Greater London Authority elections. The highest amount spent was in 2010/11 when £106.7 was spent conducting the UK Parliamentary general elections and 164 local elections in England (including elections to the 33 London boroughs).
1.73 1.77 1.79 1.83
2.58 2.56
2.18 2.08
1.64 1.76 1.72
2.13
0
1
2
3
2007-08 2008-09 2009-10 2010-11
Reg
istra
tion
spen
d pe
r ele
ctor
(£)
England Scotland Wales

14
Chart 7: Amount spent on conducting elections 2007/08 – 2010/11
3.13 As chart 8 shows below, there was a significant difference in the amount spent per elector in Scotland across the four years and as compared to England and Wales. The higher level of spend per elector in 2007/08 can be attributed to the costs relating to the use of electronic counting technology for the 2007 Scottish elections, and the lower level of spend in 2008/09 can be attributed to the fact there were no scheduled elections in Scotland that year.
Chart 8: Election expenditure per elector 2007/08 – 2010/11
Staffing of electoral services in Great Britain 3.14 In addition to the expenditure on elections and electoral registration work, the 2009/10 and 2010/11 financial surveys sought information about the number of employees comprising the core team and the cost of employing them. The following
£87.7
£55.4
£89.5 £106.7
0
20
40
60
80
100
120
2007/08 2008/09 2009/10 2010/11
£milli
ons
1.74 1.25
1.96 2.33
4.14
0.55
2.21
2.93
1.56
2.12 1.8 1.96
0
1
2
3
4
5
2007-08 2008-09 2009-10 2010-11
Ele
ctio
n sp
end
per e
lect
or (£
)
England Scotland Wales

15
table sets out the number of core team staff employed in England, Scotland and Wales in 2009/10 and 2010/11 and the cost of employing them.
Table 2: Number of core team staff in England, Scotland and Wales in 2009/10 and 2010/11
Country (Number of local authorities)
Core team staff at each year
Core team staff per 100,000 electors each year
Total spend on core team staff each year
Spend on core team staff per elector each year
% of total spend each year
England (325)
2009/10
1051
2.65
£57.7
£1.48
39%
2010/11 1039 2.63 £62m £1.57 38%
Scotland (32)
2009/10
222
5.72
£9.3m
£2.38
54%
2010/11 224 5.65 £9.1m £2.29
46%
Wales (22)
2009/10
68
3.00
£3.3m
£1.45
41%
2010/11 72 3.13 £3.7m £1.62 40%
Great Britain (379)
2009/10
1341
2.93
£70.3m
£1.55
41%
2010/11 1335 2.92 £74.8m £1.64 39%
3.15 The workload of electoral services staff varies throughout the year. Activity traditionally peaks in the autumn when the annual canvass of electors is undertaken and again in the spring when elections are normally held. To meet this need temporary staff are employed to assist with canvass activities while others work as Poll Clerks, Presiding Officers and count staff at elections.
3.16 The number of staff employed and the spend on staffing in Great Britain has remained relatively constant between the two years of collecting this information. For 2010/11, authorities in Great Britain spent almost £75 million on core team staff, an increase of £4.5 million from the previous financial year, but the number of core team staff slightly decreased, from 1341 in 2009/10 to 1335 in 2010/11.

16
3.17 Whilst spend per elector increased between 2009/10 and 2010/11 across Great Britain as a whole, the spend per elector was slightly reduced in Scotland, from £2.38 in 2009/10 to £2.29 in 2010/11, although this still remained higher than that in England and Wales. The reasons for this are not clear but it should be noted that the structure and staffing of electoral administration differs in Scotland to that in England and Wales.
3.18 In both financial years, the majority of local authorities (170 in 2009/10 and 163 in 2010/11) employed 2 – 3 members of staff. The number of staff ranged between 1 and 30. In 2009/10 and 2010/11, the average number of staff in Scotland was 7, compared to 3 members of staff in England and Wales. As with spend on staff per elector, the number of staff per 1,000 electors in Scotland is significantly higher than in England and Wales.
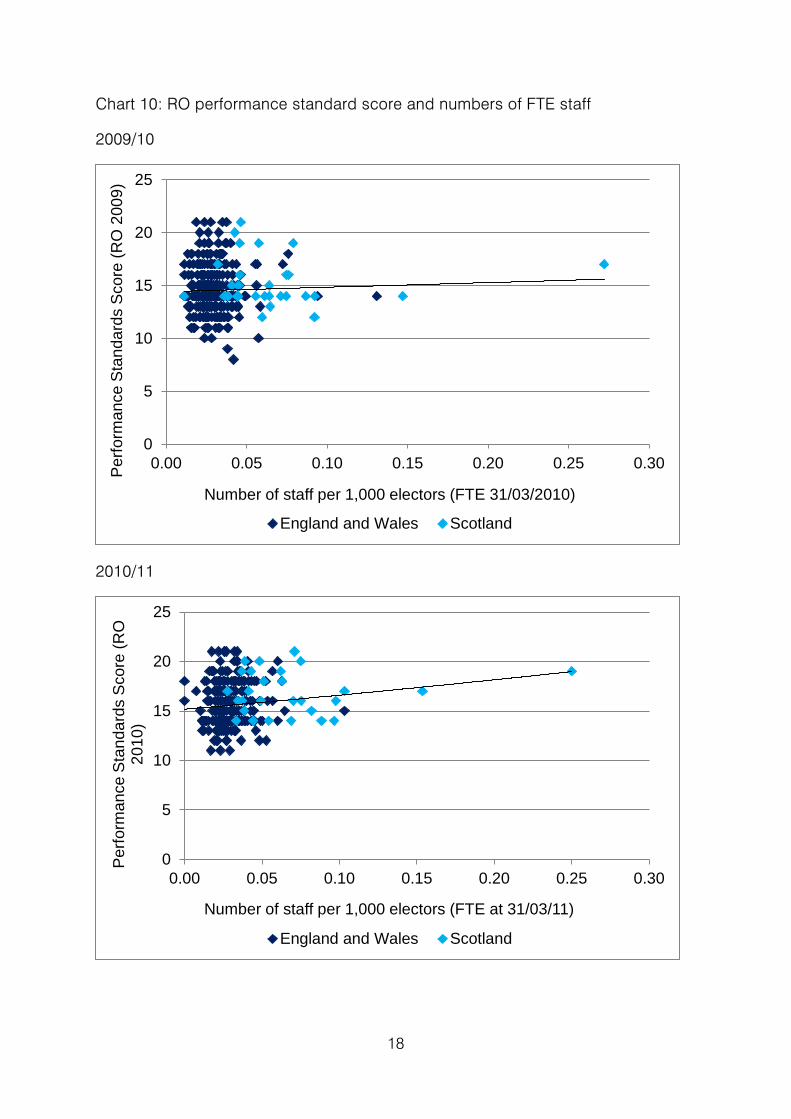
3.19 The following charts (Chart 9 and Chart 10) compare performance standards assessments against numbers of FTE staff. An overall performance standards score has been calculated for each ERO and RO on the following basis: one point was allocated where the standard was assessed as below standard, two points where the standard was met and three where it was exceeded. For example, given there are 10 ERO standards, the lowest score an ERO could achieve was 10 and the highest 30. There are particular issues with producing a scoring system for the performance standards, in that it allows for an ERO or RO to meet all the performance standards but score less than an ERO or RO who exceeds a number of standards but fails one. The lack of a correlation between performance and numbers of FTE staff may, in part, be related to this scoring system, since a high score is not always reflective of high performance. The chart below compares staffing levels with performance standards score.

17
Chart 9: ERO performance standard score and numbers of FTE staff
2009/10
2010/11
0
5
10
15
20
25
30
0.00 0.05 0.10 0.15 0.20 0.25 0.30Per
form
ance
Sta
ndar
ds S
core
(ER
O
2009
)
Number of staff per 1,000 electors (FTE 31/03/2010)
England and Wales Scotland
0
5
10
15
20
25
30
0.00 0.05 0.10 0.15 0.20 0.25 0.30Per
form
ance
Sta
ndar
ds S
core
(ER
O
2010
)
Number of staff per 1,000 electors (FTE at 31/03/11)
England and Wales Scotland
18
Chart 10: RO performance standard score and numbers of FTE staff
2009/10
2010/11
0
5
10
15
20
25
0.00 0.05 0.10 0.15 0.20 0.25 0.30Per
form
ance
Sta
ndar
ds S
core
(RO
200
9)
Number of staff per 1,000 electors (FTE 31/03/2010)
England and Wales Scotland
0
5
10
15
20
25
0.00 0.05 0.10 0.15 0.20 0.25 0.30
Per
form
ance
Sta
ndar
ds S
core
(RO
20
10)
Number of staff per 1,000 electors (FTE at 31/03/11)
England and Wales Scotland

19
4 Electoral registration costs in Great Britain (2009/10 and 2010/11) 4.1 In order to be able to vote in elections in Great Britain, a person’s name must be included in the register of electors. A complete and accurate register is therefore an essential and fundamental part of the democratic process. Responsibility for compiling the register of electors lies with the ERO appointed by each local authority.
4.2 The ERO has a statutory duty to conduct an annual canvass. This takes place every autumn and its purpose is to ascertain the name and address details of anyone who is entitled to be on the register of electors through activities including issuing household canvass forms and making house-to-house enquiries. Section 9A of the Representation of the People Act 1983 (RPA 1983) requires EROs to take ‘all steps that are necessary’ to comply with their duty to maintain the register, including making house-to-house enquiries on one or more occasions in connection with the canvass. The ERO also has a statutory duty to maintain the register throughout the year by way of the rolling registration process.
4.3 The following chart (Chart 11) shows the split of registration spend between these two periods for both the 2009/10 and 2010/11 financial years.
Chart 11: Registration spend split between during canvass and outside canvass
£47.9 £51.2
£34.4 £34.3
0
10
20
30
40
50
60
2009/10 2010/11
£milli
ons
Registration during canvass Registration outside canvass

20
4.4 Approximately 60% of spending on electoral registration is spent during the annual canvass. However, as the following graph shows, this trend is reversed in Scotland in 2010/11 where there was a slightly higher spend outside the annual canvass period than during the annual canvass. As described above, the structure and staffing of electoral administration differs in Scotland to that in England and Wales, which may have contributed to this difference. In Scotland, for example, the number of core team staff per 100,000 electors is significantly higher than in England and Wales.
Chart 12: Registration spend per elector, split during canvass and outside of canvass 2010/11
Registration during the canvass 4.5 Whilst electoral registration activities are comparable year-on-year, registration practices vary by area and in particular during the annual canvass period, due to a variety of reasons such as geography and demographics of a local authority. For example, some EROs will use postal services to deliver their initial and reminder canvass forms, with electors able to return the forms by freepost. Others will use canvass staff to hand deliver initial and reminder canvass forms, for electors to then send back or use canvass staff to both deliver and collect registration forms. Each ERO decides which method best suits their area and enables them to fulfil their responsibilities. This decision may be dictated by social or geographic circumstances.
4.6 £47.9 million (£1.06 per elector) was spent on the registration of electors during the annual canvass in 2009/10, this increased to £51.2 million (£1.12 per elector) in 2010/11. For both years spending was highest in London at £1.31 per elector in
1.12 1.13
1.00
1.17
0.75 0.70
1.08
0.96
0.00
0.20
0.40
0.60
0.80
1.00
1.20
1.40
Great Britain England Scotland Wales
Reg
istra
tion
spen
d pe
r ele
ctor
(£)
Registration (during canvass) Registration (outside canvass)

21
2009/10 and £1.64 per elector in 2010/11. This can be attributed to the cost of temporary registration staff being much higher in London than elsewhere in Great Britain. For both years the cost of temporary registration staff per elector in London was double (£0.35 per elector in 2009/10 and £0.38 per elector in 2010/11) the Great Britain average (£0.17 per elector in 2009/10 and £0.18 per elector in 2010/11). EROs in London tend to receive a lower initial response rate to the annual canvass and, although the final response rate is often high in comparison to other areas, EROs in London tend to do more intensive work to get such a response. For example, EROs in London use more canvassers at all stages of the canvass in comparison to other areas (on average in 2008-10, 29% of annual canvass responses in London were via a canvasser, compared to in Scotland where it was 4%).
Table 3: Registration expenditure during the canvass 2009/10 and 2010/11
Total registration costs during the canvass (£)
Per elector (£)
2009/10 2010/11 2009/10 2010/11 London Borough 7,365,063 9,355,962 1.31 1.64
Metropolitan Borough 8,129,740 9,068,062 0.98 1.08
Unitary Authority 8,567,949 7,760,785 0.95 0.90
District Council 17,501,386 18,371,234 1.08 1.10
Scottish Unitary 4,015,168 3,954,811 1.03 1.00
Welsh Unitary 2,325,310 2,696,688 1.02 1.17
Total 47,904,616 51,207,543 1.06 1.12
4.7 The following charts show the breakdown of expenditure on registration during the canvass for both 2009/10 and 2010/11. The biggest areas of spend on registration during the canvass for both years were on core team staffing, mail costs and canvassing.

22
Chart 13: Breakdown of registration spend during the canvass 2009/10 and 2010/11
2009/10 2010/11
4.8 As explained above, in Scotland the spend on staffing makes up a high percentage of the overall spend. This is reflected in the chart below (Chart 14), which shows the breakdown of spend during the canvass in England, Scotland and Wales.
28%
9%
17%
18%
4% 1% 6%
15% 2%
Core TeamDesign & PrintingMailCanvassingQueries & AppealsPublicity / OutreachCompilation of RegisterSupport ServicesOther
28%
8%
17% 19%
3% 1% 4%
17% 3%
Core TeamDesign & PrintingMailCanvassingQueries & AppealsPublicity / OutreachCompilation of RegisterSupport ServicesOther

23
Chart 14: Breakdown of registration spend during the canvass 2009/10 and 2010/11 for England, Scotland and Wales
2009/10
England Scotland Wales
2010/11
England Scotland Wales
25%
9%
16% 20%
4% 1% 6%
16% 3%
Core TeamDesign & PrintingMailCanvassingQueries & AppealsPublicity / OutreachCompilation of RegisterSupport ServicesOther
47%
8%
24%
7% 2%
2% 2% 8%
0%
Core TeamDesign & PrintingMailCanvassingQueries & AppealsPublicity / OutreachCompilation of RegisterSupport ServicesOther
32%
12% 22%
15%
2% 1%
4%
10% 2%
Core TeamDesign & PrintingMailCanvassingQueries & AppealsPublicity / OutreachCompilation of RegisterSupport ServicesOther
26%
8%
16% 21%
3% 1% 4%
18% 3%
Core TeamDesign & PrintingMailCanvassingQueries & AppealsPublicity / OutreachCompilation of RegisterSupport ServicesOther
46%
9%
26%
6% 1% 2% 3%
7% 0%
Core TeamDesign & PrintingMailCanvassingQueries & AppealsPublicity / OutreachCompilation of RegisterSupport ServicesOther
25%
11%
25%
15%
2% 1% 3%
15% 3%
Core TeamDesign & PrintingMailCanvassingQueries & AppealsPublicity / OutreachCompilation of RegisterSupport ServicesOther

24
Registration outside the canvass 4.9 £34.4 million (£0.76 per elector) was spent on the registration of electors outside of the annual canvass in 2009/10, and this stayed broadly constant in 2010/11 with total spending of £34.3 million (£0.75 per elector). Spending was the lowest in the North West for both years (0.52 per elector in 2009/10 and 2010/11). In 2009/10 the highest spend on registration outside the canvass was in London at £1.20 per elector. In 2010/11 the highest spend was in Scotland at £1.08 per elector.
Table 4: Registration expenditure outside the canvass 2009/10 and 2010/11
Total registration costs outside the canvass (£)
Per elector (£)
2009/10 2010/11 2009/10 2010/11 London Borough 6,723,432 5,939,689 1.20 1.04
Metropolitan Borough 4,071,202 3,871,085 0.49 0.46
Unitary Authority 6,490,943 6,763,698 0.72 0.78
District Council 10,997,293 11,193,491 0.68 0.67
Scottish Unitary 4,490,697 4,303,607 1.15 1.08
Welsh Unitary 1,602,802 2,202,264 0.70 0.96
Total 34,376,369 34,273,834 0.76 0.75
4.10 The charts below show the breakdown of expenditure on registration outside the canvass for 2009/10 and 2010/11. In both years the biggest areas of spend on registration outside the canvass were on core team staffing and support services.

25
Chart 15: Breakdown of registration spend outside the canvass
2009/10 2010/11
4.11 Once again, in Scotland the spend on staffing makes up a higher percentage of the overall spend than that in England and Wales. This is reflected in the chart below (Chart 16), which shows that the breakdown of registration spend across England, Scotland and Wales.
50%
3% 7% 1%
2% 2%
9%
23%
3%
Core TeamDesign & PrintingMailCanvassingQueries & AppealsPublicity / OutreachCompilation of RegisterSupport ServicesOther
53%
3%
6% 1%
2% 1% 5%
24%
5%
Core TeamDesign & PrintingMailCanvassingQueries & AppealsPublicity / OutreachCompilation of RegisterSupport ServicesOther

26
Chart 16: Breakdown of registration spend outside the canvass in England, Scotland and Wales
2009/10
England Scotland Wales
2010/11
England Scotland Wales
46%
3%
7%
1%
3% 2%
9%
26%
3%
Core TeamDesign & PrintingMailCanvassingQueries & AppealsPublicity / OutreachCompilation of RegisterSupport ServicesOther
75% 1% 6% 1% 1% 3%
8% 5%
Core TeamDesign & PrintingMailCanvassingQueries & AppealsPublicity / OutreachCompilation of RegisterSupport ServicesOther
47%
3% 6%
1% 5%
13%
17%
8%
Core TeamDesign & PrintingMailCanvassingQueries & AppealsPublicity / OutreachCompilation of RegisterSupport ServicesOther
49%
3% 7% 2% 2%
1%
5%
26%
5%
Core TeamDesign & PrintingMailCanvassingQueries & AppealsPublicity / OutreachCompilation of RegisterSupport ServicesOther
76%
2% 5% 1%
4% 11%
1%
Core TeamDesign & PrintingMailCanvassingQueries & AppealsPublicity / OutreachCompilation of RegisterSupport ServicesOther
50%
4% 5%
1% 1%
3% 5%
19%
12%
Core TeamDesign & PrintingMailCanvassingQueries & AppealsPublicity / OutreachCompilation of RegisterSupport ServicesOther

27
The cost of registration and performance of EROs 4.12 There has been an improvement in performance by EROs against the Commission’s performance standards over the past four years, as shown in the chart below.
Chart 17: Performance of EROs in Great Britain 2008 – 2011
4.13 The graphs below compare spend on electoral registration and ERO performance against the standards in 2009/10 and 2010/11.
4.14 An overall performance standards score has been calculated for each ERO on the following basis: one point was allocated where the standard was assessed as below standard, two points where the standard was met and three where it was exceeded. Given there are 10 standards, the lowest score an ERO could achieve was 10 and the highest 30. There are particular issues with producing a scoring system for the performance standards, in that it allows for an ERO to meet all the performance standards but score less than an ERO who exceeds a number of standards but fails one.
0% 20% 40% 60% 80% 100%
2010
2009
2008
Not currently meeting the standard Meets the standardAbove the standard

28
Chart 18: Registration spend per elector and performance standards
2009/10
2010/11
4.15 In line with the introduction of individual electoral registration (IER) we will be revising our approach to monitoring the performance of EROs. Rather than focus on the plans and the preparations that EROs have in place to deliver key processes, we
0
5
10
15
20
25
30
- 1.00 2.00 3.00 4.00 5.00 6.00
Per
form
ance
sta
ndar
ds s
core
Registration spending per elector £
England and Wales Scotland
0
5
10
15
20
25
30
- 1.00 2.00 3.00 4.00 5.00 6.00 7.00 8.00
Per
form
ance
Sta
ndar
ds S
core
Spending on registration per elector £
England and Wales Scotland

29
intend to develop a framework that focusses on the completion of these processes with measurable outputs.

30
5 The cost of conducting elections in Great Britain (2009/10 and 2010/11) 5.1 Returning Officers are responsible for the administration of elections, including:
• nominations • the provision of polling stations • the appointment of Presiding Officers and Poll Clerks • management of the postal voting process • the verification and counting of votes • declaration of the result 5.2 This section of the report sets out the spend on elections in 2009/10 and 2010/11, when the following elections took place:
2009/10 2010/11 English local elections held in 238 local authorities (not including London) (June 2009) European Parliamentary elections (June 2009) Mayoral elections held in 3 local authorities in England (June 2009)
UK Parliamentary general election (May 2010) English local elections held in 164 local authorities (including elections to 33 London boroughs) (May 2010) Mayoral elections held in 4 local authorities in England (May 2010)
5.3 £89.5 million (£1.98 per elector) was spent on conducting elections in 2009/10, and this increased to £106.7 million (£2.33 per elector) in 2010/11 as a result of the UK Parliamentary general election taking place in May 2010.

31
Table 5: Election spend in 2009/10 and 2010/11
Total election costs
Cost per elector
2009/10 2010/11 2009/10 2010/11 England 76,746,700 90,620,635 1.96 2.33
Scotland 8,611,015 11,611,585 2.21 2.93
Wales 4,112,907 4,508,435 1.80 1.96
Total 89,470,622 106,740,655 1.98 2.33
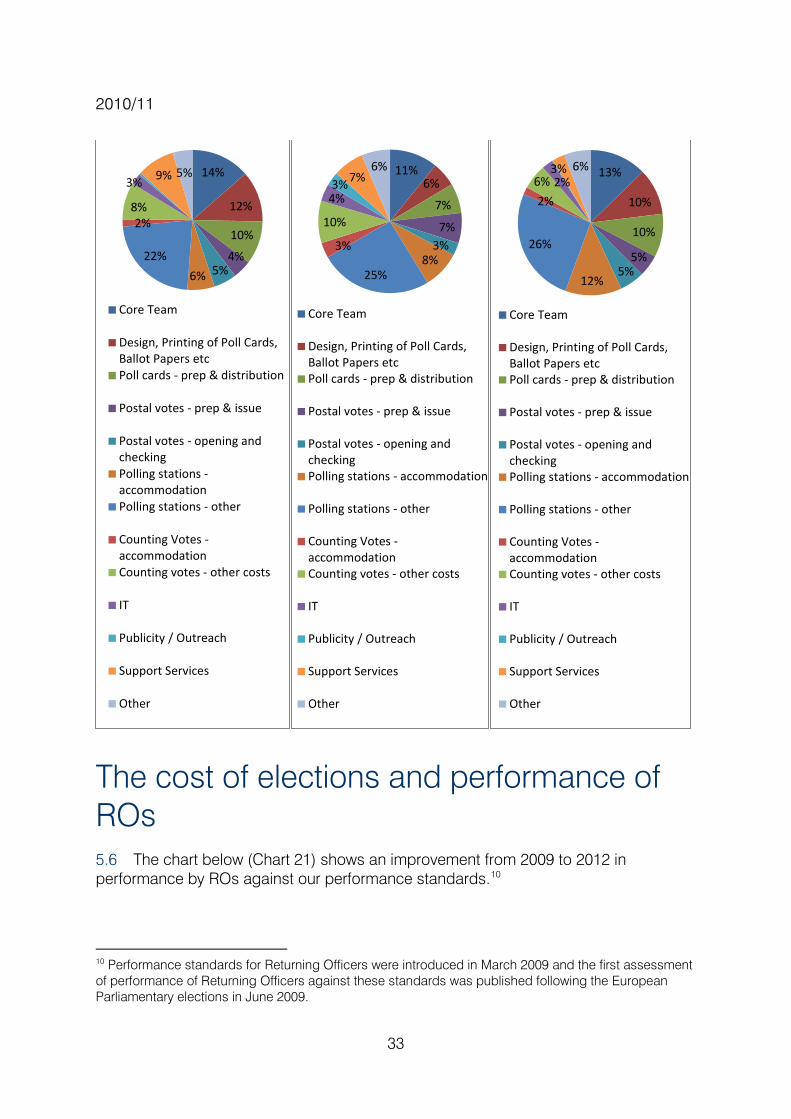
5.4 The following charts show the breakdown of spend on conducting elections across Great Britain and for each of England, Scotland and Wales. The highest area of spend on running elections in both years was on polling stations (other) which includes the costs of temporary staff (Presiding Officers and Poll Clerks) - including training, travel and subsistence for such staff - preparation, transport and equipment. The other significant categories of spend were core team staffing and printing of election stationery, which includes producing poll cards and ballot papers.
Chart 19: Breakdown of election spend
2009/10 20010/11
5.5 Unlike the breakdown of spend for electoral registration, the breakdown of election spend is fairly consistent across England, Scotland and Wales and year-on-year, as reflected in the charts below (Chart 20).
15%
12%
7% 4%
4% 7%
25%
2% 7%
3% 1% 8%
5%
Core TeamDesign, Printing of Poll Cards, Ballot Papers etcPoll cards - prep & distributionPostal votes - prep & issuePostal votes - opening and checkingPolling stations - accommodationPolling stations - otherCounting Votes - accommodationCounting votes - other costsITPublicity / OutreachSupport ServicesOther
13%
11%
10%
4% 5%
7% 23%
2%
8% 3% 1% 8%
5%
Core TeamDesign, Printing of Poll Cards, Ballot Papers etcPoll cards - prep & distributionPostal votes - prep & issuePostal votes - opening and checkingPolling stations - accommodationPolling stations - otherCounting Votes - accommodationCounting votes - other costsITPublicity / OutreachSupport ServicesOther

32
Chart 20: Breakdown of election spend for England, Scotland and Wales
2009/10
15%
12%
8% 5%
4% 7%
24%
1% 7%
3% 1% 8%
5%
Core Team
Design, Printing of Poll Cards,Ballot Papers etcPoll cards - prep & distribution
Postal votes - prep & issue
Postal votes - opening andcheckingPolling stations - accommodation
Polling stations - other
Counting Votes - accommodation
Counting votes - other costs
IT
Publicity / Outreach
Support Services
Other
12% 7% 4%
3% 3%
9%
32%
3% 7%
5% 2% 5% 8%
Core Team
Design, Printing of Poll Cards,Ballot Papers etcPoll cards - prep & distribution
Postal votes - prep & issue
Postal votes - opening andcheckingPolling stations -accommodationPolling stations - other
Counting Votes -accommodationCounting votes - other costs
IT
Publicity / Outreach
Support Services
Other
13%
12%
7% 5%
4% 9%
31%
1% 9% 2% 1% 2%
4%
Core Team
Design, Printing of Poll Cards,Ballot Papers etcPoll cards - prep & distribution
Postal votes - prep & issue
Postal votes - opening andcheckingPolling stations - accommodation
Polling stations - other
Counting Votes - accommodation
Counting votes - other costs
IT
Publicity / Outreach
Support Services
Other
33
2010/11
The cost of elections and performance of ROs 5.6 The chart below (Chart 21) shows an improvement from 2009 to 2012 in performance by ROs against our performance standards.10
10 Performance standards for Returning Officers were introduced in March 2009 and the first assessment of performance of Returning Officers against these standards was published following the European Parliamentary elections in June 2009.
14%
12%
10%
4% 5% 6%
22%
2% 8%
3% 9% 5%
Core Team
Design, Printing of Poll Cards,Ballot Papers etcPoll cards - prep & distribution
Postal votes - prep & issue
Postal votes - opening andcheckingPolling stations -accommodationPolling stations - other
Counting Votes -accommodationCounting votes - other costs
IT
Publicity / Outreach
Support Services
Other
11% 6%
7%
7% 3%
8% 25%
3%
10%
4% 3% 7%
6%
Core Team
Design, Printing of Poll Cards,Ballot Papers etcPoll cards - prep & distribution
Postal votes - prep & issue
Postal votes - opening andcheckingPolling stations - accommodation
Polling stations - other
Counting Votes -accommodationCounting votes - other costs
IT
Publicity / Outreach
Support Services
Other
13%
10%
10%
5% 5%
12%
26%
2% 6% 2%
3% 6%
Core Team
Design, Printing of Poll Cards,Ballot Papers etcPoll cards - prep & distribution
Postal votes - prep & issue
Postal votes - opening andcheckingPolling stations - accommodation
Polling stations - other
Counting Votes -accommodationCounting votes - other costs
IT
Publicity / Outreach
Support Services
Other

34
Chart 21: Performance of ROs in Great Britain 2009 and 2010
5.7 The graphs below compare spend on elections and RO performance in 2009/10 and 2010/11.
5.8 An overall performance standards score has been calculated for each RO on the following basis: one point was allocated where the standard was assessed as below standard, two points where the standard was met and three where it was exceeded. Given there are 7 standards, the lowest score an RO could achieve was 7 and the highest 21. There are particular issues with producing a scoring system for the performance standards, in that it allows for an RO to meet all the performance standards but score less than an RO who exceeds a number of standards but fails one.
Chart 22: Election spend per elector and performance standards
2009/10
0% 20% 40% 60% 80% 100%
2010
2009
Not currently meeting the standard Meets the standardAbove the standard
0
5
10
15
20
25
30
£0.00 £2.00 £4.00 £6.00 £8.00Per
form
ance
Sta
ndar
ds S
core
Cost per elector

35
2010/11
5.9 After two years of measuring RO performance we have now developed our performance standards framework. Our revised standards, published in December 2011, focus on outcomes and we believe that the completion of some key processes (with measurable outputs) is predictive of well-conducted elections. Rather than ask Returning Officers (ROs) to report on their performance after the poll, we now assess performance in the run-up to polling day. This enables us to monitor performance throughout the process of planning for and delivering the election, and to intervene where any issues are identified, in order to recommend improvements prior to polling day.
0
5
10
15
20
25
£0.00 £2.00 £4.00 £6.00 £8.00
Per
form
ance
Sta
ndar
ds S
core
Cost per elector

36
6 Next steps 6.1 The Electoral Commission has had the power to collect information relating to expenditure from EROs and ROs since 2006. During the period of 2007/08 – 2010/11 we have received a financial return from the majority of EROs and ROs, but levels of return have decreased over the four year period. Whilst the data has enabled us to report on levels of expenditure and funding for electoral services across Great Britain, the variances in the quality and completeness of the information, coupled with the fact that in each year we have not received a full set of returns, has not enabled us to draw firm conclusions about the impact of spend on performance or to fully understand the relationship between the amount spent and the precise activities it relates to.
6.2 Whilst the financial survey itself and our approach to collecting the data have remained relatively unchanged over the past four years, we have revised our approach to monitoring the performance of ROs. The revised standards, published in December 2011, place a greater focus on measurement of the outputs which we believe, if achieved, will deliver certain outcomes. In addition, we have also collated and analysed additional supporting evidence to demonstrate performance against the standards which provides further detail as to the processes undertaken. Whilst the performance standards for EROs have remained unchanged, we will be revising our approach to monitoring the performance of EROs in line with the introduction of individual electoral registration (IER).
6.3 With these changes in mind, and the fact that the financial information we have collected has not enabled us to fully meet the objectives behind the survey, we intend to review what and how we collect financial information from EROs and ROs in the future, and aim to establish a model which can provide us with detailed information on spend and the activities it relates to, including how this impacts on performance.
6.4 Due to the significant changes to electoral registration, with the introduction of IER and the funding arrangements for the transition, we do not intend to collect any further information on electoral registration expenditure until after the transition to IER has been completed.
6.5 In the first instance we will focus on election expenditure and one aspect of the election process in particular – the count – and will seek to understand how spend relates to the detailed activities undertaken for this particular process and how effectively it has been delivered. Management of the count, and the costs of delivery, vary considerably across Great Britain, and this work will help to identify which approaches are the most effective, informing our best practice guidance.
6.6 In scoping this work we will look at the data already collected as part of our role in administering the fees and charges for the referendum in May 2011, with a view to better understanding significant variations in spend, and the specific processes that the spend relates to. This analysis will also help to inform what other information we would need to collect to understand the impact of spend and how it relates to performance, with a view to providing ROs with information on where to focus

37
resources in terms of securing best value. The scoping of this case study approach will be completed by March 2013.
6.7 Following these initial case studies with a small sample of ROs during the financial year 2013/14, we intend to expand the sample for the 2014 scheduled elections to test the approach more widely to make sure it is robust. Through these case studies we plan to collect and assess financial and other information to enable us to develop a robust count model ahead of the 2015 UK Parliamentary general election, with good practice guidance underpinned by an understanding of the resource implications of adopting that approach.
6.8 We hope to use our learning from this process in the longer-term to look at other aspects of election and electoral registration expenditure to ensure that our guidance for all electoral events and electoral registration activities is clear as to the resource implications arising out of it.
6.9 Throughout this, we will work with the Cabinet Office, including ensuring that we take account of the findings of their review of the current funding system which they intend to complete before the European Parliamentary Elections in 2014. We also intend to work with the SOLACE Elections and Democracy Network Board, linking in with the work they are planning to undertake looking at standards and quality and Returning Officer fees.
We are an independent body set up by theUK Parliament. We regulate party andelection finance and set standards for well-run elections. We work to support ahealthy democracy, where elections andreferendums are based on our principles oftrust, participation, and no undue influence.
Putting voters first
The Electoral Commission3 Bunhill RowLondon EC1Y 8YZTel 020 7271 0500Fax 020 7271 0505info@electoralcommission.org.ukwww.electoralcommission.org.uk
To contact our offices in Scotland,Wales, Northern Ireland and theEnglish regions, please see ourwebsite.