the cost of capital for the daa - aviation reg · 2. the cost of capital, risk and the capm the...
TRANSCRIPT
April 2005
The Cost of Capital for the DAA A Final Report for the DAA

Project Team
Dr Richard Hern Phillippa Lowe
NERA Economic Consulting 15 Stratford Place London W1C 1BE United Kingdom Tel: +44 20 7659 8500 Fax: +44 20 7659 8501 www.nera.com

DAA WACC Contents
NERA Economic Consulting
Contents
Executive Summary 1
1. Introduction 4
2. The Cost of Capital, Risk and the CAPM 5 2.1. CAPM and Systematic Risks 5 2.2. Asymmetric Risks 6 2.3. Financial Risk 9 2.4. Summary 9
3. Practical Issues in Estimating the Cost of Capital for the DAA 11
3.1. Choice of Reference Market 11 3.2. Current or Historic Evidence 12
4. The Risk-Free Rate 14 4.1. Irish Regulatory Precedent 14 4.2. UK Regulatory Precedent 15 4.3. NERA’s Preferred Methodology 16 4.4. Conclusion on Real Risk-Free Rate 25
5. Estimating Beta 26 5.1. Approach 26 5.2. Methodological Approach to Estimating Beta for the DAA 26 5.3. Selection of Comparators to the DAA 31 5.4. Comparator Beta Estimates 49 5.5. Summary and Conclusions 53
6. The Equity Risk Premium 54 6.1. Regulatory Precedents on the Equity Risk Premium 54 6.2. Academic Evidence on the Equity Risk Premium 56 6.3. Historical Evidence on the Equity Risk Premium 57 6.4. Summary and Conclusions on the Equity Risk Premium 60
7. Gearing 62
8. Conclusions on the Cost of Equity 64
9. The Cost of Debt 65 9.1. NERA’s Preferred Methodology 65 9.2. Optimal Credit Rating for the DAA 66

DAA WACC Contents
NERA Economic Consulting
9.3. Evidence on Comparator Cost of Debt 66 9.4. Issuance Costs 68 9.5. Conclusions on the Cost of Debt 69
10. Summary of Parameter Estimates 70
Appendix A. Components of Regulatory WACC Estimates 71
Appendix B. Evidence on the Risk-Free Rate 73 B.1. Eurozone ILGs 73 B.2. Wider European ILG evidence 74 B.3. Wider Market ILG Evidence 76
Appendix C. Comparator Information Details 78 C.1. Capex/Opex 78
Appendix D. Equity and Asset Beta Estimates 79
Bibliography 80
Introduction
NERA Economic Consulting 1
Executive Summary
NERA has been commissioned by the Dublin Airport Authority (DAA) to estimate the cost of capital for the DAA’s regulated activities as an input to the forthcoming regulatory tariff review undertaken by the Commission for Aviation Regulation (CAR). We estimate the cost of capital using the standard weighted average cost of capital (WACC) methodology. This report sets out our methodological approach and presents our conclusions on the WACC for the DAA.
In estimating the WACC for DAA’s regulated activities we apply the following principles:
§ The DAA’s WACC should be estimated on a basis which is consistent with the regulatory regime under which the DAA operates, currently “single-till”.
§ Estimates of a “ forward-looking” WACC should be based on the use of averages of long-term time-series data, given widespread acknowledgement that interest rates are currently at exceptionally low levels by both long and short term historical standards and cannot be considered as a reliable indicator of expected future interest rates prevailing under typical conditions.
§ Estimates of each component of the WACC should be internally consistent, based on objective and consistent data sources, and must be empirically verifiable.
Our central case estimates of DAA’s WACC are set out in Table 1 below. Our best estimate of the post-tax (net of debt tax shield) WACC is 7.5%.1 Our best estimate of the real pre-tax WACC for the DAA is 8.5%.
1 We report the real post-tax WACC net of debt tax shield consistent with Kearney and Hutson (2001) “APPENDIX VI
TO CP8 Aer Rianta’s Cost of Capital Report by Professor Colm Kearney and Elaine Hutson” p168 methodology for calculation of real post-tax WACC presented in CAR (2001).

Introduction
NERA Economic Consulting 2
Table 1 Central Case Cost of Capital for DAA’s Regulated Activities
Calculation Parameter Value Gearing
(a) D/(D+E) 50% (b) =1/((1/(a))-1) D/E 100%
Tax (c) Corporate tax rate 12.5%
Cost of Equity (d) Real risk-free rate 3.0% (e) ERP 6.0% (f) Asset beta 0.7 (g) =(f)*(1+(b)) Equity beta 1.4 (h) =(d)+((e)*(g)) Post-tax return on equity 11.4%
Cost of Debt (i) Real cost of debt 4.0% (j) ={(a)*(i)*(1-(c))}+{(1-(a))*(h)} Real post-tax WACC net of debt tax shield 7.5% (k) ={(a)*(i)}+{(1-(a))*(h)/(1-(c))} Real pre-tax WACC 8.5% (l) ={(a)*(i)}+{(1-(a))*(h)} Real post-tax “Vanilla” WACC 7.7%
Key points relating to our estimate are summarised as:
§ WACC is estimated for the DAA as it currently stands. Our estimates of the WACC do not take account of the impacts of potential de-merger of Dublin, Shannon and Cork airports or the establishment of an independent terminal at Dublin Airport. In the former case we would expect the WACC to be higher than currently estimated due to higher gearing, and in the latter case higher due to increased competition risk and risk of excess capacity. Further evidence on the impact of the de-merger on DAA’s cost of capital is set out in NERA (2004).2
§ The allowed cost of capital and projected financial ratios must both be consistent with a single A credit rating as confirmed by financial modelling. There is significant evidence that the optimal capital structure and credit rating that will enable DAA to finance its functions at the lowest costs is consistent with a single A credit rating. The assumed gearing ratio, cost of debt and the financial ratio projections must all be consistent with single A credit rating status.
§ Allowed rate of return must make specific allowance for asymmetric downside risks in order to enable DAA’s financial viability as required by statute. It is widely recognised that the beta coefficient in the CAPM does not fully capture the premium that investors require for holding company assets. Risks that are asymmetric - such as event risks such as terrorist risks, regulatory risks, or restructuring risks - may not be contained within
2 NERA (2004) “Review of Implications of the De-Merger of the former Aer Rianta for the Regulation of Airport
Charges in Ireland”, A Report for Dublin Airport Authority, prepared by NERA, October 2004, London. Henceforth NERA (2004).

Introduction
NERA Economic Consulting 3
beta. The CAR’s statutory duty to enable DAA’s financial viability3 requires that specific allowance should be made for the impact of downside risks in its financial modelling, as noted by the CAR.4
3 The 2004 SAA contains the statutory objective “ to enable Dublin Airport Authority to operate and develop Dublin
Airport in a sustainable and financially viable manner.” 4 CAR (2004a) “ the Commission considers it appropriate in the making of a determination to undertake a separate risk
analysis of the regulated firm in order to be able to form a view that the regulated firm is enabled to be financially viable throughout the course of the regulatory period.”

Introduction
NERA Economic Consulting 4
1. Introduction
This report describes a consistent methodology for estimating the weighted average cost of capital (WACC) of regulatory activities of the DAA and establishes the value of the WACC that would apply for the calculation of airport charges under a single-till regulatory regime.
The report is structured as follows:
§ Section 2 presents the Capital Asset Pricing Model (CAPM), and discusses the relationship between the measures of the cost of capital using the CAPM and various forms of risk.
§ Section 3 discusses two key issues in the application of the CAPM: the choice of reference market and the choice of current or historic evidence as a basis for the parameter estimates.
§ Sections 4 to 8 present evidence on the cost of equity for DAA using the CAPM.
§ Section 9 presents evidence on the cost of debt for the DAA.
§ Section 10 presents our conclusions on DAA’s WACC.
§ Appendices A to D present various supporting information.

The Cost of Capital, Risk and the CAPM
NERA Economic Consulting 5
2. The Cost of Capital, Risk and the CAPM
The cost of capital represents the minimum rate of return that will compensate investors and lenders for the risks of providing finance to a company. Under the WACC methodology, the cost of capital is calculated as the weighted average of the cost of debt and the cost of equity, with each requiring different margins over the risk-free rate of return to reflect the different degrees of risk borne by debt and equity holders respectively.
Risk in broad terms is uncertainty of outcome. It is possible to distinguish between different types of risk that will influence different components of the cost of capital to a company:
§ Company "specific" risks: are risks to a company’s returns that arise from all those events that are specific to the particular company in question, and are unrelated to general market factors. An example of this in the DAA’s case would be risks to revenue arising from specific influences on demand for flights in Ireland.
§ Market "systematic" risks: arise from those events affecting a company’s returns that are related to general markets and underlying economic factors. Systematic risks are greater if returns are more sensitive to changes in market conditions. Examples of this type of risk in the DAA’s case would include risks to demand arising from general economic factors underlying wider market behaviour, such as the influence of changes in income.
§ “Asymmetric” risks: asymmetric risks describe a situation where the perceived distribution of possible outcomes is asymmetric around the mean, with either greater likelihood of the upside or downside. A downside example relevant to the DAA would include the risk of a repeat of events such as September 11th.
§ “Financial” risks: arise from risks associated with financial structure and profile of the company. Increased leverage increases risks to shareholders and debt holders since returns (to shareholders) become more variable and the probability of default increases. Weaker financial ratios - such as interest cover and dividend cover - imply lower financial strength and hence increased risk of financial distress.
These risks are not wholly independent of one another. Business risks – either specific or systematic - affect companies' profits and hence impact on financial ratios. If these financial ratios fall below minimum threshold levels then financial risks may increase sharply as financial distress and bankruptcy become a possibility.
The following sections discuss these types of risk in more detail. In particular we discuss the CAPM model and the types of risk this model takes into account in estimating the cost of equity.
2.1. CAPM and Systematic Risks
The traditional framework for estimating the cost of equity is through use of the Capital Asset Pricing Model (CAPM). The CAPM is the most widely used method for calculating the cost of equity for UK regulated utilities. Under the CAPM, the cost of equity is calculated as:
(2.1) E[re] = E[rf]+ βequity(E[rm]-E[rf])

The Cost of Capital, Risk and the CAPM
NERA Economic Consulting 6
where,
E[re] is the expected return on equity;
E[rf] is the expected return on a risk-free asset;
E[rm] is the expected rate of return for the market (and thus E[rm]-E[rf] is the expected risk premium); and,
Β equity is a measure of the systematic riskiness of the equity, the “equity beta”.
The CAPM estimates the appropriate cost of equity by only taking account of "systematic" (non-diversifiable) risks. This model is based on the premise that investors do not require a premium for company specific risks since these risks can be diversified away by holding a broad portfolio of assets.
In the CAPM framework, the direct measure of systematic riskiness is the beta coefficient, which is a measure of the co-movement of returns to a particular asset or portfolio with the overall market portfolio.
Irish regulatory precedent in estimating the cost of capital widely relies on the CAPM in estimating the cost of equity. The CER and ODTR (ComReg) have both used the CAPM in all recent price reviews. At the last airports’ price review, the CAR used the CAPM in estimating the cost of equity for Aer Rianta.5 CAR consultation documentation indicates the continued use of the CAPM as previously at the forthcoming review.6
2.2. Asymmetric Risks
Asymmetric risk describes a situation where the downside risks are perceived to be greater than the upside risks or vice-versa. An example of this type of risk is regulatory risk, where the regulatory interventions tend to be of a negative nature without equivalent offsetting positive interventions.
The CAPM model in its basic form cannot take account of skewed risks such as downside asymmetric risk. It is often argued that regulated companies face greater asymmetry in their returns compared with unregulated businesses and therefore the CAPM underestimates the cost of equity for regulated companies by comparison to unregulated companies.
An example of downside regulatory risk under price cap regulation, cited by Grout (1999), arises where regulatory interventions are perceived to reduce the expected return, by “clawing back” returns deemed to be “excessive”, and letting low returns persist. The result is that the company's expected earnings profile is “ smoothed” asymmetrically with the company earning slightly lower expected returns at the top end of the distribution. 5 Commission for Aviation Regulation (2001) (henceforth CAR (2001) “Determination in respect of the maximum levels
of airport charges that may be levied by an airport authority in respect of Dublin, Shannon and Cork airports in accordance with section 32 of the aviation regulation act, 2001”
6 Commission for Aviation Regulation (2004): Commission Paper CP2/2004 “Review of Determination on Maximum Levels of Airport Charges and Report” (henceforth CAR (2004b)) states an intention to use a WACC of 6% as at the 2001 review, which was based on the use of the CAPM in estimating the cost of equity.

The Cost of Capital, Risk and the CAPM
NERA Economic Consulting 7
This is illustrated in Figure 2.1 where re is the ex ante expected average return, rmax is the ex post maximum return, and ra is the ex post average expected return.
Figure 2.1 Returns Truncated From Above
P r o b a b i l i t y
R e t u r n rr m a xr er a
P r o b a b i l i t y
R e t u r n rr m a xr er a
The basic CAPM cannot take account of skewed downside asymmetric risks, as illustrated by Figure 2.1, since a fundamental assumption that underlies the model formulation is that returns are normally distributed. Under such circumstances the basic CAPM will underestimate the true returns that investors will demand.
Conine and Tamarkin (1985) have suggested an extension of the traditional mean-variance CAPM model to accommodate third moments, reflecting the skewness in a company's returns. In a study of the US electricity industry, the authors’ empirical work suggests that taking account of “ third moment risk” adds 1.3% to the cost of capital of a typical utility. 7
If the combination of the CAPM model and asymmetric regulatory interventions produces an expected return that is lower than the actual cost of capital, companies will not invest. This means that the regulatory regime must adjust to these circumstances. This can either take the form of removing the regulatory risk, or by promoting another source of returns, e.g. by increasing the value of the parameters in the CAPM, by increasing the operating expenditure allowance, or through the allowance of retention of higher profits from cost savings. 8
It can be argued that regulated companies require a premium on the simple CAPM-based cost of capital to compensate them for asymmetric regulatory risk. In determining the allowable cost of capital, regulators should be aware of and take into account any significant asymmetric risks that may not be captured by the standard CAPM methodology. There is UK
7 The authors studied 60 utilities in the USA over a period of five years, and calculated the expected return using the
CAPM, as well as the modified third moment CAPM. Whilst the former gave a nominal return of 15.81%, the latter suggested a nominal return of 17.16%, implying that “ third moment risk” added an additional 1.3% to the cost of capital of a typical utility, although this was not all attributed to the impact of regulation.
8 For example, Kolbe at al (1993) suggested that there are two possible responses to accommodate the downside risk so as to ensure that the expected ex ante return is equal to the cost of capital. One is to add a “ regulatory risk premium” to the allowed cost of capital. Another option is to add an “ insurance premium” to the revenue requirement. See also Grout (1994).
The Cost of Capital, Risk and the CAPM
NERA Economic Consulting 8
regulatory precedent for the allowance of headroom in financeability tests to account for outturn of downside scenarios (e.g. CAA for NATS, Ofwat for UK water companies).
In this Section we briefly assess the DAA’s likely exposure to asymmetric risk. We have identified several asymmetric risks present in our central case scenario; these are briefly described below.
§ Downside event risk such as September 11th. Events such as acts of terrorism or air travel accidents represent a downside risk to airports’ earnings distributions – events such as these will generally only occur in a negative direction in terms of earnings outcomes. Whilst the downside skew of expected earnings is likely to be somewhat mitigated by the operation of a single till regulatory regime, we consider that the downward skew to expected returns will be significant.
§ Regulatory risk. As is the case with the majority of regulated utilities, there exists a risk to investors of regulatory clawback of top-end returns. The extent of the impact on expected earnings of asymmetric regulatory behaviour is particularly relevant under a single-till regulatory regime such as that applied to the DAA, where a cap is applied to all revenues as opposed to core aviation revenues only. Asset stranding (exclusion of capital expenditure from the RAB) is a specific example of asymmetric regulatory risk.
§ Break-up of Dublin, Shannon and Cork. The passing of the State Airports Act in 2004 represents a downside skew to expected earnings for the DAA. The Act contains the provision for the break-up of Dublin, Shannon and Cork airports into separate entities. The potential pass-on of Shannon and Cork debt to Dublin will result in a combination of potentially lower profits and tighter debt coverage ratios for the DAA. NERA (2004) considered the impact of the completion of this de-merger on the WACC and presented evidence showing that the cost of capital would be likely to increase by 0.3% or more as a result of higher gearing levels leading to a likely downgrade in the credit rating of the DAA.
§ Establishment of independent terminal at Dublin Airport. We understand that the potential exists for a decision to approve the establishment of a second terminal at Dublin Airport. It is not currently clear whether any terminal will be owned and operated by the DAA or on an independent basis. The prospect of independent ownership and operation is cited by Standard and Poors as a potential detriment to future credit quality in justifying its current negative outlook status assigned to the DAA.9 The potential for an independent terminal therefore represents a downward skew to expected DAA returns.
In conclusion, we have identified above several key risks to DAA returns which imply a downside skew to the distribution of expected DAA earnings. As discussed above, the CAPM fails to take account of skewness to expected earnings by assuming that returns are distributed normally. However, as the DAA is not listed, we use comparator evidence in assessing the CAPM cost of equity for the DAA. DAA-specific asymmetric risks such as the break-up of Cork, Shannon and Dublin Airports and the potential establishment of an independent terminal at Dublin will therefore not be incorporated in our comparator-based assessment of the cost of equity for the DAA. Whilst these DAA-specific risks will be 9 Standard and Poors (20th October 2004) “Summary: Dublin Airport Authority PLC”: “Furthermore, any decision to
approve an independent terminal at Dublin Airport could be detrimental to credit quality.”

The Cost of Capital, Risk and the CAPM
NERA Economic Consulting 9
temporary in nature, they will increase the DAA’s current cost of capital relative to that under normal conditions. The regulator therefore needs to take account of downward biases to comparator beta estimates arising from sector asymmetric risks and (over the short-term horizon at least) temporary DAA-specific asymmetric risks.
2.3. Financial Risk
In the CAPM, the equity or ‘levered’ betas are calculated on the basis of the relationship between the stock price of the companies and the reference equity market as a whole, and thus the value of the equity beta reflects two types of risks:
§ Business risk: As the level of business risk increases, profit streams become more sensitive to changes in general economic conditions and hence company returns become more highly correlated with market returns.
§ Financial risk: As the gearing ratio (D/(D+E)) rises and the company issues more debt, prior claim fixed interest costs on debt increase, meaning that profit streams become more volatile, which in turn leads to a rise in the equity beta estimate.
In order to be able to compare levels of business risk across companies, it is necessary to calculate the asset or ‘de-levered’ beta of the company. The de-levered beta of the company is defined as the value of beta for the company on the assumption that the company holds no debt. Standard formulae are normally used to adjust the de-levered beta for the level of gearing of the company.
In the CAPM framework, the traditional way to account for the impact of a change in gearing on the cost of equity is to adjust the beta coefficient in a linear manner, reflecting the fact that the additional variability of equity returns generated by gearing is directly proportional to the amount of profits paid out as interest payments. To shift from asset betas to levered (or equity) betas, the following formula is used:
(2.2) βequity = βasset (1+(Debt/Equity))
As a company's gearing increases, the greater the variability of equity returns, since interest payments represent a fixed prior claim on a company's operating cashflows. For this reason, increased gearing leads to a higher cost of equity, reflected in a higher equity beta value.
In estimating the forward-looking cost of capital for a company asset betas are converted to equity betas using the assumed forward-looking gearing assumption. In practice this is undertaken by estimating a de-levered beta based on historic gearing levels commensurate with the period of measurement of the equity beta, and then “ re”-levering the beta for the forward-looking gearing assumption.
2.4. Summary
The concept of risk is crucial in estimating a company's cost of capital. Not all types of risk are rewarded in the cost of capital. Modern financial theory emphasises that many risks can be avoided by diversification and investors will not require a premium for being exposed to these types of risk. The types of risks that can be avoided by diversification are referred to as “company-specific” risks while those that cannot be diversified are referred to as

The Cost of Capital, Risk and the CAPM
NERA Economic Consulting 10
“systematic” risks. In the CAPM, the beta coefficient represents the level of systematic riskiness of returns on a company’s equity.
It is widely recognised that the beta coefficient does not fully capture the premium that investors require for holding company assets. Risks that are asymmetric - such as regulatory risks - may not be contained within beta. As discussed above, the asymmetric risks relevant to the DAA that are shared by comparator operators will be expected to downwardly influence comparator based estimates of the CAPM for the DAA. There are therefore two alternatives available in attempting to incorporate the impact of downside asymmetric risks. The first is to upwardly adjust the CAPM estimate of the cost of equity, the second is to adjust the methodology used in applying the CAPM to minimise biases to the cost of equity estimate, where at all possible. Our assessment of beta for the DAA uses the latter methodology; we consider periods of evidence excluding and/or minimising (by lengthening the measurement period) the impact of distorting industry-wide events such as September 11th and the abolition of duty free for intra-EU travel on comparator beta estimates. With regard to the other key asymmetric risk shared by the DAA and comparators identified, regulatory risk, this will influence all regulated comparator betas and we cannot make an explicit upward adjustment to beta estimates to reflect this. We therefore consider that beta estimates based on comparator evidence should be considered as a lower bound.

Practical Issues in Estimating the Cost of Capital for the DAA
NERA Economic Consulting 11
3. Practical Issues in Estimating the Cost of Capital for the DAA
This section discusses two practical issues in estimating the cost of capital particularly relevant in the application of the CAPM: the choice of reference market and the choice of current or historic evidence as a basis for the parameter estimates.
3.1. Choice of Reference Market
From an investor’s perspective, the cost of capital should be estimated with reference to the financial market that best represents their investment opportunity set, as the cost of capital for any single investment is defined by the entire portfolio of investment opportunities to which an investor has access. This “set” is commonly referred to as the “market portfolio”.
In theory the “market portfolio” should include both traded and non-traded assets. However, in practice WACC parameters are calculated with respect to readily available stock market indices, and therefore the “market portfolio” only captures assets listed on a stock exchange, to the exclusion of unlisted assets.
The next key question is whether to use a domestic stock market index, or regional or worldwide indices. Irish regulatory precedent has tended to use the Eurozone market as the reference capital market, given the relative lack of barriers to movement of capital within this market implied by the shared currency. On the other hand, the highly integrated nature of financial markets suggests that the opportunity set facing investors is wider than the Eurozone market.
Transaction costs and taxation barriers to investment in securities across countries have declined over time. It is now a simple matter to purchase and sell shares traded on exchanges in other countries. For example, the purchase of ADRs and ADSs (American Deposit Receipts/Shares) provides a simple means for accessing equity in foreign companies, as do a wide range of Irish funds that hold an international portfolio of equity investments.10
It is also true that by spreading risks among different domestic equity markets, investors can achieve lower risks and/or improve investment returns. Not only have global portfolios outperformed individual domestic markets over the 1969-2001 period, but investors have also achieved reductions in risk through diversification across different countries, which reduces exposure to shocks in the domestic market.
In short, the integration and linkages between the Eurozone, wider European and Worldwide capital markets have greatly solidified in the last decade, and wider European and US data are both relevant to typical Eurozone investors.
Our approach is to draw on market evidence from both the Eurozone and international markets in setting WACC parameter values, however we consider the Eurozone to be our
10 To illustrate, low-cost foreign index funds called “WEBS”, an acronym for World Equity Benchmark Shares, eliminate
some of the guesswork and costs involved in investing internationally. Each WEBS Index Series seeks to match the performance of a specific Morgan Stanley Capital International (MSCI) index.

Practical Issues in Estimating the Cost of Capital for the DAA
NERA Economic Consulting 12
primary reference market. In particular, we draw on wider international evidence where we believe Eurozone data alone is insufficiently robust to provide an indicator of forward-looking values over the forthcoming price control period.
3.2. Current or Historic Evidence
In estimating a forward-looking cost of capital regulators must take account of reasons why current “spot” asset prices and current rates of return may be temporarily affected by exceptional capital market conditions and therefore may not provide the best estimate of a forward-looking cost of capital.
There are two important reasons why current spot market data may underestimate the forward-looking cost of capital for the DAA. Firstly, it is widely recognised by regulators, practitioners and the markets that interest rates are at currently exceptionally low levels, both by short and long term historical standards. Recent regulatory precedent in the UK has explicitly taken account of this; examples include the setting of the cost of capital at the upper end of allowed ranges for UK electricity distribution companies and water companies at recent price reviews.11
A further reason why estimating the cost of capital using only spot market data may currently underestimate forward-looking required returns is that there is widespread evidence that financial markets have recently exhibited “excess volatility” that cannot be explained by standard economic paradigms such as the Efficient Markets Hypothesis (EMH). The implication of “excess volatility” is that current “spot” prices do not provide complete information regarding expected future values. Since “excess” volatility is by its nature only temporary, the use of historic time-series evidence on WACC parameters may be a better guide to true fundamentals.
Changes in market volatility will have an impact on current measures of the risk-free rate and the beta coefficient in the CAPM:
§ When markets are volatile, investors tend to move out of investments perceived as risky and into risk-free assets such as government bonds. The net effect will be to depress the yields on risk-free assets.
§ Increases in volatility may also lead to a “ flight to quality” into utility stocks (domestically and internationally), and their price may therefore fall by less than the price of other stocks. The net effect is that the estimated beta may be lower during periods of high volatility than during periods of ‘normal’ volatility, as utility stock prices temporarily deviate from normal levels of co-movement with market prices. If the recent sample period includes periods that exhibit abnormally high volatility then estimates of utilities’ betas may be lower than their true value.
Our recommendation is that, while accepting the general principle that estimates of the cost of capital should be forward-looking, there is current evidence of exceptionally low interest rates that cannot be reasonably expected to prevail over the near future and recent evidence of excessive stock market volatility. We consider that because of these factors, regulators
11 See Ofgem (2004) and Ofwat (2004)

Practical Issues in Estimating the Cost of Capital for the DAA
NERA Economic Consulting 13
should currently evaluate estimates of all WACC parameters over a longer period of time, such as the course of a business cycle, as opposed to the use of spot data. This will ensure that estimates of WACC parameters are internally consistent and not affected by temporary factors that cannot be reasonably expected to continue to prevail, such as shocks to capital markets that cause excess volatility and factors driving the abnormally low interest rates currently observed. We consider that a five-year historical period, consistent with a business cycle, is an appropriate measurement period which minimises biases to forward-looking estimates of the cost of capital arising from temporary or abnormal distortions, whilst it is short enough to reflect any fundamental medium term changes in underlying market conditions.

The Risk-Free Rate
NERA Economic Consulting 14
4. The Risk-Free Rate
The expected return on a risk-free asset, (E[rf]), or the “ risk-free rate”, is the return on an asset which bears no systematic risk at all. Alternatively, the real risk-free interest rate can be thought of as the price that investors charge to exchange certain current consumption for certain future consumption. In part, it is determined by investors’ subjective preferences and in part by the nature and availability of investment opportunities in the economy.
In their review of the previous airport charges determination “Review of Determination on Maximum Levels of Airport Charges and Report Commission, Paper CP2/2004” (March 2004), the CAR proposed to continue to apply a 6% post-tax real cost of capital as determined at the last price review. This is consistent with the 2.6% real risk-free rate allowed at that review.
Whilst the methodology employed by Irish regulators in estimating the risk-free rate is frequently not explicitly set out, it appears that historical evidence on nominal German Government bond yields is generally used.
UK regulators have generally estimated the risk-free rate by calculating the rate of return offered by UK government index-linked gilts (ILGs). However, recent Competition Commission decisions have shown that ILG yields may not provide reliable evidence due to the impact of structural factors such as the Minimum Funding Requirement (MFR).12
This section is structured as follows: Sections 4.1 and 4.2 discuss recent Irish and UK regulatory precedent regarding the risk-free rate; Section 4.3 sets out NERA’s preferred methodology in estimating the risk-free rate and Section 4.4 concludes.
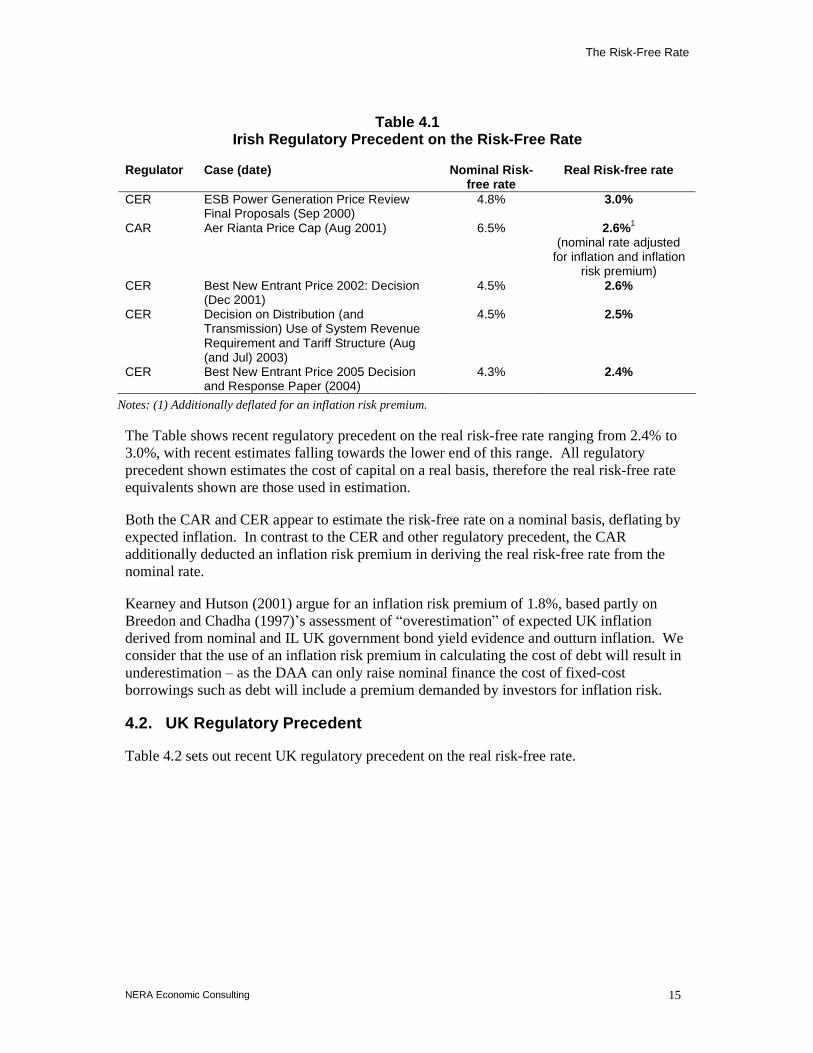
4.1. Irish Regulatory Precedent
Table 4.1 sets out recent Irish regulatory precedent on the risk-free rate.
12 See for example Competition Commission: (2000b), p117 and Competition Commission (2003), p188.
The Risk-Free Rate
NERA Economic Consulting 15
Table 4.1 Irish Regulatory Precedent on the Risk-Free Rate
Regulator Case (date) Nominal Risk-free rate
Real Risk-free rate
CER ESB Power Generation Price Review Final Proposals (Sep 2000)
4.8% 3.0%
CAR Aer Rianta Price Cap (Aug 2001) 6.5% 2.6%1 (nominal rate adjusted
for inflation and inflation risk premium)
CER Best New Entrant Price 2002: Decision (Dec 2001)
4.5% 2.6%
CER Decision on Distribution (and Transmission) Use of System Revenue Requirement and Tariff Structure (Aug (and Jul) 2003)
4.5% 2.5%
CER Best New Entrant Price 2005 Decision and Response Paper (2004)
4.3% 2.4%
Notes: (1) Additionally deflated for an inflation risk premium.
The Table shows recent regulatory precedent on the real risk-free rate ranging from 2.4% to 3.0%, with recent estimates falling towards the lower end of this range. All regulatory precedent shown estimates the cost of capital on a real basis, therefore the real risk-free rate equivalents shown are those used in estimation.
Both the CAR and CER appear to estimate the risk-free rate on a nominal basis, deflating by expected inflation. In contrast to the CER and other regulatory precedent, the CAR additionally deducted an inflation risk premium in deriving the real risk-free rate from the nominal rate.
Kearney and Hutson (2001) argue for an inflation risk premium of 1.8%, based partly on Breedon and Chadha (1997)’s assessment of “overestimation” of expected UK inflation derived from nominal and IL UK government bond yield evidence and outturn inflation. We consider that the use of an inflation risk premium in calculating the cost of debt will result in underestimation – as the DAA can only raise nominal finance the cost of fixed-cost borrowings such as debt will include a premium demanded by investors for inflation risk.
4.2. UK Regulatory Precedent
Table 4.2 sets out recent UK regulatory precedent on the real risk-free rate.

The Risk-Free Rate
NERA Economic Consulting 16
Table 4.2 UK Regulatory Precedent on the Risk-Free Rate
Regulator Case (date) Nominal Risk Free Rate
Real Risk Free Rate
CC Sutton & East Surrey Water and Mid Kent Water (2000)
- 3.0%
Oftel Proposals for Network Charge and Retail Price Controls (2001)
5.1% 2.6%
CAA Heathrow, Stansted and Gatwick Airports (2002)
- 3.0%
CC BAA (2002) - 2.6% CC Manchester Airport (2002) - 2.6% Ofgem Proposed CoC for IGTs (used in 2003
Final Proposals) - 2.8%
CC Vodafone, O2, Orange and T-Mobile (2003)
5.2% 2.6%
Ofgem Final Proposals for DNOs (2004) - 2.3%-3.0% (upper end of this
range used) Ofwat Final Determinations (2004) - ~3.0% Ofcom Statement on Wholesale Mobile Voice
Call Termination 4.8%
Bold denotes rate used in calculations of the WACC. Sources in order shown in Table: CC (2000) “Mid Kent Water Plc: A report on the references under Sections 12 and 14 of the Water Industry Act 1991” and “Sutton and East Surrey Water Plc: A report on the references under Sections 12 and 14 of the Water Industry Act 1991” Oftel (2001) “Proposals for Network Charge and Retail Price Controls from 2001” CAA (2002), see CC (2002) for CAA’s proposed RFR for HAL, STAL & GAL. CC (2002) “BAA plc: A report on the economic regulation of the London airports companies (Heathrow Airport Ltd, Gatwick Airport Ltd and Stansted Airport Ltd)” CC (2002) “Manchester Airport Plc: A report on the economic regulation of Manchester Airport Plc” Ofgem (2002) “ Independent Gas Transporter Charges and Cost of Capital” Ofgem (2003) “The Regulation of Independent Gas Transporter Charging: Final Proposals” CC (2003) “Vodafone, O2, Orange and T-Mobile: Reports on references under section 13 of the Telecommunications Act 1984 on the charges made by Vodafone, O2, Orange and T-Mobile for terminating calls from fixed and mobile networks.” Ofwat (2004) “Future water and sewerage charges 2005-10: Final determinations” Ofgem (2004) “Electricity Distribution Price Control Review: Final Proposals” Ofcom (2004) “Statement on Wholesale Mobile Voice Call Termination”
The Table shows that recent regulatory precedent on the real risk-free rate generally ranges from 2.6% to 3.0%. With the exception of Ofcom (and therefore the CC in considering Ofcom related determinations), the risk-free rate is applied as part of a real cost of capital methodology. Regulatory precedent is generally based on UK ILG yields, adjusted upwards to reflect widespread recognition of downward biases to current and recent yields arising from institutional distortions. Recent precedent has tended towards 3.0%.
4.3. NERA’s Preferred Methodology
4.3.1. Principles for estimation of the risk-free rate
Our best estimate of the risk-free rate is based on five years averages of index-linked government yield evidence, cross-checked against nominal government yield evidence.

The Risk-Free Rate
NERA Economic Consulting 17
Our preferred methodology is based on the following principles:
§ Preference for the use of index-linked evidence where possible. The CAPM states that the risk-free asset has zero correlation with the market portfolio, that is, a return on a zero beta asset or portfolio. However, in practice it is difficult to identify an asset that is completely risk-free, since inflation, as do other factors, has been shown to lead to covariance between notionally risk-free government debt and equity returns. In the UK regulatory precedent generally relies on index-linked-gilts (ILGs) yields to provide the closest proxy to the risk-free asset. There are two main reasons for this. First, ILG yields are by construction insulated from the effects of unanticipated inflation. Yields therefore by construction do not include premia for inflation risk. Second, it has been argued that the yields on index-linked government bonds are less correlated with the market than the yields on Treasury bills and other government bonds, and are therefore closer to satisfying the theoretical requirement of having a zero beta.13 ILG markets have substantially increased in size and liquidity in recent years; concerns regarding the presence of liquidity premia in yields are no longer significant. We therefore consider index-linked government bond yields as our preferred basis for the estimation of the real risk-free rate.
§ Supplementation of ILG evidence with nominal Government bond evidence. In order to provide a cross-check on the risk-free rate estimates obtained using ILG evidence, we further consider nominal Government bond yield evidence, deflated by expected inflation.
§ Use of historical evidence. It is widely acknowledged that interest rates are currently at an all-time low and that current evidence may not be a robust proxy for the expected risk-free rate. Furthermore, recent periods of relatively short-lived high equity market volatility and the consequent “ flight to safety” observed in government bond markets have highlighted the instability of spot yields over short periods of time. We consider that the use of historical evidence will prevent undue bias to forward-looking estimates arising from such temporary influences on observed yields. Our preferred estimate of the risk-free rate is based on five year averages of yield evidence, consistent with assessment over an approximate business cycle, in order to minimise the impacts of transient and cyclical influences on forward-looking estimates.
§ Use of Eurozone Government bond yields. We consider that the appropriate reference market to be used in estimating the risk-free rate for the DAA’s cost of capital is the Eurozone market. Free movement of capital between the Eurozone currency members means that investors in Eurozone countries may hold assets in other Eurozone countries without currency risk. We therefore consider that the reference market for the typical investor in Irish equity will be the Eurozone area.
§ Use of maturities of ten years or greater. With regard to the appropriate bond term or maturity, there are three main options – i) the “ investment horizon” or security holding period for a representative equity investor, equivalent to the CAPM horizon; ii) the “planning horizon”, that is the average life of projects that are to be assessed using the estimate of the cost of capital; and iii) the time-horizon of the periodic review is the appropriate measure, as this offers an opportunity to readjust the ex-ante return on the asset base. The preferred academic position - since the CAPM is a single period model -
13 This point was made by Stephanie Holmans in Ofwat RP5 (1996) , Section 2.5.
The Risk-Free Rate
NERA Economic Consulting 18
is to choose a maturity that is consistent with the investment horizon, as this represents the rate of return demanded by an investor over the lifetime of their investment. However, whilst the determination of the appropriate investment horizon is unclear,14 regulators globally are increasingly using securities with maturities of around 10 years as the appropriate measure of the risk-free rate. The main reason underlying this choice is that the 10-year bond is typically the security that has the closest maturity to the 15 year-plus investment profile of utility assets (we note that airport infrastructure asset lives are typically significantly longer than this ), while also retaining a certain liquidity and market depth, and therefore price stability. Due to limitations on the availability of index-linked government bond evidence for specific maturities over our preferred measurement period, we consider evidence on government bonds with maturities of ten years and greater over a five year historical period.
4.3.2. Index-Linked Government Bonds
In this Section we present evidence on international index-linked government bond (ILG) yields. This Section summarises Appendix B which presents full details of the ILG evidence assessed.
Table 4.3 sets out the key characteristics of the main issuers in the global ILG market.
14 A theoretical argument that is sometimes made in regulatory discussions is that "investment horizons" are heavily
influenced by the nature of the regulatory regime. The WSA/WCA (1991) argued: "The nature of the regulatory regime is such that each price review process represents an opportunity and indeed a requirement to redetermine the ex ante earnings potential of the assets… .(T)o conclude the ten (or five) year time period between Periodic Reviews would seem to provide the most appropriate benchmark for determining the true time horizon to be used in estimating the risk-free rate." However, this argument overlooks the fact that in practice regulated companies issue bonds of considerably longer maturity than the periodicity of the price review, typically 5 years, and these bonds have to be serviced over their entire lifetime.

The Risk-Free Rate
NERA Economic Consulting 19
Table 4.3 Global ILG Market
Market value ($US bn)
Number of Indexed Bonds
Longest Maturity 2Y Average bid-ask spread(1)
Eurozone France 109 8 2032 0.08% Italy 46 4 2035 0.07% Austria - 3 2023 N/A Greece - 3 2025 0.12% Other Europe UK 181 9 2035 0.05% Sweden 32 5 2028 0.11%(2)
Other US 300 16 2032 0.12% Canada 24 4 2036 0.08% Australia - 12 2020 1.02% Except where noted, source: UK Debt Management Office (www.dmo.gov.uk). (1) Average bid-ask spread is calculated as [bid price-ask price]/average(bid price, ask price), where square brackets [ ] denote absolute value. Average 2Y bid-ask spread is assessed for all bonds quoted for more than 2/3 of the 2 year period to date. It should be noted that bid-ask spreads are not adjusted for differences in average maturity of debt issued by each country. N/A denotes insufficient quoted evidence to assess bid-ask spread. Source for bid-ask spreads: NERA analysis of Bloomberg data. (2) Sweden average bid-ask spread excludes the bid-ask spread on the 2028 bond, which is a significant outlier.
The international index-linked government debt market, led by the earlier development of the UK market, has grown very rapidly. As shown in the Table, the three largest ILG markets are the US, the UK and France, however, rapid growth in other markets, notably Italy, has seen the size and diversity of issues in the global ILG market increase significantly in recent years.
We consider the characteristics of the ILG markets set out in the Table further in assessing the use of these bonds evaluating the real risk-free rate in the following sections.
4.3.2.1. Eurozone ILGs
As stated above, we consider that the appropriate primary reference market to be used in estimating WACC parameters for the DAA cost of capital is the Eurozone market. We therefore consider Eurozone ILG yields as our first-tier of evidence in evaluating the appropriate risk-free rate for DAA. We present evidence on Eurozone ILGs in Appendix Table B.1. We summarise key points regarding this evidence below:
§ Four governments in the Eurozone currently have ILGs outstanding; France, Italy, Austria and Greece. France is the dominant issuer as shown in Table 4.3.
§ With the exception of the Austrian bond, we consider that the liquidity of all Eurozone bonds presented is comparable to the liquidity of nominal German government bonds.15
§ In assessing the real risk-free rate, our preferred methodology uses the five year historical averages of yield evidence, as discussed in Section 4.3.1. Only two Eurozone ILGs,
15 Such that yields can be robustly used to estimate the real risk-free rate without requiring consideration of the presence
of liquidity premia in observed yields.

The Risk-Free Rate
NERA Economic Consulting 20
issued by France, were issued before March 2000 and therefore only these bonds have sufficient yield evidence over a five year historical period to be used in estimating the forward-looking risk-free rate. Only one of these bonds has a maturity equal to or greater than ten years over a five year historical period
§ We therefore consider the French bond maturing in 2029 as our primary first-tier source of evidence on the real risk-free rate. This evidence is presented in Table 4.4.
Table 4.4 Conclusion on First-Tier Evidence on the Real Risk-Free Rate
Issue Date Maturity 5Y Average Yield to Maturity France 10/1/1999 7/25/2029 3.0% Source: NERA analysis of Bloomberg data
The Table shows that the yield to maturity for the first-tier ILGs meeting our methodological criteria is 3.0%. Given the small size of this sample, we consider further second- and third-tier ILG evidence, in addition to cross-checking against nominal German government bond evidence, in order to further ensure robustness of our estimate. This additional evidence is presented in the following sections.
4.3.2.2. Other European and Developed Country ILGs
Our second-tier set of ILG evidence is based on wider European (non-Eurozone) markets. Whilst we consider that the Eurozone represents the best proxy of the reference market for the typical investor in Irish equity markets, the significant erosion of barriers to capital movement, particularly between developed country markets, in recent years has resulted in the widening of investment opportunities to investors. In particular, the increase in diversification options and currency hedging instruments has significantly reduced the cost to and uncertainty associated with investing in different currency areas. Evidence of substantial cross-border equity holdings, particularly in government securities demonstrates the increasing openness of international capital markets. We therefore consider that wider European and developed market evidence is relevant in assessing the rate demanded by the typical Eurozone investor for holding risk-free assets.
We present evidence on wider European (non-Eurozone) ILGs in Appendix Table B.2. We summarise key points regarding this evidence below:
§ Two wider European (non-Eurozone) governments currently have ILGs outstanding; the UK and Sweden. Of these two issuers, the UK is the larger issuer as shown in Table 4.3.
§ With the exception of the Swedish 2028 bond, we consider that the liquidity of all wider European bonds presented is comparable to the liquidity of nominal German government bonds, such that yields can be robustly used to estimate the real risk-free rate without requiring consideration of the presence of liquidity premia in observed yields.
§ The wider European market shows greater maturity than the Eurozone ILG market, with the majority of bonds issued before March 2000. These bonds therefore provide sufficient evidence of yields over a five year period in line with our methodological approach.

The Risk-Free Rate
NERA Economic Consulting 21
§ Significant and widely acknowledged distortions to yields arising from institutional factors mean that UK ILG evidence cannot be robustly used in estimating the forward-looking risk-free rate.
§ Our concluding set of wider European evidence on the real risk-free rate is therefore based on Swedish ILGs with a maturity of ten years or greater and a bid-ask spread consistent with those observed on nominal German Government bonds. These bonds are presented in Table 4.5.
Table 4.5 Conclusion on Second-Tier Wider European Evidence on the Real Risk-Free
Rate
Issue Date Maturity 5Y Average Yield to Maturity Sweden 12/1/1995 12/1/2020 3.4% Sweden 5/3/1999 12/1/2015 3.2% Average 3.3% Source: NERA analysis of Bloomberg data
The Table shows that the average yield to maturity for the second-tier wider European ILGs meeting our methodological criteria is 3.3%. We further consider wider market evidence on ILGs below.
We present evidence on wider developed market (non European) ILGs in Appendix Table B.3. We summarise key points regarding this evidence below:
§ There are three large non European developed markets in ILGs; Australia, Canada and the US. Of these three issuers, the US is the largest issuer as shown in Table 4.3.
§ With the exception of the Australian ILGs, we consider that the liquidity of all wider market bonds presented is comparable to the liquidity of nominal German government bonds, such that yields can be robustly used to estimate the real risk-free rate without requiring consideration of the presence of liquidity premia in observed yields.
§ We note that reduced supply may have downwardly impacted on long maturity US ILG yields, however we consider that these influences are not significant enough to warrant the exclusion of US evidence from our assessment of wider market evidence
§ A number of Canadian and US bonds with maturities of greater or equal to ten years over a five year period were issued prior to March 2000, providing sufficient evidence over a historical five year period, in line with our methodological criteria set out above. These bonds are presented in Table 4.6.

The Risk-Free Rate
NERA Economic Consulting 22
Table 4.6 Conclusion on Second-Tier Wider Market Evidence on the Real Risk-Free Rate
Issue Date Maturity 5Y Average Yield to Maturity Canada 3/8/1999 12/1/2031 3.2% Canada 12/7/1995 12/1/2026 3.2% Canada 12/10/1991 12/1/2021 3.2% US 4/15/1998 4/15/2028 3.0% US 4/15/1999 4/15/2029 3.0% Average 3.1%
Source: NERA analysis of Bloomberg data.
The Table shows that the average yield to maturity for the second-tier wider ILG market evidence meeting our methodological criteria is 3.1%.
4.3.3. Conclusions on ILG evidence
Table 4.7 summarises first-tier ILG evidence for the Eurozone.
Table 4.7 Conclusion on First-Tier (Eurozone) Evidence on ILGs
5Y Average Yield to Maturity Eurozone (France) 3.0%
Source: NERA analysis of Bloomberg data.
Table 4.8 summarises second-tier ILG evidence for the wider European and North American markets.
Table 4.8 Conclusion on First- and Second-Tier Evidence on ILGs
5Y Average Yield to Maturity Europe (non Eurozone) 3.3% North America (US & Canada) 3.1% Average 3.2%
Source: NERA analysis of Bloomberg data.
4.3.4. Nominal German Government Bond Evidence
As stated in Section 4.3.1, our preferred reference market for estimating the risk-free rate in assessing the cost of capital for the DAA is the Eurozone market. In the sections above we have assessed relevant ILG evidence in accordance with our preference for the use of index-linked instruments in estimating the real risk-free rate. Given the relatively limited availability of direct Eurozone ILG evidence and in order to ensure comprehensiveness in deriving a robust estimate of the risk-free rate, we further consider nominal German Government bond evidence. The use of German Government bonds is in line with standard regulatory and practitioner precedent in estimating the nominal risk-free rate for the Eurozone area. In line with our methodology set out in Section 4.3.1, we consider evidence on bonds fulfilling the following criteria:

The Risk-Free Rate
NERA Economic Consulting 23
§ Issuance prior to March 2000.
§ Sufficient liquidity as indicated by the bid-ask spread (proxied by a bid-ask spread no higher than 0.2%).
§ Maturity greater than or equal to ten years over a five year historical period.
Table 4.9 presents evidence on German Government bond yields.
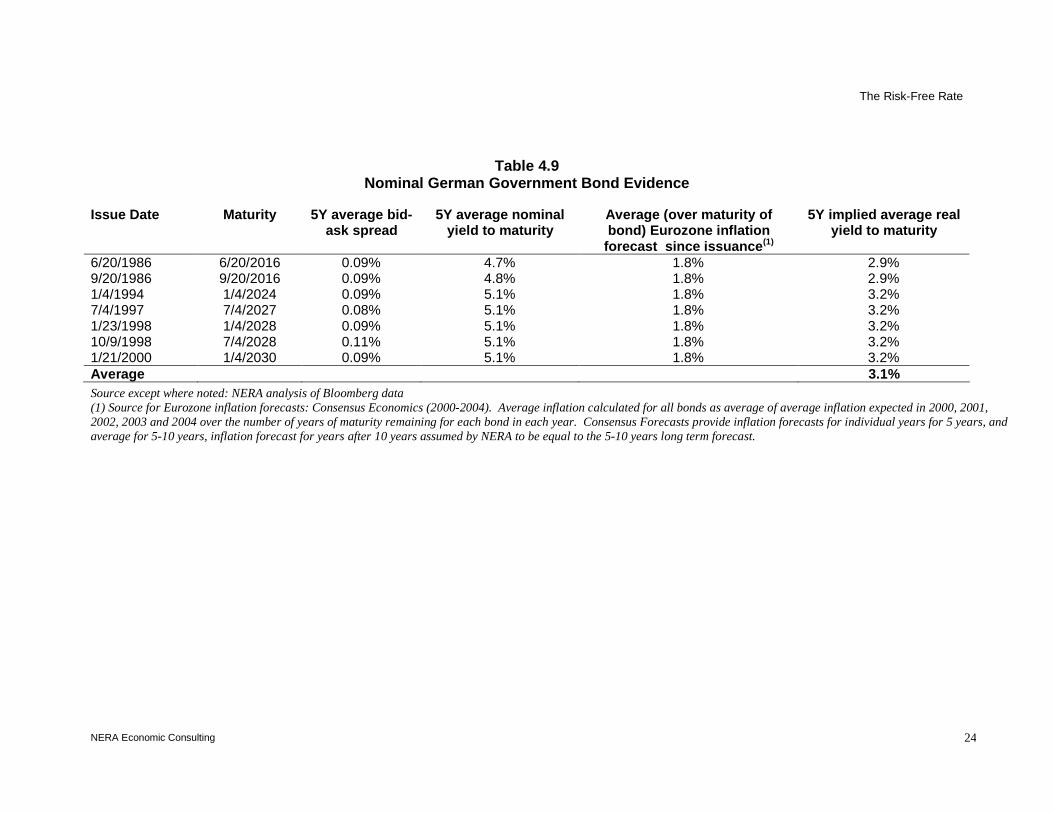
The Risk-Free Rate
NERA Economic Consulting 24
Table 4.9 Nominal German Government Bond Evidence
Issue Date Maturity 5Y average bid-ask spread
5Y average nominal yield to maturity
Average (over maturity of bond) Eurozone inflation
forecast since issuance(1)
5Y implied average real yield to maturity
6/20/1986 6/20/2016 0.09% 4.7% 1.8% 2.9% 9/20/1986 9/20/2016 0.09% 4.8% 1.8% 2.9% 1/4/1994 1/4/2024 0.09% 5.1% 1.8% 3.2% 7/4/1997 7/4/2027 0.08% 5.1% 1.8% 3.2% 1/23/1998 1/4/2028 0.09% 5.1% 1.8% 3.2% 10/9/1998 7/4/2028 0.11% 5.1% 1.8% 3.2% 1/21/2000 1/4/2030 0.09% 5.1% 1.8% 3.2% Average 3.1% Source except where noted: NERA analysis of Bloomberg data (1) Source for Eurozone inflation forecasts: Consensus Economics (2000-2004). Average inflation calculated for all bonds as average of average inflation expected in 2000, 2001, 2002, 2003 and 2004 over the number of years of maturity remaining for each bond in each year. Consensus Forecasts provide inflation forecasts for individual years for 5 years, and average for 5-10 years, inflation forecast for years after 10 years assumed by NERA to be equal to the 5-10 years long term forecast.
The Risk-Free Rate
NERA Economic Consulting 25
The Table shows that the average implied real yield to maturity for nominal German Government bonds fulfilling our criteria for the estimation of the risk-free rate is 3.1%. This is consistent with the range of estimates derived from our ILG analysis.
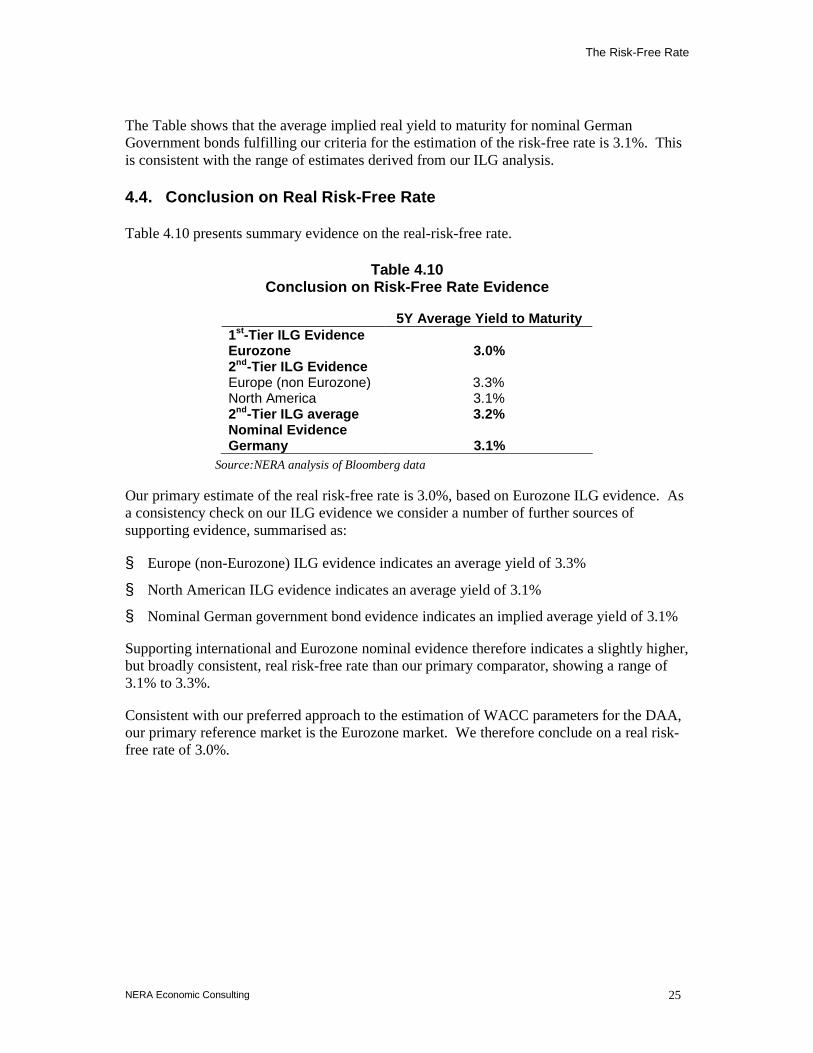
4.4. Conclusion on Real Risk-Free Rate
Table 4.10 presents summary evidence on the real-risk-free rate.
Table 4.10 Conclusion on Risk-Free Rate Evidence
5Y Average Yield to Maturity 1st-Tier ILG Evidence Eurozone 3.0% 2nd-Tier ILG Evidence Europe (non Eurozone) 3.3% North America 3.1% 2nd-Tier ILG average 3.2% Nominal Evidence Germany 3.1%
Source:NERA analysis of Bloomberg data
Our primary estimate of the real risk-free rate is 3.0%, based on Eurozone ILG evidence. As a consistency check on our ILG evidence we consider a number of further sources of supporting evidence, summarised as:
§ Europe (non-Eurozone) ILG evidence indicates an average yield of 3.3%
§ North American ILG evidence indicates an average yield of 3.1%
§ Nominal German government bond evidence indicates an implied average yield of 3.1%
Supporting international and Eurozone nominal evidence therefore indicates a slightly higher, but broadly consistent, real risk-free rate than our primary comparator, showing a range of 3.1% to 3.3%.
Consistent with our preferred approach to the estimation of WACC parameters for the DAA, our primary reference market is the Eurozone market. We therefore conclude on a real risk-free rate of 3.0%.

Estimating Beta
NERA Economic Consulting 26
5. Estimating Beta
5.1. Approach
CAPM theory states that an investor holds a diversified portfolio of assets, and thus the specific risk associated with each company is “diversified away”. An asset’s return is therefore related only to the asset’s covariant risk with the market portfolio, that is, the degree of co-movement between company’s returns and market returns. This degree of co-movement is measured by a beta parameter:
(5.1) )var(
),cov(
m
me
rrr
=β
Where:
er is the return on a specific stock; and
mr is the return on the market as a whole.
We can estimate quoted companies betas (company specific risk) by observing their share price behaviour relative to the relevant stock market index, which acts as a proxy for the market as a whole. Because of concerns about the robustness of a single regression result, it is also common to compare a beta result with “comparator” companies who operate in the same economic sector and are likely to face similar business risks.
As DAA is not a quoted company, one cannot estimate its beta using direct market information. We therefore estimate a beta for DAA by drawing on direct beta estimates for quoted comparator companies.
The remainder of this section is structured as follows:
§ Section 5.2 sets our methodological approach to estimating beta for the DAA;
§ Section 5.3 assesses appropriate comparators for the DAA;
§ Section 5.4 presents beta analysis for selected comparators to the DAA; and
§ Section 5.5 concludes.
5.2. Methodological Approach to Estimating Beta for the DAA
As discussed above, we use the CAPM to estimate the cost of equity for the DAA, based on evidence of comparator beta estimates. In undertaking this analysis there are four key issues to be taken into account in determining the appropriate methodology for estimation of our comparators’ beta values. These are:
§ The appropriate frequency for estimation of the beta;

Estimating Beta
NERA Economic Consulting 27
§ The appropriate time-frame over which to estimate the betas;
§ Adjustments to equity betas and the method of de-leveraging our observed equity betas to derive comparable asset betas; and
§ The determination of appropriate criteria for selection of comparators.
We discuss these issues below.
5.2.1. Frequency of data used in estimating beta
The three options for data frequency in the estimation of beta are daily, weekly and monthly data. Our views on the appropriateness of each frequency are summarised as:
§ Daily data. The benefit of using daily data is that a greater number of data points are available for estimation, increasing the robustness (through the lowering of the standard error) of the regression results. This means that shorter periods of historical data can be used to derive a robust beta estimate. However, the key disadvantage of the use of daily data is with respect to possible differences between the speed that individual stocks react to news at and the aggregate market reaction speed. Lags may result in biases to beta estimates, and differences in lags between stocks may mean that the robustness of comparison between individual beta estimates may be weakened.
§ Weekly data. Weekly data provides a middle ground between the estimation benefits of high frequency data and the robustness with respect to a lack of lags of monthly data. We consider that, as with monthly data, the use of average prices in estimating weekly betas is appropriate, in order to avoid well recognised timing biases to beta, such as the “day of the week” effect.
§ Monthly data. The main benefit of using monthly data to estimate beta is that stock prices are likely to represent fully the reaction of individual stock prices to information that also affects the market price. The main downside to using monthly data is that the lack of data points means that shorter period betas (1,2 or even 5 year) give insufficiently robust beta estimates.
We consider that the appropriate frequency of data to use in estimating comparator betas for the DAA is weekly data. The range of comparators considered is based on developed market companies of sufficient size that we consider that any lags are unlikely to be significant at the weekly level, negating the main advantage to the use of monthly data. The likely variation in size and reference exchanges of a potential comparator set does however mean that we rule out the use of daily data on this basis.
5.2.2. The appropriate estimation time-frame
Broadly, there are two alternatives with regard to the appropriate estimation time frame:
§ Long-term historic betas, for example, estimated over a five or ten-year period. Estimating betas over a long time-frame would capture the market’s historic assessment of risk over the entire business cycle.

Estimating Beta
NERA Economic Consulting 28
§ Betas estimated over the most recent period, for example, the most recent year. This will capture the market’s perspective on more recent risk exposures.
There is a trade-off between these two approaches. Long term estimates are more likely to give regression results with lower standard errors, i.e. more “ robust” estimates. These estimates are additionally less likely to be influenced by temporary market fluctuations or transient influences. On the other hand, longer term evidence presents a more dated picture of the risk exposure of the particular company, and therefore less pertinent to future risks.
Section 5.4 discusses the appropriate time frame for estimation of betas for comparators to the DAA in further detail.
5.2.3. Adjustments to equity betas
There are two “ technical” adjustments that need to be made to the regression (or raw) betas to ensure they are comparable.
The first adjustment takes into account biases in the raw beta that arise over time as a security’s true beta moves towards the market average (of one). To account for this bias, the raw betas (or historical betas, i.e. those betas obtained from the regression of the company’s stocks against the market index) need to be adjusted according to a simple deterministic formula:
(5.2) 0.133.067.0 ∗+∗= −− rawEquityadjustedEquity ββ
The second adjustment is required to convert equity betas to asset betas to ensure that they are comparable between companies and over time. A company’s beta is a function of the business risk particular to the company and the extent to which these risks are magnified by the financial leverage decisions of the company. We are interested in estimating our comparators’ asset betas, which capture only the business and cost risks associated with each company, to the exclusion of financial risk. This involves calculating an “un-levered” beta, defined as the value of beta for the company on the assumption that the company holds no debt.
To estimate the cost of equity we then need to “ re-gear” the asset beta in accordance with DAA’s expected capital structure.
The formula we use which relates the equity and asset beta (the leveraging formula) is:
(5.3) )1(ED
AssetEquity += ββ
An additional point to note in considering comparator beta estimates is the impact of extreme levels of gearing on the measurement of beta. Whilst standard finance procedure seeks to eliminate the influence of capital structure (gearing) on a company’s beta through the de-levering of observed equity betas to derive asset betas as set out above, extreme levels of gearing can influence the underlying asset beta estimate. For example, there will be a level of gearing for each company at which the equity stake becomes so thin as to be relatively illiquid. Standard academic theory predicts that at high levels of illiquidity, beta estimates will be biased. In assessing comparator beta estimates we must therefore pay particular

Estimating Beta
NERA Economic Consulting 29
attention to the nature of highly leveraged structures in assessing the likely robustness of beta.
5.2.4. Methodology for choice of comparators
In selecting quoted comparators to the DAA for the estimation of beta, our aim is to choose comparators which most replicate the DAA’s likely exposure to systematic, or beta, risk. There are a number of characteristics of a company’s activities, structure and operating environment that will determine its exposure to systematic risk. We must therefore ascertain the nature of these characteristics for the DAA and potential comparators under a robust and objectively verifiable framework, in order to enable the selection of the comparator(s) that will most accurately reflect the DAA’s likely exposure to systematic risk.
These characteristics can be summarised as:
§ Nature of activities and demand. In determining the systematic risk exposure of DAA and comparators arising from activities undertaken we consider the following key characteristics:
– Size and nature of market of operation. Size and market of operation will influence various components of systematic risk, principally in terms of competition risk to revenues.
– Aeronautical: non-aeronautical split. Income from airport activities can be broadly split into income from fees and charges to airlines (aeronautical) and all other incomes (non-aeronautical). Aeronautical activities, which cover the provision of airside services, such as aircraft take-off and landing, aircraft parking, passenger processing, and, in some cases, ground handling services, tend to have lower covariant risk than non-aeronautical, or commercial, aspects of an airport’s operations. This is due to three key reasons: (i) whilst aeronautical and aeronautical incomes will have a key driver in common, passenger demand, due to a non-passenger portion, in general we would expect that aeronautical incomes lag changes in passengers by more than non-aeronautical incomes – this is due to the nature of the response of airlines’ demand for slots to changing passenger demand.16 (ii) non-aeronautical incomes by nature will vary more in volume and price in response to GDP changes as they are partially dependent on expenditure per passenger in addition to passenger numbers. (iii) non-aeronautical incomes are likely to be exposed to greater competition than aeronautical revenues (see below).
– Demand. The level of covariant demand risk to which an airport operator is exposed vary according to the airport’s passenger mix, since some types of traffic are more sensitive than others to changes in GDP. As discussed above, both aeronautical and non-aeronautical revenues are partially driven by passenger numbers. Due to the differing structure of income received from these activities, the composition of
16 It should be noted that this difference will be influenced by the structure of retail incomes received by the airport; it
may be the case that under purely fixed lease contracts that income from retail premises may have a similar lag to incomes from airlines in response to changes in passenger demand. We would however expect revenues from non-aeronautical activities such as car-parking to respond more quickly to changes in passenger demand, increasing systematic risk

Estimating Beta
NERA Economic Consulting 30
passengers by type will typically influence these incomes in different ways. In Australia, the ACCC has made extensive use of the differences in passenger profiles between Australian airports in setting airport betas. The Commission’s approach has been to use estimates of the income elasticity of demand for different categories of journey (business, leisure, international, domestic), in conjunction with data on the shares of each category at particular airports, to produce measures of the relative demand risk faced by different airport operators. The higher the weighted income elasticity, the greater the relative demand risk, and hence the higher the asset beta, all other things equal.
The ACCC concludes that:
– International travel is more sensitive than domestic travel;
– Leisure travel is more sensitive than business; and
– Outbound travel (travel by nationals) is more sensitive than inbound (travel by foreigners).
We discuss the structure of DAA and comparators’ aeronautical and non-aeronautical revenues in greater detail in Section 5.3.
§ Regulatory risk. A determinant of risk exposure is the nature of regulation (if any).
1. Higher powered regulatory regimes will translate to greater covariant risk than regimes that allow greater cost pass-through.
2. Single till regulatory regimes will imply lower total risk exposure of returns than dual till regimes: non-aeronautical revenues are exposed to higher levels systematic risk vis-à-vis aeronautical revenues, although it should be noted that this is subject to a number of caveats regarding the nature of the regulatory regime (for example downside asymmetric risks arising from regulation (discussed in Section 2.2) are likely to be significantly higher under a single till regime).
§ Cost risks. The cost characteristics of an airport’s activities will also influence its exposure to systematic risk – the greater the ability of an airport to change its costs in response to a change in demand, the less responsive returns will be in response to demand changes and therefore the lower the covariant risk. Therefore in assessing an airport’s systematic risk exposure arising from cost structure the split between and nature of fixed and variable costs can be important. Operating leverage is a key determinant of a company’s beta. Formally, this is the percentage change in total costs associated with a percentage change in output. Intuitively, it measures the degree to which costs are fixed, and therefore non-variable with revenue.
§ Capital structure and equity ownership. Whilst theory and empirical evidence indicate that the cost of capital will remain broadly neutral with respect to capital structure over a central range of gearing, extreme levels of gearing can bias equity beta estimates in two key ways – i) very high gearing is frequently synonymous with financial distress; under this scenario individual equity prices will behave anomalously with respect to the market average price, the beta will therefore be biased as an indicator of the company’s systematic risk exposure under normal conditions. ii) very high gearing, particularly

Estimating Beta
NERA Economic Consulting 31
when the value of total assets is relatively low, can imply a relatively small equity market capitalization. Significant evidence indicates that lack of liquidity and lags in response to relevant information relative to the market average can mean that equity betas as measured for small market capitalization stocks are downwardly biased. We additionally consider the nature of significant equity holders in comparator stocks – in certain circumstances government ownership of a significant proportion of equity can influence investors’ perception of the company’s systematic risk exposures and therefore influence beta estimates. This is therefore a relevant consideration in selecting comparators as we seek to estimate a ring-fenced cost of capital for the DAA.
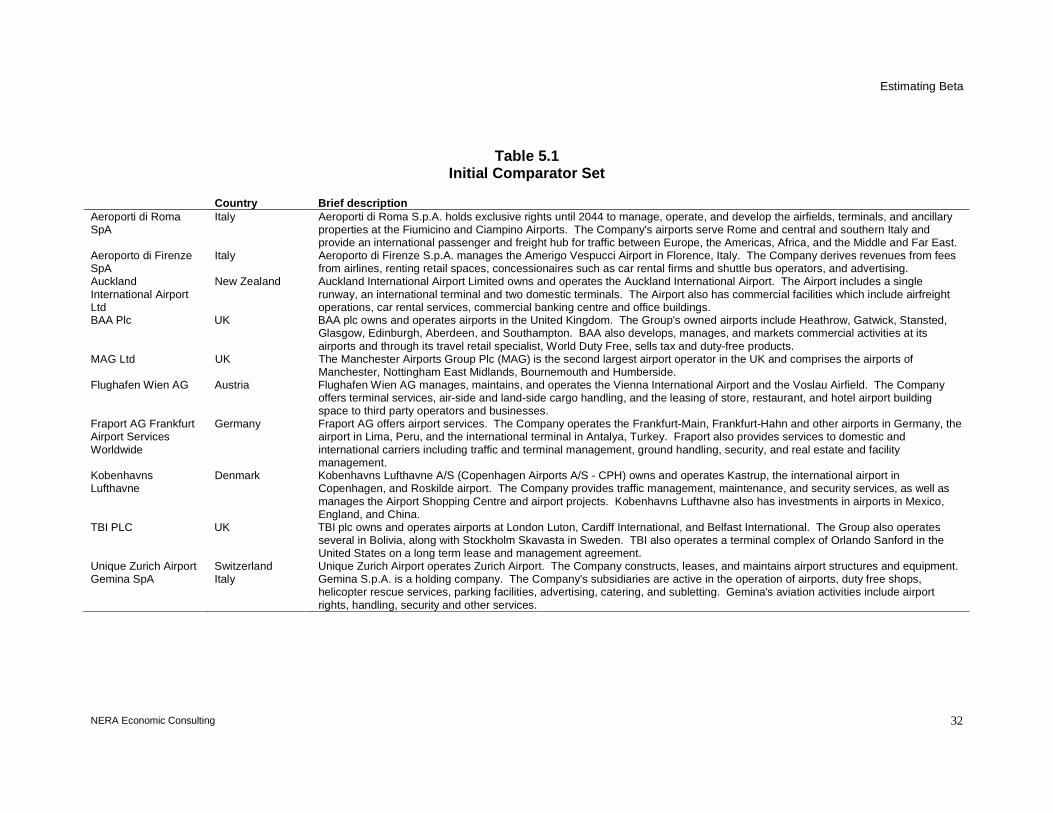
5.3. Selection of Comparators to the DAA
In total, there are eleven quoted airport operators that we consider meet the initial criterion of operating with the airport management sector in developed country markets. We additionally consider Manchester Airport; whilst this comparator is unlisted, regulatory evidence on its cost of capital is available from the 2002 Competition Commission decision on regulated charges.17 These are listed in Table 5.1 alongside basic descriptive information.
17 Competition Commission (2002b)
Estimating Beta
NERA Economic Consulting 32
Table 5.1 Initial Comparator Set
Country Brief description Aeroporti di Roma SpA
Italy Aeroporti di Roma S.p.A. holds exclusive rights until 2044 to manage, operate, and develop the airfields, terminals, and ancillary properties at the Fiumicino and Ciampino Airports. The Company's airports serve Rome and central and southern Italy and provide an international passenger and freight hub for traffic between Europe, the Americas, Africa, and the Middle and Far East.
Aeroporto di Firenze SpA
Italy Aeroporto di Firenze S.p.A. manages the Amerigo Vespucci Airport in Florence, Italy. The Company derives revenues from fees from airlines, renting retail spaces, concessionaires such as car rental firms and shuttle bus operators, and advertising.
Auckland International Airport Ltd
New Zealand Auckland International Airport Limited owns and operates the Auckland International Airport. The Airport includes a single runway, an international terminal and two domestic terminals. The Airport also has commercial facilities which include airfreight operations, car rental services, commercial banking centre and office buildings.
BAA Plc UK BAA plc owns and operates airports in the United Kingdom. The Group's owned airports include Heathrow, Gatwick, Stansted, Glasgow, Edinburgh, Aberdeen, and Southampton. BAA also develops, manages, and markets commercial activities at its airports and through its travel retail specialist, World Duty Free, sells tax and duty-free products.
MAG Ltd UK The Manchester Airports Group Plc (MAG) is the second largest airport operator in the UK and comprises the airports of Manchester, Nottingham East Midlands, Bournemouth and Humberside.
Flughafen Wien AG Austria Flughafen Wien AG manages, maintains, and operates the Vienna International Airport and the Voslau Airfield. The Company offers terminal services, air-side and land-side cargo handling, and the leasing of store, restaurant, and hotel airport building space to third party operators and businesses.
Fraport AG Frankfurt Airport Services Worldwide
Germany Fraport AG offers airport services. The Company operates the Frankfurt-Main, Frankfurt-Hahn and other airports in Germany, the airport in Lima, Peru, and the international terminal in Antalya, Turkey. Fraport also provides services to domestic and international carriers including traffic and terminal management, ground handling, security, and real estate and facility management.
Kobenhavns Lufthavne
Denmark Kobenhavns Lufthavne A/S (Copenhagen Airports A/S - CPH) owns and operates Kastrup, the international airport in Copenhagen, and Roskilde airport. The Company provides traffic management, maintenance, and security services, as well as manages the Airport Shopping Centre and airport projects. Kobenhavns Lufthavne also has investments in airports in Mexico, England, and China.
TBI PLC UK TBI plc owns and operates airports at London Luton, Cardiff International, and Belfast International. The Group also operates several in Bolivia, along with Stockholm Skavasta in Sweden. TBI also operates a terminal complex of Orlando Sanford in the United States on a long term lease and management agreement.
Unique Zurich Airport Switzerland Unique Zurich Airport operates Zurich Airport. The Company constructs, leases, and maintains airport structures and equipment. Gemina SpA Italy Gemina S.p.A. is a holding company. The Company's subsidiaries are active in the operation of airports, duty free shops,
helicopter rescue services, parking facilities, advertising, catering, and subletting. Gemina's aviation activities include airport rights, handling, security and other services.

DAA WACC Estimating Beta
NERA Economic Consulting 36
Before we fully apply the comparison criteria set out in Section 5.2.4. to our comparator selection shown in Table 5.1 we exclude comparators that do not obviously coincide with DAA in terms of comparability on basic criteria such as nature of operations, regulatory status and financial structure. The three comparators are excluded alongside reason for exclusion in Table 5.2.
Table 5.2 Comparator Exclusion on Basic Operating Characteristics
Reason for exclusion TBI PLC Unregulated company operating in several small competitive
(relative to DAA) markets. Additional interests in emerging markets. Therefore revenue and cost risks likely to be significantly higher vis-à -vis DAA.
Unique Zurich Airport Average gearing since 2001 is 86% (total debt/(debt+equity). At extreme levels of gearing, cost of capital is not broadly neutral to capital structure (commensurate with credit rating of BBB). Therefore asset betas may be biased.
Gemina SpA Gemina’s subsidiaries’ activities do not include integrated airport operation and management. Activities appear to be confined to operation of various component segments as an outsourcee. Revenues from operations can therefore be expected to be determined on a different basis from those of integrated airport operators, reducing the strength of Gemina as a comparator in terms of revenue risk exposures. Additionally, the holding company structure and ownership of a wide range of businesses (including finance, electricity generation and internet services) that the company’s risk exposures will not purely reflect risks associated with the airport sector, lessening suitability as a comparator.
We assess the suitability of the remaining seven comparators in the following sub-sections, following the methodology set out in Section 5.2.4.
5.3.1. Nature of activities and demand
5.3.1.1. Size and nature of operation
Table 5.3 shows key characteristics relating to the size and nature of operation of our eight remaining comparators, alongside information for the DAA.

DAA WACC Estimating Beta
NERA Economic Consulting 36
Table 5.3 Size and Nature of Market of Operation
No of passengers ‘000s (2004)
No of ATMs (2004)
No of airports
Total Revenues £m (2004)
DAA 21,788 225,577 3 246 Aeroporti di Roma SPA 27,1182 311,9362 2 3553
Aeroporto di Firenze SpA 1,3891 30,8631 1 144
Auckland International Airport Ltd 10,758 154,812 1 95 BAA Plc 133,400 1,183,900 7 1,970 MAG Ltd 19,90115 189,10015 4 353 Flughafen Wien AG 14,800 224,809 1 267 Fraport AG Frankfurt Airport Services Worldwide
51,100 477,500 2+ 1,341
Kobenhavns Lufthavne 19,000 272,518 2+ 224 Source: Company traffic data reports and annual reports. Conversions of revenues into Sterling from Euro, Danish Krone, New Zealand Dollar are made using monthly average exchange rates for March of relevant financial year except for Florence where 2003 exchange rates have been used. Source for exchange rates: Bloomberg. (1) 2003 data, (2) 2000 data, (3) 2001 data (4)2004 Year to September Figures are for group unless otherwise noted: (5) Passenger and ATM numbers for MAG are for Manchester Airport only
The Table shows that MAG Ltd is the DAA’s closest comparator with respect to size of operation and structure (in terms of number of airports). MAG’s group structure which is characterized by a dominant airport alongside a small number of significantly smaller regional airports also closely resembles that of the DAA – Manchester Airport contributed 70% of MAG’s revenues in 2004, in comparison with Dublin’s contribution of 65% revenues to the DAA group total. Additionally both groups have comparatively contiguous geographical coverage of home markets by component airports. AdR is a further relatively close comparator in terms of size and revenues – although its group structure appears more significantly dominated by a single airport (passengers at Fiumicino represented 97% of total Rome System passengers in 2000). Other companies that compare broadly with the DAA in terms of passenger, ATM and revenues include Vienna and Copenhagen, although Vienna operates a single airport. Auckland and AdF are significantly smaller than the DAA in terms of both passenger/movements and revenues and both are single airport structures. At the other end of the scale, BAA and Frankfurt are both significantly larger than the DAA in terms of both passenger/movements and revenues. The BAA group consists of seven UK airports which cover a range of non-contiguous home market locations (such as London, Scotland and Southampton), although the majority of revenues (65%) are contributed by the three London airports. Frankfurt, with interests in a number of airports and with significantly higher revenues differs substantially from the DAA in both measures of size and group structure.
5.3.1.2. Non-aeronautical/aeronautical revenues
§ Non-aeronautical/aeronautical revenue split
As set out in Section 5.2.4, the split between non-aeronautical revenues and aeronautical revenues is a key determinant of airports’ systematic revenue risk exposures, higher reliance on non-aeronautical revenues implying higher systematic covariance of revenues (although it should be noted that under a single till regulatory regime this influence will be to a degree mitigated).

DAA WACC Estimating Beta
NERA Economic Consulting 36
Figure 5.1 shows the proportion of non-aeronautical revenues of total revenues for our eight comparators and the DAA.
Figure 5.1 Non-Aeronautical Revenues as % Total Revenues
0%
10%
20%
30%
40%
50%
60%
70%
80%
AdR FRA
DAA
BAA (Grou
p)AdF
BAA (UK ap
ts) AIA VIEMAG
CPH
Non
Aer
onau
tical
Rev
enue
s as
% T
otal
Rev
enue
s
Source: Annual reports. All data is average 2003-04 except: DAA (2004), AdR (1999-2001), AdF 2004 is YTD September 2003. Aeronautical revenues exclude handling charges where explicitly defined, except BAA which appears to include “passenger and baggage” handling within airport and other traffic charges.
The Figure shows that the DAA’s non-aeronautical:total revenues ratio is at the upper end of a relatively narrow range of 48% (CPH) to 74% (AdR). The closest companies in terms of comparability of recent revenue splits are Frankfurt (FRA), BAA (Group) and Aeroporto di Firenze (AdF).
We would expect that the composition of non-aeronautical revenues will further influence the revenue risks implied by the non-aeronautical/total revenue split. We would expect higher reliance on retail as a component to increase the risk exposures of non-aeronautical revenues, whereas activities such as car-parking are likely to be less sensitive to changes in market conditions.

DAA WACC Estimating Beta
NERA Economic Consulting 36
Figure 5.2 shows the contribution of retail revenues and car parking to non-aeronautical revenues for selected comparators.
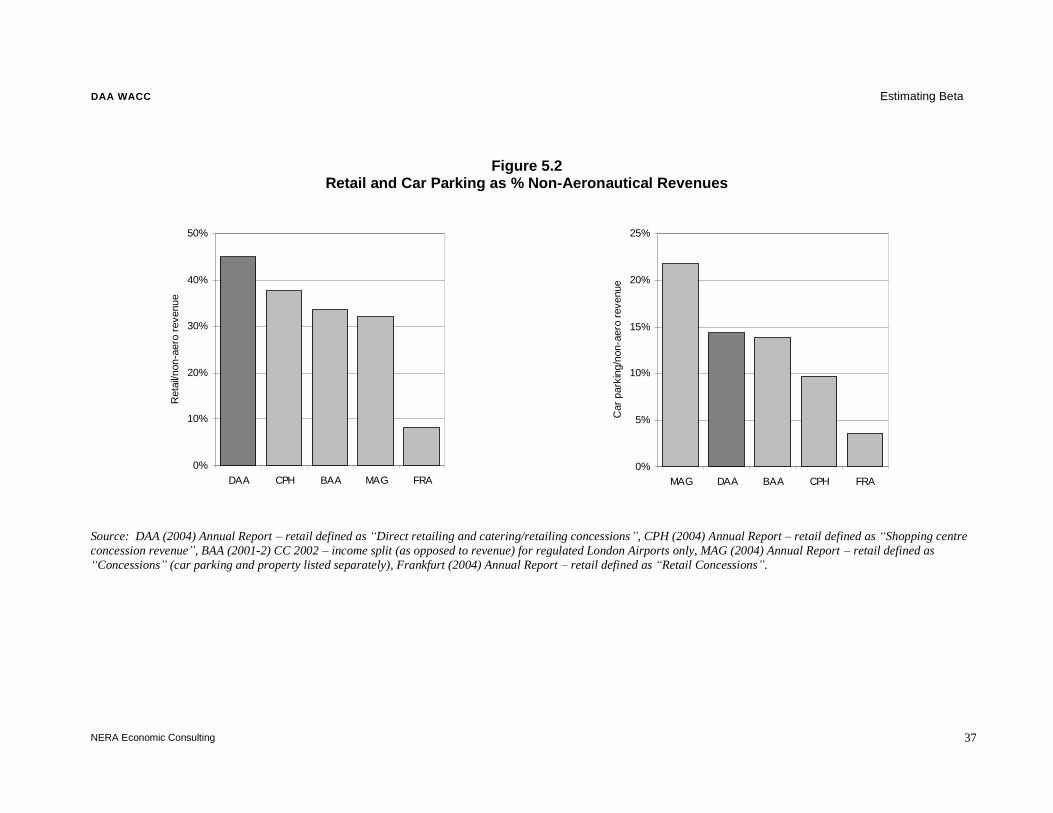
DAA WACC Estimating Beta
NERA Economic Consulting 37
Figure 5.2 Retail and Car Parking as % Non-Aeronautical Revenues
0%
10%
20%
30%
40%
50%
DAA CPH BAA MAG FRA
Ret
ail/n
on-a
ero
reve
nue
0%
5%
10%
15%
20%
25%
MAG DAA BAA CPH FRA
Car
par
king
/non
-aer
o re
venu
e
Source: DAA (2004) Annual Report – retail defined as “Direct retailing and catering/retailing concessions” , CPH (2004) Annual Report – retail defined as “Shopping centre concession revenue” , BAA (2001-2) CC 2002 – income split (as opposed to revenue) for regulated London Airports only, MAG (2004) Annual Report – retail defined as “Concessions” (car parking and property listed separately), Frankfurt (2004) Annual Report – retail defined as “Retail Concessions” .

DAA WACC Estimating Beta
NERA Economic Consulting 38
The Figures show that DAA has the highest proportion of retail revenues of the selected comparators; Copenhagen, BAA Group and Manchester Airport Group are close comparators, with reliance on retail revenues slightly lower than those of the DAA. It should be noted that BAA Group’s recent split of retail revenues is likely to be higher following proportional growth in the share of retail in non-aeronautical revenues and higher reliance on retail revenues for the Group vis-à-vis the regulated London Airports as shown in the Figure.18 Significantly lower reliance on retail and car-parking revenues for Frankfurt relative to the other comparators is consistent with a high reliance (over 50%) on transfer passengers – the largest single contributor to non-aeronautical revenue is handling (44%). In terms of car-parking revenues BAA is the closest comparator to the DAA, Manchester Airport’s slightly higher reliance on car parking is consistent with lower reliance on transfer passengers.
In conclusion, we consider that BAA and MAG are the closest comparators to the DAA in terms of likely non-aeronautical revenue risk implied by contribution of retail and car parking revenues. Evidence indicates that DAA may face higher risk exposures of non-aeronautical revenues than both of these comparators, in particular MAG, due to higher reliance on retail and lower reliance on car parking revenues.
5.3.1.3. Passenger split
§ Long-haul vs short haul
As discussed in Section 5.2.4, the ACCC concluded that international travel is more sensitive than domestic travel. We would also expect greater non-aeronautical revenues per long-haul passenger. Greater reliance on long-haul passengers for revenues therefore implies greater systematic risk exposure of both aeronautical and non-aeronautical revenues.
Figure 5.3 sets out domestic and European passengers as a proportion of total passengers for our eight comparators and the DAA.
18 BAA Group data for 2004 does not disaggregate retail income into component sources – which include car parking and
other services. We therefore use CC 2002 data to enable comparability with other airports as shown in the Figure. However growth in retail revenues and Duty Free revenues as a proportion of total non-revenues indicate that recent retail revenues excluding car parking and other services have increased. BAA Group reliance on retail revenues (including car parking and other revenues) is also higher for the group than for the regulated London Airports. We therefore expect BAA Group to be more comparable in terms of retail split to the DAA than the 2001-02 regulated London Airports breakdown indicates.

DAA WACC Estimating Beta
NERA Economic Consulting 39
Figure 5.3 Domestic and European Passengers as % Total Passengers
0%
20%
40%
60%
80%
100%
ADF CPH DAA VIE MAG ADR BAA FRA AIA
% p
asse
nger
s E
U +
dom
estic
Source: Company Traffic Reports and Annual Reports. Data based on 2004 group data except where noted: (1) MAG based on 2003 data for Manchester Airport only (2 (2) AdR based on 2000 data (4) AIA equivalent of domestic and European proxied by domestic and Australian. Data refers to arriving passengers (5) Copenhagen domestic and European includes Scandinavia (6) Frankfurt domestic and European includes Eastern Europe. .
The Figure shows that the DAA’s 2004 domestic and European passenger proportion of 89% is relatively high amongst the comparator set. Florence has the highest domestic reliance of nearly 100%, consistent with its status as a small regional airport. At the lower end of the range, 61% of Frankfurt’s passengers are domestic, consistent with its status as a major international hub. Auckland has the lowest proportion of domestic and EU equivalent passengers (proxied by domestic and Australian flights).19 The other comparators lie in the range of 70% to 90% domestic and European passengers and are broadly comparable to the DAA in terms of reliance on shorter haul vs long haul. The closest comparators to the DAA in this set are Copenhagen, Vienna and Manchester Airport Group.
§ Business vs leisure
As set out in Section 5.2.4, other regulators have concluded that leisure travel is more sensitive to economic conditions than business travel. Data on the leisure/business split for selected comparators and the DAA is shown in Figure 5.4.
19 Interpreting this as meaning the highest long-haul risk of the comparators should be undertaken with caution, due to the
substantial differences in the nature of geographical location outside of Europe.

DAA WACC Estimating Beta
NERA Economic Consulting 40
Figure 5.4 Leisure/Business Passenger Split
0%10%20%30%40%50%60%70%80%90%
GAL STAL DAA BAA HAL AdR
Tour
ist p
asse
nger
s as
% to
tal
Source for BAA: BAA London Airports - CC (2002) – BAA calculated as average of London Airports. Source for DAA – NERA (2001). Source for AdR – 2000 Traffic Report – data for Fiumicino only used. Business proportion for AdR calculated as sum of following passenger groups – study, business and congress.
The Figure shows that all London airports compare very closely with the DAA in terms of reliance on a proportion of around 75% of tourist passengers as a percentage of total.
§ Transfer vs final destination/origination
A further passenger characteristic that influences revenue risk exposure is the nature of travel in terms of origination/destination versus transfer. Transfer passengers are generally likely to be long-haul, implying higher revenue risks as set out above. Additionally, competitive pressures with regard to transfer passengers can be expected to be higher than originating/terminating passengers – as demand by passengers is not highly driven by the specific location. This is evidenced by more competitive pricing of transfer charges by airports. However, transfer passengers by definition use less facilities (car-parking, transport facilities, periphery retail etc) at the connecting airport that contribute to non-aeronautical revenues. We would therefore expect a greater reliance on transfer passengers to increase revenue risks to aeronautical revenues and to decrease revenue risks to non-aeronautical revenues. The proportion of transfer passengers can therefore be used to further interpret the risk implications of the proportion of long-haul passengers and non-aeronautical revenues.
Figure 5.5 shows the proportion of transfer passengers as a percentage of total passengers for selected comparators.

DAA WACC Estimating Beta
NERA Economic Consulting 41
Figure 5.5 Transfer Passengers as % of Total Passengers
0%
10%
20%
30%
40%
50%
60%
FRA CPH VIE BAA DAA MAG
% p
asse
nger
s tra
nsfe
r
Source: Frankfurt (2003): Fraport “Facts and Figures 2003” , Vienna (2004): ATW (2004) “Vienna is increasing its aircraft de-icing capacity to keep winter weather-related delays under control” , Copenhagen (2004): Copenhagen Airport website –Strategy: Competition, BAA (2001): CC (2002)- London Airports only, DAA (2004): DAA estimate, MAG (2001): CC (2001) states that Manchester’s hub role- connecting passengers was limited to less than 5% of passenger throughput
We understand that the DAA’s current proportion of transfer passengers is estimated to be around 5% to 6%. The Figure shows that the closest comparators in terms of transfer passengers as a proportion of total passengers are Manchester Airport Group (Manchester Airport only) and BAA. We note that the proportion shown for BAA London Airports may exceed the group total – as the smaller regional airports outside of London are more reliant on point-to-point services vis-à-vis airports such as Heathrow and Gatwick. Frankfurt, Copenhagen and Vienna’s proportions of transfer passengers are significantly higher (all exceeding 30% of passenger throughput) consistent with their status as major international hubs. The implication of a significantly higher proportion of transfer passengers is that non-aeronautical revenues are on balance likely to face less systematic risk than a company with lower transfer proportions, all else equal, whilst aeronautical revenues are likely to be of higher risk, reflecting the higher sensitivity of transfer demand to price vis-à-vis originating/terminating traffic.
5.3.2. Regulation
Whether a company is regulated or not is key in both indicating the inherent level of risk of operation and further influencing risk when regulated. Unregulated companies are generally not considered to exert significant enough market power to necessitate regulation. Returns of unregulated companies can therefore be broadly expected to face higher exposure to competitive pressures than regulated companies, such that systematic risks are higher. For regulated companies, the regulatory framework under which airport charges are set will influence the risk exposures of returns in two key ways:
§ Higher powered regulatory regimes (price and revenue cap based regulation (PC)) will imply higher risk than rate of return (RoR) type regulation.

DAA WACC Estimating Beta
NERA Economic Consulting 42
§ Less important is the distinction between single and dual till regulation - the broad risk implications for total returns of these types of regulation are summarized below.
– Single till. Under the single till regulatory approach, total forecast revenues are taken into consideration in setting the price cap. The single till regulatory regime generally therefore implies lower volatility risk to total returns vis-à-vis dual till, however this is subject to a number of caveats regarding the nature of the regulatory regime (for example downside asymmetric risks arising from regulation (discussed in Section 2.2) are likely to be significantly higher under a single till regime).20
– Dual till. Under the dual till regulatory approach, aeronautical charges are set independently of non-aeronautical revenues. The non-aeronautical proportion of total returns are therefore unregulated and imply higher volatility of total returns vis-à-vis a single till regulatory regime.
Based on the different return-risk implications and different structure of risks faced under a single till regulatory approach versus the dual till approach, a key element in selecting a comparator to the DAA should be the type of regulatory regime applied.
Table 5.4 shows the regulatory regime applied to the DAA and our comparators.
20 Further risk may arise under a single till vis-à-vis dual till from the additional forecasting of non-aeronautical revenues; as
these revenues are more volatile forecasting risk under a single till regime may be significant.

DAA WACC Estimating Beta
NERA Economic Consulting 43
Table 5.4 Regulatory Regime Applied to Comparators
Comparator Regulated ? PC/RoR Single/Dual Till
DAA Y PC Single Aeroporti di Roma SPA Y(1) Y Dual Aeroporto di Firenze SpA -(1) - - Auckland International Airport Ltd N (shadow regulation) - - BAA Plc Y (London airports only) PC Single MAG Ltd Y (Manchester Airport only) PC Single Flughafen Wien AG Y PC Single Fraport AG Frankfurt Airport Services Worldwide
Y RoR Dual
Kobenhavns Lufthavne Y PC Dual Source: ACI (2003) “Airport charges in Europe” , Bel & Fageda (2004) “Airport Management and Airline Competition in OCDE Countries” . (1) Rome regulated explicitly over period of listing (prior to 2002). It should be noted that regulatory arrangements for setting airport prices in Italy were changed in 2002 - Since this date, each airport determines its own charges as a function of airport costs and other factors as specified in Law 662/1996 and CIPE resolution August 4th , 2000. This applies to all airports whose infrastructure is owned by central government. The review procedure is that the airports cannot increase the charges, once determined. The CIPE resolution allows a review of charges every 5 years using a price cap formula. The charges are set in decree of the Ministry of Transport in agreement with the Ministry of Finance. It is not clear whether the amended rules now apply to Florence, which does not have central government ownership of infrastructure.
The Table shows that the majority of comparators are explicitly regulated, with the exception of Florence, which likely faces significant competitive pressures owing to its size and status as a regional domestic airport, and Auckland, where prices are determined in consultation with stakeholders and regulation is limited to “shadow” regulation (i.e. the threat of regulatory intervention in situations where collective agreements not reached with stakeholders). All regulated comparators are regulated under a price-cap type regulatory regime, with the exception of Frankfurt which is regulated under a lower risk rate of return regime.
With regard to the regulated comparators, Vienna, BAA and MAG are regulated under single till regimes, in common with the DAA. AdR, Frankfurt and Copenhagen are regulated under dual till regimes, broadly implying higher volatility risk to revenues, all else equal, vis-à-vis the DAA.
We therefore consider that in terms of regulatory regime, BAA, MAG and Vienna are most comparable to the DAA, as all operate under single till price cap type regimes. The least comparable is Frankfurt, which operates under a dual till rate of return regime.
5.3.3. Equity ownership
In this section we consider impacts on systematic risk exposures arising from the nature of ownership of quoted airports. Significant ownership by government bodies may imply lower perceived risk to returns, depending on the nature of the holding.
Table 5.5 shows significant government holdings in quoted comparators and details the nature of any holdings.

DAA WACC Estimating Beta
NERA Economic Consulting 44
Table 5.5 Government Holdings of Quoted Comparators
Comparator Significant government holding ?
Nature of holding
Aeroporti di Roma SPA AdR delisted in 2001 as result of acquisition Aeroporto di Firenze SpA N - Auckland International Airport Ltd Y City Councils hold 23% BAA Plc N - Flughafen Wien AG Y Province and City hold 40% Fraport AG Frankfurt Airport Services Worldwide
Y Federal Government owns 18%, regional government
owns 53% Kobenhavns Lufthavne Y Government owns 37% Source: Bloomberg
The Table shows that the majority of our comparators are significantly held by Government bodies – BAA and Florence are the exceptions with no significant equity holdings. The ownership of significant stakes of equity by government can imply lower risk arising from governmental guarantees, depending on the nature of ownership. Of the comparators significantly owned by government shown in Table 5.5, we understand that Fraport is the only airport with significant government involvement (70% + ownership and government presence on the board) which may indicate lower perceived risk to returns by private shareholders. We therefore consider that Fraport’s beta estimates may not fully reflect the compensation demanded by equity holders to remunerate for the risk of operations.
5.3.4. Cost structure
As discussed in Section 5.2.4, the degree of fixity of costs as measured by operating leverage will influence systematic risk exposures, as higher cost fixity implies greater responsiveness of returns to changes in demand. In practice, the operating leverage is difficult to calculate for comparators, primarily due to a lack of available and consistent data. A reasonable proxy for this ratio is capital costs divided by operating costs. However, it should be noted that this is difficult to compare across countries, because of differences in accounting practices. Whilst we attempt to minimize distortions to comparability arising from these differences by considering gross capital expenditure on tangible fixed assets and operating costs excluding depreciation and amortization where possible, we therefore must caveat our comparisons of this ratio between the DAA and comparator companies on the basis that accounting differences may mean that ratios cannot be compared on a pure like-for-like basis.
Figure 5.6 shows the ratio of capex to opex for the DAA and our comparators.
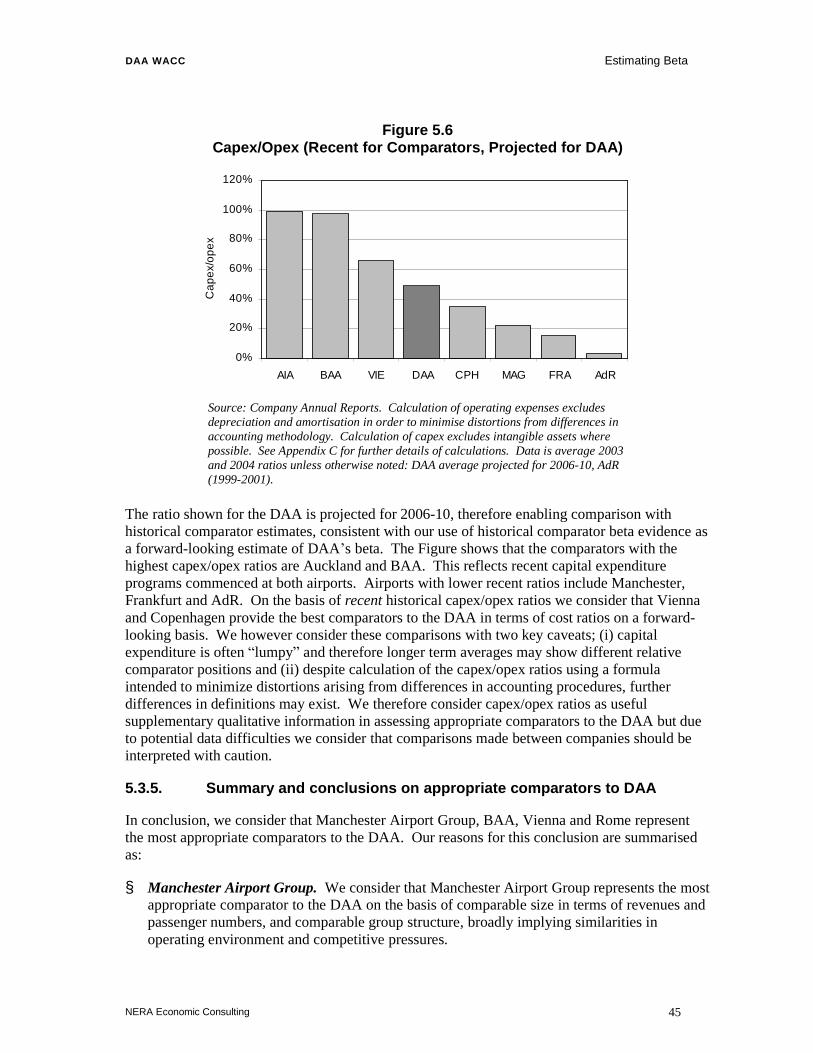
DAA WACC Estimating Beta
NERA Economic Consulting 45
Figure 5.6 Capex/Opex (Recent for Comparators, Projected for DAA)
0%
20%
40%
60%
80%
100%
120%
AIA BAA VIE DAA CPH MAG FRA AdR
Cap
ex/o
pex
Source: Company Annual Reports. Calculation of operating expenses excludes depreciation and amortisation in order to minimise distortions from differences in accounting methodology. Calculation of capex excludes intangible assets where possible. See Appendix C for further details of calculations. Data is average 2003 and 2004 ratios unless otherwise noted: DAA average projected for 2006-10, AdR (1999-2001).
The ratio shown for the DAA is projected for 2006-10, therefore enabling comparison with historical comparator estimates, consistent with our use of historical comparator beta evidence as a forward-looking estimate of DAA’s beta. The Figure shows that the comparators with the highest capex/opex ratios are Auckland and BAA. This reflects recent capital expenditure programs commenced at both airports. Airports with lower recent ratios include Manchester, Frankfurt and AdR. On the basis of recent historical capex/opex ratios we consider that Vienna and Copenhagen provide the best comparators to the DAA in terms of cost ratios on a forward-looking basis. We however consider these comparisons with two key caveats; (i) capital expenditure is often “ lumpy” and therefore longer term averages may show different relative comparator positions and (ii) despite calculation of the capex/opex ratios using a formula intended to minimize distortions arising from differences in accounting procedures, further differences in definitions may exist. We therefore consider capex/opex ratios as useful supplementary qualitative information in assessing appropriate comparators to the DAA but due to potential data difficulties we consider that comparisons made between companies should be interpreted with caution.
5.3.5. Summary and conclusions on appropriate comparators to DAA
In conclusion, we consider that Manchester Airport Group, BAA, Vienna and Rome represent the most appropriate comparators to the DAA. Our reasons for this conclusion are summarised as:
§ Manchester Airport Group. We consider that Manchester Airport Group represents the most appropriate comparator to the DAA on the basis of comparable size in terms of revenues and passenger numbers, and comparable group structure, broadly implying similarities in operating environment and competitive pressures.

DAA WACC Estimating Beta
NERA Economic Consulting 46
– Manchester’s non-aeronautical revenues as a proportion of total revenues are somewhat lower than those of the DAA, and we consider that this implies higher relative revenue risk for the DAA. DAA’s higher reliance on retail and a lower reliance on car parking revenues may also imply higher sensitivity of DAA’s non-aeronautical revenues to market conditions relative to Manchester.
– In terms of passenger composition, Manchester Airport is a close comparator to the DAA, although the DAA has a slightly higher reliance on domestic and European passengers, which may to some degree counteract the higher level of risk exposure that the DAA faces vis-à-vis Manchester on the basis of non-aeronautical revenue contribution to total revenues. Manchester and DAA are additionally highly comparable on the basis of transfer passengers, indicating a similar risk profile implied by the proportion of long haul passengers and competitive pressures in aeronautical charge structures.
– On a forward-looking basis, the DAA has a higher capex/opex ratio relative to Manchester’s recent ratio, implying a higher degree of risk exposure arising from greater cost fixity.
– In conclusion, we consider that evidence indicates that the DAA is likely to face at least similar, if not greater, risks to returns than Manchester, and we therefore conclude that estimates of Manchester’s asset beta should be taken as a lower bound in assessing beta for the DAA.
§ BAA. We consider that BAA represents a good comparator to the DAA for the following reasons:
– The DAA is comparable to BAA on the basis of key risk determinants such as non-aeronautical revenues proportion to total revenues, similarity of reliance on retail and car-parking revenues in non-aeronautical revenues, regulatory regime and leisure/business split of passengers.
– In terms of other passenger composition characteristics, BAA has a higher proportion of long haul flights and higher reliance on transfer volumes vis-à-vis DAA. This implies that BAA may face slightly higher risks arising from these elements of passenger composition. This is likely to be more than counteracted by BAA’s size and diversification of operations, which are both significantly higher than comparable measures for the DAA. We also note that BAA’s main airports face substantial capacity constraints, which will further limit BAA’s competitive risk exposures vis-à-vis the DAA.
– We consider that the BAA’s recent capex/opex ratio, which is significantly higher than that of the DAA’s forward-looking ratio for 2006-10, consistent with BAA’s major recent capex programmes, may imply higher risk exposure arising from greater cost fixity, however we consider that this risk may be to a degree mitigated by the nature of recent increases in capex: much is related to capacity expansion at Heathrow, and evidence indicating significant excess demand for capacity at Heathrow may reduce investors’

DAA WACC Estimating Beta
NERA Economic Consulting 47
perception of additional risk relative to proportionally similar levels of capex for other airports, all else equal.
– In conclusion we consider that DAA is likely to face higher levels of risk exposure than BAA, as we consider that its smaller size, lower diversification of services and substantially higher levels of capacity demand which lower operating risk.
§ Vienna. We consider that Vienna is a good comparator to the DAA for the following reasons:
– Vienna is comparable with the DAA on the basis of broadly comparable size in terms of passengers and revenues, regulatory regime, passenger composition and cost fixity.
– With a lower proportion of non-aeronautical revenues, implying lower revenue risk, and a single airport structure we however consider that comparability of Vienna to the DAA is lower vis-à-vis Manchester.
– Significantly higher reliance on transfer passengers may also imply differences between the DAA and Vienna’s demand structure and therefore risk to revenues. We also consider that increasing dependence on Eastern European markets may reduce comparability with the DAA – we would expect demand behaviour in these markets, as rapidly growing economies, to significantly differ from EU market demand.
– In conclusion we consider that the DAA is likely to face higher risk than Vienna, however we must caveat this conclusion with considerations of likely significant differences in demand structure and therefore the nature of revenue risk arising from Vienna’s significantly higher dependence on transfer traffic and increasing dependence on less mature markets vis-à-vis the DAA.
§ Rome. We consider that Rome also represents an appropriate comparator to the DAA for the following reasons:
– AdR is broadly comparable to the DAA in terms of size by passengers and revenues, and operates two airports.
– However, non-aeronautical revenues as a proportion of total revenues and the proportion of long-haul passengers are both higher than for the DAA, in addition to regulation under a dual till regime.
– A lower tourist proportion of passengers relative to DAA may counter the higher revenue risks implied by these characteristics. AdR additionally faces significantly lower cost structure risk, with a very low capex/opex ratio relative to both the DAA and the remainder of the comparator set.
– We additionally consider that the cessation of trading of AdR’s stock in 2001 resulting in the unavailability of recent evidence on its beta further supports Rome’s status as a supplementary comparator as opposed to a primary comparator to the DAA.

DAA WACC Estimating Beta
NERA Economic Consulting 48
– In conclusion, we consider that Rome is likely to face higher risk than the DAA..
§ Frankfurt. We consider that Frankfurt’s status as an international hub, with over 50% of passengers as transfer traffic, means that comparability with the DAA is low.
– Hub status, combined with a significantly higher reliance on long haul traffic will mean that the comparability of a similar proportion of non-aeronautical revenues to the DAA is diminished.
– Frankfurt is additionally regulated under a different, lower powered, regime structure to the DAA, and has a diverse number of foreign interests.
– We further consider that the substantial level of government involvement (70%+ ownership of equity) may imply that the returns (and therefore beta estimates) required by investors may not fully reflect the risks implied by the Group’s operations.
– In conclusion, we consider that Frankfurt is likely to face lower risk than the DAA and is not a suitable comparator for a number of reasons.
§ Copenhagen. We do not consider Copenhagen to be a close comparator to the DAA.
– Whilst size in terms of passenger numbers and revenues are comparable, Copenhagen’s position as the Scandinavian hub with a high proportion of passengers made up by transfers implies the same issues for comparability as those outlined for Frankfurt above. In addition, non-aeronautical revenues as a proportion of total revenues are the least comparable of all comparators with the DAA.
– In conclusion, we consider that Copenhagen is likely to face lower risk than the DAA and is not a suitable comparator for a number of reasons.
§ Auckland and Florence. We consider that Auckland and Florence are the least appropriate comparators to the DAA, based on significantly smaller size and apparently unregulated status. These characteristics imply likely significantly higher competitive risks to demand.
– In conclusion, we consider that Auckland and Florence are likely to have significantly higher risk exposures than the DAA and are therefore not suitable comparators.
In conclusion, our preferred comparators to the DAA are Manchester Airport Group, BAA, Vienna and Rome. We consider that, on balance, the DAA’s risk exposures are likely to be higher than those faced by BAA and more in line with those faced by Manchester Airport Group. Of Vienna and Rome, we consider that Vienna’s cost and regulatory risk exposures are likely to be more in line with the DAA. A lower reliance on non-aeronautical revenues implies lower revenue risk for Vienna in comparison with the DAA (however we caveat our conclusions noting that Vienna relies on significantly higher proportions of transfer traffic and is expanding Eastern European traffic rapidly). A dual till regulatory regime and higher reliance on non-aeronautical revenues may however mean that Rome’s exposure to revenue risks is higher than that of the DAA. Low cost structure risk may mitigate this to a degree, however, the likely differences in

DAA WACC Estimating Beta
NERA Economic Consulting 49
risk exposures arising from these differences, in addition to the cessation of trading of AdR’s equity in 2001 means that evidence on AdR’s beta must be considered as supplementary.
5.4. Comparator Beta Estimates
As set out in Section 5.3 above, our preferred comparators to the DAA are:
§ Manchester Airport Group
Manchester Airport Group is not quoted, therefore we consider regulatory precedent in estimation of its beta. In 2002, the Competition Commission estimated an equity beta ranging from 0.9 to 1.1. This range is 0.1 higher symmetrically than the concurrent range of 0.8 to1.0 allowed by the CC for BAA21 (where both MA and BAA decisions were based on the same 0.71 published equity beta for BAA). Whilst the CC did not explicitly state that it supported Manchester’s arguments that it faced higher systematic risk exposures relative to BAA, the increase in the equity beta range assumed was attributed as “we accept that the current international situation may lead to some increase in the systematic risk of airports as a whole. Furthermore, the recent increase in capacity (and hence fixed costs as a proportion of total costs) at MA may also have marginally increased beta, and we therefore propose a range of 0.90 to 1.1.” 22 With the CC’s higher gearing assumption for Manchester (mid point of 30% and 35%) versus that assumed for BAA (25%), the asset beta assumed by the CC in estimating the cost of capital for both BAA and Manchester is 0.68.
§ BAA
Figure 5.7 shows the movement of BAA and the FTSE All-Share Index’s relative prices since over the past ten years (January 1995 = 100 for both series).
21 Competition Commission (2002a) 22 Competition Commission (2002b), p86
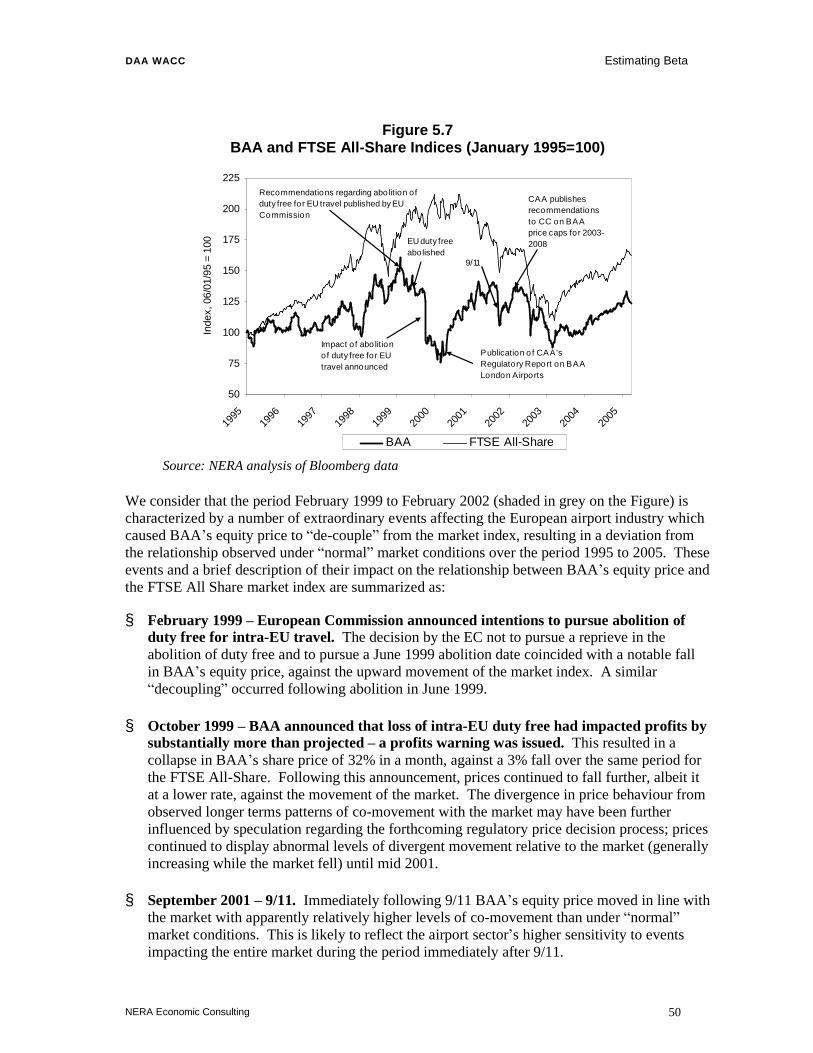
DAA WACC Estimating Beta
NERA Economic Consulting 50
Figure 5.7 BAA and FTSE All-Share Indices (January 1995=100)
50
75
100
125
150
175
200
225
1995
1996
1997
1998
1999
2000
2001
2002
2003
2004
2005
Inde
x, 0
6/01
/95
= 10
0
BAA FTSE All-Share
Impact of abo lition of duty free fo r EU travel announced
Publication o f CAA's Regulatory Report on BAA London Airports
9/11
CAA publishes recommendations to CC on BAA price caps for 2003-2008
Recommendations regarding abolition of duty free for EU travel published by EU Commission
EU duty free abolished
Source: NERA analysis of Bloomberg data
We consider that the period February 1999 to February 2002 (shaded in grey on the Figure) is characterized by a number of extraordinary events affecting the European airport industry which caused BAA’s equity price to “de-couple” from the market index, resulting in a deviation from the relationship observed under “normal” market conditions over the period 1995 to 2005. These events and a brief description of their impact on the relationship between BAA’s equity price and the FTSE All Share market index are summarized as:
§ February 1999 – European Commission announced intentions to pursue abolition of duty free for intra-EU travel. The decision by the EC not to pursue a reprieve in the abolition of duty free and to pursue a June 1999 abolition date coincided with a notable fall in BAA’s equity price, against the upward movement of the market index. A similar “decoupling” occurred following abolition in June 1999.
§ October 1999 – BAA announced that loss of intra-EU duty free had impacted profits by substantially more than projected – a profits warning was issued. This resulted in a collapse in BAA’s share price of 32% in a month, against a 3% fall over the same period for the FTSE All-Share. Following this announcement, prices continued to fall further, albeit it at a lower rate, against the movement of the market. The divergence in price behaviour from observed longer terms patterns of co-movement with the market may have been further influenced by speculation regarding the forthcoming regulatory price decision process; prices continued to display abnormal levels of divergent movement relative to the market (generally increasing while the market fell) until mid 2001.
§ September 2001 – 9/11. Immediately following 9/11 BAA’s equity price moved in line with the market with apparently relatively higher levels of co-movement than under “normal” market conditions. This is likely to reflect the airport sector’s higher sensitivity to events impacting the entire market during the period immediately after 9/11.
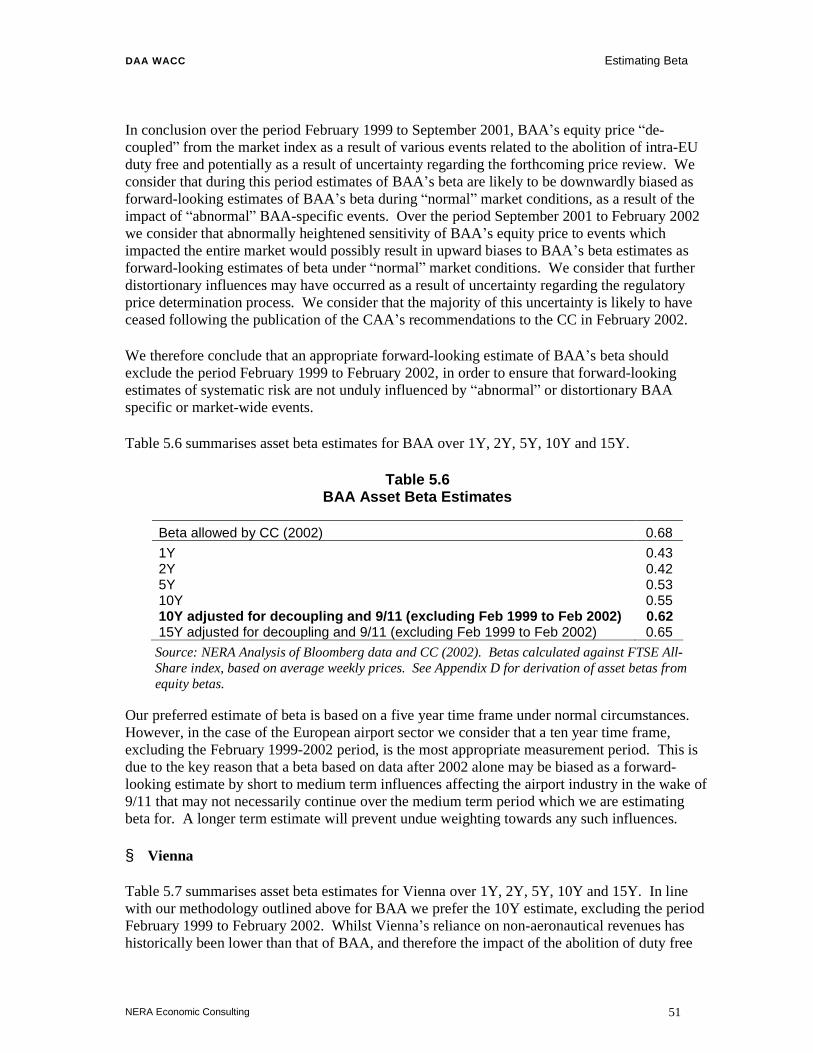
DAA WACC Estimating Beta
NERA Economic Consulting 51
In conclusion over the period February 1999 to September 2001, BAA’s equity price “de-coupled” from the market index as a result of various events related to the abolition of intra-EU duty free and potentially as a result of uncertainty regarding the forthcoming price review. We consider that during this period estimates of BAA’s beta are likely to be downwardly biased as forward-looking estimates of BAA’s beta during “normal” market conditions, as a result of the impact of “abnormal” BAA-specific events. Over the period September 2001 to February 2002 we consider that abnormally heightened sensitivity of BAA’s equity price to events which impacted the entire market would possibly result in upward biases to BAA’s beta estimates as forward-looking estimates of beta under “normal” market conditions. We consider that further distortionary influences may have occurred as a result of uncertainty regarding the regulatory price determination process. We consider that the majority of this uncertainty is likely to have ceased following the publication of the CAA’s recommendations to the CC in February 2002.
We therefore conclude that an appropriate forward-looking estimate of BAA’s beta should exclude the period February 1999 to February 2002, in order to ensure that forward-looking estimates of systematic risk are not unduly influenced by “abnormal” or distortionary BAA specific or market-wide events.
Table 5.6 summarises asset beta estimates for BAA over 1Y, 2Y, 5Y, 10Y and 15Y.
Table 5.6 BAA Asset Beta Estimates
Beta allowed by CC (2002) 0.68 1Y 0.43 2Y 0.42 5Y 0.53 10Y 0.55 10Y adjusted for decoupling and 9/11 (excluding Feb 1999 to Feb 2002) 0.62 15Y adjusted for decoupling and 9/11 (excluding Feb 1999 to Feb 2002) 0.65
Source: NERA Analysis of Bloomberg data and CC (2002). Betas calculated against FTSE All-Share index, based on average weekly prices. See Appendix D for derivation of asset betas from equity betas.
Our preferred estimate of beta is based on a five year time frame under normal circumstances. However, in the case of the European airport sector we consider that a ten year time frame, excluding the February 1999-2002 period, is the most appropriate measurement period. This is due to the key reason that a beta based on data after 2002 alone may be biased as a forward-looking estimate by short to medium term influences affecting the airport industry in the wake of 9/11 that may not necessarily continue over the medium term period which we are estimating beta for. A longer term estimate will prevent undue weighting towards any such influences.
§ Vienna
Table 5.7 summarises asset beta estimates for Vienna over 1Y, 2Y, 5Y, 10Y and 15Y. In line with our methodology outlined above for BAA we prefer the 10Y estimate, excluding the period February 1999 to February 2002. Whilst Vienna’s reliance on non-aeronautical revenues has historically been lower than that of BAA, and therefore the impact of the abolition of duty free

DAA WACC Estimating Beta
NERA Economic Consulting 52
revenues less significant in terms of distorting the relationship between Vienna’s equity price and the market index, we consider that the period preceding and following the abolition of intra-EU duty free sales is likely to represent an “abnormal” market distortion to all European airport equity prices, as with 9/11. For consistency we therefore exclude the same period from our asset beta estimate as for BAA.
Table 5.7 Vienna Asset Beta Estimates
1Y 1.04 2Y 0.74 5Y 0.51 10Y 0.61 10Y adjusted for decoupling and 9/11 (excluding Feb 1999 to Feb 2002) 0.64 15Y adjusted for decoupling and 9/11 (excluding Feb 1999 to Feb 2002)1 0.63
Source: NERA Analysis of Bloomberg data. Betas calculated against DJ Stoxx European index, based on average weekly prices. (1) based on data from 1992. See Appendix D for derivation of asset betas from equity betas.
§ Rome
Table 5.8 summarises asset beta estimates for AdR over the period 1997-2001 based on listing in 1997 and subsequent delisting following acquisition in 2001. We estimate an asset beta for both the whole period of listed status and for 1997 to February 1999, in line with the adjustments made to BAA and Vienna’s asset betas to account for the likely biasing influence of the abolition of intra-EU duty free.
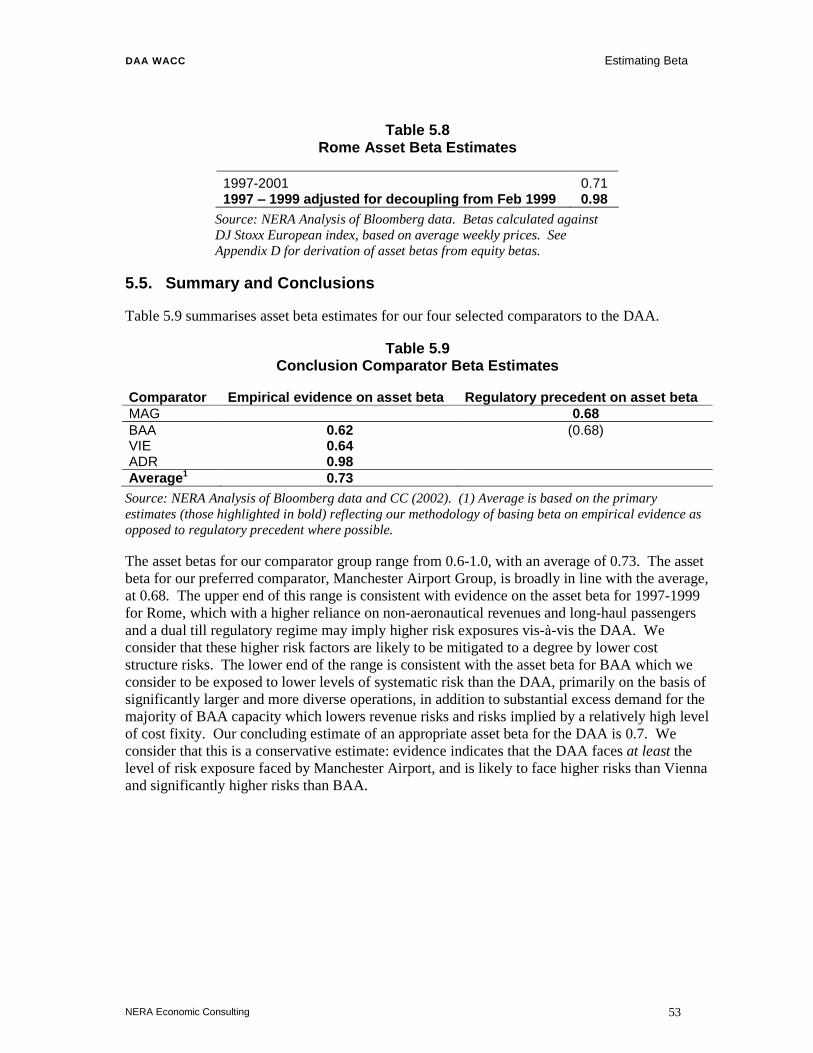
DAA WACC Estimating Beta
NERA Economic Consulting 53
Table 5.8 Rome Asset Beta Estimates
1997-2001 0.71 1997 – 1999 adjusted for decoupling from Feb 1999 0.98
Source: NERA Analysis of Bloomberg data. Betas calculated against DJ Stoxx European index, based on average weekly prices. See Appendix D for derivation of asset betas from equity betas.
5.5. Summary and Conclusions
Table 5.9 summarises asset beta estimates for our four selected comparators to the DAA.
Table 5.9 Conclusion Comparator Beta Estimates
Comparator Empirical evidence on asset beta Regulatory precedent on asset beta MAG 0.68 BAA 0.62 (0.68) VIE 0.64 ADR 0.98 Average1 0.73
Source: NERA Analysis of Bloomberg data and CC (2002). (1) Average is based on the primary estimates (those highlighted in bold) reflecting our methodology of basing beta on empirical evidence as opposed to regulatory precedent where possible.
The asset betas for our comparator group range from 0.6-1.0, with an average of 0.73. The asset beta for our preferred comparator, Manchester Airport Group, is broadly in line with the average, at 0.68. The upper end of this range is consistent with evidence on the asset beta for 1997-1999 for Rome, which with a higher reliance on non-aeronautical revenues and long-haul passengers and a dual till regulatory regime may imply higher risk exposures vis-à-vis the DAA. We consider that these higher risk factors are likely to be mitigated to a degree by lower cost structure risks. The lower end of the range is consistent with the asset beta for BAA which we consider to be exposed to lower levels of systematic risk than the DAA, primarily on the basis of significantly larger and more diverse operations, in addition to substantial excess demand for the majority of BAA capacity which lowers revenue risks and risks implied by a relatively high level of cost fixity. Our concluding estimate of an appropriate asset beta for the DAA is 0.7. We consider that this is a conservative estimate: evidence indicates that the DAA faces at least the level of risk exposure faced by Manchester Airport, and is likely to face higher risks than Vienna and significantly higher risks than BAA.

DAA WACC The Equity Risk Premium
NERA Economic Consulting 54
6. The Equity Risk Premium
The equity risk premium (ERP) is the difference between the expected return on the market portfolio and the expected return on a risk-free asset (formally stated as E[rm] – E[rf] i.e. it is the reward investors demand for bearing the risk they expose themselves to by investing in equity markets.
In Section 6.1 we summarise recent Irish and international regulatory precedent on estimates of the ERP. Section 6.2 summarises academic evidence on the ERP. In Section 6.3 we summarise the findings from analyses of long-run historical returns. Section 6.4 concludes.
6.1. Regulatory Precedents on the Equity Risk Premium
Table 6.1 presents recent Irish regulatory precedent on the equity risk premium.
Table 6.1 Irish Regulatory Precedent on the Equity Risk Premium
Regulator Case (date) ERP CER ESB Power Generation Price Review Final Proposals (Sep 2000) 5.4% CAR Aer Rianta Price Cap (Aug 2001) 6.0% CER Best New Entrant Price 2002: Decision (Dec 2001) 5.3% ODTR Review of the Price Cap on Certain Telecommunications Services:
Decision Notice (Feb 2003) 7.0%
CER Decision on Distribution (and Transmission) Use of System Revenue Requirement and Tariff Structure (Aug (and Jul) 2003)
5.0%
CER Best New Entrant Price 2005 Decision and Response Paper (2004) 5.3% (1) ODTR did not publish the individual components of the cost of capital allowed for Eircom, however we understand that they used the upper bound of parameters recommended by NERA in our report (2002) “Eircom’s Cost of capital: A Report for ODTR” . We therefore present the risk-free rate recommended in this report.
The Table shows that the ERP allowed by Irish regulators in recent years has ranged between 5.0% and 7.0%. The ODTR has allowed an ERP at the upper end of this range whilst the CER decisions have tended to be grouped around the lower end of this range. In most cases justification for the ERPs allowed by the CER and ODTR are not explicitly set out. However documentation underlying the ODTR decision prepared by NERA estimates the ERP on the basis of long term historical evidence of equity returns in Eurozone, US and UK markets. The CER state that they base their allowed ERP in the Best New Entrant 2002 decision primarily on ex-post and price-earnings analysis, consistent with regulatory precedent and backed up by ex-ante expectations.
We also consider regulatory precedent on the ERP in the UK, summarised in Table 6.2.

DAA WACC The Equity Risk Premium
NERA Economic Consulting 55
Table 6.2 Recent UK Regulatory Decisions on the Equity Risk Premium
Institution Case ERP MMC Cellnet / Vodafone (1998) 3.5%-5% Ofwat PR1999 (1999) 3.0%-4.0% Ofgem PES (1999) 3.5% Ofgem NGC (2000) 3.5% ORR Railtrack (2000) 4.0% CAA NATS (2000) 3.5%-5% Competition Commission
Mid-Kent Water Plc; and Sutton and East Surrey Water Plc, (2000)
4.0%
Ofgem Transco (2001) 3.5% Oftel BT (2001) 5% Competition Commission
BAA (2002) 2.5%-4.5%
Competition Commission
Vodafone, O2, Orange and T-Mobile (2003)
2.5%-4.5%
Ofgem Final Proposals for DNOs (2004) 2.5%-4.5% Ofwat Final Determinations (2004) ~5.0% Ofcom Various (2004) e.g. Partial Private Circuits charge control, TV
licence renewal, mobile termination charges 5.0%
UK regulatory precedent shows lower ERPs than those allowed by Irish regulators, ranging between 2.5% and 5.0%. More recent decisions have tended to the upper end of this range. In most cases, some consideration has been given to evidence on historic average returns, however UK authorities have generally judged that the historic ERP overstates the current risk premium. Estimates of the ERP have generally relied heavily on small sample survey evidence on the expectations of investors. Surveys that have been considered by the authorities include CLSE (1999), Price Waterhouse (1998), NERA (1998) and other evidence from investment bank analysts. The reliance on survey evidence has prevailed despite the CC itself recognising that “this evidence may be subject to biases that are difficult to quantify and assess” (Competition Commission, 2000a, paragraph 8.28).
However, more recently, justification for the ERP allowed by regulators has focused more on a range of evidence including long run historical evidence of equity returns, ex-ante evidence (price-earnings) in addition to survey evidence. This move away from the reliance on survey evidence, which has been subject to a number of criticisms, has paralleled recent increases in the ERP allowed by UK regulators.
Outside the UK, in countries including the US, Australia and the Netherlands, the ERP has generally been set at a higher level. In the US, although the CAPM is not widely used to estimate the cost of equity, it is often used as a check on the DCF results. The most widely quoted source used in US hearings to assess the level of the ERP is the Ibbotson data.23 The method recommended by Ibbotson is to compute the arithmetic average of stock market returns against long-term Treasury bond yields.
23 Ibbotson Associates publish data on the ERP every year in a handbook, “Stocks, Bonds, Bills & Inflation”.

DAA WACC The Equity Risk Premium
NERA Economic Consulting 56
Table 6.3 presents a summary of recent US decisions on the ERP.
Table 6.3 Recent US Decisions on the Equity Risk Premium
Institution Case ERP Comments on Decision Connecticut Department of Public Utility Control
Southern Connecticut Gas Company, 2000
6.13% Used a Risk Premium Method to check DCF. The ERP is the arithmetic average from 1974-1998.
Connecticut Department of Public Utility Control
Connecticut Power & Light Company, 1999
6.52%, 5.89%
Different witnesses performed the CAPM calculation with different ERPs. These submissions were approved by the Commission.
Maine Public Utilities Commission
Central Maine Power Company, 1999
7.40% - 8.90%
The Commission uses CAPM analysis as a check on the DCF method, and employs this range of ERPs, based on witnesses’ recommendations.
Public Service Commission of Utah
Pacificorp, dba Utah Power and Light, 1999
7.8% CAPM used as check to DCF model.
Public Utility Commission of Oregon
Northwest Natural Gas, 1999
8.5% Commission chose this ERP for use in CAPM.
Source: Public Utility Commission Dockets, US State Regulators.
In Australia, recent regulatory cases have concluded that the market risk premium is most likely to lie in the range of 5.0% to 7.0%. A recent decision by the Australian Competition and Consumer Commission (ACCC) used an ERP of 6% for the Victorian transmission network revenue caps for 2003-2008.24
In the Netherlands, the electricity regulator DTe published its guidelines for price cap regulation in the period from 2000 to 2003 whereby it “considers it reasonable to fix the market risk premium between 4% and 7%” 25. This range was derived on the basis of the available data and responses from the sector.
6.2. Academic Evidence on the Equity Risk Premium
A large amount of academic literature exists discussing the ERP. In particular, the ERP has attracted significant recent academic debate, partly in response to the bullish equity markets observed in the US economy in the 1990s. Table 6.4 below presents selected academic estimates of the ERP, illustrating the large wide range of estimates of the ERP that have been derived in the literature.
24 ACCC (2002b), p.27. 25 DTe (2000) “Guidelines for price cap regulation of the Dutch electricity sector in the period from 2000 to 2003”, February
2000

DAA WACC The Equity Risk Premium
NERA Economic Consulting 57
Table 6.4 Recent Academic Evidence on the Equity Risk Premium
Source ERP estimate
Details
Brealey and Myers (1996)
8.5% Long-run historical data
Bowman (2001) 7.5% Franks (2001) 5% Dimson, Marsh and Staunton (2001)
5%-10% (Eurozone)
Ex post estimates based on 101 years of data. Based on arithmetic averages
Fama and French (2001)
2.6%-4.3% Estimates derived from dividend and earnings growth models over 2nd half of 20th century. Compares with estimate from average returns of 7.43%.
Ibbotson and Chen (2001)
5.9-6.2% Historical and supply side models.
Oxera (undated)(1) 4.7%-8.5% Ex post estimates of one year and five years returns averaged using various periods over the last 100 years. Using the whole period the ERP was around 5%
(1) Cited in Franks and Mayer (2001).
Of these studies, the Ibbotson and Chen (2001) study is widely quoted in international regulatory contexts.26 The authors used historical evidence for the US market and supply side models (egg. dividend growth models) to predict future equity risk premia. The authors conclude:
“Contrary to several recent studies that declare the forward-looking equity risk premium to be close to zero or negative, we find the long term supply of equity risk premium is only slightly lower than the pure historical return estimate. The long-term equity risk premium is estimated to be about 6% arithmetically and 4% geometrically. Our estimate is in line with both the historical supply measures of public corporations (i.e. earnings) and the overall economic productivity (GDP per capita)” .
6.3. Historical Evidence on the Equity Risk Premium
6.3.1. The LBS/ABN AMRO Study
Dimson, Marsh and Staunton (2001) reports the returns on equity markets for 15 countries around the world over the last 101 years, and compares them against the returns on treasury bills and bonds. The results are summarised in Table 6.5 for the Eurozone markets reported by Dimson, Marsh and Staunton, US, UK and the world average. The evidence indicates equity risk premia (according to arithmetic vs geometric averaging process chosen) in the range of 4.0% to 6.0% for Ireland, 6.7% to 9.9% for Germany, 5.0% to 8.4% for Italy and 5.0% to 7.1% for France. The ranges for the UK and US are 4.4% to 5.6% and 5.0% to 6.9% respectively, and the
26 See IPART (2002) and related submissions.

DAA WACC The Equity Risk Premium
NERA Economic Consulting 58
world average ranges from 4.6% to 6.7%, whilst the Eurozone average ranges from 4.5% to 6.9%.
Table 6.5 LBS / ABN AMRO Estimates of the Equity Risk Premium, Relative to Bonds
Arithmetic Geometric Std. dev. Ireland 6.0% 4.0% 20.4% Belgium 4.9% 3.0% 20.4% Netherlands 6.7% 4.7% 21.4% Spain 5.1% 3.2% 20.2% France 7.1% 5.0% 21.6% Italy 8.4% 5.0% 30.0% Germany1 9.9% 6.7% 28.4% Eurozone average 6.9% 4.5% USA 6.9% 5.0% 19.9% UK 5.6% 4.4% 16.7% World average2 6.7% 4.6% Source: LBS / ABN AMRO “Millennium Book II, 101 years of investment returns” , 2001. 1: The estimates are based on 99 years of data, with 1922/3 excluded where hyperinflation had a major impact on the risk premia and bills returned – 100%. 2: The countries included in this average are: Australia, Belgium, Canada, Denmark (from 1915), France, Germany, Ireland, Italy, Japan, Netherlands, Spain, Sweden, Switzerland (from 1911), UK and USA.
6.3.2. Choice of averaging process
Substantial debate has taken place over whether average realised historical equity returns should be calculated using either geometric or arithmetic averages.
A large number of recent academic papers have stated a preference for the use of arithmetic means of historical data to estimate a prospective equity risk premium. Two examples of the arguments presented are as follows:
§ Dimson, Marsh and Staunton (2000) argue (p.9) that “When decisions are being taken on a forward-looking basis, however, the arithmetic mean is the appropriate measure since it represents the mean of all the returns that may possibly occur over the investment holding period” .27
§ In his book “Regulatory Finance”, Morin (1994) argues, “One major issue relating to the use of realized returns is whether to use the ordinary average (arithmetic mean) or the geometric mean return. Only arithmetic means are correct for forecasting purposes and for estimating the cost of capital.”
Consistent with recent mainstream academic wisdom, NERA favour the use of the arithmetic rather than the geometric mean in deriving an average measure to calculate the ERP using historical data.
In their Millennium Book, Dimson, Marsh and Staunton (2001) note that historical evidence on the equity risk premium may overestimate the prospective risk premium. In particular, they 27 Dimson, Marsh and Staunton (2000) “Risk and Return in the 20th and 21st Centuries”, Business Strategy Review 2000,
Volume 11 Issue 2, pp1-18.
DAA WACC The Equity Risk Premium
NERA Economic Consulting 59
argue (p.134) that periods of extreme volatility observed during the 20th century may mean that arithmetic averages of historical data may overestimate the prospective risk premium. They present recalculated arithmetic averages of the risk premia based on projections of early 21st century levels of volatility. Based on this evidence they show that arithmetic averages are around 0.6% lower when re-based for lower levels of market volatility.28 Other arguments are presented by Dimson, Marsh and Staunton that also suggest that future ERPs may differ from historical estimates. These arguments can be summarised as:29
§ Systematic underestimation of inflation by investors
§ High levels of technological, productivity and efficiency growth over the 20th Century that they (DMS) consider are unlikely to be repeated
§ Observed rising stock prices (and therefore returns) are also suggested to be a sign of lowered long term investment risk which would result in a reduction in required rates of return.
Dimson, Marsh and Staunton’s conclusion that the prospective equity risk premium is lower than the historical equity risk premium is not without controversy. The issue of systematic underestimation of inflation has been discussed in a range of academic papers. A recently published book by Cornell (1999) on “The Equity Risk Premium” does not agree that investors have systematically underestimated inflation over the 20th century.30
Cooper and Currie (1999) in their analysis of the cost of capital for the UK water sector also concluded that it was implausible that investors had systematically underestimated inflation. A number of other recent academic papers have reached similar conclusions.31
In summary, Dimson, Marsh and Staunton (2001) present long-run ex-post evidence that suggests an ERP for Ireland and the major Eurozone markets ranging from 4.9% to 9.9%, averaging 6.9% and a world average of 6.7%, based on arithmetic averages. After making adjustments for lower projections of early 21st century levels of volatility they conclude that the prospective equity risk premium is around 0.6% lower (i.e. ranging from 4.3% to 9.3% for the 28 In Table 28 of their report, Dimson, Marsh and Staunton show that the predicted arithmetic mean equity risk premia versus
bills for the UK is 5.9%. This compares to historical evidence presented in Table 25 that shows the UK equity risk premia relative to bills of 6.5%.
29 The authors show, by decomposing the historical ERP and subtracting the estimated impact of unanticipated cash flows and reductions in investors’ required rates of return, that predicted ERPs are likely to be greater than historical estimates. Overall, the authors conclude that factors such as these would have likely led to a reduction in investors required rates of return and a reduction in the equity risk premium. They conclude that this evidence suggests (p.149) that the net effect of these factors means an expected equity risk premium on an annualised basis is around 3-4 percent; and on an arithmetic mean basis is around 4-5 percent. This is around 1.5% lower than the ERP implied by the historical averages.
30 “Although the United States did experience a prolonged period of unexpected high inflation between 1973 and 1980, the rate then dropped unexpectedly over the period between 1982 and 1990… (T)his means that although bondholders have experienced both good and bad intervals because of inflation, inflation has had almost no impact over the full period on their average returns. Consequently, inflation cannot explain the large average difference between the historical returns on equity and the historical returns on long term treasury bonds”
31 See Cooper and Currie (1999). Draper and Paudyal (1995) record such a view: " It is unlikely on the basis of current evidence available to us about markets and their use of information [ie. the efficient market hypothesis] that investors would systematically underestimate inflation over a long period of time… It is premature on the basis of current knowledge to believe that investors systematically underestimated inflation. It seems implausible that all investors around the world systematically underestimated inflation"

DAA WACC The Equity Risk Premium
NERA Economic Consulting 60
Eurozone (averaging 6.3%) and 6.1% for the world average). They also present other reasons why the prospective equity risk premium may not be as high, such as unanticipated inflation but we note that other academic papers do not reach the same conclusions regarding this particular issue.
In conclusion, we place primary weight on long-run historical evidence. Overall, we conclude that Dimson, Marsh and Staunton’s analysis shows that the equity risk premium is most likely to lie in the range of 5.0% to 7.0%. The lower end of this range is consistent with the (contested) view that view that the prospective equity risk premium is likely to be lower than the historical equity risk premium. The upper end is derived from the unadjusted average of ERPs reported for Eurozone markets.
6.4. Summary and Conclusions on the Equity Risk Premium
We summarise evidence presented in this section:
§ Irish regulatory precedent shows central estimates of the ERP in the range of 5.0% to 7.0%
§ UK Regulatory precedent shows central estimates of the ERP in the range of 3.5% to 5.0%.
§ International regulatory precedent shows central estimates of the ERP in the range of 5.0% to 7.0%.
§ Recent academic papers generally conclude that the equity risk premium lies in a range of 4% to 8%. The widely quoted Ibbotsen and Chen (2001) study estimates an equity risk premium in the range of 4% to 6%.
§ Long-run arithmetic historical averages of the ERP for Eurozone countries suggests a range of 5% to 10%. Averages of ERPs for 15 countries over a period of 100 years, presented by ABN AMRO and LBS (Dimson, Marsh and Staunton 2001) suggest an ERP in the upper end of the range of 6% to 7% for Eurozone and world averages.
§ We also note that there are arguments why historical evidence on the equity risk premium may overestimate the prospective equity risk premium based on factors such as exceptional high market volatility in the 20th century, unanticipated inflation and historical periods of high technological productivity that are unlikely to be repeated. There is no consensus amongst academics regarding the net effect of these factors although Dimson Marsh and Staunton’s work suggests that the net impact of these factors may be in the range of 0.6% (volatility only) to 1.5% (all factors). ERP estimates for Dimson and Marsh’s Eurozone and world averages, adjusted downwards for volatility are 6.3% and 6.1% respectively.
Overall, we conclude that Dimson, Marsh and Staunton’s analysis shows that the equity risk premium is most likely lie in the range of 5.0% to 7.0%. The lower end of this range is consistent with the lower bound of arithmetic Eurozone averages of the ERP. The centre of this range is consistent with Eurozone and world averages, adjusted for volatility as set out above. The upper end is based on an unadjusted average of estimated ERPs for the Eurozone economies reported by Dimson, Marsh and Staunton.
Of all the evidence presented we consider the LBS/ABN AMRO data on the historical equity risk premia over 1900-2000 to be the most compelling. This data source is widely recognised as the most comprehensive and consistent dataset of historical returns. It also produces estimates of
DAA WACC The Equity Risk Premium
NERA Economic Consulting 61
the ERP that are remarkably consistent across countries over a long period of time. However, we consider that other evidence is consistent with the lower end of this range: Irish and international regulatory precedent supports a range of 5.0% to 7.0%, whilst UK regulatory precedent supports a lower range of 3.5% to 5.0%. Other sources of academic evidence support a range of 4% to 8%, whilst the widely quoted Ibbotsen and Chen (2001) study estimates an equity risk premium in the range of 4% to 6%.
We conclude that 6%, the central point of the range of 5.0% to 7.0% indicated by the Dimson, Marsh and Staunton analysis is the appropriate ERP for our Eurozone reference market, taking into account regulatory precedent and other academic evidence.
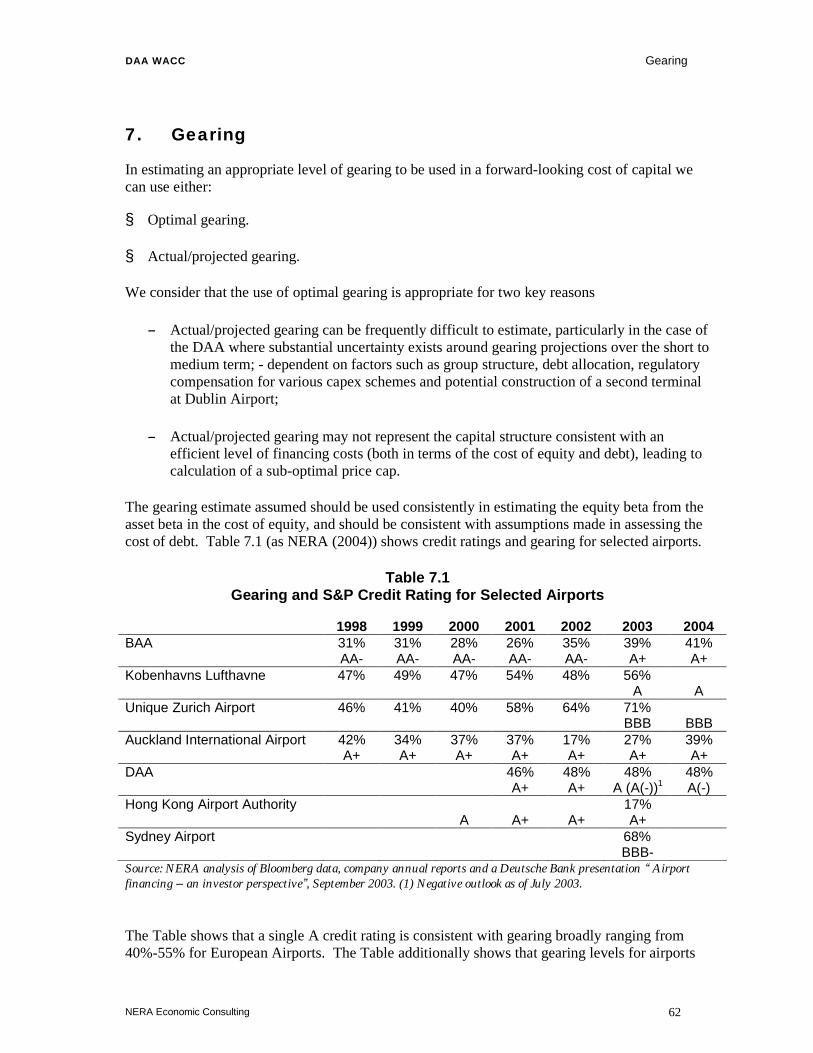
DAA WACC Gearing
NERA Economic Consulting 62
7. Gearing
In estimating an appropriate level of gearing to be used in a forward-looking cost of capital we can use either:
§ Optimal gearing.
§ Actual/projected gearing.
We consider that the use of optimal gearing is appropriate for two key reasons
– Actual/projected gearing can be frequently difficult to estimate, particularly in the case of the DAA where substantial uncertainty exists around gearing projections over the short to medium term; - dependent on factors such as group structure, debt allocation, regulatory compensation for various capex schemes and potential construction of a second terminal at Dublin Airport;
– Actual/projected gearing may not represent the capital structure consistent with an efficient level of financing costs (both in terms of the cost of equity and debt), leading to calculation of a sub-optimal price cap.
The gearing estimate assumed should be used consistently in estimating the equity beta from the asset beta in the cost of equity, and should be consistent with assumptions made in assessing the cost of debt. Table 7.1 (as NERA (2004)) shows credit ratings and gearing for selected airports.
Table 7.1 Gearing and S&P Credit Rating for Selected Airports
1998 1999 2000 2001 2002 2003 2004 BAA 31% 31% 28% 26% 35% 39% 41% AA- AA- AA- AA- AA- A+ A+ Kobenhavns Lufthavne 47% 49% 47% 54% 48% 56% A A Unique Zurich Airport 46% 41% 40% 58% 64% 71% BBB BBB Auckland International Airport 42% 34% 37% 37% 17% 27% 39% A+ A+ A+ A+ A+ A+ A+ DAA 46% 48% 48% 48% A+ A+ A (A(-))1 A(-) Hong Kong Airport Authority 17% A A+ A+ A+ Sydney Airport 68% BBB- Source: NERA analysis of Bloomberg data, company annual reports and a Deutsche Bank presentation “ Airport financing – an investor perspective”, September 2003. (1) Negative outlook as of July 2003.
The Table shows that a single A credit rating is consistent with gearing broadly ranging from 40%-55% for European Airports. The Table additionally shows that gearing levels for airports

DAA WACC Gearing
NERA Economic Consulting 63
above 60% are consistent with middle to low triple B ratings. This is supported by S&P evidence which shows that single A ratings for US utilities are unlikely at gearing levels in excess of 60%, even with a “well above average business position” (see NERA (2004)). For US utilities with an “above average” business risk profile, S&P identify a range of gearing of 53% to 57% as consistent with a triple B rating.32 Based on this evidence and that presented in the Table above a gearing level of 50% for the DAA would be commensurate with a low single A credit rating, consistent with the lower end of the range at which companies can efficiently raise finance.
32 See NERA (2004)

DAA WACC Conclusions on the Cost of Equity
NERA Economic Consulting 64
8. Conclusions on the Cost of Equity
Table 8.1 summarises NERA’s recommended values for the four key parameters of the cost of equity for the DAA, and the resulting real post-tax cost of equity, 11.4%.
Table 8.1 CAPM Cost of Equity Parameters
Calculation Parameter CAPM Estimate (a) Real Risk-Free Rate 3.0% (b) Equity Risk Premium 6.0% (c) Asset Beta 0.7 (d) Gearing 50% (e) =1/((1/(d))-1) D/E 100% (f) =(c)*(1+(e)) Equity Beta 1.4 (g) =(a)+((b)*(f)) Real Post-Tax Cost of Equity 11.4%
Source: NERA analysis

DAA WACC The Cost of Debt
NERA Economic Consulting 65
9. The Cost of Debt
The conventional regulatory approach used in estimating the cost of fixed rate debt to companies is to use the sum of the risk-free rate and the excess yield on the company’s corporate bonds over and above the benchmark risk-free rate, i.e. the company specific debt premium. In estimating the cost of debt for the DAA at the 2001 price review, the CAR (based on Kearney and Hutson (2001)) utilised this approach, estimating a debt premium of 1.1% for the DAA over a real risk-free rate of 2.6%. This translated to a total real cost of debt of 3.7%, and was primarily based on the spread of DAA’s 2011 bond (rated by Standard and Poors at A+ at the time) over the relevant German government benchmark.
The remainder of this Section is structured as follows:
§ Section 9.1 sets out NERA’s preferred methodology
§ Section 9.2 discusses the appropriate credit rating to be assumed for the DAA in estimating its forward-looking cost of debt.
§ Section 9.3 presents evidence on the cost of debt for comparator corporate bond issues.
§ Section 9.4 presents evidence on debt issuance costs.
§ Section 9.5 presents our conclusions on the cost of debt for the DAA.
9.1. NERA’s Preferred Methodology
Our preferred methodology for estimating the cost of debt for the DAA is based on the following key principles:
§ Use of total debt costs. As discussed above, the conventional regulatory approach used in estimating the cost of fixed rate debt to companies is to use the sum of the risk-free rate and the company-specific debt premium. However, as discussed in Section 4 there are a number of uncertainties involved in the estimation of the real risk-free rate, as with all cost of capital parameters. Given the uncertainties inherent in parameter estimation, we consider that the most robust methodology involves the estimation of the cost of debt for the DAA based on an analysis of the actual market or coupon costs of debt issues over a period of time.
§ Use of market cost of debt evidence for comparator bonds rated at optimal credit rating. We estimate the cost of debt for the DAA on the basis of market evidence of the costs of issuing debt at the assumed optimal credit rating. This is due to the fact that credit ratings are the key driver of the actual (coupon) cost of debt to companies and the yield to maturity on traded debt. We estimate the cost of debt on the basis of market comparator evidence in order to ensure that an estimate of the efficient benchmark market cost of debt is obtained consistent with our optimal credit rating assumption and gearing assumption.
§ Use of time series evidence. We recommend that the cost of debt, like other elements of the WACC formula, should be calculated based on long-term averages (over a business cycle, at least) of historical time series. This recommendation is based on widespread acknowledgment that interest rates are currently atypically low, both by short and long term historical standards. The use of time series evidence rather than current evidence will ensure that cost of capital estimates are not unduly sensitive to the timing of regulatory decisions
DAA WACC The Cost of Debt
NERA Economic Consulting 66
and abnormal capital market conditions. Consistent with this approach, we estimate the cost of debt for DAA on the basis of five year historical comparator evidence.
§ Use of comparator bonds with a maturity of ten years and over. We use comparator bonds with a maturity of ten years and over in order to ensure consistency with our estimate of the risk-free rate and with average asset lives observed in the airport sector.
§ Use of comparator bonds denominated in Euros and issued by Eurozone companies. Consistent with our methodology used in estimating other cost of capital parameters, we consider that the appropriate reference market for estimating the cost of debt should by the Eurozone area.
§ Use of nominal fixed coupon bonds with normal maturity structures. In order to ensure comparability between bond costs as measured by coupon costs we consider only bonds which have fixed coupons and which are redeemable only at maturity (as opposed to other types of redemption such as callable structures etc). This ensures that the effective maturity assumed by the market in pricing the bond is equal to the nominal maturity of the bond, such that comparator bonds can be accurately assessed.
9.2. Optimal Credit Rating for the DAA
As discussed above, the key driver of the cost of debt to a company is the assumed credit rating. The estimate of the forward-looking cost of debt for the DAA should therefore reflect the optimal credit rating consistent with an efficient cost of financing and with gearing assumptions.
In estimating the cost of debt our key assumption is that DAA must maintain a single A credit rating in order to be able to raise finance for its capital investment programme in all economic conditions. Key arguments for this conclusion are as follows:
§ Higher costs of BBB rated debt: Recent evidence from the debt capital markets suggests that the cost of BBB rated debt can be markedly higher (NERA (2004) presented evidence showing that a BBB+ rating attracts a 20 to 35bps premium over single A rated debt) than the cost of A rated debt.
§ Restricted availability of longer term BBB rated debt: Evidence indicates that access to longer term debt markets is limited for airport companies at ratings lower than single A – of the companies listed in Table 7.1 rated at below single A (Sydney and Zurich), neither has long term debt outstanding (Sydney Airport Finance Co Pty has raised long term finance at triple A rating by credit wrapping issues).
We therefore consider that single A is the optimal credit rating. In estimating the cost of debt for the DAA we base our analysis on the lower end of the single A rating range, consistent with our optimal gearing assumption of 50% for the DAA.
9.3. Evidence on Comparator Cost of Debt
In this Section we present evidence on the cost of debt for DAA, based on the principles set out above. Our selected comparator bond set and evidence on coupon costs is presented in Table 9.1.

DAA WACC The Cost of Debt
NERA Economic Consulting 67
Table 9.1 Eurozone Corporate Debt, Rated at A- at Issue
Name Issue Date Maturity Coupon Inflation Expected at Issuance(1)
Implied Real Coupon Cost,
%(2)
Repsol International Finance BV 05/05/2000 05/05/2010 6.0 1.8% 4.2% France Telecom SA 10/11/2000 10/11/2010 6.6 1.8% 4.8% DaimlerChrysler International Finance BV 21/03/2001 21/03/2011 7.0 1.8% 5.1% Financiere Pour la Location d'Immeubles Industriels et Commerciaux
25/04/2001 25/04/2011 5.9 1.8% 4.0%
Koninklijke Philips Electronics NV 16/05/2001 16/05/2011 6.1 1.8% 4.2% Deutsche Telekom International Finance BV 11/07/2001 11/07/2011 7.1 1.8% 5.2% GIE PSA Tresorerie 27/09/2001 27/09/2011 5.9 1.8% 4.0% GIE Suez Alliance 26/11/2002 26/11/2012 5.5 1.9% 3.5% GIE Suez Alliance 24/06/2003 24/06/2015 5.1 1.8% 3.3% GIE Suez Alliance 24/06/2003 24/06/2023 5.8 1.8% 3.9% GIE PSA Tresorerie 19/09/2003 19/09/2033 6.0 1.8% 4.1% Financiere Pour la Location d'Immeubles Industriels et Commerciaux
14/11/2003 06/01/2014 5.0 1.8% 3.2%
Elia System Operator SA/NV 13/05/2004 13/05/2014 4.8 1.9% 2.8% Elia System Operator SA/NV 13/05/2004 13/05/2019 5.3 2.0% 3.2% Saint-Gobain Nederland BV 22/06/2004 25/04/2014 5.0 1.9% 3.0% Enbw International Finance BV 09/12/2004 16/01/2025 4.9 2.0% 2.8% Average A- rated 3.8% Source for bond information: Bloomberg Source for inflation forecasts: Consensus Economics (2000:2004) Consensus Forecasts Global Outlook (1) Inflation expected at issuance calculated as average inflation expected at year of issuance over life of bond maturity (2) Implied real coupon cost calculated using Fischer equation to deflate nominal coupon: Real coupon cost, % = {(1+ nominal coupon cost, %)/(1+ expected inflation, %)}-1

DAA WACC The Cost of Debt
The Table shows that the average real implied coupon cost for comparator bonds issued at an A- rated is 3.8%.
9.4. Issuance Costs
The costs of debt finance presented in section 9.3 do not include issuance costs associated with banking, legal, trustee and paying agent fees. Corporate issues are also usually made at a discount to par to meet investors preferred tax positions (the discounted part of returns is treated as capital gain) and it is market practice to round the coupon payment to the nearest 1/8%. We understand that an extra 10-15 basis points is typically added to coupons to account for fees and discounting arrangements.
In its previous price review of Aer Rianta, the CAR did not include an allowance for transactions costs in the cost of debt, however we note that there is regulatory precedent in the Republic of Ireland, UK and other developed country regulatory regimes for this allowance:
§ In its reviews of gas transmission and distribution prices for 2003-2007 the CER allowed a cost of capital for BGE which included an issuance cost premium on the cost of debt.33
§ In its review of Mid Kent Water and Sutton and East Surrey Water, the Competition Commission (2002a, 2002b) noted that the “cost of debt should include both interest payments and fees”, although it did not disclose its estimates of the magnitude of any such costs.
§ In its Final Determinations (2004) Ofwat included debt transactions costs within its debt premium allowance.34
§ In the US the cost of debt for regulated utilities is computed according to companies’ actual interest obligations, with allowances usually made for issuance costs, including discounts, floatation costs and other fees, at the time of issue. 35
§ In Australia a number of regulatory decisions have allowed an adjustment to the cost of debt to allow for non-margin debt issuance costs. 36
33 CER (2003) “Commission’s Decision on Transmission Use of System Revenue Requirement and Tariff Structure: 1 October
2003 to 30 September 2007” and CER (2003) “Commission’s Decision on Distribution Use of System Revenue Requirement and Tariff Structure: 1 October 2003 to 30 September 2007”
34 Ofwat (2004) “Future water and sewerage charges 2005-10: Final Determinations” . Ofwat did not state explicitly the size of the allowance made for transactions costs however it is stated that the debt premium allowed includes these costs.
35 See Morin (1994) and Phillips (1993). 36 For instance, the Australian Competition and Consumer Commission (ACCC) has recently made allowances for bank fees
and dealer swap margins. For example, in its review of prices for ElectraNet, the South Australian electricity transmission network service provider, the ACCC added 10.5 bps to the benchmark cost of debt (ACCC, 2002). And in considering access arrangements for the transmission company, GasNet, the ACCC allowed 12.5bps for costs such as swap fees, dealer fees and legal fees (ACCC, 2003). Likewise, in its recent review of gas access arrangements the Essential Services Commission (ECS) in Victoria made an allowance of 5 bps to reflect the non-margin establishment costs of debt issuance (ECS, 2002).
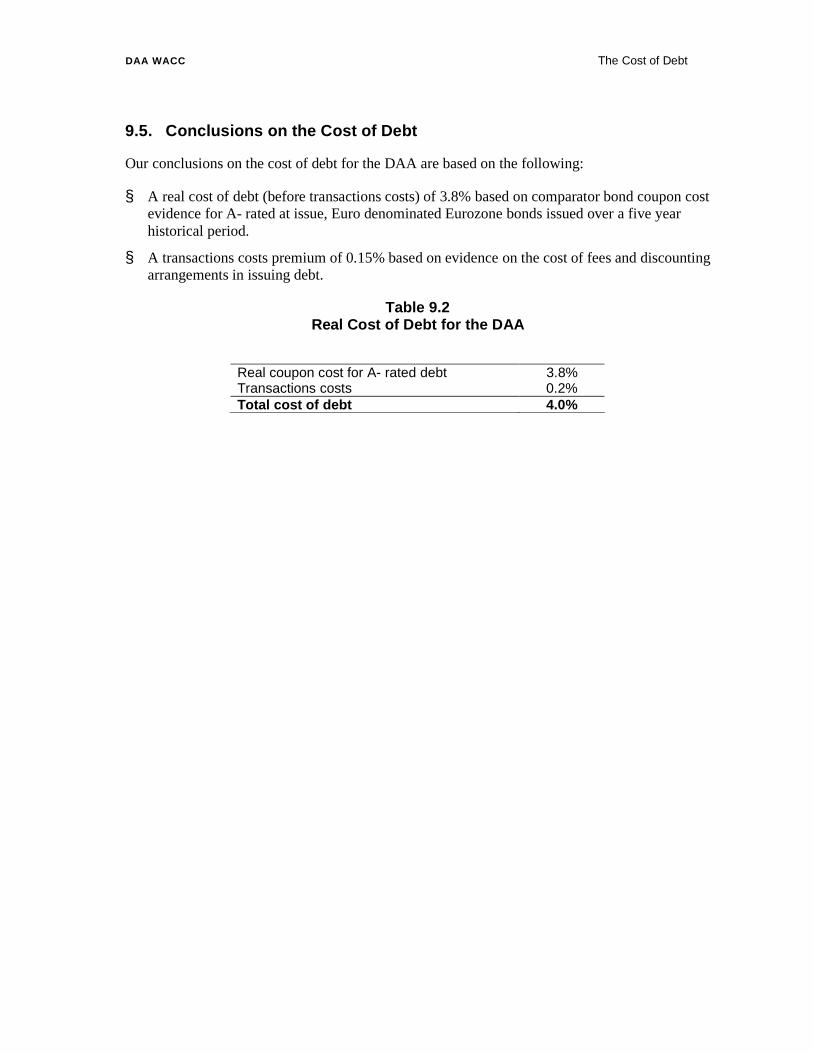
DAA WACC The Cost of Debt
9.5. Conclusions on the Cost of Debt
Our conclusions on the cost of debt for the DAA are based on the following:
§ A real cost of debt (before transactions costs) of 3.8% based on comparator bond coupon cost evidence for A- rated at issue, Euro denominated Eurozone bonds issued over a five year historical period.
§ A transactions costs premium of 0.15% based on evidence on the cost of fees and discounting arrangements in issuing debt.
Table 9.2 Real Cost of Debt for the DAA
Real coupon cost for A- rated debt 3.8% Transactions costs 0.2% Total cost of debt 4.0%

DAA WACC Summary of Parameter Estimates
10. Summary of Parameter Estimates
Table 10.1 presents our conclusions on the cost of capital for the DAA.
Table 10.1 Summary of DAA Cost of Capital Parameter Estimates
Calculation Parameter Value Gearing
(a) D/(D+E) 50% (b) =1/((1/(a))-1) D/E 100%
Tax (c) Corporate tax rate 12.5%
Cost of Equity (d) Real risk-free rate 3.0% (e) ERP 6.0% (f) Asset beta 0.7 (g) =(f)*(1+(b)) Equity beta 1.4 (h) =(d)+((e)*(g)) Post-tax return on equity 11.4%
Cost of Debt (i) Real cost of debt 4.0% (j) ={(a)*(i)*(1-(c))}+{(1-(a))*(h)} Real post-tax WACC net of debt tax shield 7.5% (k) ={(a)*(i)}+{(1-(a))*(h)/(1-(c))} Real pre-tax WACC 8.5% (l) ={(a)*(i)}+{(1-(a))*(h)} Real post-tax “Vanilla” WACC 7.7%
Our concluding best estimate of the cost of capital for the DAA is 8.5% on a real pre-tax basis and 7.5% on a real post-tax net of debt tax shield basis.

DAA WACC Appendix A
Appendix A. Components of Regulatory WACC Estimates
Table A.1 presents evidence on the components of allowed WACCs by regulators in recent decisions.

DAA WACC Appendix A
NERA Economic Consulting 72
Table A.1 Regulatory Precedents
Real RFR ERP Asset β Equity β Post-tax CoE
DP over RFR
CoD Gearing (%)1 Tax (%) Implied Real Post Tax Net of Debt Tax Shield Derived WACC (%)4
CC 2002 (BAA)3 2.63 3.5 0.68 0.9 5.78 1.05 4.13 25 30 5.06 CC 2002 (Heathrow)2 3 4 0.53 0.7 5.8 0.9 3.9 25 30 5.03 CC 2002 (Gatwick)2 3 4 0.6 0.8 6.2 0.9 3.9 25 30 5.33 CC 2002 (Stansted)2 3 4 0.6 0.8 6.2 0.9 3.9 25 30 5.33 CC 1996 (BAA) 3.65 4.5 0.56 0.8 7.25 0.55 4.2 30 16.25 6.13 CC 2002 (MA) 2.63 3.5 0.68 1 6.13 1.5 4.13 32.5 30 5.08 CC 1997 (MA) 3.65 4.5 0.64 0.9 7.7 0.8 4.45 29 30 6.37 CC Average (2002) 5.07 CAR 2001 (Aer Rianta) 2.6 6 0.47 0.93 8.18 1.1 3.7 50 13.2 5.70 Average (CC and CAR) 5.50 ACCC 1999 (Adelaide) 3.37 6 0.51 1.6 12.97 1.3 4.67 68 30 6.37 ACCC 2000 (Melbourne) 2.97 6 0.62 1.54 12.21 1.3 4.27 60 25 6.68 ACCC 2000 (Northern Territories) 3.01 6 0.65 1.62 12.73 1.3 4.31 60 30 6.90 ACCC 2000 (Perth) 3.17 6 0.62 1.55 12.47 1.3 4.47 60 30 6.87 ACCC 2001 (Sydney) 2.98 6 0.55 1.37 11.2 1 3.98 60 30 6.15 Average (ACCC) 6.59 Notes: MA = Manchester Airport, CC = Competition Commission, CAR = Commission for Aviation Regulation, BAA = British RFR = risk-free rate, ERP = equity risk premium, DP = debt premium, all numbers are in real terms (1) Gearing defined as D/(D+E) (2) CAA Submission (3) CC increased pre-tax real mid-point WACC by 0.5% to cover Terminal 5 construction funding needs, which the estimate in the table does not include (4) Implied real post-tax net of debt tax shield WACC, NERA analysis using statutory corporate tax rate Sources: CC (2002), “ A report on the economic regulation of Manchester Airport Plc” , October 2002 CC (2002), “A report on the economic regulation of the London airports companies” , October 2002 CC (1997), “A report on the economic regulation of Manchester Airport Plc” , July 1997 CC (1996), “A report on the economic regulation of the London airports companies” , June 1996 ACCC (1999), Adelaide Airport, “Decision on a proposal to pass through the price cap the costs of a Multi-User Integrated Terminal” , October 1999 ACCC (2000), Melbourne Airport, “New Investment Decision on Multi-User Domestic Terminal” , August 2000 ACCC (2000), Northern Territory Airport, “New Investment Decision” , September 2000 CCC (2000), Perth Airport, “Final Decision on proposal to increase aeronautical charges to recover the costs of necessary new investment” , April 2000 ACCC (2001), Sydney Airports Corporation Ltd., “Aeronautical pricing proposal decision”

DAA WACC Appendix B
NERA Economic Consulting 73
Appendix B. Evidence on the Risk-Free Rate
B.1. Eurozone ILGs
Table B.1 presents yield and liquidity evidence on quoted Eurozone ILGs.
Table B.1 Eurozone ILGs
Issuer Issue Date Maturity Currency 5Y bid-ask spread
5Y average yield
France 10/31/2002 7/25/2032 EUR 0.11% 2.4% France 10/1/1999 7/25/2029 EUR 0.12% 3.0% France 1/22/2004 7/25/2020 EUR 0.12% 2.0% France 11/23/2004 7/25/2015 EUR 0.12% 1.5% France 2/11/2003 7/25/2013 EUR 0.07% 2.0% France 10/31/2001 7/25/2012 EUR 0.07% 2.2% France 6/22/2004 7/25/2011 EUR 0.06% 1.4% France 9/29/1998 7/25/2009 EUR 0.06% 2.6% Italy 9/17/2003 9/15/2008 EUR 0.07% 1.2% Italy 1/31/2005 9/15/2010 EUR 0.08% 1.1% Italy 2/18/2004 9/15/2014 EUR 0.11% 1.9% Italy 10/27/2004 9/15/2035 EUR 0.12% 2.1% Austria 2/28/2003 2/28/2013 EUR 1.72% N/A Greece 3/27/2003 7/25/2025 EUR 0.12% 2.5% Source: NERA analysis of Bloomberg data
The Table shows the following:
§ Majority of issues after 2003. Of the 14 bonds shown, only four were issued prior to 2003. This is indicative of the rapid growth in the Eurozone ILG market in recent years. All four of the bonds issued before 2003 were issued by France, consistent with the French ILG market’s position as the largest and most developed in the Eurozone.
§ High liquidity for the majority of bonds. A concern voiced in the UK by the Competition Commission regarding the use of international ILGs in estimating the real risk-free rate is that lower liquidity in international markets may mean that liquidity premia exist in yields relative to the more mature UK market. This concern should also be addressed in the context of the use of international ILG yields in estimating the risk-free rate for Eurozone countries. The Table shows that, with the exception of the Austrian bond, all bonds have a five year average bid-ask spread of less than 0.12%. This is not significantly different from the five year average bid-ask spread of 0.06% observed on German nominal Government bonds, measured on the same basis. These bid-ask spreads are significantly lower than those seen in highly liquid commercial debt markets, confirming the qualitative evidence of strong liquidity in index-linked government bond markets relative to nominal markets.37As an example recent bid-ask spreads on quoted bonds issued by
37

DAA WACC Appendix B
NERA Economic Consulting 74
quoted UK WaSC water and sewerage companies bonds range from 0.43% -to 1.24%.38 The exception to this is the Austrian bond; a bid-ask spread of 1.72% is high, relative to commercial and nominal Government debt. This reflects the relatively immature status and small size of the Austrian ILG market.39
B.2. Wider European ILG evidence
Table B.2 Other European ILGs
Issuer Issue Date Maturity Currency 5Y bid-ask spread
5Y average yield
UK 7/8/1981 7/19/2006 GBP 0.03% 2.0% UK 10/19/1982 5/20/2009 GBP 0.03% 2.1% UK 1/28/1982 8/23/2011 GBP 0.03% 2.1% UK 2/21/1985 8/16/2013 GBP 0.05% 2.1% UK 1/19/1983 7/26/2016 GBP 0.06% 2.1% UK 10/12/1983 4/16/2020 GBP 0.06% 2.1% UK 12/30/1986 7/17/2024 GBP 0.06% 2.0% UK 6/16/1992 7/22/2030 GBP 0.07% 1.9% UK 7/11/2002 1/26/2035 GBP 0.12% 1.9% Sweden 4/22/1999 12/1/2028 SEK 2.09% 3.3% Sweden 12/1/1995 12/1/2020 SEK 0.10% 3.4% Sweden 5/3/1999 12/1/2015 SEK 0.11% 3.2% Sweden 4/1/1994 4/1/2014 SEK 0.16% 3.3% Sweden 12/1/1995 12/1/2008 SEK 0.11% 3.2% Source: NERA analysis of Bloomberg data
The Table shows the following:
§ Greater market maturity versus the Eurozone market. All bonds shown in the Table were issued prior to 2003, with the majority of issues occurring at least five years ago, prior to 2000. This contrasts with the relatively short period since issue (less than two years) of the majority of the Eurozone ILGs presented in Table B.1, and reflects the greater maturity of the Swedish and UK ILG markets.
§ High liquidity for the majority of bonds. As with the Eurozone bonds, we consider the liquidity of wider European ILG bonds in assessing the appropriateness of their use in estimating the real risk-free rate. The Table shows that, with the exception of the Swedish 2028 bond, all bonds have a five year bid-ask spread average of less than 0.16%, with the majority of spreads lying in the 0.03% - 0.12% range. As discussed above, this range is consistent with bid-ask spreads observed on nominal German Government bonds.
38 See NERA (2003). 39 The bid-ask spread on the Austrian bond compares with the 0.12% observed on the Greek bond. Whilst the bonds
shown in the Table indicate similar times of issuance, it should be noted that both Greece and Austria have two other bonds issued. These are not shown due to lack of quoted yields. The Greek bonds were issued in 1997, whilst the Austrian bonds were issued in 2003. This difference in market maturity may explain the differential in liquidity observed between the two quoted bonds.

DAA WACC Appendix B
NERA Economic Consulting 75
As expected, the bid-ask spreads on the UK ILGs are generally significantly lower than those observed for Eurozone and other ILG evidence (and nominal German Government bonds), reflecting the higher liquidity of the UK ILG market arising from its greater size and maturity relative to other ILG markets.
§ Downward sloping yield curve for UK ILGs. The Table shows that UK ILG yields are generally negatively correlated with maturity, in contrast to other ILG evidence which indicates an upward sloping yield curve. An upward sloping yield curve is consistent with theory which predicts that investors will demand a term premium for holding longer maturity instruments, due to the higher risk associated with less certain cashflows.40 The downward slope of the UK ILG yield curve is associated with the widely recognised downward bias to yields by institutional factors which have artificially inflated demand for UK ILGs, primarily the MFR and later the FRS17. 41 42 43
40 Whilst it should be noted that spot curves can be downward sloping when future interest rates are expected to fall
relative to current rates, due to the outweighing of the term premium effect by the expectation of lower future returns, longer period historical averages will contain yield evidence over the period of a business cycle, such that changing interest rate expectations, which are pro-cyclical, will generally have less influence on yields. Yields will therefore be more likely to demonstrate the upward sloping nature of the yield curve with respect to the term premium.
41 See for example the Bank of England: “The Minimum Funding Requirement led to strong institutional demand for ILGs. The combination of strong and rather price-insensitive demand (largely from pension funds) with limited supply has pushed real yields down, perhaps more than in the conventional gilt market. Consequently, real yields in the ILG market may not be a good guide to the real yields prevailing in the economy at large” 41 (Bank of England (1999) Quarterly Bulletin, May).
42 FRS17 refers to Financial Reporting Standard 17. This sets out the requirements for accounting for retirement benefits in company accounts and will replace SSAP24 ’Accounting for Pension Costs’ when it is fully implemented. The Debt Management Office (DMO) recently argued that the introduction of FRS17 may lead to an increase in demand for government gilts and strong corporate bonds as companies reallocate their pension portfolios from equities into gilts. The DMO cites the extreme example of Boots PLC which moved all its pension fund assets, around £2.3bn, predominantly from equities into long-dated gilts in 2001(DMO (2002) ”Annual Review 2001-02”, p11). .
43 Regulators in the UK have widely acknowledged the downward bias in UK ILG yields – see for example, Competition Commission (2003) “Vodafone, O2, Orange and T-Mobile: Reports on references under section 13 of the Telecommunications Act 1984 on the charges made by Vodafone, O2, Orange and T-Mobile for terminating calls from fixed and mobile networks”, para 7.208.

DAA WACC Appendix B
NERA Economic Consulting 76
B.3. Wider Market ILG Evidence
Table B.3 Wider Market ILGs
Issuer Issue Date Maturity Currency 5Y bid-ask spread
5Y average yield to maturity
Australia 10/14/1996 8/20/2020 AUD 0.90% 3.3% Australia 5/18/1994 8/20/2015 AUD 0.91% 3.3% Australia 2/22/1993 8/20/2010 AUD 0.94% 3.2% Australia 8/20/1985 8/20/2005 AUD 1.05% 2.9% Canada 6/9/2003 12/1/2036 CAD 0.07% 2.5% Canada 3/8/1999 12/1/2031 CAD 0.12% 3.2% Canada 12/7/1995 12/1/2026 CAD 0.12% 3.2% Canada 12/10/1991 12/1/2021 CAD 0.15% 3.2% US 10/29/2004 4/15/2010 USD 0.05% 1.1% US 1/18/2005 1/15/2015 USD 0.01% 1.7% US 7/15/2003 7/15/2013 USD 0.10% 1.8% US 1/15/2004 1/15/2014 USD 0.09% 1.8% US 7/15/2004 7/15/2014 USD 0.09% 1.7% US 7/30/2004 1/15/2025 USD 0.16% 2.1% US 7/15/2002 7/15/2012 USD 0.10% 1.9% US 2/6/1997 1/15/2007 USD 0.06% 2.0% US 1/15/2002 1/15/2012 USD 0.09% 2.1% US 10/15/2001 4/15/2032 USD 0.19% 2.6% US 1/16/2001 1/15/2011 USD 0.08% 2.3% US 1/15/1998 1/15/2008 USD 0.07% 2.2% US 4/15/1998 4/15/2028 USD 0.15% 3.0% US 1/15/1999 1/15/2009 USD 0.07% 2.4% US 4/15/1999 4/15/2029 USD 0.14% 3.0% US 1/18/2000 1/15/2010 USD 0.07% 2.5% Source: NERA analysis of Bloomberg data.
The Table shows the following:
§ Greater market maturity versus the Eurozone market but lower maturity versus the wider European market (UK and Sweden). The Table shows that the Australian and Canadian ILG markets are significantly more mature than the Eurozone markets and the US markets, with issuance in these markets as early as 1991 (Canada) and 1993 (Australia). The US market is a slightly younger, with the first issue in 1997 consistent with the first French issue in 1998.
§ Liquidity is low for Australian ILGs. The five year average bid-ask spreads observed for the Australian bonds are significantly higher, at over 0.9%, than the range of 0.03% - 0.15% generally observed for Eurozone, wider European, Canadian and US ILGs. This is likely to reflect significantly lower liquidity in the Australian market, and may partially explain the higher yields observed for the Australian ILGs vis-à-vis comparable maturity US and Canadian bonds. Due to the low liquidity of Australian ILGs indicated by the high bid-ask spreads, we consider that the yields on these bonds may include significant

DAA WACC Appendix B
NERA Economic Consulting 77
liquidity premia and we therefore exclude them from wider market evidence used in assessing the risk-free rate.
§ Low yields on US ILGs vs other markets. The Table shows that US ILG yields vis-à-vis comparable maturity and liquidity bonds in other markets are relatively low. This has been attributed by some commentators to the restriction in supply of ILGs (known as TIPS in the US) at longer maturities – the Treasury announced its intention to cease the issuance of 30 year TIPs in October 2001.44 Whilst we recognise that supply pressures may downwardly impact on long term US TIP yields, we do not believe it appropriate to exclude US evidence on the basis that i) the influence of reduced supply is likely to have only been felt over the recent couple of years and therefore not the whole of the five year historical period of our preferred five year average and ii) the extent of the impact of reduced supply vis-à-vis other “natural” influences that reflect underlying movements in the risk-free rate (such as increased demand from pension funds arising from demographic factors) cannot be robustly ascertained.
44 The first TIP with a maturity greater than ten years issued since 2001was issued in July 2004.

DAA WACC Appendix C
NERA Economic Consulting 78
Appendix C. Comparator Information Details
C.1. Capex/Opex
Source for capex/opex calculations: Annual Reports for 2004 unless otherwise noted. Calculation of ratio as follows:
§ AIA: capital expenditure/total operating expenses (excluding depreciation and amortisation)
§ BAA: capital expenditure/operating costs (minus depreciation and amortisation, source: notes to the accounts)
§ MAG: purchase of tangible fixed assets + additions to fixed assets investments (cash-flow, not net)/total operating costs (excluding depreciation and amortisation, source: notes to the accounts, operating costs exclude restructuring costs in 2003)
§ VIE: additions to property, plant and equipment/(personnel costs + other operating costs) (notes to income statement, excluding depreciation and amortisation)
§ CPH: Net payments for intangible assets and property, plant and equipment/(external costs + staff costs) (excluding depreciation and amortisation, source: notes to the accounts)
§ FRA: Capital expenditures for property, plant, equipment/(total operating expenses) (excluding depreciation and amortisation)
§ ADR: Cashflow from (for) investing activities: investments in tangible fixed assets/total operating costs.

DAA WACC Appendix D
NERA Economic Consulting 79
Appendix D. Equity and Asset Beta Estimates
Table D.1 Equity and Asset Beta Estimates for Selected Comparators
Measurement period Equity beta over period (a)1
D/E over period (b)2
Asset beta (=(a)/(1+(b))
BAA 1Y Feb 04 - Feb 05 0.72 0.6636 0.43 2Y Feb 03 - Feb 05 0.68 0.6377 0.42 5Y Feb 00 - Feb 05 0.80 0.4889 0.53 10Y Feb 95 - Feb 05 0.76 0.3723 0.55 10Y Feb 95 - Feb 05 excluding Feb 99 – Feb 02 0.85 0.3796 0.62 15Y Feb 90 - Feb 05 excluding Feb 99 – Feb 02 0.87 0.3413 0.65 Vienna 1Y Feb 04 - Feb 05 1.04 0.0000 1.04 2Y Feb 03 - Feb 05 0.74 0.0017 0.74 5Y Feb 00 - Feb 05 0.51 0.0031 0.51 10Y Feb 95 - Feb 05 0.61 0.0023 0.61 10Y Feb 95 - Feb 05 excluding Feb 99 – Feb 02 0.64 0.0025 0.64 13Y Jun 92 - Feb 05 excluding Feb 99 – Feb 02 0.64 0.0044 0.63 Rome 4Y 1997-2001 0.72 0.0014 0.71 4Y 1997-Feb 1999 0.98 0.0014 0.98
(1) Equity betas calculated using weekly (average price) data against DJ Stoxx European Index for Vienna and Rome and FTSE All-Share Index for BAA. Raw equity betas adjusted using formula set out in Section 5.2.3. (2) Debt to market capitalisation as reported by Bloomberg. D/E assumed 0 for 1997 for Rome based on 0.0022 reported for 1998 and evidence indicating no significant debt outstanding.

DAA WACC Appendix D
NERA Economic Consulting 80
Bibliography
ACCC (2002) “South Australian Transmission Network Revenue Cap 2003-2007/08: Decision” , 11 December 2002
ACCC (2003) “GasNet Australia: Access Arrangement Revisions: Final Approval” , 17 January 2003.
ACI (2003) “Airport charges in Europe”
Bank of England (1999) “Quarterly Bulletin” , May
Bel & Fageda (2004) “Airport Management and Airline Competition in OCDE Countries” .
Bowman (2001) “Estimating Market Risk Premium: the Difficulty with Historical Evidence and an alternative Approach”, JASSA, Issue 3, Spring 2001, p10-13
Brealey and Myers (1996) “Principles of Corporate Finance”, 5th edition, McGraw-Hill
Commission for Energy Regulation (CER) (2000) “ESB Power Generation Price Review Final Proposals”
Commission for Energy Regulation (CER) (2002) “Best New Entrant Price 2002: Decision”
Commission for Energy Regulation (CER) (2003) “Decision on Distribution (and Transmission) Use of System Revenue Requirement and Tariff Structure” (Aug (and Jul) 2003)
Commission for Energy Regulation (CER) (2003) “Best New Entrant Price 2005 Decision and Response Paper”
Commission for Aviation Regulation (2004), Commission Paper CP9/2004 “Commission for Aviation Regulation’s conclusions on the impact of the amendments to the Aviation Regulation Act, 2001, on the regulation of maximum levels of airport charges in Ireland” .
Commission for Aviation Regulation (2004): “Commission Paper CP2/2004 “Review of Determination on Maximum Levels of Airport Charges and Report”
Commission for Aviation Regulation (2001) “Determination in respect of the maximum levels of airport charges that may be levied by an airport authority in respect of Dublin, Shannon and Cork airports in accordance with section 32 of the aviation regulation act, 2001”
Competition Commission (1998) “Cellnet and Vodafone: Reports on References under Section 13 of the Telecommunications Act 1984 on the Charges Made by Cellnet and Vodafone for Terminating Calls from Fixed-line Networks”
Competition Commission (2000a) “Mid-Kent Water Plc: A Report on the References under Sections 12 and 14 of the Water Industry Act 1991”

DAA WACC Appendix D
NERA Economic Consulting 81
Competition Commission (2000b) “Sutton and East Surrey Water Plc: A Report on the References under Sections 12 and 14 of the Water Industry Act 1991”
Competition Commission (2002a) “BAA Plc: A report on the economic regulation of the London airports companies (Heathrow Airport Ltd, Gatwick Airport Ltd and Stansted Airport Ltd)”
Competition Commission (2002b) “Manchester Airport Plc: A report on the economic regulation of Manchester Airport Plc”
Competition Commission (2003) “Reports on references under Section 13 of the Telecommunications Act 1984 on the charges made by Vodafone, O2, Orange and T-Mobile for terminating calls from fixed and mobile networks”
Conine, T and M Tamarkin (1985) “ Implications of Skewness in Returns for Utilities”, Financial Management, Spring 1985, pp.54
Consensus Economics (2000:2004) “Consensus Forecasts Global Outlook”: 2000, 2001, 2002, 2003, 2004
Cooper and Currie (1999) “The Cost of Capital for the UK Water Sector”, London Business School Regulation Initiative Discussion Paper Series, No. 28
Cornell, B (1999) “Equity Risk Premium: The Long Run Future of the Stock Market” John Wiley and Sons Inc.
DMO (2002) “Annual Review 2001-02”
Dimson, Marsh and Staunton (2000) “Risk and Return in the 20th and 21st Centuries”, Business Strategy Review 2000, Volume 11 Issue 2, pp1-18.
Essential Services Commission (2002) “Review of Gas Access Arrangements: Final Decision” , Victoria, October 2002
Fama and French (2001) “The Equity Premium”, The Journal of Finance, Vol 57(2), p637-659
Franks (2001) “Submission to Oftel” (2001) Regulatory Price Review
Franks and Mayer (2001) “BAA – The Cost of Capital”, 4 December 2001, Annex 3 in BAA (2001) “BAA Response (December 2001) to CAA Preliminary Proposals (November 2001)” , December.
Ibbotson and Chen (2001) “The Supply of Stock Market Returns”, Yale International Centre for Finance working Paper, June 2001
Kearney and Hutson (2001) “APPENDIX VI TO CP8 Aer Rianta’s Cost of Capital Report by Professor Colm Kearney and Elaine Hutson”

DAA WACC Appendix D
NERA Economic Consulting 82
Kolbe, L, S C Myers and W B Tye (1993) “Regulatory Risk: Economic Principles and Applications to Natural Gas Pipelines and Other Industries” , Kluwer
LBS / ABN AMRO “Millennium Book II, 101 years of investment returns”
Morin (1994) “Regulatory Finance: Utilities Cost of Capital”, Public Utilities Reports, Inc, Arlington, Virginia
NERA (2004) “Review of Implications of the De-Merger of the former Aer Rianta for the Regulation of Airport Charges in Ireland” , A Report for Dublin Airport Authority, prepared by NERA, October 2004, London
ODTR (2003) “Review of the Price Cap on Certain Telecommunications Services: Decision Notice”
Ofcom (2004) “Statement on Wholesale Mobile Voice Call Termination”
Ofgem (2002) “Independent Gas Transporter Charges and Cost of Capital”
Ofgem (2003) “The Regulation of Independent Gas Transporter Charging: Final Proposals”
Ofgem (2004) “Electricity Distribution Price Control Review: Final Proposals”
Oftel (2001) “Proposals for Network Charge and Retail Price Controls from 2001”
Ofwat (2004) “Future water and sewerage charges 2005-10: Final determinations”
Ofwat (1996): “RP5”
Phillips, Charles F. Jr (1993) “The Regulation of Public Utilities: Theory and Practice”, 3rd Edition, Public Utilities Reports Inc, Arlington, Virginia
Standard and Poors (20th October 2004) “Summary: Dublin Airport Authority PLC”
UK Debt Management Office (2005): various on-line statistics

NERA Economic Consulting 15 Stratford Place London W1C 1BE United Kingdom Tel: +44 20 7659 8500 Fax: +44 20 7659 8501 www.nera.com