the cost of alcohol and drug abuse in maine, 2010 · the cost of alcohol and drug abuse in maine,...
TRANSCRIPT

The Cost of
Alcohol and Drug Abuse
in
Maine, 2010
April 2013


Prepared for: Office of Substance Abuse and Mental Health Services Department of Health and Human Services Anne L. Rogers, Maine Office of Substance Abuse and Mental Health Services Marcella H. Sorg, Margaret Chase Smith Policy Center, University of Maine Jamie A. Wren, Margaret Chase Smith Policy Center, University of Maine For more information, contact:
Maine Office of Substance Abuse and Mental Health Services
Information & Resource Center #11 State House Station
Augusta, ME 04333-0011 Web: http://www.maine.gov/dhhs/samhs/osa/
Email: [email protected] 1-800-499-0027 or (207)287-8900
TTY: 711 (Maine Relay)
TABLE OF CONTENTS
List of Tables ....................................................................................................................... iii List of Figures ........................................................................................................................ v Executive Summary ............................................................................................................... 1 Chapter 1: Introduction .......................................................................................................... 6 Introduction and Background ....................................................................... 6 Methodology .................................................................................................. 6 Limitations ..................................................................................................... 7 Organization ................................................................................................... 8 Chapter 2: Substance Abuse Treatment ................................................................................. 9 Major Findings ...............................................................................................10 Methodology ..................................................................................................10 Results ............................................................................................................11 Summary and Implications ............................................................................14 Chapter 3: Morbidity..............................................................................................................16 Major Findings ...............................................................................................16 Methodology ..................................................................................................17 Results ............................................................................................................17 Summary ........................................................................................................21 Chapter 4: Mortality ...............................................................................................................22 Major Findings ...............................................................................................22 Methodology ..................................................................................................23 Results ............................................................................................................24 Summary ........................................................................................................26 Chapter 5: Crime ....................................................................................................................32 Major Findings ...............................................................................................32 Methodology ..................................................................................................33 Results ............................................................................................................34 Law Enforcement ......................................................................................34 Police Protection ..................................................................................34 Drug Control ........................................................................................36 Judicial ......................................................................................................38 Corrections ................................................................................................39 State Corrections ..................................................................................40 County Corrections ..............................................................................41 Other Societal Costs ..................................................................................43 Productivity Losses Due to Incarceration ............................................44
i
Property Destruction ............................................................................45 Criminal Victimization ........................................................................46 Summary ........................................................................................................48 Chapter 6: Medical Care ........................................................................................................50 Major Findings ...............................................................................................50 Methodology ..................................................................................................51 Results ............................................................................................................51 Summary ........................................................................................................57 Chapter 7: Other Related Costs..............................................................................................58 Major Findings ...............................................................................................58 Methodology ..................................................................................................58 Results ............................................................................................................59 Child Welfare ............................................................................................59 Social Welfare Administration .................................................................59 Fire Destruction ........................................................................................61 Motor Vehicle Crashes (Non-Medical) ....................................................62 Summary ........................................................................................................63 Chapter 8: Summary ..............................................................................................................64 Major Findings ...............................................................................................64 Overview ........................................................................................................56 Conclusions ....................................................................................................59 References ......................................................................................................60 Appendices A. Calculation of Estimated Morbidity Costs, 2010 B.1 ICD-9 Codes and Alcohol Attributable Fractions for Alcohol-Related Injuries and Associated Hospital Inpatient Charges, Maine, 2010 B.2 ICD-9 Codes and Alcohol Attributable Fractions for Alcohol-Related Injuries and Associated Hospital Outpatient Charges, Maine, 2010 C. Estimated Costs of Alcohol Related Motor Vehicle Crashes, Maine, 2010 D. Data Sources for this Report
LIST OF TABLES & FIGURES
Table Page 2.1 Treatment funding by payer, Maine, 2010.................................................................11
2.2 DEEP Funding, Maine, 2010 .....................................................................................11
2.3 Number of admissions for treatment by type of disorder, Maine, 2010 ....................12
2.4 Number of clients receiving treatment by type of disorder, Maine, 2010 .................12
2.5 Admissions for treatment by race, Maine, 2010 ........................................................13
2.6 Admissions for treatment by age, Maine, 2010 .........................................................13
3.1 Estimated number of adults with abuse or dependence, by gender and age,
Maine, 2006-2009 ......................................................................................................18
3.2 Estimated number of adults with abuse or dependence, by gender, age, and employment
status, Maine, 2010 ....................................................................................................19
3.3 Morbidity costs, Maine, 2010 ....................................................................................23
4.1 Number of alcohol- and drug-related deaths by age and gender, Maine, 2010 .........24
4.2 Deaths attributable to alcohol by diagnosis and gender, Maine, 2010 ......................27
4.3 Deaths attributable to drugs, Maine, 2010 .................................................................29
4.4 Estimated mortality costs and years of potential life lost, Maine, 2010 ....................30
5.1 Attributable fractions .................................................................................................34
5.2 Estimated cost of police protection, Maine, 2010......................................................35
5.3 Drug Control Expenditures, Maine, 2010 ..................................................................36
5.4 Substance Control Expenditures, Maine, 2010 ..........................................................37
5.5 Legal and adjudication costs, Maine, 2010 ................................................................38
5.6 Estimated cost of state corrections, Maine, 2010 ......................................................40
5.7 Estimated cost of county corrections, Maine, 2010 ...................................................42
5.8 Estimated productivity losses due to incarceration, Maine, 2010 .............................45
5.9 Property destruction due to crime, Maine, 2010 ........................................................46
5.10 Estimated productivity losses for victims of crime, Maine, 2010 .............................47
5.11 Summary of crime costs, Maine, 2010 ......................................................................48
6.1a Estimated alcohol-related hospital inpatient direct costs, Maine, 2010.....................53
iii

List of Tables & Figures (continued)
6.1b Estimated drug-related hospital inpatient direct costs, Maine, 2010 .........................54
6.2a Estimated alcohol-related hospital outpatient charges, Maine, 2010 ........................55
6.2b Estimated drug-related hospital outpatient charges, Maine, 2010 .............................56
6.2c Total estimated hospital inpatient/outpatient charges, Maine, 2010..........................57
6.3 Other medical costs due to alcohol, Maine, 2010 ......................................................58
7.1 Estimated administrative costs of selected social welfare programs attributed
to substance abuse, Maine, 2010 ................................................................................61
7.2 Estimated alcohol-related cost of fire protection and property damage
and destruction due to fire, Maine, 2010 ...................................................................62
7.3 Estimated non-medical cost of alcohol-related motor vehicle crashes,
Maine, 2010 ...............................................................................................................64
8.1 Summary: Estimated cost of alcohol and drug abuse by category, Maine, 2010 ......66
Figure Page
2.1 2010 Public Funds Spent on Treatment ......................................................................14
2.2 2010 Private Funds Spent on Treatment .....................................................................15
4.1 Percent of alcohol and drug deaths by age group, 2010 ............................................26
8.1 Comparison of costs, 2000, 2005, & 2010.................................................................67
8.2 Distribution of substance abuse costs, Maine, 2010 ..................................................68

The Cost of Alcohol and Drug Abuse in Maine: 2010 Executive Summary
Published by the Maine Office of Substance Abuse and Mental Health Services, April 2013
Summary findings
• In 2010, the total estimated cost of substance abuse in Maine was $1.403 billion.
• This $1.403 billion translates into a cost equaling $1,057 for every resident of Maine.
• This was a 56.2% increase from 2005.
• Substance abuse treatment ($47.0 million) comprised the smallest proportion of total
cost (3.4%), while mortality, $409.6 million, comprised the largest proportion of costs
(24.8%).
Substance abuse treatment
Treatment services available in Maine to help persons with substance use disorders
include various levels of residential programs, outpatient programs, medication assisted
treatment, detoxification, and specialty programs for youth, pregnant women, and persons who
are diagnosed with both mental health and substance use disorders.
Summary findings:
• The total estimated cost of providing treatment and intervention in Maine in 2010,
based on reported annual revenue in the Treatment Data System (TDS), was $47.0
million, $45.6 million of which was spent on admissions for treatment, shelter, and
detoxification.
• Of the $45.6 million; 79% is from public funds (state and federal) 21% from private
funding sources. Of public funds, 53% is from Federal Medicaid and 16% is from
other Federal grants. Of private funds, 74% is from client payments and 26% is from
private insurance.
1

• An additional $1.4 million was spent on Driver Education and Evaluation Program
(DEEP), which was covered fully by client payments.
• Approximately 16,818 admissions for drug and/or alcohol related treatment was
reported during 2010, representing 14,996 distinct individuals.
• It is estimated that more than 10% of 18-24 year olds in Maine meet the criteria for
drug abuse or dependence.
Morbidity
Alcohol and drug abuse or dependence may adversely affect an individual’s work
productivity as well as his or her ability to function in other roles. Examples of reduced work
productivity would include a worker calling in sick or working while hung-over from heavy
drinking the night before, using drugs or alcohol on the job, or leaving work early to use drugs
and consume alcohol. An individual’s productivity in other non-work roles may also be affected
by alcohol or drug use, e.g. performing household or child-care duties. In all these cases, reduced
output resulting from alcohol or drug use can be measured as an economic loss. It is often
assumed, incorrectly, that the affected worker or individual incurs all of the costs for his or her
behavior. However, productivity loss due to alcohol and drug abuse or dependence creates an
economic loss borne by society at large.
Summary findings:
• Total estimated morbidity costs in 2010 due to alcohol or drug abuse was $188.6
million.
• Males accounted for 66.9% of total costs.
• Males aged 45-64 accounted for the largest portion of alcohol morbidity costs.
Mortality
A major economic loss is imposed on society by premature death from substance use and
abuse. Premature death through illness or injury can occur through auto and other accidents
2

involving alcohol, through liver diseases such as hepatitis and cirrhosis, through increasing the
risk of cancer or cerebrovascular disease, and through violence involving drugs or alcohol. When
an individual dies prematurely, there is an economic cost to society in the form of the loss of that
individual’s productive capacity.
Summary findings:
• 713 deaths related to drug and alcohol abuse occurred in 2010, (538 alcohol-related and
175 drug-related deaths), resulting in 15,896 years of potential life lost.
• Major causes of death were:
a. cancer (various types) – 132 deaths
b. accidental drug poisoning – 128 deaths
c. cirrhosis and liver damage – 102 deaths
d. motor vehicle accidents – 66 deaths
e. drug-induced suicide - 52 deaths
• Total mortality costs for 2010 were $409.6 million. Of this amount, $240.9 million
resulted from alcohol abuse and $168.7 million from drug abuse.
• The average cost per death in 2010, measured in lost earnings, was $574,534.
Crime
Recent surveys of incarcerated populations provide evidence of the strong link between
crime and substance abuse. In 2004, one in four federal inmates (26%) and one in three state
inmates (32%) reported that they were under the influence of alcohol or illicit drugs at the time
of their current offense. Fifty-three percent (53%) of State and 45% of Federal prisoners met the
diagnostic criteria for drug dependence or abuse (US Department of Justice, 2006).
Summary findings:
• Of 19 arrests for homicide in 2010, an estimated 6 were related to alcohol and 3 to drug
abuse.
3
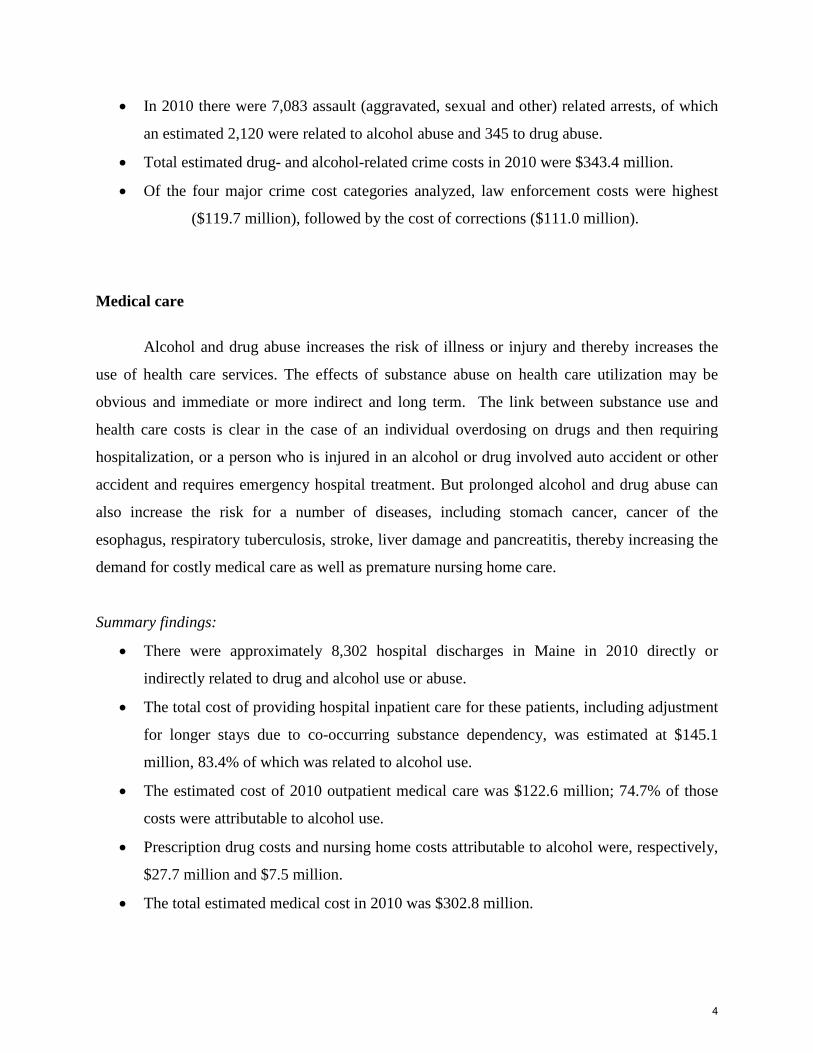
• In 2010 there were 7,083 assault (aggravated, sexual and other) related arrests, of which
an estimated 2,120 were related to alcohol abuse and 345 to drug abuse.
• Total estimated drug- and alcohol-related crime costs in 2010 were $343.4 million.
• Of the four major crime cost categories analyzed, law enforcement costs were highest
($119.7 million), followed by the cost of corrections ($111.0 million).
Medical care
Alcohol and drug abuse increases the risk of illness or injury and thereby increases the
use of health care services. The effects of substance abuse on health care utilization may be
obvious and immediate or more indirect and long term. The link between substance use and
health care costs is clear in the case of an individual overdosing on drugs and then requiring
hospitalization, or a person who is injured in an alcohol or drug involved auto accident or other
accident and requires emergency hospital treatment. But prolonged alcohol and drug abuse can
also increase the risk for a number of diseases, including stomach cancer, cancer of the
esophagus, respiratory tuberculosis, stroke, liver damage and pancreatitis, thereby increasing the
demand for costly medical care as well as premature nursing home care.
Summary findings:
• There were approximately 8,302 hospital discharges in Maine in 2010 directly or
indirectly related to drug and alcohol use or abuse.
• The total cost of providing hospital inpatient care for these patients, including adjustment
for longer stays due to co-occurring substance dependency, was estimated at $145.1
million, 83.4% of which was related to alcohol use.
• The estimated cost of 2010 outpatient medical care was $122.6 million; 74.7% of those
costs were attributable to alcohol use.
• Prescription drug costs and nursing home costs attributable to alcohol were, respectively,
$27.7 million and $7.5 million.
• The total estimated medical cost in 2010 was $302.8 million.
4

Other related costs Substance use and abuse impacts a number of areas not included in the previous sections: These
include child welfare and the administration of other social welfare programs, fire protection and
the destruction caused by fire, and the non-medical costs of motor vehicle accidents.
Summary findings:
• An estimated $45.9 million in child welfare costs related to substance abuse was spent in
Maine during 2010.
• An estimated $3.5 million was spent on the administration of other social welfare programs
related to drug and alcohol abuse in Maine during 2010.
• Alcohol is plays a role in many fires. In 2010, the estimated cost of these alcohol related
fires in Maine was $9.5 million.
• The cost of alcohol-related motor vehicle crashes in Maine in 2010 is estimated at $53.1
million.
• The combined cost of all three cost categories was $111.9 million
5

Chapter 1
Introduction
Introduction and Background
This report uses nationally accepted practices in an attempt to quantify, in monetary
terms, the consequences of alcohol and drug abuse for the State of Maine. The problem of
alcohol and drug abuse continues to be a major social concern, with serious personal, social and
economic consequences. Alcohol and drug abuse cause illness, disability and premature death.
The burden on society includes the use of costly health care resources, significant productivity
(economic) losses due to morbidity, serious injuries from accidents, and criminal activity
resulting in property damage and incarceration. Earlier reports sponsored by the Office of
Substance Abuse estimated the cost of substance abuse as $485 per Maine citizen in 2000, and
$682 per Maine citizen in 2005. The current report provides an update using 2010 data; it
estimates a total of $1,040 costs per person.
Methodology
This study used the following to estimate costs: 1) review of the literature on updated
substance related cost estimates (in particular, proportions and attributable fractions); and 2)
review of the 2005 study to align as close as possible to prior methodology to allow comparison.
In general this study follows “Cost of Illness” guidelines focusing on tangible costs. Prevalence-
based cost estimation studies measure how many cases there are of a disorder or consequence
over a period of time, the costs or value of the resources used to treat the disorder, and the lost
productivity during a specified period of time. For the current study, the base period is calendar
year 2010. The population of interest resides in the State of Maine, estimated as 1,328,361
persons in 2010 (US Census Bureau, 2010).
Cost of illness studies require a monetary value to be placed on human life. This study
uses the same approach in determining a life value as was done in the 2005 report: the human
capital approach, which measures an individual’s value to society in terms of his or her
production potential, reflected in earnings. Using this perspective, the value of an individual to
6

society is his or her earnings, and the value of a life lost due to premature death is calculated as
the missed future earnings of that individual.
Studies using the human capital approach measure both the direct and indirect costs of
specific disease categories. Direct costs are those for which payments are made (e.g., medical
care or alcohol treatment); indirect costs are those for which resources are lost (e.g., lost
productivity due to morbidity or mortality). Using this approach the estimation of direct costs is
straightforward; but indirect costs are more difficult to analyze because they require a value
based upon a person’s earnings and production potential. This may undervalue certain members
of society: children, elderly, people with disabilities, ethnic minorities and women. Despite its
limitations, the human capital approach remains widely used and provides a useful method for
analyzing the cost of disease.
Limitations
This analysis has several limitations that merit mention. First, any cost estimation study
may miss certain costs. It’s important to remember that this report provides a conservative
estimate of the costs of substance abuse to Maine, but does not capture all of the associated
economic costs.
Second, to estimate costs related to drug and alcohol abuse, the analyses often had to
assign a portion of total costs to substance abuse. Prior studies have developed these
“attributable fractions” based upon research and surveys conducted that can be used to estimate
the portion of total costs that can reasonably be attributed to alcohol or drug use (US DOJ/NDIC,
2011; The Lewin Group, 2010; NIDA/NIAAA, 1998). For example, if research shows that
alcohol abuse contributes to approximately 30% of all stomach cancers, then only 30% of
medical costs incurred in treating stomach cancer should be attributable to alcohol abuse. The
attributable fractions used here are the same as those used for a national cost analysis (US
DOJ/NDIC, 2011; The Lewin Group, 2010; NIDA/NIAAA, 1998; Brucker, 2007). Some of the
attributable fractions we will be using in this report were originally developed from research
conducted as much as 25 years ago.
Third, though an effort was made to replicate the study completed on year 2005 data,
slight differences in data sources, revisions in attributable fractions, and changes in methodology
7

arose. Differences are noted where applicable. Comparisons between this report and the previous
report should therefore be made with caution.
In addition, although efforts were made to obtain Maine data for the year 2010, this was
not always possible. In certain cases, national data were used to provide estimates for Maine and
were adjusted for inflation or cost of living differences to provide estimates for 2010.
Organization
The report is organized into eight chapters. Chapters two through seven present cost
estimates for each of the six cost areas analyzed: substance abuse treatment, morbidity, mortality,
crime, medical care, and other related costs. The final chapter summarizes the findings of the
analyses and outlines some policy implications.
8

Chapter 2
Substance Abuse Treatment
This chapter documents treatment costs in Maine for 2010 and also presents information
concerning service utilization. Complete and detailed information regarding treatment costs is
difficult to obtain because of the multiplicity of funding sources and the large number of
programs. The best source of current information on treatment cost is the Treatment Data
System (TDS) maintained by the Maine Office of Substance Abuse (as of September 2012, the
Office became the Office of Substance Abuse and Mental Health Services). The service
utilization data presented in this chapter are from the TDS.
The following substance abuse treatment services were available in Maine, and those
costs are included in the report: residential, outpatient, intensive outpatient, medication assisted
therapy, detoxification, shelter, and specialty programs for youth, pregnant women, and persons
who have co-occurring mental health and substance use disorders.
The major findings of the analysis were:
• The total estimated cost of providing treatment in Maine in 2010, based on reported
annual revenue, was $47.0 million, of which $45.6 million is for admissions for
treatment, shelter and detoxification, and another $1.3 million is for OUI intervention
(DEEP).
• Of the $45.6 million for admissions for treatment, shelter and detoxification, $36.1
million (79.1%) is from public funds and $9.5 million (20.9%) is from private funds.
• Of public funds, 53.9% is from Medicaid Federal portion; 9.2% is from the federal
Substance Abuse Prevention and Treatment Block Grant; 15.8% is from other federal,
state and local funds; 18.3% is from MaineCare State portion.
• Of private funds, 69.1% is from Client payments; 30.7% is from Private Insurance.
• $1.4 million were spent on DEEP services in 2010, serving approximately 5,500 in-
state clients.
• Approximately 16,818 admissions to drug and/or alcohol related treatment services,
representing 14,996 distinct individuals, were reported during 2010.
9

Methodology
Cost estimates in this chapter were based on discharge data extracted from the Treatment
Data System, 2012 (TDS). The data included payer source, number of clients, and the number of
units times the cost per unit (see table 2.1). The data in the TDS system are collected from
approximately 90% of the treatment facilities located throughout the State. The proportion of
clients whose data are included in TDS is even higher than 90% because most of the facilities
that are not required to report or do not report tend to be small. While all licensed treatment
facilities in Maine are required to report to TDS, there were still a few in Maine who had not
begun reporting. Primary care providers treating patients in provider’s offices do not report to
TDS. Therefore the admission counts given are considered to be an underestimate of the total
number of persons treated for substance abuse in Maine.
In addition to costs associated with those admitted to treatment, shelter or detoxification,
the State conducts an intervention program for those who receive an arrest for OUI (Operating
Under the Influence), called the Driver Education and Evaluation Program (DEEP). Cost data on
DEEP was extracted from the Maine Department of Administrative and Financial
services 1financial database. These include all costs: administration in the completion of
treatment; Under 21 program; and PRIME FOR LIFE program. Non client administration and
out-of-state/military administration were not included in this total. DEEP funding is shown in
table 2.2. DEEP is considered a revenue neutral program, where all costs of the program are
covered by fees paid by DEEP clients. The fees go into the State General Fund, from which a
portion is then returned to the Office of Substance Abuse to pay for program administration.
Results
Major sources of treatment funding are shown in Tables 2.1 and 2.2. Treatment, shelter,
and detoxification costs totaled approximately $45.6 million, 79.1% of which was from public
funds (state and federal). The single largest payer source was Medicaid/MaineCare and
Medicare, which accounted for 59.3% of all treatment funding. The second largest source was
state and federal government funds (including general and local funds, and federal grant funds),
which accounted for 19.8%. The third largest source was client payments, accounting for 14.4%
1 These figures do not include the costs associated with treatment by private physicians prescribing buprenorphine (Suboxone and subutex).
10

of all funding. DEEP funding adds an additional $1.4 million for a total of $47.0 million for
intervention and treatment.
Table 2.1
Treatment funding by payer Maine, 20102
Public 2010 % Total Attrib. Alc
22.2% Attrib. Drug
28.88% Attrib. Alc &
Drug 49% OSA $3,248,277 7.1% $721,117 $938,102 $1,591,656 Medicaid Fed $19,459,027 42.7% $4,319,904 $5,619,767 $9,534,923 Medicaid State $6,590,541 14.4% $1,463,100 $1,903,348 $3,229,365 Medicare $1,014,229 2.2% $225,159 $292,909 $496,972 SA BG $3,307,877 7.3% $734,349 $955,315 $1,620,860 Other $2,461,790 5.4% $546,517 $710,965 $1,206,277
Total Public $36,081,741 79.1% $8,010,147 $10,420,407 $17,680,053 Private
Client Payment $6,589,056 14.4% $1,462,770 $1,902,919 $3,228,637 Private Insurance $2,928,691 6.4% $650,169 $845,806 $1,435,059 Other Funding $11,591 0.0% $2,573 $3,347 $ 5,679
Total Private $9,529,337.15 20.9% $2,115,513 $ 2,752,073 $ 4,669,375 TOTAL 2010 $45,611,078.26 Source: SAMHS/TDS
Table 2.2 DEEP funding
Maine, 2010
DEEP 2010 DEEP – Self-Pay to General Fund $ 1,364,822
Source: Maine DHHS Financial database
Data gathered through TDS includes information about treatment services, utilization and
program capacity. Data can be broken down by type of disorder and type of service setting.
Admissions include persons who reported a primary problem of substance use as well as affected
others such as family members. Of all admissions (16,818) for treatment in 2010, 78.5% were for
outpatient services (Table 2.3); 28.8% of admissions were for drug problems only, 22.2% were
for alcohol problems only, and the remaining 49.0% of admissions were for treatment of
combined alcohol and drug problems. There were approximately 5,500 in-state clients served by
DEEP in calendar year 2010
2 In this and later tables “Attrib.” refers to the amount of the cost attributed to alcohol or drugs
11

Table 2.3 Number of admissions for treatment by type of disorder
Maine, 2010
Type of disorder Treatment type Total Percent
(%) Inpatient Outpatient Alcohol disorder 1,044 2,695 3,739 22.2 Drug disorder 800 4,037 4,837 28.8 *Dual disorder 1,764 6,478 8,242 49.0 Total 3,608 13,210 16,818 100.00 Percent (21.5) (78.5) Source: SAMHS/TDS *Dual disorder are those who have both an alcohol and drug disorder combined.
Persons may be admitted to treatment multiple times over the course of a year, either as
new admissions to different facilities for different levels of care or as re-admissions to the same
facilities or levels of care. Table 2.4 shows that these 16,818 admissions represented 14,996
individual clients. 79.3% of the (unduplicated) clients were admitted to outpatient services.
Table 2.4
Number of clients receiving treatment by type of disorder Maine, 2010
Type of disorder Treatment type Total Percent
(%) Inpatient Outpatient Alcohol disorder 902 2,559 3,461 23.1 Drug disorder 704 3,588 4,292 28.6 Dual disorder 1,491 5,752 7,243 48.3 Total 3,097 11,899 14,996 100.00 Percent (20.7) (79.3) Source: SAMHS/TDS *Dual disorder are those who have both an alcohol and drug disorder combined.
As shown in Table 2.5, 93.9% of all admissions to treatment were categorized as White
clients, 2.6% were Black, 2.2% were American Indian/Alaskan Native, and the remaining small
portion included “Asians” and clients of other races. The demographic profile of the state
population overall is shown in the last column of Table 2.5. In general, the treatment population
reflects the state population, although Black and Native American clients are over- represented in
the treatment population and Whites and other races are under-represented, when compared to
the US Census distribution in Maine.
12
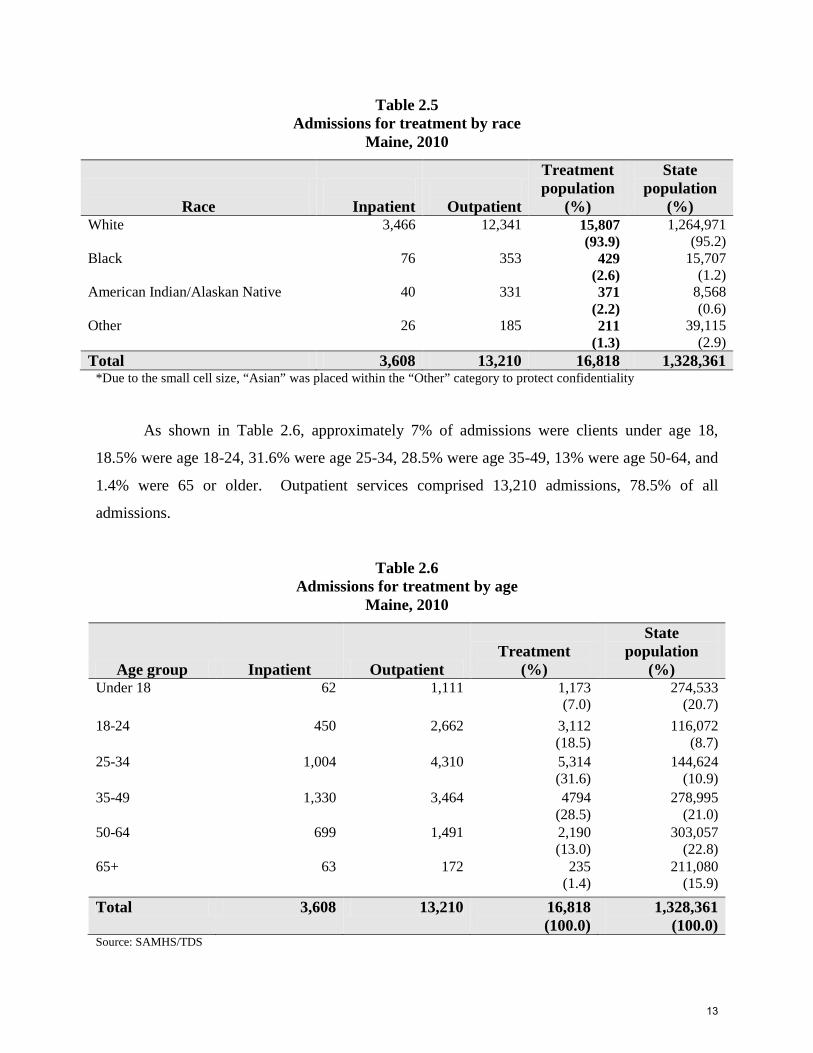
Table 2.5 Admissions for treatment by race
Maine, 2010
Race
Inpatient
Outpatient
Treatment population
(%)
State population
(%) White 3,466 12,341 15,807
(93.9) 1,264,971
(95.2) Black 76 353 429
(2.6) 15,707
(1.2) American Indian/Alaskan Native 40 331 371
(2.2) 8,568 (0.6)
Other 26 185 211 (1.3)
39,115 (2.9)
Total 3,608 13,210 16,818 1,328,361 *Due to the small cell size, “Asian” was placed within the “Other” category to protect confidentiality
As shown in Table 2.6, approximately 7% of admissions were clients under age 18,
18.5% were age 18-24, 31.6% were age 25-34, 28.5% were age 35-49, 13% were age 50-64, and
1.4% were 65 or older. Outpatient services comprised 13,210 admissions, 78.5% of all
admissions.
Table 2.6 Admissions for treatment by age
Maine, 2010
Age group Inpatient Outpatient Treatment
(%)
State population
(%) Under 18 62 1,111 1,173
(7.0) 274,533
(20.7) 18-24
450
2,662
3,112 (18.5)
116,072 (8.7)
25-34 1,004
4,310
5,314 (31.6)
144,624 (10.9)
35-49 1,330
3,464
4794 (28.5)
278,995 (21.0)
50-64 699
1,491
2,190 (13.0)
303,057 (22.8)
65+ 63
172
235 (1.4)
211,080 (15.9)
Total 3,608 13,210 16,818 (100.0)
1,328,361 (100.0)
Source: SAMHS/TDS
13
Summary and Implications
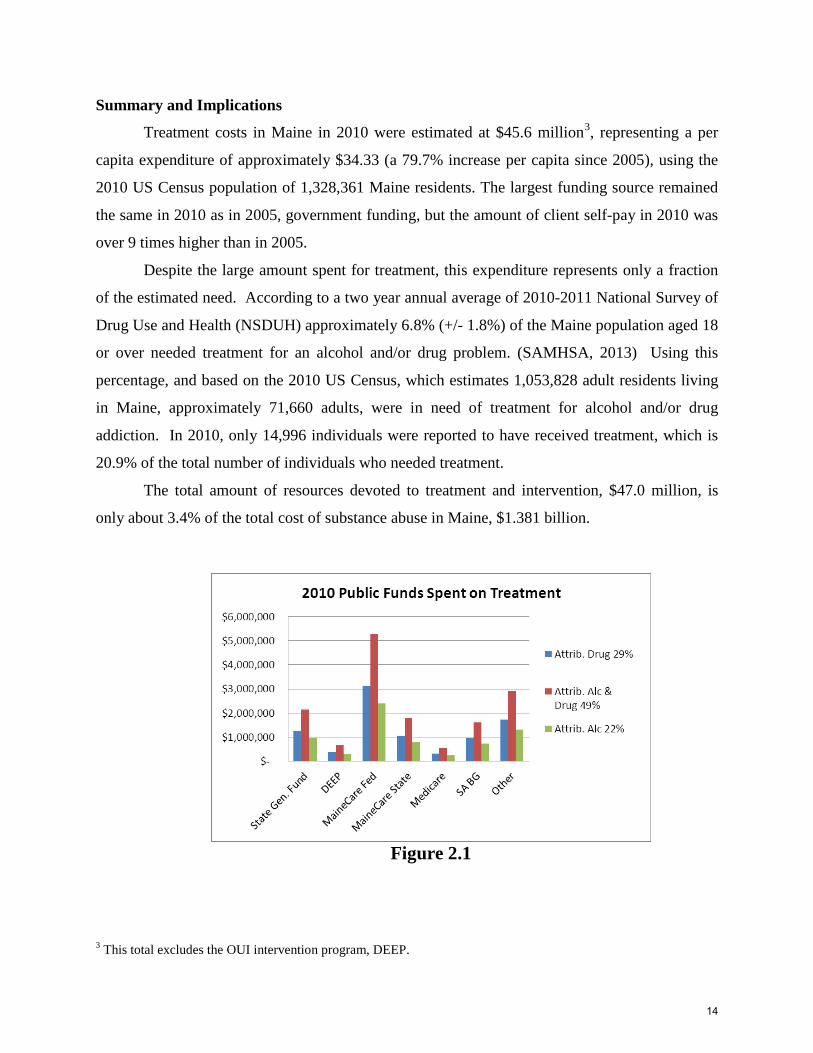
Treatment costs in Maine in 2010 were estimated at $45.6 million3, representing a per
capita expenditure of approximately $34.33 (a 79.7% increase per capita since 2005), using the
2010 US Census population of 1,328,361 Maine residents. The largest funding source remained
the same in 2010 as in 2005, government funding, but the amount of client self-pay in 2010 was
over 9 times higher than in 2005.
Despite the large amount spent for treatment, this expenditure represents only a fraction
of the estimated need. According to a two year annual average of 2010-2011 National Survey of
Drug Use and Health (NSDUH) approximately 6.8% (+/- 1.8%) of the Maine population aged 18
or over needed treatment for an alcohol and/or drug problem. (SAMHSA, 2013) Using this
percentage, and based on the 2010 US Census, which estimates 1,053,828 adult residents living
in Maine, approximately 71,660 adults, were in need of treatment for alcohol and/or drug
addiction. In 2010, only 14,996 individuals were reported to have received treatment, which is
20.9% of the total number of individuals who needed treatment.
The total amount of resources devoted to treatment and intervention, $47.0 million, is
only about 3.4% of the total cost of substance abuse in Maine, $1.381 billion.
Figure 2.1
3 This total excludes the OUI intervention program, DEEP.
14

Figure 2.2
15

Chapter 3
Morbidity
Alcohol and drug use, abuse, or dependence may adversely affect the ability of an
individual to participate in work or other activities, such as maintaining a household. This
chapter measures morbidity costs as reduced productivity from alcohol and drug abuse,
measured in terms of either wage earnings for workers or housekeeping values for non-workers.
The major findings of the analysis were:
• Total morbidity costs in 2010 due to alcohol or drug abuse were $188.6 million;
• Males accounted for 75.9% of total costs;
• Males aged 45-64 accounted for the largest portion of alcohol morbidity costs.
Methodology
This chapter generally follows the established methodology used in previous Maine
studies and other studies nationally to estimate morbidity costs associated with alcohol or drug
use (Baird et al., 2004; Wickizer, 1999; Rice et al., 1990).
First, the number of persons with a drug abuse disorder, the number with an alcohol
abuse disorder, and the total number with either or both substance use disorders were estimated
based upon prevalence data gathered for Maine by the federal survey, NSDUH4. Due to
relatively small NSDUH sample sizes each year, data from 2006 through 2009 (SAMHSA,
2011) had to be combined to develop reasonably reliable prevalence estimates, and were then
weighted by age/gender proportions from the 2010 Census. Then the prevalence rates were
applied to Maine Census population estimates for the year 2010 (U.S. Census Bureau, 2010) to
estimate the numbers of persons within each age group and gender category who met the criteria
for a substance disorder. The number of persons who met criteria for a substance disorder in
each age/gender category was multiplied by the labor force participation rate within each
subgroup to estimate the expected number who would be employed. Next, the number of
persons with a substance use disorder who were not employed was estimated by subtracting the
1 Total persons with a substance abuse disorder is less than the sum of persons with an alcohol or drug abuse disorder because some persons have both disorders.
16

number of employed persons from the total number of persons who met the substance disorder
criteria.
Median earnings for male and female age groups were estimated by adjusting the
earnings listed in the 2005 Cost Report (OSA, 2007). The alcohol and drug use disorder
impairment rates were determined by averaging the rates used by Wickizer (1999). To develop
an estimate of an impairment rate to apply to the alcohol or drug use disorder estimates, the
impairment rates for the two separate categories were weighted according to the percentage of
age specific prevalence reported from the NSDUH. 5
Median earnings for each age/gender/labor participation group were multiplied by the
relevant impairment rate to generate estimates of lost earnings due to drug and alcohol abuse. 6
Results
Approximately 80,091 adults in Maine had an alcohol use disorder in 2010; 29,507 adults
had a drug use disorder, and 99,060 adults had either or both disorders (Table 3.1).
The prevalence of abuse or dependence was highest among the 18-24 year old age group. The
prevalence of alcohol abuse or dependence was 22.1% for males and 13.4% for females in the
18-24 year old age group. An estimated 10.4% of males and 10.9% of females in that age group
met the criteria for drug abuse or dependence. Criteria for illicit drug or alcohol abuse or
dependence were met by 27.4% of males and 20.2% of females in the 18-24 year old age group.
Based upon the labor force participation rates included in Table 3.2, an estimated 56,685
employed persons had an alcohol use disorder, at least 21,854 employed persons had a drug use
disorder, and an estimated 70,824 employed persons had either or both disorders in Maine in
2010. Of persons who were not participating in the labor force, an estimated 17,095 persons were
estimated to have an alcohol use disorder, 7,435 persons had a drug use disorder, and 21,881
persons had either or both disorders.
5 See Appendix A for details of the calculations. 6 See Appendix A for details of the calculations.
17

Table 3.1 Estimated number of adults with abuse or dependence, by gender and age
Maine, 2006-2009
Alcohol disorder
prevalence
Drug disorder
prevalence
Alcohol and/or drug
disorder prevalence
2010 Maine
Population
Alcohol disorder
Drug
disorder
Alcohol and/or drug
disorder % % % N N N N Male 18-24 22.1 10.4 27.4 59,258 13,096 6,163 16,237 25-44 13.7 4.5 15.8 156,066 21,381 7,023 24,658 45-64 8.6 2.1 10.7 201,212 17,304 4,225 21,530 65+ * * * 92,468 * * * Total 11.1 3.5 13.2 509,004 56,499 17,815 67,189
Female 18-24 13.4 10.9 20.2 56,814 7,613 6,193 11,476 25-44 6.9 2.9 9.4 159,934 11,035 4,638 15,034 45-64 1.6 0.5 1.8 209,464 3,351 1,047 3,770 65+ * * * 118,612 * * * Total 4.4 2.3 6.0 544,824 23,972 12,531 32,689 TOTAL 7.6 2.8 9.4 1,053,828 80,091 29,507 99,060
Sources: SAMHSA, 2011; US Census, 2010
18
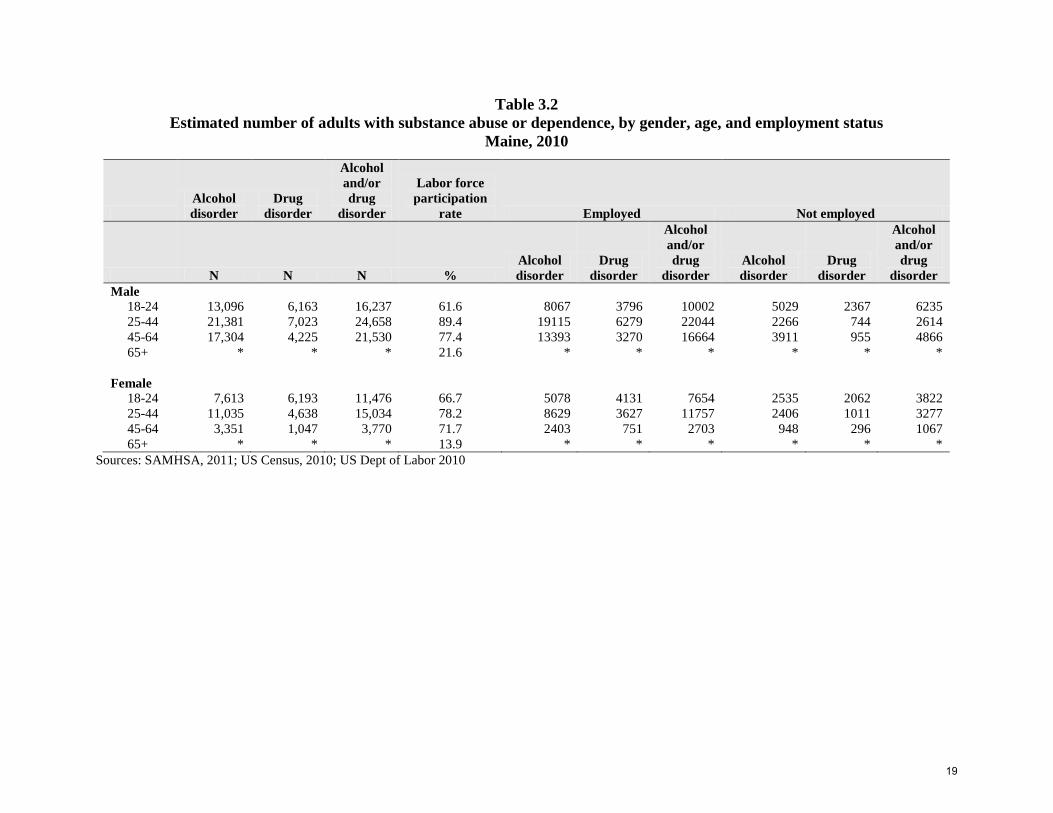
Table 3.2 Estimated number of adults with substance abuse or dependence, by gender, age, and employment status
Maine, 2010
Alcohol disorder
Drug disorder
Alcohol and/or drug
disorder
Labor force participation
rate Employed Not employed
N N N % Alcohol disorder
Drug disorder
Alcohol and/or drug
disorder Alcohol disorder
Drug disorder
Alcohol and/or drug
disorder Male 18-24 13,096 6,163 16,237 61.6 8067 3796 10002 5029 2367 6235 25-44 21,381 7,023 24,658 89.4 19115 6279 22044 2266 744 2614 45-64 17,304 4,225 21,530 77.4 13393 3270 16664 3911 955 4866 65+ * * * 21.6 * * * * * * Female 18-24 7,613 6,193 11,476 66.7 5078 4131 7654 2535 2062 3822 25-44 11,035 4,638 15,034 78.2 8629 3627 11757 2406 1011 3277 45-64 3,351 1,047 3,770 71.7 2403 751 2703 948 296 1067 65+ * * * 13.9 * * * * * *
Sources: SAMHSA, 2011; US Census, 2010; US Dept of Labor 2010
19

Median annual wages in Maine in 2010 ranged from a low of $16,227 for males aged 65 and older to $46,447 for males aged
45-64 (Table 3.3). Housekeeping values, which represent imputed market values for maintaining the home, are also included in Table
3.3. Employment earnings do not capture all of the productive capacity of individuals, because people have to maintain households
apart from their jobs. Thus, Table 3.3 includes two sets of housekeeping values, one for persons in the labor force, the second for
persons not in the labor force. Housekeeping values are significantly higher for females than males, reflecting the relative amount of
time spent in this activity. These housekeeping values were calculated by taking the values from the 2005 Cost Report and adjusting
for inflation (14.93% from 2005 to 2010, InflationData.com).
Table 3.3 Morbidity costs
Maine, 2010
Employed Not in labor force Median earnings Housekeeping Impairment rates Morbidity costs
Alcohol disorder
Drug disorder
Alcohol and/or drug
disorder Alcohol disorder
Drug disorder
Alcohol and/or drug
disorder
In labor force
Not in labor force Alcohol Drugs
Alcohol and/or drugs Alcohol Drugs
Alcohol and/ or drugs
N N N N N N $ $ $ $ $ $ Male 18-24 8,067 3,796 10,002 5,029 2,367 6,235 26,127 3,910 8,103 1.40 1.10 1.61 3,962,819 1,465,203 5,650,332 25-44 19,115 6,279 22,044 2,266 744 2,614 40,641 4,918 9,186 4.25 5.45 5.17 37,896,220 15,963,014 53,163,875 45-64 13,393 3,270 16,664 3,911 955 4,866 46,447 5,326 9,604 7.40 7.80 7.40 54,090,820 13,920,623 67,301,397 65+ * * * * * * 16,227 3,973 7,550 9.30 7.30 * * * * 95,949,859 31,348,840 126,115,604 Female 18-24 5078 4131 7654 2535 2062 3822 19,882 12,367 20,474 0.80 0.20 0.65 1,725,296 350,876 2,113,056 25-44 8629 3627 11757 2406 1011 3277 26,796 14,658 22,718 7.35 1.45 6.74 30,308,906 2,513,163 37,866,773 45-64 2403 751 2703 948 296 1067 34,835 12,938 21,092 15.30 4.55 14.87 20,623,441 1,916,494 22,542,231 65+ * * * * * * 16,257 6,142 10,068 18.70 7.30 * * * * 52,657,644 4,780,533 62,522,060
TOTAL EST 148,607,503 36,129,373 $188,637,664 Sources: US Census Bureau, 2010; Baird, Lanctot and Clough, 2004; Rice et al., 1990
20
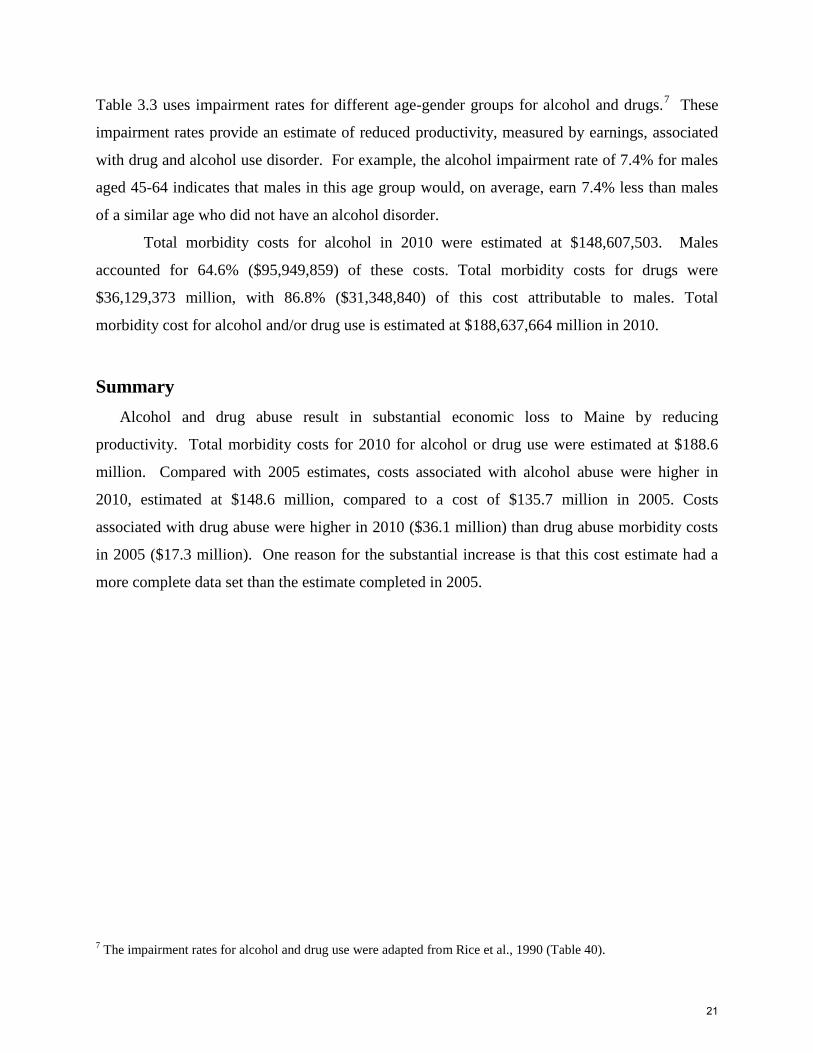
Table 3.3 uses impairment rates for different age-gender groups for alcohol and drugs.7 These
impairment rates provide an estimate of reduced productivity, measured by earnings, associated
with drug and alcohol use disorder. For example, the alcohol impairment rate of 7.4% for males
aged 45-64 indicates that males in this age group would, on average, earn 7.4% less than males
of a similar age who did not have an alcohol disorder.
Total morbidity costs for alcohol in 2010 were estimated at $148,607,503. Males
accounted for 64.6% ($95,949,859) of these costs. Total morbidity costs for drugs were
$36,129,373 million, with 86.8% ($31,348,840) of this cost attributable to males. Total
morbidity cost for alcohol and/or drug use is estimated at $188,637,664 million in 2010.
Summary Alcohol and drug abuse result in substantial economic loss to Maine by reducing
productivity. Total morbidity costs for 2010 for alcohol or drug use were estimated at $188.6
million. Compared with 2005 estimates, costs associated with alcohol abuse were higher in
2010, estimated at $148.6 million, compared to a cost of $135.7 million in 2005. Costs
associated with drug abuse were higher in 2010 ($36.1 million) than drug abuse morbidity costs
in 2005 ($17.3 million). One reason for the substantial increase is that this cost estimate had a
more complete data set than the estimate completed in 2005.
7 The impairment rates for alcohol and drug use were adapted from Rice et al., 1990 (Table 40).
21

Chapter 4
Mortality
Premature death due to drug and alcohol use and abuse imposes a major economic cost
on society. Premature death through illness or injury can occur through auto accidents involving
alcohol, through increasing the risk of cancer or cerebrovascular disease, or through violence
involving drugs or alcohol. When an individual dies prematurely, there is an economic cost to
society in the form of loss of that individual’s productive capacity.
This chapter analyzes mortality costs for Maine in 2010. It has three aims:
1. To determine the number of alcohol- and drug-related deaths.
2. To estimate the number of years of potential life lost from these deaths.
3. To estimate the total economic costs of drug- and alcohol-related deaths.
The major findings of the analysis were:
• 713 deaths related to drug and alcohol abuse occurred in 2010, (538 alcohol-related and
175 drug-related deaths), resulting in 15,896 years of potential life lost.
• Major causes of death were:
a. cancer (various types) – 132 deaths
b. accidental drug poisoning – 128 deaths
c. cirrhosis and liver damage – 102 deaths
d. motor vehicle accidents – 66 deaths
e. suicide - 52 deaths and 31 deaths from drugs
• Total mortality costs for 2010 were $409.6 million. Of this amount, 58.8% resulted
from alcohol abuse and 41.2% from drug abuse.
• The average cost per death in 2010, measured in lost earnings, was $574,534.
• Drugs accounted for a higher relative proportion of the costs per death than did alcohol.
Only 24.5% of deaths were attributable to drugs, yet 41.2% of costs were attributable to
drugs,
• With drug deaths tending to occur at younger ages than alcohol deaths, the number of
years of life lost per person on average was higher in drug related deaths.
22

Methodology In brief, three steps were followed. First, the number of deaths due to diseases associated
either directly or indirectly with alcohol or drug use was obtained from the death certificate file
of the Maine Office of Data, Research and Vital Statistics (ODRVS), Department of Health and
Human Services (DHHS, 2012)8. The authors of this report were informed that in 2010 there
were many death certificates entered into the death database system as “unknown” for the cause
of death, so a complete picture of the drug deaths was not available. Therefore the authors
decided to use the data from the State Medical Examiner’s Office to provide a more accurate
estimation of drug related deaths in 2010. Alcohol Attributable Fractions (AAF) and Drug
Attributable Fractions (DAF) used by NIDA/NIAAA were applied to the data to estimate the
number of alcohol- and drug-related deaths in Maine for non-substance categories. A review of
the literature, was performed to check for any updates to industry standards in calculating year
per life lost and cost attribution. This report uses the methodology in Economic Costs of
Excessive Alcohol Consumption, 2006 produced by the Lewin group. Because of this change in
methodology, caution should be used when trying to compare Maine cost reports 2005 and 2010.
Second, the mortality cost for each age-gender cohort was determined by using the same
cost per potential life lost as used by The Lewin Group (2010) and Max, D., et. al. (2004). An
average net present value (NPV) with 3% discount was obtained by using table IV-11 in the
2010 Lewin Group Economic Cost of Excessive Alcohol Consumption report to calculate the
average per age/gender group cost used in this report. Cost figures were adjusted for inflation
from the 2006 rate estimates by The Lewin Group (2010) using the inflation cost calculator
(InflationData.com, 2012) based upon the CPI for 2010. This produced the “net present value of
future earnings” as shown in table 4.4a. This is a different methodology than was used in the
2005 Maine Cost report, but has been used by Federal agencies such as the US Center for
Disease Control and the US Department of Justice, among many other highly respected
organizations. The final adjusted mortality cost figure was then multiplied by the number of
substance-related deaths in Maine. To further adjust for difference in median income rates
between Maine and the US, total drug and alcohol costs were multiplied by .9383 to calculate the
total loss overall (which is the percent of Maine wages compared to national wages).
8 Preliminary data for drug related deaths were provided by the Office of Chief Medical Examiner, pending final data from Vital Statistics.
23

Third, the number of years of potential life lost was calculated for each age group and
gender by first determining Maine’s current life expectancy by gender obtained from the Social
Science Research Council, Measure of America (www.measureofamerica.org). The life
expectancy at birth for females in Maine was 81 years; for males it was 76 years.
Results There were 713 deaths in Maine in 2010 related to drug or alcohol use. A breakdown of
the deaths by age and gender is shown in Table 4.1. Alcohol accounted for 75.5% of the
substance abuse deaths, and older persons represented the greatest proportion of alcohol related
deaths (ARD) particularly those 55-64 (21.0%) and 65 and over (48.3%). In contrast, the highest
proportion of drug-related deaths (DRD) was among middle aged adults 35-44 (25.7%) and 45-
54 (29.1%) (see Figure 4.1).
Table 4.1 Number of alcohol and drug related deaths by age and gender
Maine 2010
Alcohol related deaths Drug related deaths Total Female Male Total Female Male Total
Age N N N N N N N (%) (%) (%) (%) (%) (%) (%)
1-18 3 10 13 1 0 1 14
(1.6) (2.8) (2.4) (0.0) (0.0) (0.0) 2.0%
19-24 5 14 19 5* 11* 16 35 (2.7) (3.9) (3.5) (8.0) (17.5) (13.8) 4.9%
25-34 4 16 20 10* 18* 28 48
(2.2) (4.5) (3.7) (12.0) (27.5) (21.5) 6.7%
35-44 9 12 21 21* 24* 45 66
(4.9) (3.3) (3.9) (32.0) (22.5) (26.2) 9.3%
45-54 23 65 88 19* 32* 51 139
(12.6) (18.1) (16.4) (32.0) (27.5) (29.2) 19.5%
55-64 35 82 113 9* 9* 18 131
(19.1) (22.8) (21.0) (4.0) (2.5) (3.1) 18.4%
65+ 103 157 260 3* 5* 8 268
(56.3) (43.7) (48.3) (12.0) (2.5) (6.2) 37.6%
Unknown 1 (0.5)
3 (0.8)
3 (0.6)
5* (12.0)
3* (2.5)
8 (6.2)
12 1.7%
Total 182 359* 538* 73 102 175 713 (100.0) (100.0) (100.0) (100.0) (100.0) (100.0) (100.0)
Source: Maine Department of Health and Human Services, Office of Data, Research and Vital Statistics, 2010; * Office of the Chief Medical Examiner, 2013 * 6 unknown age male and 6 unknown age female
24

More detailed information concerning alcohol-and drug-related deaths is presented in
Tables 4.2 and 4.3, which show how mortality estimates were derived. Table 4.2 includes
respective alcohol-attributable fractions (AAF), representing the percentage of deaths within a
given diagnosis believed to be attributable to alcohol. For example, the AAF for cancer of the
larynx is 0.50, indicating that research has suggested that 50 percent of deaths linked to this form
of cancer could reasonably be associated with alcohol use. Table 4.3 has a column labeled drug-
attributable fraction (DAF), which provides corresponding information for drug-related deaths.
Multiplying the total number of deaths within a diagnostic category by the AAF or DAF gives an
estimate of the number of deaths attributable to alcohol or drug use. The AAF and DAF values
used for this report are the same as those used in by NIDA/NIAAA (1998).
Table 4.2 shows that different types of cancers accounted for the greatest number of
alcohol-related deaths (132), followed by accidental drug poisonings (128), cirrhosis/liver
damage (102), alcohol related suicide (52) and cerebrovascular disease (40). Motor vehicle
accidents accounted for 66 alcohol-related deaths. Accidental poisoning was the leading cause
of drug-related death (128 deaths). (Table 4.3)
Table 4.4a and 4.4b provides detailed information on the number of years of potential life
lost (YPLL) due to drug and alcohol use and the estimated economic cost of premature death. In
2010, deaths associated with drug and alcohol use resulted in 15,896 years of potential life lost.
Alcohol accounted for a greater proportion (63.2%) of total years of life lost than drugs (36.7%).
The category representing the single greatest number of years of lost life for those dying of
alcohol-related causes was males age 45-54 (1,690 or 16.8%).
Multiplying lost earnings by the years of life lost can provide an estimate of the economic
impact of substance abuse. Cost figures were derived from The Lewin Group (2010) and Max et
al. (2004). More details are available in the methodology section. Using this newer
methodology is one major factor in the increase (100.1%) shown between 2005 and 2010 reports,
although the numbers of deaths also increased, especially drug related deaths, which tend to
occur at younger ages than alcohol related deaths.9 Other factors contributing to the increase
includes increase in average wages and a slight increase in Maine’s average lifespan.
9 The total drug death numbers reported in the 2005 report were an underestimate of the actual total number of deaths, particularly accidental overdoses.
25

Premature death due to alcohol and drug use resulted in an estimated economic loss of
approximately $409.6 million. As reflected in Table 4.4a the estimated economic loss due to
premature death in 2010 related to alcohol use was $240.9 million ($256.7 adjusted with the
.9383 income discount), as compared to $168.7 million for drug use. Drug and alcohol-related
deaths among males aged 45-54 accounted for the largest single age group costs, $89.2 million.
Summary In 2010, 713 people died in Maine from drug and alcohol-related causes, resulting in
15,898 years of potential life lost. Nearly half of alcohol related deaths occurred in persons 65 or
older (Figure 4.1), whereas drug related deaths occurred more often in persons 35-44 and 45-54
years old. Translated into economic terms, this loss of life combined represented an economic
cost of approximately $409.6 million. Approximately 58.8% of this cost represents premature
death related to alcohol use and abuse.
Figure 4.1
0
14
22 26
29
3 6
2 4 4 4
16 21
48
0
10
20
30
40
50
60
1-18 19-24 25-34 35-44 45-54 55-64 65+
Perc
ent
Percent of Alcohol and Drug Deaths, by Age Group, 2010
Drugs Alcohol
26
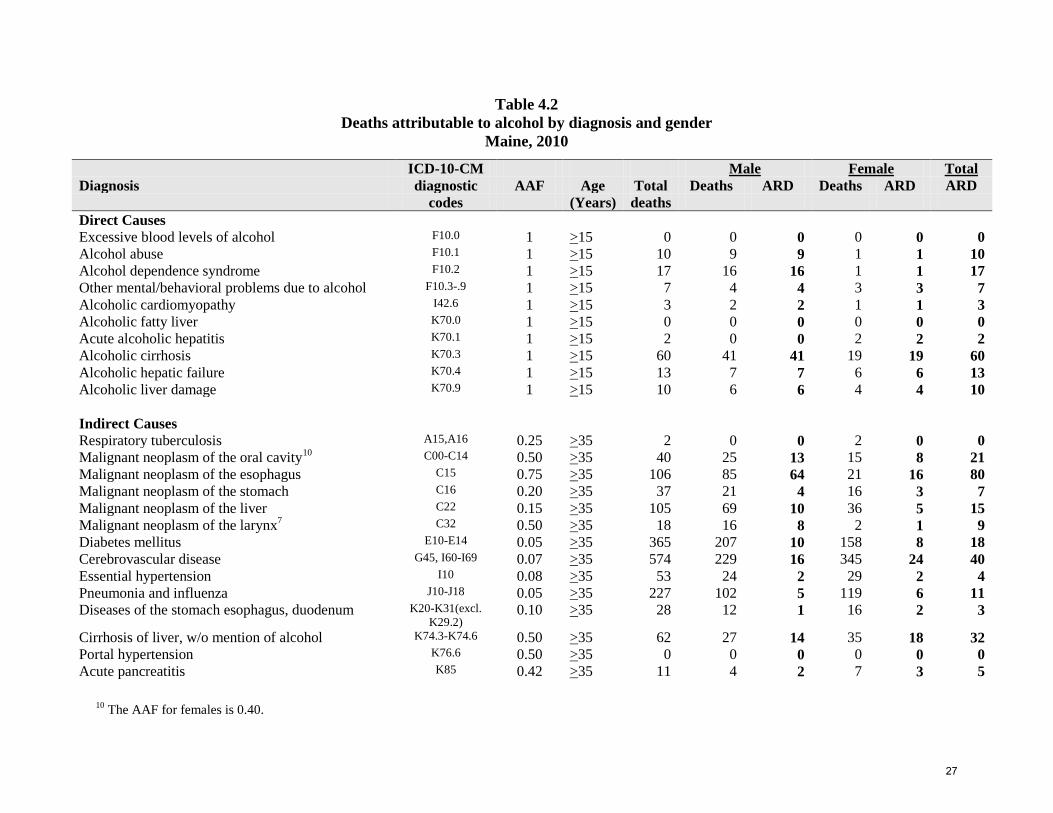
Table 4.2 Deaths attributable to alcohol by diagnosis and gender
Maine, 2010
ICD-10-CM Male Female Total Diagnosis diagnostic AAF Age Total Deaths ARD Deaths ARD ARD codes (Years) deaths Direct Causes Excessive blood levels of alcohol F10.0 1 >15 0 0 0 0 0 0 Alcohol abuse F10.1 1 >15 10 9 9 1 1 10 Alcohol dependence syndrome F10.2 1 >15 17 16 16 1 1 17 Other mental/behavioral problems due to alcohol F10.3-.9 1 >15 7 4 4 3 3 7 Alcoholic cardiomyopathy I42.6 1 >15 3 2 2 1 1 3 Alcoholic fatty liver K70.0 1 >15 0 0 0 0 0 0 Acute alcoholic hepatitis K70.1 1 >15 2 0 0 2 2 2 Alcoholic cirrhosis K70.3 1 >15 60 41 41 19 19 60 Alcoholic hepatic failure K70.4 1 >15 13 7 7 6 6 13 Alcoholic liver damage K70.9 1 >15 10 6 6 4 4 10 Indirect Causes Respiratory tuberculosis A15,A16 0.25 >35 2 0 0 2 0 0 Malignant neoplasm of the oral cavity10 C00-C14 0.50 >35 40 25 13 15 8 21 Malignant neoplasm of the esophagus C15 0.75 >35 106 85 64 21 16 80 Malignant neoplasm of the stomach C16 0.20 >35 37 21 4 16 3 7 Malignant neoplasm of the liver C22 0.15 >35 105 69 10 36 5 15 Malignant neoplasm of the larynx7 C32 0.50 >35 18 16 8 2 1 9 Diabetes mellitus E10-E14 0.05 >35 365 207 10 158 8 18 Cerebrovascular disease G45, I60-I69 0.07 >35 574 229 16 345 24 40 Essential hypertension I10 0.08 >35 53 24 2 29 2 4 Pneumonia and influenza J10-J18 0.05 >35 227 102 5 119 6 11 Diseases of the stomach esophagus, duodenum K20-K31(excl.
K29.2) 0.10 >35 28 12 1 16 2 3
Cirrhosis of liver, w/o mention of alcohol K74.3-K74.6 0.50 >35 62 27 14 35 18 32 Portal hypertension K76.6 0.50 >35 0 0 0 0 0 0 Acute pancreatitis K85 0.42 >35 11 4 2 7 3 5
10 The AAF for females is 0.40.
27

Unintentional Injuries Accidental drowning & submersions W65-W74 0.38 >0 22 19 7 3 1 8 Accidental falls W00-W19 0.35 >15 76 44 15 32 11 26 Accidents caused by fire & flames X00-X09 0.45 >0 7 4 2 3 1 3 Air and space transport accidents V95-V97 0.16 >0 5 5 1 0 0 1 Other injuries and adverse effects 11 0.25 >15 18 12 3 6 2 5 Motor vehicle accidents 12 0.42 >0 156 106 45 50 21 66 Pedal cycle & other road vehicle 13[6] 0.20 >0 1 1 0 0 0 0 accidents Water transport accidents V90-V94 0.20 >0 3 3 1 0 0 1 Intentional Injuries Suicide X60-X84.9,Y87.0 0.28 >15 185 150 42 35 10 52 Homicide X85-Y09,Y87.1 0.46 >15 23 15 7 8 4 11 Total 2261 1277 359 984 183 542
Sources: Maine Department of Health and Human Services, Office of Data, Research and Vital Statistics, 2012; International Classification of Diseases, 10th revision, Clinical Modification (ICD-10-CM); Bouchery et. al., 2010; Wickizer, 1999; NIDA/NIAAA, 1998 * ARD – Alcohol Related Deaths
11 X31, W78, W79, W50, W51, W22-W24, W27-W34, Y10, Y13, Y14, Y18, Y19 12 V02-V04, V09 (.0, .2), V12-V14 (.3-.9), V19 (.0-.2, .4-.6), V20-V79, V80 (.3-.5), V81 (.0, .1), V82 (.0, .1), V83-V86, V87 (.0-.8), V88 (.0-.8), V89 (.0, .2) 13 V01, V06, V09 (.1, .3, .9), V10-V11, V12-V14 (.0-.2), V16-V18, V19 (.3, .8, .9), V82 (.2-.9), V87.9, V88.9, V89 (.1, .3)
28
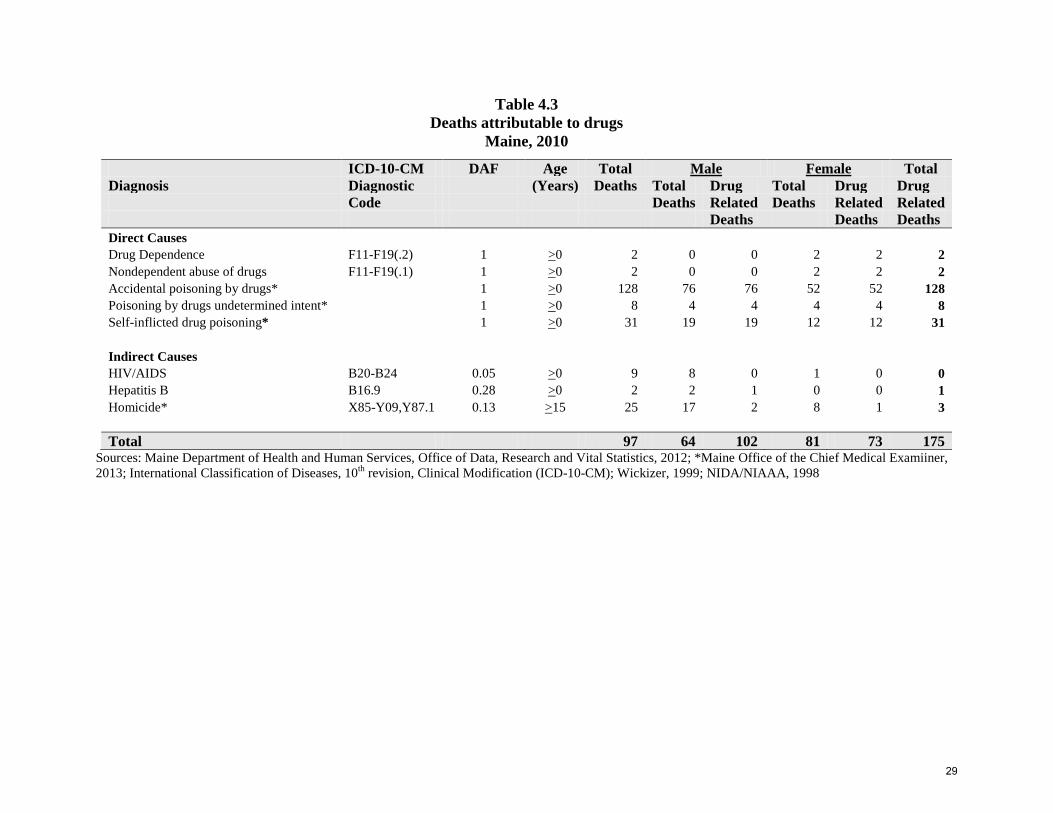
Table 4.3 Deaths attributable to drugs
Maine, 2010
ICD-10-CM DAF Age Total Male Female Total Diagnosis Diagnostic (Years) Deaths Total Drug Total Drug Drug Code Deaths Related Deaths Related Related Deaths Deaths Deaths Direct Causes Drug Dependence F11-F19(.2) 1 >0 2 0 0 2 2 2 Nondependent abuse of drugs F11-F19(.1) 1 >0 2 0 0 2 2 2 Accidental poisoning by drugs* 1 >0 128 76 76 52 52 128 Poisoning by drugs undetermined intent* 1 >0 8 4 4 4 4 8 Self-inflicted drug poisoning* 1 >0 31 19 19 12 12 31 Indirect Causes HIV/AIDS B20-B24 0.05 >0 9 8 0 1 0 0 Hepatitis B B16.9 0.28 >0 2 2 1 0 0 1 Homicide* X85-Y09,Y87.1 0.13 >15 25 17 2 8 1 3 Total 97 64 102 81 73 175
Sources: Maine Department of Health and Human Services, Office of Data, Research and Vital Statistics, 2012; *Maine Office of the Chief Medical Examiiner, 2013; International Classification of Diseases, 10th revision, Clinical Modification (ICD-10-CM); Wickizer, 1999; NIDA/NIAAA, 1998
29

Table 4.4a Estimated mortality costs
ARD NPV ALC DRD NPV DRUG ME/National Total deaths Future Total costs deaths Future Total costs per cap inc. Loss
Earning Before income
discount Earning Before income
discount ratio Male* 1-18 10 $1,659,719 $16,597,189 0 $1,659,719 $ - 0.9383 $15,573,143
19-24 14 $1,921,027 $26,894,371 11 $1,921,027 $21,131,292 0.9383 $45,062,479 25-34 16 $1,797,244 $28,755,898 18 $1,797,244 $32,350,385 0.9383 $57,336,026 35-44 12 $1,500,876 $18,010,517 24 $1,500,876 $36,021,034 0.9383 $50,697,804 45-54 65 $980,606 $63,739,365 32 $980,606 $31,379,380 0.9383 $89,249,919 55-64 82 $425,099 $34,858,152 9 $425,099 $3,825,895 0.9383 $36,297,241 65+ 157 $111,117 $17,445,330 5 $111,117 $555,584 0.9383 $16,890,257
Total Males $206,300,822 $125,263,570 .9383 $ 311,106,868
Female* 1-18 3 $1,226,949 $3,680,846 1 $1,226,949 $1,226,949 0.9383 $4,604,984
19-24 5 $1,374,168 $6,870,841 5 $1,374,168 $6,870,841 0.9383 $12,893,820 25-34 4 $1,260,684 $5,042,736 10 $1,260,684 $12,606,841 0.9383 $16,560,598 35-44 9 $967,656 $8,708,908 21 $967,656 $20,320,785 0.9383 $27,238,561 45-54 23 $ 594,882 $13,682,285 19 $594,882 $11,302,757 0.9383 $23,443,466 55-64 35 $235,570 $8,244,933 9 $235,570 $2,120,126 0.9383 $9,725,534 65+ 103 $40,910 $4,213,750 3 $40,910 $122,731 0.9383 $4,068,919
Total Females $50,444,299 $54,571,030 .9383 $ 98,535,881
TOTAL $256,745,121 $179,834,600 $409,642,749 Source: The Lewin Group (2010); Max, D. et. al. (2004); Maine Department of Health and Human Services, Office of Data, Research and Vital Statistics, 2012 Excluded from above, 6 males and 6 female due to unknown age NPV is the Net Present Value based upon national rates.
30

Table 4.4b Estimated Years of Potential Life Lost (YPLL)
ALC DRUG YPLL YPLL
Male* 1-18 660 0 19-24 756 594 25-34 736 828 35-44 432 864 45-54 1,690 832 55-64 1,312 144 65+ 864 28
Total males 6,450 3,290
Female* 1-18 213 71
19-24 295 295 25-34 204 510 35-44 369 861 45-54 713 589 55-64 735 189 65+ 1,082 32
Total females 3,611 2,547
TOTAL (%) 10,061
(63.3%) 5,837
(36.7%) Excluded from above, 6 males and 6 females due to unknown age
31

Chapter 5
Crime
Research and data collected for over two decades have shown a strong link between drug
and alcohol abuse and its impact on crime. Although the exact nature and strength of the
relationship with each type of crime is not fully known, there is little doubt that substance abuse
increases the likelihood that certain crimes will be committed. A 1989 Department of Justice
study found that in some cities as many as 50%-80% of persons arrested for felonies tested
positive for drugs (Tonry & Wilson, 1990). Recent surveys of incarcerated populations provide
further evidence of the strong link between crime and the use of drugs and alcohol. In 2004,
approximately one in four federal inmates (26%) and one in three state inmates (32%) reported
that they were under the influence of alcohol or illicit drugs at the time of their current offense
(U.S. Department of Justice, 2007). In 2010, the Office of National Drug Control Policy
conducted urinalysis testing of male arrestees across ten urban sites nationally, finding that
presence of at least one test substance ranged from 52% in Washington, DC to 83% in Chicago;
in addition, a low of 11% of arrestees in Washington, DC to 38% in Sacramento tested positive
for the presence of multiple substances. (ONDCP, 2011).
This chapter analyzes crime costs for Maine in 2010. It examines five types of costs
related to criminal activity: (1) Law enforcement, (2) Judicial, (3) Correctional, and (4) Other
societal costs.
The major findings of the analysis were:
• Of 19 arrests for homicide, an estimated 6 were related to alcohol and 3 to drug abuse.
• In 2010 there were 7,083 assault (aggravated, sexual and other) related arrests, of which
an estimated 2,120 were related to alcohol abuse and 345 to drug abuse.
• Total estimated drug- and alcohol-related crime costs in 2010 were $343.4 million.
• Of the four major crime cost categories analyzed, law enforcement costs were highest
($119.7 million), followed by the cost of corrections ($111.0 million).
32

Methodology
Information was gathered from various sources on different criminal activities (offenses
and arrests), corrections populations, numbers of crime victims, and property destruction. The
variables were then adjusted to reflect criminal activity related specifically to drug and alcohol
abuse.
The analysis was restricted to the set of crimes believed to be most closely linked to
substance abuse (NIDA/NIAAA, 1998). They included the following Part I felonies:
● homicide ● assault (aggravated, sexual and other) ● robbery ● burglary ● larceny (property theft) ● auto theft
Less serious Part II offenses analyzed included: ● operating under the influence (OUI) ● liquor law violations ● public drunkenness ● stolen property (buying, receiving and selling) ● prostitution ● drug law violations (possession, sale, use, or manufacture).
The numbers of drug- and alcohol-related crimes were estimated by multiplying crime
figures by attributable fractions in the same manner as done to derive other cost estimates. The
attributable fractions used for this report were those used by NIDA/NIAAA (1998; Table C.1)
and represent the most current evidence available regarding drug- and alcohol-related crime.
The attributable fractions ranged from 5.1% for drug-related sexual assault to 100% for OUI. In
other words, it was assumed that 5.1% of all sexual assaults are related to drug use; by definition,
100% of OUI offenses are related to alcohol use.
The attributable fractions used for tables 5.1-5.5 analyses are the same as were used in the
2005 report, which allows for consistency and comparison between the types of crimes and
between the 2005 and 2010 reports. Table 5.1 shows the fractions used (crimes such as OUI
with attributable fractions of 100% are not shown):
33

Table 5.1 Attributable fractions
Alcohol Drugs (%) (%) Homicide 30.0 15.8 Aggravated Assault 30.0 5.1 Sexual Assault 22.5 5.1 Other Assault 30.0 5.1 Robbery 3.4 27.2 Burglary 3.6 30.0 Larceny 2.8 29.6 Auto Theft 3.5 6.8 Stolen Property 0.0 15.1 Prostitution 0.0 12.8
To derive some of the cost estimates (judicial costs), it was necessary to convert numbers
of arrests or offenses into dollar equivalents. This conversion was done using the same
procedure as Rice et al. (1990), which assumed that costs were proportional to the numbers of
crimes committed.
Results
Law Enforcement Costs Police Protection:
Police protection costs were estimated based on the 33,020 arrests (Maine DPS, 2010) for
Part I and II offenses committed in 2010 (Table 5.2). The numbers of the offenses were
multiplied by the above attributable fractions to obtain estimates of the number of drug- and
alcohol-related offenses committed. In 2010 the police protection costs for alcohol- and drug-
related crimes were estimated at $47.7 million (Table 5.2). Based on 2005 Cost Report data
(OSA, 2007) and adjusted for inflation (InflationData.com, 2012; US Department of Justice,
2007), cost per arrest is estimated at $4,082. For OUI, liquor law offenses, and public
drunkenness offenses, the arrest cost from Baird et al. (2004) was used and adjusted for inflation,
for a total of $50.64 (the cost per arrest for those offenses in 2005 was $45.63 and in 2000 was
$39.14).
There were an estimated 6 homicides and 2,120 assaults in 2010 related to alcohol use or
abuse. There were fewer drug-related crimes in these two categories, 3 and 345, respectively,
but levels of drug-related robberies, burglaries and thefts were substantially higher compared to
alcohol-related robberies, burglaries and thefts.
34

5.2 Estimated cost of police protection Maine, 2010
Type of offense Total arrests
Attributable Fraction
Number of arrests due to:
Cost per arrest Police protection costs
Alcohol Drugs Alcohol Drugs Alcohol Drug Total Homicide 19 .30 .158 5.7 3 $4,082.31 $23,269. $12,247 $35,516 Aggravated assault 610 .30 .024 183 14.64 $4,082.31 $747,063 $59,765 $806,828 Sexual assault 68 .225 .051 15.3 3.47 $4,082.31 $62,459 $14,166 $76,625 Other assaults 6,405 .30 .051 1921.5 326.66 $4,082.31 $7,844,159 $1,333,527 $9,177,686 Robbery 191 .034 .272 6.5 51.95 $4,082.31 $26,535 $212,076 $238,611 Burglary 1,440 .036 .30 51.84 432 $4,082.31 $211,627 $1,763,558 $1,975,185 Larceny-theft 6,119 .028 .296 171.33 1811.22 $4,082.31 $699,422 $7,393,962 $8,093,384 Auto theft 229 .035 .068 8 15.57 $4,082.31 $32,658 $63,562 $96,220 OUI 6,245 1.00 .0 6,245 0 $50.64 $316,247 $0 $316,247 Liquor laws 4,950 1.00 .0 4,950 0 $50.64 $250,668 $0 $250,668 Public drunkenness 39 1.00 .0 39 0 $50.64 $1,975 $0 $1,975 Stolen property 211 0.00 .151 0 31.86 $4,082.31 $0 $130,062 $130,062 Prostitution 14 0.00 .128 0 1.79 $4,082.31 $0 $7,307 $7,307 Drug laws 6,479 0.00 1 0 6,479 $4,082.31 $0 $26,449,286 $26,449,286 TOTAL 33,020 $10,216,082 $37,439,518 $47,655,600
Sources: Maine Department of Public Safety, 2010; Harwood et al., 1998; OSA, 2007
35

Drug Demand and Supply Control:
Demand reduction refers to programs and research related to drug abuse treatment and
prevention that are designed to reduce the demand for drugs. Supply reduction refers to a wide
scope of law enforcement related activities designed to reduce the supply of drugs (this is often
referred to as drug control). (National Drug Control Strategy, 2010)
Drug traffic control is a national priority involving a wide range of federal, state and local
agencies. Because so many different agencies are involved in drug control it is difficult to
accurately estimate the costs for Maine. National data on drug traffic control costs were used to
compute the per capita costs for the relevant expenditure categories shown in Table 5.3 below.
Per capita costs were applied to Maine. Total estimated drug control expenditures for Maine in
2010 were estimated at $64.7 million.
Table 5.3 Drug Control Expenditures
Maine, 2010
Activity Expenditures Demand reduction $22,633,774 Supply reduction $42,047,983 TOTAL $64,681,757
Source: U.S. Department of Justice; National Drug Control Strategy, 2010.
The mandated duties of the Office of Substance Abuse and Mental Health Services include
providing funds for the prevention and treatment of substance abuse disorders. The expenditures
given in the Prevention category in Table 5.4 include only administrative and prevention
expenditures that were incurred by the Office of Substance Abuse in 2010. The majority of the
funds were granted out to community coalitions, schools, and prevention organizations. The
largest portion (83%) of the $7.3 million prevention budget was federal grant money that
provides funding to community coalitions so that they may develop and implement evidence-
based prevention practices.
36

Table 5.4
Substance Control Expenditures Maine Office of Substance Abuse, 2010
Judicial:
Legal and judicial costs were estimated based on the number of arrests for Part I and II
crimes (Table 5.5). The FBI lists the following as Part I crimes: homicide, forcible rape,
robbery, aggravated assault, burglary, larceny, motor vehicle theft, and arson. Part II crime
includes liquor offenses, simple assault, forgery, fraud, embezzlement, stolen property (buying,
receiving, possessing), vandalism, weapons, prostitution, sex offenses, drug violations,
gambling, alcohol violations, etc. Since only 2002 cost figures were available from the U.S.
Bureau of Justice Statistics, these data were used and adjusted for inflation. In 2002, 54,800
arrests were made in Maine. Total legal and adjudication costs were estimated at $80.0 million
(U.S. Department of Justice, 2007). In 2002, the cost per arrest was estimated as $1,460.29; after
adjustment for inflation (.0768) it was $1,572.44 in 2005. We further adjusted for inflation from
2005 to 2010 time frame using .1256. A final cost per arrest of $1,770 was used for legal and
adjudication costs in 2010.
The most costly Part I crime category was Other Assaults, $4.0 million, due to the large
number of alcohol- related arrests. The most costly Part II crime category was drug law
violations, $11.5 million. The total estimated 2010 cost for drug- and alcohol-related legal and
adjudication activities was $21.0 million, with drug abuse accounting for 77.4% of the costs.
Funding source Total expenditures Expenditures Prevention - OSA Alcohol (50%) Drug (50%) State general fund $577,461 $288,730 $288,730 Federal categorical $3,304,764 $2,597,636 $707,128 Fund for Health Maine $670,428 $335,214 $335,214 Safe and Drug Free Schools and Communities Act $1,342,346 $671,173 $671,173 Substance Abuse Prevention and Treatment Block Grant $1,441,946 $720,973 $720,973 Total $7,336,944 $4,613,726 $2,723,219
37

Table 5.5 Legal and adjudication costs 2010
Type of offense Total
arrests Attributable Number of
arrests due to: Cost per
arrest
Legal and adjudication costs Fraction
Alcohol Drugs Alcohol Drugs Alcohol Drug Total Homicide 19 0.3 0.158 5.7 3 $1,770 $10,089 $5,310 $15,399 Aggravated assault 610 0.3 0.024 183 14.64 $1,770 $323,910 $25,913 $349,823 Sexual assault 68 0.225 0.051 15.3 3.47 $1,770 $27,081 $6,142 $33,223 Other assaults 6,406 0.3 0.051 1921.5 326.66 $1,770 $3,401,055 $578,188 $3,979,243 Robbery 191 0.034 0.272 6.5 51.95 $1,770 $11,505 $91,952 $103,457 Burglary 1,440 0.036 0.3 51.84 432 $1,770 $91,757 $764,640 $856,397 Larceny-theft 6,119 0.028 0.296 171.33 1811.22 $1,770 $303,254 $3,205,859 $3,509,114 Auto theft 229 0.035 0.068 8 15.57 $1,770 $14,160 $27,559 $41,719 OUI 6,245 1 0 6,245 0 $51 $315,373 $0 $315,373 Liquor laws 4,950 1 0 4,950 0 $51 $249,975 $0 $249,975 Public drunkenness 39 1 0 39 0 $51 $1,970 $0 $1,970 Stolen property 211 0 0.151 0 31.86 $1,770 $0 $56,392 $56,392 Prostitution 14 0 0.128 0 1.79 $1,770 $0 $3,168 $3,168 Drug laws 6,479 0 1 0 6,479 $1,770 $0 $11,467,830 $11,467,830 TOTAL 33,020 $4,750,128 $16,232,953 $20,983,081
Sources: Wickizer, 1999; Maine Department of Public Safety, 2010; OSA, 2007 (US DOJ (2007); Harwood et al, 1998; Rice et al., 1990
38

Corrections State Corrections:
Total state substance abuse related corrections costs were estimated at $68.4 million
(Table 5.6). This is 2.4 times higher than it was in 2005. The average annual estimated cost per
inmate in 2010 was $46,404 (Vera Institute of Justice, 2012). This includes funds spent on
capital and state wide administration. Incarcerations related to drugs accounts for 59.8% of total
costs, equaling $40.9 million.
The Maine Department of Corrections provided the number of state correctional inmates
imprisoned for each offense in 2010. Table 5.6 uses attribution fractions from The Lewin Group,
Inc. (2010) and the National Drug Intelligence Center (2011) to estimate the proportion of
offenses attributable to alcohol or drug use. These are different than the ones used for the other
crime data, but these are thought to be a more accurate representation of those who are
incarcerated. The number of alcohol and drug related offenses were then multiplied by the
average annual cost per inmate of $46,404 (Vera Institute of Justice, 2012). As Table 5.6 shows,
the most costly offender category was drug law violations ($14.2 million) followed by homicide
($10.7 million) and burglary ($9.4 million).
39

Table 5.6 Estimated cost of state corrections, Maine, 2010
Offense Total
Inmates Attributable fraction Substance related
crimes State corrections costs Alcohol1 Drugs2 Alcohol Drugs Alcohol Drugs Total Homicide 307 0.47 0.28 144 86 $6,695,633 $3,988,888 $10,684,521 Aggravated assault 125 0.294 0.25 37 31 $1,705,347 $1,450,125 $3,155,472 Sexual assault 237 0.283 0.18 67 43 $3,112,363 $1,979,595 $5,091,957 Other assault 91 0.188 0.22 17 20 $793,880 $929,008 $1,722,888 Robbery 216 0.265 0.46 57 99 $2,656,165 $4,610,701 $7,266,866 Burglary 270 0.272 0.48 73 130 $3,407,910 $6,013,958 $9,421,868 Larceny-theft 199 0.199 0.49 40 98 $1,837,645 $4,524,854 $6,362,499 Motor vehicle theft 5 0.222 0.42 1 2 $51,508 $ 97,448 $148,957 Arson 41 0.29 0 12 $ - $551,744 $551,744 Vandalism 0 0.268 0.25 0 0 $ - $ - $ - Drug laws 307 0 1 0 307 $ - $14,246,028 $14,246,028 Liquor laws 1 1 0 1 0 $46,404 $ - $46,404 Public Drunkeness 0 1 0 0 0 $ - $ - $ - OUI 129 0.907 0.09 117 12 $5,429,407 $538,750 $5,968,158 Prostitution 0 0.25 0 0 $ - $ - $ - Sex Offenses 51 0.215 0.13 11 7 $508,820 $307,659 $816,478 Other 166 0.159 0.22 26 37 $1,224,787 $1,694,674 $2,919,461 TOTAL 2145 $27,469,869 $ 40,933,432 $68,403,301
Sources: Maine Department of Corrections, 2012; 1 Lewin Group, Inc. 2010. Economic Costs of Excessive Alcohol Consumption in the United States, 2006. 2 2011 The Economic Impact of Illicit Drug Use on American Society. Washington D.C.: US Department of Justice.
40
County Corrections:
In Maine, some individuals arrested for alcohol- and drug-related crimes are booked into
county jails. Thus, some of the expense of operating these jails should be included in the
analysis as drug- and alcohol-related costs. No one source captures all county jail costs. Some
counties do not keep electronic records on reason for incarceration; therefore multiple contacts
had to be made to estimate the number of persons in county jails for the entire state and the
average annual cost per inmate. So to help estimate the total for 2010 the following information
was collected: the average daily census in 4 of the county jails was 875 (Cumberland, Kennebec,
Lincolns 2 bridges, and Somerset). Because these are thought to contain approximately half of
Maine’s County Inmate population, this number was doubled to get the estimated average daily
county inmate population for the State.The U.S. Department of Justice, Office of Justice
Programs, Bureau of Justice Statistics conducts an annual survey of state jails. In the 2011
survey the estimated number of jail inmates was 1,750. We were also provided actual number of
offenses booked by Cumberland County Corrections. In Table 5.7, to get proportion of offenses
we used the actual number of offenses booked (not people) to determine an estimated proportion
by general category and applied that ratio to the average number of inmates in all Maine county
jails per day in 2010. The average cost per Cumberland County inmate in 2011 was $130/day or
$47,450/year. To adjust this to 2010 rates, we deducted 3.16% which was the 2011 rate of
inflation per inflationdata.com. After deducting the rate of inflation, the annual cost per inmate
used was $45,951.
In 2010, there were an estimated 9,463 incarcerated in Maine County jails. Total
alcohol- and drug-related county corrections costs for 2010 are estimated at $42.6 million. In
2005 66% of costs were due to alcohol related arrests; in 2010 this decreased to 49.8% of costs.
The cost of drug related arrests, $21.4 million, inched past that of alcohol related arrest costs,
$21.3 million.
41

Table 5.7 Estimated cost of county corrections Maine, 2010
Avg. # all
county inmates
Attributable Fraction
No. Inmate Attributed
Substance Use
Cost attributable Substance Use Est.
count Prop. of total CC
CC Offense Alcohol Drug Alcohol Drug Alcohol Drug Total OUI 927 0.0980 171 1 0.12 171.4 21 $7,877,418 $945,290 $8,822,709
Drug Laws 796 0.0841 147 0 1 0.0 147 $0 $6,764,213 $6,764,213 Arson 6 0.0006 1 0.05 0.13 0.1 0.1 $2,549 $6,628 $9,178
Liquor laws 270 0.0285 50 1 0 49.9 0.0 $2,294,394 $0 $2,294,394 Burglary 259 0.0274 48 0.272 0.45 13.0 22 $598,650 $990,413 $1,589,063
Stolen Prop. 77 0.0081 14 0.199 0.25 2.8 4 $130,211 $163,582 $293,793 Theft 842 0.0890 156 0.199 0.39 31.0 61 $1,423,867 $2,790,493 $4,214,359
Robbery 56 0.0059 10 0.265 0.51 2.7 5 $126,107 $242,696 $368,803 Homicide 11 0.0012 2 0.47 0.15 1.0 0.3 $43,933 $14,021 $57,955
Agg Assault/ 53 0.0056 10 0.294 0.23 2.9 2 $132,394 $103,574 $235,968 Sex. Assault/abuse 46 0.0049 9 0.283 0.2 2.4 2 $110,624 $78,179 $188,803
Other Assault 988 0.1044 183 0.188 0.22 34.3 40 $1,578,307 $1,846,954 $3,425,261 Prostitution 5 0.0005 1 0.21 0.73 0.2 0.7 $8,923 $31,017 $39,939 Sub Total 4336 0.0
Other Offense 5127 0.5418 948 0.159 0.17 150.8 161.2 $6,927,310 $7,406,558 $14,333,868 TOTAL 9463 $21,254,686 $21,383,618 $42,638,304
42

Other Societal Costs: Other social costs arising from drug and alcohol abuse include the costs of lost productivity due
to incarceration, the value of lost productivity due to criminal victimization, and the cost of
property damage arising from substance abuse-related accidents.
Productivity Losses Due to Incarceration:
Inmates of state prisons and local jails are unable to participate in the economy as
workers. This results in a substantial economic cost to society in the form of lost productivity.
The cost estimates were based upon the numbers of individuals entering state prisons and
local/county jails shown in the previous section. We assumed, as did Rice et al. (1990), that one
year was served per offense even though that would tend to inflate the cost of Part II offenses.
Since annual costs were calculated, the analysis was based upon a maximum of 12 months
served, even though individuals served much longer for some crimes (e.g., homicide). Numbers
of person years served related to alcohol and drug use match the number of inmates in the state
and county system as included in Tables 5.6 and 5.7. Productivity losses were calculated based
upon 2011 US Department of Labor, Bureau of Labor Standards showing Maine’s median
annual wage of $40,190, this was then adjusted to 2010 rates using inflationdata.com. This
produced an estimated 2010 median annual wage for Maine of $38,960. No discount is being
applied even though it is expected that those incarcerated are likely to earn less than the average.
They are being treated as if there were no drug or alcohol abuse incarcerations (this approach
was used in the 2011 US DOJ Economic Impact of Illicit Drug Use report as well).
The findings are presented in Table 5.8. Total productivity losses due to incarceration
were estimated to be $81.5 million, with $57.5 million representing losses associated with
incarceration in state prisons. Productivity losses were higher for drug-related productivity
losses, $46.3 million (56.8%), than for alcohol-related productivity losses, $35.2 million
(43.1%).
43

Table 5.8 Estimated productivity losses due to incarceration, Maine, 2010
Alcohol Drugs Total losses Offense
Person years served
Productivity
losses
Person years
served
Productivity
losses
State prisons Homicide 144.0 $5,610,240 86.0 $3,350,560 $8,960,800 Assault 121.0 $4,714,160 94.0 $3,662,240 $8,376,400 Robbery 57.0 $2,220,720 99.0 $3,857,040 $6,077,760 Burglary 73.0 $2,844,080 130.0 $5,064,800 $7,908,880 Auto theft 1.0 $38,960 2.0 $77,920 $116,880 OUI 117.0 $4,558,320 12.0 $467,520 $5,025,840 Larceny/theft 40.0 $1,558,400 98.0 $3,818,080 $5,376,480 Drug laws 0.0 $0 307.0 $11,960,720 $11,960,720 Arson 0.0 $0 12.0 $467,520 $467,520 Liquor laws 1.0 $38,960 0.0 $0 $38,960 Sex Offenses 11.0 $428,560 7.0 $272,720 $701,280 Other 26.0 $1,012,960 37.0 $1,441,520 $2,454,480 Total 591.0 $23,025,360 884.0 $34,440,640 $57,466,000 County/Local jails Homicide 1.0 $38,960 0.3 $11,688 $50,648 Assault 39.6 $1,542,816 44.0 $1,714,240 $3,257,056 Robbery 2.7 $105,192 5.0 $194,800 $299,992 Burglary 13.0 $506,480 22.0 $857,120 $1,363,600 Theft 31.0 $1,207,760 61.0 $2,376,560 $3,584,320 OUI 171.4 $6,677,744 21.0 $818,160 $7,495,904 Stolen property 2.8 $109,088 4.0 $155,840 $264,928 Drug laws 0.0 $0 147.0 $5,727,120 $5,727,120 Liquor laws 49.9 $1,944,104 0.0 $0 $1,944,104 Arson 0.1 $3,896 0.1 $3,896 $7,792 Prostitution 0.2 $7,792 0.7 $27,272 $35,064 Total 311.7 $12,143,832 305.1 $11,886,696 $24,030,528 Total state and local 902.7 $35,169,192 1189.1 $46,327,336 $81,496,528
44
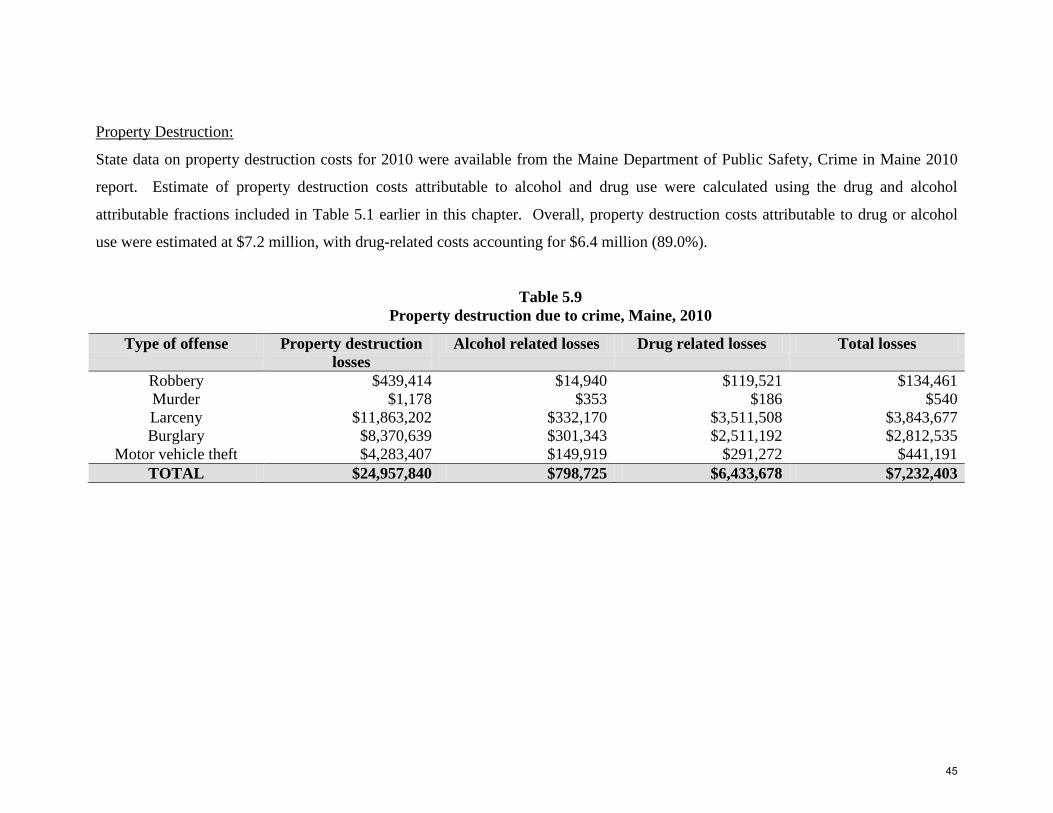
Property Destruction:
State data on property destruction costs for 2010 were available from the Maine Department of Public Safety, Crime in Maine 2010
report. Estimate of property destruction costs attributable to alcohol and drug use were calculated using the drug and alcohol
attributable fractions included in Table 5.1 earlier in this chapter. Overall, property destruction costs attributable to drug or alcohol
use were estimated at $7.2 million, with drug-related costs accounting for $6.4 million (89.0%).
Table 5.9 Property destruction due to crime, Maine, 2010
Type of offense Property destruction losses
Alcohol related losses Drug related losses Total losses
Robbery $439,414 $14,940 $119,521 $134,461 Murder $1,178 $353 $186 $540 Larceny $11,863,202 $332,170 $3,511,508 $3,843,677 Burglary $8,370,639 $301,343 $2,511,192 $2,812,535
Motor vehicle theft $4,283,407 $149,919 $291,272 $441,191 TOTAL $24,957,840 $798,725 $6,433,678 $7,232,403
45

Criminal Victimization:
The economic cost associated with criminal victimization is the value of lost productivity,
including time lost from work and the cost of medical care that the victim requires. There were
no state level data on the number of crime victims, so the number of Part I offenses were used for
the analysis, based upon the assumption that there was one victim per offense. The average
number of days lost from work was estimated in an earlier report by Liu (1992). The number of
offenses was multiplied by the estimated monetary loss, based on lost workdays, and the product
was then multiplied by the appropriate attributable fraction for the offense. The estimated cost of
a work day loss was calculated by taking the median salary, using the rate estimated earlier in
this chapter, $38,960 for Maine by adjusting for inflation the rate from the 2005 cost report to
and dividing by 260 work days ($149.84/day). To calculate the loss of a work day for forcible
rape, the median annual salary for women was used, ($34,965/260=$134.48). The findings are
shown in Table 5.10. As indicated, the total economic loss in 2010 due to criminal victimization
related to drug and alcohol abuse was $3.0 million, with drug abuse accounting for 85.0% of
costs ($2.5 million).
46

Table 5.10 Estimated productivity losses for victims of crime, Maine, 2010
Offense
Number14 of
offenses Average15 work days
Cost per work day16 Total AAF DAF
Alcohol losses Drug losses Total losses
Forcible rape 389 4.6 $134.48 $240,639 0.225 0.024 $54,144 $5,775 $59,919 Aggravated assault 760 3.7 $149.84 $421,350 0.300 0.051 $126,405 $21,489 $147,894
Robbery 416 4.4 $149.84 $274,267 0.034 0.272 $9,325 $74,601 $83,926
Burglary 7,343 1.7 $149.84 $1,870,468 0.036 0.300 $67,337 $561,140 $628,477
Larceny 24,490 1.7 $149.84 $6,238,289 0.028 0.296 $174,672 $1,846,533 $2,021,206
Motor vehicle 985 2.7 $149.84 $398,499 0.035 0.068 $13,947 $27,098 $41,045
TOTAL 34,383 $9,443,512 $445,830 $2,536,637 $2,982,467
14 Crime in Maine, 2010 15 Liu, 1992 16 Based on Median income
47
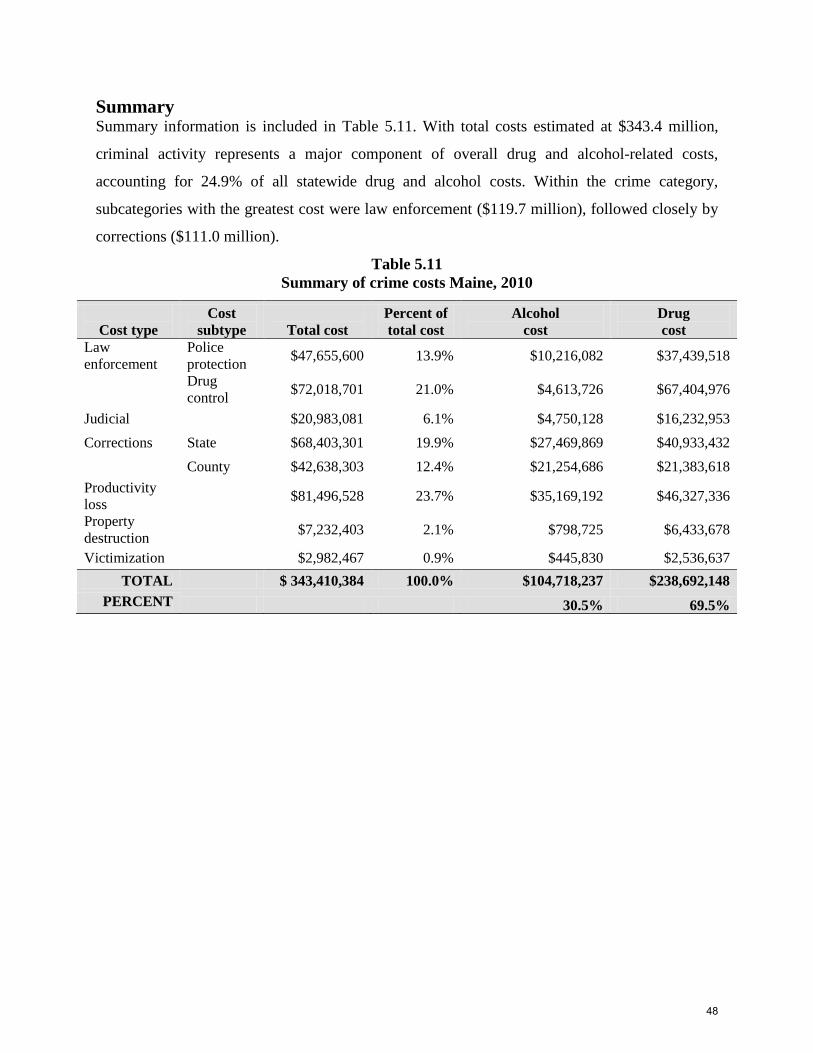
Summary Summary information is included in Table 5.11. With total costs estimated at $343.4 million,
criminal activity represents a major component of overall drug and alcohol-related costs,
accounting for 24.9% of all statewide drug and alcohol costs. Within the crime category,
subcategories with the greatest cost were law enforcement ($119.7 million), followed closely by
corrections ($111.0 million).
Table 5.11 Summary of crime costs Maine, 2010
Cost type
Cost subtype
Total cost
Percent of total cost
Alcohol cost
Drug cost
Law enforcement
Police protection $47,655,600 13.9% $10,216,082 $37,439,518
Drug control $72,018,701 21.0% $4,613,726 $67,404,976
Judicial $20,983,081 6.1% $4,750,128 $16,232,953 Corrections State $68,403,301 19.9% $27,469,869 $40,933,432 County $42,638,303 12.4% $21,254,686 $21,383,618 Productivity loss $81,496,528 23.7% $35,169,192 $46,327,336
Property destruction $7,232,403 2.1% $798,725 $6,433,678
Victimization $2,982,467 0.9% $445,830 $2,536,637 TOTAL $ 343,410,384 100.0% $104,718,237 $238,692,148
PERCENT 30.5% 69.5%
48

Chapter 6
Medical Care Alcohol or drug abuse may increase the risk of illness or injury and thereby increase the use of
health care services. The effects of substance abuse on health care utilization may be obvious and
immediate or more indirect and long term. The link between alcohol and drug use is clear in the
case of an individual overdosing on drugs and then requiring hospitalization, or a drunk driver
who sustains serious injury in an auto accident and requires emergency hospital treatment. But
prolonged alcohol abuse can also increase the risk for a number of diseases, including stomach
cancer, cancer of the esophagus, respiratory tuberculosis, diabetes, and hypertension, thereby
increasing the demand for costly medical care as well as nursing home care.
This chapter analyzes 2010 medical costs for Maine related to drug and alcohol abuse. Four
types of medical costs are reported: inpatient hospital costs, outpatient hospital costs,
prescription drugs and non-durable medical supplies, and nursing home costs.
The major findings of the analysis were:
• There were approximately 6,453 hospital (inpatient) discharges in Maine in 2010 directly
or indirectly related to drug and alcohol use or abuse.
• The total cost of providing hospital inpatient care for these patients, including adjustment
for longer stays due to co-occurring substance dependency, was estimated at $145.1
million, 83.4% of which was related to alcohol use.
• The estimated cost of outpatient medical care was $122.6 million; 74.7% of those costs
were alcohol related.
• Prescription drug costs and nursing home costs attributable to alcohol were, respectively,
$27.7 million and $7.5 million.
• The total estimated medical cost was $302.8 million.
49

Methodology
The estimation of hospital inpatient and outpatient costs were based upon 2010 data from
the Maine Health Data Organization (MHDO, 2013), which gathers information on total hospital
charges, length of stay, diagnosis, gender and age for all hospital discharges in Maine. For this
analysis, MHDO supplied data on patients discharged within selected diagnostic categories
related to drug and alcohol abuse. These data were used to estimate inpatient hospital costs. The
adjustment process used followed the same approach as used to estimate mortality costs (see
Chapter 4) and is commonly known as the illness-specific approach (NIDA/NIAAA, 1998).
This illness-specific approach does not take into account the extra days a patient may stay
in an inpatient hospital setting if he or she has a co-occurring alcohol or drug disorder.
Estimating the costs of these extra days was not possible using the data obtained for this analysis,
but it was possible to use cost estimates generated by the NIDA/NIAAA (1998) national study
and extrapolate these costs to Maine. The NIDA/NIAAA study, which was based on analysis of
over 200,000 records from the U.S. Hospital Discharge Survey, found that hospital inpatient
costs associated with longer stays due to co-occurring alcohol or drug conditions represented
21.3% of substance abuse specific- and substance abuse related-costs. The Maine 2005 cost
estimates derived from the analysis of inpatient discharge data were increased by this same
percentage (21.3%) to account for the longer hospital stays associated with secondary (co-
occurring) diagnoses related to substance abuse. The 2010 cost report continues with this
method.
The estimation of alcohol- and drug-related outpatient costs was also based upon data
from the MHDO. The same approach was used to apply attributable fractions to these costs.
Cost estimates for prescription drugs in Maine came from data from the Kaiser Family
Foundation (2013). As reported in NIDA/NIAAA (1998), the attributable fraction of 2.2% can be
applied to prescription drugs used for the medical treatment of diseases and injuries related to
substance abuse. This figure is based upon earlier research by Harwood et al. (1984), indicating
that 2.2% of expenditures in this category can reasonably be attributed to alcohol abuse (no
equivalent estimates have been made for drug abuse). Cost estimates for nursing home care also
came from the Kaiser Family Foundation (2007). Based upon research from the 1985 National
Nursing Home Survey (NIDA/NIAAA, 1998), it was assumed that 1.0% of all nursing home
expenditures could reasonably be related to alcohol abuse.
50

Results
As shown in Tables 6.1a and 6.1b, 6,453 inpatient hospital discharges occurred as a result
of a medical condition or injury related to drug or alcohol abuse. Approximately 4,189 or 64.9%
of these were related to alcohol abuse. Males accounted for 3,941 discharges (61.1%). Of the
$119.6 million in hospital inpatient costs for alcohol and drugs combined, shown in Table 6.1a
and 6.1b, $99.8 million (83.4%) were for hospital care for an alcohol-related condition or injury.
The major cost categories were: injuries and poisonings, alcohol psychoses and dependence,
acute pancreatitis, drug psychoses and dependence, and cerebrovascular disease.
As discussed earlier, the $119.6 million in hospital inpatient costs shown in Tables 6.1a
and 6.1b is based on data from the MHDO. These costs do not include incremental expenses
associated with treating patients requiring longer hospitalization resulting from co-occurring
alcohol or drug dependence. A 1998 NIDA/NIAAA report estimated these incremental costs at
21.3% of direct alcohol- and drug-related hospital costs. To remain consistent with the 2005 cost
report, the 2010 continued with this method. To account for these other indirect costs, the
estimate of $119.6 million should be multiplied by 1.213, yielding a total cost estimate for
alcohol- and drug-related hospital inpatient costs of $145.1 million.
The estimation of alcohol- and drug-related outpatient costs was also based upon data
from the MHDO. The same approach was used to apply attributable fractions to these costs.
The total alcohol- and drug-related outpatient cost, as shown in Table 6.2 was $122.6 million.
Alcohol related costs represented $91.6 million (74.7%) of these outpatient costs.
Two other medical cost categories included here are prescription drug and nursing home
costs. The estimates for these two categories are shown in Table 6.3. Of the over $2 billion spent
on these two categories it is estimated that $35.2 million is due to alcohol abuse. For
prescription drugs, the estimated cost was $27.7 million. The estimated cost for nursing home
care was $7.5 million. Both of these cost categories are attributable to alcohol alone.
51

Table 6.1a Alcohol-related hospital inpatient direct costs, Maine 2010
Est. number of alcohol-related discharges Estimated alcohol-related inpatient charges
Diagnosis or condition ICD-9 code
Age range AAF Males Females Male Female Total
Alcoholic mental disorders & psychoses 291 All 1 1342 539 $10,027,053 $ 3,558,079 $ 13,585,132 Alcohol dependence syndrome 303 All 1 698 277 $ 3,523,814 $ 1,801,475 $ 5,325,289 Non-dependent abuse of alcohol 305 All 1 59 32 $ 585,283 $ 250,450 $ 835,733 Alcoholic polyneuropathy 357.5 All 1 0 1 $ - $ 30,954 $ 30,954 Alcoholic gastritis 535.3 All 1 2 1 $ 25,571 $ 16,316 $ 41,887 Alcoholic fatty liver 571 All 1 1 0 $ 17,308 $ - $ 17,308 Acute alcoholic hepatitis 571.1 All 1 16 9 $ 327,857 $ 346,564 $ 674,421 Alcoholic cirrhosis of the liver 571.2 All 1 22 6 $ 403,543 $ 224,766 $ 628,309 Alcoholic liver damage, unspecified 571.3 All 1 2 0 $ 12,344 $ - $ 12,344 Toxic effect of alcohol 980 All 1 90 96 $ 1,852,943 $ 1,489,444 $ 3,342,387 Accidental poisoning by alcohol E860.0-.1 All 1 3 1 $ 40,414 $ 21,873 $ 62,287 Cancer of the lip, tongue, oral cavity, pharynx 140-149 >=35 0.5 11 4 $ 155,323 $ 106,566 $ 261,889 Cancer of the esophagus 150 >=35 0.75 32 4 $ 1,623,296 $ 122,630 $ 1,745,927 Cancer of the stomach 151 >=35 0.2 6 4 $ 182,974 $ 172,933 $ 355,907 Cancer of the liver and intrahepatic bile ducts 155.0-155.2 >=35 0.15 4 1 $ 73,568 $ 32,291 $ 105,858 Cancer of the larynx 161 >=35 0.49 4 1 $ 119,684 $ 109,002 $ 228,686 Essential hypertension 401 >=35 0.08 7 10 $ 94,496 $ 158,972 $ 253,469 Cerebrovascular disease 430-438 >=35 0.07 110 109 $ 2,265,830 $ 2,135,263 $ 4,401,093 Respiratory tuberculosis 011-012 >=35 0.25 0 0 $ 3,657 $ 6,312 $ 9,969 Diabetes mellitus 250 >=35 0.05 24 15 $ 474,304 $ 288,274 $ 762,578 Pneumonia and influenza 480-487 >=35 0.05 103 109 $ 1,936,020 $ 1,985,425 $ 3,921,444 Diseases of the esophagus, stomach, duodenum 530-537* >=35 0.1 17 24 $ 399,583 $ 541,127 $ 940,709 Chronic hepatitis 571.4 >=35 0.5 1 1 $ 9,769 $ 3,751 $ 13,520 Cirrhosis without mention of alcohol 571.5 >=35 0.5 10 5 $ 123,106 $ 95,761 $ 218,866 Other chronic nonalcoholic liver damage/disease 571.8 >=35 0.5 0 1 $ - $ 44,501 $ 44,501 Portal hypertension 572.3 >=35 0.5 1 0 $ 44,127 $ - $ 44,127 Acute pancreatitis 577 >=35 0.42 210 139 $ 5,537,993 $ 2,716,143 $ 8,254,136 Chronic pancreatitis 577.1 >=35 0.6 18 10 $ 349,639 $ 145,554 $ 495,193 Injuries and poisonings (see Appendix B1) $25,097,405 $28,082,231 $ 53,179,636
TOTAL 2,791 1,398 $55,306,903 $44,486,655 $99,793,558 *Excluded 535.5 ICD9’s ran but zero cases found: 425.5, 571.9, 790.3 Due to rounding, totals may not equal 100%.
52

Table 6.1b Drug-related hospital inpatient direct costs, Maine 2010
Est. number of drug-related discharges Estimated drug-related inpatient charges
Diagnosis or condition ICD-9 code Age range DAF Males Females Male Female Total
Drug mental disorders & psychoses 292 All 1 655 526 $ 4,354,798 $3,417,555 $7,772,353 Drug dependence 304 All 1 217 162 $ 1,763,578 $1,351,869 $3,115,447 Nondependent abuse of drugs 305.2-.9 All 1 29 10 $ 254,725 $99,766 $354,491 Polyneuropathy due to drugs 357.6 All 1 1 0 $ 22,719 $ - $ 22,719 Drug dependence complicating pregnancy, childbirth, or puerperium 648.3 All 1 0 60 $ - $33,762 $ 333,762
Drugs affecting fetus or newborn via placenta or breast
760.72, .73, .75 All 1 1 0 $ 21,752 $ - $ 21,752
Drug withdrawal syndrome in newborn 779.5 All 1 10 6 $ 301,079 $113,582 $414,661 Fetal damage due to drugs 655.5 All 1 0 1 $ - $ 3,614 $ 3,614 Poisoning by opiates and related narcotics 965 All 1 88 128 $1,385,769 $1,779,549 $3,165,318 Poisoning by sedatives and hypnotics 967 All 1 13 16 $190,896 $154,555 $ 345,451 Poisoning by central nervous system muscle tone depressants 968 All 1 0 0 $ - $ - $ -
Poisoning by psychotropic agents 969 All 1 127 199 $1,625,010 $2,441,492 $ 4,066,502 Poisoning by central nervous system Stimulants 970 All 1 9 6 $163,925 $ 24,476 $ 188,401 TOTAL 1150 1114 $10,084,482 $ 9,720,220 $19,804,471
53
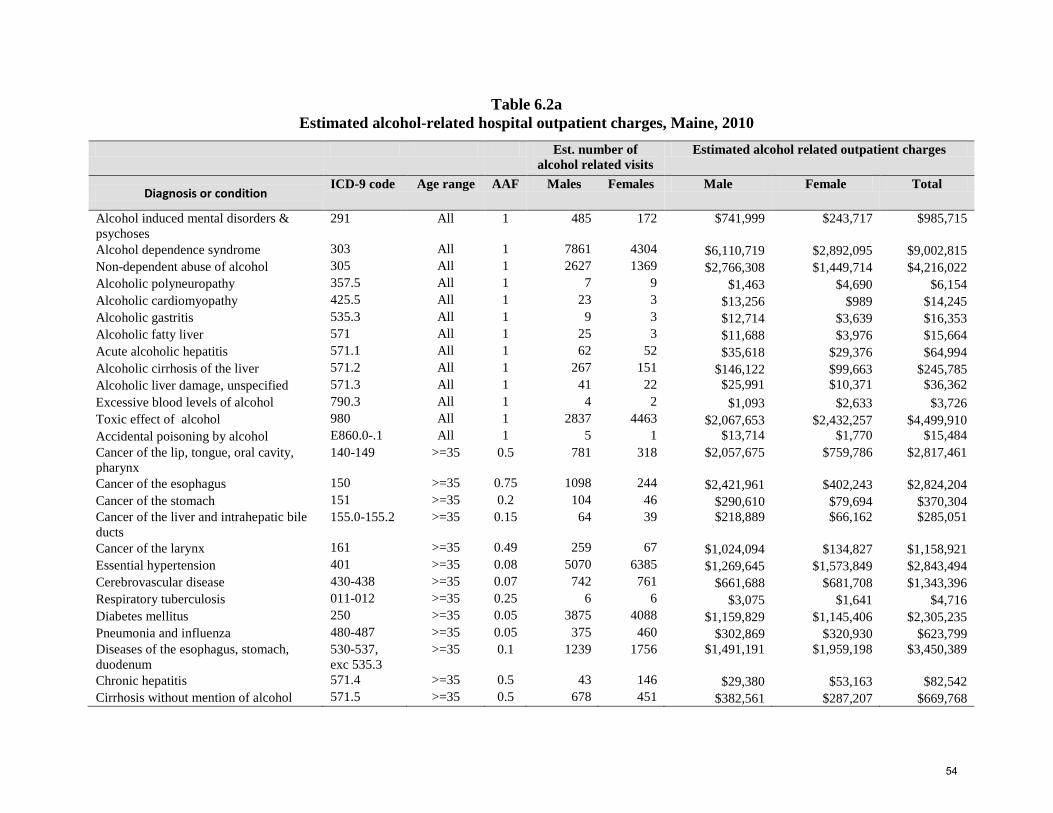
Table 6.2a Estimated alcohol-related hospital outpatient charges, Maine, 2010
Est. number of alcohol related visits
Estimated alcohol related outpatient charges
Diagnosis or condition ICD-9 code Age range AAF Males Females Male Female Total
Alcohol induced mental disorders & psychoses
291 All 1 485 172 $741,999 $243,717 $985,715
Alcohol dependence syndrome 303 All 1 7861 4304 $6,110,719 $2,892,095 $9,002,815 Non-dependent abuse of alcohol 305 All 1 2627 1369 $2,766,308 $1,449,714 $4,216,022 Alcoholic polyneuropathy 357.5 All 1 7 9 $1,463 $4,690 $6,154 Alcoholic cardiomyopathy 425.5 All 1 23 3 $13,256 $989 $14,245 Alcoholic gastritis 535.3 All 1 9 3 $12,714 $3,639 $16,353 Alcoholic fatty liver 571 All 1 25 3 $11,688 $3,976 $15,664 Acute alcoholic hepatitis 571.1 All 1 62 52 $35,618 $29,376 $64,994 Alcoholic cirrhosis of the liver 571.2 All 1 267 151 $146,122 $99,663 $245,785 Alcoholic liver damage, unspecified 571.3 All 1 41 22 $25,991 $10,371 $36,362 Excessive blood levels of alcohol 790.3 All 1 4 2 $1,093 $2,633 $3,726 Toxic effect of alcohol 980 All 1 2837 4463 $2,067,653 $2,432,257 $4,499,910 Accidental poisoning by alcohol E860.0-.1 All 1 5 1 $13,714 $1,770 $15,484 Cancer of the lip, tongue, oral cavity, pharynx
140-149 >=35 0.5 781 318 $2,057,675 $759,786 $2,817,461
Cancer of the esophagus 150 >=35 0.75 1098 244 $2,421,961 $402,243 $2,824,204 Cancer of the stomach 151 >=35 0.2 104 46 $290,610 $79,694 $370,304 Cancer of the liver and intrahepatic bile ducts
155.0-155.2 >=35 0.15 64 39 $218,889 $66,162 $285,051
Cancer of the larynx 161 >=35 0.49 259 67 $1,024,094 $134,827 $1,158,921 Essential hypertension 401 >=35 0.08 5070 6385 $1,269,645 $1,573,849 $2,843,494 Cerebrovascular disease 430-438 >=35 0.07 742 761 $661,688 $681,708 $1,343,396 Respiratory tuberculosis 011-012 >=35 0.25 6 6 $3,075 $1,641 $4,716 Diabetes mellitus 250 >=35 0.05 3875 4088 $1,159,829 $1,145,406 $2,305,235 Pneumonia and influenza 480-487 >=35 0.05 375 460 $302,869 $320,930 $623,799 Diseases of the esophagus, stomach, duodenum
530-537, exc 535.3
>=35 0.1 1239 1756 $1,491,191 $1,959,198 $3,450,389
Chronic hepatitis 571.4 >=35 0.5 43 146 $29,380 $53,163 $82,542 Cirrhosis without mention of alcohol 571.5 >=35 0.5 678 451 $382,561 $287,207 $669,768
54

Other chronic nonalcoholic liver damage & disease
571.8 >=35 0.5 277 333 $265,018 $199,717 $464,735
Unspecified chronic liver disease w/o mention of alcohol
571.9 >=35 0.5 37 51 $12,411 $16,487 $28,897
Portal hypertension 572.3 >=35 0.5 22 15 $35,881 $17,093 $52,974 Acute pancreatitis 577 >=35 0.42 337 299 $467,210 $399,631 $866,841 Chronic pancreatitis 577.1 >=35 0.6 225 163 $358,438 $235,220 $593,658 Injury (see appendix B2) 23,404 23,415 $28,900,354 $22,755,260 $51,655,614 *Total (Alcohol) 29,482 26,179 $ 53,301,117 $ 38,264,112 $ 91,565,229 * Total may not equal above due to rounding
Table 6.2b Estimated drug-related hospital outpatient charges, Maine, 2010
Est. Number of Drug Related Visits
Estimated Alcohol Related Outpatient Charges
Diagnosis or Condition ICD-9 Code Age Range
AAF Males Females Male Female Total
Drug psychoses 292 All 1 734 722 $625,984 $648,422 $625,984 Drug dependence 304 All 1 18237 18728 $11,586,512 $10,735,846 $11,586,512 Nondependent abuse of drugs 305.2-.9 All 1 3072 3003 $1,946,450 $1,842,284 $1,946,450 Polyneuropathy due to drugs 357.6 All 1 2 12 $326 $7,457 $326 Drug dependence complicating pregnancy, childbirth, or puerperium
648.3 All 1 0 1072 $522,266 $0
Drugs affecting fetus or newborn via placenta or breast
760.72, .73, .75
All 1 15 15 $9,003 $12,040 $9,003
Drug withdrawal syndrome in newborn 779.5 All 1 45 38 $6,068 $5,722 $6,068 Fetal damage due to drugs 655.5 All 1 0 316 $253,023 $0 Poisoning by opiates and related narcotics
965 All 1 228 299 $421,481 $551,374 $421,481
Poisoning by sedatives and hypnotics 967 All 1 46 65 $74,920 $147,729 $74,920 Poisoning by central nervous system muscle tone depressants
968 All 1 3 2 $2,091 $2,003 $2,091
Poisoning by psychotropic agents 969 All 1 315 462 $662,017 $884,209 $662,017 Poisoning by central nervous system Stimulants
970 All 1 28 22 $40,272 $34,777 $40,272
* Total (Drug) 22,725 24,756 $ 15,375,123 $ 15,647,151 $ 31,022,274 * Total may not equal above due to rounding.
55

Table 6.2C
Total estimated alcohol and drug-related hospital inpatient and outpatient charges, Maine, 2010
Male Female Cost-Male Cost-Female Total Total Adjusted
Inpatient
Alcohol 2,791 1,398 $55,306,903 $44,486,655 $99,793,558 $99,793,558
Drug 1,150 1,114 $10,084,482 $9,720,220 $19,804,471 $19,804,471 Adjust for long-term
inpatient (.213) $25,474,380
Total Inpatient 3,941 2,512 $65,391,385 $54,206,875 $119,598,260 145,072,409
Outpatient Alcohol 29,482 26,179 $53,301,117 $38,264,112 $91,565,229 $91,565,229 Drug 22,725 24,756 $15,375,123 $15,647,152 $31,022,275 $31,022,275 Total Outpatient 52,207 50,935 $68,676,240 $53,911,264 $122,587,504 $122,587,504 TOTAL 56,148 53,447 $120,120,913 $100,458,657 $242,285,764 $267,659,913
56
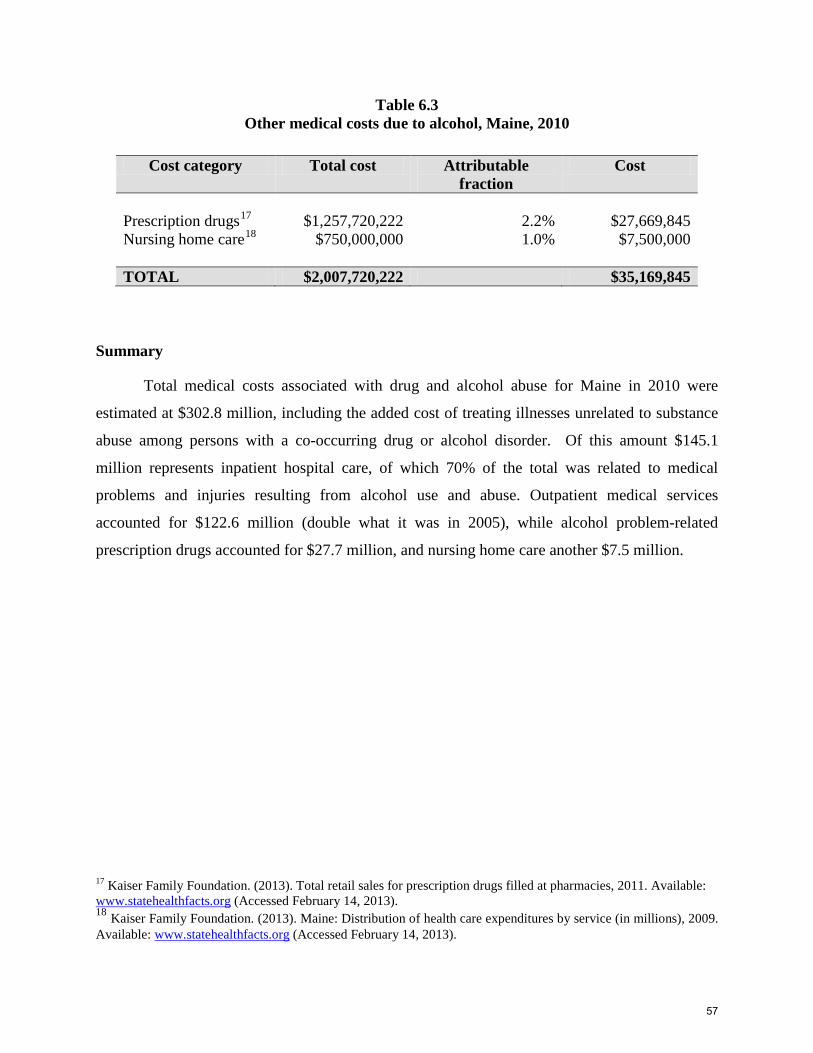
Table 6.3 Other medical costs due to alcohol, Maine, 2010
Summary
Total medical costs associated with drug and alcohol abuse for Maine in 2010 were
estimated at $302.8 million, including the added cost of treating illnesses unrelated to substance
abuse among persons with a co-occurring drug or alcohol disorder. Of this amount $145.1
million represents inpatient hospital care, of which 70% of the total was related to medical
problems and injuries resulting from alcohol use and abuse. Outpatient medical services
accounted for $122.6 million (double what it was in 2005), while alcohol problem-related
prescription drugs accounted for $27.7 million, and nursing home care another $7.5 million.
17 Kaiser Family Foundation. (2013). Total retail sales for prescription drugs filled at pharmacies, 2011. Available: www.statehealthfacts.org (Accessed February 14, 2013). 18 Kaiser Family Foundation. (2013). Maine: Distribution of health care expenditures by service (in millions), 2009. Available: www.statehealthfacts.org (Accessed February 14, 2013).
Cost category Total cost Attributable fraction
Cost
Prescription drugs17 $1,257,720,222 2.2% $27,669,845 Nursing home care18 $750,000,000 1.0% $7,500,000 TOTAL $2,007,720,222 $35,169,845
57

Chapter 7
Other Related Costs
In addition to the costs examined in the previous chapters, there are three other drug and alcohol-
related costs that are included in this analysis. These are the substance abuse related costs of:
1) child welfare and the administration of other social welfare programs, 2) fire protection and
the destruction caused by fire, and 3) the non-medical costs of motor vehicle accidents. The
general methodology used to estimate these costs was similar to that used to estimate other costs.
Attributable risk coefficients, used by Rice at al. (1990) and NIDA/NIAAA (1998), were applied
to cost data obtained from secondary data sources and used to generate estimates of costs related
to drug and alcohol abuse.
The major findings of the analysis were:
• An estimated $45.9 million in child welfare costs related to substance abuse was spent in
Maine during 2010.
• An estimated $3.5 million was spent on social welfare administration in Maine during 2010
related to drug and alcohol abuse.
• Alcohol is believed to play a role in a large proportion of fires. In 2010, the estimated cost of
these fires in Maine was $9.5 million.
• The non-medical cost of alcohol-related motor vehicle crashes in Maine in 2010 is estimated
at $53.0 million.
• The combined cost of all of these cost categories was $111.9 million.
Methodology
Since the methods used to derive the cost estimates vary among the three areas, the
methodological description is provided as part of the results sections.
58

Results
Child welfare Although there is little documented data on this subject for Maine, a report by the Maine
Bureau of Child and Family Services (BCFS, 2003) to the Maine Legislature indicates that 50%
or more of the Bureau’s clients in SFY03 needed substance abuse services. This estimate is
supported by data from the National Center on Addiction and Substance Abuse at Columbia
University (CASA, 1999), which states that in a survey of child welfare professionals, the vast
majority felt that “substance abuse causes or contributes to at least half of all cases of child
maltreatment.” This report goes on to suggest that, based on additional research, an average of
70% of cases of child abuse and neglect are directly or indirectly associated with substance
abuse. Data in the Child Protective Services 2010 report (OCFS, 2010) recognized alcohol and
drug misuse of the caretaker or family member was identified 1,943 times as a stress factor
during assessments. For this report, with agreement from the Office of Child and Family
Services we will use 52.6% (1,119 cases), which is the exact percentage of substantiated cases of
child abuse where alcohol and or drug abuse was identified as one of the multiple risk factors for
removing a child. We will continue to use the 2005 methodology that assumes that of the
substance-abuse related cases, 67% were due to alcohol abuse by parents or guardians and 33%
were due to drug abuse, based on NIDA/NIAAA’s distribution of social welfare administration
costs.
The estimated total cost of protecting Maine’s children from abuse and neglect in 2010
was $87,250.00 (MDHHS OCFS, 2013). The 2010 expenditures were lower than 2005 due to
multiple factors, including increase in attrition, salary freezes, and state government shut down
days, etc., rather than a decrease in the need for social services. Applying the above-mentioned
proportion 52.6% to this total, child welfare costs due to substance abuse were $45.9 million,
with $30.7 million due to alcohol abuse and $15.1 million due to drug abuse.
Social Welfare Administration
Social welfare programs serve individuals with substance abuse problems. Therefore, it is
appropriate to include a portion of these expenses as part of the overall costs of substance abuse.
Direct welfare payments to clients, however, are considered transfer (redistribution) payments,
and thus are not included.
59

Drug and alcohol-related administrative costs for social welfare programs are shown in
Table 7.1. The first two program categories shown are OASDI and SSI, two federal programs
representing Old Age, Survivors and Disability Insurance (Social Security Administration,
OASDI, Table 2) and Supplemental Security Income (Social Security Administration, Table SSI-
7). In December 2010 in Maine, 299,875 persons (22.6% of the total population, which is 10%
higher than in 2005) were receiving Social Security benefits (185,849 retired workers, 22,473
widows and widowers, 55,525 disabled workers, 11,878 wives and husbands, and 24,150
children). In December 2010, 35,426 persons were receiving Supplemental Security Income
(SSI). Of these, 1,988 were aged, 215 were blind, and 33,223 were disabled (SSA, 2010). The
next program category represents Temporary Assistance for Needy Families (U.S. Department of
Health and Human Services, 2007, TANF, Table C) and the food stamp program, SNAP (U.S.
Department of Agriculture, 2007). The final category is veterans’ pensions and rehabilitation
(U.S. Veterans Administration, Table 22). After applying the relevant attributable fractions, the
total estimated cost for all social welfare programs combined is approximately $3.5 million, $2.4
million attributed to alcohol and $1.2 million to drugs.
Table 7.1 Estimated administrative costs of selected social welfare programs
attributed to substance abuse, Maine, 2010
Total AAF/DAF Alcohol and Attributed to: Program administrative drug admin. Alcohol Drugs Costs costs (67%) (33%) % [1] combined [1] [1] OASDI [2] $94,484,000 1.7 $1,606,228 $1,076,173 $530,055 SSI [3] $13,547,943 3.0 $406,438 $272,314 $134,125 TANF [4] $2,813,267 5.2 $146,290 $98,014 $48,276 SNAP [5] $21,009,743 5.2 $1,092,507 $731,979 $360,527 Veterans compensation $17,042,056 1.7 $289,715 $194,109 $95,606 and pension [6] Total $148,897,009 $3,541,178 $2,372,589 $1,168,589 Notes and Sources: [1] NIDA/NIAAA, 1998, Table D.3. [2] Social Security Administration; Old Age, Survivors and Disability Insurance (OASDI), 2006, Table 5 [3] Social Security Administration; Supplemental Security Income (SSI), 2006,Table 7.B7 [4] U.S. Dept. of Health and Human Services; Temporary Assistance for Needy Families (TANF), Table B (FY 2005) [5] U.S. Dept. of Agriculture; Food Stamp Program Annual Benefits (FY 2005) [6] U.S. Department of Veterans Affairs, 2011: Veterans Benefits Administration, Annual Benefits Report (FY 2010) p. 130.
60

Fire Destruction
Alcohol plays a role in economic losses resulting from fire destruction. While the precise
extent of this role is unknown, the best available information from an early study (Berry &
Boland, 1973) suggests that approximately 6.1% of structural fire destruction and 11.2% of fire
protection costs can be associated with alcohol use. Because the total cost of structural damage
and fire protection in Maine is not available, these values were determined by using national data
and adjusting for inflation and Maine’s population size. The source of structural fire damage
cost was from the National Fire Protection Association (2012) and the costs of fire protection
were originally from the U. S. Census Bureau (1994) and cited in NIDA/NIAAA (1998). The
National Fire Protection Association estimated a cost of $34.60 per capita for the Northeast
region for structural fire damage (Karter, 2012). Northeast was defined to include Connecticut,
Maine, Massachusetts, New Hampshire, New Jersey, New York, Pennsylvania, Rhode Island,
and Vermont. The resulting estimated cost of fire destruction related to alcohol abuse is $9.5
million.
Table 7.2 Estimated Alcohol-Related Cost of Fire Protection and Property Damage and Destruction
Maine, 2010
Total Alcohol Total Type of Cost/Loss Costs/Losses Attributable Alcohol-Related Fraction [3] Losses ($) Fire Protection Costs [1] $61,835,205 0.112 $6,925,543 Property Damage/Destruction [2] Residential Structure $33,031,556 0.061 $2,014,925
Other Structure
$8,413,307 0.061 $513,212 Total $9,453,680 Notes and Sources: [1] U. S. Bureau of the Census, 1994; adjusted for Maine population and inflation [2] National Fire Protection Association, 2011; Fire Loss in the United States During 2010
61

Motor Vehicle Crashes (Non-Medical Costs) Use or abuse of drugs and alcohol is a significant risk factor for motor vehicle accidents.
Costs resulting from alcohol- or drug-related accidents result in premature death, medical care,
vehicle damage, and legal and court costs. The costs related to premature death were presented
in Chapter 4 and those related to medical care were reported in Chapter 6. This section reports
on other motor vehicle accident costs, including legal and court costs, insurance administration,
and vehicle damage. The source of the cost data is NIDA/NIAAA (1998, Table 6-17). Data on
the percent of alcohol-related fatalities in Maine was provided by the U.S. Department of
Transportation, Traffic Safety Facts, 2010.
While drug abuse is known to contribute to some accidents, there is no published, reliable
research on the frequency of drug-related accidents. Because of this lack of data, a national cost
study (NIDA/NIAAA, 1998) limited the cost estimates to alcohol-related crashes only. The
same approach is followed here. National data on the costs of motor vehicle crashes presented in
NIDA/NIAAA (1998) were adjusted for inflation and Maine’s population size. Table 7.3 shows
the resulting estimates by type of cost for Maine and the percentage attributable to alcohol abuse
(Appendix C shows greater detail). In Maine during 2010, there were 161 total motor vehicle
fatalities. Thirty-eight (23% of total) were instances in which a driver had a blood alcohol level
of 0.08 g/dl or greater. The total non-medical costs of alcohol-related automobile accidents were
estimated at $53.1 million. The most costly accident category was property damage, which
accounted for 35.4% of the total costs, followed by minimum/moderate injury accidents, 27.4%.
62
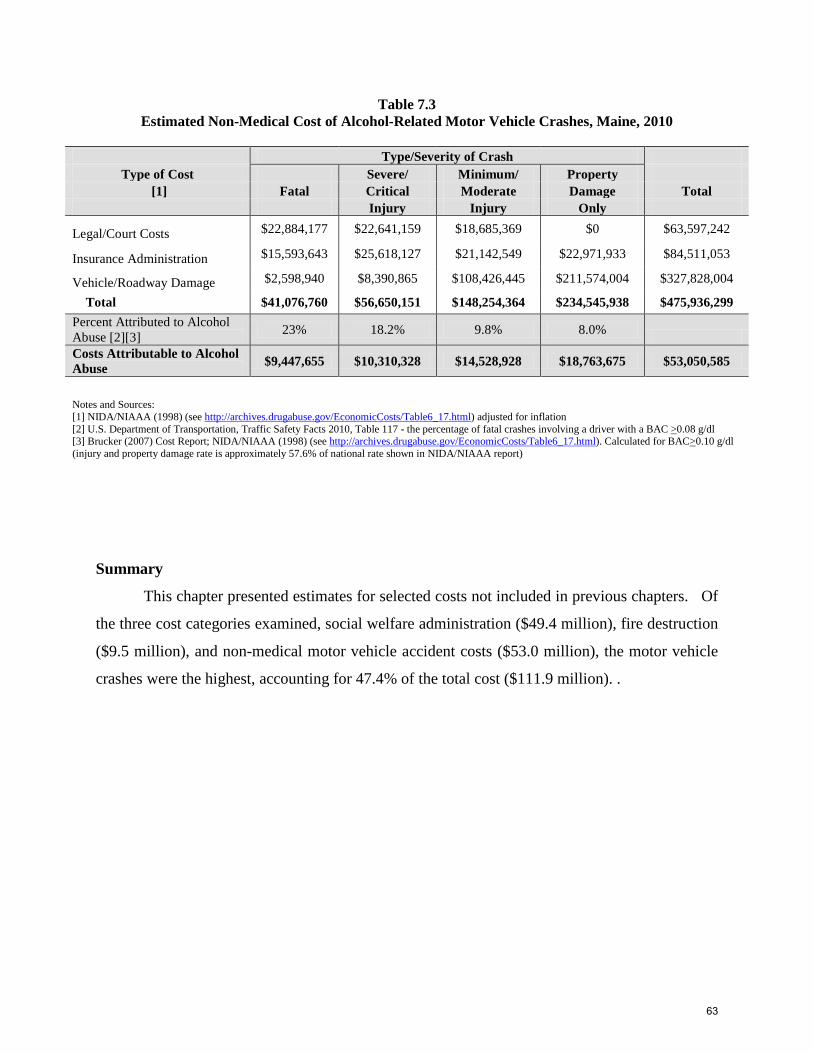
Table 7.3 Estimated Non-Medical Cost of Alcohol-Related Motor Vehicle Crashes, Maine, 2010
Type/Severity of Crash
Type of Cost Severe/ Minimum/ Property [1] Fatal Critical Moderate Damage Total
Injury Injury Only
Legal/Court Costs $22,884,177 $22,641,159 $18,685,369 $0 $63,597,242
Insurance Administration $15,593,643 $25,618,127 $21,142,549 $22,971,933 $84,511,053
Vehicle/Roadway Damage $2,598,940 $8,390,865 $108,426,445 $211,574,004 $327,828,004
Total $41,076,760 $56,650,151 $148,254,364 $234,545,938 $475,936,299 Percent Attributed to Alcohol Abuse [2][3] 23% 18.2% 9.8% 8.0% Costs Attributable to Alcohol Abuse $9,447,655 $10,310,328 $14,528,928 $18,763,675 $53,050,585
Notes and Sources: [1] NIDA/NIAAA (1998) (see http://archives.drugabuse.gov/EconomicCosts/Table6_17.html) adjusted for inflation [2] U.S. Department of Transportation, Traffic Safety Facts 2010, Table 117 - the percentage of fatal crashes involving a driver with a BAC >0.08 g/dl [3] Brucker (2007) Cost Report; NIDA/NIAAA (1998) (see http://archives.drugabuse.gov/EconomicCosts/Table6_17.html). Calculated for BAC>0.10 g/dl (injury and property damage rate is approximately 57.6% of national rate shown in NIDA/NIAAA report)
Summary
This chapter presented estimates for selected costs not included in previous chapters. Of
the three cost categories examined, social welfare administration ($49.4 million), fire destruction
($9.5 million), and non-medical motor vehicle accident costs ($53.0 million), the motor vehicle
crashes were the highest, accounting for 47.4% of the total cost ($111.9 million). .
63

Chapter 8
Summary
The purpose of this report has been to determine in economic terms the cost to society of
substance abuse among Maine residents in 2010. We have quantified these costs according to
the major categories in which actual costs are expended or opportunities for economic
productivity are lost: substance abuse treatment; morbidity; mortality; crime; medical care; and
other related costs. Although this type of analysis cannot measure the emotional toll exacted by
alcohol and drug abuse, and devalues certain segments of the population (e.g., youth,
homemakers and the elderly), it nonetheless provides a valuable comparison between the
resources invested in the prevention and treatment of substance abuse, and the costs resulting
from these disorders. This report also provides a benchmark for tracking changes in these costs
over time; allowing comparisons between the similarly structured 2000 and 2005 cost reports.19
Major Findings
• In 2010, the total estimated cost of substance abuse in Maine was $1.403 billion.
• This $1.403 billion translates into an annual cost of $1,057 for every resident of
Maine.
• Substance abuse treatment ($47.0 million) comprised the smallest category of total
cost (3.3%), while mortality ($409.6 million) comprised the largest (29.2%).
Overview
The total 2010 economic cost of drug and alcohol abuse in Maine was estimated at $1.403 billion
(see Table 8 for a breakdown by category). Figure 8.1 graphically compares the 2000, 2005 and
2010 category amounts. The largest single cost category in 2010 was mortality, accounting for
an estimated $409.6 million, followed by crime, $343.4 million, medical care, $302.8 million,
morbidity $166.1 million, and other related costs, $111.9 million. The total cost of $1.381
billion translates to a per capita cost of $1,040 for every Maine resident in 2010. The proportion
19 As we have specified throughout the report, care is needed in making comparisons with previous cost reports. It is important to verify the details of the methodology to verify the same procedures and attributable were used. Although we have utilized the same methods in most sections, there are changes; these are specified in the report.
64

of the total cost attributed to different categories have not changed dramatically since 2005, but
nearly all categories have increased. Shown as percentages of the total cost in 2010 (Figure 8.2),
crime and mortality accounted for the largest portions of the total cost.
Table 8 Summary: Estimated Cost of Alcohol and Drug Abuse by Category
Maine, 2010 Category Cost % TREATMENT $46,975,900 3.3% MORBIDITY $188,637,664 13.4% MORTALITY $409,642,749 29.2% CRIME $343,410,384 24.5% Law Enforcement $119,674,301 Police Protection $47,655,600 Drug Control $72,018,701 Supply/Demand Reduction (Federal) $64,681,757 Prevention (State) $7,336,944 Judicial $20,983,081 Corrections $111,041,604 State $68,403,301 County $42,638,303 Other $91,711,398 Productivity Loss Due to Incarceration $81,496,528 Property Destruction Due to Crime $7,232,403 Productivity Loss for Victims $2,982,467 MEDICAL CARE $302,829,757 21.6% Hospital Care $267,659,913 Inpatient $145,072,409 Outpatient $122,587,504 Other Costs $35,169,844 Prescription Drugs $27,669,844 Nursing Home $7,500,000 OTHER $111,938,943 8.0% Social Welfare $49,434,678 Child Welfare $45,893,500 Other Welfare (Administration Only) $3,541,178 Fire Protection and Destruction Due to Fire $9,453,680 Motor Vehicle Crashes (Non-Medical Costs) $53,050,585 TOTAL $1,403,435,398 100.00%
65

Figure 8.1
66

Figure 8.2
Conclusions The total estimated cost of substance abuse in Maine in 2010 was $1.403 billion,
compared to $898.4 million in 2005, an increase of 56.2%. The category comprising the
smallest proportion of the total cost (3.3%) was substance abuse treatment at $47.0 million. At
$409.6 million, the category showing the highest estimated cost was mortality (29.2% of total).
This is a change from the 2000 and 2005 reports where crime was the highest cost factor. At
least 39% of total costs of substance use and abuse are due to drugs. Because some of the cost
categories, such as motor vehicle crashes, do not measure the impact of drugs, this percent is
likely an underestimate.
Although the goal of this report was to document the economic costs associated with drug
and alcohol abuse, readers should keep in mind that substance abuse also has serious
consequences that affect individuals and their families in ways that cannot be quantified through
economic analysis. In 2010, it was estimated that 713 persons in Maine died of causes related to
drug or alcohol abuse, resulting in a potential loss of 15,896 years of life, and substantially more
people suffered from substance-related illnesses, injuries, and domestic violence. Clearly, the
consumption of alcohol and other drugs creates costs that are not only born by the producer or
the consumer of the products, but also by society as a whole, including substantial lost economic
productivity.
67

References Bouchery, E., Simon, C., and Harwood, H. (2010, December) Economic costs of excessive alcohol consumption in the United States, 2006. Submitted by The Lewin Group, Inc. for The Centers for Disease Control and Prevention. Brucker, D. (2007, December). The cost of alcohol and drug abuse in Maine, 2005. Augusta, ME: Division of Data and Research, Office of Substance Abuse, Department of Health and Human Services. CASAColumbia: National Center on Addiction and Substance Abuse at Columbia University. (1999) No safe haven: Children of substance abusing parents. New York, NY: Author. Harwood, HJ, Napolitano, DM, Krisianson, P. and Collins, JJ. (1984). The economic costs to society of alcohol and drug abuse and mental illness: 1980. Research Triangle Park, NC: Research Triangle Institute. Inflation data U.S. (2012). Cumulative inflation calculator. Retrieved from http://inflationdata.com/inflation/Inflation_Rate/InflationCalculator.asp#results; Accessed multiple times in 2011, 2012) Karter, M.J. (2012). Fire loss in the United States during 2011. Quincy, MA: National Fire Protection Association. Retrieved from http://www.nfpa.org/assets/files/PDF/OS.fireloss.pdf Maine Dept. of Corrections. (2012) Sentence counts by offense. For 1/1/2010 – 12/31/2010. Unpublished data. (Ellis King) Maine Dept. of Health and Human Services, Office of Child and Family Services (2013) Personal communication with Bill Fox, Program Fiscal Coordinator. Unpublished data. Maine Dept. of Health and Human Services, Office of Data, Research, and Vital Statistics. (2012). Unpublished alcohol and drug related mortality data. Kim Haggan. Maine Dept. of Public Safety. (2012) Crime in Maine, 2010. Retrieved from http://www.maine.gov/dps/cim/crime_in_maine/2010contents.htm Maine Health Data Organization. (2013). Inpatient and outpatient data for 2010 completed data run by William Kilbreth and Thomas Seger, February 8, 2013. Max, W., Rice, D. P., Sung, H., and Michel, M. (2004) Valuing human life: Estimating the PVLE, 2000. Retrieved from http://escholarship.org/uc/item/82d0550k National Institute on Drug Abuse (1998). The Economic costs of drug and alcohol abuse in the United States, 1992. Bethesda, MD: Author.
68

Office of National Drug Control Policy (2004). The economic costs of drug abuse in the United States, 1992-2002. Washington, DC: Executive Office of the President (Publication no. 207303) Retrieved from https://www.ncjrs.gov/ondcppubs/publications/pdf/economic_costs.pdf Office of National Drug Control Policy (2010) National Drug Control Strategy : FY 2011 Budget Summary. Washington, DC: Executive Office of the President Retrieved from: http://www.whitehouse.gov/sites/default/files/ondcp/policy-and-research/fy11budget.pdf Rice, DP, Kelman, S, Miller, LS, and Dunmeyer, S. (1990). The economic costs of alcohol and drug abuse and mental illness: 1985. Bethesda, MD: National Institute on Drug Abuse Social Science Research Council. (2010/2011). Life expectancy for females and males living in Maine. Retrieved from http://www.measureofamerica.org/maps/ (accessed on 1/23/2013) U.S. Social Security Administration. (2010). Social Security Administrative expenses: Administrative expenses as a percentage of total expenditures, 1957-2012. Administrative expenses for 2010: 0.9% of total, 0.6% of OASI, 2.3% of DI Retrieved from http://www.ssa.gov/OACT/STATS/admin.html U.S. Social Security Administration. (2010). State statistics for December 2010: Maine, Retrieved from http://www.ssa.gov/policy/docs/factsheets/cong_stats/2010/me.html Substance Abuse and Mental Health Services Administration. (2011) Data from National Survey on Drug Use and Health (NSDUH), with years 2006-2009 aggregated by Art Hughes, Center for Behavioral Health Statistics. Unpublished data. Substance Abuse and Mental Health Services Administration. (2013) Maine estimates based on National Survey of Drug Use and Health 2010, 2011 data run through R-DAS by Art Hughes, Center for Behavioral Health Statistics. Unpublished data. U.S. Dept. of Agriculture (2011). Food and nutrition service. Supplemental nutrition assistance program state activity report- federal fiscal year 2010. Table 1: Supplemental nutrition and assistance program participation and issuance. Retrieved from http://www.fns.usda.gov/snap/qc/pdfs/2010_state_activity.pdf US Census Bureau. (2010). 2010 Census Interactive Population Search. Retrieved from http://2010.census.gov/2010census/popmap/ipmtext.php?fl=23 US Census Bureau. (2007). M1901-M1902. Median earnings for male and female full-time year round workers (in 2005 inflation-adjusted dollars). 2005 American Community Survey. US Census Bureau, Population Division. (2007). Table 1: Annual estimates of the population by five year age groups and sex: April 1, 2000 to July 1, 2006. Retrieved from http://www.census.gov/popest/national/asrh/NC-EST2006/NC-EST2006-01.xls
69

US Dept. of Health and Human Services. (2011). TANF financial data. FY 2010. Table C.2.a: State maintenance of effort (MOE) expenditures in the TANF program in FY 2010. Retrieved from http://www.acf.hhs.gov/sites/default/files/ofa/2010_tanf_data_with_states.pdf US Dept. of Justice. (2012). Sourcebook of criminal justice statistics. Retrieved from http://www.albany.edu/sourcebook/pdf/t100112012.pdf U.S. Dept. of Justice Programs, Bureau of Justice Statistics (11/27/2012) Conversation with Todd Minton, Research Analyst. regarding data from the 2011 U.S. DOJ, Bureau of Justice Statistics survey. US Dept. of Labor, Bureau of Labor Statistics. (2010). Archived Consumer Price Index detailed report tables. Retrieved from www.bls.gov/cpi/cpi_dr.htm#2000. US Dept. of Labor, Bureau of Labor Statistics. (2012). Maine median earnings in 2005. Retrieved from http://www.bls.gov/oes/current/oes_me.htm#b00-0000. US Dept. of Labor, Bureau of Labor Statistics. (2010). Employment status of civilian non-institutional population. Retrieved from http://www.bls.gov/lau/table14full10.pdf US Dept. of Transportation, National Highway Traffic Safety Administration. (2012). Traffic safety facts 2010. Retrieved from http://www-nrd.nhtsa.dot.gov/Pubs/811659.pdf US Dept. of Transportation, National Highway Traffic Safety Administration. (February 2012). Traffic Safety Facts 2010: Research Note. Retrieved from http://www.nrd.nhtsa.dot.gov/Pubs/811552.pdf US Dept. of Veterans Affairs. (2010). Veteran benefits administrations. Annual benefits report, 2010. Retrieved from http://www.vba.va.gov/REPORTS/abr/ US Office of National Drug Control Policy. (2011). ADAM II 2010 Annual Report. Retrieved from http://www.whitehouse.gov/sites/default/files/ondcp/policy-and-research/adam2010.pdf Webster, BH and Bishaw, A. (2006). Income, earnings, and poverty: Data from the 2005 American Community Survey (ACS-02). Washington DC: U.S. Government Printing Office. Wickizer, TM. (2007). The economic costs of drug and alcohol abuse in Washington State, 2005. Seattle, WA: University of Washington.
70
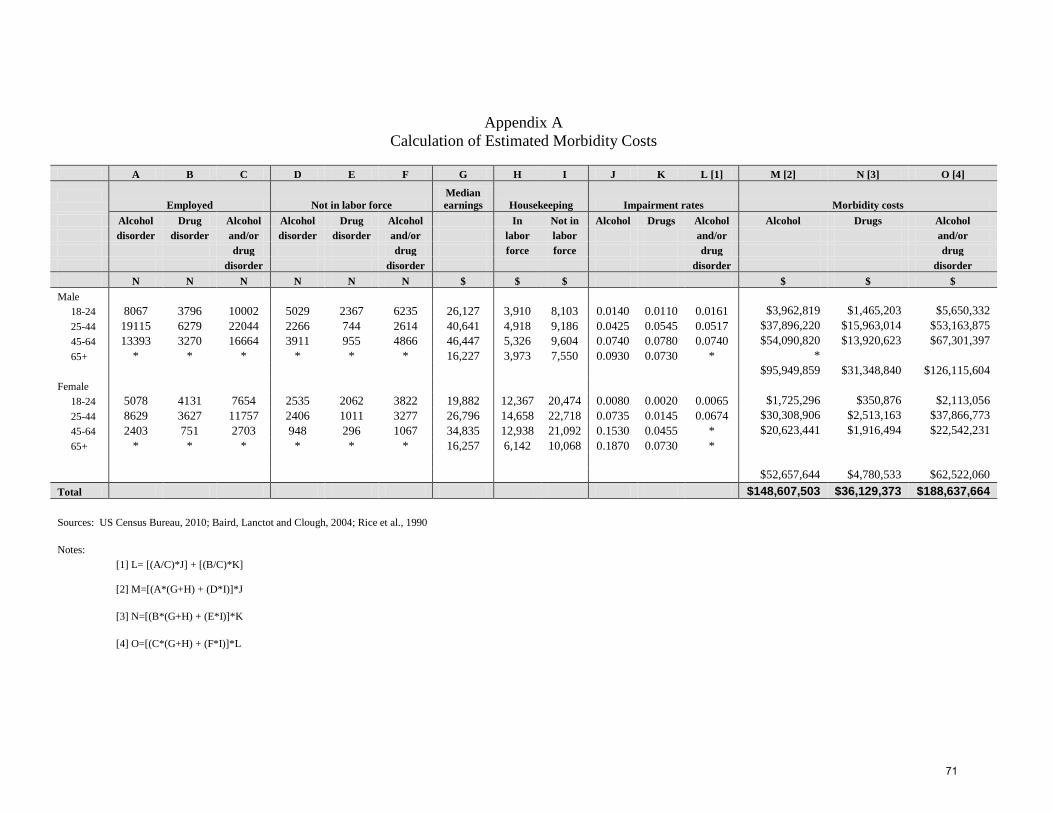
Appendix A
Calculation of Estimated Morbidity Costs
A B C D E F G H I J K L [1] M [2] N [3] O [4]
Employed Not in labor force
Median earnings Housekeeping Impairment rates Morbidity costs
Alcohol Drug Alcohol Alcohol Drug Alcohol In Not in Alcohol Drugs Alcohol Alcohol Drugs Alcohol disorder disorder and/or disorder disorder and/or labor labor and/or and/or drug drug force force drug drug disorder disorder disorder disorder N N N N N N $ $ $ $ $ $
Male 18-24 8067 3796 10002 5029 2367 6235 26,127 3,910 8,103 0.0140 0.0110 0.0161 $3,962,819 $1,465,203 $5,650,332 25-44 19115 6279 22044 2266 744 2614 40,641 4,918 9,186 0.0425 0.0545 0.0517 $37,896,220 $15,963,014 $53,163,875 45-64 13393 3270 16664 3911 955 4866 46,447 5,326 9,604 0.0740 0.0780 0.0740 $54,090,820 $13,920,623 $67,301,397 65+ * * * * * * 16,227 3,973 7,550 0.0930 0.0730 * * $95,949,859 $31,348,840 $126,115,604 Female 18-24 5078 4131 7654 2535 2062 3822 19,882 12,367 20,474 0.0080 0.0020 0.0065 $1,725,296 $350,876 $2,113,056 25-44 8629 3627 11757 2406 1011 3277 26,796 14,658 22,718 0.0735 0.0145 0.0674 $30,308,906 $2,513,163 $37,866,773 45-64 2403 751 2703 948 296 1067 34,835 12,938 21,092 0.1530 0.0455 * $20,623,441 $1,916,494 $22,542,231 65+ * * * * * * 16,257 6,142 10,068 0.1870 0.0730 * $52,657,644 $4,780,533 $62,522,060 Total $148,607,503 $36,129,373 $188,637,664 Sources: US Census Bureau, 2010; Baird, Lanctot and Clough, 2004; Rice et al., 1990 Notes: [1] L= [(A/C)*J] + [(B/C)*K] [2] M=[(A*(G+H) + (D*I)]*J [3] N=[(B*(G+H) + (E*I)]*K [4] O=[(C*(G+H) + (F*I)]*L
71
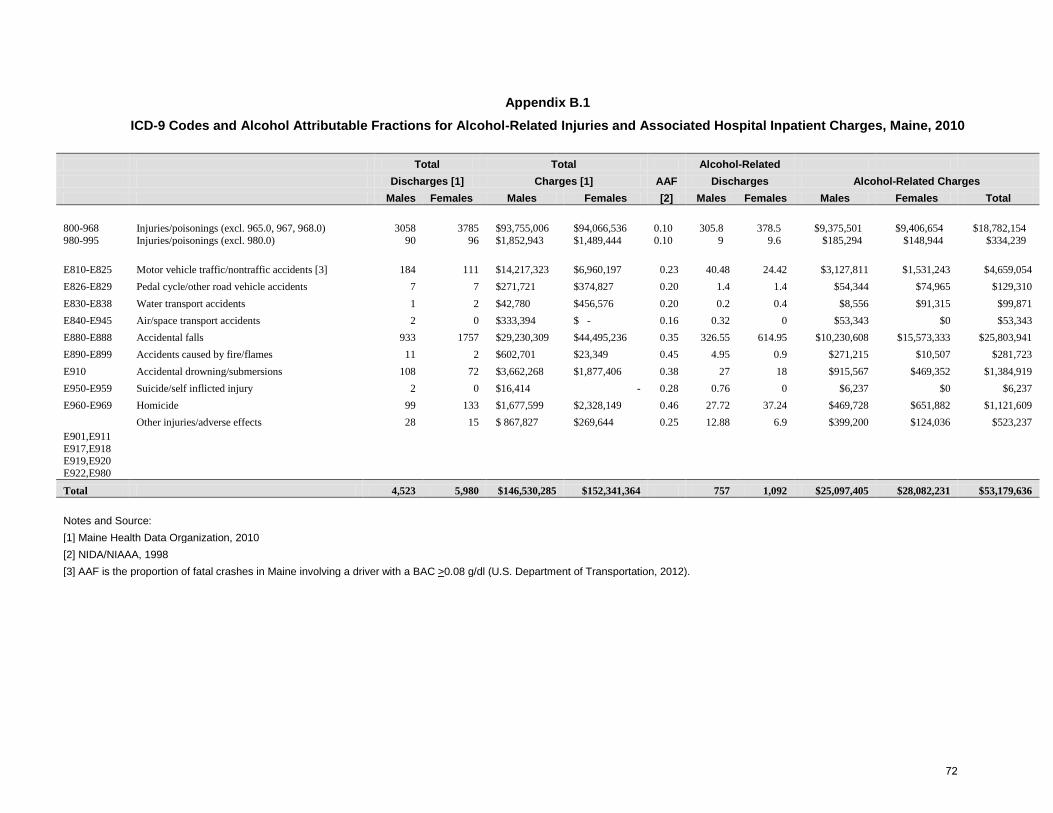
Appendix B.1
ICD-9 Codes and Alcohol Attributable Fractions for Alcohol-Related Injuries and Associated Hospital Inpatient Charges, Maine, 2010 Total Total Alcohol-Related Discharges [1] Charges [1] AAF Discharges Alcohol-Related Charges Males Females Males Females [2] Males Females Males Females Total 800-968 Injuries/poisonings (excl. 965.0, 967, 968.0) 3058 3785 $93,755,006 $94,066,536 0.10 305.8 378.5 $9,375,501 $9,406,654 $18,782,154 980-995 Injuries/poisonings (excl. 980.0) 90 96 $1,852,943 $1,489,444 0.10 9 9.6 $185,294 $148,944 $334,239
E810-E825 Motor vehicle traffic/nontraffic accidents [3] 184 111 $14,217,323 $6,960,197 0.23 40.48 24.42 $3,127,811 $1,531,243 $4,659,054 E826-E829 Pedal cycle/other road vehicle accidents 7 7 $271,721 $374,827 0.20 1.4 1.4 $54,344 $74,965 $129,310 E830-E838 Water transport accidents 1 2 $42,780 $456,576 0.20 0.2 0.4 $8,556 $91,315 $99,871 E840-E945 Air/space transport accidents 2 0 $333,394 $ - 0.16 0.32 0 $53,343 $0 $53,343 E880-E888 Accidental falls 933 1757 $29,230,309 $44,495,236 0.35 326.55 614.95 $10,230,608 $15,573,333 $25,803,941 E890-E899 Accidents caused by fire/flames 11 2 $602,701 $23,349 0.45 4.95 0.9 $271,215 $10,507 $281,723 E910 Accidental drowning/submersions 108 72 $3,662,268 $1,877,406 0.38 27 18 $915,567 $469,352 $1,384,919 E950-E959 Suicide/self inflicted injury 2 0 $16,414 - 0.28 0.76 0 $6,237 $0 $6,237 E960-E969 Homicide 99 133 $1,677,599 $2,328,149 0.46 27.72 37.24 $469,728 $651,882 $1,121,609
E901,E911 E917,E918 E919,E920 E922,E980
Other injuries/adverse effects 28 15 $ 867,827 $269,644 0.25 12.88 6.9 $399,200 $124,036 $523,237
Total 4,523 5,980 $146,530,285 $152,341,364 757 1,092 $25,097,405 $28,082,231 $53,179,636 Notes and Source: [1] Maine Health Data Organization, 2010 [2] NIDA/NIAAA, 1998 [3] AAF is the proportion of fatal crashes in Maine involving a driver with a BAC >0.08 g/dl (U.S. Department of Transportation, 2012).
72

APPENDIX B.2
ICD-9 Codes and Alcohol Attributable Fractions for Alcohol-Related Injuries And Associated Hospital Outpatient Charges, Maine, 2010
Total Total Alcohol-Related Alcohol-Related Outpatient Visits [1] Charges [1] AAF Visits Charges
Males Females Males Females [2] Males Females Males Females Total
800-968 Injuries/poisonings (excl. 965.0, 967, 968.0) 105,622 97,221 $78,041,608 $63,915,965 0.10 10,562 9,722 $7,804,161 $6,391,596 $14,195,757
980-995 Injuries/poisonings (excl. 980.0) 3,949 4,572 $1,770,086 $1,778,704 0.10 395 457 $177,009 $177,870 $354,879
E810-E825 Motor vehicle traffic/nontraffic accidents [3] 746 1,102 $796,804 $885,015 0.22 172 253 $183,265 $203,553 $386,818
E826-E829 Pedal cycle/other road vehicle accidents 62 48 $38,620 $28,563 0.20 12 10 $7,724 $5,713 $13,437
E830-E838 Water transport accidents 14 6 $12,643 $2,677 0.20 3 1 $2,529 $535 $3,064
E840-E845 Air/space transport accidents 1 2 $1,097 $3,878 0.16 0 0 $176 $620 $796
E880-E888 Accidental falls 2,222 3,308 $2,220,061 $2,889,997 0.35 778 1,158 $777,021 $1,011,499 $1,788,520
E890-E899 Accidents caused by fire/flames 49 30 $35,175 $17,796 0.45 22 14 $15,829 $8,008 $23,837
E910 Accidental drowning/submersions 4 2 $2,261 $5,154 0.38 2 1 $859 $1,959 $2,818
E950-E959 Suicide/self inflicted injury 275 454 $337,518 $524,937 0.28 77 127 $94,505 $146,982 $241,487
E960-E969 Homicide 154 306 $138,632 $223,388 0.46 71 141 $63,771 $102,758 $166,529
E901,E911 E917,E918 E919,E920 E922,E980
Other injuries/adverse effects 1,070 852 $704,230 $559,460 0.25 268 213 $176,058 $139,865 $315,923
Total 150,843 149,844 $168,484,020 $137,854,841 23,404 23,415 $28,900,354 $22,755,261 $51,655,615 Sources:
[1] Maine Health Data Organization, 2007
[2] NIDA/NIAAA, 1998
[3] AAF is the proportion of fatal crashes in Maine involving a driver with a BAC >0.10 g/dl (U.S. Department of Transportation, 2005).
73

APPENDIX C
Calculation of Estimated Costs of Alcohol-Related Motor Vehicle Crashes, Maine, 2010
Type/Severity of Crash Type of Costs Fatal Severe/Critical Injury Minimum/Moderate Injury Property Damage Only
U.S. 1992 U.S. 2010
Est. Maine U.S. 1992 U.S. 2010
Est. Maine U.S. 1992 U.S. 2010
Est. Maine U.S. 1992 U.S. 2010
Est. Maine
[1] [2] [4] [1] [2] [4] [1] [2] [4] [1] [2] [4] Legal/Court Costs (million) 3,390.0 5,318.9 22.8 3,354.0 5,262.4 22.6 2,768.0 4,343.0 18.7 -- --
per capita cost [3] $17.23 $17.04 $14.07 Insurance Administration (million) 2,310.0 3,624.3 15.6 3,795.0 5,954.3 25.6 3,132.0 4,914.1 21.1 3,403.0 5,339.3 22.9
per capita cost [3] $11.74 $19.29 $15.92 $17.29 Vehicle and Roadway Damage (million) 385.0 604.0 2.6 1,243.0 1,950.2 8.4 16,062.0 25,201.3 108.4 31,342.0 49,175.6 211.6
per capita cost [3] $1.96 $6.32 $81.62 $159.27 Total $41.1 $56.6 $148.2 $234.5
Proportion of Costs due to Alcohol:
Fatalities Severe Injury
Moderate Injury Property
U.S. 1992 [1] 39.7% 31.5% 17.0% 13.9%
Maine, 2005 [5] 23% 18.2% 9.8% 8.0%
actual est. est. est.
Notes and Sources: [1] NIDA/NIAAA (1998), Table 6.17 (p.6-28) [2] 1992 U.S. data adjusted for inflation using the Consumer Price Index rate of 56.9% over the 13-year period [3] 2010 U.S. estimate divided by the 2010 U.S. population: 296,507,061 [4] 2010 U.S. per capita cost multiplied by the 2010 Maine population: 1,328,361 [5] The proportion of fatalities due to alcohol is the percent of fatal crashes in Maine involving a driver with a BAC > 0.08 g/dl (U.S. DOT, 2010); the proportion of less serious crashes due to alcohol is estimated using the same Maine to US proportion as for fatalities, 57.9% .
74
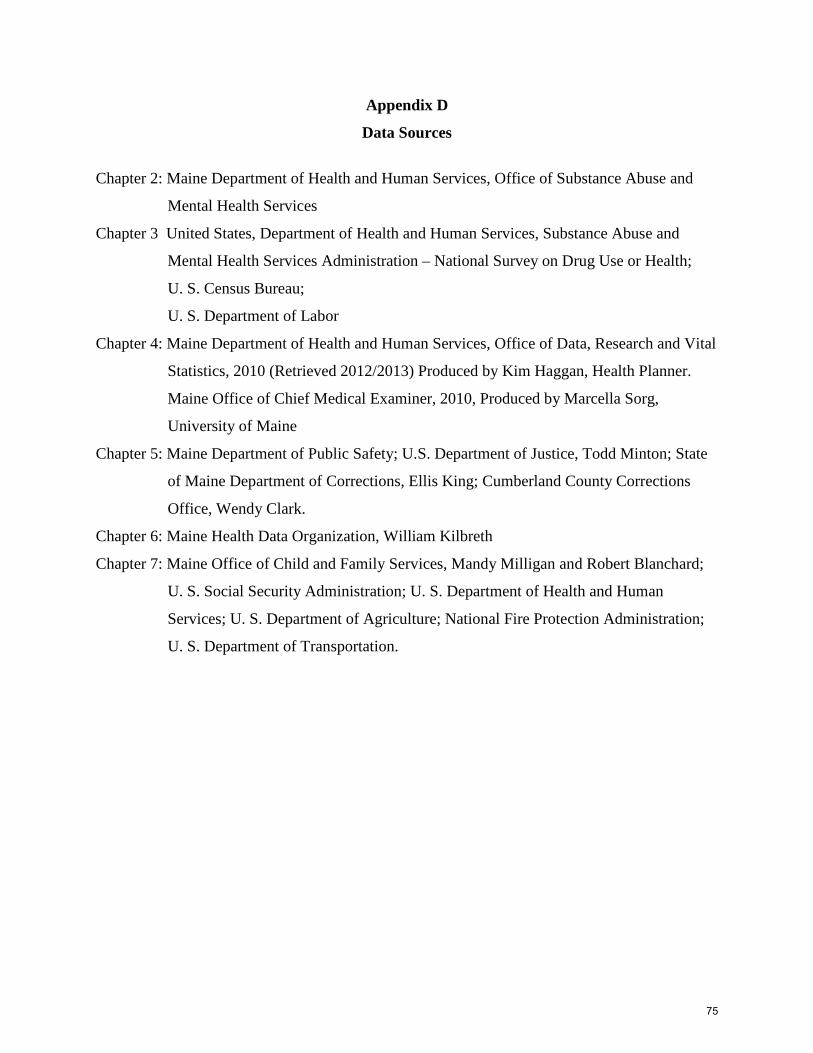
Appendix D
Data Sources
Chapter 2: Maine Department of Health and Human Services, Office of Substance Abuse and
Mental Health Services
Chapter 3 United States, Department of Health and Human Services, Substance Abuse and
Mental Health Services Administration – National Survey on Drug Use or Health;
U. S. Census Bureau;
U. S. Department of Labor
Chapter 4: Maine Department of Health and Human Services, Office of Data, Research and Vital
Statistics, 2010 (Retrieved 2012/2013) Produced by Kim Haggan, Health Planner.
Maine Office of Chief Medical Examiner, 2010, Produced by Marcella Sorg,
University of Maine
Chapter 5: Maine Department of Public Safety; U.S. Department of Justice, Todd Minton; State
of Maine Department of Corrections, Ellis King; Cumberland County Corrections
Office, Wendy Clark.
Chapter 6: Maine Health Data Organization, William Kilbreth
Chapter 7: Maine Office of Child and Family Services, Mandy Milligan and Robert Blanchard;
U. S. Social Security Administration; U. S. Department of Health and Human
Services; U. S. Department of Agriculture; National Fire Protection Administration;
U. S. Department of Transportation.
75

The Department of Health and Human Services does not discriminate on the basis of disability, race, color, creed, gender, sexual orientation, age or national origin in admission or access to or
operations of its programs, services, or activities, or its hiring or employment practices.
This notice is provided as required by Title II of the Americans with Disabilities Act of 1990 and in accordance with the Civil Rights Act of 1964 as amended, Section 504 of the Rehabilitation
Act of 1973 as amended, the Age Discrimination Act of 1975, Title IX of the Education Amendments of 1972 and the Maine Human Rights Act.
Questions, concerns, complaints or requests for additional information regarding the ADA may be forwarded to DHHS ADA Compliance/EEO Coordinator, SHS #11, Augusta, ME 04333;
(207) 287-4289 (V) or (207) 28703488 (V), TTY: 800-606-0215. Individuals who need auxiliary aids or services for effective communication in programs and services of DHHS are
invited to make their needs and preferences known to the ADA Compliance/EEO Coordinator.
This information is available in alternate formats upon request.
76