the contribution to distribution network fault...
TRANSCRIPT

THE CONTRIBUTION TO DISTRIBUTION NETWORK FAULT LEVELS FROM THE CONNECTION OF DISTRIBUTED GENERATION
CONTRACT NUMBER: DG/CG/00027/00/00
URN NUMBER: 05/636

The DTI drives our ambition of ‘prosperity for all’ by working to create the best environment for business success in the UK. We help people and companies become more productive by promoting enterprise, innovation and creativity.
We champion UK business at home and abroad. We invest heavily in world-class science and technology. We protect the rights of working people and consumers. And we stand up for fair and open markets in the UK, Europe and the world.

The Contribution to Distribution Network Fault Levels From the Connection of Distributed
Generation
DG/CG/00027/00/00
URN
This work was commissioned and managed by the DTI's Distributed Generation Programme in support of the Technical Steering Group (TSG) of the Distributed
Generation Co-ordinating Group (DGCG). The DGCG is jointly chaired by DTI and Ofgem, and further information can be found at www.distributed-generation.gov.uk
Contractor
KEMA Limited
The work described in this report was carried out under contract as part of the DTI Technology Programme: New and Renewable Energy, which is managed by Future Energy Solutions. The views and judgements expressed in this report are those of the contractor and do not necessarily reflect those of the DTI or Future Energy Solutions.
First published 2005 Crown Copyright 2005

WS5 P01 Steering Group
The KEMA Consulting report for the Department of Trade and Industry’s New & Renewable Energy Programme on
The Contribution to Distribution Network Fault Levels from the connection of Distributed Generation
Introduction: In support of DGCG TSG WS5, the Department of Trade and Industry’s New & Renewable Energy Programme commissioned KEMA Limited to undertake an investigation and report on ‘The Contribution to Distribution Network Fault Levels from the connection of Distributed Generation’. The investigation was undertaken during 2004/5 and was subject to review and commentary by the TSG WS5 Project 01 Manager and other WS5 members while in progress. The final report was submitted to Future Energy Solutions (FES – acting for the DTI New & Renewable Energy Programme) in April 2005. Objective: The aim of the study was to identify the likely impact that distributed generation (DG) will have on GB distribution network fault levels in the period to 2010, and addresses how these increased fault levels could be managed to ensure that they do not act as a barrier to the increased penetration of DG. The study also includes an overview of the likely longer term impact of new forms of generation. The study focused on two areas in particular: the circumstances and scenarios that are most likely to give rise to fault level issues that require to be addressed; and the options and likely costs for addressing these fault level issues. Methodology: Three main sources of information were used: KEMA’s own experience in the Netherlands (where DG penetration exceeds current levels in GB); material already published; and analysis of DNOs’ Long Term Development Statements. The study included some significant work to assess distribution network fault level headroom i.e. the extent to which fault levels can be raised before installation of replacement apparatus with higher fault level ratings becomes necessary. Findings: KEMA have reported on their findings in the context of a range of levels of penetration of DG, providing a range of estimates of the costs attributable to resolving fault level increases. KEMA have reported their view that issues arising from increases in distribution network fault levels will not constrain achievement of current targets for DG penetration.

The KEMA report also includes commentary on international experience with HV (11 kV & 33 kV) connected DG, options for managing increased fault levels, the measurement and calculation of fault levels, and a summary of the characteristics of DG machines. Next steps: TSG WS5 members have received the findings established in the KEMA report with interest. However, members are alert to the fact that changes in fault levels, arising from new DG connected to existing distribution networks, need to be considered in the context of other changes (e.g. voltage control, active management, etc). Caution should be exercised in the regard given to cost estimates attributable to fault level change, given that other changes will often be the trigger for additional expenditure incurred to enable connection. Network Operators and generators are encouraged to read the KEMA report, and consider its findings in the context of generator connection charging proposals.
Chris Mortley Manager, TSG WS5 P01
May 2005

1
Table of Contents
Table of Contents ......................................................................................................................1
Executive Summary..................................................................................................................3
1. Introduction ........................................................................................................................7
1.1 Background .......................................................................................................... 7 1.2 Aim of Study ........................................................................................................ 8 1.3 Scope of Document ............................................................................................. 8 1.4 Structure of Document ........................................................................................ 9 1.5 References ............................................................................................................ 9
2. Technical Review .............................................................................................................14
2.1 Introduction ........................................................................................................ 14 2.2 Relationship between DG and Fault Levels ..................................................... 14 2.3 Likely Impact in the Period to 2010 .................................................................. 17
2.3.1 LV connected DG................................................................................. 17 2.3.2 International experience with LV connected DG .............................. 19 2.3.3 MV and HV connected DG.................................................................. 20 2.3.4 International Experience with MV and HV connected DG ............... 29
3. Options for Managing Increased Fault Levels ................................................................32
3.1 Introduction ........................................................................................................ 32 3.2 Overview of Fault Level Management Methods ............................................. 32
3.2.1 Uprating and replacement of components ....................................... 32 3.2.2 Increase impedance ............................................................................ 32 3.2.3 Is limiter ............................................................................................... 34 3.2.4 Superconducting fault current limiter ............................................... 34 3.2.5 Power Electronics................................................................................ 34 3.2.6 Solid state fault current limiter .......................................................... 35 3.2.7 Network splitting and reconfiguration .............................................. 35 3.2.8 Sequential switching........................................................................... 35 3.2.9 Active fault level management .......................................................... 36
3.3 Fault Level Management Costs ........................................................................ 36 3.3.1 DG connected to MV and HV.............................................................. 37
3.4 Case Study Example.......................................................................................... 43
4. Measurement and Calculation of Fault Level Values.....................................................44
4.1 Introduction ........................................................................................................ 44 4.2 Fault Level Calculation ...................................................................................... 44 4.3 Fault Level Measurement.................................................................................. 45 4.4 Conclusion.......................................................................................................... 46
5. Constraints to DG Penetration due to Fault Level Limitations ......................................48
5.1 Introduction ........................................................................................................ 48 5.2 LV Network ......................................................................................................... 48 5.3 MV/HV Network.................................................................................................. 49
6. Characteristics of DG Machines ......................................................................................51

2
6.1 Introduction ........................................................................................................ 51 6.2 DG types and their Contributions..................................................................... 51 6.3 Impact on make and break currents................................................................. 53
7. Longer term perspective (to 2020-2030) .........................................................................55
7.1 Introduction ........................................................................................................ 55 7.3 New generation technologies........................................................................... 58 7.4 Conclusion.......................................................................................................... 59
Appendix A: Example Netherlands DG Project .......................................................................1

3
Executive Summary
This document presents KEMA’s view on the impact of distributed generation on fault
levels in response to a request by the DGCG TSG Workstream 5.
The increasing demand on Great Britain’s distribution networks imposed by new
distributed generation (such as renewable, micro CHP or CHP) will impact on the
operation of the network in a number of areas including voltage levels and fault levels.
In general all new distributed generation contributes some increase to fault levels, and
this would in some cases result in the fault level exceeding the design limit of the
network equipment to which it is connected if no action is taken to address it.
This report focuses on two major areas: the circumstances and scenarios that are most
likely to give rise to fault level issues that require to be addressed; and the options and
likely costs for addressing these fault level issues.
In examining the circumstances and scenarios most likely to give rise to fault level
issues, we examine the generic structure of the GB distribution networks and identify
the areas where the type of distributed generation likely to require connection has the
greatest contribution to fault level relative to the fault level headroom available at that
point in the network. Our conclusion is that this is most likely to occur with the
connection of distributed generation to urban 11 kV and 33 kV networks, and that the
most likely form of distributed generation requiring connection to these networks is
small, medium and large CHP, landfill gas and waste incineration. Whilst we conclude
that the connection of distributed generation to urban 11 kV and 33 kV networks is
most likely to result in fault level issues, there will also be instances of large-scale
distributed generation connections to both rural and urban networks which provide
sufficient contribution to fault levels to exceed the fault level headroom available at
that particular location.
We also examine the likely impact of the fault level issue over time, particularly in the
period to 2010 but also beyond that. In so doing, we consider the development of
distributed generation to date in Great Britain, taking into account the factors that have
influenced development to date but are in the process of changing, such as the change
to the connection charging methodologies. The change from deep connection
charging to shallower connection charging provides poorer locational signals than in
the past, and may result in a significant increase in connection requests in areas with
very low fault level headroom as the costs to the developer will now be lower than
before.
We also consider the situation with regards to the levels of distributed generation
currently in place in comparison to the Government’s targets for 2010, and the

4
potential paths towards the targets in relation to the fault level issue. In particular, we
conclude that the targets in relation to CHP are unlikely to be met in the absence of a
significant increase in small, medium and large CHP projects. An increase in CHP
projects, which would be most likely to occur in urban areas, would lead to an
increase in fault level issues as urban networks tend to have the lowest fault level
headroom.
In examining the likely impact of the fault level issue over time we also consider
historical experience in the Netherlands, where distributed generation penetration
levels are higher than those in Great Britain. Our conclusion here is that distributed
generation has been accommodated with little impact on the networks for a number of
reasons which may not be readily applied to Great Britain. For example, the increase
in distributed generation in the Netherlands has been over a much longer period of
time (some 25 years), with the capacity of individual generators being very low to
begin with, giving rise to a much more gradual decrease in fault level headroom. The
longer timeframe for the introduction of distributed generation has also resulted in the
potential for greater coincidence between substation refurbishment due to aging
infrastructure and the need to increase fault level headroom due to the introduction of
greater levels of distributed generation. In the Netherlands there would also appear to
be a greater tendency towards proactive investment in network infrastructure which
can accommodate higher levels of distributed generation, where it has been
reasonably certain that such levels of distributed generation will materialise.
With regards to the options and costs for managing fault levels, we find that there is a
small range of options utilised. The first option is connection to higher voltage levels
or neighbouring substations with greater fault level headroom as a means of avoiding
reinforcement costs at substations with inadequate fault level headroom. The
remaining options, in increasing cost order, are typically splitting the network,
increasing impedance, installing current limiting equipment, or reinforcing the
network. Whilst network splitting is a valid option, it cannot be implemented in all
circumstances, and reduces power quality, increases losses and reduces reliability.
The introduction of increased impedance through current limiting reactors is the next
option, but if permanently connected these have the disadvantage of introducing a
permanent voltage drop and increasing losses. Transformers may also be used, but
these are more commonly used for voltage regulation with standard designs
providing only limited short circuit impedance. Other forms of current limiting devices
such as Is limiters, superconducting fault current limiters and solid state fault current
limiters are better technical solutions than simply increasing the impedance, but are
either not permitted in Great Britain (Is limiter), or have not yet been developed
successfully for operation in 11 kV and 33 kV networks (and are unlikely to be available
by 2010). In general, the technically superior and most expensive option is to

5
reinforce the network with higher rated equipment, which could include cables or
overhead lines.
The options presented above are largely options to solve specific fault level issues as
and when they arise, and with the exception of network reinforcement they do not
increase capacity in the distribution networks to accommodate further distributed
generation connections. This means that the more inexpensive options are best
suited to slow growth in distributed generation and would be inappropriate to cope
with a rapid acceleration which could occur in the period to 2010 if Government
targets are to be met. In order to accommodate such a rapid acceleration, there are
alternative options which may be required and which have been utilised in the
Netherlands in cases where significant growth was predicted. These included building
new networks capable of operating at 20 kV but operating them at 10 kV, such that
they can be operated at 20 kV at a later date when required. The 20 kV rated
equipment has a higher short circuit current capability. Refurbishment work to
existing networks also resulted in similarly rated 20 kV rated equipment being
installed but continuing to operate at 10 kV until such times as a change to 20 kV is
required. Finally, networks specifically for distributed generation have also been built.
Each of these options would require significant investment on the part of the DNOs.
In terms of the overall costs to DNOs of addressing fault level issues, there is a range
of likely costs in the period to 2010 and probabilities of incurring such costs. Our
analysis utilises the distribution of headroom in medium voltage urban networks and
high voltage networks in Great Britain, the likely costs of addressing the fault level
issue across this distribution specifically when connecting small, medium and large
CHP, and the likely development scenarios for CHP in the period to 2010. This results
in potential costs which are in the range £800k to £1.9 million per year across all DNOs
(for a low CHP growth scenario) and £10 million to £18 million per year across all
DNOs (for a high CHP growth scenario).
The figures provided above cover costs to address fault level issues for the connection
of small, medium and large CHP to medium voltage urban networks and high voltage
networks. This does not include provision for any costs for addressing fault level
issues on connection of distributed generation to the low voltage networks, which will
be small in comparison. Also, no costs are included for addressing fault level issues
for large scale renewables (e.g., wind) projects, for which the costs could be of the
order of £10 million per project, but not all of which can be apportioned to addressing
fault level issues. Thus, overall cost estimates per year for medium voltage and high
voltage networks can be built up as follows:

6
Costs per year for Low CHP
Growth
Costs per year for High
CHP Growth
CHP connections (11 kV, 33
kV and 132 kV)
£800K to £1.9 million total £10 million to £18 million
total
Large scale distributed
generation (non-CHP)
connecting at 132 kV
Typically £10 million per
project (a proportion of
which will be to address
fault level issues)
Typically £10 million per
project (a proportion of
which will be to address
fault level issues)
In the longer term (to 2020-2030) it is not envisaged that fault levels will act as a
“showstopper” for the further increase in penetration of distributed generation. This
applies for penetration levels up to and beyond 50% of local generation in the low
voltage network and to a lesser extent in the medium voltage network. However, in
order to maintain an acceptable level of fault level headroom, investment will continue
to be required in network reinforcement, and innovative solutions such as distributed
generation networks may become more commonplace.
We also find that fault level measurement technology is not commercially available to
allow on-line fault level monitoring; therefore fault level headroom calculations will
continue to be based on IEC60909/G74 for the foreseeable period. These calculations
must be reviewed regularly to account for the changing configuration of the network
and loads over time in order to ensure that, amongst other things, adequate fault level
headroom is maintained. Finally, DNOs are encouraged to consider reviewing cable
short circuit ratings where particular issues exist, as original design ratings may be
conservative and could potentially be increased in specific cases based on actual
protection settings compared to those envisaged at the design stage.

7
1. Introduction
1.1 Background
The Department of Trade and Industry’s New and Renewable Energy Programme, in
support of the Distributed Generation Co-ordinating Group (DGCG) Technical Steering
Group (TSG) Workstream 5, has commissioned KEMA Limited to undertake this Study
to identify the likely impact that Distributed Generation (DG) will have on distribution
network fault levels in the period to 2010. This is particularly important due to the
increasing levels of new generation capacity from renewable and Combined Heat and
Power (CHP) sources being embedded within electricity distribution networks and
causing an increase in fault levels. A key finding of the DTI Renewables Advisory
Board’s (RAB) Grid Working Group, published in the 2003 RAB Annual Report, is that
“grid constraints need to be addressed as the penetration of intermittent renewable
capacity increases”.
The Government has set targets (Ref. 1) for reducing greenhouse emissions and
increasing the proportion of renewable forms of electricity generation. It is expected
that 10% of electricity energy consumed in 2010 will be provided by renewable
sources with 10 GWe capacity from CHP plants. As a consequence of meeting this
target some 8 GW of renewable capacity (approximately 3000 installations) and 5 GW
of CHP is needed (some 1000 CHP installations in addition to 1-3 million domestic CHP
installations in the range of 1-5 kW (micro CHP)). The nature of these plants is such
that the vast majority of them will be connected to the distribution networks. With the
level of penetration of DG forecast for 2010, it is necessary to develop an
understanding of the likely impact on fault levels now in order that the DGCG can
recommend priorities for action required to assist the integration of small generation
into the DNOs electrical networks.
In general all forms of DG contribute some increase to fault levels. The connection of
DG to the distribution network could therefore result in fault levels exceeding the
design limit of the network, particularly if it is already being operated close to its
design limit (i.e., with low fault level headroom). When fault level design limits are
exceeded, there is a risk of damage to and failure of the equipment with consequent
risk of injury to personnel and interruption of supply under short circuit fault
conditions.
The incidence of fault level issues is a function with three variables: the available
headroom at any given point in the network; the fault level contribution from any DG
type to be connected; and the number of DG projects which would result in the fault
level design limit being exceeded if connected. This report examines all three

8
variables and puts them in context of the likely impact on fault levels as a result of
new DG connections in the period to 2010, and the likely costs of managing this.
There are a number of methods of managing the increase in fault levels introduced by
increased penetration of DG. These methods fall into two groups: increasing the fault
level design limit of the network, or reducing the fault level to below the design limit
of the existing network. Potential solutions for both groups are discussed in the report.
As this report focuses on the fault level issue, the following issues related to the
introduction of DG are noted, but are outwith the scope of this report:
• In addition to the potential increase to fault level magnitude the direction of the
current could also change, affecting the operation of the protective devices. In
this instance settings may need to be adjusted or protective devices may even
need to be replaced by more sophisticated ones in order to ensure proper
operation of power system protection schemes.
• The introduction of DG could result in a voltage rise on the network from the
point of connection towards the substation, as opposed to a volt drop on the
network away from the substation.
1.2 Aim of Study
The aim of this Study is to identify the likely impact that DG will have on GB
distribution network fault levels in the period to 2010, and addresses how these
increased fault levels could be managed to ensure that they do not act as a barrier to
the increased penetration of DG. The Study also includes an overview of the likely
longer term impact of new forms of generation.
1.3 Scope of Document
This document is KEMA Limited’s report on the likely impact that DG will have on GB
distribution network fault levels in the period to 2010, covering both the technical
aspects of the issue and the financial aspects of dealing with the issue in order not to
impede the increased penetration of DG.
The report draws on three main sources of information:
• KEMA’s own experience of the issue in the Netherlands, where DG penetration
is significantly higher than current levels in Great Britain.
• Material already published concerning fault level issues and possible solutions.

9
• The Long-Term Development Statements (LTDS) published by each of the
DNOs.
This study includes the LV (400V and 230V) and MV (11 kV and 33 kV) networks where
the majority of DG will be connected. In addition, the study includes the HV (132 kV)
distribution network in England and Wales where a small number of very large DG
schemes will be connected.
Whilst this document refers to fault levels generically, it is recognised that there are
two relevant fault level design limits: make current, and break current. These are
referred to separately within the document where relevant, as are the differing
contributions to make current and break current from differing types of DG.
1.4 Structure of Document
The structure of the remainder of this document is as follows:
• Section 2 assesses the current situation and provides a technical review of the
likely impact on the network of all types of faults.
• Section 3 details the options for managing increased fault levels with an
estimate of likely costs.
• Section 4 assesses the methods and techniques of calculating and measuring
fault level values.
• Section 5 comments on the extent to which DG may be constrained as a
consequence of network fault level limitations.
• Section 6 contains details of the characteristics of different forms of DG.
• Section 7 provides an overview of the longer term perspective (to 2020-2030).
• Appendix A provides an example of a specific DG integration project in the
Netherlands.
1.5 References
1. Ofgem Press release Monday 13 January 2003, ‘REWIRING‘ BRITAIN – FACING
THE CHALLENGES.
2. Effects on distribution networks by grid connected PV-systems”. “Beinvloeding
distributienetten door netgekoppelde PV-systemen”, KEMA report 94460523-
TDP 98-102495, Juni 1998 (in Dutch).
10
3. S.M.Bolik, Grid requirements challenges for wind turbines, Fourth international
workshop on large scale integration of wind power and transmission networks
for offshore wind farms, Billund, Denmark, October 2003.
4. System Integration of Additional Micro-generation (SIAM), Mott McDonald,
September 2004, available at the DGCG website www.distributed-
generation.gov.uk.
5. Large scale integration of micro and mini CHP in LV networks, technical
consequences for the network. “Grootschalige inpassing van kleine opwekkers
in laagspanningsnetten, elektrotechnische gevolgen voor het laagspanningsnet
van de inpassing van micro en mini warmtekracht”, KEMA report 098462526-
TDC 99-04489B, 11 juni 2002 (in Dutch).
6. Hybrid (AC+DC) MV networks with DG and storage – system studies.
“Concretisering hybride (AC+DC) middenspanningsnetten met decentrale
opwekking en opslag”, KEMA report 40050080-TDP 01-20686A, October 2001
(in Dutch).
7. From calculation to assessment – network integration of DG. “Van berekening
naar beoordeling – inpassing van decentrale opwekking”, KEMA PREGO9
report 40230030-TDC 03-36739A, November 2003 (in Dutch).
8. E. Boxum et. al., Method for determining the maximum amount of DG to be
integrated. “Methodiek bepaling maximaal inpasbaar decentraal vermogen”,
Energietechniek vol.78 no.9 p 416-419, 2000 (in Dutch).
9. The Impact of Small Scale Embedded Generation on the Operating Parameters
of Distribution Networks, PB Power, October 2003, available at the DGCG
website www.distributed-generation.gov.uk.
10. Enslin, JHR: Interconnection of Distributed Power to the Distribution Network,
IEEE Young Researchers Symposium in Electrical Power Engineering 2004,
Delft, The Netherlands, 18-19 March 2004 (Keynote Address).
11. Enslin, JHR; Heskes, PJM; Harmonic interaction between a large number of
distributed power inverters and the distribution network, IEEE Transactions on
Power Electronics, Vol. 19, No. 6, pp. 1586 - 1593, Nov. 2004.
12. Results of the outcome of the VDEN-working group decentralised generation.
“Eindresultaten van de VDEN-werkgroep gedecentraliseerde
elektriciteitsopwekking”, Elektrotechniek vol.66 no.8, p722-731, 1988 (in Dutch).

11
13. Solutions for the Connection and Operation of Distributed Generation, EA
Technology Ltd, July 2003, available at the DGCG website www.distributed-
generation.gov.uk.
14. Short-circuit limiting equipment in MV networks – state of the art.
“Kortsluitstroombegrenzende apparatuur in middenspanningsnetten – state of
the art”, KEMA report 98450066-TDP 01-18388A, April 2001 (in Dutch).
15. High-temperature Superconducting Fault-current Limiter - Optimisation of
Superconducting Elements, VA Tech, 2004, available at the DGCG website
www.distributed-generation.gov.uk.
16. Blaabjerg et.al, The future of Electronic Power Processing and conversion, IEEE
Transactions on industry applications, Vol. 41, no. 1 January/February 2005.
17. Ben Damsky, A solid state current limiter, available at the website
www.epa.gov search for current limiter
18. An investigation of Network Splitting for Fault Level Reduction, Working Paper
25, Wu et al, Tyndall Centre for Climate Change Research, January 2003, pp 1-
30, available at the DGCG website www.distributed-generation.gov.uk.
19. The performance of networks using alternative network splitting configurations,
EA Technology, 2004, available at the DGCG website www.distributed-
generation.gov.uk
20. Guido Daniels, “operation of MV network with high level of CHP”, “Betrieb von
MS netzen mit hoher Blockheizkraftwerk Einspeisung”, 1996, Dissertation
RWTH-Aachen (in German).
21. Vision of the industry on RES and DER key note speech, First International
Conference on the Integration of Renewable Energy Sources and Distributed
Energy Resources, 1st –3rd December 2004, Brussels, Belgium.
22. First multiyear innovative research program electromagnetic power
technology, “Eerste meerjarenprogramma IOP EMVT”, Senter, June 2001
website www.senternovem.nl/iopemvt.
23. Ofgem press release 6 January 2005, ELECTRICITY DISTRIBUTION BUSINESS
ACCEPT OFGEM PRICE CONTROL – BUT FOCUS IS NOW ON THEM TO
DELIVER.

12
24. Scenarios of Distributed Generation Development, document WS1 P06-D01
V1.2, 25/02/03, available at the DGCG website www.distributed-
generation.gov.uk.
25. Review of CHP projections to 2010, Ilex Energy Consulting, 2003, available at
the DGCG website www.distributed-generation.gov.uk.
26. Roy E. Cossé et. al. Choosing medium-voltage circuit breakers based on the
IEC60909 short-circuit calculations IEEE paper 0-7803-6404-X/00, 2000.
27. Report of CIRED Working Group No 4 on Dispersed Generation, CIRED 1999,
Nice, available at the website www.cired.be.
28. N. Nimpitiwan and G.T. Heydt, Consequences of fault currents contributed by
DG (study in progress), Power Systems Engineering Research Center,
www.pserc.org.
29. Williamson et al., Use of naturally occurring system disturbances to estimate
the fault current contribution of induction motors, IEE Proceedings, GTD, Vol.
143, no. 3, May 1996, pp 243-248.
30. Cornfield, G.C. Estimating system fault level from naturally occurring
disturbances, presented at the Fault Level Assessment - Guessing with Greater
Precision? IEE Colloquium in 1996.
31. Erinmez A, Review of Short Circuit Infeeds from Induction Motor Loads, report
prepared for the Electricity Supply Industry Operations and Systems Group
(subgroup 4), November 2002, pp 1-27.
32. Thomas S.Key, EPRI PEAC, US Laboratory efforts to integrate distributed
resources into the electrical grid, First International Conference on the
Integration of Renewable Energy Sources and Distributed Energy Resources, 1st
–3rd December 2004, Brussels, Belgium.
33. Electricity Technology Roadmap, KEMA April 2002. Available at
www.kema.com “search for roadmap”.
34. European commission DG Research, New ERA for electricity in Europe
distributed generation: key issues, challenges and proposed solutions,
EUR20901, 2003.
35. M.Yagi et al. Development of Dispersed generation and consequences for
power systems, CIGRE C6-01 final report, July 2003.

13
36. J.G. Slootweg, Wind Power: Modelling and Impact on power System Dynamics,
PH.D. thesis from Technical University Delft, December 2003 (ISBN 90-9017239-
4)
37. Vladislav Akhmatov, Analysis of Dynamic Behaviour of Electric Power Systems
with Large Amount of Wind Power, PH.D. thesis from Technical University of
Denmark, April 2003 (ISBN 87-91184-18-5)
38. Technical Guide to the Connection of Generation to the Distribution Network,
Power Planning Associates, February 2004, available at the DGCG website
www.distributed-generation.gov.uk
39. Commission for Energy Regulation, Wind Generation Distribution Code
Provisions, CER/04/318 dated 6th of October 2004, available at website
www.cer.ie
40. Thomas Ackermann, Wind power in power systems, 2005, John Wiley and
Sons Ltd., ISBN 0-470-85508-8

14
2. Technical Review
2.1 Introduction
This section of the document contains a technical review of the likely impact of DG on
distribution network fault levels in the period to 2010. This review is based on several
elements:
• The fault level headroom available across the distribution networks;
• The fault level contribution from all DG types;
• The current levels and growth trends of DG penetration;
• Potential scenarios for growth in DG penetration in the period to 2010 as a
result of government targets, regulatory regimes and incentivisation;
• Experience in the Netherlands, which has a higher level of DG penetration than
GB.
The technical review will demonstrate that there are particular types of distribution
networks at particular voltage levels that are much more likely to suffer from fault
level issues. These will be further analysed to develop an overview of the fault level
headroom available in these network types at these particular voltage levels. The
review will also identify the DG types most likely to be connected to these network
types and voltage levels, and will examine a small number of scenarios for the growth
in DG penetration in the period to 2010.
International experience will also be reviewed particularly in the Netherlands, where
DG penetration levels are higher than those in GB. This will show that while DG has
historically been accommodated with little impact on the networks, this cannot be
readily applied to GB.
2.2 Relationship between DG and Fault Levels
Many of the effects caused by connecting generation to the distribution network are
related to the planning and design of the network. Historically the distribution network
has been designed as shown in Figure 2.1 to accommodate power flow from the grid
supply points downward through tiers of networks operating at lower voltage to the
electricity consumers. The network is designed to meet the needs of normal operation,
fault conditions and abnormal operation (e.g., when the network has been re-
configured for maintenance).

15
Figure 2.1 – Traditional Network schematic
When a short circuit fault occurs in the distribution network a fault current will flow to
the fault location. The fault current comprises the current from connected generation
and from rotating load such as motors at customer sites. This fault current is detected
by the protection system and will be cleared by circuit breakers or fuses.
DNOs calculate fault levels, during network planning and also for operational
networks, based on connected generation and known connected rotating equipment at
customer sites, in order to ensure that they remain within the design limits of the
network. Fault level can be an issue in all types of networks at all voltage levels, and if
fault levels exceed the equipment, cable or overhead line ratings then there are two
broad options to address it:

16
• The network configuration may be modified and/or additional equipment may
be installed, in order to reduce the fault level at the specific parts of the network
where the fault level exceeds design limits.
• The appropriate equipment, and potentially cables and lines, may be uprated to
withstand the fault level (i.e., increase the design limits).
Traditionally, in an environment where the primary forms of generation are connected
to the distribution networks via supply transformers from the transmission network,
the main changes to fault levels over time were due to additional supply transformers
and also due to changes in rotating load at customer sites.
In today’s distribution networks, the presence of DG provides an additional
contribution to the fault level, and the embedded nature of the DG makes the fault
current calculations more complex as they should take into account the consequences
of operational switching combinations to a degree not required when all generation
was via the transmission network. The fault level contribution from DG is determined
by a number of factors, including:
• The type of DG, as different types of DG contribute different fault currents.
• The distance of the DG from the fault, as the increased cable impedance over
longer distances will reduce the fault current.
• Whether or not a transformer is present between the fault location and the
contributing DG (which is often the case for voltage regulation purposes), as
transformer short circuit impedance may assist in limiting the fault current.
• The configuration of the network between the DG and the fault, as different
paths for the flow of the fault current will alter the magnitude of the fault
current (due to cable impedances and other installed equipment).
• The method of coupling the DG to the network. Directly connected DG will
contribute significantly higher fault current than DG connected via power
electronics (PE) interfaces.
Apart from the contribution to the fault current, faults have other effects (including
mechanical and thermal effects). For the purposes of this report we will focus only on
the effect on fault levels, but the switch-off criteria of protection settings and the
prevention of accidental “islanding” (i.e., the operation of a part of the network in
complete isolation from the rest of the network) should also be noted. The prevention
of accidental islanding is important to avoid the risk of DNO maintenance personnel
17
working on a part of the system that is still energised. (Note: This has happened in the
Netherlands in a large area fitted with roof photovoltaic (PV) systems (Ref. 2)).
It is likely that the rules for disconnecting DG plant when faults occur will have to be
revised in the future. In Denmark and Ireland there are already specific guidelines for
network support in place with respect to windfarms (Refs. 3, 39). As DNOs issue
guidelines for network support of DG in case of faults, these new criteria and
guidelines will lead to new criteria for protection settings, adjustments and
modification of the technology used in DG plant.
2.3 Likely Impact in the Period to 2010
In this section the various types of DG have been grouped into three network levels as
follows:
• Low voltage (LV), covering up to and including 460V.
• Medium voltage (MV), covering levels greater than LV up to and including 33
kV.
• High voltage (HV), covering levels greater than MV up to and including 132 kV.
The assessment in this section addresses the likelihood of fault level issues at each of
these voltage levels, based on a number of development scenarios for DG in the
period to 2010.
2.3.1 LV connected DG
It is generally anticipated that LV connected DG will be limited in the period to 2010 to
consist mainly of domestic micro CHP, PV, and mini CHP used in buildings such as
offices, swimming pools, and small shops. There may also be some small individual
wind turbines in place.
The report on System Integration of Additional Micro-generation (SIAM) (Ref. 4) found
that the maximum outcome (upper bound) of micro-generation is approximately 2.5
GW by 2010 (see Table 2.1 below).

18
Table 2.1 – Micro-generation Forecasts from SIAM Report (Ref. 4)
This table also summarises the capacity (GW) and energy (TWh) assumed in the
scenarios for the penetration of micro-generation until 2020. To put the values of the
high scenario in context, the 6.5 TWh figure in 2010 would represent some 1.5% of
total energy demand, while the 2.5 GW of capacity in 2010 would represent 3% of peak
load in Great Britain.
The SIAM report states that existing LV networks can accept up to 100% penetration of
micro-generation, where the percentage refers to the numbers of properties installing
a micro-generator of any type with a rating nominally of 1.0 – 1.1 kW, provided some
steps are taken to reconfigure the network as penetration levels increase. The main
problem was identified as voltage regulation, which can be solved by adjusting
transformer tap changers or in some cases replacing a transformer.
TSG Workstream 1 project 6 (WS1P06) also produced scenarios for DG development
specifically for workstream 5 (Ref. 24). These scenarios forecast that the capacity
available from LV connected micro CHP, PV and mini CHP in 2010 will be around 1 GW
if the government targets for CHP are to be met through pro-rata growth in existing
CHP types at all voltage levels. An additional high figure of around 4.3 GW is also
given should all domestic central heating boiler replacements in the period to 2010 be
replaced with 1 kW CHP units. The WS1P06 scenarios also include a low forecast of
0.4 GW, based on low growth consistent with unfavourable market prices for gas and
electricity.
In the SIAM report, the analysis of networks with micro-generation with a load density
of 5 MW/km2 (inner city) showed that even without micro-generation a minimum
length of cable would be needed between a consumer and the 800 kVA distribution
transformer to keep single phase faults below 16 kA. To some extent this cable
impedance buffers the rise in fault level on the LV busbars caused by micro-generation
on feeders.
The fault contribution from micro-generation to a single phase fault is further reduced
by having a direct contribution from only one third of the generators on the affected
feeder. The impact in this worst case situation in an area with 100% DG would add
about 1 kA to the fault levels (this is 6-7% of the 16 kA commonly used). In the Dutch
study (Ref. 5) for a similar case with larger plant (mini CHP) a maximum increase of
The level of penetration of DG on the LV network will increase, but by 2010 will still only be anextremely small proportion of total energy demand. Even at 100% penetration the likely worst caseincrease in fault levels will be typically 6–7%. This means that it is likely that there will only be veryfew situations where network reconfiguration or uprating of equipment is required to address faultlevel issues.

19
25% was found. As stated before such conditions are likely to be extremely unusual in
the period to 2010, but may occur occasionally in cities with meshed LV distribution.
In rural areas there are mainly problems with the voltage profile (voltage is low at the
end of the feeder) rather than with fault levels. Furthermore the penetration of micro
CHP or even PV is likely to be very gradual and is likely to be widely dispersed in the
rural areas.
Therefore, in the period to 2010 no real problems are foreseen with fault levels
specifically while the amount of DG plant in the LV network is still very limited.
However, it is possible that in some isolated situations, DG penetration levels are
sufficiently high to necessitate network reconfiguration or uprating of equipment. This
may occur in areas where there is a high density of micro CHP, or PV demonstrator
areas, which is likely to be in urban areas.
2.3.2 International experience with LV connected DG
Great Britain has been a relatively late adopter of large levels of DG and it worth
considering the experience in international distribution networks that are further
advanced. Much of this report looks at the Dutch distribution networks, where similar
fault levels standards are applied. In the Netherlands the fault level for the LV network
in urban areas is 16, 25 or 31.5 kA and is mainly determined by the 10/0.4 kV
transformer short circuit impedance (400 to 1600 kVA transformers with impedances
between 4 and 6%). This is similar to Great Britain where 11/0.4 kV transformers are in
use. In the older parts of major Dutch cities a meshed LV network is present, as in
British cities, and the radial distribution concept for the newer developed areas is also
similar. Note there are also significant differences, mainly in the rural areas, where
Great Britain uses overhead lines and the Netherlands uses cables.
Studies performed by KEMA for DNOs in the Netherlands have shown that the LV
network is easily capable of accepting up to 100% of DG (Refs. 5, 6, 7, 8). In a study
(Ref. 5) into the technical consequences of large amounts of micro and mini CHP in the
LV network the conclusion is that voltage regulation is the biggest technical issue and
“it is not expected that fault levels by micro and mini CHP (up to 100 kW) will have any
influence on the low voltage network”. In other studies (Refs. 6 and 7) low (and
medium) voltage networks with large amounts of DG (up to 100% PV or micro CHP)
are investigated. The conclusion from these studies was that, once again, the voltage

20
regulation profile is the main problem with increasing levels of DG and that existing
fault levels are only slightly increased.
The possible large uptake of micro CHP in the LV network is a particular point of
interest for Dutch DNOs. In The Netherlands nearly ever household has a gas fired
central heating system and the national gas company Gasunie is planning a large
micro CHP introduction scheme. However, studies by DNOs, universities and KEMA
give similar results to GB-based studies (Refs. 4, 9) and indicate that a large amount of
micro CHP, say up to 50% of the load, will not cause any problems and even up to
100% and beyond is possible. However, there will be specific locations where even
20% might give a problem with voltage regulation (e.g., in weak rural networks with a
small feeder transformer).
As stated above, the main technical problems are related to voltage regulation,
voltage profile and the protection of (maintenance) personnel and equipment. The
challenge is to use the micro CHP for network support, and deferral and avoidance of
network investments for DNOs, rather than simply disconnecting them whenever
there is a problem in the network (which is the case at the moment because of lack of
suitable monitoring and control tools).
At the current time the Netherlands does not yet have any experience with large
amounts of micro CHP in urban networks. There are a few newly developed residential
areas where the equivalent of some 2MW peak solar (Ref. 10) is installed on some 500
rooftops. Fault levels have not been a problem because all the PV systems are
equipped with PE interfaces. The only problems encountered were related to power
quality (harmonic generation from inverters (Ref. 11)) and safety for DNO maintenance
workers (a situation occurred where part of the network went into islanding operation
without being detected).
2.3.3 MV and HV connected DG
The majority of the 8 GW of renewable capacity and 5 GW of new CHP required to
meet the 2010 targets is expected to be connected to the MV networks. A small
International studies indicate that the increased penetration of micro CHP on the LV network up to say50% of the load can be accommodated largely without any action required to address fault level issuesspecifically. However, action may be required to address voltage regulation issues. The increasedpenetration of PV on the LV network does not contribute to fault levels where the PV systems areequipped with a PE inverter.

21
number of larger schemes will also be integrated into the HV networks. In general the
number of plant will be limited as the average size of each installation may be quite
high, with the Government targets set in 2003 predicting approximately 3000 new
renewable generation installations, and 1000 new CHP installations (excluding LV
connected domestic CHP installations) by 2010. The renewable installations will be
mainly wind turbines, either as stand-alone applications or combined in (smaller)
windfarms, and biomass plant. Smaller contributions will also be made from tidal
stream and wave power, landfill gas and waste incineration. The CHPs are likely to be
associated with industrial centres, large offices, shops and residential buildings, and
agricultural greenhouses.
The scenarios of DG development (Ref. 24) also provides similar figures as an upper
level scenario, with a lower level scenario of 3.7 GW new renewable and just under 1
GW new CHP (again excluding LV connected domestic CHP installations). Using the
same approximations for each installation capacity as for the Government targets, this
would result in just under 1400 new renewable generation installations, and 200 new
CHP installations.
Current evidence shows that development of new renewable generation is moving
towards the 2010 target. However, the current trend in the development of new CHP is
that there has been very little increase in new CHP in recent times, and it is highly
unlikely that the target will be met unless developers and/or consumers are
incentivised to install CHP in the period to 2010. In combining these two scenarios it is
also possible that the proportional contributions from renewable generation and CHP
towards the target will be different to that originally predicted, and that renewable
generation will make a more significant contribution to counter the lower contribution
from CHP.
In considering the MV and HV networks that the renewable generation and CHP will be
connected to, we can correlate the DG type to the network type (adapted from Ref. 24)
as shown in Table 2.2 below.

22
DG Type Network
Voltage
Level
Location Typical
Capacity
[MW]
Added
Capacity
2003 – 2010
[MW]
Onshore Wind MV, HV Rural, 66% to 75%
Scotland
0.4 – 4 (per
turbine)
2000 – 7000
Offshore Wind MV, HV Rural, predominantly
England & Wales
150 – 500 1000 – 5000
Tidal Stream
and Wave
Power
MV Rural, coastal 0.75 – 5 100 – 250
Biomass MV Rural 0.5 – 10 200 – 850
Landfill Gas MV Semi-urban 0.5 – 5 200
Waste
Incineration
MV Semi-urban 20 – 40 200
Small CHP
MV Urban 0.5 – 5 70 – 400
Medium CHP
MV Urban 5 – 50 500 – 1100
Large CHP
(>50MWe)
MV, HV Industrial centres 50 – 400 400 – 2400
Table 2.2 – DG Types, Typical Connections and Capacities
The density of urban MV networks in comparison to rural MV networks means that it
is significantly more likely that urban MV networks have low fault level headroom
availability, and better voltage control due to shorter circuit lengths, whereas rural MV
networks have poorer voltage control due to longer circuit lengths, and higher fault
level headroom availability. It is therefore expected that the majority of fault level
issues will occur in urban, semi-urban and industrial MV networks, and will therefore
be caused by the connection of CHP (which being synchronous generators will
contribute to both make current and break current as detailed in Section 6 of this
document), and to a lesser extent landfill gas and waste incineration schemes.
The DG types with the highest capacity per project and therefore the highest fault level
contribution per project will be large scale onshore and offshore wind projects, which
are most likely to be connected to rural HV networks (and which will contribute
primarily to the make current as today’s wind turbines make little or no contribution to
the break current as detailed in Section 6 of this document). It is therefore expected
that, even when connecting to rural HV networks which will typically have the highest
fault level headroom availability, large scale onshore and offshore wind developments

23
will occasionally require some action to be taken with regards to fault levels. The
number of instances where this is required will be low primarily due to the low
numbers of projects of this nature.
It is clear from the above that the majority of fault level issues are likely to occur in
urban MV networks. However, there is currently no analysis available to provide an
indication of the likely scale of the problem. This can be investigated by examining
the fault level headroom availability in urban MV networks as provided by the DNOs in
their long term development statements, in order to determine the capabilities of the
existing urban MV networks to accommodate additional DG without the need for
action to be taken to address the fault level issue.
The chart in Figure 2.2 shows the distribution of headroom availability, both in terms
of make current and break current, in urban MV networks across a number of DNOs in
GB. Urban networks were determined through a manual process of identifying
substations located in built-up city areas. Data from five DNO areas was analysed,
covering around 3,000 substations, and it is assumed that the results are
representative of urban MV networks in GB as a whole.

24
Make Current (Peak)
0
2
4
6
8
10
12
14
0-2 2-4 4-6 6-8 8-10 10-12 12-14 14-16 16-20 20-25 >25[kA]
Pr [%
]
11 kV 33 kV
Break Current (rms)
0
5
10
15
20
25
30
35
0-2 2-4 4-6 6-8 8-10 10-12 12-14 14-16 16-20 20-25 >25[kA]
Pr [%
]
11 kV 33 kV
Note: The horizontal axis shows the (categorised) available headroom in kA. For each bar the vertical axis shows the percentage of substations that belong to this category. Example: of all 11 kV sub-stations, 8 % have a make current headroom of more than 8 kA but less than 10 kA. By summing the values for the two
leftmost bars, it follows that the percentage of 11 kV substations with less than 4 kA make current headroom equals approximately 18 %.
Figure 2.2 – Distribution of Headroom Availability in Urban MV Networks

25
It can be seen from Figure 2.2 that there is a significant proportion of substations in
urban MV networks that have less than 4 kA headroom availability, both in terms of
make current and break current. As detailed in Section 6 of this document, different
types of DG contribute differently to both make current and break current, some of
which could be above 4 kA for a single DG project. Given this, there are many cases
where no additional DG can be connected without addressing the fault level issue.
Both graphs in Figure 2.2 are shown with the same kA ranges on the horizontal axis, in
order to provide a direct comparison between make current and break current
headroom availability. However, as there is not a one to one relationship between
make current and break current, this makes the shape of the graphs look very
different. The typical ratio between make current and break current is 2.5, so plotting
the make current headroom distribution in kA ranges which are 2.5 times the kA
ranges of the break current headroom graph, as shown in Figure 2.3, provides a graph
which shows a shape of make current headroom distribution more in line with the
shape of the break current headroom distribution.
Analysis indicates that, in the period to 2010, the main area of concern with respect to fault levels is inurban MV networks, where there is a significant proportion of substations that do not have sufficientfault level headroom to accommodate additional DG of the type that would typically be connected tosuch substations. There will also be a small number of (rural) HV substations where the fault levelcontribution from large scale renewables (e.g., wind) projects would be sufficient to make themexceed their design limits, thus requiring major reinforcement works.

26
0
5
10
15
20
25
30
0-5 5-10 10-15 15-20 20-25 25-30 30-35 35-40 40-50 50-62,5 >62,5
[kA]
Pr [%
]
11 kV 33 kV
Figure 2.3 – Distribution of Make Current Headroom Availability in Urban MV
Networks
We can also make an assessment of the change in this distribution in the period to
2010, given potential scenarios of the development of DG. In order to develop these
scenarios we have made the following assumptions:
• All CHP plants contribute to the fault level due to the characteristics of the
plant.
• We can divide the DG types into three main groups (small CHP, medium CHP
and large CHP). Landfill gas is treated as belonging to the same group as small
CHP, and waste incineration is treated as belonging to the medium CHP group.
• The distribution of projects amongst the three main groups, the voltage levels
and the fault level contribution is represented in Table 2.3 below.
CHP Distribution Connected to Fault Level Contribution
(make current) at
Type of number
of projects
[%]
11 kV
[%]
33 kV
[%]
132 kV
[%]
11 kV
[kA]
33 kV
[kA]
132 kV
[kA]
Small 80 95 5 0 0.1 – 2 0.03 –
0.5
N/A

27
CHP Distribution Connected to Fault Level Contribution
(make current) at
Type of number
of projects
[%]
11 kV
[%]
33 kV
[%]
132 kV
[%]
11 kV
[kA]
33 kV
[kA]
132 kV
[kA]
Medium 15 0 60 40 N/A 0.5 – 2.5 0.09 –
0.9
Large 5 0 10 90 N/A 1.5 - 3.5 0.4 – 8
Table 2.3 – Typical DG Projects Connecting to MV and HV Networks
Taking Table 2.3 and Figure 2.2, it can be seen that the fault level contribution from
any single project will only result in a fault level issue at those substations with the
insufficient headroom availability.
2.3.3.1 Scenario 1 – Organic CHP Growth
In this scenario we consider that CHP continues to grow at the levels predicted as the
low growth scenario. This scenario is based on the following assumptions:
• The number of projects (GB-wide) is in the range of 10-30 a year up to 2010.
• Government targets are not met.
• Projects are randomly distributed amongst substations.
• The number of substations remains the same (no new ones are built).
• No load growth.
Due to the slow rate of CHP growth and therefore the limited number of projects, it is
more likely that any given project can be integrated in the existing network, either at
the local substation or a nearby substation. This will help keep costs low as the need
for major substation upgrade is likely only to be required occasionally, but the longer
term effect will be that the headroom distribution will not change for the better, as no
additional headroom is being created and existing headroom is being consumed
slowly.
It is worth noting that if scenario 1 comes to fruition, it is more likely that other forms
of DG, such as large scale wind, are promoted in order to meet the overall targets.
This would mean an increase in the number of occurrences of fault level issues in the
rural HV networks to which these large scale wind projects would be connected.

28
2.3.3.2 Scenario 2 – CHP Growth to Meet Targets
In this scenario we consider that CHP growth accelerates in order to meet the 2010
targets. It is possible that such acceleration is triggered by a change to the regulatory
regime or incentivisation of CHP. It is also possible that the change to the connection
charging regime introduced in the Distribution Price Control from April 2005 will
encourage new DG developments. As the connection charging regime is moving
towards shallower reinforcement costs to the generator, it is possible that DG
developments in areas where fault level headroom is an issue become financially
more attractive to the generator.
This scenario is based on the following assumptions:
• The number of projects (GB-wide) is in the range of 100-200 a year up to 2010.
• The fault level headroom distribution will change.
• The number of substations will increase (in some cases, new substations will
be built to address fault level issues).
• No load growth.
Due to the high rate of CHP growth, the potential to integrate such DG into the existing
network, either at the local substation or a nearby substation at the same or higher
voltage level, will reduce very quickly. As a consequence, projects will tend to have
high costs associated with them, either because cables or overhead lines will be
longer (substations with headroom availability are further away), major substation
upgrade work is required, or new substations need to be built.
In this scenario it is likely that the cost-effectivity of continuing to integrate DG into the
existing network will be questionable, as fault level issues will continue to get worse
over time as the distribution of headroom availability gets poorer, especially in areas
where there are concentrations of CHP projects. Where there are such concentrations
of CHP projects the construction of a separate DG network might be advantageous.

29
2.3.4 International Experience with MV and HV connected DG
An interesting comparison can be made with the Netherlands where the amount of DG
from CHP presently is around 30% of peak load. This is actually somewhat lower than
the situation in the late 1980’s and early 1990’s, the decrease being due to increased
imports, and less promotion (in the form of governmental subsidies) of CHP. The DG
is mainly located in the MV (10 and 20 kV) network. The outcome of the high level
Dutch VDEN-working group on DG found that additional network costs to incorporate
CHP were predominantly related to voltage regulation (Ref. 12) and that this high DG
percentage had been reached without significant problems in the distribution
network.
The Netherlands arrived at this high level of DG with classical network design with
expensive measures (e.g., replacement of switchgear) undertaken only occasionally to
deal with the increased fault levels. However, there are significant differences
between the way in which DG has developed in the Netherlands compared to that in
GB which result in the experience in the Netherlands not being readily applicable in
GB, as detailed below.
2.3.4.1 Timeframe
The increase in DG in the Netherlands has been over a long period of time (some 25
years). Therefore, when DG was first being introduced, the capacity of individual
generators would have been very low, giving rise to a much more gradual decrease in
fault level headroom. The low capacity generators included both wind turbines,
because wind turbine technology was not capable of delivering larger generators at
the time, and CHP, which was principally in the form of smaller generators associated
with agricultural greenhouses rather than large industrial plants.
When considering the possible scenarios for the development of DG in the period to 2010, two morelikely scenarios emerge. One is that CHP continues to experience low growth, and this can beintegrated using relatively simple technical solutions to avoid reinforcement costs in many cases.However, there will still be cases where substation upgrades will be required. Also, low CHP growthmay be offset by greater numbers of larger scale projects such as wind projects, which may alsorequire major substation upgrades or new build.
Alternatively, changes to the regulatory regime or incentivisation may trigger a large uptake in CHP.In terms of impact on fault levels, this will have the greatest impact as it will result in a greaternumber of fault level issues. This scenario may also necessitate greater levels of investment in longerterms solutions which increase fault level headroom and therefore build additional capability into thenetworks in terms of accommodating further DG.

30
The longer timeframe for the introduction of DG also means that there has been the
potential for greater coincidence between substation refurbishment due to aging
infrastructure and the need to increase fault level headroom due to the introduction of
greater levels of distributed generation. Equally well, DG introduction over a longer
period of time has allowed load growth related network investment over time to be
better aligned to cope with the impact of the introduction of the DG.
2.3.4.2 Alternative Options
There would also appear to be a greater use of alternative options to avoid
reinforcement costs in the Netherlands compared to GB when the DNOs are faced
with fault level issues. This can be seen from the priority order of solutions that are
investigated in the Netherlands whenever fault level issues are to be addressed, where
the two most likely solutions are:
• Connection to higher voltage levels. Where there is insufficient fault level
headroom at a specific substation, the possibility of connection to the next
voltage level is investigated, where there is a greater likelihood of there being
sufficient fault level headroom available.
• Connection to a neighbouring substation. Where the nearest substation does
not have sufficient fault level headroom, the possibility of connection to a
neighbouring substation (with sufficient fault level headroom) is investigated.
For connections of up to 10 MVA, there is a standard connection charge according to
the power rating, with additional charges according to the length of cable used.
Above 10 MVA the generator pays all shallow costs associated with the connection.
Also, the use of Is Limiters is permitted in the Netherlands, and although these are
only in limited use they have been used in specific cases, in conjunction with network
splitting, to address fault level issues without having to undertake network
reinforcement. This is most likely in unlicensed industrial networks.
2.3.4.3 Proactive Investment
In the Netherlands, there have been greater levels of proactive investment in the
distribution networks to make them more capable of accommodating increasing levels
of DG. This has been done in specific areas where significant growth in DG was
predicted, and has included:
• Building new networks capable of operating at 20 kV but operating them at 10
kV, such that they can be operated at 20 kV at a later date when required. The
20 kV rated equipment has a higher short circuit current capability.

31
• Refurbishment work to existing networks involving installing 20 kV rated
equipment (with a higher short circuit current capability) but continuing to
operate it at 10 kV until such times as a change to 20 kV is required.
• Networks specifically for distributed generation have also been built.
Each of these options required significant proactive investment on the part of the
DNOs. Also, note that the first two options do not remove the need for additional
investment when a network is eventually switched from 10 kV to 20 kV, as investment
is also required for the final modifications to the network prior to switching over to 20
kV operation. However, they do reduce the level of investment required at one time to
convert a network from 10 kV to 20 kV. Generators are also required to make further
investments as their transformers will require to be changed to supply at the new
voltage level.
The historic development of integration of large amounts (up to 30%) of CHP in the Netherlands hasbeen achieved over a significantly longer period of time than is forecast for GB. This has resulted in amuch more gradual decrease in fault level headroom availability, due to the lower capacity of earlyDG and the potential for greater alignment between the introduction of DG and the upgrading of agingassets and also load growth related network investments. This has also been accompanied by specificproactive investment in building the capability for the networks to accommodate further DG. The wayin which this situation has developed to date is therefore not particularly applicable to GB.

32
3. Options for Managing Increased Fault Levels
3.1 Introduction
This section provides an overview of fault level management methods available and in
use and provides an estimated cost for the implementation of solutions to the fault
level issue in general.
This section also presents our estimate of the likely costs for the implementation of
solutions to the fault level issue, based on the types of solution available and the
number of occasions that these solutions are likely to be employed.
3.2 Overview of Fault Level Management Methods
Possible solutions for addressing the increase in fault levels due to DG are provided in
several studies (Refs. 13, 14). The following summary gives a brief overview and
contains primarily permanent solutions for use in MV and HV networks.
3.2.1 Uprating and replacement of components
When fault levels go beyond the existing design limits due to the connection of DG,
uprating the capability of existing equipment such as circuit breakers is an option to
increase the fault level capabilities of the network. Most often the network equipment
will be replaced with equipment having a higher design rating. This is a method that is
widely used throughout the world as a traditional solution to the problem of increased
fault levels. It is a familiar approach for DNO operations and maintenance personnel,
requiring no new technology or design approaches. It is also possible that a large
area of the network must be reworked from the point of connection, making this a
relatively expensive solution if transformers and cables or overhead lines are also
involved.
3.2.2 Increase impedance
It is possible to introduce higher impedances in the network to limit the fault level. The
use of current limiting reactors is a relatively cost effective solution but needs
additional effort to maintain the voltage profile, and increases the network losses. This
solution is reasonably widespread in the Netherlands, but is used on a limited basis in
Great Britain, where replacement of switchgear appears to be a more common
solution. Also, one to one transformers can be used to connect the (larger) individual
DG plant to the network. In the Netherlands transformers are often used for the
connection of both CHP and windfarms. The techniques are well established but most

33
cost-effective when applied at the design stage rather than as a retro-fit option when
problems occur.

34
3.2.3 Is limiter
The Is limiter or fault current limiter senses the rapid rise of the fault current and fires
a pyrotechnic charge to open the main current path. The current is commutated to the
parallel path where a conventional fuse operates. The key advantage of using an Is
limiter is that it retains the existing low network impedance under normal network
conditions (no losses), combined with the effectiveness of operation of a fuse. A major
disadvantage is the replacement of contacts and fuses after each operation and the
requirement for careful adjustment of protective relay settings to maintain selectivity.
This technique has been used in specific cases since the 1980’s in the Netherlands
with positive experience. Is limiters are relatively cost effective solutions but do
require different or additional maintenance and health and safety measures (due to
the explosive charge). This makes them expensive to implement and because they are
currently not permitted for use in public networks in GB they are unlikely to become
widely used in the period to 2010. TSG Workstream 3 project 4 (WS3P04) has
undertaken some work on the potential of using Is limiters in GB.
3.2.4 Superconducting fault current limiter
A superconducting fault current limiter (SFCL) behaves like an Is limiter in that it has
very low impedance at normal operation but when a fault occurs the impedance rises
very quickly limiting the current. When the fault is cleared it returns to its normal
state. Throughout the world, research has been undertaken by manufacturers (e.g..
ABB and Siemens) to develop an SFCL and the technology has been amply
demonstrated. In Great Britain VA Tech is researching this technology (Ref. 15). It
would be an ideal component technically, but it is an expensive solution. It is not
expected that these devices will be commercially available within the next 10 years.
Maintaining superconducting devices could also be an additional burden for the DNO.
3.2.5 Power Electronics
For various reasons, an increasing number of DG types have become available which
use a PE converter interface. These provide a much lower fault current contribution
than either synchronous or asynchronous machines, effectively providing no
additional contribution to the fault level. PE is an area of rapid technological
development (Ref. 16). The power ratings continue to increase while the costs are
reducing, and it is becoming more and more commonplace for smaller DG plant to
incorporate such an interface. Although these power electronic devices are generally
not installed by the DNO they can provide additional controllability to improve sub-
system performance and provide additional system functionality.
35
3.2.6 Solid state fault current limiter
Because of the rapid development of power electronics the idea of a solid state fault
current limiter (SSFCL) emerged with similar functionality an Is limiter or SFCL.
SSFCLs currently exist and are available from several manufacturers, and are in use
for LV connected DG. For MV the application is still under development (Ref. 17) and
the main problem is the losses during normal operation (which is less of a problem for
LV). Because of the technical problems that remain to be solved it is not expected that
MV SSFCLs will enter the market within the next 10 years. Note that if successful, this
is a superior solution than the SFCL because no special cooling circuitry is needed.
3.2.7 Network splitting and reconfiguration
Network splitting can significantly reduce the fault level at a busbar. However, network
splitting reduces power quality in general due to the increased source impedance, and
it increases system losses and the risk of supply failure (i.e., reduces reliability).
Another possibility to reduce the fault level is to reconfigure and alter the existing
connectivity of the distribution network. Distribution networks are designed to allow
their connectivity to be altered, either in response to a fault or to allow a section of
network to be isolated for maintenance purposes. Both solutions require new
protective setting and switching sequences (Refs. 18, 19). Next to uprating and the use
of current limiting reactors, these techniques have been widely used in the Dutch MV
network (Ref. 20). Many of the disadvantages of network splitting can be avoided by
the use of Is limiters such that the network is only split when the fault occurs. This has
been used in specific cases in the Netherlands.
3.2.8 Sequential switching
Sequential switching is a method by which the multiple sources contributing to any
fault current are separated prior to the clearance of the faulted section. This solution
has some safety risks to people and equipment because there is the risk that a
sequential switching scheme fails to prevent a circuit breaker opening before the fault
current has been reduced sufficiently. Another issue is the increased complexity and
dependency on information and communication technology, particularly if equipment
at more than one site is involved, and the technical issues associated with the
deliberate introduction of a protection operation time delay. The associated costs are
low to medium but a careful assessment with other options should be made with
respect to risk. It is likely that this is a solution for use in isolated cases only.

36
3.2.9 Active fault level management
The management of fault level could be carried out within operational as well as
planning timescales by developing the evolution of the network from “fit and forget”
to “actively managed” as part of the transition to “intelligent networks”. Active fault
level management would consist of simple activities such as reconfiguring the
network combined with more dynamic and active measures like temporarily
introduced impedances, and actively shifted loads. The latter would require much
more flexible networks. In practice this means that some active controllable
components are introduced to the network and more monitoring and information
about the status of the network is required. Internationally (Ref. 21) there is ongoing
research concerning “intelligent” networks. In the Netherlands for example a large,
Government funded 8 year programme on intelligence in networks, part of the IOP-
EMVT (Ref. 22), is under way with the participation of universities, industry and the
DNOs. However, active fault level management is at an early stage of development,
will be very expensive and is not likely to become reality within the next 10 years.
3.3 Fault Level Management Costs
Costs associated solely attributed to fault levels are extremely difficult to estimate
because of the fact that fault levels is only one of several technical problems
associated with the integration of DG that may need to be resolved. For LV connected
DG it is unlikely that any occasion exists where fault levels are the only problem to be
solved, as fault levels play only a minor role as detailed in Section 2. For MV and HV
connected DG the situation is somewhat more complicated, with DG such as CHP
connecting to urban MV networks (and in some cases HV networks) most likely to
result in fault level issues. There will also be occasional instances of large-scale DG
connecting to rural HV networks resulting in fault level issues, for which the costs will
be very high and will vary dramatically on a project by project basis, so it is not
possible to undertake a substantial analysis. For these reasons the analysis and
resultant costs presented in this section are based on dealing with the connection of
DG such as CHP to HV and urban MV networks.
The costs directly associated with fault levels presented below for GB for the period to
2010 are best estimates based on the information currently available and the analysis
undertaken for this report. These have been developed using a bottom up approach,
which utilises estimates of the number and types of DG connections that will require
technical solutions, and develops estimated costs based on the likely cost of each type
of technical solution.

37
3.3.1 DG connected to MV and HV
DG connected to the MV or HV networks can have costs associated with fault levels in
both the MV and HV network itself and the higher voltage network to which it is
connected.
Again an order of magnitude estimate of the investment required by DNOs directly
related to fault levels is difficult to give, as investments in networks will often solve a
variety of technical problems. However, this section attempts to approximate how
much investment will be required in the GB MV and HV distribution networks in the
period to 2010, specifically to address the scenarios developed in Section 2.
In order to present an estimate of the overall costs, we have developed a model of up
to four potential solutions for fault level issues at each voltage level (11 kV, 33 kV, 132
kV), which is presented in Table 3.1 below, along with typical costs. Actual solutions
and costs may vary widely from this, and the typical costs presented in Table 3.1 are
based on a combination of the examples given in the DNOs published connection
charging methodologies, the Technical Guide to the Connection of Generation to the
Distribution Network (Ref. 38), and experience. Note that all costs provided in this
section do not take into account any change to costs over time.
Voltage
level
Solution 1 Solution 2 Solution 3 Solution 4
11 kV
Current limiting
reactor for the DG
feeder.
Typical cost £50k
New cable
connection to an
11 kV substation
with sufficient
headroom.
Typical cost 5km *
£40k = £200k
New overhead
line to the 33 kV
level.
Typical cost
15km * £40k =
£600k
Uprate
complete
substation.
Typical cost
£1,500k
33 kV
Current limiting
reactors in all
other feeders
(assuming the
existing busbar
has enough
capacity).
Typical cost 8 *
£100k = £800k
New cable
connection to a 33
kV substation with
sufficient
headroom.
Typical cost 10km
* £80k = £800k
New overhead
line connection
to the 132 kV
level.
Typical cost
15km * £200k =
£3,000k
Uprate
complete
substation.
Typical cost
£5,000k

38
Voltage
level
Solution 1 Solution 2 Solution 3 Solution 4
132 kV
Uprate complete
substation.
Typical cost
£10,000k
Create a new 132
kV substation.
Typical cost
£20,000k
Note: Uprating substations in general also means working on the surrounding network to remove local
constraints. For this reason the costs are in general higher than just for uprating the substation alone (a factor of 1.5 - 2 times is assumed here).
Table 3.1 – Potential Solutions and Typical Costs
In Table 3.2 below a distribution is assumed for the application of the available
solutions, for both CHP growth scenarios outlined in section 2 of this report.
Voltage
level
Scenario Solution 1
[%]
Solution 2
[%]
Solution 3
[%]
Solution 4
[%]
Organic 20 50 20 10 11 kV
Meet
Target
10 20 50 20
Organic 5 70 20 5 33 kV
Meet
Target
0 50 30 20
Organic 50 50 N/A N/A 132 kV
Meet
Target
20 80 N/A N/A
Table 3.2 – Distribution of Potential Solutions for Different DG Growth Scenarios
In the slow uptake scenario (Organic) more inexpensive solutions are possible than in
the high growth scenario (Meet Target). Note that these are assumed likely
distributions and do not necessarily reflect actual GB DNO behaviour.
3.3.1.1 Scenario 1 – Organic CHP Growth
Using the potential solutions shown in Table 3.1, the distribution of solutions as
shown in Table 3.2, and the distribution of available headroom in Figure 2.2, the range
of potential costs can be calculated using Monte-Carlo analysis. These costs are
slightly higher when considering make current compared to break current. The results
of the analysis for make current are shown in Figure 3.1 below.
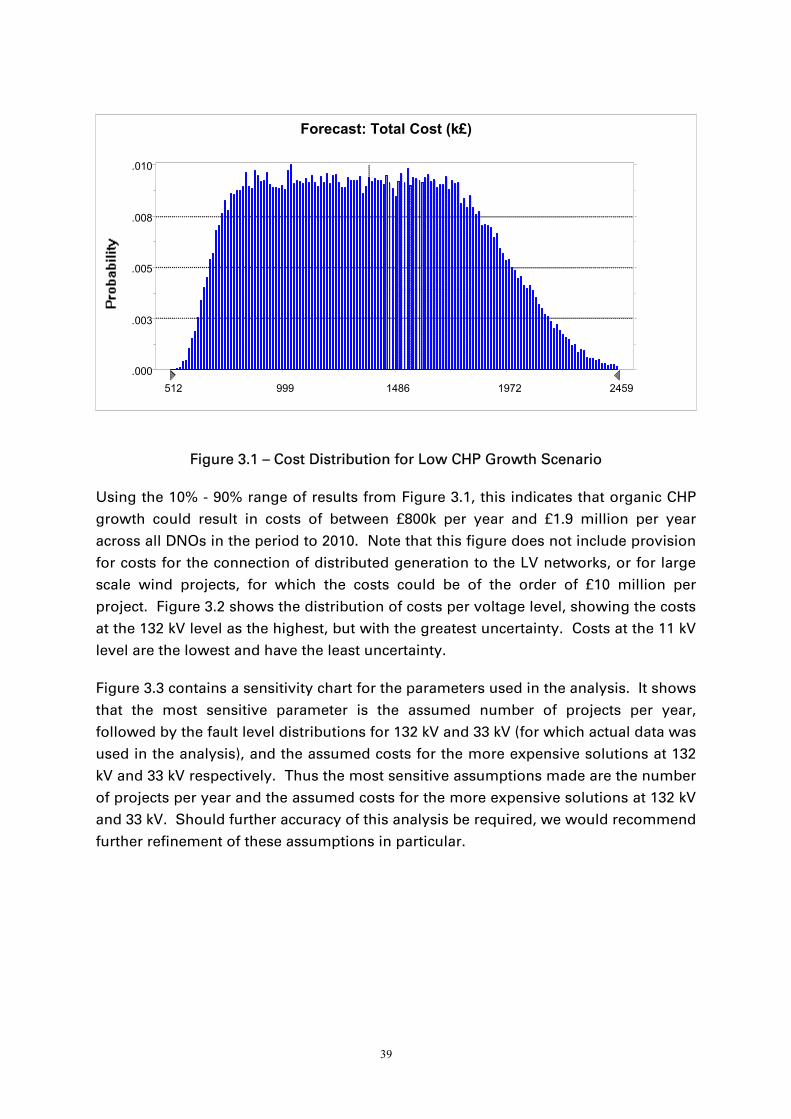
39
.000
.003
.005
.008
.010
512 999 1486 1972 2459
Forecast: Total Cost (k£)
Figure 3.1 – Cost Distribution for Low CHP Growth Scenario
Using the 10% - 90% range of results from Figure 3.1, this indicates that organic CHP
growth could result in costs of between £800k per year and £1.9 million per year
across all DNOs in the period to 2010. Note that this figure does not include provision
for costs for the connection of distributed generation to the LV networks, or for large
scale wind projects, for which the costs could be of the order of £10 million per
project. Figure 3.2 shows the distribution of costs per voltage level, showing the costs
at the 132 kV level as the highest, but with the greatest uncertainty. Costs at the 11 kV
level are the lowest and have the least uncertainty.
Figure 3.3 contains a sensitivity chart for the parameters used in the analysis. It shows
that the most sensitive parameter is the assumed number of projects per year,
followed by the fault level distributions for 132 kV and 33 kV (for which actual data was
used in the analysis), and the assumed costs for the more expensive solutions at 132
kV and 33 kV respectively. Thus the most sensitive assumptions made are the number
of projects per year and the assumed costs for the more expensive solutions at 132 kV
and 33 kV. Should further accuracy of this analysis be required, we would recommend
further refinement of these assumptions in particular.

40
.000
.020
.040
.060
.080
0% 18% 35% 53% 70%
% cost 11 kV
% cost 33kV
% cost 132 kV
Total Cost Contribution
Figure 3.2 – Cost Distribution per Voltage Level for Low CHP Growth Scenario
Forecast: Total Costnumber of projects / year .95
0-2 kA headroom at 132 kV .23costs for solution 2 for 132kV .11
0-2 kA headroom at 33 kV .09
costs for solution 3 for 33kV .08
costs for solution 2 for 33kV .04
0-2 kA headroom at 11 kV .04
costs for solution 1 for 132kV .04
costs for solution 2 for 11kV .03
costs for solution 3 for 11kV .03
costs for solution 4 for 11kV .02
costs for solution 4 for 33kV .02
likelihood of large CHP project on 33 kV -.01
likelihood of medium CHP project on 132 kV .00costs for solution 1 for 11kV .00
costs for solution 1 for 33kV .00
likelihood of small CHP project on 33 kV .00
-1 -0.5 0 0.5 1
Sensitivity Chart
Figure 3.3 – Sensitivity Chart for Low CHP Growth Scenario

41
3.3.1.2 Scenario 2 – CHP Growth to Meet Targets
Using the potential solutions shown in Table 3.1, the distribution of solutions as
shown in Table 3.2, and the distribution of available headroom in Figure 2.2, the range
of potential costs can be calculated using Monte-Carlo analysis. As with scenario 1,
these costs are slightly higher when considering make current compared to break
current. The results of this analysis for make current are shown in Figure 3.4 below.
.000
.003
.006
.008
.011
7154 10780 14406 18031 21657
Forecast: Total Cost (k£)
Figure 3.4 – Cost Distribution for High CHP Growth Scenario
Using the 10% - 90% range of results from Figure 3.4, this indicates that CHP growth to
meet targets could result in costs of between £10 million per year and £18 million per
year across all DNOs in the period to 2010. Note that this figure does not include
provision for costs for the connection of distributed generation to the LV networks, or
for large scale wind projects, for which the costs could be of the order of £10 million
per project. Figure 3.5 shows the costs per voltage level, showing the costs at the 132
kV level as likely to be the highest, but with the greatest uncertainty. Costs at the 11
kV level are the lowest and have the least uncertainty.
Figure 3.6 contains a sensitivity chart for the parameters used in the analysis. As with
the low growth scenario, it shows that the most sensitive assumptions made are the
number of projects per year and the assumed costs for the more expensive solutions
at 132 kV and 33 kV. Should further accuracy of this analysis be required, we would
recommend further refinement of these assumptions in particular.

42
.000
.017
.034
.051
.067
0% 18% 35% 53% 70%
% cost 11 kV
% cost 33 kV
% cost 132 kV
Total Cost Contribution
Figure 3.5 – Cost Distribution per Voltage Level for High CHP Growth Scenario
Forecast: Total Costnumber of projects / year .91
0-2 kA headroom at 132 kV .28costs for solution 2 for 132kV .17
costs for solution 3 for 33kV .11
0-2 kA headroom at 33 kV .09
costs for solution 3 for 11kV .08
costs for solution 4 for 33kV .08
0-2 kA headroom at 11 kV .06
costs for solution 4 for 11kV .04
costs for solution 2 for 33kV .02
costs for solution 2 for 11kV .01
likelihood of medium CHP project on 132 kV -.01
likelihood of large CHP project on 33 kV -.01
costs of solution 1 for 132kV .01likelihood of small CHP project on 33 kV -.00
costs for solution 1 for 33kV .00
costs of solution 1 for 11kV .00
-1 -0.5 0 0.5 1
Sensitivity Chart
Figure 3.6 – Sensitivity Chart for High CHP Growth Scenario

43
3.4 Case Study Example
An example of a particular project in the Netherlands to accommodate a large amount
of DG is provided in Appendix A, illustrating where investment has been made to
develop the capability to accommodate current and future DG projects.
Costs to address fault level issues for the integration of DG into the GB distribution networks in theperiod to 2010 are very difficult to estimate. Any costs developed are based on several assumptions,and there is more than one scenario of DG growth possible in the period. However, we havedeveloped cost estimates based on a low CHP growth scenario and a high CHP growth scenario.Costs are estimated to be in the range £800k to £1.9 million per year across all DNOs (for a low CHPgrowth scenario) and £10 million to £18 million per year across all DNOs (for a high CHP growthscenario). Note that these figures do not include provision for any costs for addressing fault levelissues on connection of distributed generation to the low voltage networks, or addressing fault levelissues for large scale renewables (e.g., wind) projects, for which the costs could be of the order of £10million per project

44
4. Measurement and Calculation of Fault Level Values
4.1 Introduction
The connection of DG can raise the fault levels on existing equipment, due to the fault
contributions from the DG itself, to values beyond the capacity of existing switchgear.
At the planning stage, fault levels are calculated in order to determine whether or not
they exceed the design limit of existing equipment, and to determine the design limit
required of new equipment. Fault levels tend not to be measured in operational
networks.
DNOs must continue to be prudent in ensuring that they continue to operate within
the available fault level headroom.
This section describes and comments on the methods of calculation currently in use
and potential measurement methods.
4.2 Fault Level Calculation
The method of calculation of fault levels as used by the DNOs is described in IEC60909
– “short-circuit current calculation in three-phase ac systems”. This calculation
method gives rise to conservative results that could lead either to over-investment in
network reinforcement or to the refusal of DG connections (Ref. 26). An alternative to
the method presented in IEC60909 was adopted and issued in 1992, known as
Engineering Recommendation G74 “Procedure to meet the requirements of IEC60909
for the calculation of short-circuit currents in three phase ac power systems”. This
procedure incorporates the contribution of rotating equipment at the customer site.
In the Report of CIRED Working Group No 4 on Dispersed Generation (Ref. 27), the
results of a survey involving 16 countries are given. On the issue of short circuit
calculations there was consensus that the fault level calculations were based on
IEC60909, and that no particular attention was paid to unusual switching conditions
caused by DG. In most cases the DNO planning department performs the system
studies using either no data or at best estimated data for customer machines.
Sometimes, for complex cases with large industrial customers, the DNO itself will
perform systems studies with actual customer machine data themselves or will
outsource this to a consulting firm. This can result in DG being sometimes refused
based on the calculated fault levels being too high, which would necessitate major
network reinforcement to resolve.

45
There have also been a small number of cases in the Netherlands where cable short
circuit ratings have been increased as a result of a critical review. In these cases, the
review typically focuses on comparing actual protection settings with the original
design protection settings. In some cases the actual protection settings means that
the cable is subject to short circuit conditions for a shorter period of time than
originally anticipated, and therefore the short circuit rating of the cable can be
increased.
At the Power Systems Engineering Research Center (PSERC) (Ref. 28) work is ongoing
to develop a method to enhance the method of fault level calculation. It proposes the
use of an index known as the average change of fault current (ACF) and the method of
approximating the ACF for a given system. The ACF can be used to indicate the
severity of the change of fault current due to installing new DG. Based on our
experience in providing advice on European and American networks we believe that
practical application of this method may be some years away. We are not aware that
other methods are being developed specifically to address fault level calculation.
4.3 Fault Level Measurement
The current situation is that fault levels in the network are generally not measured.
Event recording is done, and under fault conditions in higher voltage networks fault
recording is done, but the actual fault level during normal operation is not measured.
Historically, there was no need for the DNOs to obtain accurate measurements of fault
levels. This was because any network enhancement required took place on the basis
of the DNO system studies, which included the (conservative) fault level calculations,
thus ensuring that actual fault levels would be likely to be well below the design limit
of the network. Now, with the expected uptake of DG and the erosion of fault level
headroom if network enhancements are to be avoided or deferred, the need to
measure actual fault levels to ensure that they are within design limits becomes
greater.
At EA Technology, the Fault Level Monitor (FLM) has been developed to estimate
network fault levels including the contribution from induction motor loads without
requiring detailed information about the load or the network itself.
The principle of the FLM is that responses of the power system to naturally occurring
disturbances are recorded and an estimation technique (Refs. 29, 30) is used to
calculate the network fault level at the time of recording. Note that this is a “single
point” estimate as fault levels can change over time depending on how much DG and
customers’ rotating plant is actually connected. Following extensive tests carried out

46
at two industrial substations and a wind farm, it was confirmed that the results
obtained showed good agreement with standard calculation methods (Ref. 31).
The main advantages of the FLM include:
• Providing a check on the accuracy of the fault level calculations.
• Since the measured values will vary throughout the day, the FLM will be useful
for fault level management. For example, a DNO could allow generators to
connect if the measured fault level is say 90% of the computed value.
Although there are no other fault level measuring devices available on the market, and
there is an industry project to develop the FLM commercially, there are a number of
uncertainties in terms of the prospects for such a product:
• Expected sales, as the number of places in the network where the DNO wants
to measure is limited.
• The equipment must be easy to connect and compatible with the DNO
operational practices and data collecting systems (which differ widely
throughout the world).
• The measuring period should cover a substantial period of time to build up a
database of reliable values. It the measuring period is only a short period of
time there will be less disturbances recorded and therefore a less accurate
measure of fault levels.
• The DNO system planning department would require training on how to assess
the value of the measurements and to use this in the system studies whilst still
not having machine data from the customer site.
4.4 Conclusion
For the moment we have to accept that fault level calculations according to IEC60909
will inevitably be conservative. There is little activity in the international community to
change this situation. If the DNOs seek to have a better understanding of the fault
levels to better estimate the headroom there are two routes: either better modelling,
or development of an FLM.
The problems associated with the first route is that the DNOs need to have a better
understanding of what is happening in their network and must have data available
from both the new DG plant and from machines at the customer site. However, it is
unlikely that DNOs will be able to obtain customer site data.

47
DNOs are also encouraged to consider reviewing cable short circuit ratings where
particular issues exist, as original design ratings may be conservative and could
potentially be increased in specific cases based on actual protection settings
compared to those envisaged at the design stage.
The route of developing a commercial FLM poses the problems that it will take quite
some time to assess a single location (this has to be repeated over time). Furthermore
the DNO has to develop criteria based on these measurements without actually
knowing what is happening at the customer site. However, the route to an FLM fits
well with a long term strategy to have more access to measured data in the network
and as such could facilitate the realisation of active fault level management systems
within the concept of “intelligent networks”.
In the short term the most obvious solution for DNOs seeking to improve fault level calculationsis to try to obtain more machine data at the client site and perform more detailed calculations.From a longer term perspective, stimulation of the development of a commercial FLM will beadvantageous and having access to more detailed machine data during the development periodcreates a better overall understanding and gives more options for control of the network.

48
5. Constraints to DG Penetration due to Fault Level Limitations
5.1 Introduction
This section discusses the constraints to increased penetration of DG due to fault level
limitations, at both the low and medium voltage network levels in the period to 2010.
5.2 LV Network
In order to assess the constraints due to fault level limitations on the LV network, we
must consider what room there is for increases in the fault level at this network level.
Typical fault ratings for LV equipment are 25 MVA or 35 kA (Note: reference
impedance is used and this can differ widely in practice). The LV feeders with
connected loads and DG are normally connected to an 11 kV transformer. When a fault
in the LV network occurs the fault level current is determined predominantly by LV
feeder transformer short circuit impedance. Due to the introduction of large amounts
of small scale DG the present fault levels in the range of 1 to 1.5 MVA will rise some
20%, even if each household is equipped with generating capabilities up to 3 times the
load as is shown in Ref. 9.
In a US study (Ref. 32) on the effort to integrate DG into the network it was found that
with a penetration level of up to 25% of generation the impact on the network is very
limited (sometimes affecting voltage profile and to a lesser extent system operation
and control). Even with greater amounts of DG, fault levels do not appear as one of
the concerns of network operators.
In the Boxum et al study (Ref. 8) a methodology is described to make a first estimate
of the amount of decentralised power that can be integrated in the existing low
voltage distribution network. The method is suitable for both urban and rural areas.
The study was performed for different Dutch DNO LV networks and focused on power
integration (preventing overload of components), voltage levels (regulation) and fault
levels. It was found that in 80% of the cases the feeder transformer was the limiting
factor constraining the amount of DG power to be integrated (the maximum power to
be fed back in the MV network is determined by the transformer size). In the
remaining 20% of cases the limiting factor was voltage regulation. When replaced
The low impact of DG on fault levels indicates that it is unlikely to be a constraint at the low voltageconnection levels before 2010, provided that the appropriate investments are made when determinedas being necessary.
49
with a bigger transformer, in 75% of the cases the maximum loading of the cable was
the limiting factor and in 25% of the cases the voltage level. In none of the cases
studied the fault level was a limiting factor.
5.3 MV/HV Network
The MV network has to cope with fault level contribution from the DG connected to
the LV and the DG connected directly to the MV network. In the PB Power study (Ref.
9) fault levels increase was calculated for the 33 and 11 kV busbars when generation at
LV was raised from 0 to 200% and the transformer rating of the 33/11 kV and 11/04 kV
networks were doubled. The findings are that the fault level rise on 11 kV was approx
1 MVA, similar to that of the LV fault level rise due to the additional generation. This
does not cause problems related to fault levels in the period to 2010 even with the fact
that in some MV networks the remaining (calculated) fault level headroom is very
limited (less than 10%). In general this limited headroom is caused by the fact that a
lot of equipment installed is quite old and was designed for 13 kA (now the minimum
recommended rating is 25kA). Some replacement programmes are already under way
for this older equipment.
At the MV/HV level the main source for growth in fault levels is the connection of
individual wind turbines, windfarms and CHP. In general the power rating of these
generators is large enough to justify connection to the MV network. When a request
for connection comes in, the planning department of the DNO treats them on an
individual basis. When a larger CHP or a windfarm (> 5 MW) is to be connected, or
where there is low fault level headroom availability, fault levels are an issue and are
responsible for a large portion of the integration costs. The solutions are as described
in Section 3.
There does not appear to be a significant constraint to scenario 1 (low CHP growth) as
described in Section 2, as the solutions will be required largely to solve specific
problems and the headroom availability is only gradually being consumed. However,
there may be significant constraints to scenario 2 (high CHP growth) as described in
Section 2, in that:
• A large number of projects require to be completed on an annual basis.
• Solving fault level issues on a project by project basis is likely to result in a
rapid consumption of the remaining available headroom in areas of high
growth (i.e., urban networks).
• A point will be reached where certain networks will not be able to
accommodate further DG in the absence of investment in solutions which

50
increase the capability of the network to accommodate further DG (i.e., increase
the headroom).
The most significant constraint to the development of DG in the period to 2010, in terms of faultlevels, is the constraint on the MV networks in accommodating the levels of CHP required to meetGovernment targets. This constraint cannot be solved by addressing fault level issues on a projectby project basis, without investment in increasing the overall headroom available in the networks.

51
6. Characteristics of DG Machines
6.1 Introduction
As mentioned in earlier sections of this report, the magnitude of the contribution to
the fault level from DG depends on the type of generator and the type of network
coupling. Really this information only allows statement of a typical range for the fault
current contribution. Electrical parameters of a particular type of equipment (e.g. the
short-circuit impedance of a transformer coupling the generator to the network) can
assume different values making it impossible to make a general statement on the
contribution of a particular scheme.
In the following section current and envisaged DG types have been listed with an
indication of the typical range of fault current contribution. The characteristics of fault
current over time is also described, providing detailed definitions of make current and
break current, as well as typical values for different types of DG.
6.2 DG types and their Contributions
To assist with planning and indicative studies by DNOs, the following table provides a
listing of types of existing and future DG and their approximate contribution to the
fault current. The given value is the initial symmetrical short-circuit current (Ik",
IEC60909-0 Clause 1.3.5) for a three-phase fault at the network terminals of the DG
plant, expressed as multiple of the plant's rated current (Ir).
Type of equipment Network
Network Coupling Comment
[kV] Direct Trans-former
Power Electronics
Induction generator 0.4 - 33 5 - 8 3 - 7 NA Power rating 0.01 - 1 MW
Synchronous generator
• small 0.4 - 33 5 - 8 3 - 7 NA Power rating 0.5 - 5 MW
• medium 11 - 132 5 - 6 3 - 5 NA Power rating 5 - 25 MW
• large 132 NA 2.5 - 4.5
NA Power rating over 25 MW
Battery Energy Storage System
0.4 - 132
NA NA 1 - 1.2
Biomass system 0.4 - 33 Dependent on generator type.

52
Type of equipment Network
Network Coupling Comment
[kV] Direct Trans-former
Power Electronics
CHP system 0.4 - 132
Dependent on generator type.
Fuel Cell system 0.4 - 33 NA NA 1 - 1.2 Landfill gas system 0.4 - 11 Dependent on generator
type.
Micro CHP generator 0.4 5 - 8 NA 1 - 1.2 Power rating 1-3 kW. Domestic application. Typically (single-phase) induction generator.
Mini CHP turbine 0.4 - 11 5 - 8 3 - 7 NA Up to 500 kW. For blocks of houses, offices and shops. Typically induction generator.
PV system 0.4 NA NA 1 - 1.2 Tidal stream system 11 5 - 8 3 - 7 NA Waste incineration 0.4 -
132 Dependent on generator type.
Wave power system 0.4 - 33 5 - 8 3 - 7 NA Typically induction generator. See note 1.
Wind turbine See note 1. • squirrel-
cage
induction
generator
0.4 - 11 5 - 8 3.5 - 6.5
NA
• DFIG, type I 11 - 132 1 - 2 1 - 1.5 NA See note 2.
• DFIG, type II 11 - 132 4 - 6 3 - 5 NA See note 2.
• direct-drive
synchronou
s
11 - 132 NA NA 1 - 2
NA = Not applicable
NOTES
1. Values apply to a single generating unit. Many units can be combined to a park and connected to
a higher voltage network.
2. For type I the generator's rotor winding looks in to the converter's DC interlink when the IGBT
switches open. For type II the generator's rotor winding is shorted and effectively the generator becomes an induction generator (Refs. 36, 37, 40).

53
Table 6.1 - DG contribution Ik"/Ir
6.3 Impact on make and break currents
Fault currents decrease over time. This is reflected in most LTDS reports by the fact
that they distinguish between make and break fault levels.
The make fault level relates to the ability to withstand the mechanical forces caused by
the flow of current. The relevant value is the peak short-circuit current (ip) which is
defined as the maximum possible instantaneous value of the prospective (available)
short-circuit current (IEC60909-0 Clause 1.3.8).
The break fault level relates to the ability of circuit breakers to interrupt the fault
current. The relevant value is the symmetrical short-circuit break current (Ib) which is
defined as the r.m.s. value of an integral cycle of the symmetrical a.c. component of
the prospective short-circuit current at the instant of contact separation of the first pole
to open of a switching device (IEC60909-0 Clause 1.3.9).
For calculation of these values, refer to IEC60909-0 and G74. The currents in Table 6.1
can be used as make current contributions. For the contribution of DG to the break
current, the following categories can be distinguished:
• DG types with an induction generator.
• DG types with a synchronous generator.
• DG types with a power electronic coupling.
• DFIG wind turbines.
The characteristics of each of these categories in terms of break current are detailed
below.
6.3.1.1 Induction Generators
Induction generators get their magnetic excitation from the power system they are
connected to. Shorting the machine at its terminals causes a collapse of the excitation,
in turn resulting in a collapse of the fault current contribution. Typically currents
decrease to a negligible value after 100 to 300 ms and so induction generators hardly
increase the break current. As a first approximation the break current contribution can
be assumed as zero.

54
6.3.1.2 Synchronous Generators
The contribution of a synchronous generator decreases from the so-called
subtransient value (0-50 ms after fault initiation), via the transient value (50 ms - 1 s) to
the steady-state short-circuit current (beyond 1 s). While the subtransient current is
determined by the subtransient reactance, an electrical property of the machine, the
transient and steady-state short-circuit currents depend strongly on the design of the
excitation system. For the break current one can use a value for the generator current
of about 1 to 3 times rated current.
6.3.1.3 DG with power electronics coupling
Power electronic devices cannot carry large currents for a long time. A sudden
increase of the current is detected by protective circuits (typical setting 1.2 times rated
current) causing the control electronics to stop the firing of the semiconductor valves.
While thyristors will block only when there is a zero crossing of the current (worst case
after 10 ms), forced-commutated devices such as IGBTs and MOSFETs block the
current within milliseconds. In either case the contribution to the break current is zero.
6.3.1.4 DFIG Wind Turbines
The short-circuit behaviour of DFIG wind turbines is highly-dependent on the design of
the generator and its electronics. Worst case is when the rotor winding is shorted
when the converter blocks. The fault current contribution will reach peak values of four
to six times rated current before decreasing to zero in about 100 to 200 ms. On most
types, however, the blocking of the rotor converter will cause the unit to disconnect
from the network within 25 to 100 ms. In either case the break current contribution is
zero.

55
7. Longer term perspective (to 2020-2030)
7.1 Introduction
There is no doubt that our present day network, with its historically defined structure,
will have to change to cope with the new demands of the future. A paradigm shift in
network planning and network development is needed because DNOs are faced with
increased uncertainty with respect to location and the amount of demand and
generation. The generation is operating in a more intermittent manner whilst the
diversity and numbers of generators increases quickly. As a consequence new rules
are needed alongside ideas of how this transition to an electricity network of the future
has to take shape and emerge from the present system. A few things are sure about
the network of the future (see Figure 7.1):
• The assets will be utilised as much as technically possible.
• Many small scale generators (of fluctuating nature) are connected.
• Power flows will be in all directions (not only top-down).
• Information and communication technology (measure and control) will be
widely used.
Figure 7.1 Vision of the future network (source KEMA)
When discussing the longer term perspective (to 2020-2030) of the distribution
network fault levels and assessing the potential cost involved to remove this technical
barrier, we have to take a look at some possible visions (scenarios) that might become

56
reality. We have broken this down into two sections: the impact of new network
design on coping with fault levels, and how new generation will impact on fault levels.

57
7.2 Network Design in 2020-2030
A key question to consider for the future is what will the power exchange layer look
like in the future. Two models that can be examined are the camel or the dromedary
model, which are illustrated in Figure 7.2. The Camel model envisages large power
plants connected to one another via a high-voltage network, while a low-voltage
network interconnects the micro networks. Power would then be exchanged between
the high and low voltage networks over a relatively lightweight medium-voltage
network. Alternatively, the dromedary model assumes that both the large-scale plants
and the micro networks are connected to each other via a well-developed medium-
voltage network.
Figure 7.2 Camel and dromedary model for the exchange of power between large
and small-scale generation during the transition to a future network
system.
If the camel model is adopted, with a relatively weak MV interconnection layer, the
investments are done mainly in the HV and LV network (MV network investments are
avoided when possible). When looking at the LV network substantial investments are
done locally (probably at the customers site) to maintain voltage levels within
tolerances and as a consequence also limit the possible fault level increases in the LV
network. Because maintaining the voltage levels is a difficult task in the LV network
with a weak MV coupling there will probably be a large emphasis on information
technology and control. The small generators will therefore be equipped with
intelligence (power electronics interface) that will also limit the fault level contribution.
When the dromedary model is adopted, the MV network will be reinforced
(transformers and controls) and serves as a primary means for keeping the voltage
within limits (this resembles most closely the present network situation). As a
consequence no special measures need to be taken at the local LV generators to
reduce the fault level contribution. The DNO installs advanced measuring and control

58
tools at the feeders and the MV substation transformers and switchgear is upgraded to
make a “strong network”. As a consequence of this reinforcement the fault level
capabilities of the MV network are greatly enhanced. In this case to the main problem
will be the maintenance of the voltage profiles within the tolerance. Remaining within
tolerance will become increasingly difficult with only direct control functionality at the
entrance point of the feeders, so it is therefore likely that there will again be a demand
for intelligence (power electronics) being introduced at the individual connected
generators.
Recent studies (Refs. 21, 33, 34, 35) suggest that ultimately the camel model will be
adopted, in which case fault levels are only of concern in specific cases. It is not likely
that a DNO will encounter high investments associated to cope with high fault levels
because fault levels are limited by the use of power electronics at DG plant. If the
transition is more gradual and first goes through a stage of dromedary development
and then switches to the camel model, the remaining problems with fault levels will
still tend to be specific cases. In this process the MV network will be reinforced and
therefore capable of coping with the increase in fault levels.
7.3 New generation technologies
It is possible that in the period to 2020-2030, entirely new generation technologies
might become commercially available, employing for example tidal wave energy,
thermo- and piezoelectric energy or osmosis. Also micro turbines (gas-fired, wind),
energy storage systems and fuel cell systems (mobile in cars and stationary) hopefully
reach the point of becoming commercially viable. Of course there will be
developments to increase the efficiency and ratings of all kind of existing equipment
(e.g., gas turbines), but most promising is the rapid development of power electronics.
Components will become cheaper over time and the power ratings are steadily
increasing. As a consequence of these developments it is possible that new micro,
mini and small CHP as well as small wind turbines will be equipped with power
electronic inverters. Small and large fuel cell systems and storage systems (battery
and /or flywheel), as well as large wind turbines (direct drives) will be developed (Ref.
36). None of these systems will contribute to the fault levels. All other generators not
equipped with power electronics will continue to contribute to fault levels. Note that
on the customer site the motors will be almost exclusively be equipped with VSDs (for
superior controllability) and as such will not contribute to fault levels either.
A higher proportion of the connected DG in the LV and MV networks will have powerelectronics interfaces in 2020-2030 than is currently the case. These power electronicsinterfaces slow down the growth in fault levels. However, there will continue to be large DGconnected which continue to contribute to the fault level. If the uptake of DG is very large, thefault level contribution will grow significantly.

59
7.4 Conclusion
As already concluded in earlier sections increasing fault levels are not a “show
stopper” for the uptake of small scale DG in the period to 2010 assuming that the
appropriate investments in the networks are made. In the longer term until 2020-2030
the expected network development, the uptake of new generation technologies and
the appropriately rated power electronics interfaces could prevent further increases in
fault levels from smaller scale DG, but will not assist in addressing the significant fault
level contribution from large scale DG.

KEMA Limited Proprietary G04-1517D001 Rev 1 Final April 2005
A.1
Appendix A: Example Netherlands DG Project
By 2000, some 25 wind turbines with a total installed power of 3.3 MW were
connected to a rural 10 kV network. Most of these turbines were stand-alone units
installed by farmers with power ratings typically ranging from 75 to 250 kW.
However, since the late 1990's turbine power ratings have increased significantly, and
Government policy changed to favour wind parks and discourage stand-alone
turbines. With new stand-alone sites becoming more difficult to develop, turbine
owners started replacing their existing small turbines with larger ones. Within a matter
of two years the DNO was faced with requests to increase the connection capacity
from 3.3 MW to about 20 MW.
Besides the turbines already connected, the DNO had a portfolio of other prospective
connections. Originally consisting of 10 sites with total power of 5.5 MW, the portfolio
grew to about 20 sites with a total of 35 MW.
The massive increase in capacity required as a result of these connection requests was
far beyond the capacity of the rural infrastructure, and the DNO was faced with three
choices as follows:
• Increase the tolerance of the supply voltage.
• Reinforce the existing 10 kV network.
• Build a new and separate network infrastructure specifically for DG.
The DNO chose to build an entirely new and separate 20 kV network with adequate
capacity for the potential DG growth. The network has its own 110/20 kV supply
transformer. Some parts of the new network are still connected to the existing 10 kV
network, but can in future be reconnected / switched over to the 20 kV network. The
new network offers the DG initially no redundancy, reducing construction cost by 50
%. Instead the DNO compensates turbine owners for loss of energy due to non-
availability of the network. If the amount of wind turbines keeps growing over time,
partial redundancy will be introduced. Although use of 10 kV was technically possible
and more economical, the transport capacity would be low and the existing
infrastructure would reach its limits faster. The 20 kV voltage was therefore adopted
as an investment for the future.
The investment cost for the new network was qualified as "deep cost" and was born by
the DNO. The DG network was built at a cost of approximately €210 Euro per kW. The

KEMA Limited Proprietary G04-1517D001 Rev 1 Final April 2005
A.2
annual OPEX is about €1 per kW connected. Figure A.1 below shows a schematic of
the new network and DG locations.
20 km<200 kW<400 kW<800 kW<1200 kW>1200 kWCity / Town20 kV DG grid
Exis
ting
Pros
pect
Note: Upgrades to existing wind turbines are shown by partially overlapping dots.
Figure A.1 – Dutch DG Network Schematic