the contribution of human capital to china’s … contribution of human capital to china’s...
TRANSCRIPT
NBER WORKING PAPER SERIES
THE CONTRIBUTION OF HUMAN CAPITAL TO CHINA’S ECONOMIC GROWTH
John WhalleyXiliang Zhao
Working Paper 16592http://www.nber.org/papers/w16592
NATIONAL BUREAU OF ECONOMIC RESEARCH1050 Massachusetts Avenue
Cambridge, MA 02138December 2010
We are grateful to a seminar group at University of Western Ontario for comments, and to ChunbingXing, Chris Robinson, Chunding Li, Jim MacGee and Xiaojun Shi for discussions. We acknowledgesupport from the Ontario Research Fund. The views expressed herein are those of the authors anddo not necessarily reflect the views of the National Bureau of Economic Research.
NBER working papers are circulated for discussion and comment purposes. They have not been peer-reviewed or been subject to the review by the NBER Board of Directors that accompanies officialNBER publications.
© 2010 by John Whalley and Xiliang Zhao. All rights reserved. Short sections of text, not to exceedtwo paragraphs, may be quoted without explicit permission provided that full credit, including © notice,is given to the source.

The Contribution of Human Capital to China’s Economic GrowthJohn Whalley and Xiliang ZhaoNBER Working Paper No. 16592December 2010JEL No. O0,O10,O4,O47
ABSTRACT
This paper develops a human capital measure in the sense of Schultz (1960) and then reevaluates thecontribution of human capital to China’s economic growth. The results indicate that human capitalplays a much more important role in China’s economic growth than available literature suggests, 38.1%of economic growth over 1978-2008, and even higher for 1999-2008. In addition, because humancapital formation accelerated following the major educational expansion increases after 1999 (collegeenrollment in China increased nearly fivefold between 1997 and 2007) while growth rates of GDPare little changed over the period after 1999, total factor productivity increases fall if human capitalis used in growth accounting as we suggest. TFP, by our calculations, contributes 16.92% of growthbetween 1978 and 2008, but this contribution is -7.03% between 1999 and 2008. Negative TFP growthalong with the high contribution of physical and human capital to economic growth seem to suggestthat there have been decreased in the efficiency of inputs usage in China or worsened misallocationof physical and human capital in recent years. These results underscore the importance of efficientuse of human capital, as well as the volume of human capital creation, in China’s growth strategy.
John WhalleyDepartment of EconomicsSocial Science CentreUniversity of Western OntarioLondon, ON N6A 5C2CANADAand [email protected]
Xiliang ZhaoDepartment of EconomicsXiamen [email protected]

2
1. Introduction
We reevaluate the role of human capital in economic growth in China relative to recent
growth accounting literature (Chow and Li, 2002; Wang and Yao, 2003; Bosworth and Collins,
2008) which seemingly concludes that human capital has been relatively unimportant for China’s
growth. China maintained high growth rate for more than three decades after the 1978 reforms.
The average real GDP growth rate was 9.82% between 1978 and 2008. But since 1999 there has
been a major transformation in higher education in China as documented by Li et al. (2008).
Existing growth accounting literature concludes that despite this physical capital growth rather
than growth of human capital which is central to China’s growth.
Following Barro and Lee (1993) which uses changes in the years of schooling over time
as a proxy for human capital growth human capital is the relatively slow growing input in growth
accounting for China and contributes little to growth. We use an alternative measure of human
capital constructed from the opportunity cost side and reevaluate the contribution of human
capital to China’s growth. We treat human capital in its original Schultz (1960) sense as the
opportunity cost foregone when individuals acquire human capital. This focuses on the earnings
foregone when obtaining schooling, and the time and cost involved. We modify the procedure
used by Barro and Lee (1993, 2000) and use the flow of graduates from different levels of
education as the estimate of the volume increase in human capital, and then use the real average
wage over time to value the time input into human capital formation for different levels of
education. Under this treatment the human capital stock for the whole of China is much faster
growing than in previous literature because wages change significantly over time.
Using this measure of the human capital stock, we recalculate the role of physical capital
accumulation in China’s economic growth along with labor, and human capital stock. Our results
3
suggest that human capital is much more important for China’s growth than in existing growth
accounting literature. During the period 1978-2008, our calculations suggest that China’s human
capital stock increased by 7.6% annually, and contributed 33.2% to growth, even though
physical capital still contributes to economic growth in a major way (45.1%, between 1978 and
2008). Human capital’s contribution is almost the same in recent decades at nearly 40%. The
contribution of physical capital in the last decade accounts for more than 68% of economic
growth, but equally human capital is important for China’s economic growth, reflecting the
transformation in higher education since 1999 (See Li et al., 2008). Our growth accounting
results suggest that China’s growth reflects input growth, physical capital as well as human
capital, rather than exogenous technical changes as in Solow’s (1957) original growth accounting
study of the U.S.. In China’s case, in the most recent decade, TFP growth becomes negative in
the calculations we report.
There are several implications which follow from our analysis. As the contribution of
TFP to growth in growth accounting is calculated as a residual, when we both separately identify
and appropriately measure human capital accumulation, TFP growth in China is small to
negative. This implies China’s economic growth is mainly driven by capital accumulation, of
both physical and human capital. But negative TFP growth suggests that there may well be
inefficient use of human capital in recent decades, and this is particularly manifest in increased
unemployment of college graduates. This misallocation of human capital and physical capital
means that the Chinese economy may operate significantly inside the production frontier despite
achieving high rates of growth. These findings suggest that there are substantial returns to raising
employment of those with higher education and deploying human capital more efficiently. The
paper is organized as follows. Section 2 is a brief review of previous growth accounting literature

4
on China and the role that human capital formation plays in it, and sets out the basic growth
accounting framework. Section 3 discusses how human capital can best be incorporated into a
growth accounting framework, and highlights critical issues in the measurement of human
capital in the Chinese case given China’s high growth rate. Section 4 provides a series of growth
decompositions using growth accounting methods for China which stress the revision we offer to
existing analysis of the role of human capital in China’s growth. A final section, concludes.

5
2. Earlier Analyses of Sources of Chinese Growth
Positions on the sources of growth in China today are critical in framing an overall policy
stance towards maintaining high growth in the future. The 11th five year plan in 2005, for
instance, reported growth accounting calculations in which total factor productivity (TFP)
growth accounted for around 40% of growth and argued for a target to raise this to 60% of
growth (Fan, 2006). This in turn was to be achieved by large increases in educational
expenditures with a stress on a knowledge based economy with both upgrading of quality of
products and development of new products. This view of the Chinese growth process finds its
echo in the sharp rise in information technology product exports from around 7% in the early
1990s to around 30% today (Xing, 2010).
The view that TFP growth increases are the way to sustain high Chinese growth is,
however, one which can be challenged following debate over the main sources of growth in
China over the last two decades. The view in the 1990s was that China’s growth was driven
primarily by growth of total factor productivity (TFP) as in Solow’s (1957) analysis of US long
term growth. Later empirical analysis for China by Maddison (1999) and the World Bank (1997)
showed, however, that TFP growth accounted for over 30-58% of China’s growth during 1978-
1995. Hu and Khan (1997) calculated an average Chinese TFP growth of 3.9% over this period
which they claimed accounted for more than 40% of China’s growth in the early reform years.
However, other economists have argued that China’s growth in this period was mainly driven by
the growth of inputs rather than TFP growth. Chow and Li (2002) found that the main
contribution to China’s economic growth in the post reform period of 1978-1998 was from
capital accumulation rather than TFP increases in productivity. In their analysis capital
accumulation accounted for 54% of growth while TFP increases accounted for only 32% of
6
growth, and labor input growth 13%. Li et al. (2005) reported an even higher contribution of
capital accumulation to growth of 63.2% in the post reform period 1978-2003. The contribution
of labor input growth was only 10.6%, total factor productivity contributed the 26.2% residual.
At the same time related work raised doubts concerning China’s growth rate reflecting
what was seen as poor quality of Chinese data. Krugman (1994), for instance, argued it is
difficult to account for China’s growth because of poor quality of data in China. Young (2003)
also questioned the quality of Chinese data and after making adjustments to public Chinese data,
found nonagricultural labor productivity growth of 2.6% and TFP growth of 1.4 per year. Holz
(2006) further explored Chinese data issues.
Another strand of literature examines the role of human capital in understanding China’s
high growth, also our focus here. At analytical level, Lucas (1988) stressed human capital as an
engine for economic growth and Romer (1990) developed a model in which growth was driven
by human capital accumulation, with no special analysis of the Chinese case. However, later
empirical analysis by Wang and Yao (2003) decomposes China’s growth sources into physical
and human capital accumulation, as well as labor force growth. For the post reform period 1978-
1999, the contribution of physical capital accumulation, labor, and human capital accumulation
are 47.7%, 15.9%, 11%, respectively with total factor productivity growth in the post reform
period contribution is 25.4% of China’s growth. Their results suggest that the human capital
contributes in a major way to Chinese economic growth before reform, when TFP growth is
negative, but after reform, the contribution of human capital is minor. The results seem
counterintuitive since formal human capital formation increases sharply after the reforms. For
example, according to their data, average years of schooling in China increase from 3.6 in 1978
to 5.9 in 1999.

7
A more recent paper, Bosworth and Collins (2008) also analyses sources of China’s
growth over the period 1978-2004. They decompose the growth of per capita output into growth
of capital and education per worker. Their result shows that 3.2% of the 7.3% per capita output
growth over this period is contributed by physical capital growth per worker, i.e., 44% of per
capita output growth is due to physical capital accumulation. Only 0.3% of the 7.3% output per
capita growth is from education, that is to say, 4.1% of growth is contributed by education. The
residual 3.6% or 49% of growth is from total factor productivity growth.
The literature view thus seems to be that human capital formation is of little consequence
in understanding China’s high growth since reform in 1978. This is despite large increases in
educational spending and participation since 1999.

8
3. Growth Accounting and Human Capital
Most growth accounting work builds on Solow’s (1957) paper. He showed how to use an
aggregate production function to decompose overall growth rates into growth of Hicks-neutral
disembodied technical change and a weighted sum of rates of growth of factor inputs, coming to
the conclusion that for the U.S. using data back to the 1870’s the majority of U.S. growth arose
from disembodied technical change. Later work challenged this conclusion using embodied
technical change and quality adjustments over time for inputs.
This framework is well known using a CRS production function with capital and labor as
inputs, and assuming factors are paid their values marginal products,
,t t t tY A F K N , (1)
where Yt is output, Kt is capital. Nt is the work force, At is the Hicksian Neutral technology factor,
then after a simple transformation of a time derivative, one can obtain the well known Solow
growth accounting equation:
,Y A K K N Ng g s g s g (2)
where xg x x is the growth rate of x, where x refers to Y, A, K, and N alternately. sK and sN are
shares of capital and labor in national income.
In principle it is easy to extend Solow’s formulation to include human capital as well as
the work force in the aggregate production function and extend it to a three-factor formulation.
Human capital is then the increment which improves unimproved (or uneducated) labor through
the educational process.
Early growth accounting literature, including Solow (1957) and Denison (1962),
decomposed the overall growth rate into contributions from capital and labor service growth, and

9
computed the so-called Solow residual to capture the rate of technological change. Jorgenson and
Griliches (1967) later noted that changes in the quality of factor inputs and particularly labor can
play a major role in the decomposition of growth performance, and sharply reduce the
contribution of Hicksian neutral technical change to growth. They did not explicitly refer to or
emphasize human capital as well, but discussed education as something which improves labor
quality over time. Increases in educational participation were therefore important in raising labor
quality and raising growth rates. In this paper, we highlight that how human capital is measured
in growth accounting is also important.
3.1 Barro and Lee’s (1993; 2000) Approach to Measuring Human Capital
In recent literature and following Barro and Lee (1993, 2000), school enrollment rates, or
adult literacy rates are frequently used as proxies for human capital because of the inadequacy of
measures for human capital, Barro and Lee (1993; 2000) also used a perpetual inventory
approach in estimating their human capital proxies. In constructing a measure of human capital
for use in growth accounting, Barro and Lee (1993) use information which comes from census
and survey estimates of educational attainment from UNESCO Statistical Yearbooks, U.N.
Demographic Yearbooks, and other sources to first construct a data set on educational attainment
for 129 countries over five-year periods from 1960 to 1985. They then use a perpetual inventory
method to construct a human capital measure for each country that starts with census/survey
figures as benchmark stocks and then uses school enrollment ratios to estimate changes from the
benchmarks to get an estimate of education attainment for missing values. Barro and Lee (1996;
2000) update their data to 1990 and 1995 to provide a data set for international comparison and
growth analysis.

10
Since we build on their method, we will first briefly review Barro and Lee’s (1993; 2000)
method. They consider country populations aged 25 and over in their 1993 paper, and later
extended it to consider the population aged 15 and over in their 2000 paper. If Lt is the
population aged 25 and over at time t, and Hjt is the number of people within this adult
population for whom j is the highest level of education attainment, and j=0 for no schooling, j=1
for completed primary, j=2 for completed secondary, and j=3 for completed higher education,
then hjt=Hjt/Lt is the proportion of the adult population for whom j is the highest educational
level attained. PRIt-τ is the gross enrollment ratio for primary school, SECt- τ the ratio for
secondary school, and HIGHt- τ the ratio for higher education, all observed at time t- τ. L25t is the
population aged 25-29 at time t who entered into Lt during the previous five years. Barro and Lee
assume that these new entrants would have received primary education 15 years earlier (if they
attend primary school), secondary education 10 years earlier (if they attended secondary school),
and higher education 5 years earlier (if they received higher education).
Taking the no-schooling category as an example, the estimated number of people aged 25
and over who have no educational attainment at time t is given by
0, 0, 5 151 25 1t t t t tH H L PRI , (3)
where δt is the proportion of people aged 25 and over in year t-5 who did not survive to year t.
This is estimated as δt ≈ (L25t + Lt-5 – Lt)/Lt-5. They assume that the fraction of the population
aged 25 to 29 who have no elementary education equals the fraction, 1-PRIt-15, who were not
enrolled in primary school 15 years before. Substituting δt into (3), gives the fraction of the
population with no schooling,
0 0 0, 5 151 25 25 1t t t t t t t t th H L L L h L L PRI , (4)

11
The procedures they use for other levels of educational attainment are analogous. The
resulting formulas are
1 1 1, 5 15 101 25 25t t t t t t t t t th H L L L h L L PRI SEC , (5)
2 2 2, 5 10 51 25 25t t t t t t t t t th H L L L h L L SEC HIGH , (6)
3 3 3, 5 51 25 25t t t t t t t t th H L L L h L L HIGH . (7)
Using these ratios, they get an estimate of average years of schooling for different countries
for every year.
3.2 Gemmell’s (1996) Adjustment of Barro and Lee
Later, Gemmell (1996) made a significant adjustment to Barro and Lee’s procedure. The
Barro and Lee’s (1993; 2000) method allows stock/accumulation effects to be investigated, but
their dataset also includes adults not in the labor. Gemmell argues that only human capital in the
labor force contributes to economic growth so that Barro and Lee’s method exaggerates the size
of the human capital stock. He constructed a stock-flow measure of human capital in the labor
force,
1t t t t t tH H N R (8)
where Ht is the stock of human capital at time t, αt is the proportion of new labor force entrants,
and Nt, and βt is the proportion of retirees with embodied human capital skills, Rt. He used 1960
schooling enrollment ratios as a proxy for the proportion of the 1960 labor force with relevant
levels of education, combining it with the working age population in 1960 to estimate the initial
12
stock of human capital for different levels of education, and then used eq. (8) to estimate human
capital stock over time.
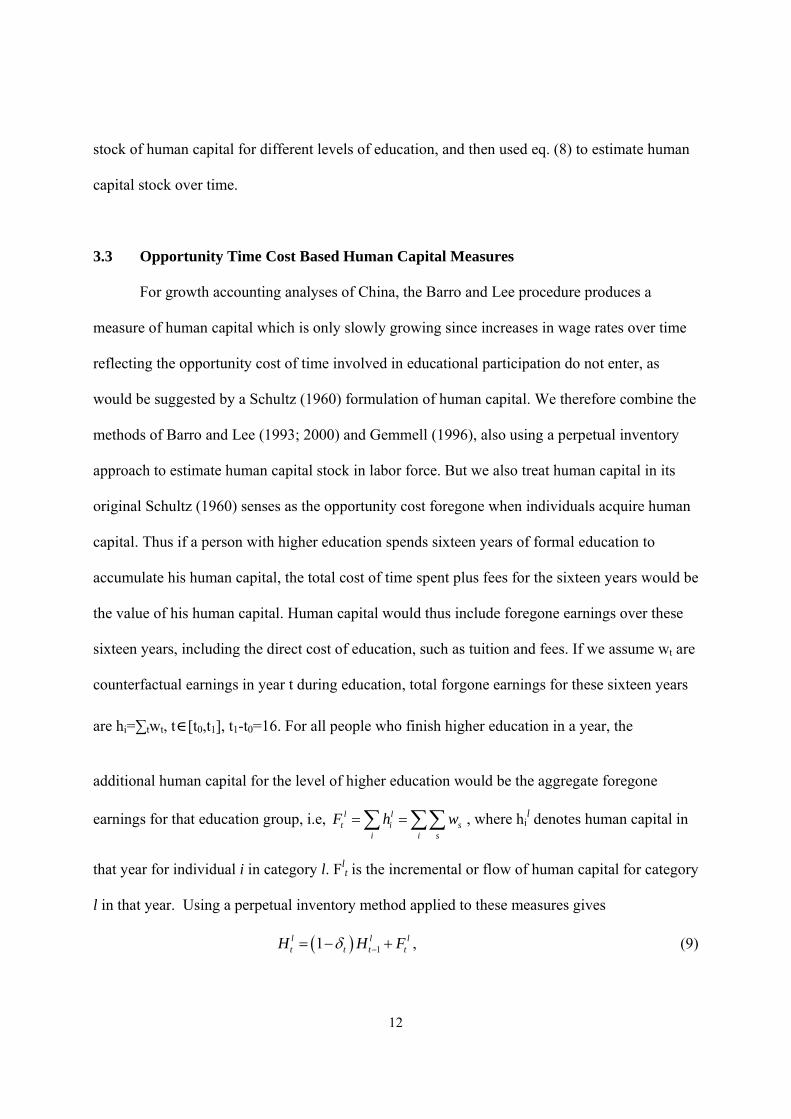
3.3 Opportunity Time Cost Based Human Capital Measures
For growth accounting analyses of China, the Barro and Lee procedure produces a
measure of human capital which is only slowly growing since increases in wage rates over time
reflecting the opportunity cost of time involved in educational participation do not enter, as
would be suggested by a Schultz (1960) formulation of human capital. We therefore combine the
methods of Barro and Lee (1993; 2000) and Gemmell (1996), also using a perpetual inventory
approach to estimate human capital stock in labor force. But we also treat human capital in its
original Schultz (1960) senses as the opportunity cost foregone when individuals acquire human
capital. Thus if a person with higher education spends sixteen years of formal education to
accumulate his human capital, the total cost of time spent plus fees for the sixteen years would be
the value of his human capital. Human capital would thus include foregone earnings over these
sixteen years, including the direct cost of education, such as tuition and fees. If we assume wt are
counterfactual earnings in year t during education, total forgone earnings for these sixteen years
are hi=∑twt, t∈[t0,t1], t1-t0=16. For all people who finish higher education in a year, the
additional human capital for the level of higher education would be the aggregate foregone
earnings for that education group, i.e, l lt i s
i i s
F h w , where hil denotes human capital in
that year for individual i in category l. Flt is the incremental or flow of human capital for category
l in that year. Using a perpetual inventory method applied to these measures gives
11l l lt t t tH H F , (9)
13
where Htl denotes the human capital stock in year t for category l, and δt is the depreciation rate
for human capital in year t. The aggregate level of human capital would be the human capital
stock for the economy, i.e., Ht = ∑lHtl.
Instead of using enrollments as the flow measure of human capital formation, we use
graduates as the flow of human capital as in Wang and Yao (2003). In China, there are usually
six years for primary school education, three years for junior secondary school education, three
years for senior secondary school education, and three or four years for tertiary education.
Special secondary here mainly refers to vocational or technical schools, which are usually two or
more years of education after junior secondary education. Tertiary graduates usually have 16
years of education, special secondary graduates, 11 years, senior secondary school graduates, 12
years, junior secondary graduates, 9 years, and primary school graduates, 6 years.
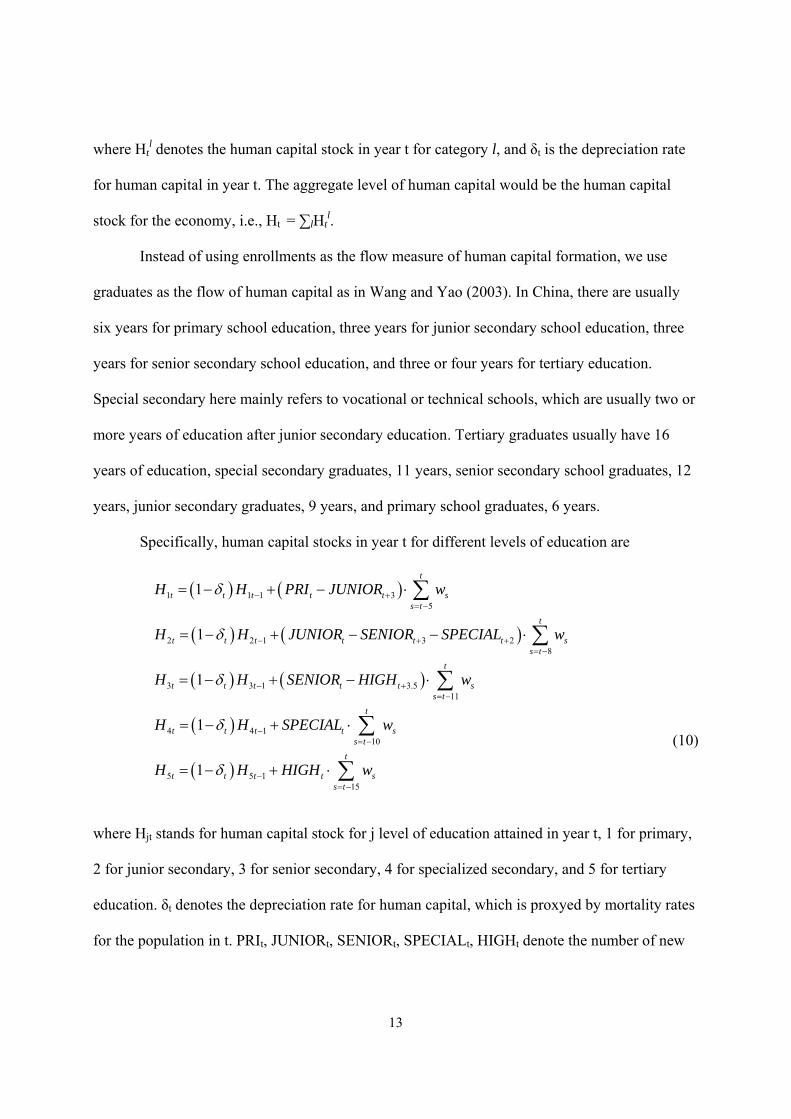
Specifically, human capital stocks in year t for different levels of education are
1 1 1 35
2 2 1 3 28
3 3 1 3.511
4 4 110
5 5 115
1
1
1
1
1
t
t t t t t ss t
t
t t t t t t ss t
t
t t t t t ss t
t
t t t t ss t
t
t t t t ss t
H H PRI JUNIOR w
H H JUNIOR SENIOR SPECIAL w
H H SENIOR HIGH w
H H SPECIAL w
H H HIGH w
(10)
where Hjt stands for human capital stock for j level of education attained in year t, 1 for primary,
2 for junior secondary, 3 for senior secondary, 4 for specialized secondary, and 5 for tertiary
education. δt denotes the depreciation rate for human capital, which is proxyed by mortality rates
for the population in t. PRIt, JUNIORt, SENIORt, SPECIALt, HIGHt denote the number of new

14
graduates for primary, junior secondary, senior secondary, special secondary, and higher
education. wt are real average wages in year t.
Ideally, we should use average wage data for different levels of education in constructing
our human capital estimate. These kinds of wage data are not available and so we use the same
average wage for employees in China for all educational time valuations. The major impact of
the adjustments we make in our human capital estimation is to capture changes in wages over
time in the valuation of human capital inputs, and this effect is still preserved by this use of data.
15
4. Measurement and Chinese Growth Accounting
This section discusses the measurement of the variables used for our growth accounting.
The variables involved are output, the physical capital stock, labor, and the human capital stock.
4.1 Output
Our output data, GDP, covers 31-year period (1978-2008), and are taken from the China
Statistical Yearbook (hereafter CSY, 2009). We use the CSY constant price index to transform
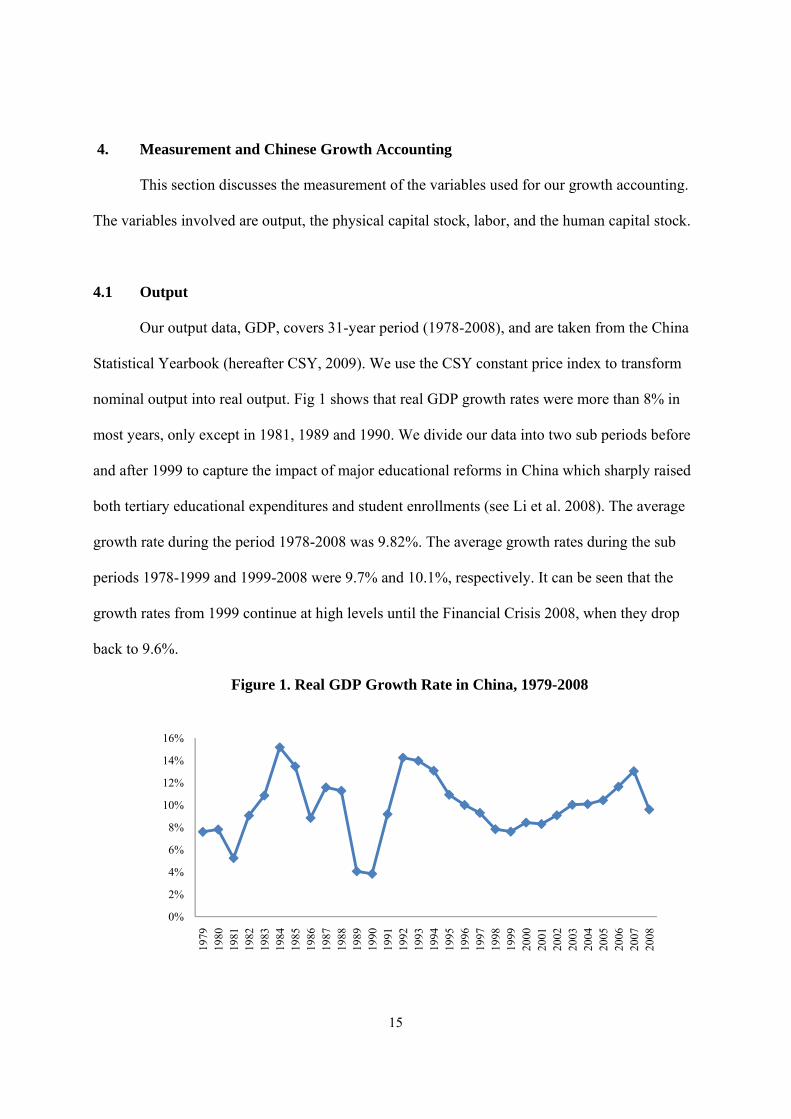
nominal output into real output. Fig 1 shows that real GDP growth rates were more than 8% in
most years, only except in 1981, 1989 and 1990. We divide our data into two sub periods before
and after 1999 to capture the impact of major educational reforms in China which sharply raised
both tertiary educational expenditures and student enrollments (see Li et al. 2008). The average
growth rate during the period 1978-2008 was 9.82%. The average growth rates during the sub
periods 1978-1999 and 1999-2008 were 9.7% and 10.1%, respectively. It can be seen that the
growth rates from 1999 continue at high levels until the Financial Crisis 2008, when they drop
back to 9.6%.
Figure 1. Real GDP Growth Rate in China, 1979-2008
0%
2%
4%
6%
8%
10%
12%
14%
16%
1979
1980
1981
1982
1983
1984
1985
1986
1987
1988
1989
1990
1991
1992
1993
1994
1995
1996
1997
1998
1999
2000
2001
2002
2003
2004
2005
2006
2007
2008

16
4.2 Physical Capital Stock
We use a perpetual inventory approach to estimate the physical capital stock over the
same period. We take the 1978 capital stock estimate from Chow (1993) and Chow and Li (2002)
of 1 411.2 billion yuan as our initial physical capital stock estimate at the end of 1978. CSY
(2009) provides a fixed capital price index (1991=100) after 1991. Hsueh and Li (1999) provide
an implicit investment deflator for the period 1952-1995, based on data from the Annual Report
of Statistics on Investment in Fixed Assets. We combine Hsueh and Li (1999) and CSY (2009)
together to get investment deflator from 1978-2008 and use gross fixed capital formation at
current prices from CSY (2009), and the investment deflator above to estimate real investment.
Our capital stock series is calculated as,
11t t tK K I , (11)
where δ is the depreciation rate.
Figure 2. Real Capital Stock and its Growth Rate, 1978-2008
0%
2%
4%
6%
8%
10%
12%
14%
16%
0
20000
40000
60000
80000
100000
120000
140000
160000
180000
200000
1978
1980
1982
1984
1986
1988
1990
1992
1994
1996
1998
2000
2002
2004
2006
2008
real capital stock (100 million yuan)
growth rate of capital stock

17
Chow (1993) assumes that the depreciation rate is 4%, while Perkins (1988), Wang and Yao
(2003) assume the depreciation rate is 5%, Chow and Li (2002) first assume the depreciation rate
is 4% in 1978-1992, then use equation (3) to estimate the implied depreciation rates for 1993-
1998, giving an average implied depreciation rate of 5.4% which they then take 5.4% as the
depreciation rate for the period of 1978-1998. We assume an average depreciation rate of 5%
between 1978 and 2008. Figure 2 reports our estimate of real capital stock and its growth rate.
The accumulation of physical capital increases at high rates with three growth rate declines in
1988, 1998, 2008, reflecting a downturn of economic activity in China in these years. The long-
term trend growth rate for the capital stock growth rate is around 13% annually in recent years.
4.3 Labor
CSY provides employment data from 1952-2008. There was a revision after 1990
according to the 1990 population census data, and another revision according to 2000 population
census data in 2002. Holz (2006) explores this issue in detail and adjusts the labor data before
1990, so that the labor data is consistent before and after 1990. We use his adjusted employment
data as our labor data from 1978 to 1990, and use the employment data from CSY (2009) from
1990 onwards.

18
4.4. Human Capital
In our growth accounting analysis, our measure of human capital follows Barro and Lee’s
(1993; 2000) method to estimate average years of schooling as a proxy for human capital stock,
but we estimate the human capital stock using the Schultz (1960) motivated modification set out
earlier. Figure 3 reports average years of schooling (following Barro and Lee), rising from 3.18
years in 1978 to 6.33 years in 2008, an increase of 2.3% annually. However, our measure of the
human capital stock suggests a much more rapid increase. The human capital stock was 1095
billion yuan in 1978, and reached 9826 billion yuan in 2008, increasing by 7.6% annually. The
increase of human capital from tertiary education is even larger, from 27 billion yuan in 1978 to
1712 billion yuan in 2008, an increase of 14.8% annually. There is an increased rate of human
capital formation for tertiary education after 2002 which is consistent with China’s higher
education expansion after 1999 (see Li et al., 2008). Using average years of schooling as in
Figure 3. Human Capital Stock in China (Left Scale Billion Yuan, Right Scale Years)
0
1
2
3
4
5
6
7
0
2000
4000
6000
8000
10000
12000Tertiary
Special Secondary
Senior Secondary
Junior Secondary
Primary
total human capital (billion yuan in 1978 price)
years of schooling (right axis)
19
Barro and Lee significantly understates the changes in China’s human capital stock and
downplays its role in China’s growth.
To implement our growth accounting, we also need the share of physical capital in national
income, sK. Usually, in growth accounting literature, sK is assumed to be a specific number. For
example, Chow (1993) uses 0.6 as the share of capital over 1952-1980. Young (2003) and
Bosworth and Collins (2008) use 0.4 as the share of capital. Wang and Yao (2003) assume 0.5
for the share of capital over 1978-1999. Chow and Li (2002) estimate a Cobb-Douglas
production function using data over 1952-1998, and this yields a coefficient for capital between
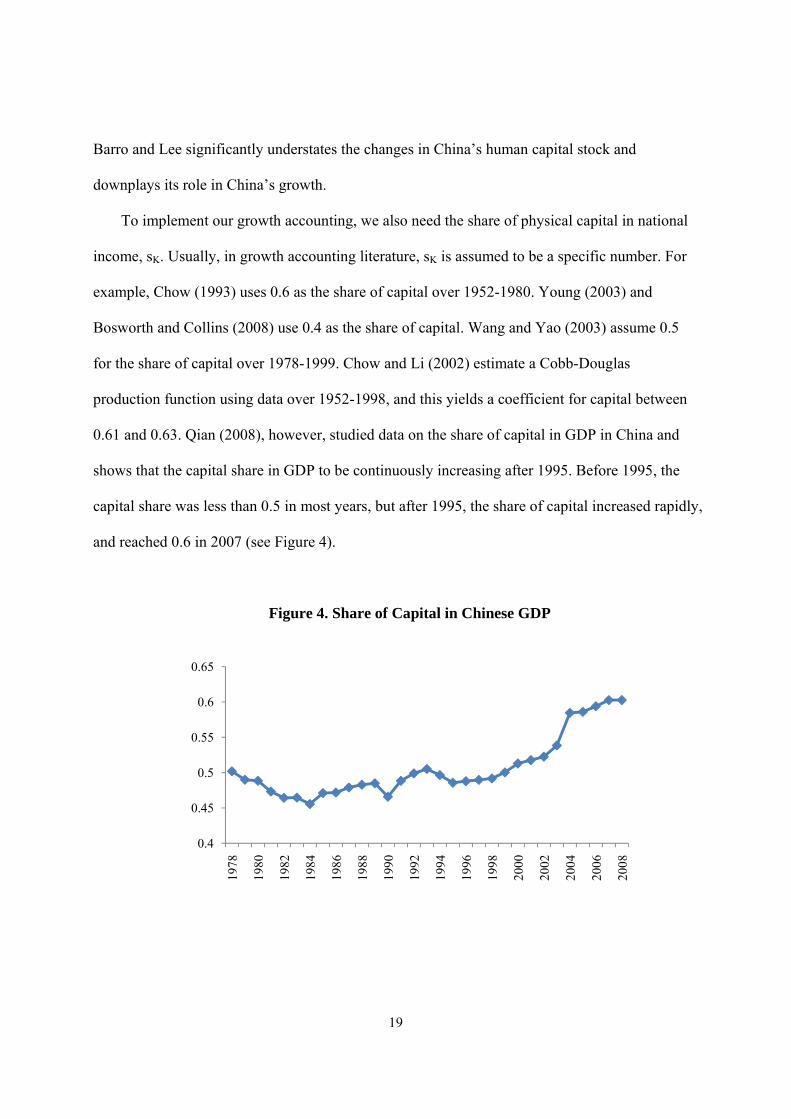
0.61 and 0.63. Qian (2008), however, studied data on the share of capital in GDP in China and
shows that the capital share in GDP to be continuously increasing after 1995. Before 1995, the
capital share was less than 0.5 in most years, but after 1995, the share of capital increased rapidly,
and reached 0.6 in 2007 (see Figure 4).
Figure 4. Share of Capital in Chinese GDP
0.4
0.45
0.5
0.55
0.6
0.65
1978
1980
1982
1984
1986
1988
1990
1992
1994
1996
1998
2000
2002
2004
2006
2008

20
Table 1 reports the average capital and labor share in GDP for different sub periods. The
average share of capital for the whole period 1978-2008 is 0.5064. Before 1999, the share of
capital is 0.4835, and after 1999, the average share of capital is 0.5623.
Table 1
Average share of capital and labor in GDP1
share of capital share of labor
1978-2008 0.5064 0.4936
1978-1999 0.4835 0.5165
1999-2008 0.5623 0.4377
1 The Chinese Statistical Yearbook does not provide aggregate labor share data, but divides regional GDP into
compensation of employees, net taxes on production, depreciation of fixed assets and operating surplus. We
aggregate this regional data to get Chinese GDP and the share of aggregate labor is calculated as the ratio of
compensation of employees to GDP.

21
5. New Growth Accounting Analysis of Human Capital’s Role in China’s Economic
Growth
This section reports our growth accounting analyses of China’s economic growth using
the modified human capital measures we set out above. We first evaluate the sources of growth
in the original sense of Solow (1957), which only considers the role of physical capital and labor.
Then we contrast results using Barro and Lee’s (1993; 2000) human capital measure in
evaluating the role of human capital in growth and then our modified human capital measures in
the sense of Schultz (1960).
5.1 Sources of Growth in the Sense of Solow (1957) and Excluding Human Capital
As in Solow (1957), we first decompose the sources of China’s economic growth into
growth of capital and labor and TFP. Table 2 reports the results. During the period 1978-2008,
the average GDP growth rate is 9.82%, the growth rate of capital is 8.72%, labor increases by
1.67% annually, and TFP growth is 4.57% annually. Thus, in this analysis capital contributes
nearly 45%, and labor only contributes 8.5% of growth, the rest, 46.5%, is contributed by TFP. If
TFP is interpreted as technological change, then China’s economic growth is mainly driven by
capital input growth and technological improvement. The growth rate of capital is 7.3% over
1978-1999, and 12.1% over 1999-2008, which results in a large in the increase of contribution of
physical capital to growth, from 36.4% to 67.6%.
The reasons for the large increase in capital’s role in growth are the combine effects of a
higher growth rate for capital and an increased share of capital in output in recent decades (see
Figure 4). Because the growth of labor and the share of labor in output were both decreasing, the
contribution of labor is less, only 4% in recent decades. TFP growth decreases from 5.1% to

22
2.8%, which is reflected in a sharp decrease of TFP contribution to growth from 52.9% to 28.4%.
Therefore, if TFP growth is interpreted as technological change, Solow based growth accounting
results indicate that the growth of technology advances slows in recent decades. This result is
consistent with literature which emphasizes the role of physical capital input and TFP. However,
this result underestimates the role of quality improvement in labor or human capital.
Table 2
Sources of China’s Economic Growth Using Simple Solow Growth Accounting
1978-2008 1978-1999 1999-2008
Growth rate (% per year)
Output 9.82% 9.72% 10.06%
Physical capital stock 8.72% 7.30% 12.10%
Labor 1.69% 2.03% 0.91%
TFP 4.57% 5.14% 2.86%
Contribution to GDP growth (%)
Physical capital stock 44.96% 36.35% 67.62%
Labor 8.50% 10.78% 3.97%
TFP 46.54% 52.87% 28.41%
5.2 Sources of Growth with Human Capital in the Sense of Barro and Lee (1993; 2000)
Next we take human capital into account in our growth accounting approach using Barro
and Lee’s approach. We use years of schooling as a proxy for human capital which is estimated

23
combining the approaches in Barro and Lee (1993; 2000) and Gemmell (1996). Table 3 indicates
that human capital contributes 11.7% to economic growth over the entire period 1978-2008, and
that it contributes 9.6% in the most recent decade and contributes 15% before 1999. This result
Table 3
Sources of Economic Growth in China Incorporating Human Capital Using Barro-Lee Approach
1978-
2008
1978-
1999
1999-
2008
Growth rate (% per year)
Output 9.82% 9.72% 10.06%
Physical capital stock 8.72% 7.30% 12.10%
Labor 1.69% 2.03% 0.91%
Human capital stock* 2.34% 2.81% 2.21%
TFP 3.45% 3.64% 2.45%
Contribution to GDP growth (%)
Physical capital stock 44.96% 36.35% 67.62%
Labor 8.50% 10.78% 3.97%
Human capital stock* 11.74% 14.95% 9.60%
TFP 34.80% 37.93% 18.81%
*average years of schooling as the proxy for human capital stock
reflects a declining and only small contribution to growth from human capital formation and
seems counterintuitive, since educational participation in China in recent decades is rising and

24
substantively higher in recent years. One reason for this result is that years of schooling treats the
productivity of different levels of education the same over time and as such undervalues the role
of human capital. The contribution to growth of TFP declines comparing with the simple Solow
case.
5.3 Sources of Growth with Human Capital in the Sense of Schultz (1960)
Average years of schooling is not a reliable proxy for human capital in implementing of
growth accounting for China since it takes the productivity for different levels of education as
the same through time, even though growth is occurring and wage rates are rising. Using years
of schooling alone as a proxy for human capital thus underestimates the role of human capital in
growth accounting and for China, and given her high growth rates the effect is large. Schultz’s
(1960) opportunity cost measure of education of inputs to human capital formation takes
productivity into account, and seemingly provides a more appealing proxy for human capital
formation.
Table 4 shows the results of growth accounting which uses a proxy for human capital in
the sense of Schultz (1960). Under this approach, human capital in China grew at 7.6% annually
over 1978-2008; slightly less than the growth rate of physical capital. The contribution of human
capital to growth is 38.1%, which is large although still smaller than the contribution of physical
capital, 44.96%. TFP growth is 1.66% annually, and contributes the remaining 16.9% of
economic growth. The growth of human capital increases from 6.96% during 1978-1999 to 9.1%
during 1999-2008. The contribution of human capital increases from 37% to 39.7% and TFP
growth rate decreases from 2.59% to -0.52%. It contributes 26.65% of growth over 1978-1999
and -7.03% over 1999-2008.

25
Table 4
Source of China’s Economic Growth, Including Human Capital in the Sense of Schultz
1978-2008 1978-1999 1999-2008
Growth rate (% per year)
Output 9.82% 9.72% 10.06%
Physical capital stock 8.72% 7.30% 12.10%
Human capital stock 7.59% 6.96% 9.06%
TFP 1.66% 2.59% -0.52%
Contribution to GDP growth (%)
Physical capital stock 44.96% 36.35% 67.62%
Human capital stock 38.12% 37.00% 39.41%
TFP 16.92% 26.65% -7.03%
We can also calculate the contributions of different inputs for the sub-period 2003-2008,
when new graduates enter the job market after graduation. For this sub-period, economic growth
is 10.95% annually, and the annual growth rates of human capital and physical capital are 10.7%
and 13.2%, separately. The growth rate of human capital increases rapidly, but still lags behind
the growth rate of physical capital. The contributions of human capital and physical capital are
40.6% and 70.2%, respectively. The contribution of human capital does increase, but only
moderately.

26
5.4 Summary and Further Interpretation
The last set of growth accounting results above indicate that human capital plays an
important role in China’s growth, and contributes 20%-40% to growth. Without improvement of
labor quality and accumulation of human capital, China’s economic growth rate would be lower.
There are several channels through which human capital contributes to economic growth. One is
as an input like physical capital since more human capital inputs increase output. In this sense, it
is effectively a quantitative increment to labor. Another channel may be human capital as an
improvement to productivity. New growth theory indicates that the accumulation of human
capital can increase the production of new ideas and innovation so that technology levels will
improve, and increase productivity. Under this view, human capital is more than an input, and it
should be thought as other input enhancing. The more human capital is accumulated, the more
the chance of technology improvement and innovation, the higher the productivity of production,
and more output results from the same inputs. In this sense, human capital is a source of
productivity improvement. The reason why the contribution of TFP becomes negative when we
include human capital in our growth accounting may be this.
Our growth accounting results also suggest that China’s economic growth still relies
heavily on capital input growth, although human capital play a more and more important role in
economic growth over time. Despite this, the contribution of human capital still lags physical
capital. The reasons why physical capital contributes so much to growth are a reflection in the
share of physical capital and growth rate of physical capital. Figure 4 shows that the share of
physical capital in GDP continues to increase, and exceeds 60% of GDP in recent years. The
recent share of labor in GDP is only 40%. There is a debate as to whether the share of labor in

27
Table 5
Growth Accounting Where the Share of Capital is 0.4 and the Share of
Human Capital is 0.6
1978-2008 1978-1999 1999-2008 2003-2008
Growth rate (% per year)
Output 9.82% 9.72% 10.06% 10.95%
Physical capital stock 8.72% 7.30% 12.10% 13.15%
Human capital stock 7.59% 6.96% 9.06% 10.71%
TFP 1.78% 2.62% -0.21% -0.73%
Contribution to GDP growth (%)
Physical capital stock 35.51% 30.07% 48.10% 48.03%
Human capital stock 46.34% 42.98% 54.03% 58.65%
TFP 18.15% 26.95% -2.13% -6.68%
GDP is underestimated in China. Gollin (2002) adjusts for self-employment and the sectoral
composition of output, and found that the labor shares for most developing countries are in the
range of 0.65-0.80.
If we adjust our growth accounting analysis for this effect, the contribution of physical
capital is smaller and contribution of human capital larger. We cannot easily separate all these
effects, but we can perform sensitivity analysis. Table 5 reports calculation that assumes the
share of capital in GDP is 40%. Under this treatment the contribution of physical capital in
growth decreases to 35.5% over 1978-2008, and the contribution of human capital increases to

28
46.3%, and the contributions of physical capital and human capital are 30.1% and 43%
respectively over the period 1978-1999. For the most recent decade, the contribution of physical
capital is 48.1%, and the contribution of human capital is 54%. For the period 2003-2008, after
the increased educational participation, the contribution of human capital is even higher, 58.7%,
which is a larger increase than earlier. Thus, under these assumptions, the contribution of human
capital is larger, and the contribution of physical capital is smaller and less than that of human
capital.

29
6. Conclusion
This paper reexamines the sources of China’s economic growth, emphasizing the role of
human capital. We first evaluate the sources of growth in the sense of Solow (1957), and find
under this analysis China’s economic growth is mainly driven by capital accumulation and TFP
growth, which is consistent with the results in other Chinese growth accounting literature. Since
Solow’s framework does not consider quality improvements of labor and human capital, we first
reevaluate the sources of growth taking human capital in the sense of Barro and Lee (1993; 2000)
into account. The contribution of human capital in the sense of Barro and Lee is minor, only 11.7%
between 1978 and 2008. Barro and Lee’s measure of human capital is average years of schooling
which does not distinguish productivity differences among different levels of education nor take
wage rate changes into account over time.
We then construct an alternative human capital measure in the sense of Schultz (1960)
taking productivity differences into account. Using this human capital measure, we find that
human capital plays a much more important role in China’s economic growth. The contribution
of human capital to growth is 38%, and even higher for the most recent decade. If we allow for
adjustment for self-employment and sectoral composition of outputs as Gollin (2002) suggests,
the contribution of human capital is higher. Under an assumption that the share of capital in
China in GDP is only 0.4 shows that the contribution of human capital to growth is 43% during
1978-1999, and accounts for 54% during 1999-2008. Human capital contributes 59% of growth
over 2003-2008 when graduates enrolled during China’s educational transformation enter job
markets. In addition, since human capital growth accelerated following the major educational
expansion after 1999 (college enrolment in China increase fivefold between 1997 and 2007),
while growth rates of GDP are little changed, total factor productivity decreases. TFP, by our

30
calculations, contributes 16.9 of growth between 1978 and 2008, but this contribution is -7%
between 1999 and 2008 taking human capital into account in the way we suggest.
These results suggest that economic growth in China may still be driven by growth in
both capital inputs (physical and human), but TFP growth may have been negative in recent
decades. Negative TFP growth along with a high contribution of physical and human capital to
economic growth seems to suggest that there has been a decrease in the efficiency of input usage
in China and misallocation of physical and human capital. This view is consistent with increased
education expansion and has been accompanied by increased urban young skilled worker
unemployment. These findings suggest that there are substantial returns to raising employment
of those with higher education and deploying human capital more efficiently.

31
References
Barro, Robert J., and Jong-Wha Lee, 1993, International comparisons of educational attainment,
Journal of Monetary Economics, 32, 363-394.
Barro, Robert J., and Jong-Wha Lee, 1996, International measures of schooling years and
schooling quality, American Economic Review, 86, 219-223.
Barro, Robert J., and Jong-Wha Lee, 2000, International data on education attainment: Updates
and implications, NBER Working Papers 7911.
Becker, G., 1964, Human Capital (Columbia University Press, New York).
Ben-Porath, Yoram, 1967, The production of human capital and the life cycle of earnings, The
Journal of Political Economy,75, 352-365.
Bosworth, Barry, and Susan M. Collins, 2008, Accounting for growth: Comparing China and
India, Journal of Economic Perspectives, 22, 45-66.
Chinese Statistical Bureau, 2009, Chinese Statistical Yearbook.
Chow, Gregory C., 1993, Capital formation and economic growth in China, The Quarterly
Journal of Economics, 108, 809-842.
Chow, Gregory C., and Kui-Wai Li, 2002, China's economic growth: 1952-2010, Economic
Development and Cultural Change, 51, 247-256.
Fan, C. Cindy, 2006, China’s Eleventh Five-Year Plan (2006-2010): From “Getting Rich First”
to “Common Prosperity”, Eurasian Geography and Economics, 47(6) 708-723.
Gemmell, Norman, 1996,. Evaluating the Impacts of Human Capital Stocks and Accumulation
on Economic Growth: Some New Evidence, Oxford Bulletin of Economics and Statistics,
58(1) 9-28.

32
Gollin, Douglas, 2002, Getting Income Shares Right, Journal of Political Economy, 110(2), 458-
474.
Holz, Carsten A., 2006, Measuring Chinese productivity growth, 1952-2005, Hong Kong
University of Science and Technology Working Paper.
Hsueh, T. and Q. Li (eds), 1999. China’s National Income, 1952–1995, Boulder, CO: Westview
Press.
Hu, X. F., and M. S. Khan, 1997, Why is China growing so fast? IMF Staff Papers 44, 103.
Jorgenson, Dale W., and Z. Criliches, 1967, The explanation of productivity change, The Review
of Economic Studies, 34(3), 249-283.
Krugman, P., 1994, The myth of Asia's miracle, Foreign Affairs, 73, 62-78.
Li, Shantong, Yongzhi Hou, Yunzhong Liu, and Jianwu He, 2005, China's economic growth
potential and prospect analysis, Management World 9 (in Chinese).
Li, Yao , John Whalley, Shunming Zhang, and Xiliang Zhao, The Higher Educational
Transformation of China and its Global Implications (March 2008). NBER Working
Paper No. W13849. Available at SSRN: http://ssrn.com/abstract=1106576
Lucas, Robert E., 1988, On the mechanics of economic development, Journal of Monetary
Economics, 22, 1988.
Maddison, A., 1998, Chinese economic performance in the long run (Organization for Economic
Co-operation and Development, Paris and Washington, DC).
Perkins, D. H., 1988, Reforming China's economic system, Journal of Economic Literature, 26,
601-645.
Qian, Zhenjie, 2008, Research on Chinese Factor Shares, PhD Dissertation submitted to
Tsinghua University (in Chinese).
33
Romer, Paul M., 1990, Endogenous technological change, The Journal of Political Economy, 98,
S71-S102.
Schultz, Theodore W., 1960, Capital Formation by Education, Journal of Political Economy,
University of Chicago Press, vol. 68, 571.
Solow, R.M., 1957, Technical changes and the aggregate production function, Review of
Economics and Statistics, vol. 39(3), 312-320.
Wang, Yan, and Yudong Yao, 2003, Sources of China's economic growth 1952-1999:
Incorporating human capital accumulation, China Economic Review, 14, 32-52.
World Bank, 1997, China 2020: Development challenges in the new century (The World Bank).
Xing, Yuqing, 2010, China’s High-Tech Exports: Myth and Reality, EAI Background Brief No.
506.
Young, A., 2003, Gold into base metals: Productivity growth in the People's Republic of China
during the reform period, Journal of Political Economy, 111, 1220-1261.