the condition of education in connecticut
TRANSCRIPT
The Condition of Education
in Connecticut
EDITOR’S NOTE: This publication provides summary statistics for the 2008-09
school year unless otherwise noted. Questions about these statistics should be
directed to Charles Martie at 860-713-6809.

Foreword
The Condition of Education in Connecticut is the Connecticut State Department of
Education’s yearly status report on public education in the state, fulfilling the requirements
under Section 10-4(b) of the Connecticut General Statutes. This edition focuses on the
achievements and challenges experienced by Connecticut’s public school students for the
2008-09 school year and highlights the major issues from that year.
The report contains the following categories of elements that describe the condition of
education in Connecticut:
• The education system;
• The students;
• The teachers;
• The curriculum;
• Resources and budgeting; and
• Student achievement.
Each year, The Condition of Education in Connecticut adopts a particular focus in order to
shed light on an issue that is particularly relevant. Last year’s report examined the
condition of education in light of economic need and socioeconomic status in the state.
This year’s report looks at the trend of declining public school enrollment, a critical issue
that is certain to affect education in our state in the years to come. The State Department
of Education, the Connecticut State Data Center and the National Center for Education
Statistics at the U.S. Department of Education have each forecasted that the recent trend of
declining enrollment will persist for several years. With this phenomenon comes
significant impacts on district and school resources.
Attention is also placed on the three priorities identified by the State Board of Education in
its Five-year Comprehensive Plan for 2006-2011. These priorities, detailed in A Superior
Education for Connecticut’s 21st Century Learners (January 2007), are:
• making high-quality preschool education available for all students;
• creating an environment where the high academic achievement of all students
in reading, writing, mathematics and science is the expectation; and
• achieving meaningful high school reform so all students graduate prepared to
participate in the evolving global economy.

As parents, citizens, business leaders, public officials and educators, we are
charged with the responsibility of ensuring that our students receive the best
education possible. Equipped with accurate information on the condition of
education in Connecticut, we can work together to provide all Connecticut
students the opportunity to achieve at the highest levels.
Mark K. McQuillan, Commissioner
Connecticut State Department of Education
EDITOR’S NOTE: The Condition of Education in Connecticut is one of many sources of
information that the Department of Education provides. Please visit our Web site
(http://www.sde.ct.gov), especially the Connecticut Education Data and Research (CEDaR)
site. The Department also publishes Connecticut’s Strategic School Profiles, Special
Education Annual Performance Reports and the state’s No Child Left Behind report cards.

Contents
The Education System 1
Connecticut Facts 2
Profiling Public Education in Connecticut 3
The Students 4
Public School Enrollment 5
Enrollment Trends and Projections 6
Public School Enrollment by Race/Ethnicity 7
Economic Need 8
Kindergarten Students with Prekindergarten Experience 9
Special Education 10
English Language Learners 11
Connecticut’s Adult Learners 12
The Teachers 13
Certified Staff Members 14
Demographics of Certified Staff Members 15
Highly Qualified Teachers 16
Teacher Shortages 17
Staffing Quality Indicators 18
Paraprofessional Instructional Staff 19
The Curriculum 20
Instructional Time by Subject for Elementary Students 21
High School Credits Required for Graduation 22
Connecticut Technical High School Career Clusters 23
High School Courses for College Credit 24
Time Students with Disabilities Spent with Nondisabled
Peers
25
Gifted and Talented 26
Adult Education Programs 27

Resources and Budgeting 28
Average Class Size 29
Family Literacy, Even Start and Family Resource Centers 30
Open Choice and Interdistrict Magnet School Funding 31
Charter Schools 32
Expenditure Data 33
Revenue Sources 34
Student Achievement 35
Connecticut Mastery Test (CMT) 36
Connecticut Academic Performance Test (CAPT) 42
Adequate Yearly Progress (AYP) 43
National Assessment of Educational Progress (NAEP) 44
SAT 49
Advanced Placement 52
School Discipline 54
Dropout Rates 55
Connecticut Physical Fitness Assessment 56
Activities of Connecticut Public High School Graduates 57
Contents (continued)

The Education
System
1
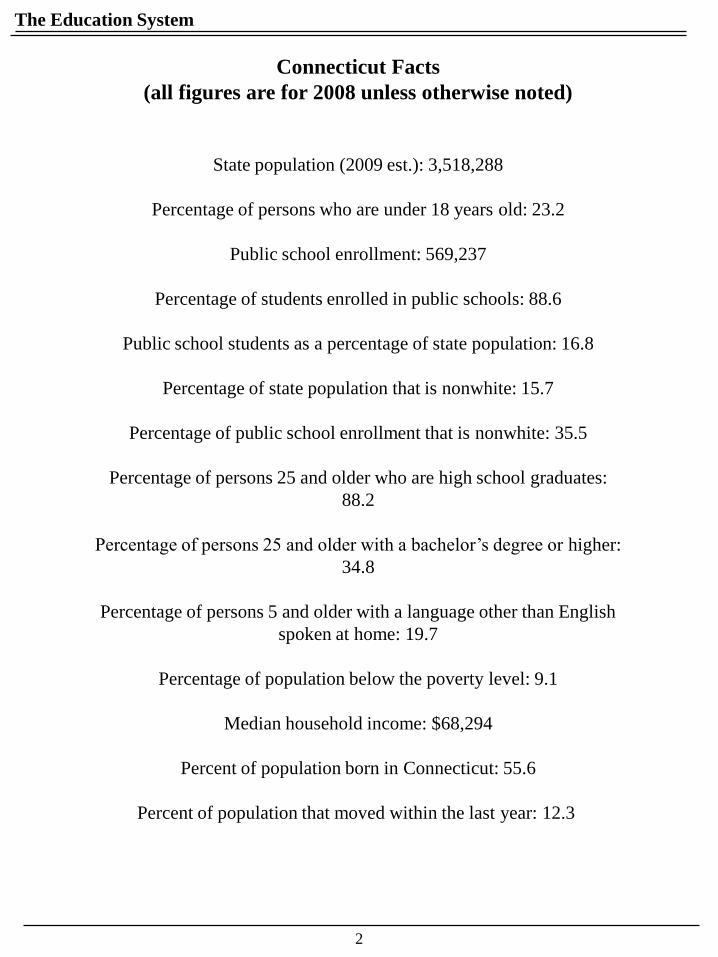
State population (2009 est.): 3,518,288
Percentage of persons who are under 18 years old: 23.2
Public school enrollment: 569,237
Percentage of students enrolled in public schools: 88.6
Public school students as a percentage of state population: 16.8
Percentage of state population that is nonwhite: 15.7
Percentage of public school enrollment that is nonwhite: 35.5
Percentage of persons 25 and older who are high school graduates:
88.2
Percentage of persons 25 and older with a bachelor’s degree or higher:
34.8
Percentage of persons 5 and older with a language other than English
spoken at home: 19.7
Percentage of population below the poverty level: 9.1
Median household income: $68,294
Percent of population born in Connecticut: 55.6
Percent of population that moved within the last year: 12.3
2
The Education System
Connecticut Facts
(all figures are for 2008 unless otherwise noted)

The Education System
3
CONNECTICUT’S SCHOOLS
Elementary schools 664
Middle/Junior high schools 173
High schools 172
Technical high schools 17
Nongraded, prekindergarten schools 47
Charter schools:
Elementary schools 7
Middle schools 5
High schools 4
Full-time magnet schools:
Elementary schools 25
Elem/Middle 1
Middle schools 6
Middle/High 7
High schools 21
Part-time magnet school programs:
High schools 4
Regional agricultural science and technology centers 19
Nonpublic schools 397
Adult education programs* 75
* Adult education programs include 44 local school districts, three regional educational service
centers and 15 cooperating eligible entities that serve all 169 towns in Connecticut per state
statute. Thirteen other organizations are funded solely through federal grant initiatives.
Profiling Public Education in Connecticut

The Students
4

The Students
In the past 20 years, public school enrollment in Connecticut increased by 24
percent, from 459,215 students in 1989 to 569,237 students in the fall of 2008. After
15 consecutive years of increases, enrollment has declined each year since 2004.
There are about as many students enrolled now as there were in 2001.
Public School Enrollment
5
400,000
425,000
450,000
475,000
500,000
525,000
550,000
575,000
600,000
Nu
mb
er o
f S
tud
ents
October of Year
Public School Enrollment, 1989 to 2008

6
Enrollment Trends and Projections
The Students
500
510
520
530
540
550
560
570
580
590
20
01
-02
20
02
-03
20
03
-04
20
04
-05
20
05
-06
20
06
-07
20
07
-08
20
08
-09
20
09
-10
20
10
-11
20
11
-12
20
12
-13
20
13
-14
20
14
-15
20
15
-16
20
16
-17
20
17
-18
20
18
-19
20
19
-20
Th
ou
san
ds
of
Stu
den
ts
Statewide Public School Enrollment
Actual and Forecast to 2020
Actual Forecast
Public school enrollment in Connecticut is projected to decline over the next several
years, bottoming out around 2019. This is largely due to a decline in the birth cohort and
a continuation of low birth rates and migration from the state.
-15%
-10%
-5%
0%
5%
10%
15%
0 - 4 5 - 9 10 - 14 15 - 19 5 to 19
Per
cen
t G
row
th
Age Group
Projected Population Growth by Age
Group: 2010 to 2020
US Bureau of the Census
Forecast
CT State Data Center
Forecast

7
Public School Enrollment by Race/Ethnicity
The Students
As the number of students decreased over the last five years, the percentage of
students who are racial and/or ethnic minorities has risen. Most of this growth
has been in the Hispanic population. In October 2008, 35.5 percent of students
represented racial or ethnic minorities, a 3 percentage point increase from
October 2004. Last year, the number of Hispanic students in Connecticut
public schools grew by 2.8 percent, while the number of black students
remained relatively steady, and the number of white students fell 1.3%.
American
Indian
0.4%
Asian
4.1%
Black
13.9%
Hispanic
17.1%
White
64.5%
Public School Enrollment
by Racial/Ethnic Group
-8,000
-6,000
-4,000
-2,000
0
2,000
4,000
2005 2006 2007 2008 2009 2010
Ch
an
ge
in E
nro
llm
ent
Year
Annual Change in Enrollment by
Race/Ethnicity: 2005-2010
American Indian Asian American Black White Hispanic

8
The Students
The decline in enrollment also carries with it a change in the income distribution of the
families of Connecticut students. The leaner enrollment total contains more low-income
students than ever before. The Connecticut State Department of Education uses
eligibility for free and reduced-price meals under the National School Lunch Program as
its poverty indicator. Federal nutrition program eligibility is based on household size and
income†.
In October 2008, 30 percent of all Connecticut students came from families poor enough
to qualify for free or reduced-price meals. During the last five years, Connecticut has seen
the percentage of students eligible for free and reduced-price meals increase by more than
4 percentage points. This increase translates to more than 18,000 newly eligible students.
Economic Need
† In 2008-09, a family of four needed to earn less than $27,560 for a child to receive free meals, and less than $39,220
to receive reduced-price meals.
26.4 26.7
27.1 28.5 30.0
0
10
20
30
40
2004-05 2005-06 2006-07 2007-08 2008-09
Perc
enta
ge
of
Stu
den
ts E
lig
ible
School Year
Percentage of Students Eligible
for Free and Reduced-price Meals

Kindergarten Students with Prekindergarten Experience
9
The State Board of Education is committed to ensuring that all the state’s preschool-
age children, including children with disabilities, are afforded an opportunity to
participate in a high-quality preschool education.† Such an experience fosters a
child’s overall development, including literacy and readiness for the
kindergarten, and is essential to a child’s future success.
After a long period of gradual increases, the percentage of kindergarteners with
prekindergarten experience has remained fairly stable at approximately 80 percent for
the last four years.
The Students
† From A Superior Education for Connecticut’s 21st Century Learners: Five-Year Comprehensive Plan for Education
2006-2011, January 2007.
65
70
75
80
85
1999 2000 2001 2002 2003 2004 2005 2006 2007 2008
Percen
tag
e
Fall of Year
Percentage of Kindergartners Who Attended
Preschool, Nursery School or Head Start

Special Education
In 2008-09, more than 64,000 Connecticut public school students, or 11.6 percent of
total enrollment, required special education services. The special education incidence
rate increased slightly in 2008-09.
10
The Students
The percentage of special education students who were eligible to receive free and reduced-
price meals was 36.9 percent, compared to 30.0 percent of the total school population.
11.9 11.8 11.2 11.5 11.6
0
5
10
15
2004-05 2005-06 2006-07 2007-08 2008-09
Per
cen
tage
of
Stu
den
ts
School Year
Special Education Incidence Rate
2004-05 to 2008-09
36.9
30.0
0
15
30
45
Special Education Students All Students
Per
cen
tag
e o
f S
tud
ents
Eli
gib
le
Student Group
Free and Reduced-price Meal Eligibility:
Special Education and All Students
October 2008

English Language Learners
Despite declining state enrollment over the past five years, the number of ELL students
has remained relatively stable. In 2008-09, one in 20 of Connecticut's public school
students was an English language learner. These 29,512 students spoke 161 different
languages, ranging from Spanish and Chinese to the Bikol language of the Philippines and
the Fon language of Western Africa. While most districts only had to accommodate a few
languages, more than 30 districts had student populations where more than 20 different
languages were spoken. *
11
The Students
0
5,000
10,000
15,000
20,000
25,000
30,000
35,000
2001-02 2002-03 2003-04 2004-05 2005-06 2006-07 2007-08 2008-09
English Language Learners: 2001-02 to 2008-09
Language
Number of Students
with Non-English
Home Language
Number of ELL
Students
Spanish 48,150 21,058
Portuguese 2,967 1,067
Polish 2,395 610
Chinese 2,152 673
Creole-Haitian 1,501 609
Albanian 1,234 489
Vietnamese 1,199 401
Urdu 1,066 354
Arabic 978 429
Russian 906 285
*School districts must provide all English language learners with services to assist them in becoming
proficient in the English language. Schools that have 20 or more students who speak the same language
other than English are required to offer a program of bilingual instruction to those students.
Ten Most Prevalent Languages in Connecticut Schools

The Students
12
Connecticut’s Adult Learners†
Connecticut’s adult education programs operate in their local communities to assist
adults in obtaining the knowledge and skills necessary for employment, self-sufficiency
and citizenship, becoming full partners in the educational development of their own
children, and completing their secondary school education.
Connecticut State statutes require that adult education services be provided by local
school districts free of charge to any adult, 16 years of age or older, who is no longer
enrolled in a public elementary or secondary school program. In 2008-09, Connecticut
adult education programs served 31,185 adult learners, a two percent increase from
2007-08.
† For more information on adult education, please see page 28.
32,635 33,292 32,87831,958
30,001 30,043 30,626 31,185
0
10,000
20,000
30,000
40,000
2001-02 2002-03 2003-04 2004-05 2005-06 2006-07 2007-08 2008-09
Nu
mb
er o
f S
tud
ents
Fiscal Year
Adult Education Enrollment

The Teachers
13

Since 2004-05, the total number of full-time equivalent† certified staff members working in
Connecticut’s public schools has increased steadily. During the past four years, the number of
certified staff members in Connecticut’s public schools has grown by more than 1,700
educators. Less than half of that increase was seen in the ranks of regular classroom teachers.
All other areas saw increases as well, with the group of ―other instructional specialists‖ seeing
the largest percentage increase.
Certified Staff Members
The Teachers
14
† Full-time equivalent (FTE) is derived by dividing the amount of time a person works by the time required of a
corresponding full-time position. A full-time position is considered to be 1.0 FTE. For example, a teacher who works two
of the five days per week would be a .4 FTE (2 days/5 days = .4 of full time or .4 FTE).
Total Full-Time Equivalent†
Certified Staff Count = 53,328
Administration
4.3%
Other instructional
specialists (e.g., media
specialists, reading/lan-
guage arts
consultants, librarians)
4.2%
Student support
specialists
(e.g., guidance
counselors, social
workers)
4.5%
Regular classroom
67.8%
Special programs
(e.g., remedial
mathematics and
reading, gifted and
talented, English as a
second language)
13.1%
Special education
6.2%
2008-09 Certified Staff Full-Time Equivalent Staffing by
Assignment Type

15
Demographics of Certified Staff Members
While Connecticut’s student population is somewhat diverse, with 35.5 percent of students
drawn from racial or ethnic minorities, Connecticut’s teaching force is quite
homogeneous. White females represent approximately one-third of the state’s student
population but more than two-thirds of the state’s teaching force. During the last
decade, the disparity between the student population and teaching force has grown.
During the 1998-99 school year, 67.1 percent of the teaching force were white females.
By 2008-09, that figure had grown by 1.9 percentage points to 69 percent.
The Teachers
0.1%0.1%
0.2%
0.6%
1.0%
2.7% 0.9%
2.4%
23.0%
69.1%
Connecticut's Certified Staff by Gender and Race/Ethnicity
Native American Male
Native American Female
Asian Male
Asian Female
Black Male
Black Female
Hispanic/Latino Male
Hispanic/Latina Female
White Male
White Female
Highly Qualified Teachers
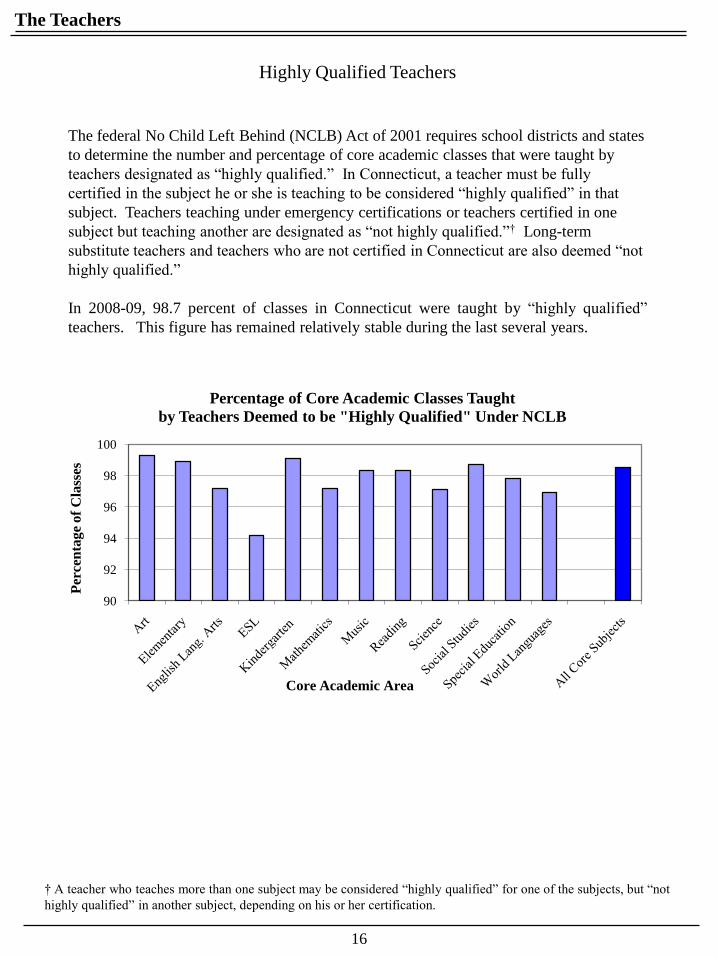
The federal No Child Left Behind (NCLB) Act of 2001 requires school districts and states
to determine the number and percentage of core academic classes that were taught by
teachers designated as ―highly qualified.‖ In Connecticut, a teacher must be fully
certified in the subject he or she is teaching to be considered ―highly qualified‖ in that
subject. Teachers teaching under emergency certifications or teachers certified in one
subject but teaching another are designated as ―not highly qualified.‖† Long-term
substitute teachers and teachers who are not certified in Connecticut are also deemed ―not
highly qualified.‖
In 2008-09, 98.7 percent of classes in Connecticut were taught by ―highly qualified‖
teachers. This figure has remained relatively stable during the last several years.
16
The Teachers
† A teacher who teaches more than one subject may be considered ―highly qualified‖ for one of the subjects, but ―not
highly qualified‖ in another subject, depending on his or her certification.
90
92
94
96
98
100
Per
cen
tag
e o
f C
lass
es
Core Academic Area
Percentage of Core Academic Classes Taught
by Teachers Deemed to be "Highly Qualified" Under NCLB

17
Teacher Shortages
Before the start of each school year, districts work to fill vacancies caused by
retirements, transfers and teachers leaving the profession, as well as new positions that are
created in response to increased enrollment and/or expansion of offerings. For the 2008–09
school year, Connecticut’s public school districts had 4,830 full- and part-time certified staff
positions to fill, the lowest number in the last five years. By October 1, 2008, all but 312 of
these positions had been filled. This means that school districts filled 93.5 percent of their
positions.
Nearly half of the positions left unfilled were in subject areas and/or positions in which
Connecticut has a history of staffing shortages. The chart below details these shortage areas
and the percentages of positions filled by persons with temporary certificates† or those left
unfilled.
The Teachers
† Temporary certificates include Durational Shortage Area Permits, which allow persons who have received a certain
level of college credit in a subject, but are not certified in Connecticut, to teach in that subject, and Temporary
Authorization for Minor Assignment, where, under certain circumstances, a certified teacher is allowed to temporarily
teach outside his or her area of certification to address a shortage.
0 10 20 30 40 50
World Languages, 7-12
Technology Education, PK-12
Speech /Language Pathologist
Science, 7-12
School Media Library Specialist
Mathematics, 7-12
Intermediate Administrator
English, 7-12
Comprehensive Special Ed
Bilingual, PK-12
Percentage of Total Positions Available
Sh
ort
ag
e A
rea
2008-09 Certified Staff Shortage Areas
Positions left unfilled as of October 2007 Positions filled by persons with temporary certificates
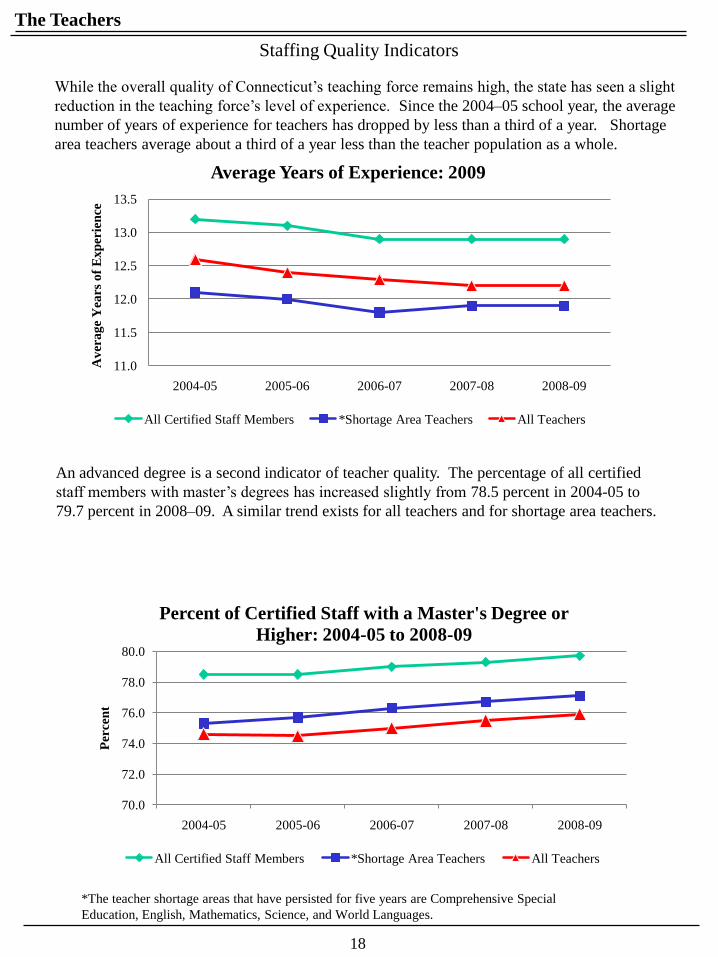
While the overall quality of Connecticut’s teaching force remains high, the state has seen a slight
reduction in the teaching force’s level of experience. Since the 2004–05 school year, the average
number of years of experience for teachers has dropped by less than a third of a year. Shortage
area teachers average about a third of a year less than the teacher population as a whole.
Staffing Quality Indicators
18
The Teachers
An advanced degree is a second indicator of teacher quality. The percentage of all certified
staff members with master’s degrees has increased slightly from 78.5 percent in 2004-05 to
79.7 percent in 2008–09. A similar trend exists for all teachers and for shortage area teachers.
*The teacher shortage areas that have persisted for five years are Comprehensive Special
Education, English, Mathematics, Science, and World Languages.
11.0
11.5
12.0
12.5
13.0
13.5
2004-05 2005-06 2006-07 2007-08 2008-09
Av
era
ge
Yea
rs o
f E
xp
erie
nce
Average Years of Experience: 2009
All Certified Staff Members *Shortage Area Teachers All Teachers
70.0
72.0
74.0
76.0
78.0
80.0
2004-05 2005-06 2006-07 2007-08 2008-09
Per
cen
t
Percent of Certified Staff with a Master's Degree or
Higher: 2004-05 to 2008-09
All Certified Staff Members *Shortage Area Teachers All Teachers

Paraprofessional Instructional Staff
19
Paraprofessional instructional staff members play vital roles in many students' educational
experiences. Paraprofessionals assist certified teachers, provide tutoring, act as reading
assistants, and perform a variety of other tasks that supplement and enhance the work of
certified teachers. A majority of the state’s paraprofessional instructional staff works with
special education students, assisting some of the state’s most academically-challenged
students.
In 2008-09, the 14,440 full-time equivalent (FTE)† paraprofessional instructional staff
members represented 36.1 percent of the total noncertified school staff members in the state.
The other 25,559 FTE noncertified staff members provided nursing, security, administrative
support, maintenance and other services.
† Full-time equivalent (FTE) is derived by dividing the amount of time a person works by the time required of a
corresponding full-time position. A full-time position is considered to be 1.0 FTE. For example, a teacher who works two
of the five days per week would be a .4 FTE (2 days/5 days=.4 of full time or .4 FTE).
The Teachers
Regular Program
26.1%
Special Education
62.0%
Special Programs
(e.g., English as a
second
language, bilingual)
2.3%
Other Instructional
Staff
(e.g., library/media
center support)
9.6%
2008-09 Paraprofessional Instructional Staff
The
Curriculum
20

The arts
6.2%
English
language
arts
50.4%
Mathematics
20.1%
Science
7.2%
Social studies
7.0%
Other subjects
9.4%
Physical
education
3.7%
Percentage of Hours of Instruction
Devoted to Specific Subjects: Grade 2
The arts
6.3%
English
language
arts
43.1%
Mathematics
20.1%
Science
9.8%
Social studies
9.3%
Other subjects
11.1%Physical education
4.1%
Percentage of Hours of Instruction
Devoted to Specific Subjects: Grade 5
The Curriculum
During the 2008-09 school year, Connecticut’s public elementary schools devoted, on
average, 496 hours (or roughly two hours and 45 minutes per day) to English language
arts instruction in Grade 2, a 2.8 percent drop in hours from 1998–99. English language
arts represents the largest portion of all Grade 2 instruction with 50.4 percent of Grade 2
time devoted to English language arts in 2008–09, compared to 52.4 percent in 1998–99.
Instructional Time by Subject for Elementary Students
21
In Grade 5, the average number of hours devoted to English language arts was 427 (or
approximately two hours and 20 minutes per day). The 427 hours devoted to English
language arts in 2008–09 represents an increase of 1.6 percent from the 1998–99 school
year.
Average Hours of
Instruction in Grade 2 = 984
Average Hours of
Instruction in Grade 5 = 988

22
Credits Required for Graduation by Subject
Subject
State
Requirement†
Number of High
Schools that Require
Credits Beyond the
State Minimum
English 4 4
Mathematics 3 10
Social studies 3 29
Science 2 132
Arts or vocational education 1 44
Physical education 1 81
Health 0 144
World languages 0 26
Other specific requirements 0 57
Community service 0 10
High School Credits Required for Graduation
Connecticut law requires that high school students successfully complete at least 20
credits† of course work and receive a minimum number of credits in specific subjects
to graduate. One hundred seventy-four, or 94.1 percent, of the 185 high schools that
graduated students†† in the spring of 2009 required their graduates to complete more
than the state minimum of 20 credits. Furthermore, most high schools had additional
subject-specific requirements that exceeded the state mandates. For example, 71.4
percent of the high schools required more than the state-required two credits in
science. The table below details the state subject requirements and the number of
high schools that require more than the state minimum number of credits in specific
subjects.
Many Connecticut high school graduates exceed the minimum credits set by State
statutes and local requirements. In fact, even though only 10 high schools required
more than the State-mandated three credits in mathematics, 65 percent of the class of
2009 graduated with four or more credits in the subject. While only 26 schools
required any course work in world languages, 60 percent of the graduates earned
three or more credits in a language.
† Section 10-221a of the Connecticut General Statutes stipulates that a course credit must consist of no less than the
equivalent of a 40-minute class period for each day of a school year. For a 180-day school year, this translates to 120
hours of instruction for a full credit and 60 hours for a half-credit.
† † A number of high schools did not graduate students in 2009 and, therefore, did not submit data on credits required for
graduation.
The Curriculum

23
Connecticut Technical High School Career Clusters
The Curriculum
31.0%
18.4%14.8%
13.2%
17.2%
1.8% 2.9% 0.4% 0.5%
Technical High School Enrollment by Career Cluster: 2003-04
Construction
Hospitality and Tourism
Manufacturing
Transportation and Distribution Services
Information Tech and Telecom Services
Health Services
Wholesale, Retail Sales and Services
Agriculture and Natural Resources
Human Services
30.3%
20.5%16.5%
14.1%
12.0%
3.3%2.3%
0.5%0.5%
Technical High School Enrollment by Career Cluster: 2008-09
Construction
Hospitality and Tourism
Manufacturing
Transportation and Distribution Services
Information Tech and Telecom Services
Health Services
Wholesale, Retail Sales and Services
Agriculture and Natural Resources
Human Services
Since the 2003–04 school year, enrollment in Connecticut Technical High School
career clusters, supported by the Carl D. Perkins grant, has risen from 9,423 students to
10,280. Connecticut has also seen a slight increase in the percentage of technical high
school students in Hospitality and Tourism, Manufacturing and Health Services.
Nearly one-third of students are enrolled in the Construction career cluster.

High School Courses for College Credit
Enrollment in
College
Credit
Courses
Percentage of High Schools
Granting Credit for:
Advanced
Placement
Courses
Other Courses
for College
Credit
The Arts 919 40.5 11.8
English 9,386 75.1 46.4
World languages 3,479 54.9 21.0
Mathematics 6,456 71.3 45.9
Science 9,966 72.4 44.8
History and social sciences 13,916 76.7 31.3
Other 9,333 51.3 68.6
High School Courses for College Credit
Courses that can yield college credit are among the most academically rigorous courses
offered at the high school level. While Advanced Placement (AP)† is the most prevalent
form of these courses, several other college credit programs exist (e.g., the UConn Early
College Experience Program and International Baccalaureate). Many of these courses offer
students an opportunity to earn both high school and college credit. Since 2001, high school
student enrollment in college credit courses has risen by 62 percent, from 33,027 in 2001–02
to 53,455 in 2008–09.
24
† For more information on the Advanced Placement program, please see page 52.
The Curriculum

Time Students with Disabilities Spent with Nondisabled Peers
For students with disabilities, time spent with nondisabled peers is an important indicator of
access to the general curriculum, as well as a demonstration of compliance with the federal
Individuals with Disabilities Education Act (IDEA) requirement that students with disabilities
be educated with their nondisabled peers to the maximum extent appropriate. To monitor this
requirement of IDEA, the federal Office of Special Education Programs has established three
levels of time special education students spend with nondisabled peers – 40 percent or less of
the students’ time, between 40 percent and up to and including 79 percent of their time, and
greater than 79 percent of their time.
During the last five years, Connecticut schools have increased the percentage of students with
disabilities who spend more than 79 percent of their time with nondisabled peers by 12.7
percentage points. During the same period, the percentage of students who spent 40 percent or
less of their time with nondisabled peers has decreased from 18.3 percent in 2004-05 to 11.2
percent in 2008-09.
25
†The category ―Greater than 40% and up to and including 79%‖ includes students in nonpublic placements.
The Curriculum
18.3 21.7
60.0
13.520.2
66.3
11.618.7
69.7
11.8 16.6
71.6
11.216.1
72.7
0
20
40
60
80
100
40% or Less Greater than 40% up to
and including 79%†
More than 79%
Per
cen
tag
e o
f S
tud
ents
wit
h D
isa
bilit
ies
Time Spent with Nondisabled Peers
Percentage of K-12 Students with Disabilities
by Time Spent with Nondisabled Peers
2004-05 2005-06 2006-07 2007-08 2008-09

26
† Connecticut General Statutes, Section 10-76a (5)
Gifted and Talented
In 2008-09, there were 22,701 students, roughly 4 percent of all Connecticut public
school students, identified as being gifted and talented. These students are defined as
having ―extraordinary learning ability or outstanding talent in the creative arts.‖†
While Connecticut state law requires that school districts evaluate and identify gifted
and talented students, districts are not required to provide them with additional
services. In 2008-09, however, 61.5 percent of gifted and talented students received
some type of additional services.
The Curriculum
0.0%
10.0%
20.0%
30.0%
40.0%
50.0%
60.0%
70.0%
2004-2005 2005-2006 2006-2007 2007-2008 2008-2009
School Year
Percent of Identified Gifted and Talented
Students Who Are Served:
2004-05 to 2008-09

27
Adult Education Programs
Learners participated in one of the following State-mandated adult education instructional
programs: citizenship preparation, English as a second language (ESL), adult basic literacy
education or one of three secondary school completion programs (i.e., General Educational
Development (GED®), Adult High School Credit Diploma or National External Diploma).
Fifty-four percent of learners participated in basic literacy or secondary school completion
programs, while 46 percent of learners participated in ESL or Citizenship programs.
In 2008-09, more than 5,400 individuals earned diplomas through adult education. For the
second consecutive year, more than 3,000 individuals earned a state high school diploma by
passing the GED Tests. The number of individuals who earned an adult education diploma
by completing the National External Diploma Program assessments was the highest ever in
2008-09. Earning a diploma through adult education enables individuals to pursue
postsecondary education/training opportunities and participate more fully in Connecticut’s
workforce.
The Curriculum
Citizenship
1.9%
English as a Second
Language
44.8%
Adult Basic
Education/General
Educational
Development (GED) Preparation
31.5%
Adult High School
Credit Diploma
Program
20.7%
External Diploma
Program
1.1%
Adult Education Enrollment by Program Type: 2008-09

Resources and
Budgeting
28

Resources and Budgeting
Average Class Size
29
Average class size provides a measure of the intensity with which teacher resources are
utilized. During the last five years, average class sizes have remained relatively stable.
The only significant increase in average class size occurred in the high schools, rising
from 18.6 students per class in 2007-08 to 19.3 in 2008-09.
†Grade 7 and high school class sizes are calculated by using enrollment and section data (i.e., number of individual
classes) from select courses taught at these levels.
15
16
17
18
19
20
21
22
2004-05 2005-06 2006-07 2007-08 2008-09
Av
era
ge
Nu
mb
er o
f
Stu
den
ts p
er C
lass
Average Class Size of Selected Grades
and High School 2004-05 to 2008-09
Kindergarten Grade 2 Grade 5 Grade 7† High school†

Family Literacy, Even Start and Connecticut’s Family Resource Centers are three
programs connecting families and schools in ways that expand the learning process
to include parents and the wider community. Family Literacy programs are designed
to promote the literacy of parents and children as a learning team. Even Start is a
comprehensive program that integrates early childhood education with education for
parents to create literate home environments. Family Resource Centers provide a
full continuum of early childhood and family support services that foster the optimal
development of the child and family. Programs offered by Family Resource Centers
include early childhood education, parenting classes, adult education, family literacy
programs and after-school programs.
In 2008-09, the Department of Education awarded 17 Family Literacy grants, an
increase of six additional programs from the preceding year, resulting in a substantial
increase in the number of families served. The Even Start program had one fewer
center in 2008-09 but served nearly the same number of families as in the prior year.
The number of individuals served by Family Resource Centers declined 3.3 percent
from the prior year.
Family Literacy, Even Start and Family Resource Centers
30
Family Literacy Even Start
Family Resource
Centers
Number
of
Centers
Estimated
Number of
Families
Served
Number
of
Centers
Number
of
Families
Served
Number of
Centers
Number of
Individuals
Served †
2003-04 12 300 9 217 61 N/A
2004-05 12 300 9 197 62 N/A
2005-06 12 300 8 189 62 N/A
2006-07 11 275 6 149 62 17,451
2007-08 11 275 6 137 62 20,262
2008-09 17 697 5 131 62 19,586
Resources and Budgeting
† Before 2006-07, the state collected data on the number of families served, not the number of individuals.

The Open Choice program provides urban students with an opportunity to attend public
schools in nearby suburban school districts on a space-available basis in the
Bridgeport, Hartford, New Haven and New London regions. This program works to: improve
academic achievement; reduce racial, ethnic and economic isolation; and provide a choice of
educational programs to students in the program regions. Participation in Open Choice has
risen from 1,562 in 2004-05 to 1,793 in 2008-09, or 14.8 percent. During the same
period, state funding for the Open Choice program increased from $9.4 million to $14.6
million, or by 55 percent.
Open Choice and Interdistrict Magnet School Funding
31
Resources and Budgeting
Interdistrict magnet schools are another mechanism the Department uses to improve the
diversity in Connecticut’s schools. Interdistrict magnet schools receive state support for
building construction and operations. Since 2004-05, student participation in magnet schools
has risen from 13,783 students to 20,599 in 2008-09. State spending on magnet schools
increased by more than 88 percent in that period, from $66.9 million in 2004-05 to $125.9
million in 2008-09.
$0
$2,500,000
$5,000,000
$7,500,000
$10,000,000
$12,500,000
$15,000,000
$17,500,000
2004-05 2005-06 2006-07 2007-08 2008-09
Sta
te F
un
din
g
School Year
State Funding for the Open Choice Program
$0
$20,000,000
$40,000,000
$60,000,000
$80,000,000
$100,000,000
$120,000,000
$140,000,000
2004-05 2005-06 2006-07 2007-08 2008-09
Sta
te F
un
din
g
School Year
State Funding for Interdistrict Magnet Schools

32
Charter Schools
Charter schools are yet another vehicle that Connecticut uses to meet the diverse needs of its
students. Charter schools operate outside the traditional school district structure. These schools
are funded by the state and are given operational latitude to create innovative opportunities to
improve student learning. Since 2000-01, the state has increased funding for charter schools
threefold.
Connecticut added two charter schools in 2008-09 and total charter school enrollment
continued to rise – increasing by more than 11 percent. During the last 10 years, enrollment in
Connecticut’s charter schools has increased 136 percent.
Resources and Budgeting
1,895 2,000 2,0952,224 2,265
2,693 2,921
3,583
4,020
4,479
0
1,000
2,000
3,000
4,000
5,000
1999-
00
2000-
01
2001-
02
2002-
03
2003-
04
2004-
05
2005-
06
2006-
07
2007-
08
2008-
09
Oct
ob
er 1
En
roll
men
t
School Year
Charter School Enrollment: 1999-00 to 2008-09
$14.00 $14.67 $15.57 $16.42
$19.82
$22.47
$29.83
$35.27
$41.65
$0
$5
$10
$15
$20
$25
$30
$35
$40
$45
2000-
01
2001-
02
2002-
03
2003-
04
2004-
05
2005-
06
2006-
07
2007-
08
2008-
09
Mil
lion
s of
Doll
ars
Fiscal Year
Connecticut Charter School Funding

The State of Connecticut spends billions of dollars each year to educate the state’s students.
These funds pay for everything from teachers’ salaries and benefits to computers and
textbooks, and from school buses to heat and electricity for school buildings. In 2008-
09, the state’s overall school expenditures (excluding investments in land, buildings and
debt) totaled $7.614 billion, an increase of 4.75 percent from 2007-08. Instructional staff
and services represented a majority of the total expenditures: approximately 56 cents out of
every education dollar was devoted to this area.
2008-09 Expenditure Data†
† These data are preliminary and are subject to change. Please note that the percentages do not total 100 percent due to
rounding.
†† A portion of the cost of students tuitioned out was sent to other Connecticut public school districts and, therefore, is
also included under the various expenditure categories.
33
Resources and Budgeting
Instructional staff and
services
55.8%
Instructional supplies
and equipment
2.0%
Improvement of
instructional and
educational media
services
3.3%
Student support services
6.1%
Administration and
support services
10.3%
Plant operation and
maintenance
10.4%
Transportation
5.4%
Cost of students
tuitioned out††
5.5%Other
1.2%
2008-09 Expenditures†
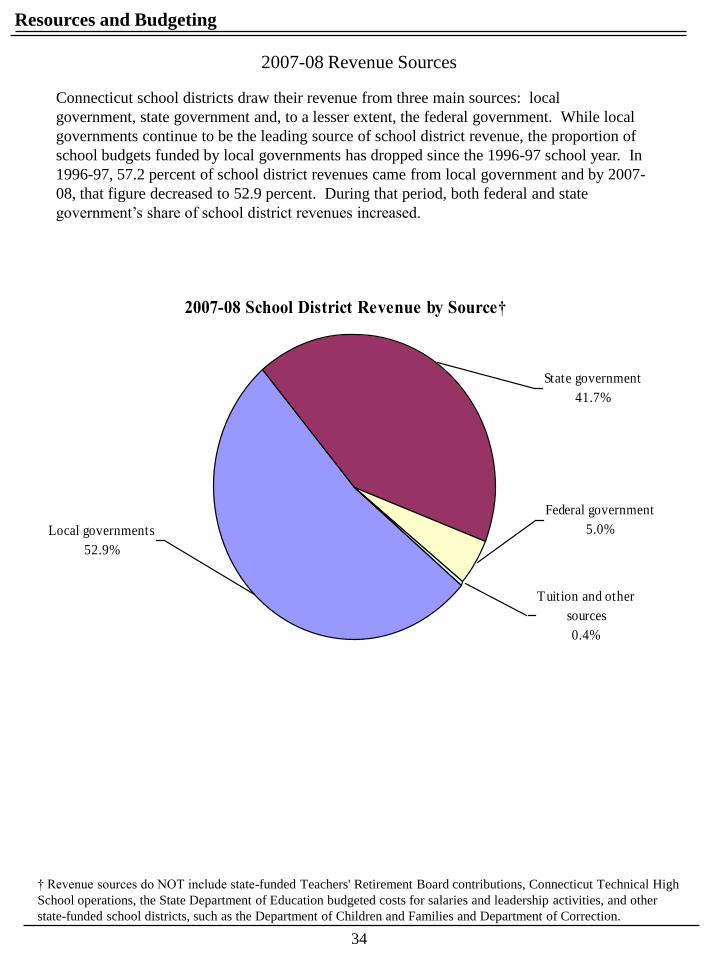
Connecticut school districts draw their revenue from three main sources: local
government, state government and, to a lesser extent, the federal government. While local
governments continue to be the leading source of school district revenue, the proportion of
school budgets funded by local governments has dropped since the 1996-97 school year. In
1996-97, 57.2 percent of school district revenues came from local government and by 2007-
08, that figure decreased to 52.9 percent. During that period, both federal and state
government’s share of school district revenues increased.
2007-08 Revenue Sources
† Revenue sources do NOT include state-funded Teachers' Retirement Board contributions, Connecticut Technical High
School operations, the State Department of Education budgeted costs for salaries and leadership activities, and other
state-funded school districts, such as the Department of Children and Families and Department of Correction.
34
Resources and Budgeting
2007-08 School District Revenue by Source†
Federal government
5.0%
Tuition and other
sources
0.4%
Local governments
52.9%
State government
41.7%

Student
Achievement
35

Student Achievement
36
2009 Connecticut Mastery Test (CMT)
Grade 3
The Connecticut Mastery Test (CMT) was developed in the 1980s to provide an accurate
assessment of how well the state’s students are meeting the standards of achievement that
the State Board of Education established in reading, writing and mathematics. Beginning
in 1985, students in Grades 4, 6 and 8 are tested in the fall in all three areas on an annual
basis. In 2006, Connecticut moved to a new generation of the CMT and added
assessments in Grades 3, 5 and 7. In 2008, Connecticut began testing Grades 5 and 8 in
science to meet the requirements of the federal No Child Left Behind Act (NCLB) of
2001. CMT test scores are reported at five achievement levels: Below
Basic, Basic, Proficient, Goal and Advanced. 62.6 percent of Grade 3 students scored at
or above Goal in writing in 2009, 54.6 percent in reading and 63 percent in math.
Recent enrollment trends by race (see page 7) are expected to continue over the next
several years, resulting in a more diverse mix of students. Spring 2009 CMT results for
Grade 3 indicate that, on average, white and Asian students significantly outperformed
students from other races/ethnicities on all three assessments: writing, reading and
mathematics. While the gap between minority students and their non-minority peers was
sizable on all three assessments, it was largest in mathematics.
0
10
20
30
40
50
60
70
80
90
Writing Reading Math
CMT Grade 3: Percent At or Above Goal by Race/Ethnicity: 2009
Black
Hispanic/Latino
American Indian
White
Asian
Percent At or Above Goal Writing Reading Math
All Grade 3 Students 62.6 54.6 63

Results from the spring 2009 CMT indicate that, statewide, Grade 4 students performed
the highest on the writing assessment and the lowest on the reading assessment.
Spring 2009 CMT results for Grade 4 indicate that, on average, white and Asian students
significantly outperformed students from other races/ethnicities on all three assessments:
reading, writing and mathematics. While the gap between minority students and their non-
minority peers was sizable on all three assessments, it was largest in mathematics.
37
2009 Connecticut Mastery Test (CMT)
Grade 4
Student Achievement
Percent At or Above Goal Writing Reading Math
All Grade 4 Students 64.2 60.7 63.8
0
10
20
30
40
50
60
70
80
90
Writing Reading Math
CMT Grade 4: Percent At or Above Goal by Race/Ethnicity: 2009
Hispanic/Latino
Black, not of Hispanic origin
American Indian
White, not of Hispanic origin
Asian

38
2009 Connecticut Mastery Test (CMT)
Grade 5
In spring 2008, schools assessed students in Grade 5 in science for the first time, and more
than 55 percent of students scored at or above Goal. In 2009, more than 58 percent of
Connecticut’s Grade 5 students scored at or above Goal in science. Overall, students in
Grade 5 fared best in math and worst in science.
Spring 2009 CMT results for Grade 5 indicate that, on average, white and Asian students
significantly outperformed students from other races/ethnicities on all four assessments:
reading, writing, mathematics and science. While the gap between minority students and
their non-minority peers was sizable on all four assessments, it was largest in science.
Student Achievement
Percent At or Above Goal Writing Reading Math Science
All Grade 5 Students 66.6 66 69 58.3
0
10
20
30
40
50
60
70
80
90
Writing Reading Math Science
CMT Grade 5: Percent At or Above Goal by Race/Ethnicity: 2009
Hispanic/Latino
Black, not of Hispanic origin
American Indian
White, not of Hispanic origin
Asian
39
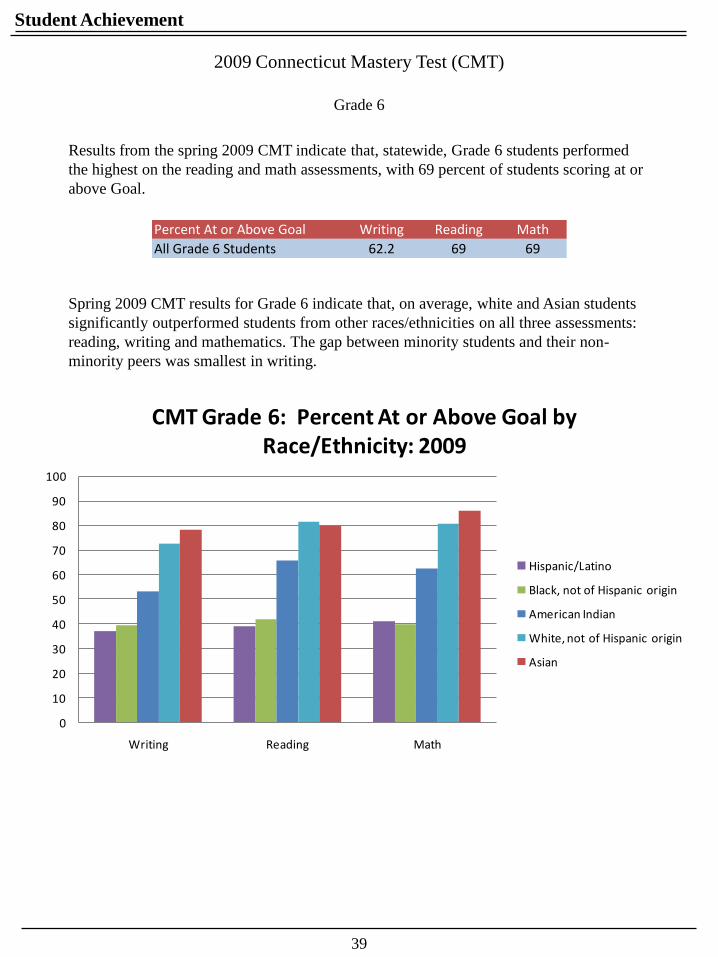
2009 Connecticut Mastery Test (CMT)
Grade 6
Results from the spring 2009 CMT indicate that, statewide, Grade 6 students performed
the highest on the reading and math assessments, with 69 percent of students scoring at or
above Goal.
Spring 2009 CMT results for Grade 6 indicate that, on average, white and Asian students
significantly outperformed students from other races/ethnicities on all three assessments:
reading, writing and mathematics. The gap between minority students and their non-
minority peers was smallest in writing.
Student Achievement
Percent At or Above Goal Writing Reading Math
All Grade 6 Students 62.2 69 69
0
10
20
30
40
50
60
70
80
90
100
Writing Reading Math
CMT Grade 6: Percent At or Above Goal by Race/Ethnicity: 2009
Hispanic/Latino
Black, not of Hispanic origin
American Indian
White, not of Hispanic origin
Asian

40
2009 Connecticut Mastery Test (CMT)
Grade 7
Results from the spring 2009 CMT indicate that, statewide, Grade 7 students performed
the highest on the reading assessment, with nearly 75 percent of students scoring at or
above Goal.
Spring 2009 CMT results for Grade 7 indicate that, on average, white and Asian students
significantly outperformed students from other races/ethnicities on all three assessments:
reading, writing and mathematics. While the gap between minority students and their non-
minority peers was sizable on all three assessments, it was largest in mathematics.
Student Achievement
Percent At or Above Goal Writing Reading Math
All Grade 7 Students 62.9 74.9 66.3
0
10
20
30
40
50
60
70
80
90
Writing Reading Math
CMT Grade 7: Percent At or Above Goal by Race/Ethnicity: 2009
Hispanic/Latino
Black, not of Hispanic origin
American Indian
White, not of Hispanic origin
Asian

41
As mentioned earlier, Connecticut schools assessed Grade 8 students in science for the first
time in the spring of 2008. In this initial assessment, more than 58 percent of the state’s
students scored at or above Goal. In 2009, nearly 61 percent scored at or above Goal in
science. Statewide, Grade 8 students performed the highest on the reading assessment with
nearly 69 percent of students scoring at or above Goal.
Spring 2009 CMT results for Grade 8 indicate that, on average, white and Asian students
significantly outperformed students from other races/ethnicities on all four assessments.
While the gap between minority students and their non-minority peers was sizable on all
four assessments, it was largest in science.
2009 Connecticut Mastery Test (CMT)
Grade 8
Student Achievement
Percent At or Above Goal Writing Reading Math Science
All Grade 8 Students 66.5 68.5 64.7 60.9
0
10
20
30
40
50
60
70
80
90
Writing Reading Math Science
CMT Grade 8: Percent At or Above Goal by Race/Ethnicity: 2009
Hispanic/Latino
Black, not of Hispanic origin
American Indian
White, not of Hispanic origin
Asian

2009 Connecticut Academic Performance Test (CAPT)
Grade 10 students take the Connecticut Academic Performance Test (CAPT) in the spring of each
year. This test assesses student performance in mathematics, science, reading and writing. The
CAPT is aligned with Connecticut’s curriculum frameworks and provides information on how
well students are performing with respect to the critical skills required in the four content areas.
As in the CMT, CAPT scores are reported at five achievement levels: Below
Basic, Basic, Proficient, Goal and Advanced. While Connecticut uses the Proficient level for
NCLB purposes, the state continues to use the higher standard of Goal or above as its benchmark
for achievement.
In 2009, Grade 10 students scored the highest on the writing assessment with 55 percent of
students scoring at or above Goal. This strength in writing was witnessed in all racial/ethnic
categories. The weakest subject overall was science with only 42.9 percent of Grade 10 students
reaching the Goal level.
As in the CMT, Black, Hispanic and Native American students lagged behind their peers on all
four assessments of the CAPT. While still significant, the achievement gap on the reading
assessment was the smallest among the four CAPT assessments.
42
Student Achievement
Percent At or Above Goal Writing Reading Math Science
All Grade 10 Students 55 47.5 47.9 42.9
0
10
20
30
40
50
60
70
80
Writing Reading Math Science
CAPT: Percent At or Above Goal by Race/Ethnicity: 2009
Black, not of Hispanic origin
Hispanic/Latino
American Indian
White, not of Hispanic origin
Asian

Student Achievement
43
Adequate Yearly Progress (AYP)
Under the federal No Child Left Behind (NCLB) Act of 2001, states are required to hold
schools, districts and themselves to yearly standards of achievement on standardized tests in
reading and mathematics. These standards are used to determine if schools, districts and states
are making Adequate Yearly Progress (AYP) as a whole, and for specific subgroups of
students (including racial/ethnic groups, special education students and English language
learners). Schools, districts and states failing to meet the AYP levels of achievement for two
consecutive years in the same subject are considered to be in need of improvement and must
take specific steps to improve performance of their students. Connecticut uses the CMT and
the CAPT for determining AYP.
During the 2008-09 school year, 40 percent of Connecticut’s schools failed to make AYP.
While still high, the number of schools failing to make AYP remained the same compared to
2007-08. The number of districts failing to make AYP, however, was 55, an increase of 11
districts from last year. The state, as a whole, continued to fail to make AYP because specific
subgroups of students did not meet the achievement standards in both reading and
mathematics.
2008-09 Number of Schools and Districts
Failing to Make Adequate Yearly Progress (AYP)
Elementary/Middle
Schools
High
Schools
District
Level
Whole school/district mathematics and
reading achievement 161 37 24
Whole school/district mathematics
academic achievement only 7 16 3
Whole school/district reading
academic achievement only 66 3 6
Subgroup only mathematics and
reading academic achievement 82 11 16
Subgroup only mathematics academic
achievement 1 2 1
Subgroup only reading academic
achievement 17 3 5

The National Assessment of Educational Progress (NAEP) is often called the ―Nation’s Report
Card.‖ It is a congressionally-mandated assessment in various subject areas administered by
the National Center for Education Statistics, a branch of the U.S. Department of Education. It
is the only nationally-representative, continuing assessment of what America’s students know
and can do in various subject areas.
On the spring 2009 assessment of reading, 42 percent of Connecticut’s Grade 4 students scored
at or above the Proficient level. This compares favorably to the nation’s score of 32 percent at
or above Proficient.
Connecticut outperformed 43 states and its performance was statistically equal to that of five
other states. Only Massachusetts performed significantly higher than Connecticut.
2009 National Assessment of Educational Progress (NAEP)
Grade 4 Reading
Percentage At or Above Proficient
All Students
44
Student Achievement
† DoDEA: The Department of Defense Education Activity, a civilian agency of the US which
oversees schools in military bases.
†

On the spring 2009 assessment of mathematics, 46 percent of Connecticut Grade 4 students
scored at or above the Proficient level. This figure is greater than the nation’s score of 38
percent at or above Proficient.
Connecticut outperformed 30 states and its performance was statistically equal to 15 other
states. Only Massachusetts, Vermont, New Hampshire and Minnesota performed significantly
higher than Connecticut.
2009 National Assessment of Educational Progress (NAEP)
Grade 4 Math
Percentage At or Above Proficient
All Students
45
Student Achievement

46
On the spring 2009 Grade 8 NAEP reading assessment, 43 percent of Connecticut’s students
reached the Proficient level or above, higher than the national figure of 30 percent.
On a state-by-state level, Connecticut outperformed 43 states. No states scored higher than
Connecticut. Connecticut’s performance was not significantly different from the remaining six
states.
2009 National Assessment of Educational Progress (NAEP)
Grade 8 Reading
Percentage At or Above Proficient
All Students
Student Achievement

47
On the spring 2009 assessment of mathematics, 40 percent of Connecticut Grade 8 students scored
at or above the Proficient level. This figure is greater than the nation’s score of 33 percent at or
above Proficient.
Connecticut outperformed 29 states and its performance was statistically equal to 16 other states.
Only Massachusetts, Vermont, New Jersey and Minnesota performed significantly higher than
Connecticut.
2009 National Assessment of Educational Progress (NAEP)
Grade 8 Math
Percentage At or Above Proficient
All Students
Student Achievement

2007 National Assessment of Educational Progress (NAEP)
Grade 8 Writing
Percentage At or Above Proficient
All Students
48
Student Achievement
The 2009 NAEP writing assessment data has not yet been published. On the spring 2007 Grade 8
NAEP writing assessment, 53 percent of Connecticut’s students reached the Proficient level or
above. This figure compared favorably to the national figure of 31 percent.
Connecticut outperformed 43 other states. Only New Jersey performed at a level that was
comparable to Connecticut’s level. The remaining five states either did not participate in the
assessment or did not meet the minimum level of participation.

The SAT is one of the nation’s most commonly used college-readiness assessments. Beginning
with the 2006 administration of the SAT, the test was divided into three sections, with the
addition of a writing assessment to the existing mathematics and critical reading (formerly
verbal) assessments. All three assessments are graded on a scale of 200 to 800 points.
For the Connecticut high school students in the class of 2009, the average score in math
increased by one point from the prior year to 508, remaining two points below the national
public school average score of 510.
Black, white, American Indian and Asian students all showed increases in their average
mathematics scores. The average SAT math scores were highest for Asian graduates at
571, followed by 532 for white, 435 for Hispanic and 400 for black graduates. Black students’
average scores rose by four points from 2008. Hispanic students showed a slight decline in
2009.
SAT Reasoning Test- Mathematics †
49
Student Achievement
49
1 56
1
40
8
44
5 52
9
48
0 56
7
40
4
44
1 53
0
48
0 56
0
40
5
43
4 52
6
47
7 56
2
39
7
43
7 53
1
49
0 57
1
40
0
435 53
20
100
200
300
400
500
600
American Indian Asian American Black Hispanic White
Aver
age
Sco
re
Race/Ethnicity
SAT :
Average Math Score by Race/Ethnicity:
Classes of 2005 to 2009
2005 2006 2007 2008 2009
† The source for these data is the College Board.

Overall, Connecticut’s average on the Critical Reading section remained at 503 and exceeds the
national public school average (496) by seven points. The national average declined by a point
this year.
The 2009 average scores for white and Asian graduates in reading were 526 and
525, respectively, with a 12 point increase for Asian graduates from 2008. The average reading
score of 438 for Hispanic graduates was down four points from 2008. The average reading score
of 409 for black graduates remained the same. The average reading score for American Indian
students rose 10 points from last year.
SAT Reasoning Test - Reading †
50
† The source for these data is the College Board.
Student Achievement
48
3
51
3
41
7
44
7 52
8
47
1
52
2
41
8
44
5 52
3
47
8
51
6
41
6
43
9 52
2
47
8
51
3
40
9
44
2 52
4
48
8
52
5
40
9
43
8 52
6
0
100
200
300
400
500
600
American Indian Asian American Black Hispanic White
Av
era
ge
Sco
re
Race/Ethnicity
SAT:
Average Reading Score by Race/Ethnicity:
Classes of 2005 to 2009
2005 2006 2007 2008 2009

This was the fourth year that the SAT included a writing component, and Connecticut’s 2009
public school students remained at an average of 506—which is 19 points above the national
average (487) for public school students. † †
In 2009, black, white, American Indian and Asian students all showed increases in their average
writing scores. The average writing scores in 2009 were 535 for Asian, 529 for white, 440 for
Hispanic and 412 for black graduates.
SAT Reasoning Test- Writing †
51
† The source for these data is the College Board.
† † The SAT writing assessment did not exist before 2006.
Student Achievement
46
8
52
5
41
6
44
2 52
2
47
4
52
2
41
6
43
9 52
4
48
3
52
4
41
0
44
2 52
8
48
7
53
5
41
2
44
0 52
9
0
100
200
300
400
500
600
American Indian Asian American Black Hispanic White
Av
era
ge
Sco
re
Race/Ethnicity
SAT:
Average Writing Score by Race/Ethnicity:
Classes of 2005 to 2009
2006 2007 2008 2009
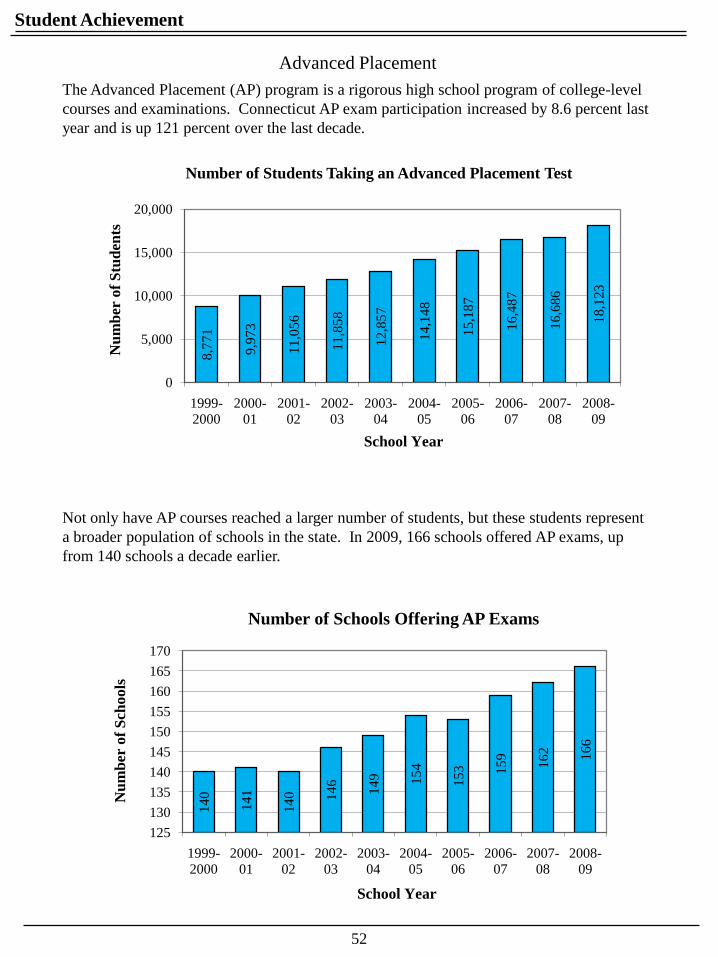
Advanced Placement
52
Not only have AP courses reached a larger number of students, but these students represent
a broader population of schools in the state. In 2009, 166 schools offered AP exams, up
from 140 schools a decade earlier.
The Advanced Placement (AP) program is a rigorous high school program of college-level
courses and examinations. Connecticut AP exam participation increased by 8.6 percent last
year and is up 121 percent over the last decade.
Student Achievement
8,7
71
9,9
73
11
,05
6
11,8
58
12,8
57
14,1
48
15,1
87
16,4
87
16,6
86
18,1
23
0
5,000
10,000
15,000
20,000
1999-
2000
2000-
01
2001-
02
2002-
03
2003-
04
2004-
05
2005-
06
2006-
07
2007-
08
2008-
09
Nu
mb
er o
f S
tud
en
ts
School Year
Number of Students Taking an Advanced Placement Test
140
141
140 146
149 154
153 159
162 166
125
130
135
140
145
150
155
160
165
170
1999-
2000
2000-
01
2001-
02
2002-
03
2003-
04
2004-
05
2005-
06
2006-
07
2007-
08
2008-
09
Nu
mb
er o
f S
ch
ools
School Year
Number of Schools Offering AP Exams

53
Student Achievement
Advanced Placement Examinations
The American Council on Education has established a minimum score of 3 (on a scale of 1
through 5) on an AP exam for students to be awarded college credit. Even with the
increased number of schools and students participating in the AP program, the percentage of
students scoring 3 or more has remained relatively stable in most subject areas during the last
five years. Historically, Connecticut's public school students have performed best on the AP
English exams.
0
10
20
30
40
50
60
70
80
90
100
The Arts English World languages Mathematics Science History and the
social sciences
Per
cen
tage o
f S
tud
ents
Subject Tested
Advanced Placement Examinations
Percentage of Students Scoring 3 or Above
Spring 2005 Spring 2006 Spring 2007 Spring 2008 Spring 2009

54
School Discipline†
To perform at their best, students need a safe learning environment. One of the ways
school climate is tracked in Connecticut is by monitoring the number and type of
disciplinary incidents occurring in the state’s schools. In 2008-09, there were
136,515 disciplinary offenses that were considered serious enough to warrant a
suspension or expulsion.
This large number of total incidents (both serious and policy offenses) involved 11
percent of Connecticut’s students. This means that almost nine out of 10 students
were not involved in either serious or policy offenses. A quarter of all violations was
related to attendance.
† These data have not been audited and are considered preliminary and subject to change.
Student Achievement
Drugs2.1%
Fighting/Battery9.4%
Personally Threatening
Behavior
5.0%
Physical/Verbal Confrontation/
Conduct
Unbecoming8.2%
Property Damage1.0%
Theft/Theft-Related
Behaviors
1.4%
Violent Crimes Against Persons
0.2%
Weapons1.0%
Sexually Related Behavior
0.8%
Academic Violations 0.8%
Attendance 25.1%
Classroom Disruptions12.6%
Insubordination, Disrespect, Obscene Language
24.2%
Personal Threats 2.1%
Possession of Electronic Devices 1.5%
School Threats 0.3%
Trespassing 1.1%
Other School Policy 3.2%
School Policy Violations86.5%
Disciplinary Incidents by Category: 2009
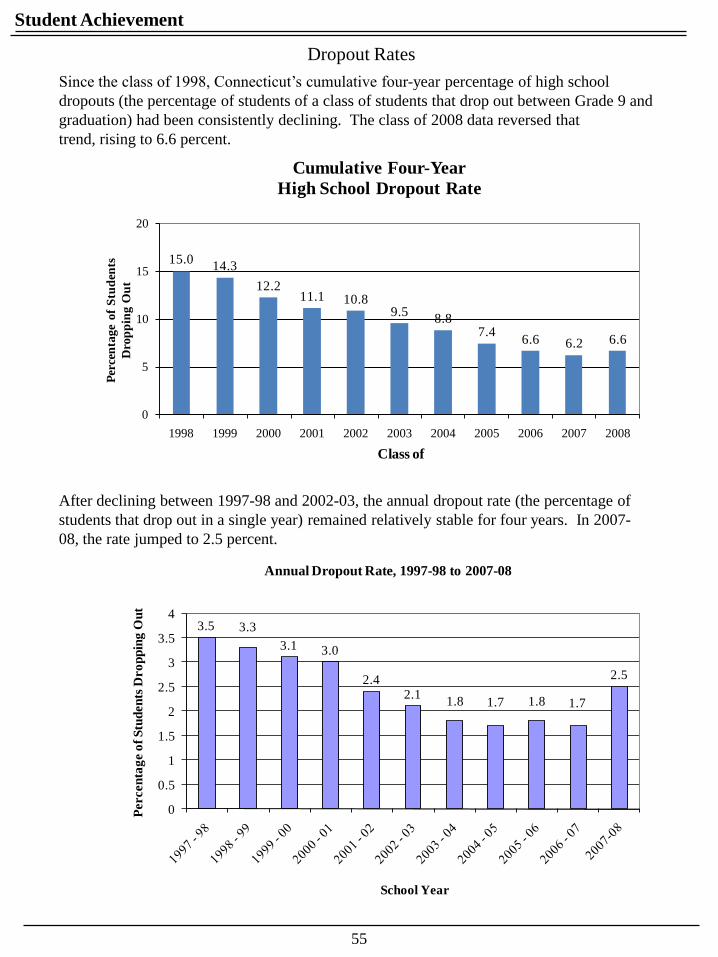
Dropout Rates
Since the class of 1998, Connecticut’s cumulative four-year percentage of high school
dropouts (the percentage of students of a class of students that drop out between Grade 9 and
graduation) had been consistently declining. The class of 2008 data reversed that
trend, rising to 6.6 percent.
55
After declining between 1997-98 and 2002-03, the annual dropout rate (the percentage of
students that drop out in a single year) remained relatively stable for four years. In 2007-
08, the rate jumped to 2.5 percent.
Student Achievement
3.5 3.3
3.1 3.0
2.42.1
1.8 1.7 1.8 1.7
2.5
0
0.5
1
1.5
2
2.5
3
3.5
4
Percen
tag
e o
f S
tud
en
ts D
ro
pp
ing
Ou
t
School Year
Annual Dropout Rate, 1997-98 to 2007-08
15.014.3
12.211.1 10.8
9.58.8
7.46.6 6.2 6.6
0
5
10
15
20
1998 1999 2000 2001 2002 2003 2004 2005 2006 2007 2008
Per
cen
tag
e o
f S
tud
ents
Dro
pp
ing
Ou
t
Class of
Cumulative Four-Year
High School Dropout Rate

Connecticut Physical Fitness Assessment
Across all grades statewide, results of the Connecticut Physical Fitness Assessment (CPFA)
have remained relatively constant for the last five years. For all four grades tested (Grades
4, 6, 8 and 10), between 30 and 40 percent of students met the ―Health‖ standard on all four
assessments in each of the last five years. The CPFA contains four separate assessments that
test students for flexibility, abdominal strength and endurance, upper-body strength and aerobic
endurance.
56
Student Achievement
0
5
10
15
20
25
30
35
40
45
Grade 4 Grade 6 Grade 8 Grade 10
Per
cen
tag
e M
eeti
ng
th
e H
ealt
h S
tan
da
rd o
n A
ll
Fo
ur
Ass
essm
ents
Grade
Percentage Passing All Four Physical Fitness Assessments
By Grade, 2004-05 to 2008-09
2004-05 2005-06 2006-07 2007-08 2008-09

Activities of Spring 2009 Connecticut Public High School Graduates
In the spring of 2009, 38,266 students were graduated with diplomas from
Connecticut public high schools. More than half these graduates went on to attend a
four-year college or university. An additional 24 percent of the graduates continued
their education at two-year colleges or other educational institutions. In all, 94
percent of the 2009 graduates were either furthering their education or engaged in
military or civilian employment.
57
† This category includes full-time homemakers, graduates who were incarcerated or deceased, and other graduates whose
status could not be determined.
Student Achievement
Four-year
college, 58.9%
Two-year
college, 23.6%
Other
education, 4.2%
Military, 1.9%
Civilian
employment, 8.0%
Unemployed, 0.8%
Other†, 4.5%
Activities of Spring 2009
Graduates

STATE OF CONNECTICUT
M. Jodi Rell, Governor
STATE BOARD OF EDUCATION
Allan B. Taylor, Chairperson
Janet M. Finneran, Vice Chairperson
Beverly R. Bobroske
Patrick Campbell
Lynne S. Farrell
William W. Fritz
Theresa Hopkins-Staten
Patricia B. Luke
Neha Mehta
Brenda L. Sisco
John H. Voss
Joseph Vrabely Jr.
Pamela Partridge West
Michael Meotti (ex officio)
Commissioner of Higher Education
Mark K. McQuillan
Commissioner of Education
The State of Connecticut Department of Education is committed to a policy of equal
opportunity/affirmative action for all qualified persons and does not discriminate in any employment
practice, education program, or educational activity on the basis of race, color, national
origin, sex, disability, age, religion or any other basis prohibited by Connecticut state and/or federal
nondiscrimination laws. Inquiries regarding the Department of Education’s nondiscrimination
policies should be directed to the Equal Employment Opportunity Director, State of Connecticut
Department of Education, 25 Industrial Park Road, Middletown, CT 06457-1543, 860-807-2071.