the condensation temperatures of the elements: a reappraisalk€¦ · and cosmochemistry. during...
TRANSCRIPT
The condensation temperatures of the elements: A reappraisal k
Bernard J. Wood1,*, duane J. Smythe1, and thomaS harriSon1
1Department of Earth Sciences, University of Oxford, South Parks Road, Oxford OX1 3AN, U.K.
aBStract
As part of a project to investigate the volatilities of so-called “moderately volatile elements” such as Zn, In, Tl, Ga, Ag, Sb, Pb, and Cl during planetary formation, we began by re-calculating the con-densation temperatures of these elements from a solar gas at 10-4 bar. Our calculations highlighted three areas where currently available estimates of condensation temperature could be improved. One of these is the nature of mixing behavior of many important trace elements when dissolved in major condensates such as silicates, Fe-rich metals, and sulfides. Nonideal solution of the trace elements can alter (generally lower) condensation temperatures by up to 500 K. Second, recent measurements of the halogen contents of CI chondrites (Clay et al. 2017) indicate that the solar system abundance of chlorine is significantly overestimated, and this affects the stabilities of gaseous complexes of many elements of interest. Finally, we have attempted to improve on previous estimates of the free energies of chlorine-bearing solids since the temperature of chlorine condensation has an important control on the condensation temperatures of many trace elements. Our result for the 50% condensation temperature of chlorine, 472 K is nearly 500 K lower than the result of Lodders (2003), and this means that the HCl content of the solar gas at temperatures <900 K is higher than previously estimated.
We based our calculations on the program PHEQ (Wood and Hashimoto 1993), which we modi-fied to perform condensation calculations for the elements H, O, C, S, Na, Ca, Mg, Al, Si, Fe, F, Cl, P, N, Ni, and K by free energy minimization. Condensation calculations for minor elements were then performed using the output from PHEQ in conjunction with relevant thermodynamic data. We made explicit provision for nonidealities using information from phase diagrams, heat of solution measurements, partitioning data and by using the lattice strain model for FeS and ionic solids and the Miedema model for solutions in solid Fe. We computed the relative stabilities of gaseous chloride, sulfide, oxide, and hydroxide species of the trace elements of interest and used these, as appropriate in our condensation calculations. In general, our new 50% condensation temperatures are similar to or, because of the modifications noted above, lower than those of Lodders (2003).
Keywords: Condensation temperatures, element abundances, solar nebula, thermodynamics
introduction
The concept of volatility is an important one in geochemistry and cosmochemistry. During the early evolution of the solar system, there was fractionation of volatile elements between solid, gas, and liquid phases, resulting in the isotopic and chemi-cal fractionations observed between different meteorite groups and planetary bodies. One of the principal tasks in this area is to determine how to interpret the observed chemical and isotopic differences between different bodies in terms of appropriate processes in the solar nebula and during planetary accretion. In this context, it is necessary to consider exactly what is meant by “volatility.” Conventionally, volatility is defined geochemi-cally in a very broad sense as being related to the temperature at which a specific element would condense from a gas of solar composition. Thus, volatile elements are defined as those that condense at relatively low temperature (e.g., < 1100 K) from the putative solar gas while refractory, involatile elements condense at higher temperatures. The utility of the approach lies in the fact
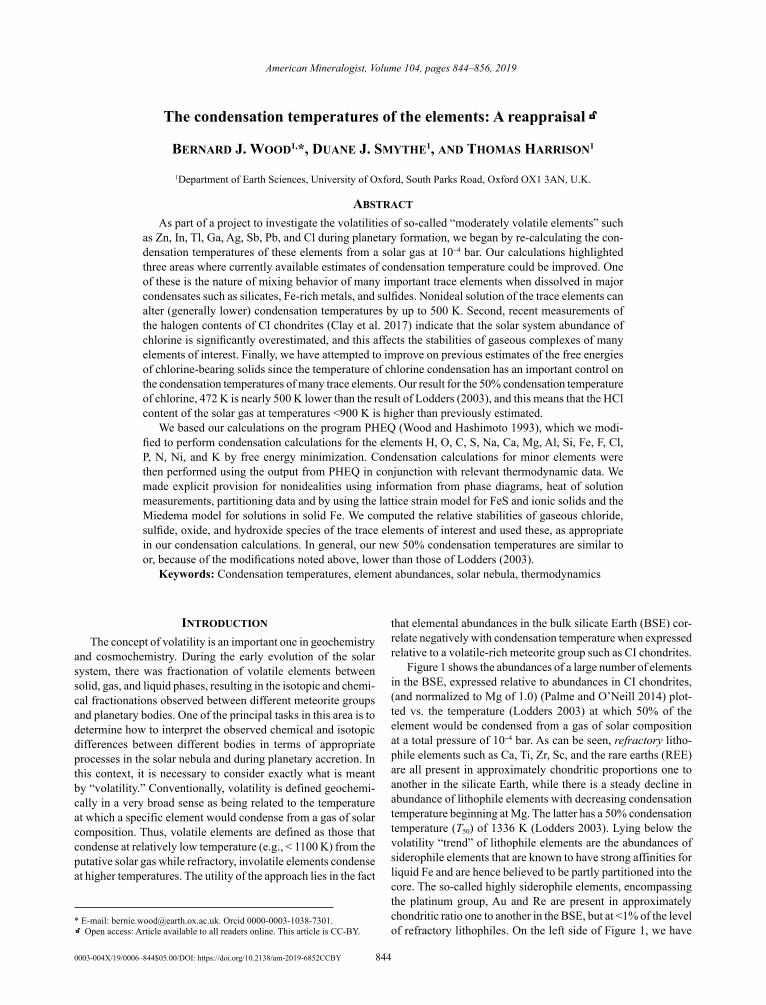
that elemental abundances in the bulk silicate Earth (BSE) cor-relate negatively with condensation temperature when expressed relative to a volatile-rich meteorite group such as CI chondrites.
Figure 1 shows the abundances of a large number of elements in the BSE, expressed relative to abundances in CI chondrites, (and normalized to Mg of 1.0) (Palme and O’Neill 2014) plot-ted vs. the temperature (Lodders 2003) at which 50% of the element would be condensed from a gas of solar composition at a total pressure of 10-4 bar. As can be seen, refractory litho-phile elements such as Ca, Ti, Zr, Sc, and the rare earths (REE) are all present in approximately chondritic proportions one to another in the silicate Earth, while there is a steady decline in abundance of lithophile elements with decreasing condensation temperature beginning at Mg. The latter has a 50% condensation temperature (T50) of 1336 K (Lodders 2003). Lying below the volatility “trend” of lithophile elements are the abundances of siderophile elements that are known to have strong affinities for liquid Fe and are hence believed to be partly partitioned into the core. The so-called highly siderophile elements, encompassing the platinum group, Au and Re are present in approximately chondritic ratio one to another in the BSE, but at <1% of the level of refractory lithophiles. On the left side of Figure 1, we have
American Mineralogist, Volume 104, pages 844–856, 2019
0003-004X/19/0006–844$05.00/DOI: https://doi.org/10.2138/am-2019-6852CCBY 844
* E-mail: [email protected]. Orcid 0000-0003-1038-7301.k Open access: Article available to all readers online. This article is CC-BY.

WOOD ET AL.: THE CONDENSATION TEMPERATURES OF THE ELEMENTS 845
American Mineralogist, vol. 104, 2019
sation calculations for 30 of the more volatile elements. These convinced us that the results are very sensitive to the wide range of possible assumptions for the properties of the trace elements dissolved in the major phases. For example, we are able to re-produce the result of Lodders (2003) for Ag and Pb dissolved in solid Fe assuming ideal solution, but when we take account of the likely nonidealities of Ag and Pb in Fe, the condensation temperatures drop by several hundred degrees Kelvin. As we progressed through most of the naturally occurring elements we found that the behavior of Cl in the solar gas has major in-fluences on the properties of many of the elements and that the recently re-determined halogen contents of the solar system (as in CI chondrites, Clay et al. 2017) should change condensation temperatures significantly. We, therefore, determined to revise the published values to take account of the new measurements.
calculation Strategy: condenSation from a Solar gaS
Many of the calculations discussed below can be and were performed in a spreadsheet. The first step, however, is to de-termine the stabilities of the solids and gaseous species of the major elements. To do this, we used the computer program PHEQ (Wood and Hashimoto 1993) that performs free energy minimization for fixed total gas pressure and temperature and provides the number of moles of each species for a known starting composition. It was written specifically for performing condensation calculations and, as initially configured, uses free energy data for 93 gaseous and 148 solid species of the elements H, O, C, S, Na, Ca, Mg, Al, Si, and Fe. These are tabulated in 100 K intervals in the form:
µ0
RT=HT
0−H
298
0−TS
T
0+ΔH
f ,298
0
RT (2)
In Equation 2, H0 and S0 refer to enthalpy and entropy of the pure phase at the subscripted temperature and DH0
f,298 to the
10-3
10-2
10-1
100
101
500 700 900 1100 1300 1500 1700 1900
Abu
ndac
e/CI
Cho
ndrit
e
50% Condensation Temperature
Zr
In
SSe
Te
Au
W
RhPt
Ru
IrRe Os
Li
Mo
VCr
FeCo Ni
PCu
As
Ag
SbGeTl
Cd Pb
Zn
Cs
Rb B
Na
GaK
Pd
SiMg Eu
SrSc
Mn
VolatileLithophile
Refractory Lithophile
VolatileSiderophile
RefractorySiderophile
Highly Siderophile
AlTi
Ca TaBe
BaHf
F
Br
Sn
Bi
I
Nb
Cl
REE, U, Th
Figure 1
figure 1. Graph of abundance of elements in the silicate Earth, relative those in CI chondrites (Palme and O’Neill 2014), normalized to Mg = 1.0, plotted vs. the calculated temperature (Lodders 2003) at which 50% of the element would be condensed from a gas of solar composition at 10-4 bar.
grouped together elements that are depleted relative to elements of similar volatility (or condensation temperature) and arbitrarily named them “volatile siderophile” elements. Some of the latter, Sb, Ag, S, and C for example are well-known to partition strongly into Fe-rich metals (Steelmaking Data Sourcebook 1988; Wood 1993; Pei et al. 1995) while others (e.g., Cl) are depleted but not known to partition into liquid Fe, so the reasons for their low abundances are unclear. Note, however, that a recent re-analysis of CI chondrites (Clay et al. 2017) raises the CI normalized concentration of chlorine by a factor of 6.1.
The correlation shown in Figure 1 for lithophile elements is seductive but liable to draw the reader into overinterpretation of geochemical and cosmochemical data because abundances correlate with a process, condensation, which applied only for a brief period in the history of the solar system. The nebular gas of approximately solar composition appears to dissipate within about 3 Ma of the beginning of the solar system (Evans et al. 2009) so that most of the tens of millions of years of planetary growth and even the geological development of small asteroidal bodies such as Vesta (Roszjar et al. 2016) took place in the ab-sence of the H2-rich atmosphere characteristic of the bulk solar system. The nebular gas is, of course, highly reducing (about 7 log fO2 units below the Fe-FeO, IW oxygen buffer) and after it disappeared the atmospheres above protoplanetary bodies would have been established by silicate-gas equilibria under oxygen fugacity conditions governed by the FeO contents of the silicate mantle. If we take the lowest fO2 values plausible, then these would have been controlled, given the presence of metallic cores on the terrestrial planets and many asteroids, by Fe-FeO equilibrium and would thus have been 1–2.5 log units below IW (Righter et al. 1998; Wood et al. 2006).
Despite these observations on the short lifetime of the nebular gas and the inevitable increase in fO2 after it disappeared, the condensation sequence shown in Figure 1 appears to have taken on near-magical significance in the literature. Thus, for example, the difference in abundances of Zn and S in the silicate Earth has been used to infer that the S “missing” from silicate Earth is partitioned into the core and that the difference in Zn/S between CI chondrites and BSE can be used to calculate the S content of the core (Dreibus and Palme 1996). The result is 1.7% S (Dreibus and Palme 1996). The large difference in relative abundance between In and elements of similar volatility such as Tl is often treated as an unexplained anomaly (Witt-Eickschen et al. 2009) an impression enhanced by the fact that In is both more sidero-phile and more chalcophile than the more depleted Tl (Kiseeva and Wood 2013; Wood et al. 2014). However, In (+3) and Tl (+1) have different oxidation states in many geologic environments so their relative volatilities must depend on oxygen fugacity, with indium becoming, in principle less volatile as fO2 increases. This assertion follows from the idealized equilibrium:
2In0(gas) + Tl2O (solid) + O2 = 2Tl0 (gas) + In2O3 (solid) (1)
Raising fO2 should, in this case, drive the equilibrium to the right, putting Tl into the gas phase and In into the solid.
Our study started from the question “Are the calculated con-densation temperatures from a solar gas relevant to elemental abundances in silicate Earth?” We began by performing conden-

WOOD ET AL.: THE CONDENSATION TEMPERATURES OF THE ELEMENTS846
American Mineralogist, vol. 104, 2019
enthalpy of formation from the elements at 298 K. For reasons that will become clear as we continue, we have added solid and gas data for species of the elements F, Cl, P, N, Ni, and K. Other updates and modifications of PHEQ described in the literature include the GRAINS code of Petaev (2009). Although the PHEQ program, as initially configured, assumes ideal solution for olivines, orthopyroxenes, clinopyroxenes, plagioclases, met-als, spinels, and melilite this assumption introduces only small errors in T50 for the major elements Na, Ca, Mg, Al, Si, and Fe that all, except for Na, condense above 1300 K. The calculated condensation temperatures for these elements agree well with those of Lodders (2003) and of earlier workers on this subject (Table 1). Most of the minor elements of interest condense into Fe metal or iron sulfide, however, and we have made explicit provision for nonideal solution in these cases as detailed below.
Calculations were performed at a total pressure of 10-4 bar, and we followed normal convention of re-equilibrating
apatite in
Mas
s cr
ysal
lised
as
% �
nal t
otal
sol
ids
600 800 1000 1200 1400 1600 1800Temperature (K)
10-14
10-12
10-10
10-8
10-6
10-4
10-2
100
SiliconSodiumCalciumAluminumMagnesiumIronSulfur
a.
b.
OlivinePlagioclaseClinopyroxeneSpinelOrthopyroxeneAlloySul�de
P = 10-4 bar
50
40
30
20
10
0
hibonite +corundum
Mol
e Fr
actio
n in
Gas
(M
g initi
al n
orm
aliz
ed)
Melilite
Figure 2a,b
figure 2. (a) Fractions of different phases present in the stable solid assemblage as a function of temperature at total pressure = 10-4 bar. Corundum is the first phase to appear at about 1675 K and is joined by small amounts of hibonite and melilite before the major phase of condensation begins at ~1380 K. (b) Concentrations of major elements in the gas phase (normalized to the initial Mg content of the solar gas) as a function of temperature at 10-4 bar.
solids and gases at each step in the condensation process as temperature declined. Although there are several estimates of solar system abundances of the elements, we opted, apart from the halogens, to use those of Lodders (2003) to facilitate comparison with her calculations of condensation temperature.
Figure 2 shows the abundances of the important solid phases and gas components as functions of temperature at 10-4 bar. Small amounts of corundum appear at about 1675 K, followed by hibonite at 1630 K, melilite at 1550 K, and spinel at 1410 K. Major forsteritic olivine and Fe-rich metal start precipitating at 1380–1360 K, followed by other silicates, clinopyroxene, plagioclase, and orthopyroxene at 1350, 1305, and 1285 K, respectively. With declining temperature, the proportions of these phases change as they react with one another and with the solar gas. The other major phase to appear is iron sulfide at 710 K, and this increases in proportion at the expense of Fe metal as the temperature falls further (Fig. 2). Table 2 gives the major solid and gaseous species in 50° intervals from 1700 down to 350 K together with the fugacities of H2O, O2, HCl, and H2S at each temperature. We reiterate that these are equilibrium calculations, however, and that it has been shown that some of the expected reactions, notably the reduction of N2 and CO to NH3 and CH4 are kinetically inhibited at low temperatures (Lewis and Prinn 1980).
Trace and minor element condensationOur general approach to condensation can be carried out for
most elements in a spreadsheet. Let us suppose that our trace element M is present in the gas phase predominantly as mona-tomic M0 and that it condenses to oxide MO1.5. The condensation equilibrium can be represented as follows:
M0 (gas) + 0.75O2 (gas) = MO1.5 (solid) (3)
The logarithm of the equilibrium constant for the reaction (log Kr) is calculated from the tabulated equilibrium constants of formation of the species involved from their constituent elements:
logKr= logK
f
MO1.5− logK
f
M0
−0.75logKf
O2 (4)
We fit log Kr as a function of temperature or reciprocal tempera-ture. Then, from the equilibrium constant for reaction 3 we have:
logPM0 = logaMO
1.5
solid− logK
r−0.75logP
O2
(5)
where PM0 and PO2 are the partial pressures of M0 and O2 in the gas phase, respectively, and aMO1.5 is the activity of the metal oxide in the condensing solid. We obtain logPO2 as a function of tempera-ture from the PHEQ program and as a starting point assume that MO1.5 is a pure oxide with aMO1.5 equal to 1. We fix PM0 at the value expected at a total gas pressure of 10-4 bar when 50% of the solar abundance of M is in the gas phase. We then vary temperature until the left- and right-hand sides of Equation 5 are equal. This gives us T50. Exactly the same approach is used if, for example, the most stable gaseous species is MCl or MS or MOH. In these cases, however, the equilibrium must also use appropriate log K and partial pressure data for HCl, H2S, H2O, and H2. If two or more gaseous species are present in similar amounts, we simply reduce

WOOD ET AL.: THE CONDENSATION TEMPERATURES OF THE ELEMENTS 847
American Mineralogist, vol. 104, 2019
log Pi for the most stable species by an appropriate amount to take account of the fractions of these additional species.
The simplified case above describes condensation into a pure solid phase of element M to MO–1.5. Higher condensation tem-peratures are obtained, however, if we consider the fact that trace elements will, in general, dissolve in one or more of the major phases described above and illustrated in Figure 2. This is because the activity of any component i (ai) is generally lowered relative to that of pure i (ai = 1) if i is dissolved in a major element phase P:
log ai = n log( X
i )P + n log(γ
i )P (6)
In Equation 6, n refers to the number of sites in phase P on which i substitutes, Xi is the mole fraction of i on those sites, and (gi)P is the activity coefficient of i in phase P. Mole fraction Xi comes from having 50% of element i in the solid phase. If the solid solution is ideal (gi)P is 1.0 and i will condense into P so long as the sum of the second and third terms on the right-hand side is less than zero i.e.,
IF: log (Xi)P + log (gi)P < 0, condensation of i is into phase PELSE: i condenses into pure i at a lower temperature.
To calculate activities and condensation temperatures in cases of dissolution in a major phase, we started with the phases
nominated by Lodders (2003) as the hosts and searched for other solutions in cases where it seemed likely that such existed.
Activity coefficients of trace elements
We used a combination of phase equilibria, thermodynamic data, and crystallographic measurements to make estimates of the activity coefficients of trace elements in the major solid phases in the condensation sequence.
Activity coefficients in solid Fe from solubility. At temperatures below 1185 K, the stable form of Fe is body-centered-cubic a-Fe while face-centered cubic g-Fe is stable between 1185 and 1667 K. For elements such as Ag and Pb that are almost insoluble in solid Fe we estimate activity coef-ficients from known solubility at a fixed temperature. Thus, for example, in equilibrium with pure Ag the maximum mole fraction of Ag dissolved in g-Fe at 1366 K is 3.7 × 10⁻⁵ (Wriedt et al. 1973). A first estimate of the activity coefficient at this temperature would then be:
gAg = 1/XAg = 1/(3.7 × 10–5) = 27 027
At this temperature the Ag is liquid, however, so we should make a correction for the free energy of the liquid-solid transformation in pure Ag. This makes gAg larger by a factor fs-l:
Table 1. 50% condensation temperatures and major host phases at 10–4 barElement This study Lodders (2003) Wasson (1985) T50 (K) Phase Activity coefficient (g) T50 (K) Phase T50 (K)Li 1148 En 5.0 [1] 1142 Fo + En 1225Be 1551 Mll lng = 1000·ln(16)/T [2] 1452 Mll B 740 Pl 1 (assumed ideal) 908 Fsp C 40 CH4·7H2O + CH4 ice N 123 NH3·H2O O 183 Rock + Water ice 180 Rock + Water ice F 674 F-Ap 1 (assumed ideal) 734 F-Ap 736Ne 9.1 Ne ice Na 1035 Pl lng = (0.64∙XAn), XAn > 0.56 ELSE 0 [3] 958 Fsp 970Mg 1343 Fo + Cpx 1 (pure) 1336 Fo 1340Al 1652 Crn 1 (pure) 1653 Hbn 1650Si 1314 Fo + Cpx 1 (pure) 1310 Fo + En 1311P 1287 Scb 1 (pure) 1229 Scb 1151S 672 Tro 1 (pure) 664 Tro 648Cl 472 Cl-Ap 1 (assumed ideal) 948 Sdl 863Ar 47 Ar·6H2O K 993 Pl lng = 1100∙ln(9.57)/T [2] 1006 Fsp 1000Ca 1535 Mll 1 (pure) 1517 Hbn + Mll 1518Sc 1541 Prv + Mll 1 (assumed ideal) 1659 Hbn 1644Ti 1565 Prv 1 (pure) 1582 Prv 1549V 1370 Fe alloy + Prv lng = –29000/(8.314·T) [4] 1429 Prv 1450Cr 1291 Fe alloy lng = –6000/(8.314·T) [4] 1296 Fe alloy 1277Mn 1123 Fo + En 1 (close to ideal) [1] 1158 Fo + En 1190Fe 1338 Fe alloy 1 (assumed ideal) 1334 Fe alloy 1336Co 1354 Fe alloy 0.85[4] 1352 Fe alloy 1351Ni 1363 Fe alloy 0.68 [5] 1353 Fe alloy 1354Cu 1034 Fe alloy lng = 1000∙ln(117)/T [7] 1037 Fe alloy 1037Zn 704 Tro lng = 1123∙ln(1.86)/T [8] 726 Fo + En 660Ga 1010 Fe alloy lng = –7045/T [9] 968 Fe alloy + Fsp 918Ge 830 Fe alloy lng = –52000/(8.314∙T) [10] 883 Fe alloy 825As 1235 Fe alloy lng = –68000/(8.314∙T) [4] 1065 Fe alloy 1157Se 701 Tro lng = 1293∙ln(1.67)/T [2] 697 Tro 684Br 420 Syl lng = 420∙ln(3.36)/T [2] 546 Cl-Ap ~690Kr 52 Kr·6H2O Rb 752 Sa lng = 1000∙ln(1.43)/T [2] 800 Fsp ~1080Sr 1548 Prv lng = 1100∙ln(1.53)/T [2] 1464 Ca-titanate Y 1551 Mll + Prv 1 (assumed ideal) 1659 Hbn 1592Zr 1722 ZrO2 1 (pure) 1741 ZrO2 ~1780Nb 1561 Prv 1 (assumed ideal) 1559 Ca-titanate ~1550Mo 1520 Mo metal 1 (pure) 1590 Refractory metal alloy 1608
(Continued on next page)

WOOD ET AL.: THE CONDENSATION TEMPERATURES OF THE ELEMENTS848
American Mineralogist, vol. 104, 2019
Table 1.—ContinuedElement This study Lodders (2003) Wasson (1985) T50 (K) Phase Activity coefficient (g) T50 (K) Phase T50 (K)Ru 1533 Os-Ir-Ru alloy 1 (assumed ideal) 1551 Refractory metal alloy 1573Rh 1370 Fe alloy lng = –23000/(8.314·T) [4] 1392 Refractory metal alloy 1391Pd 1330 Fe alloy lng = –19000/(8.314·T) [4] 1324 Fe alloy 1334Ag 699 Tro lng = 1323∙ln(50)/T [2] 996 Fe alloy 952Cd 502 Tro lng = 1000∙ln(2.6)/T [2] 652 En + Tro 430*In 492 Tro lng = 1000∙ln(5.2)/T [2] 536 Tro 456*Sn 604 Fe alloy lng = 873∙ln(45)/T [11] 704 Fe alloy 720Sb 890 Fe alloy lng = 1100∙ln(1.7)/T [12] 979 Fe alloy 912Te 665 Tro lng = 1293∙ln(40)/T [2] 709 Fe alloy 680I 390 KI 1 (pure) 535 Cl-Ap Xe 68 Xe·6H2O Cs 593 Sa lng = 1000∙ln(7.12)/T [2] 799 Fsp Ba 1423 Prv lng = 1100∙ln(64)/T [2] 1455 Ca-titanate La 1615 Hbn 0.164 [6] 1578 Hbn + Ca-titanate 1520Ce 1454 Mll+ Prv 1 (assumed ideal) 1478 Hbn + Ca-titanate 1500Pr 1550 Hbn + Prv 0.229 (Hbn) [6] 1582 Hbn + Ca-titanate 1532Nd 1630 Hbn 0.297[6] 1602 Hbn 1510Sm 1545 Hbn + Prv 0.55 (Hbn) [6] 1590 Hbn + Ca-titanate 1515Eu 1491 Mll + Prv 1.28 [2] 1356 Hbn + Ca-titanate + Fsp 1450Gd 1630 Hbn 1.1 [6] 1659 Hbn 1545Tb 1630 Hbn 1.63 [6] 1659 Hbn 1560Dy 1630 Hbn 2.49 [6] 1659 Hbn 1571Ho 1630 Hbn 3.83 [6] 1659 Hbn 1568Er 1630 Hbn 5.93 [6] 1659 Hbn 1590Tm 1630 Hbn 9.37 [6] 1659 Hbn 1545Yb 1528 Mll + Prv 1 (assumed ideal) 1487 Hbn + Ca-titanate 1455Lu 1630 Hbn 27.4 [6] 1659 Hbn 1597Hf 1720 HfO2 1 (pure) 1684 HfO2 1652Ta 1546 Prv 1 (assumed ideal) 1573 Hbn + Ca-titanate ~1550W 1736 W-Re alloy 1 (assumed ideal) 1789 Refractory metal alloy 1802Re 1736 W-Re alloy 1 (assumed ideal) 1821 Refractory metal alloy 1819Os 1806 Os metal 1 (pure) 1812 Refractory metal alloy 1804Ir 1566 Os-Ir alloy 1 (assumed ideal) 1603 Refractory metal alloy 1610Pt 1370 Fe alloy lng = –59000/(8.314·T) [4] 1408 Refractory metal alloy 1411Au 967 Fe alloy lng = 38000/(8.314·T) [4] 1060 Fe alloy 1225Hg 240 Tro lng = 1000∙ln(7.4)/T [2] 252 Tro Tl 365 Tl2S, Tl 1 (pure) 532 Tro 428*Pb 495 PbS 1 (pure) 727 Fe alloy 496*Bi 480 Bi metal 1 (pure) 746 Fe alloy 451Th 1630 Hbn 1 (assumed ideal) 1659 Hbn 1545U 1609 Hbn 1 (assumed ideal) 1610 Hbn 1420Notes: En = enstatite; Fo = forsterite; Cpx = clinopyroxene; Mll = melilite; Pl = plagioclase; Fsp = feldspar; Ap = apatite; Crn = corundum; Hbn = hibonite; Scb = schreibersite; Tro = troilite; Sdl = sodalite; Prv = perovskite; Syl = sylvite; Sa = sanidine; *10–5 bar. [1] Frei et al. (2009); [2] This study based on lattice strain Model; [3] Orville (1972); [4] Boom et al. (1983); [5] Grimsey and Biswas (1977); [6] Davis et al. (2018); [7] Arita et al. (1981); [8] Fleet (1975); [9] Predel and Vogelbein (1975); [10] Predel and Vogelbein (1979); [11] Hari Kumar et al. (1996); [12] Pei et al. (1995).
fs-l = exp[DSfus(T – Tfus)/(RT)] (7)
where DSfus is the entropy of melting at the melting temperature of 1234 K, T is the temperature of interest, and R is the gas constant.
To extrapolate a known (or estimated) value of gi up and down temperature we make the usual assumption that activity coefficients approach 1 at infinite temperature. This leads to a calculated gT at temperature T, from gTM measured at tem-perature TM:
ln(gT) = (TM/T)·ln(gTM) (8)
Activity coefficients in Fe from Miedema model. Where the Fe – M (M being the minor element of interest) phase diagram is complex such that extraction of activity coefficients is difficult, we have used the semi-empirical Miedema model (Boom et al. 1983; Miedema et al. 1980) to estimate activity coefficients in the solid Fe alloy. This model for the energetics of mixing of binary alloys has 3 parameters for each element, an electron density parameter, the work function of the metal and the atomic surface area. It has been found to successfully predict alloying behavior
in a large number of cases. We did not re-calculate heats of mix-ing using the Miedema model but have simply adopted published values calculated for binary alloys with Fe (Boom et al. 1983).
Activity coefficients from lattice strain theory. Insertion of a “foreign” ion into a crystal lattice generally requires that the lattice relaxes to accommodate the ion that will, in general, have a different radius and sometimes charge from those of the major ion that it is replacing. Thus, for example, in the case of chalcophile elements such as Pb, Cd, or Zn dissolving in FeS, the differences in ionic radius between Fe and the substituent trace element leads to a positive free energy of strain around the cation defect. If we treat the lattice as elastically isotropic, the strain-free energy per mole of substituent can be shown to be (Brice 1975; Blundy and Wood 1994):
ΔGstrain
crystal= 4πE
SN
A
r!
2r!−r
i( )
2
−1
3r!−r
i( )
3⎛
⎝⎜⎜⎜⎜
⎞
⎠
⎟⎟⎟⎟ (9)
In Equation 8, ES is the Young’s modulus of the site, NA is Avo-gadro’s Number, ri is the radius of the substituent (Pb, Cd, or Zn in this case), and ro is the radius of the cation that fits without

WOOD ET AL.: THE CONDENSATION TEMPERATURES OF THE ELEMENTS 849
American Mineralogist, vol. 104, 2019
strain into the lattice. In the case of FeS, ro is assumed to be the ionic radius of Fe2+. In cases where the Young’s modulus is unknown we use the bulk modulus for the crystal K and convert assuming a Poisson’s ratio of 0.25 yielding ES = 1.5 K (Blundy and Wood 1994).
The strain-free energy leads to an activity coefficient of:
γi= exp
ΔGstrain
crystal
RT (10)
We used this approach for substitution of elements into phases (other than Fe) for which no thermodynamic, partitioning, or solubility data were available.
Activity coefficients from thermodynamic or partitioning data. In some cases, there have been direct measurements of the thermodynamic properties of the minor elements of interest and these yield estimates of the activity coefficients. There are, for example, measurements of the enthalpies of mixing of the systems Fe–Ga and Fe–Ge (Predel and Vogelbein 1975, 1979) and these can be turned into partial molar enthalpies of solution of Ge and Ga in solid Fe. These partial molar enthalpies Hs are then converted into activity coefficients using an analog of Equation 10.
γi= exp
Hs
RT (11)
A final method of estimating gi is from partitioning between liquid and crystals. In this case, we assume that the ratio of crystal–liquid partition coefficients Di and Do for the trace ion of interest (i) and the major ion of the host crystal (o) can be inverted to give activity coefficient (Davis et al. 2018), i.e.,
Di
Do
1γi
~ (12)
High-temperature condensation (>1300 K) of metals and oxides
Elements forming simple alloys or metals: Os, Ir, Ru, W, Re, Mo. At high temperatures (>1300 K) in a solar gas, the domi-nant species of many elements is the uncharged atom M0. This makes the calculation of condensation temperature into one of the stable phases of Figure 2 relatively straightforward, or even easier in the cases of elements that condense at higher temperatures into pure metal or oxide. Os is calculated to condense to Os metal at 1806 K. Ir would be expected to form a solid solution with Os, and we assumed it dissolves ideally in Os-Ir alloy, giving a T50 of 1566 K. Ru should also alloy with osmiridium and making this assumption yields T50 of 1533 K for Ru.
The dominant gas species of W is calculated to be WO and W is calculated to form an alloy with Re with T50 of 1736 K for both
Table 2. Major solid and gaseous species present at different temperatures and fugacities of O2, H2O, H2S, and HClT (K) Pressure (bar) log (fO2) log (fH2O) log (fH2S) log (fHCl) Major gas species (>1 ppm) Major solid phases1700 1.00 × 10⁻⁴ –15.99 –7.31 –9.30 –11.14 Al, CO, Ca, Fe, He, H2, H2O, H, H2S, Mg, Na, SiO, S, SiS, SH, N2, Ni 1650 1.00 × 10⁻⁴ –16.45 –7.31 –9.14 –11.14 Al, CO, Ca, He, Fe, H2, H2O, H, H2S, Mg, Na, Crn SiO, S, SiS, SH, N2, Ni 1600 1.00 × 10⁻⁴ –16.94 –7.31 –9.00 –11.13 CO, Ca, Fe, He, H2, H2O, H, H2S, Mg, Na, Hbn SiO, S, SiS, SH, N2, Ni 1550 1.00 × 10⁻⁴ –17.46 –7.31 –8.89 –11.14 CO, Ca, Fe, He, H2, H2O, H, H2S, Mg, Na, Mll, Hbn SiO, S, SiS, SH, N2, Ni 1500 1.00 × 10⁻⁴ –18.01 –7.31 –8.80 –11.13 CO, Fe, He, H2, H2O, H, H2S, Mg, Na, SiO, S, Crn, Mll SiS, SH, N2, Ni 1450 1.00 × 10⁻⁴ –18.60 –7.31 –8.74 –11.13 CO, Fe, He, H2, H2O, H, H2S, Mg, Na, SiO, S, Crn, Mll SiS, SH, N2, Ni 1400 1.00 × 10⁻⁴ –19.23 –7.31 –8.70 –11.13 CO, Fe, He, H2, H2O, H, H2S, Mg, Na, SiO, SiS, Spl, Mll SH, N2, Ni 1350 1.00 × 10⁻⁴ –19.98 –7.35 –8.67 –11.14 CO, Fe, He, H2, H2O, H, H2S, Mg, Na, SiO, SiS, Ol, Spl, Cpx, Mll, Fe-alloy SH, N2
1300 1.00 × 10⁻⁴ –20.89 –7.44 –8.61 –11.14 CO, Fe, He, H2, H2O, H, H2S, Mg, Na, SiO, SiS, Ol, Cpx, Pl, Fe-alloy, Scb SH, N2
1250 1.00 × 10⁻⁴ –21.77 –7.49 –8.55 –11.15 CO, Fe, He, H2, H2O, H, H2S, Na, SiO, SiS, SH, N2 Ol, Opx, Cpx, Pl, Fe-alloy, Scb1200 1.00 × 10⁻⁴ –22.65 –7.50 –8.52 –11.17 CO, He, H2, H2O, H, H2S, Na, N2 Ol, Opx, Cpx, Pl, Fe-alloy, Scb1150 1.00 × 10⁻⁴ –23.58 –7.50 –8.52 –11.22 CO, He, H2, H2O, H, H2S, Na, N2 Ol, Opx, Cpx, Pl, Fe-alloy, Scb1100 1.00 × 10⁻⁴ –24.59 –7.50 –8.52 –11.33 CO, He, H2, H2O, H, H2S, Na, N2 Ol, Opx, Cpx, Pl, Fe-alloy, Scb1050 1.00 × 10⁻⁴ –25.70 –7.50 –8.51 –11.49 CO, He, H2, H2O, H2S, Na, N2 Ol, Opx, Cpx, Pl, Fe-alloy, Scb1000 1.00 × 10⁻⁴ –26.92 –7.50 –8.51 –11.56 CO, He, H2, H2O, H2S, N2 Ol, Opx, Cpx, Pl, Fe-alloy, Scb950 1.00 × 10⁻⁴ –28.27 –7.50 –8.51 –11.53 CO, He, H2, H2O, H2S, N2 Ol, Opx, Cpx, Pl, Fe-alloy, Scb900 1.00 × 10⁻⁴ –29.77 –7.50 –8.51 –11.40 CO, He, H2, H2O, H2S, N2 Ol, Opx, Cpx, Pl, Fe-alloy, Scb850 1.00 × 10⁻⁴ –31.44 –7.50 –8.51 –11.28 CO, He, H2, H2O, H2S, N2 Ol, Opx, Cpx, Pl, Fe-alloy, Scb, Sa800 1.00 × 10⁻⁴ –33.32 –7.50 –8.51 –11.20 CO, He, H2, H2O, H2S, N2 Ol, Opx, Cpx, Pl, Fe-alloy, Scb, Sa750 1.00 × 10⁻⁴ –35.45 –7.50 –8.51 –11.15 CH4, CO, CO2, He, H2, H2O, H2S, N2 Ol, Opx, Cpx, Pl, Fe-alloy, Scb, Sa700 1.00 × 10⁻⁴ –37.79 –7.45 –8.61 –11.14 CH4, CO, CO2, He, H2, H2O, H2S, N2 Ol, Opx, Cpx, Pl, Fe-alloy, Tro, Scb, Sa650 1.00 × 10⁻⁴ –40.17 –7.24 –8.99 –11.13 CH4, CO, CO2, He, H2, H2O, H2S, N2 Ol, Spl, Opx, Cpx, Pl, Fe-alloy, Tro, Ap, Scb, Sa600 1.00 × 10⁻⁴ –43.11 –7.07 –9.43 –11.14 CH4, CO, He, H2, H2O, H2S, N2 Ol, Spl, Opx, Cpx, Pl, Fe-alloy, Tro, Ap, Scb, Sa550 1.00 × 10⁻⁴ –46.96 –7.05 –9.97 –11.27 CH4, He, H2, H2O, H2S, N2 Ol, Spl, Opx, Cpx, Pl, Fe-alloy, Tro, Ap, Sa500 1.00 × 10⁻⁴ –51.62 –7.06 –10.60 –11.37 CH4, He, H2, H2O, N2 Ol, Spl, Opx, Cpx, Pl, Fe-alloy, Tro, Ap, Sa450 1.00 × 10⁻⁴ –57.32 –7.06 –11.19 –11.54 CH4, He, H2, H2O, N2, NH3 Ol, Spl, Opx, Cpx, Pl, Fe-alloy, Tro, Ap, Sa400 1.00 × 10⁻⁴ –64.43 –7.06 –11.84 –11.82 CH4, He, H2, H2O, N2, NH3 Ol, Spl, Cpx, Pl, Tr, Fe-alloy, Tro, Ap, Sa350 1.00 × 10⁻⁴ –73.57 –7.07 –13.00 –19.07 CH4, He, H2, H2O, N2, NH3 Ol, Spl, Cpx, Pl, Tr, Fe-alloy, Tro, Sdl, Ap, SaNotes: Crn = corundum; Hbn = hibonite; Mll = melilite; Spl = spinel; Ol = olivine; Cpx = clinopyroxene; Pl = plagioclase; Opx = orthopyroxene; Scb = schreibersite; Tro = troilite; Ap = apatite; Sdl = sodalite; Sa = sanidine; Tr = tremolite.

WOOD ET AL.: THE CONDENSATION TEMPERATURES OF THE ELEMENTS850
American Mineralogist, vol. 104, 2019
ties of HfO (gas) from Pedley and Marshall (1983) and calcu-lated condensation to the pure HfO2 solid (Barin et al. 1989) at 1720 K (T50). Assuming ZrO2 and HfO2 form a solid solution has insignificant effect because the condensation temperatures are virtually identical.
Ta has stable gas species of TaO and TaO2 and 50% conden-sation as Ta2O5 is calculated to occur at 1546 K if Ta dissolves ideally in perovskite. A value of 1561 K is obtained for Nb condensing as NbO and NbO2 into perovskite.
The most stable gaseous species of Th is ThO2 in the solar gas. Assuming ideal solution of Th in hibonite, perovskite, and melilite we obtain T50 for Th of 1630 K with hibonite as the principal host. For U we obtained the thermodynamic properties of the gaseous oxides from Konings et al. (2014) and obtained a similar result to Th for condensation into hibonite (T50 = 1609 K), given the properties of UO2 (solid) from Barin et al. (1989).
Ba and Sr are also refractory and potentially stabilized by solution in perovskite. We used thermodynamic data for BaTiO3 and SrTiO3 (Barin et al. 1989) and used the elastic strain model with ro of 1.18 Å and ES of 130 GPa (Corgne and Wood 2005) to calculate activity coefficients using the eightfold-coordinated ionic radii of Shannon (1976). This leads to T50 values of 1548 and 1423 K for Sr and Ba, respectively.
Finally, Be condensation was treated using the thermody-namic data for BeO (solid), BeO (gas), and Be (gas) and, as-suming condensation into melilite, T50 is 1550 K, essentially at the point of melilite appearance.
condenSation at temperatureS <1300 K
Condensation of Cl, F, Br, and ICl is cosmochemically abundant and forms stable gas species
with many of the elements of interest, predominantly at tempera-tures below 1100 K. Figure 3 shows calculated MCl/M0 ratios for several elements of interest as a function of temperature at 10-4 bar in the solar composition gas. Because of the stabiliz-ing effect of gaseous Cl (as HCl) on other gas species at low temperatures, the temperature of condensation of Cl into solid phases is critical to the calculation of condensation temperature for several the other elements of interest. If, for example, in the regime below 800 K Cl is uncondensed, then elements such as In are stabilized in the gas relative to the solid by the presence of gaseous chlorides.
Lodders (2003) notes that the condensation temperatures of the halogens are uncertain and gives T50 for F, Cl, Br, and I of 734, 948, 546, and 535 K, respectively. The relatively abundant Cl was considered to condense into sodalite (Na4Al3Si3O12Cl), at 948 K, this phase occurring in some carbonaceous chondrites. Sodalite is also a stable phase at high temperatures in some alka-line silica-undersaturated rocks (Stormer and Carmichael 1971).
To derive thermodynamic data for sodalite, we used calo-rimetric measurements of third law entropies, heat capacities and enthalpy of formation (Komada et al. 1995). We then tested these against the reversed phase-equilibrium experiments of Sharp et al. (1989) who determined the equilibrium boundary for the breakdown of sodalite to b-nepheline plus sodium chloride:
Na4Al3Si3O12Cl = 3NaAlSiO4 + NaCl (13)
elements. Similarly, Mo metal should form at high temperature with T50 of 1520 K.
Elements condensing into Fe metalAs soon as metallic Fe appears (1380 K) Rh, Pt, Pd, and V,
which have very low activity coefficients (<<1) in Fe, begin to dissolve in it. We used the Miedema model for activity coef-ficients (Boom et al. 1983) and calculated T50 values of 1370, 1370, 1330, and 1370 K for these four elements. Ni also dissolves into Fe with a T50 value of 1363 K followed by Co at 1354 and Cr (1291) all condensing from M0 in the gas to the Fe-rich metal with small nonidealities (Table 1).
For phosphorus we followed Lodders (2003) and assumed that (Fe,Ni)3P is a potentially stable phase. The most stable gas species at high temperatures are P2, PO, and PS. We used experi-mental data on P2 partial pressures above phosphides (Zaitsev et al. 1995) to calculate the thermodynamic properties of Fe3P that were added to the PHEQ database. The properties of Ni3P were taken from Barin et al. (1989). (Fe,Ni)3P was found to appear at 1310 K with a T50 of 1287 K for phosphorus.
Refractory lithophiles: Y, Sc, Ti, Nb, Ta, U, Th, Zr, Hf, and the lanthanides
Most of these elements are so oxyphile that the most stable gas species, even in the reducing solar gas is MO or MO2 rather than M0. Ti is calculated to condense from TiO in the gas into CaTiO3 perovskite, starting at 1583 K with a T50 of 1565 K. Many of these refractory lithophiles are very compatible in perovskite (Corgne and Wood 2005) and will, depending on their properties, condense into it (below 1583 K) or into hibonite (at temperatures below its appearance at 1630 K). The lanthanides are also very compatible in gehlenite-rich melilite (Nagasawa et al. 1980), so we can assume that this also becomes a host for the REE at temperatures below its appearance at 1550 K. For the lanthanides we used thermodynamic data on the gaseous oxides (Konings et al. 2014) and the gaseous element (Barin et al. 1989) to compute the stable gas species and the temperature of condensation of the oxide, which was assumed to dissolve in hibonite, perovskite, and/or melilite as discussed above. For the elements Sm, Eu, Tm, and Yb the most stable gaseous species is M0. For all the other REE except Ce it is MO while for Ce it is CeO2. Several elements are calculated to dissolve in hibonite almost as soon as it appears at 1630 K (La, Nd, Gd, Tb, Dy, Ho, Er, Tm, and Lu). This is largely because their mole fractions are so low relative to Ca in the gas phase that their activities, taking account of the activity coefficients of Davis et al. (2018) (Eq. 6) in the solid are <10-4. Three lanthanides—Sm, Pr, and Yb—dis-solve in hibonite together with perovskite and melilite at slightly lower temperatures. The two elements that are not M3+, Eu2+, and Ce4+ should condense primarily into melilite and perovskite at 1491 and 1454 K, respectively. For yttrium, we used data on the properties of YO gas (Pedley and Marshall 1983) to calculate condensation into melilite, hibonite, and perovskite with T50 of 1551 K. The stable ScO gas species is calculated to similarly condense into melilite and perovskite with T50 of 1541 K.
In a solar gas, the dominant Zr species at high temperatures are ZrO and ZrO2, and these condense to form solid ZrO2 with T50 of 1722 K. For Hf, we obtained the thermodynamic proper-

WOOD ET AL.: THE CONDENSATION TEMPERATURES OF THE ELEMENTS 851
American Mineralogist, vol. 104, 2019
Sodalite was determined to be the stable assemblage at pres-sures up to about 0.8 GPa in the temperature range 900–1100 K (Sharp et al. 1989). Using the equations of state of Sharp et al. (1989) we used the phase equilibrium results to estimate that the free energy change of reaction 13 at 1 bar lies in the range 16.0 to 16.9 kJ at 923–1073 K. To reproduce these values and to generate the apparent change in P-T slope of the reaction from negative to positive above about 1000 K we followed Sharp et al. in adding entropy of Al-Si disorder in sodalite above 800 K. We find that adding 35 J/K of additional entropy (Sharp et al. assumed 30.85 J/K) yields the observed free energies of reaction.
We added the free energy functions for sodalite, NaCl, and KCl (both from Barin et al. 1989) to the PHEQ database and calculated the condensation sequence in the normal way. This leads to a condensation temperature (T50 of 410 K) with NaCl and KCl as the major solid Cl-bearing phases if we use the original, Lodders (2003) abundances of Cl. Sodalite appears at about 390 K and rapidly consumes NaCl at lower temperatures.
Paradoxically, the new, lower solar system abundances of Cl (Clay et al. 2017) lead to higher T50 values for Cl. This is because Cl begins to condense into fluorapatite soon after it appears at 675 K if the original high Cl abundances (Lodders 2003) are used. In this case about a third of the Cl condenses as chlorapatite until all P is consumed, but T50 for Cl is not reached until NaCl and KCl start to precipitate at 410 K. When we revert to the new lower Cl abundances, more than 50% of the Cl condenses into fluorapatite-chlorapatite solutions before halides or sodalite be-come stable. This, therefore, increases T50 for Cl, which becomes dependent on the thermodynamic properties of chlorapatite. To perform these calculations, we added to the PHEQ database thermodynamic data for fluorapatite (Hovis and Harlov 2010; Robie et al. 1978), hydroxyapatite, and chlorapatite (Drouet 2015) together with the properties of a large number of gaseous species from Barin et al. (1989), detailed in Supplemental1
Table S1, combined with those of PH, PN, PH3 (Lodders 1999), and PS (Lodders 2004). P begins to condense into (Fe,Ni)3P at 1310 K (discussed above) but this phosphide starts being con-sumed when fluorapatite appears (675 K) and is completely lost at 590 K. The enthalpy of formation of chlorapatite, Ca5(PO4)3Cl, has been measured several times, with a spread from –6639 to –6548 kJ (Drouet 2015) that produces considerable uncertainty in the condensation temperature of this component of apatite. Hovis and Harlov (2010) also determined large apparent nonidealities in fluor-chlorapatite solid solutions, which, if applied at face value would substantially lower the condensation temperature of Cl. These authors suggested, however, that their calorimetric measurements were influenced by anion vacancy defects in their synthetic apatite crystals and that the fluorapatite-chlorapatite series is essentially ideal. We commenced with an enthalpy of formation (–6580.35 kJ) in the middle of the measured range and assumed ideal solution. In this case chlorapatite appears in solid solution in fluorapatite (which itself condenses rapidly at 675 K) at about 610 K. The chlorapatite component then con-denses over an extended temperature interval with T50 of 472 K. Lowering the enthalpy of formation to that determined by Cruz et al. (2005) (–6615.5 kJ) has little effect on the initial tempera-ture of Cl condensation, but T50 is reached much more rapidly, at about 600 K. To put these values in context, if chlorapatite is completely destabilised then T50 into KCl is about 420 K, while we would need to go to the lower limit of measured heats of formation to push T50 significantly above 620 K.
We used bromapatite heat of formation data from Cruz et al. (2005) and estimated the heat capacity and entropy of this phase from the values for fluorapatite, CaF2 and CaBr2. Based on these estimates, Br should not condense above 350 K in apatite. We instead calculate condensation at about 420 K into K(Cl,Br) solid solution. Activity coefficients for KBr, based on the low bulk modulus of KCl (Vijay and Verma 2000) should be about 3.36 at 420 K. Using the same elasticity data, KI should have an activity coefficient of ~7000 in KCl under these conditions, which means that the activity of KI dissolved in KCl would be much greater than 1. KI should, therefore, condense as a pure phase with T50 of 390 K.
Low-temperature condensation into Fe and FeSNonideality issues. Lodders (2003) groups Ag, As, Au, Bi,
Cu, Ge, P, Pb, Sb, Sn, and Te as siderophile elements condens-ing into the Fe alloy. We began by assuming ideal solution of most of these elements in the metal and found good agreement with Lodders’ T50 values (in parentheses), as follows As 1030 K (1065); Pb 739 K (727); Bi 751 K (746); Ag 997 K (996); Sb 930 K (979); Sn 725 K (704). The problem with these values, however, is that there are demonstrable nonidealities evidenced by the insolubility of, for example, Ag, Pb, and Bi in solid iron. When the activity coefficients implied by the low extents of solubility, as exemplified by Ag, discussed above, are added to the thermodynamic data, the condensation temperatures are depressed by several hundred degrees Kelvin. Frequently, how-ever, the effect is lessened by the precipitation of another phase, generally FeS, into which the trace element dissolves.
Condensation into iron: Au, As, Cu, Ge, Ga, Sb, and Bi. Au, which has AuS as the dominant gas species, has large activ-
figure 3. Showing the ratio of MCl to M0 in the gas phase as a function of temperature for several elements of interest. Total pressure of 10-4 bar and partial pressure of HCl computed at each temperature by free energy minimization using the PHEQ program.
-10
-5
0
5
10
15
20
25
400 600 800 1000 1200
log M
Cl/M
0
Temperature (K)
GaCl/Ga0
InCl/ In0
KCl/K0
NaCl/Na0
SbCl/Sb0
TlCl/Tl0
M0 DominantMCl Dominant
Figure 3

WOOD ET AL.: THE CONDENSATION TEMPERATURES OF THE ELEMENTS852
American Mineralogist, vol. 104, 2019
ity coefficients in solid Fe (Boom et al. 1983). Nevertheless, we find condensation into Fe with T50 of 967 K. Arsenic dissolves into Fe with strong negative deviations from ideality. Both the Miedema model and a more recent thermodynamic assessment (Pei et al. 1994) lead to essentially the same T50 of 1235 K. Cu has small positive deviations from ideality when dissolved in Fe (Arita et al. 1981). We obtain virtually identical T50 to that of Lodders (2003) (1035 K) when the nonidealities are accounted for. The condensation temperature of Ge into Fe is influenced by large negative deviations from ideal solution. We estimated the enthalpy of solution of Ge in Fe from the results of Predel and Vogelbein (1979) and converted this [–52 kJ/(gm·atom)] to activity coefficients using Equation 11. The result is similar to that of Wai and Wasson (1979), a calculated T50 temperature of 830 K. Ga also dissolves in Fe with strong negative deviations from ideality. The most stable gaseous species at low tempera-tures are GaCl, GaF, and GaOH (Wai and Wasson 1979) although the free energy of GaOH is fairly uncertain (Battat et al. 1974). Taking account of the enthalpy of solution data for Ga in Fe (Predel and Vogelbein 1975) we obtain a T50 value of approxi-mately 1010 K. The considerable uncertainty is highlighted if we use the Wai and Wasson (1979) estimate for gGa. This would lower T50 by about 200 K.
For antimony, SbS should, given Knudsen cell mass spectro-metric data (Hino et al. 1986), be an important gas species in the temperature range of interest, with Sb2, Sb0, Sb4, and SbCl all present in proportions that are strongly temperature-dependent. We find that given the activity coefficients estimated from phase relations (Pei et al. 1995) Sb condenses into iron at around 890 K. Use of the lower activity coefficients adopted by Wai and Wasson (1979) would raise this by ~100 K.
Sn may condense either into Fe metal or into FeS depending on activity coefficients. For the metal, we estimate a minimum activity coefficient of 45 at 873 K based on the Fe-Sn phase diagram (Hari Kumar et al. 1996) while in FeS an activity coef-ficient of 1060 is obtained at 700 K from the lattice strain model given an Es of 81 GPa (discussed below). The most stable gas species is SnS and the condensation temperature into Fe is 604 K while condensation into sulfide is calculated to be at about 50 K lower temperature.
There is essentially complete immiscibility in the Bi-Fe system with activity coefficients of the order of 2500 even in liquid Fe at 1873 K (Boa et al. 2008). Extrapolating this value down to 750 K or using the Miedema model results in either case of Bi activity >1 in Fe. Hence Bi should precipitate as Bi metal rather than in solution in Fe. We obtain T50 of 485 K for Bi metal.
Condensation into FeS and as sulfide. S, Se, and Te all condense primarily into FeS. The PHEQ program has thermo-dynamic data for both pyrrhotite Fe0.877S and troilite FeS that are treated as separate phases. Using the data as given, pyrrhotite should precipitate first from a solar gas. This has been shown, however, to be inconsistent with more recent thermodynamic data (Grønvold and Stølen 1992; Lauretta et al. 1996). Lauretta et al. (1996) showed that, at the H2S/H2 ratio of the solar nebula, the thermodynamic data of Grønvold and Stølen (1992) indicate that FeS, troilite should be the most stable sulfide and hence should appear first. We, therefore, used the data of Grønvold and Stølen (1992) for FeS and Fe0.875S to calculate that troilite
appears at 710 K with T50 for S of 672 K, virtually identical to the Lodders (2003) value for S.
We have measured (unpublished) partition coefficients of Se between solid FeS and sulfide liquid of about 0.6 at 1293 K. We assume that this corresponds to the reciprocal of the activity coefficient that is therefore 1.67 at 1293 K. The stable gas species H2Se condenses FeSe into FeS with T50 of 701 K. We used the same approach for Te and adopted an activity coefficient of 40 at 1293 K based on our partitioning experiments. This results in T50 of 665 K.
For Ag we assumed nonideal solution with activity coeffi-cients obtained from the lattice strain model and Es of 81 GPa, which is in reasonable agreement with the bulk moduli of the different FeS polymorphs (Kusaba et al. 1997) and with ro the sixfold radius of Fe2+ (Shannon 1976). These parameters were also constrained to be in accord with our measured (unpublished) solid sulfide-liquid sulfide partition coefficient DAg of ~0.03 at 1323 K. Ag is calculated to condense into iron sulfide with T50 of 699 K.
The most stable gaseous species of Cd should be Cd0 and this condenses into FeS with a T50 of 502 K. Activity coefficients were obtained from the lattice strain model with Cd2+ radius from Shannon (1976).
ZnS mixes with only small nonidealities into FeS (Fleet 1975), and we find that incorporating Fleet’s results, Zn condenses into FeS essentially as soon as it appears, with T50 of 704 K.
Indium has several important gaseous species in the tem-perature range of interest, including InOH (Skulan et al. 2006) and InCl (Barin et al. 1989). The latter dominates before Cl condenses. Indium has stable sulfides InS and In2S3 and the former should be more stable at the H2S fugacities of the solar nebula. Assuming that InS dissolves ideally in FeS, we obtain a T50 of 580 K. In2+ is, however significantly larger than Fe2+ and InS has metal-metal bonds (Schwarz 2002; Schwarz et al. 1995) so is unlikely to dissolve ideally in FeS. The low-pressure structure (Schwarz et al. 1995) has a very distorted coordination polyhedron around In, with average In-S distances of 2.92 Å, which, taking the S2– radius from Shannon (1976) leads to an In2+ radius of 1.08 Å. The polyhedron becomes much less distorted by 4.3 GPa however (Schwarz et al. 1995), and performing the same calculation leads to an In2+ radius of 0.92 Å. We averaged these 2 values and used the lattice strain model to estimate an activity coefficient of 5.2 at 1000 K in FeS. We hence calculate that In will condense as InS into FeS at 492 K (T50) from the solar gas. This temperature would decrease by ~25 K if we were to apply the lattice strain model and assume an ionic radius of In2+ of 1.08 Å. For HgS we used data on the pressure of Hg0 plus S2 over heated HgS (Mills 1974; Ferro et al. 1989) to calculate the conditions of HgS condensation into FeS. We took account of the nonidealities of HgS in FeS using the lattice strain model with Es and r0 as discussed above. The T50 condensation tem-perature is 240 K.
We used the lattice strain model for condensation of PbS into FeS and obtain an activity coefficient of 686 at 1000 K. This means that, at solar system abundances, PbS activities in FeS would be >1 below 530 K. At lower temperatures, Pb would condense from Pb0 and H2S as pure PbS. We thus obtain condensation of pure PbS at 495 K.

WOOD ET AL.: THE CONDENSATION TEMPERATURES OF THE ELEMENTS 853
American Mineralogist, vol. 104, 2019
Tl behaves similarly to Pb. The lattice strain model gives activity coefficients on the order of 1010 at 1000 K for dissolu-tion into FeS while the Miedema model gives activity coef-ficients of about 108 for dissolution into Fe metal at the same temperature. These large values mean that Tl should condense into a Tl phase, either Tl2S or Tl metal and the temperatures are of the order of 400 K or lower depending on the stability of the TlCl gaseous species (Fig. 3). We find that the T50 temperatures for Tl condensing into both Tl metal and Tl2S are virtually identical, at 365 K.
Condensation into silicates: K, Rb, Cs, Li, Mn, and BThe alkalis—K, Rb, and Cs—were all assumed to condense
into the phases with which they are most associated in nature, the feldspars. For K we assumed condensation into either the albitic plagioclase present in the major element condensation sequence or into a separate sanidine feldspar. We calculated activity coefficients in plagioclase using lattice strain param-eters derived from plagioclase-liquid partitioning experiments (Blundy and Wood 1994) and obtained a T50 temperature of 993 K into plagioclase with K0 as the dominant gas species. Given an activity coefficient of 35 from the lattice strain model at 700 K however, KAlSi3O8 should exsolve from plagioclase at lower temperature. Cs and Rb will then condense into sanidine. We modeled the properties of Rb and Cs feldspar by assuming that the log K of formation of RbAlSi3O8 minus that of KAl-Si3O8 and of CsAlSi3O8 minus KAlSi3O8 are the same as the differences in log K of formation of RbO0.5 minus KO0.5 and of CsO0.5 minus KO0.5. Then we used the lattice strain model data (Blundy and Wood 1994) to calculate activity coefficients for dissolution into sanidine. This yields T50 values of 752 K for Rb and 593 K for Cs.
The dominant gas species of Li close to the condensation temperature is LiCl. We used the orthopyroxene-liquid parti-tion coefficient data (Frei et al. 2009) to estimate an activity coefficient of ~5. Assuming that Li dissolves in pyroxene as Li2SiO3, we obtain T50 of 1148 K. If we were to treat Li4SiO4 dissolution into olivine in a similar manner, we would obtain a lower condensation temperature. According to the partition-ing data of Frei et al. (2009) Mn2+ fits into the M2 site of orthopyroxene without strain (g = 1.0) and will fit into the M1 site with an activity coefficient of 1.5 at 1673 K. Given the close approach to ideality and DMn (liquid/crystal) values close to 1.0 (Laubier et al. 2014; Le Roux et al. 2015) for both orthopyroxene and olivine we assumed that Mn mixes ideally in olivine and Mg-pyroxene during condensation. We obtain virtually identical temperatures for condensation into pyrox-ene and olivine (1123 K). This is reduced by 11 K if we make explicit provision for the small nonidealities mentioned above.
In the low-temperature region of interest B2O3 is calculated to be the most stable form of B in both gas and solid phases and, assuming, following Lodders (2003), that B replaces Al in plagioclase feldspar, then, if the solution is ideal, we obtain T50 of 740 K.
diScuSSion
The results of our calculations are given in Table 1 together with a summary of the activity coefficient expressions discussed
above. Figure 4 shows silicate Earth abundances of the elements plotted, in the same manner as in Figure 1, vs. the T50 condensa-tion temperatures generated in this study. One might argue that, with the exception of the elements S, Se, and Te, the “volatility trend” is better defined by our results than by those of Lodders (2003). This would require either the “eye of faith” or a statisti-cal analysis that we do not consider worth performing, since there is no physical or chemical reason we are aware of that the volatile elements should all fall on the same line in a plot of this kind. Planetary and protoplanetary processes such as melt-ing, core formation, and silicate differentiation must obviously have exerted considerable influence on the final abundances of elements in silicate Earth.
Figure 5a shows the differences between our values of T50 and those of Lodders (2003). As can be seen, agreement is good for the relatively refractory elements that condense above 1300 K. Principal differences are found at temperatures below 900 K where we find Cl-species stable in the gas phase and strong nonidealities in the solid phases for most elements. Both these effects reduce condensation temperature leading to a positive difference between Lodders’ condensation temperatures and ours.
implicationS and concluding remarKS
We have attempted to update the generally accepted equi-librium condensation temperatures of Lodders (2003) by mak-ing what we believe are realistic assumptions about activity coefficients for trace elements dissolved in the major phases, Fe, FeS, pyroxene, olivine, and plagioclase. In the course of this re-analysis, we also found based on reversed phase-equilibrium experiments (Sharp et al. 1989) that the stability of sodalite during the condensation sequence is much lower than was proposed in the earlier study. This means that the T50 temperature for Cl is 472 K rather than 948 K. The presence of significant amounts of cosmochemically abundant Cl (as HCl) in the gas phase between 1000 and 400 K stabilizes gaseous chlorides such as KCl, RbCl, CsCl, GaCl, TlCl, and InCl and
figure 4. Abundances of elements in the silicate Earth, relative those in CI chondrites (Palme and O’Neill 2014), normalized to Mg = 1.0, plotted vs. the calculated temperatures (this work) at which 50% of each element would be condensed from a gas of solar composition at 10-4 bar. Cl, Br, I abundances in chondrites from Clay et al (2017).
10-3
10-2
10-1
100
101
300 700 900 1100 1300 1500 1700 1900
Abu
ndac
e/CI
Cho
ndrit
e
50% Condensation Temperature
SSe
Au
W
Rh PtRu
IrOsRe
Li
Mo
VCr
FeCo Ni
PCu
As
AgSb
Cl
GeTlCd
Pb
ZnCs
RbF
Na
GaK
Pd
SiMg
Mn
VolatileLithophile
Refractory Lithophile
VolatileSiderophile
RefractorySiderophile
Highly Siderophile
REE, U, Th
In
Nb
Br
Sn
Te
Al
Zr
TiBe, Sr,Sc, Ca,
Ta
HfBa
Bi
B
500
I
Figure 4

WOOD ET AL.: THE CONDENSATION TEMPERATURES OF THE ELEMENTS854
American Mineralogist, vol. 104, 2019
-300
-200
-100
0
100
200
300
400
500
600T 5
0 Di�
eren
ce (K
)(L
odde
rs, 2
003
- Thi
s St
udy)
AuPt Ir
Os
Re
Rh
PdRu
I
1100 1600
EuBe
MgAl
Si Ca
Sr
Y
Ta ZrBa
LaNd
Sm
Yb Hf
U
Sc
CeTi
NbNa
Br
Cl
ZnIn
Rb
Cs
F
Li
B
O K
300 600 900 400 700 1000 1400 1700
WV
CrNi
Mo
Fe
Co
P
Hg Te
Tl
As
Se
Bi
Pb
GaS
CuGe
Ag
CdSb
SnMn
1400 1500 1600 1700
Gd, Tb, Dy,Ho, Er, Tm,Lu, Th
Pr
-300
-200
-100
0
100
200
300
400
500
T 50 D
i�er
ence
(K)
(Was
son,
198
5 - T
his
Stud
y)
Au
Pt Ir
Os
Re
RhPd
Ru
1100 1600
Eu
Mg Al
SiCa
YTa
Zr
La
Nd
SmYb
Hf
U
Sc
Ce
TiNb
Na
Br
Cl
ZnIn
Rb
F
Li
K
300 600 900 400 700 1000 1400 1700
WV
Cr Ni
Mo
Fe Co
P
TeTl
As
SeBi
Pb
Ga
SCu
Ge
Ag
Cd
Sb
Sn Mn
1400 1500 1600 1700
TbPr Dy, Ho
Gd, Tm, Th
LuEr
VolatileLithophile
VolatileSiderophile
RefractoryLithophile
RefractorySiderophile
HighlySiderophile
T50 (K) This Study
a.
b.
Figure 5a,b
figure 5. A comparison of our results for 50% condensation temperatures of the elements (T50) to those of (a) Lodders (2003) and (b) Wasson (1985). Principal differences arise for the volatile elements because of the stabilities of Cl complexes in the gas phase and the nonidealities of trace elements in Fe(metal) and iron sulfide (see text).
lowers condensation temperatures for these minor elements.One important point to note is that some earlier authors
(Larimer 1967; Grossman 1972; Grossman and Larimer 1974; Wai and Wasson 1979) made solid solution assumptions and used gaseous species that are similar to the ones we find to be most appropriate. Hence their results are often similar to ours, as can be seen in Figure 5b and Table 2. These authors only studied small subsets of the periodic table, however, and the more re-cent all-encompassing study of Lodders (2003) has superseded their work in the minds of most geochemists. We believe that
our critique and discussion here will provide more context for condensation results and give the reader some idea of where there are significant uncertainties or errors in the calculations.
In conclusion, we must recognize that it is impossible to generate a list of exact condensation temperatures of the elements from a solar gas. There are uncertainties in solar abundances, uncertainties in the thermodynamic data that we use and, at low temperatures at least, in the assumption that perfect equilibrium is maintained and that all stable solids have been considered. However, given the equilibrium assumption, we do assert that

WOOD ET AL.: THE CONDENSATION TEMPERATURES OF THE ELEMENTS 855
American Mineralogist, vol. 104, 2019
we have a robust list. We await with interest future updates and comments on our work.
acKnoWledgmentS and fundingThis work would have been much more arduous if John Wood had not provided
B.J.W. with the source code and database for PHEQ about 25 yr ago. He is grate-fully acknowledged. T.H. commenced this work as a fourth year undergraduate project. We received funding from the European Research Council grant 267764 and from the Natural Environment Research Council (U.K.) grant NE/M000427/1 and 000370/1. We acknowledge with thanks the detailed and constructive reviews of Andrew Davis, Denton Ebel, Mikhail Petaev, and Laura Schaefer, particularly the fact that the last two reviewers repeated and checked some of our calculations. Any remaining errors and omissions are of course entirely our responsibility.
referenceS citedArita, M., Tanaka, M., Goto, K.S., and Someno, M. (1981) Activity and diffusivity
measurements of copper in gamma and delta Fe by equilibration between solid Fe and liquid Ag. Metallurgical and Materials Transactions A, 12, 497–504.
Barin, I., Sauert, F., Schultze-Rhonhof, E., and Sheng, W.S. (1989) Thermo-chemical data of pure substances, Part I and Part II. CH Verlagsgesellschaft, Weinheim, Germany.
Battat, D., Faktor, M.M., Garrett, I., and Moss, R.H. (1974) Modified entrain-ment method for measuring vapor-pressures and heterogeneous equilibrium-constants. 2. Equilibria in water-gallium system. Journal of the Chemical Society—Faraday Transactions, 70, 2280–2292.
Blundy, J.D., and Wood, B.J. (1994) Prediction of crystal–melt partition coefficients from elastic moduli. Nature, 372, 452–454.
Boa, D., Hassam, S., Krac, G., Kotchi, K.P., and Rogez, J. (2008) The ternary bismuth-iron-antimony system: Experimental phase diagram study and ther-modynamic evaluation. Calphad—Computer Coupling of Phase Diagrams and Thermochemistry, 32, 227–239.
Boom, R., De Boer, F.R., Niessen, A.K., and Miedema, A.R. (1983) Enthalpies of formation of liquid and solid binary alloys based on 3d metals III. Alloys of Iron. Physica B, 115B, 285–309.
Brice, J.C. (1975) Some thermodynamics aspects of the growth of strained crystals. Journal of Crystal Growth, 28, 249–253.
Chase, M.W. Jr., Davies, C.A., Downey, J.R. Jr., Frurip, D.J., McDonald, R.A., and Syverud, A.N. (1985) JANAF Thermochemical Tables Third Edition. Journal of Physical and Chemical Reference Data 14, Supplement 1, 1856 pp.
Clay, P.L., Burgess, R., Busemann, H., Ruzie-Hamilton, L., Joachim, B., Day, J.M.D., and Ballentine, C.J. (2017) Halogens in chondritic meteorites and terrestrial accretion. Nature, 551, 614–618.
Corgne, A., and Wood, B.J. (2005) Trace element partitioning and substitution mechanisms in calcium perovskites. Contributions to Mineralogy and Petrol-ogy, 149, 85–97.
Cruz, F., da Piedade, M.E.M., and Calado, J.C.G. (2005) Standard molar enthal-pies of formation of hydroxy-, chlor-, and bromapatite. Journal of Chemical Thermodynamics, 37, 1061–1070.
Davis, A.M., Zhang, J., Greber, N.D., Hu, J., Tissot, F.L.H., and Dauphas, N. (2018) Titanium isotopes and rare earth patterns in CAI’s: Evidence for thermal processing and gas-dust decoupling in the protoplanetary disk. Geochimica et Cosmochimica Acta, 221, 275–295.
Dreibus, G., and Palme, H. (1996) Cosmochemical constraints on the sulfur con-tent in the Earth’s core. Geochimica et Cosmochimica Acta, 60, 1125–1130.
Drouet, D. (2015) A comprehensive guide to experimental and predicted thermody-namic properties of phosphate apatite minerals in view of applicative purposes. Journal of Chemical Thermodynamics, 81, 143–159.
Evans, N.J., Dunham, M.M., Jorgensen, J.K., Enoch, M.L., Merin, B., van Dishoeck, E.F., Alcala, J.M., Myers, P.C., Stapelfeldt, K.R., Huard, T.L., and others. (2009) The Spitzer c2d Legacy results: star-formation rates and efficiencies; evolution and lifetimes. The Astrophysical Journal Supplement Series, 181, 321–350.
Ferro, D., Piacente, V., and Scardala, P. (1989) Vaporization enthalpies of black and red mercury sulfides and their heat of transition from vapor-pressure measurements. Journal of the Less-Common Metals, 147, 1–8.
Fleet, M.E. (1975) Thermodynamic properties of (Zn,Fe)S solid solutions at 850 °C. American Mineralogist, 60, 466–470.
Frei, D., Liebscher, A., Franz, G., Wunder, B., Klemme, S., and Blundy, J. (2009) Trace element partitioning between orthopyroxene and anhydrous silicate melt on the lherzolite solidus from 1.1 to 3.2 GPa and 1,230 to 1,535 °C in the model system Na2O–CaO–MgO–Al2O3–SiO2. Contributions to Mineralogy and Petrology, 157, 473–490.
Glushko, V.P., Gurvich, L.V., Bergman, G.A., Veitz, I.V., Medvedev, V.A., Khach-kuruzov, G.A., and Jungman, V.S. (1978) Thermodynamic Properties of Pure Substances, 3rd ed. Nauka Publishers.
Grimsey, E.J., and Biswas, A.K. (1977) The activity of iron in low-iron liquid (Ni + Au + Fe) and solid (Ni + Fe) alloys at 1573 K. The Journal of Chemical
Thermodynamics, 9, 415–422.Grønvold, F., and Stølen, S. (1992) Thermodynamics of iron sulfides II. Heat
capacity and thermodynamic properties of FeS and of Fe0.875S at temperatures from 298.15 K to 1000 K, of Fe0.98S from 298.15 K to 800 K, and of Fe0.89S from 298.15 K to about 650 K. Thermodynamics of formation. Journal of Chemical Thermodynamics, 24, 913–936.
Grossman, L. (1972) Condensation in the primitive solar nebula. Geochimica et Cosmochimica Acta, 36, 597–619.
Grossman, L., and Larimer, J.W. (1974) Early chemical history of the solar-system. Reviews of Geophysics, 12, 71–101.
Hari Kumar, K.C., Wollants, P., and Delaey, L. (1996) Thermodynamic evaluation of the Fe-Sn phase diagram. Calphad, 20, 139–149.
Hashimoto, A. (1992) The effect of H2O gas on volatilities of planet-forming major elements: I. Experimental determination of thermodynamic properties of Ca-, Al- and Si-hydroxide gas molecules, and its application to the solar nebula. Geochimica et Cosmochimica Acta, 56, 51l–532.
Hino, M., Nagamori, M., and Toguri, J.M. (1986) Thermodynamics of gaseous SbS. Metallurgical Transactions B, 17, 913–914.
Hovis, G.L., and Harlov, D.E. (2010) Solution calorimetric investigation of fluor-chlorapatite crystalline solutions. American Mineralogist, 95, 946–952.
Kiseeva, E.S., and Wood, B.J. (2013) A simple model for chalcophile element partitioning between sulphide and silicate liquids with geochemical applica-tions. Earth and Planetary Science Letters, 383, 68–81.
Knacke, O., Kubaschewski, O., and Hessemann, K. (1991) Thermochemical Proper-ties of Inorganic Substances, 2nd ed., vol. I & II. Springer, Berlin.
Komada, N., Westrum, E.F., Hemingway, B.S., Zolotov, M.Y., Semenov, Y.V., Khodakovsky, I.L., and Anovitz, L.M. (1995) Thermodynamic properties of sodalite at temperatures from 15 K to 1000 K. Journal of Chemical Thermo-dynamics, 27, 1119–1132.
Konings, R.J.M., Benes, O., Kovacs, A., Manara, D., Sedmidubsky, D., Gorokhov, L., Iorish, V.S., Yungman, V., Shenyavskaya, E., and Osina, E. (2014) The thermodynamic properties of the f-elements and their compounds. Part 2. The lanthanide and actinide oxides. Journal of Physical and Chemical Refer-ence Data, 43.
Kumar, R.V., and Kay, D.A.R. (1985) The utilization of galvanic cells using Ca β-alumina solid electrolytes in a thermodynamic investigation of the CaO-Al2O3 system. Metallurgical Transactions, 16B, 107–112.
Kusaba, K., Syono, Y., Kikegawa, T., and Shimomura, O. (1997) The structure of FeS under high pressure. Journal of Physics and Chemistry of Solids, 241–246.
Larimer, J.W. (1967) Chemical fractionations in meteorites-I. Conensation of ele-ments. Geochimica et Cosmochimica Acta, 31, 1215–1238.
Laubier, M., Grove, T.L., and Langmuir, C.H. (2014) Trace element mineral/melt partitioning for basaltic and basaltic andesitic melts: An experimental and laser ICP-MS study with application to the oxidation state of mantle source regions. Earth and Planetary Science Letters, 392, 265–278.
Lauretta, D.S., Kremser, D.T., and Fegley, B.J. (1996) The rate of iron sulfide formation in the solar nebula. Icarus, 122, 288–315.
Le Roux, V., Dasgupta, R., and Lee, C.T.A. (2015) Recommended mineral-melt partition coefficients for FRTEs (Cu), Ga, and Ge during mantle melting. American Mineralogist, 100, 2533–2544.
Lewis, J.S., and Prinn, R.G. (1980) Kinetic inhibition of CO and N2 reduction in the solar nebular. The Astrophysical Journal, 238, 357–364.
Lodders, K. (1999) Revised thermochemical properties of phosphinidene (PH), phosphine (PH3), phosphorus nitride (PN) and magnesium phosphate (Mg3P2O8). Journal of Physical and Chemical Reference Data, 28, 1705–1712.
——— (2003) Solar system abundances and condensation temperatures of the elements. The Astrophysical Journal, 591, 1220–1247.
——— (2004) Revised and updated thermochemical properties of the gases mer-capto (HS), disulfur monoxide (S2O), thiazyl (NS), and thioxophosphino (PS). Journal of Physical and Chemical Reference Data, 33, 357–367.
Mel’chakova, L.V., Ogorodova, L.P., and Kiseleva, I.A. (2004) The enthalpy of formation and heat capacity of phlogopite. Russian Journal of Physical Chemistry, 78, 860–863.
Miedema, A.R., De Chatel, P.F., and De Boer, F.R. (1980) Cohesion in alloys—Fundamentals of a semi-empirical model. Physica, 100B, 1–28.
Mills, K.C. (1974) Thermodynamic data for Inorganic Sulphides, Selenides and Tellurides. Butterworths, London.
Nagasawa, H., Schreiber, H.D., and Morris, R.V. (1980) Experimental mineral-liquid partition-coefficients of the rare-earth elements (REE), Sc and Sr for perovskite, spinel and melilite. Earth and Planetary Science Letters, 46, 431–437.
Orville, P.M. (1972) Plagioclase cation exchange equilibria with aqueous chloride solution at 700°C and 2000 bars in the presence of quartz. American Journal of Science, 272, 234–272.
Palme, H., and O’Neill, H.St.C. (2014) Cosmochemical Estimates of Mantle Composition, Treatise on Geochemistry, vol. 3, 2nd ed. Elsevier, pp. 1–39.
Pedley, J.B., and Marshall, E.M. (1983) Thermochemical data for gaseous mon-oxides. Journal of Physical and Chemical Reference Data, 12, 967–1031.
Pei, B.Y., Bjorkman, B., Jansson, B., and Sundman, B. (1994) Thermodynamic

WOOD ET AL.: THE CONDENSATION TEMPERATURES OF THE ELEMENTS856
American Mineralogist, vol. 104, 2019
assessment of the Fe-As system using as ionic 2-sublattice model for the liquid-phase. Zeitschrift für Metallkunde, 85, 171–177.
Pei, B.Y., Bjorkman, B., Sundman, B., and Jansson, B. (1995) A thermodynamic assessment of the iron—antimony system. Calphad-Computer Coupling of Phase Diagrams and Thermochemistry, 19, 1–15.
Petaev, M.I. (2009) The GRAINS thermodynamic and kinetic code for modeling nebular condensation. Calphad, Computer Coupling of Phase Diagrams and Thermochemistry, 33, 317–327.
Predel, B., and Vogelbein, W. (1975) Thermodynamische untersuchung der systeme eisen-gallium und kobalt-gallium. Thermochimica Acta, 13, 133–145.
——— (1979) Bildungsenthalpien fester legierungen der binären systeme des eisens, kobalts und nickels mit germanium und zinn. Thermochimica Acta, 30, 201–215.
Righter, K., Hervig, R.L., and Kring, D.A. (1998) Accretion and core formation on Mars: Molybdenum contents of melt inclusion glasses in three SNC meteorites. Geochimica et Cosmochimica Acta, 62, 2167–2177.
Robie, R.A., Hemingway, B.S., and Fisher, J.R. (1978) Thermodynamic properties of minerals and related substances at 298.15 K and 1 bar (105 Pascals) pres-sure and at higher temperatures. U.S. Geological Survey, Washington, D.C.
Roszjar, J., Whitehouse, M.J., Srinivasan, G., Mezger, K., Scherer, E.E., Van Or-man, J.A., and Bischoff, A. (2016) Prolonged magmatism on 4 Vesta inferred from Hf-W analyses of eucrite zircon. Earth and Planetary Science Letters, 452, 216–226.
Schwarz, U. (2002) Crystal structure of indium monosulfide, InS, at 7.9 GPa. Zeitschrift für Kristallographie—New Crystal Structures, 217, 470–470.
Schwarz, U., Hillebrecht, H., and Syassen, K. (1995) Effect of hydrostatic pressures on the crystal structure of InS. Zeitschrift für Kristallographie, 210, 494–497.
Shannon, R.D. (1976) Revised ionic radii and systematic studies of interatomic distances in halides and chalcogenides. Acta Crystallographica, A32, 751–767.
Sharp, Z.D., Helffrich, G.R., Bohlen, S.R., and Essene, E.J. (1989) The stability of sodalite in the system NaAlSiO4-NaCl. Geochimica et Cosmochimica Acta, 53, 1943–1954.
Skulan, A., Nielsen, I., Melius, C., and Allendorf, M. (2006) BAC-MP4 predictions of thermochemistry for gas-phase indium compounds in the In-H-C-O-Cl system. The Journal of Physical Chemistry A, 110, 281–290.
Steelmaking Data Sourcebook (1988) Gordon and Breach, New York 325 pp. https://openlibrary.org/books/OL2372294M/Steelmaking_data_sourcebook
Stormer, J.C., and Carmichael, I.S.E. (1971) The free energy of sodalite and
the behavior of chloride, fluoride and sulfate in silicate magmas. American Mineralogist, 56, 292–306.
Vijay, A., and Verma, T.S. (2000) Analysis of temperature dependence of elastic constants and bulk modulus for ionic solids. Physica B, 291, 373–378.
Wai, C.M., and Wasson, J.T. (1979) Nebular Condensation of Ga, Ge and Sb and the Chemical Classification of Iron-Meteorites. Nature, 282, 790–793.
Wasson, J.T. (1985) Meteorites, Their Record of Early Solar-system history. W.H. Freeman, New York.
Witt-Eickschen, G., Palme, H., O’Neill, H.St.C., and Allen, C.M. (2009) The geo-chemistry of the volatile trace elements As, Cd, Ga, In and Sn in the Earth’s mantle: New evidence from in situ analyses of mantle xenoliths. Geochimica et Cosmochimica Acta, 73, 1755–1778.
Wood, B.J. (1993) Carbon in the core. Earth and Planetary Science Letters, 117, 593–607.
Wood, J.A., and Hashimoto, A. (1993) Mineral equilibrium in fractionated nebular systems. Geochimica et Cosmochimica Acta, 57, 2377–2388.
Wood, B.J., Walter, M.J., and Wade, J. (2006) Accretion of the Earth and segrega-tion of its core. Nature, 441, 825–833.
Wood, B.J., Kiseeva, E.S., and Mirolo, F.J. (2014) Accretion and core formation: The effects of sulfur on metal-silicate partition coefficients. Geochimica et Cosmochimica Acta, 145, 248–267.
Wriedt, H.A., Morrison, W.B., and Cole, W.E. (1973) Solubility of silver in γ-Fe. Metallurgical Transactions, 4, 1453–1456.
Zaitsev, A.I., Dobrokhotova, Z.V., Litvina, A.D., and Mogutnov, B.M. (1995) Thermodynamic properties and phase equilibria in the Fe-P system. Journal of the Chemical Society, Faraday Transactions, 91, 703–712.
Manuscript received OctOber 19, 2018Manuscript accepted March 15, 2019Manuscript handled by dOn baker
Endnote:1Deposit item AM-19-66852, Supplemental Table. Deposit items are free to all readers and found on the MSA website, via the specific issue’s Table of Con-tents (go to http://www.minsocam.org/MSA/AmMin/TOC/2019Jun2019_data/Jun2019_data.html).