the composition of english further education corporations
TRANSCRIPT

The Composition of English Further Education Corporations and College Governance Frameworks A report on the Association of Colleges’ survey of FE corporations 6 May 2014

The Composition of English Further Education Corporations and College Governance Frameworks A report on the Association of Colleges’ survey of FE corporations Author: Brian Godbold (Godbold Consultancy) 6 May 2014 CONTENTS Pages Executive Summary: 1-5
Part 1: The results on the composition of corporations 6-15 Size of corporations and types of governors
(Questions 8&10) Vacancies (Question 9) Gender (Question 12) Age of governors (Question 13)
Ethnicity (Question 16) Disabilities (Question 15) Governors’ professional and work backgrounds (Question 11)
Public positions (Question 14) Part 2: The results on governance frameworks 16-22 Number of committees (Question 7) Terms of office for governors (Question 3&4) Appointment of chair & current terms of office
(Questions 5&6) Amending the Instrument and Articles of Government (Question 1)
More complex business models (Question 2)
Part 3: The methodology 23-25
Appendix 1: Terminology 26-28 Appendix 2: Survey questions and format 29-33 Appendix 3: Data tables (published separately)

AoC Report: The Composition of English Further Education Corporations and College Governance Frameworks
1
The Composition of English Further Education Corporations and College Governance Frameworks Executive Summary Introduction
1. This is a high-level summary showing the key findings of the AoC survey covering
the composition of English Further Education (FE) college corporations and
governance frameworks. The report gives more detailed information on all the
findings in a form that will facilitate benchmarking individual colleges.
2. The results of the survey cover 183 colleges who use the standard Instrument and
Articles of Government to underpin their governance frameworks. This number of
respondents represents 56% of English Further Education (FE) colleges and covers
some 3258 governors’ positions. On the basis of this, a simple extrapolation shows
that overall there are currently just under 6,000 governors appointed to corporations
in English FE colleges.
3. While some terms for types of governors are defined within the Instrument and
Articles of Government and supporting documents, others are not. For convenience,
this report has adopted the terms and descriptors most commonly used across the
college sector.
Size of corporations
4. A typical corporation in an English general further education college (GFEC) is made
up of 17 governors. These include one executive governor (the Principal) and 16
non-executive governors: two student governors, two staff governors and twelve
independent/external governors. A typical Sixth Form College (SFC) corporation
also includes a parent governor, increasing the overall size of their corporation to 18.
5. Figure 3 in the report (shown below) shows that the smallest corporation responding
to the survey was a GFEC with 11 governors. Just under a quarter of colleges (23%)
have corporations set at 20, the maximum under the un-modified Instrument and
Articles of Government.

AoC Report: The Composition of English Further Education Corporations and College Governance Frameworks
2
The size of corporations in the College Sector
6. The smallest corporation of 11 (a GFEC) included the Principal, two student
governors, one staff governor and seven independent/external governors. The
smallest SFC corporation has an overall membership of 12: the Principal, two
student, one parent and two staff governors and just six independent/external
governors.
Co-opted members
7. Thirty percent of colleges (56 colleges in the survey) have at least one co-opted
governor. Eight percent (14 colleges) have three or more co-opted governors. Most
co-opted governors are not members of the corporation and are appointed to support
committees only.
Terms of office for governors
8. Seventy-six percent of colleges set a four year term of office for governors. Fifty-five
percent of colleges set an overall limit for the terms of office of governors.
Number of committees
9. A typical English college has five standing committees which support the
corporation. Only two percent of respondents (3 colleges) have no standing
committees other than the mandatory audit committee. Over a quarter of colleges
(27%) operate through six or more standing committees (including 23% of GFECs
and 39% of SFCs).

AoC Report: The Composition of English Further Education Corporations and College Governance Frameworks
3
Governors’ professional and work backgrounds
10. Around one in four independent/external governors (26%) currently work or have
worked in the education sector. The next biggest source for independent/external
governors is finance, which provides around one in six (18%). These two business
areas are followed by HR and Law, which each make up the background for around
7% of independent/external governors.
11. A typical corporation of 12 independent/external governors would therefore include
three with an education background, two with a finance background, one with a
legal and one with an HR background.
Public positions held by governors
12. Just under half of corporations (49%) have at least one governor who is a local
councillor and just under a third (31%) have at least one governor who is either a
board or committee member at a Local Enterprise Partnership. Two colleges
reported having a governor who is a Member of Parliament.
Vacancies
13. At the time of the survey, over half of the colleges (52%) had at least one vacancy for
an independent/external governor and 29% had at least two vacancies. Twenty
colleges (11%) had three or more vacancies (17 GFECs and 3 SFCs) for
internal/external governors.
14. The average vacancy rate across the college sector for all governors was 9%
(representing around two governors in a typical corporation) but this included a
vacancy rate of student governors and parent governors of 24% and 20%
respectively. These relatively high vacancy rates for student governors and parent
governors may reflect the timing of the survey, which was undertaken in early
October 2013, and the fact that appointment processes for the appointment of new
student and parent governors were underway at that time.
Gender
15. Just over six out of ten governors (62%) are male and just under four out of ten (38%)
are female.

AoC Report: The Composition of English Further Education Corporations and College Governance Frameworks
4
Age of governors
16. The survey provides a picture of the age of governors on corporations. The majority
of governors (60%) are between 45 and 64 years of age. Fourteen percent are aged 65
years or more.
Ethnicity
17. The survey shows a national and regional snapshot of corporations. Eighty-eight
percent of governors are white British with another three percent with white
backgrounds. Four percent of governors have a Black African, Black Caribbean or
Other Black background, and Indian, Pakistani and British Asian backgrounds
account for 3% of governors.
Disabilities
18. Colleges were asked whether any of their governors assess themselves as disabled.
Three percent of governors in the colleges that responded to this question assessed
themselves as disabled.
Appointment of chair
19. Fifty-six percent of colleges elect their chair at least every two years (28% elect the
chair annually and 28% every two years). A very small number of colleges (7 in total
representing 4% of respondents) said they had no fixed term for their chair.
20. Figure 20 in the report (shown below) shows 17% of chairs have been in post for less
than one year. Forty-four percent have been in post for two years or less. Twelve
percent of chairs have been in post for eight or more years.

AoC Report: The Composition of English Further Education Corporations and College Governance Frameworks
5
How long has your current chair been in place
Period chair has
been in post
No of
colleges %
Less than 1 year 31 17%
1 to less than 2
years 49 27%
2 to less than 3
years 25 14%
3 to less than 4
years 15 8%
4 to less than 5
years 9 5%
5 to less than 6
years 18 10%
6 to less than 7
years 4 2%
7 to less than 8
years 9 5%
8 to less than 9
years 4 2
9 to less than 10
years 3 2%
10 or more years 15 8%
Vacancy 1 1%
Total colleges 183 100%
Amending the Instrument and Articles of Government
21. Just over half of colleges (51%) told us they have, or have decided, to use the new
freedoms in the 2011 Education Act to amend their Instrument and Articles of
Government. A further 29% of respondents who have not proposed any changes so
far, said they may make changes during the academic year 2013/14.
More complex business models
22. Eleven percent of colleges classify themselves as operating within a group structure
(13% of GFECs and 6% of SFCs). Twenty-three percent sponsor either an academy,
free school, UTC or studio school.

AoC Report: The Composition of English Further Education Corporations and College Governance Frameworks
6
Part 1: The results on the composition of corporations
23. The results cover 183 English FE colleges and provide information on some 3258
governors’ positions, including vacancies. On the basis of this, a straightforward
extrapolation shows that overall there are currently some 6,000 governors appointed
to corporations in English FE colleges1.
Figure 1: Number and type of governor by region
Region
Type of Governor All
Governors Student Staff Parent Executive Independent/
External
Co-
opted
Eastern 30 30 4 15 186 10 275
East
Midlands 31 27 1 16 197 8 280
London 39 38 6 20 250 12 365
North East 19 19 3 10 119 4 174
North West 60 57 7 31 363 21 539
South East 59 60 12 33 377 36 577
South West 36 34 4 18 229 6 327
West
Midlands 38 38 2 20 241 13 352
Yorkshire &
Humberside 40 39 7 20 250 13 369
Total2 352 342 46 183 2212 123 3258
Size of corporations
24. The data shows that, a typical corporation in an English general further education
college (GFEC) is made up of 17 governors. These include one executive governor
(the Principal) and 16 non-executive governors: two student governors, two staff
governors and twelve independent/external governors. A typical Sixth Form
College (SFC) corporation includes a parent governor, increasing the overall size of
their corporation to 18.
1 This extrapolation is based on an overall (all colleges) response rate of 56% applied to all governors (including
co-opted governors). 2 180 colleges provided full information on the types of governors who make up their corporation and
committees.

AoC Report: The Composition of English Further Education Corporations and College Governance Frameworks
7
25. Figure 2 shows the average size of a GFEC is 17.3 governors and an SFC 18.1
governors.
Figure 2: Average size of corporations
Average number of governors on corporations
Type of college
College
Sector Non-SFCs3 GFECs SFCs A&HCs AD&PAs
Average
17.5 17.4 17.3 18.1 18.5 18
26. As figure 3 shows, the smallest corporation responding to the survey was a GFEC
with 11 governors. This included the Principal, two student governors, one staff
governor and seven independent/external governors. The smallest SFC corporation
had just six independent/external governors making the overall membership of 12.
Just under a quarter of colleges (23%) have corporations set at 20, the maximum
under the un-modified Instrument and Articles of Government.
Figure 3: The size of corporations in the college sector
27. Figures 4 and 5 show the size of Corporations for GFECs and SFCs respectively.
3 Non-SFCs represent the college sector excluding SFCs and as such represents colleges regulated by the
Department for Business Innovation and Skills and the Skills Funding Agency.

AoC Report: The Composition of English Further Education Corporations and College Governance Frameworks
8
Figure 4: The size of GFEC corporations
Figure 5: The size of SFC corporations
28. In assessing the size of corporations we have taken into account the position of co-
opted governors (see paragraph 38 below).
Executive governors
29. Under the unmodified Instrument and Articles of Government for FE colleges, a
Principal can (if they wish) choose to be a member of the corporation. We found that

AoC Report: The Composition of English Further Education Corporations and College Governance Frameworks
9
all the Principals in our survey took up the opportunity to be an executive governor4,
which is the term used in this report to describe their position.
30. In addition, three GFECs reported that they had modified their Instruments and
Articles to provide for two executive governor positions. That is the Principal and
one other member of the senior management team. On the face of it, therefore this
may indicate that there are currently 5 or 6 such arrangements across the Engish
college sector.
Independent/external governors
31. This report has adopted the term independent or external governor5 to define a
college governor who is not a student governor, staff governor, parent governor or
executive governor. Though they constitute the largest type of non-exective governor
on a corporation they have not been given a distinctive label in the umodified
Instrument and Articles of Government for FE colleges6. The term business or
employer governors is also sometimes used.
32. The survey collected information on the number of “business and employer
governors” and separately on those categorised as “other governors”7. Forty-seven
percent (47%) of colleges used the term “business and employer governor”
exclusively and 38% classified them all as “other governor”. Fifteen percent of
colleges spread their governors across both headings.
33. The survey collected data on 2212 independent/external governors (1229
business/employer governors and 983 other governors. The mean average number of
governors in colleges was 12.3 and figure 6 shows the mean average across the types
of college.
Figure 6: Average number of independent/external governors on corporations
4 Also referred to as ex-officio governor or member.
5 Independent or external governor is the most commonly used term to describe this type of governor
in English FE colleges. 6 The term independent/external governor is used in the 2013 Joint Audit Code of Practice
7 “Other governors” being non-executive governors not being categorised as student, staff, parent or
business/ employer governors

AoC Report: The Composition of English Further Education Corporations and College Governance Frameworks
10
34. Figure 7 shows the number of independent/external governors on corporations in terms of the percentage number of colleges responding to the survey. The minimum number of independent/external governors in any one college is six and the maximum number is sixteen. Twenty-one percent of colleges have 13 independent/external governors and 27% fourteen or more. Figure 7: The number of independent/external governors on corporations
Student governors 35. Ninety-three percent of corporations have two student governors. Six percent (all
GFECs) have just one student governor and 1% have three (GFECs). All the SFCs and A&HCs have two student governors.
Staff governors 36. Eighty-four percent of corporations have two staff governors, 13% have one staff
governor and 3% three staff governors. Figure 8 shows the percentage of colleges with the number of staff governors on their corporations.
Average number of independent/external governors on corporations
Type of college
College
Sector Non-SFCs GFECs SFCs A&HCs
Average
12.3 12.5 12.3 11.5 13.6

AoC Report: The Composition of English Further Education Corporations and College Governance Frameworks
11
Figure 8: The percentage of staff governors on the corporation by type of college
Parent governors 37. Thirty-six colleges in the survey appointed parent governors: all 33 SFCs, two GFECs
and one A&HC. Seventy-two percent of the SFCs (24 colleges) appointed one parent governor and 27% of SFCs (9 colleges) appointed two parent governors.
Co-opted governors
38. Thirty percent of colleges (56 colleges in the survey) have at least one co-opted
governor. Eight percent (14 colleges) have three or more co-opted members. Most
co-opted governors are not members of the corporation and are appointed to support
committees only.
39. The AoC survey did not spefically ask respondents to differentiate between those co-
opted governors who are on the corporation and those that are not. It was possible
however, by cross-checking data within responses and on occasion seeking
clarification directly, to assess that only eight colleges’ co-opted governors were
corporation members (relating to 17 governors in all). This represents just four
percent of colleges overall8. Vacancies
40. As figure 9 shows, the average vacancy rate across the college sector for all governors
at the time of the survey was 9% (representing around two governors in a typical
corporation) but this included a vacancy rate of student governors and parent
governors of 24% and 20% respectively. These relatively high vacancy rates for
student governors and parent governors may reflect the timing of the survey, which
was undertaken in early October 2013, and the fact that appointment processes for
the appointment of new student and parent governors were underway at that time.
8 This estimate is in line with the ACER 2012 survey which found that 3% of colleges in the Eastern Region
appointed co-opted governors to their corporations.
Type of College
No. of Staff
Governors
1 2 3
College Sector 13% 84% 3%
Non-SFCs 14% 84% 3%
SFCs 9% 88% 3%
GFECs 13% 85% 2%
A&HCs 27% 73% 0%

AoC Report: The Composition of English Further Education Corporations and College Governance Frameworks
12
Figure 9: Vacancy rates in corporations
41. Over half the colleges (52%) had at least one vacancy for an independent/external
governor and 29% had at least two vacancies. Eleven percent had three or more
vacancies (17 GFECs and 3 SFCs) for internal/external governors.
Gender
42. Just over six out of ten governors (62%) are male and just under four out of ten (38%)
are female. This is in line with the FE Women’s Leadership Network’s findings from
their 2012 survey, which showed that 65% of governors were male. The AoC survey
did not differentiate gender between types of governor nor did it ask for the gender
of Chairs. The 2012 ACER survey of the Eastern Region found that 70% of
independent/external governors were male and 76% of Chairs. Age of governors
43. The survey provides a picture of the age of governors on corporations. The majority
of governors (60%) are between 45 and 64 years of age. Fourteen percent are aged 65
years or more. The summary table below shows the age of governors.
Figure 10: Age of governors on corporations.
Age of governors on corporations
24 or
under 25 - 34 35 - 44 45 - 54 55 - 64 65 - 74
75 or
over
9%
5% 13% 29% 31% 13% 1%
Type of college
Type of governors
Overall Student
governor
Staff
governor
Parent
governor
Executive/
Principal
Independent/
External
governor
College Sector 24% 5% 20% 0% 8% 9%
Non-SFCs 25% 6% 75% 0% 8% 9%
SFCs 18% 2% 14% 0% 6% 7%
GFECs 24% 7% 100% 0% 8% 10%
A&HCs 32% 0% 0% 0% 3% 6%
AD&PAs 33% 0% 0% 0% 13% 13%

AoC Report: The Composition of English Further Education Corporations and College Governance Frameworks
13
44. The survey does not differentiate the type of governor but more detailed information
from the ACER’s 2012 survey shows (unsurprisingly) that 90% of student governors
were in the first age range (24 and under) and that only 5% of independent/external
governors are less than 35 years of age.
Ethnicity
45. One hundred and sixty-five colleges (90% of respondents) provided details of their
college’s ethnic composition. Eighty-eight percent of governors are white British
with another three percent with white backgrounds. Four percent of governors have
a Black African, Black Caribbean or Other Black background, and Indian, Pakistani
and British Asian backgrounds account for 3% of governors.
46. The results on ethnicity in figure 11 show a national and regional snapshot of
corporations. While the survey can give a helpful national and regional overview
and a baseline for assessing changes in the ethnicity of corporations, colleges
themselves will be assessing the composition of their corporations with regard to the
communities they serve.
Figure 11: The ethnicity of governors9
9 Results are shown to the nearest whole percentage except where the rounded result is 0 % in which case
they are shown to first decimal place.
Area/
Region
Wh
ite
Bri
tish
/
En
gli
sh/
Sco
ttis
h/
No
rth
ern
Iri
sh
Wh
ite
Iris
h
Wh
ite
Gy
psy
or
Iris
h T
rav
elle
r
Wh
ite
Oth
er
Wh
ite
and
Bla
ck
Car
ibb
ean
Wh
ite
and
Bla
ck
Afr
ican
Wh
ite
and
Asi
an
Oth
er m
ixed
/
mu
ltip
le e
thn
ic
bac
kg
rou
nd
Ind
ian
Pak
ista
ni
Ban
gla
des
hi
Ch
ines
e
An
y o
ther
Asi
an/A
sian
Bri
tish
Bla
ck A
fric
an
Bla
ck C
arib
bea
n
An
y o
ther
Bla
ck /
Afr
ican
/ C
arib
bea
n
Ara
b
An
y o
ther
eth
nic
gro
up
Eastern 88% 1% 0% 2% 0% 0% 0% 0% 2% 0% 0% 0% 3% 1% 0.5% 1% 0.5% 0.5%
East
Midlands 88% 1% 0% 2% 0.4% 2% 0.4% 1% 1% 0.4% 0% 0% 2% 0% 2% 0% 0% 0%
London 67% 1% 0% 3% 1% 0.3% 0.3% 3% 2% 2% 0.3% 0.3% 2% 3% 10% 3% 0.3% 1%
North East 95% 0% 0% 3% 0% 0% 1% 0% 1% 0% 0% 0% 0% 1% 0% 0% 0% 0%
North West 93% 1% 0% 1% 0% 0% 0% 0.5% 1% 1% 0.2% 0% 2% 0% 0% 0.2% 0% 0%
South East 90% 0.4% 0% 2% 0% 0.2% 1% 1% 0.4% 1% 0% 1% 1% 0.4% 1% 0.2% 0% 0.4%
South West 93% 1% 0% 2% 0% 0% 0% 2% 1% 0% 0% 0% 0.4% 0.4% 0.4% 0% 0.4% 0%
West
Midlands 88% 1% 0% 1% 0.3% 0% 0% 0.3% 3% 1% 0% 0% 2% 1% 2% 0.3% 0.0% 0.7%
Yorkshire &
Humberside 92% 0% 0% 1% 0% 0% 0% 0.3% 2% 2% 0% 0.3% 1% 1% 1% 0% 0.3% 0.3%
National
88% 1% 0% 2% 0.2% 0.3% 0.3% 1% 1% 1% 0.1% 0.2% 1% 1% 2% 1% 0.2% 0.3%
AoC Report: The Composition of English Further Education Corporations and College Governance Frameworks
14
Disabilities
47. One hundred and thirty colleges (71% of the respondents) responded to the question
about whether any of their governors assess themselves as disabled. Of these, 48
colleges (37% of the 130 repondents) said they had one or more governors who are
self-assessed as disabled. Overall the 48 colleges had 63 governors who self-assessed
as having a disability. This represents 3% of the governors in the 130 respondent
colleges.
48. This question was carefully drafted in a way that would secure a response, so it is
disappointing that 53 colleges (29%) did not respond. However, it must be
recognised that the survey was completed by clerks on behalf their corporations and
as such this can limit the sort of questions about indivduals’ circumstances. Using
the rudimentary question of whether or not non-executive governors are disabled,
ACER’s 2012 survey showed that 3% of independent/external governors in the
Eastern Region were disabled.
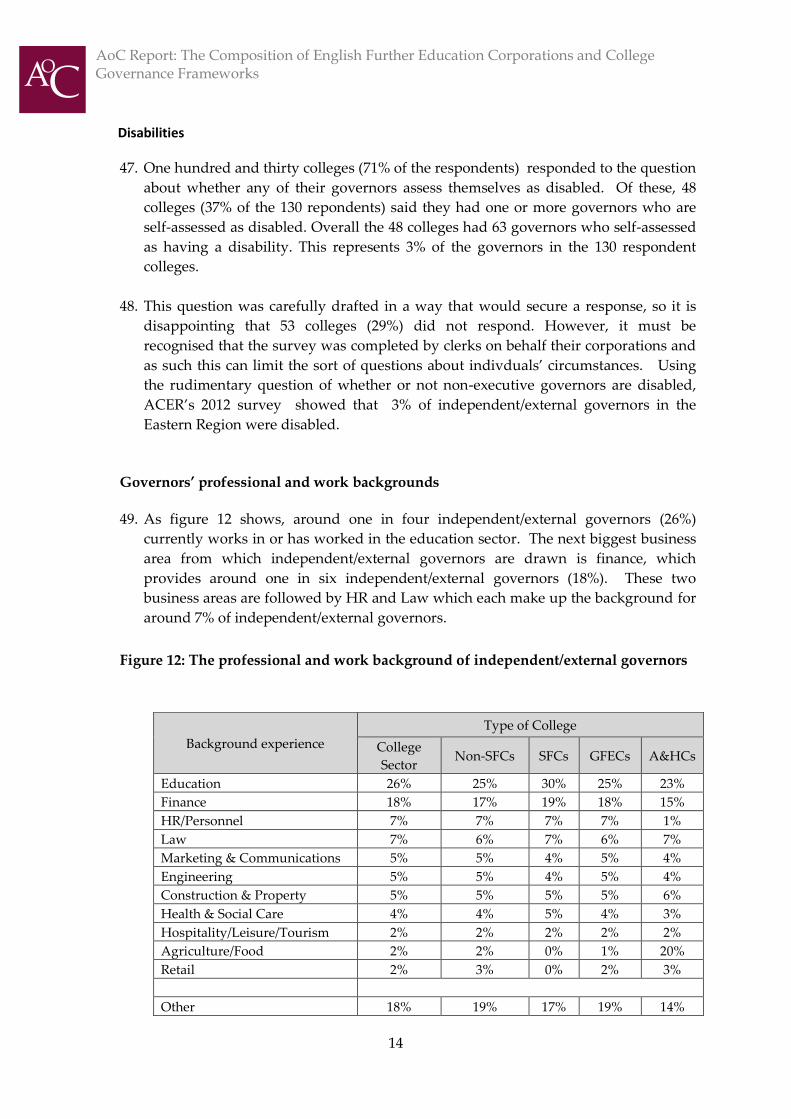
Governors’ professional and work backgrounds
49. As figure 12 shows, around one in four independent/external governors (26%)
currently works in or has worked in the education sector. The next biggest business
area from which independent/external governors are drawn is finance, which
provides around one in six independent/external governors (18%). These two
business areas are followed by HR and Law which each make up the background for
around 7% of independent/external governors.
Figure 12: The professional and work background of independent/external governors
Background experience
Type of College
College
Sector Non-SFCs SFCs GFECs A&HCs
Education 26% 25% 30% 25% 23%
Finance 18% 17% 19% 18% 15%
HR/Personnel 7% 7% 7% 7% 1%
Law 7% 6% 7% 6% 7%
Marketing & Communications 5% 5% 4% 5% 4%
Engineering 5% 5% 4% 5% 4%
Construction & Property 5% 5% 5% 5% 6%
Health & Social Care 4% 4% 5% 4% 3%
Hospitality/Leisure/Tourism 2% 2% 2% 2% 2%
Agriculture/Food 2% 2% 0% 1% 20%
Retail 2% 3% 0% 2% 3%
Other 18% 19% 17% 19% 14%

AoC Report: The Composition of English Further Education Corporations and College Governance Frameworks
15
50. A typical corporation of 12 independent/external governors would therefore include
three with an education background, two with a finance background, one with a
legal and one with an HR background.
51. Figure 13 looks more closely at the education backgrounds of independent/external
governors and shows the extent to which they are drawn from schools, further or
higher education.
Figure 13: Independent/external governors with an education background
Background experience
Type of College
College
Sector Non-SFCs SFCs GFECs A&HCs
Education (Schools) 7% 7% 10% 7% 4%
Education (Further) 7% 7% 7% 7% 8%
Education (Higher) 8% 7% 9% 7% 7%
Education (Other) 3% 3% 5% 3% 4%
Total 26% 25% 30% 25% 23%
52. In terms of specific skills for particular colleges, 20% of independent/external
governors at agricultural and horticultural colleges (A&HCs) have an agricultural or
food-processing background. This would represent between two and three
governors in a typical A&HC corporation.
Public positions held by governors
53. Finally, we asked clerks to tell us whether any governors on their corporation hold
public positions. Just under half of corporations (49% in the survey) have at least one
governor who is a local councillor and 31% of corporations (56 colleges in the survey)
have at least one governor who is either a board or committee member at a Local
Enterprise Partnership. Two colleges reported having a governor who is a Member
of Parliament.

AoC Report: The Composition of English Further Education Corporations and College Governance Frameworks
16
Part 2: The results on governance frameworks
Number of committees
54. The survey explored the number of committees that colleges have. It shows that a
typical English college has five standing committees that is: an audit committee,
which remains as the mandatory10 and four others. The term standing committee is
deliberately used to indicate those which have been formed with a view to having a
continued existence to do assigned work on an ongoing basis. As such they would
exclude committees set up for specific purpose with a limited life.
55. As figure 14 shows only 2% of corporations (3 colleges in the survey) have no
standing committees other than the audit committee. Over a quarter of colleges
(27%) operate through six or more standing committees.
Figure 14: College Sector - the number of standing committees supporting
corporations
56. Figure 15 shows the number of standing committees at GFECs and figure 16 for
SFCs.
10
Audit Committees are mandatory under the Joint Audit Code of Practice (July 2013)

AoC Report: The Composition of English Further Education Corporations and College Governance Frameworks
17
Figure 15: GFECs - the number of standing committees supporting corporations
Figure 16: SFCs - the number of standing committees supporting corporations
57. The typical model for a corporation with five standing committees is for it to be
supported by an Audit, Search, Remuneration, Quality and Standards, and Finance
Committee. Ninety five percent of college have a Search Committee; 88% a
Remuneration Committee, 73% a Quality, Standards and Achievement Committee,

AoC Report: The Composition of English Further Education Corporations and College Governance Frameworks
18
and 68% a Finance Committee (though this is frequently defined with a wider brief
such as a Resources Committee or a Finance and General Purposes Committee, etc).
These were by far the most popular standing committees reported to the survey.
Terms of office for governors
58. As figure 17 shows, 76% of colleges said that they set a four year term for governors.
Ten percent of colleges said the term varied by type of governor. ACER’s 2012
survey of colleges in the Eastern Region asked specifically the term set for
independent/external governors and found that 93% set four years. It is likely
therefore that on the basis of this survey’s results and those of ACER, that a
substantial number of those who said their college’s terms varied according to the
type of governor would set four years for independent/external governors.
Figure 17: Term of office for governors
Term of
office
No. of
colleges %
2 years 4 2%
3 years 22 12%
4 years 139 76%
Varies 18 10%
Responses 183 100%
59. Over half of colleges (55%) set a maximum length of service for governors as shown
in figure 18 (57% of GFECs, 47% of SFCs and 64% of A&HCs).
Figure 18: Does your college set a maximum length of sevice for governors?
Does your College have overall
term limits for Governors?
Reponses No. of
colleges %
Yes 99 55%
No 81 45%
Reponses 180 100%
60. The ACER 2012 survey of colleges in the Eastern Region found that the maximum
period set by colleges ranged from 8 to 12 years, with the majority of those having a

AoC Report: The Composition of English Further Education Corporations and College Governance Frameworks
19
maximum applying 8 years. A number of those setting a maximum did however
indicate that in special circumstances this could be extended.
Appointment of chair and current term of office
61. Figure 19 shows how often corporations elect their chair. Fifty-six percent of colleges
elect their chair at least every two years (28% elect the chair annually and 28% every
two years).The more complex policies reported by respondents include linking the
appoinment of the chair to their remaining term as a governor and one college that
appointed the chair for an intial one year followed by a longer term. A number of
respondents drew attention to the fact that although their chair’s term of office was
longer than one year, this was subject to an annual performance review. A very small
number of colleges (7 colleges - representing 4% of respondents) said they had no
fixed term for their chair.
Figure 19: What is the term of office for your chair
What is the term for your chair?
Years Colleges %
1 year 51 28%
2 years 51 28%
3 years 27 15%
4 years 37 21%
5 years 1 1%
6 years 1 1%
9 years 1 1%
Other more complex
policy 4 2%
No policy 7 4%
No. of colleges 180
62. Figure 20 shows long chairs have been in post. It shows that 17% of chairs have been
in post for less than one year and 44% have been in post for two years or less. One
chair’s position was vacant at the time of the survey. Twelve percent of chairs have
been in post for eight or more years.

AoC Report: The Composition of English Further Education Corporations and College Governance Frameworks
20
Figure 20: How long has your current chair been in place
Period chair has
been in post
No of
colleges %
Cumulative
%
Less than 1 year 31 17% 17%
1 to less than 2 years 49 27% 44%
2 to less than 3 years 25 14% 57%
3 to less than 4 years 15 8% 66%
4 to less than 5 years 9 5% 70%
5 to less than 6 years 18 10% 83%
6 to less than 7 years 4 2% 87%
7 to less than 8 years 9 5% 87%
8 to less than 9 years 4 2% 90%
9 to less than 10
years 3 2% 91%
10 or more years 15 8% 99%
Vacancy 1 1% 100%
Total colleges 183 100%
Amending the Instrument and Articles of Government
63. As figure 21 shows, just over half of colleges (51%) told us they have decided to use
the new freedoms in the 2011 Education Act to amend their Instrument and Articles
of Government. A further 29% of respondents who have not decided on any changes
so far, said they may make changes during the academic year 2013/14.

AoC Report: The Composition of English Further Education Corporations and College Governance Frameworks
21
Figure 21: Making changes to the Instrument and Articles of Government
64. Earlier in this report we identified that three GFECs in the survey have amended
their Instrument and Articles of Government to allow two executive governors to be
appointed to their corporations. That is the principal and one other member of the
senior mangement team.
More complex business models
65. Twenty colleges (11%) in the survey (18 GFECs and 2 SFCs) classify themselves as
operating within a group structure. That is 13% of GFECs and 6% of SFCs. One of the
GFECs classifing themselves as within a group also said they were part of a legal
federation with another college.
66. Forty-two colleges (23% of all survey responses) sponsor at least one academy, free
school, UTC or studio school. That is 33 GFECs, 8 SFCs and one A&HC which
represent 24% of GFECs; 24% of SFCs; and 9% of A&HCs in the survey. Sixteen
Making changes to the Instrument and Articles of Government
Region
No. of
colleges
responding
Have decided
to change
I&As
%
May make
changes in
2013/14
%
Both
decided to
and those
that may
make
changes in
2013/14
%
A B A+B
Eastern 16 81% 19% 100%
East
Midlands 16 50% 25% 75%
London 21 29% 48% 76%
North East 10 30% 30% 60%
North West 29 38% 45% 83%
South East 31 61% 23% 84%
South West 18 50% 22% 72%
West
Midlands 20 55% 5% 60%
Y&H 21 62% 38% 100%
Responses 182 51% 29% 80%

AoC Report: The Composition of English Further Education Corporations and College Governance Frameworks
22
colleges (9% of all survey responses) classified themsleves as operating in a group
structure but did not sponsor an academy, free school, UTC or studio school.

AoC Report: The Composition of English Further Education Corporations and College Governance Frameworks
23
Part 3: The methodology
66. The Association of Colleges’ survey sought to build on the work of the Governors'
Council Database Development Task Group, set up after the 2013 National Governance
Conference, and the work of ACER and the FE Women’s Leadership Network, in
collecting and publishing data on the composition of English FE corporations. The
survey was completed by clerks on behalf of their corporations in October 2013 prior to
the AoC Conference. Godbold Consultancy was commissioned to analyse the data more
fully and produce a report on the survey findings.
67. The survey was completed by 188 institutions but the results in this report focus on the
183 respondent colleges that use the standard Instrument and Articles of Government to
underpin their governance frameworks. The 183 colleges represent 56% of English FE
colleges and cover some 3258 governors’ positions. Figure 22 shows the response rate
across the college sector by region and figure 23 by type of college.
Figure 22: Response rate to survey by region
Region
Total number of
colleges in
regions11
Number of
Responses
from regions
% Response
rate
Eastern 31 16 52%
East Midlands 22 16 73%
London 43 23 53%
North East 20 9 45%
North West 56 30 54%
South East 58 32 55%
South West 28 17 61%
West Midlands 39 20 51%
Yorkshire & Humberside 32 20 63%
National 329 183 56%
11
Excludes The 10 Special Designated Colleges - seven in the London Region and one in each of the South East, West Midlands and Yorkshire and Humberside regions

AoC Report: The Composition of English Further Education Corporations and College Governance Frameworks
24
Figure 23: Response rate to survey by type of college
Response rate for survey across College Sector
Type of
college
Number
of
responses
No. of
English
Colleges12
%
Response
rate
GFECs 136 218 62%
SFCs 33 93 35%
A&HCs 11 15 73%
AD&PAs 3 3 100%
Total 183 329 56%
68. The results of the survey represent a sample of colleges and as such the college sector
will look to use the data to benchmark their own college’s position and project the
position that applies across the sector.
69. The data relates to those colleges that have chosen to respond and as such this may
contribute to a bias in the sample that could impact on the reliability of the
extrapolations for the sector as a whole. The analysis has not sought to measure the
likely impact. An alternative, more robust, approach might have been to issue the
questionnaire to a randomly selected sample. Further, while the results provide a timely
snapshot of practices in colleges, they should not be taken as providing best practice
benchmarks.
70. While data was captured by type of college and their region, for the most part the
questions about the composition and experience of corporations and the governance
framework were drawn from free-standing individual questions (e.g. what is the
number of male and female governors; what is the sector background of governors; and,
what are governors ages?). This approach makes the questionnaire simpler to complete
and may result in a higher unprompted response rate but it does limit the extent to
which responses to one question can be tabulated to the responses of another. A more
detailed approach can be adopted in other relatively smaller surveys, - where data can
be gathered in anonymised form on each governor - allowing for the cross-tabulation of
responses to questions.
12
Excludes The 10 Special Designated Colleges - seven in the London Region and one in each of the South East, West Midlands and Yorkshire and Humberside regions

AoC Report: The Composition of English Further Education Corporations and College Governance Frameworks
25
71. While the overall response rate is fairly robust, the response rate from sixth form
colleges (35%) is disappointingly low and may further limit the reliability of forecasts for
this subset of results.
72. The analysis looked at forms of measuring and showing averages. Unless otherwise
stated in the report, average refers to the mean average. While this can have limitations it
is the most frequently used form across the college sector and as such the most readily
understood.
73. While some terms for types of governors are defined within the FE Instrument and
Articles of Government and supporting documents, others are not. For convenience, this
report has adopted the terms and descriptors most commonly used across the college
sector.
74. For the most part, data presented as a percentage is shown to the nearest whole number.
75. The report is supported by a full set of source data tables in Appendix 3. This is
published separately.
AoC Report: The Composition of English Further Education Corporations and College Governance Frameworks
26
Appendix 1: Terminology
________________________________________________________________
While some terms for types of governors are defined within the FE Instrument and Articles
of Government and supporting documents, others are not. For convenience, this report has
adopted the terms and descriptors most commonly used across the college sector.
AD&PAs
There are a very small number of specialist art and design and performing arts colleges.
They are regulated by the Department for Business Innovation and Skills.
A&HCs
A&HCs are specialist agricultural and horticultural colleges. They are sometimes
referred to as land-based or rural colleges. A&HCs are regulated by the Department for
Business Innovation and Skills.
Business-employer governor
The term business or employer governor is sometimes used to define a college governor
who is not a student governor, staff governor, parent governor or executive governor..
Though they constitute the largest type of governor on a corporation, they have never
been given a distinctive label in the FE Instrument and Articles of Government for FE
colleges. Independent or external governors are the two most common terms used in the
college sector to label these governors and this has been adopted in this report.
Co-opted governor
Co-opted governor is the term used to describe governors who have been specifically
recruited, usually for their specialist skills and experience, to support a corporation.
Normally co-opted governors support committees of the corporation and are not
members of the corporation. While this is generally the case, some co-opted governors
are also members of the corporation.
Executive governor
This is the term to used distinguish governors who are the Chief Executive, Principal or
a member of the college’s Senior Management Team. They are a member of the
corporation by virtue of the executive position they hold within the college. The term ex-
officio is also sometimes used. The unmodified FE Instrument and Articles of
Government allow the Principal alone to be the only executive governor on the
corporation. Some colleges are now using the new freedoms to amend their Instrument
and Articles of Government to appoint more than the Principal to this position.

AoC Report: The Composition of English Further Education Corporations and College Governance Frameworks
27
College Sector
The college sector is defined as those colleges established as independent colleges under
the 1992 Education Act. There are currently 339 such colleges. For the purpose of this
report the term excludes the 10 special designated colleges which are not required to
apply the FE Instrument and Articles of Government.
GFECs
The term GFECs (General Further Education Colleges) is used in this report to also
include colleges which classify themselves as tertiary colleges.
Independent/external governor
This report has adopted the term independent or external governor to define a college
governor who is not a student governor, staff governor, parent governor or executive
governor. Though they constitute the largest type of governor on a corporation, they
have never been given a distinctive label in the FE Instrument and Articles of
Government for FE colleges. Independent or external governors are the two most
common terms used in the college sector to label these governors. The term business or
employer governors is also sometimes used.
Non-executive governor
This is the generic term used to label those governors who are not executive governors.
Traditionally, under the unmodified FE Instrument and Articles of Government, this
covered all the governors other than the principal. It includes student, staff, parent and
independent/external governors.
Non-SFCs
This is the descriptor used in this report to distinguish those colleges which are
regulated by the Department for Business Innovation and Skills. It is effectively the
college sector less SFCs which are regulated by the Department for Education.
SFCs
Sixth Form Colleges regulated by the Department for Education

AoC Report: The Composition of English Further Education Corporations and College Governance Frameworks
28
Standing committees
The term standing committee is deliberately used to indicate those which have been
formed with a view to having a continued existence to do assigned work on an ongoing
basis. As such, they would exclude committees set up for a specific purpose with a
limited life.
.

AoC Report: The Composition of English Further Education Corporations and College Governance Frameworks
29
Appendix 2: The AoC survey questions and format
________________________________________________________________
Preliminary questions
College type:
General Further Education / Tertiary College
Sixth Form College
Specialist College
Other
The data within this Appendix captures colleges according to: GFEC/Tertiary, SFC,
Agricultural and Horticultural College (A&HC) and Art & Design and Performing Arts
College (AD & PA). The A&HC and AD&PA colleges were originally included under the
specialist/other categories.
College regions:
Eastern region
East Midlands
London
North East
North West
South East
South West
West Midlands
Yorkshire and Humberside
_____________________________________
The survey: Governance
The 2011 Education Act allows Further Education Colleges and Sixth Form Colleges to
revise their Instrument and Articles so long as they maintain some core features. These
changes took effect in April 2012 and were explained in the paper New Challenges, New
Chances as offering freedom and flexibilities for Colleges.
1. Has your College Governing Body decided to revise its Instrument and Articles using
these new freedoms? Yes/No

AoC Report: The Composition of English Further Education Corporations and College Governance Frameworks
30
If no, do you anticipate that your governing body may decide to revise its Instrument &
Articles during 2013/14? Yes/No
2. Has your College developed any of the following business models? (tick all that apply)
Creation of a group structure
Legal federation with another College
Sponsorship of an Academy
Sponsorship of a Free School
Sponsorship of a University Technical College
Sponsorship of a Studio School
Other model (please specify)
3. What is the standard term of appointment for your Governors?
1 year
2 years
3 years
4 years
Varies according to role
4. Does your College have overall term limits for Governors? Yes/No
5. What is the term for your Chair?
6. How long has your current Chair been in place?
___________________________________________________________________________
The survey: Governing body composition
There is some external interest in the composition of Governing bodies and a concern within
Colleges themselves about how to ensure Boards are effective, attuned to issues within their
various communities and on top of their legal responsibilities to promote equality and
diversity. The purpose of these questions is to collect data which Colleges can use to learn
from each other and to provide summary national estimates on key indicators. Information
provided will be kept confidential by AoC and statistics published will not be used to name
individual Colleges.
7. Which committees does your College have?
Search
Audit
Remuneration
Quality/Standard/Achievement
Finance
Building Project/Estates

AoC Report: The Composition of English Further Education Corporations and College Governance Frameworks
31
Other (please specify)
8. How many Governors does the College have by the following categories?
Student Governor (s)
Staff Governor (s)
Parent Governor (s)
Principal/Chief Executive
Business/Employer Governor (s)
Other Governor (s)
Co-opted Governor (s)
Total number of Governors
9. Number of vacancies on Governing body by category?
Student Governor (s)
Staff Governor (s)
Parent Governor (s)
Principal/Chief Executive
Business/Employer Governor (s)
Other Governor (s)
Co-opted Governor (s)
Total number of Governors
10. What is the total size of Governing Body?
11. Excluding student governors or governors who are employed by the College, how many
Governors does the College have in the following employment sectors or with the
following skills (choose the one that is most appropriate)
Education (Schools)
Education (Further)
Education (Higher)
Education (Other)
Health and Social Care
Finance (including banking and insurance)
Law
HR/Personnel
Marketing/Communications
Engineering
Construction/Property (including surveyors, architects)
Hospitality/Leisure/Tourism (including restaurateurs etc)
Agriculture/Food (including food production, processing and manufacture)
Retail
Other

AoC Report: The Composition of English Further Education Corporations and College Governance Frameworks
32
Total number of governors
12. What is the gender balance of the Governing body?
Female
Male
Total number of governors
13. What is the age balance of your Governing body? Please give numbers in each age
group. Include estimates if you do not have exact ages of individuals
24 or under
25 - 34
35 – 44
45 - 54
55 – 64
65 - 74
75 or over
Total number of Governors
14. Do any of the Governors hold the following public positions?
MP
Councillor
Member of Local Enterprise Partnership Board
Member of Local Enterprise Partnership Skills/Employment Committee
15. Please record the numbers of Governors who self assess themselves as having
disabilities (if known)
16. What is the ethnic composition of your Governing body? Please include numbers in each
group if known or not provided if not. This data is being collected to aid benchmarking
between Colleges
White British/ English/ Scottish/ Northern Irish
White Irish
White Gypsy or Irish Traveller
White Other
White and Black Caribbean
White and Black African
Indian
Pakistani
Bangladeshi
Chinese
Any other Asian/Asian British

AoC Report: The Composition of English Further Education Corporations and College Governance Frameworks
33
Black African
Black Caribbean
Any other Black / African / Caribbean
Arab
Any other ethnic group
Not provided
17. If you have any comments on the questions in this survey or the issues it raises or any
other issue, please record them.
_______________________________________