the competitive landscape of destination marketing ... · ceo staff-team marketing the destination....
TRANSCRIPT
The Competitive Landscape of Destination Marketing & Development
Berkeley W. Young
Young Strategies, Inc.
This presentation and its content may not be shared or duplicated without the prior written expressed permission of Berkeley Young
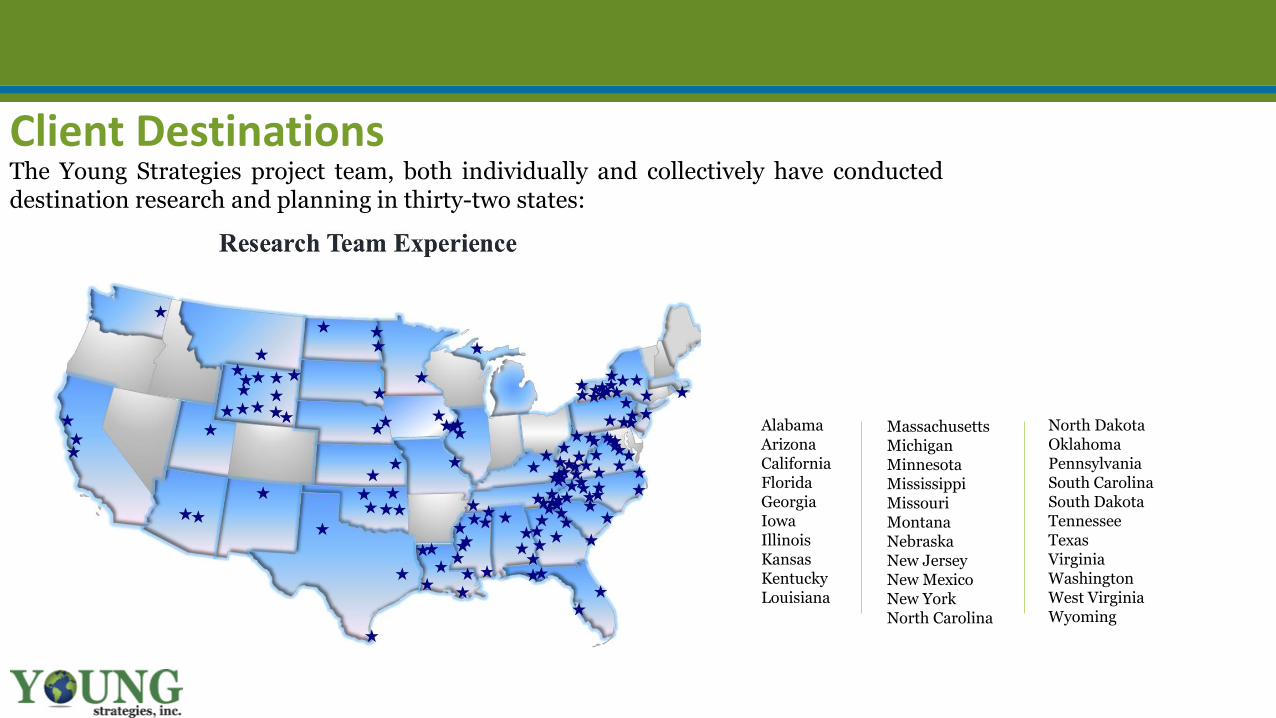
AlabamaArizona California Florida Georgia IowaIllinois KansasKentuckyLouisiana
Client DestinationsThe Young Strategies project team, both individually and collectively have conducteddestination research and planning in thirty-two states:
Massachusetts MichiganMinnesotaMississippiMissouriMontanaNebraska New JerseyNew MexicoNew YorkNorth Carolina
North Dakota OklahomaPennsylvaniaSouth Carolina South DakotaTennesseeTexasVirginiaWashingtonWest VirginiaWyoming
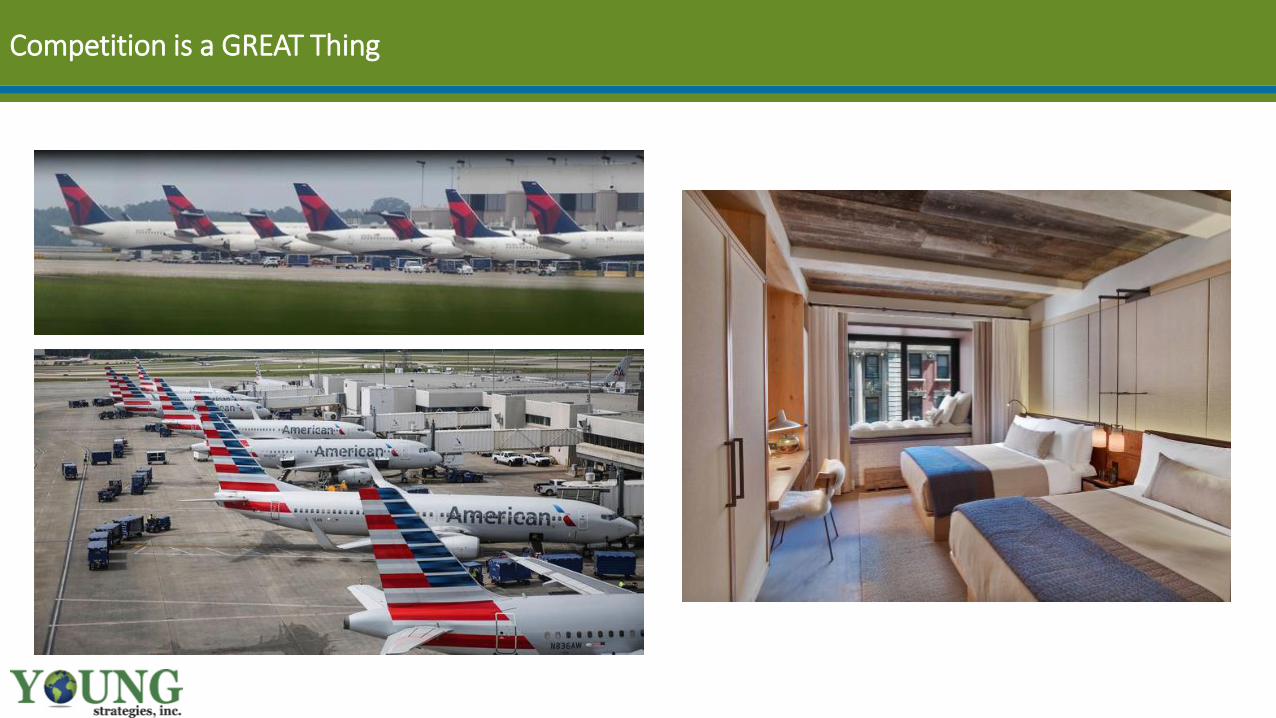
Competition is a GREAT Thing

Competition or Coopetition?
• Destinations
• Lodging
• Restaurants
• Attractions
• Entertainment
• Retail
• Events
• Associations
• Conferences

Competing for….

Within every day
We change the way we compete
We adapt to the situation
We compete
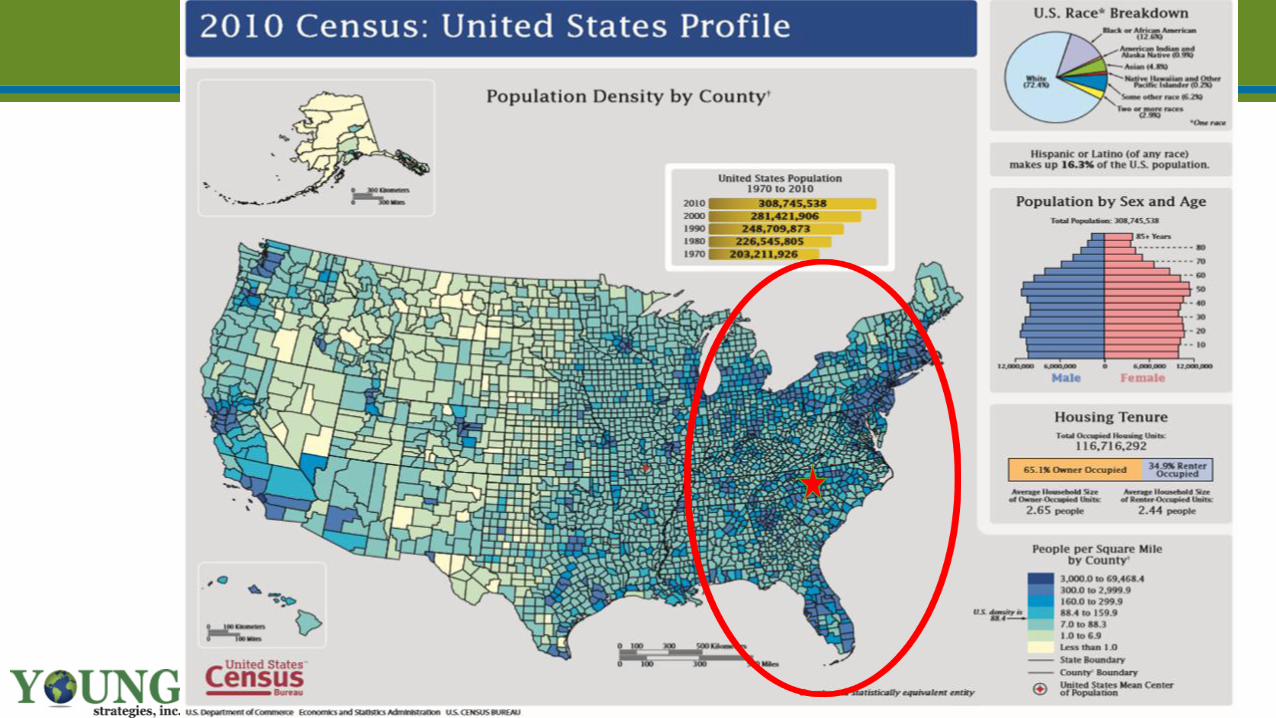
Competition Among Communities Is Intense

Destinations in the competitive landscape
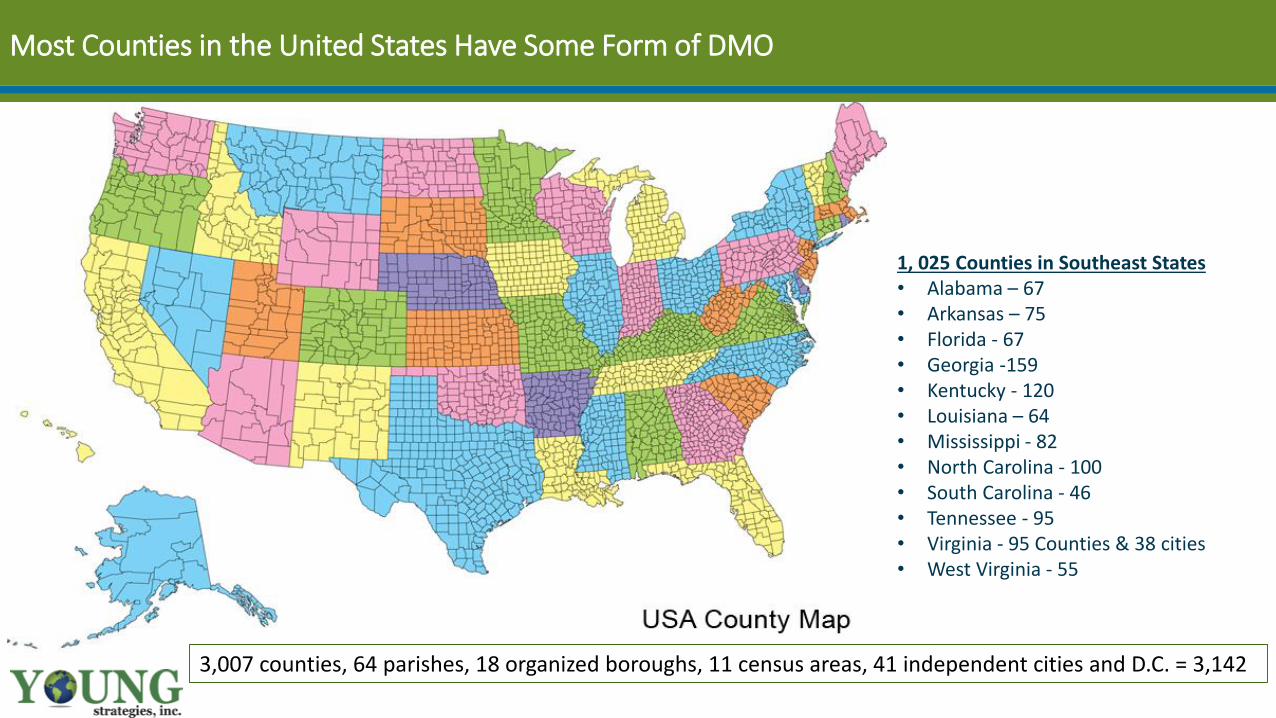
1, 025 Counties in Southeast States• Alabama – 67• Arkansas – 75• Florida - 67• Georgia -159• Kentucky - 120• Louisiana – 64• Mississippi - 82• North Carolina - 100• South Carolina - 46• Tennessee - 95• Virginia - 95 Counties & 38 cities • West Virginia - 55
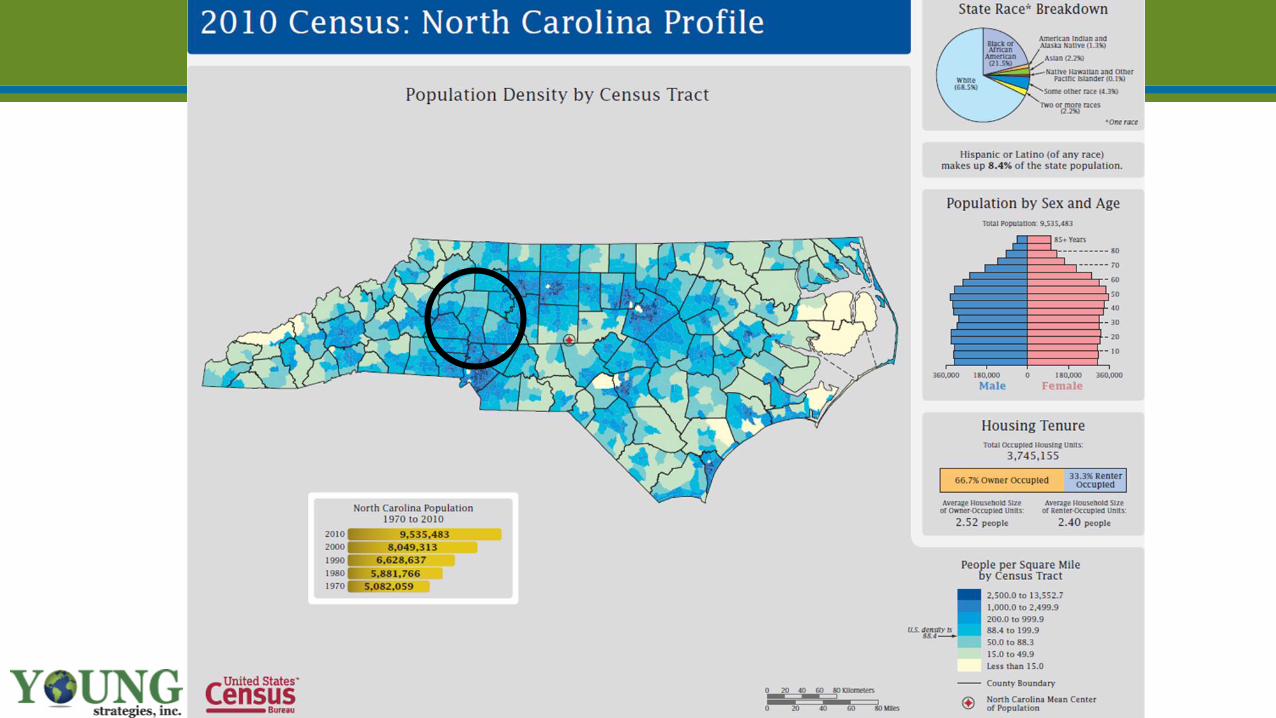
Most Counties in the United States Have Some Form of DMO
3,007 counties, 64 parishes, 18 organized boroughs, 11 census areas, 41 independent cities and D.C. = 3,142
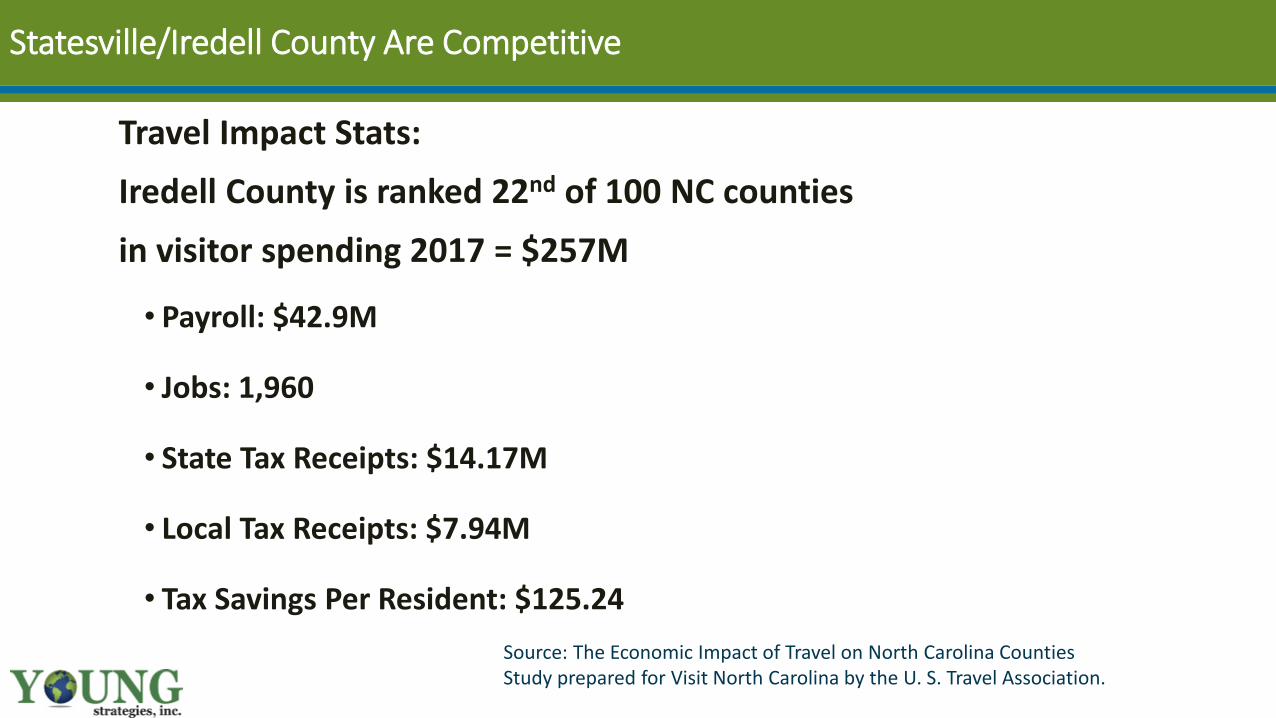
Statesville/Iredell County Are Competitive
Travel Impact Stats:
Iredell County is ranked 22nd of 100 NC counties
in visitor spending 2017 = $257M
• Payroll: $42.9M
• Jobs: 1,960
• State Tax Receipts: $14.17M
• Local Tax Receipts: $7.94M
• Tax Savings Per Resident: $125.24
Source: The Economic Impact of Travel on North Carolina CountiesStudy prepared for Visit North Carolina by the U. S. Travel Association.
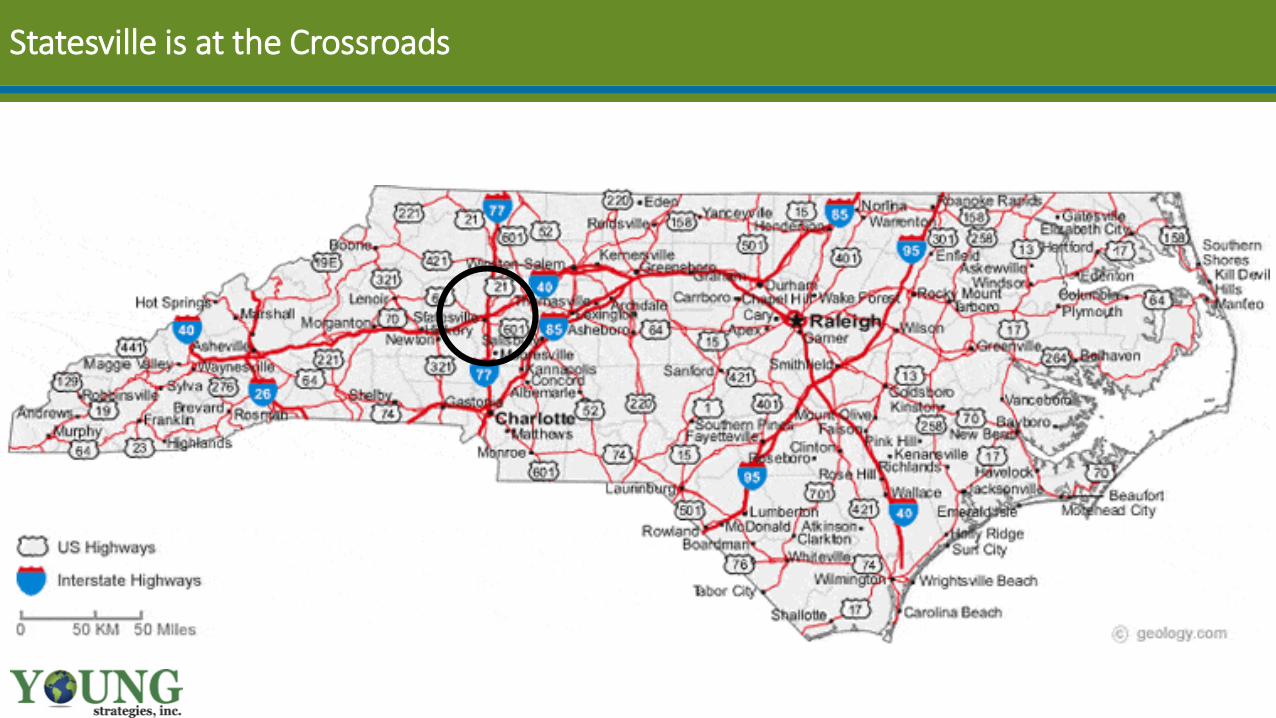
Statesville is at the Crossroads

“Tourism” is a segment of the travel Industry
• Business travel• Conference/meetings• Team sports• Motorcoach tours• Leisure getaways & vacations• University/education

In 2014, the foundation lost a total of $62 million, or $176,000 every day, Mitchell Reiss, President, Colonial Williamsburg
“The commercial businesses have been running at a loss for many, many years,” Reiss said.
• Hamilton premiered in July, 2015
• Through May, 2017 Hamilton has Grossed $111,867,904 with a total of 408,496 seats sold.
• The cast album has sold over 428,000 copies domestically
• At $100 million a year, the Broadway production of Hamilton would pass the $1 billion mark in a decade
Destinations Have to be Updated to be Relevant

Selling begins when the customer says “No”.
Overcoming objection.
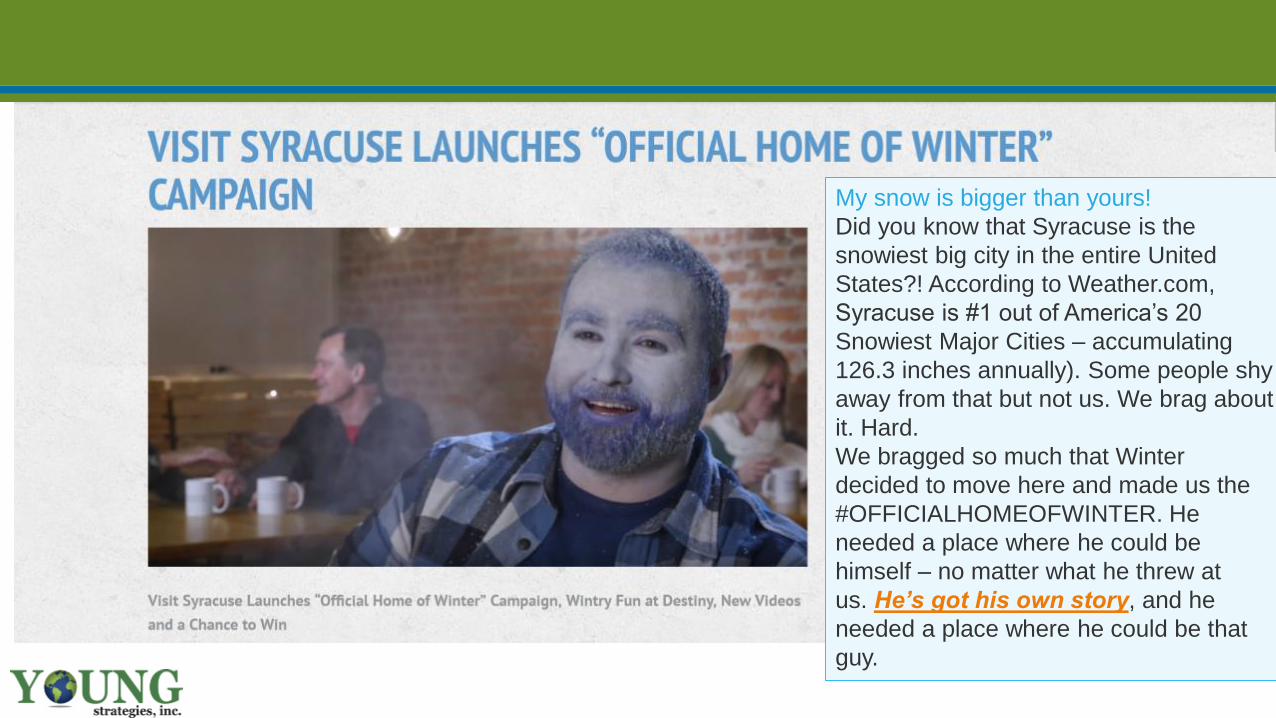
My snow is bigger than yours!
Did you know that Syracuse is the
snowiest big city in the entire United
States?! According to Weather.com,
Syracuse is #1 out of America’s 20
Snowiest Major Cities – accumulating
126.3 inches annually). Some people shy
away from that but not us. We brag about
it. Hard.
We bragged so much that Winter
decided to move here and made us the
#OFFICIALHOMEOFWINTER. He
needed a place where he could be
himself – no matter what he threw at
us. He’s got his own story, and he
needed a place where he could be that
guy.


Competition for the Household Leisure SpendEntertainment and Activities:
• Attractions
• College Sports
• Professional Sports
• Concerts and theater
• Children’s activities
• Gaming
Consumer Expenditure Survey (CE) data from 1934–1936 show that, even during the Great Depression, spending on entertainment accounted for 5.4 percent of the household budget. – US Department of Labor

Facilities to drive the off-seasonEntertainment and Activities:
• Attractions
• Sports
• Concerts and theater
• Children’s activities
• Events
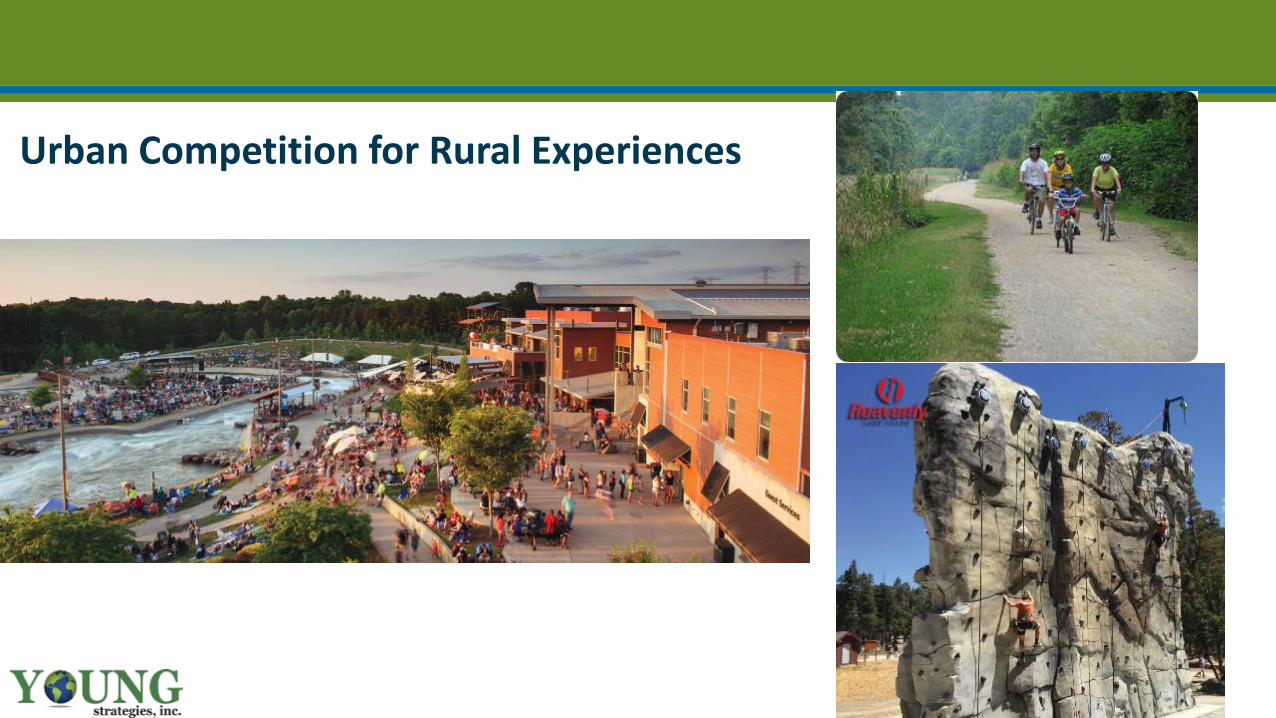
Urban Competition for Rural Experiences
Competition is NOT always two way street

South Padre Island

South Padre Island
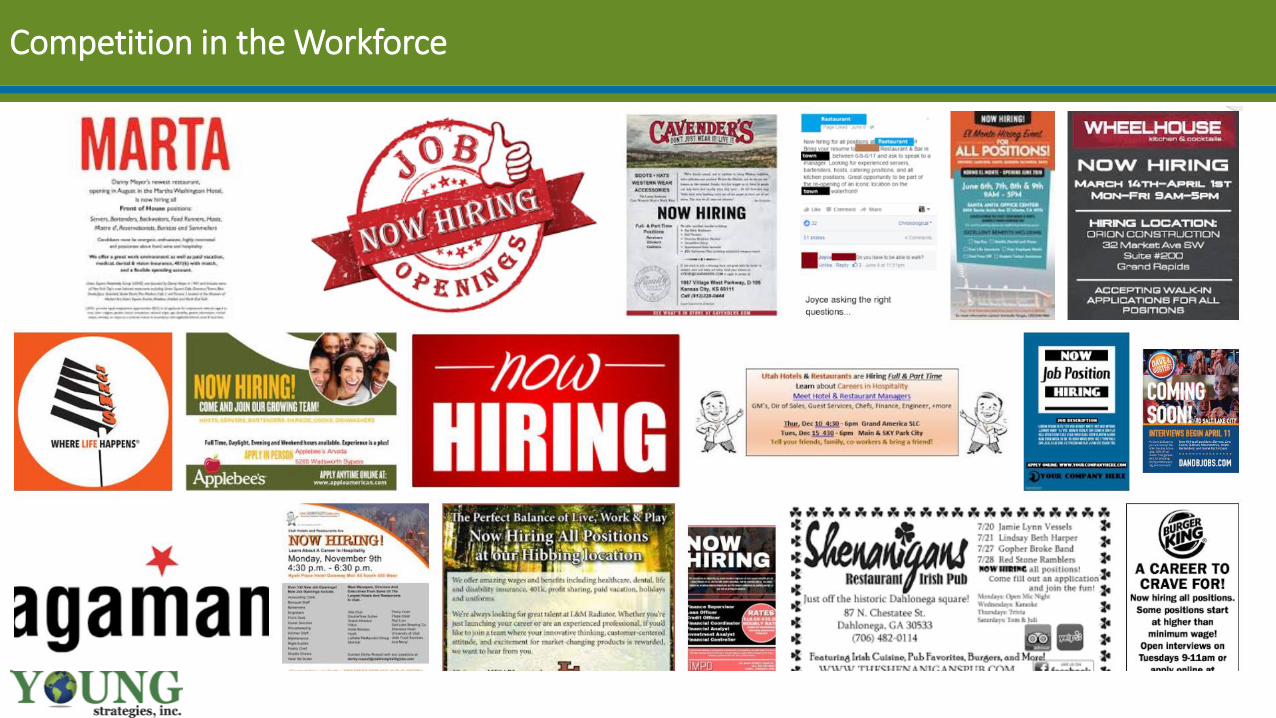
Competition in the Workforce

Competition From Your Own Citizens

Growth From Unexpected Audiences
Barter TheaterCreeper Trail

Successful marketing startswith solid research
You MUST monitor the ever changing behavior of YOUR visitors
Why would they visit your destination?
Why would they come back?
Why would they recommend you to others?
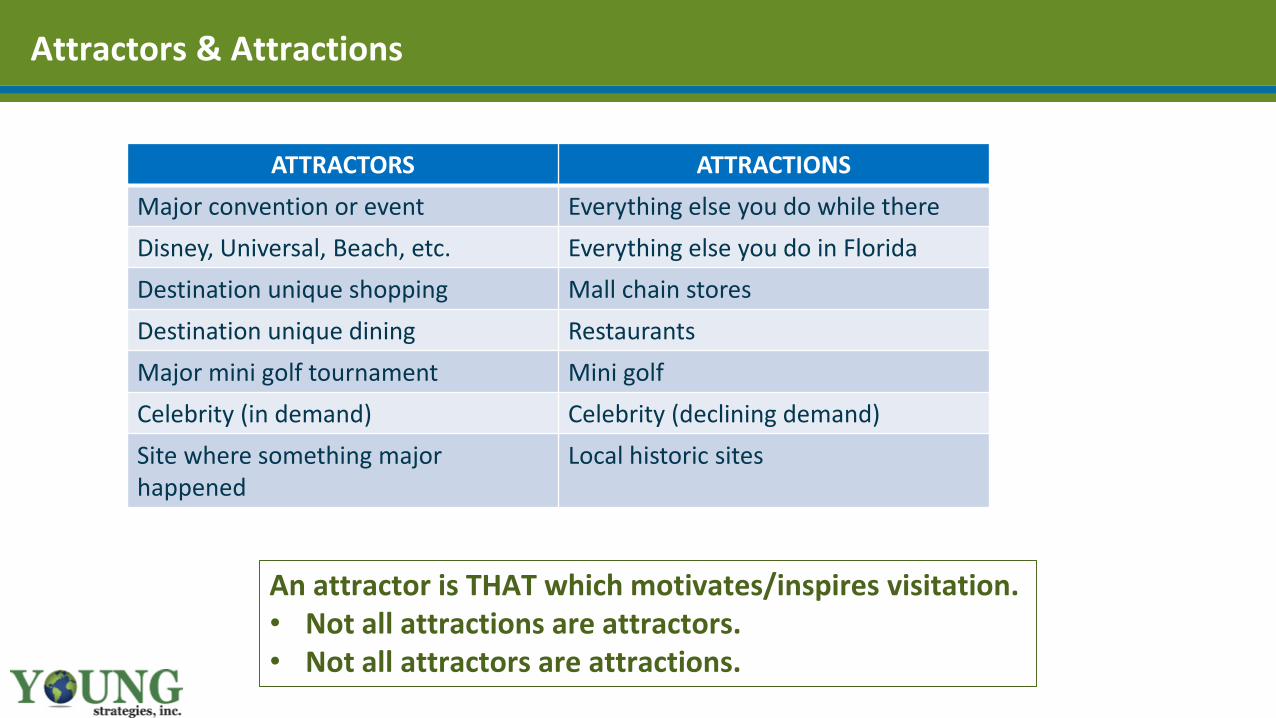
Attractors & Attractions
ATTRACTORS ATTRACTIONS
Major convention or event Everything else you do while there
Disney, Universal, Beach, etc. Everything else you do in Florida
Destination unique shopping Mall chain stores
Destination unique dining Restaurants
Major mini golf tournament Mini golf
Celebrity (in demand) Celebrity (declining demand)
Site where something major happened
Local historic sites
An attractor is THAT which motivates/inspires visitation.• Not all attractions are attractors.• Not all attractors are attractions.

The Constant Conundrum
Human Technology
Marketers must ask themselves:
• What do I need to know?
• What is my budget?
• How much will it cost?
• How reliable will it be?
• Will it be actionable?
AI?
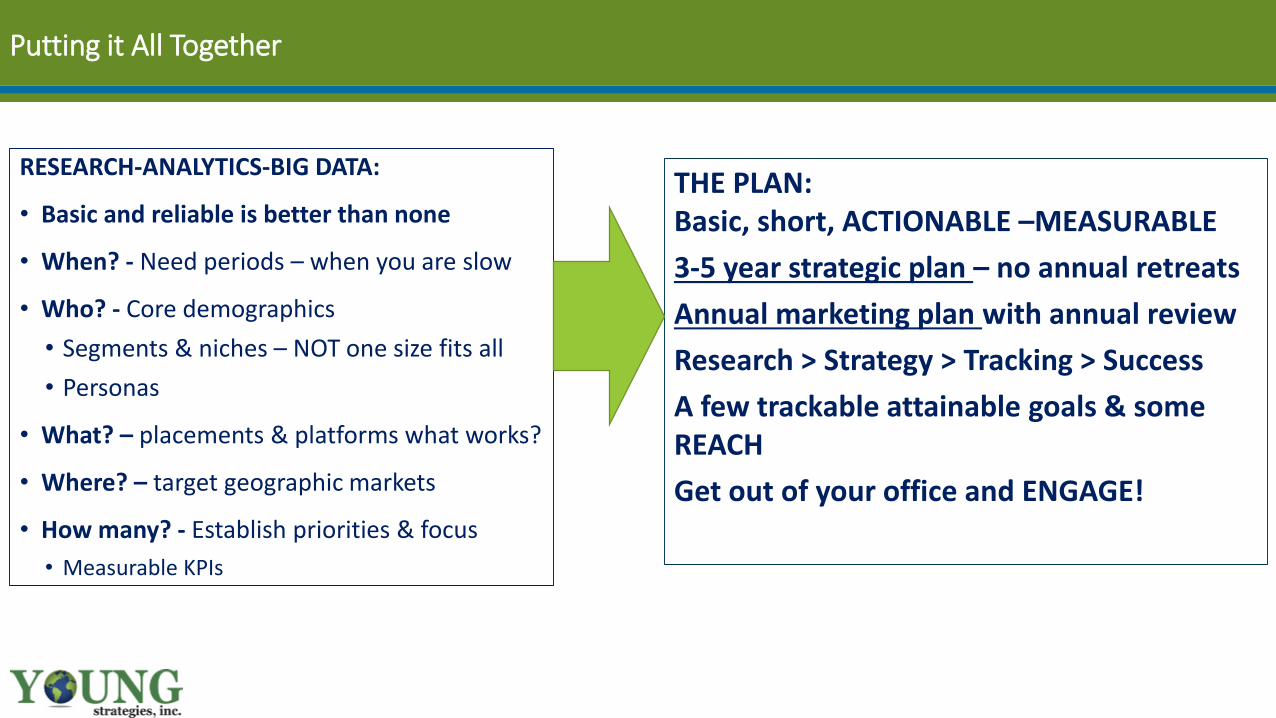
Putting it All Together
RESEARCH-ANALYTICS-BIG DATA:
• Basic and reliable is better than none
• When? - Need periods – when you are slow
• Who? - Core demographics
• Segments & niches – NOT one size fits all
• Personas
• What? – placements & platforms what works?
• Where? – target geographic markets
• How many? - Establish priorities & focus
• Measurable KPIs
THE PLAN:Basic, short, ACTIONABLE –MEASURABLE
3-5 year strategic plan – no annual retreats
Annual marketing plan with annual review
Research > Strategy > Tracking > Success
A few trackable attainable goals & some REACH
Get out of your office and ENGAGE!
To thrive in 2019 you MUST embrace change without fear.
It’s an exciting dynamic travel economy so jump in and go for it.
Hint: An overnight visitor spends 2X-3X
As a daytripper

Statesville Lodging Product
Name of Establishment Class Open Date RoomsBest In Town Motel Economy Class Oct 1950 25Lodge Inn & Suites Economy Class Jun 1966 130Masters Inn Statesville Economy Class Jun 1968 120Days Inn Statesville Economy Class Aug 1970 99Hallmark Inn Motel Economy Class Jun 1980 39Red Roof Inn Statesville Economy Class Sep 1984 115Brookwood Inn Economy Class Jun 1985 117Ramada Statesville Midscale Class Dec 1985 134Quality Inn & Suites Statesville Midscale Class Jul 1986 107Comfort Inn & Suites Statesville Upper Midscale Class Jan 1987 111Americas Best Value Inn Statesville Economy Class Jun 1992 40Economy Inn Economy Class Jun 1993 59Best Western Statesville Inn Midscale Class Apr 1995 69Sleep Inn Statesville Midscale Class Feb 1998 69Motel 6 Statesville Economy Class May 1999 50Microtel Inn & Suites by Wyndham Statesville Economy Class May 1999 64Hampton Inn Statesville Upper Midscale Class Jan 2007 80Courtyard Statesville Mooresville Lake Norman Upscale Class Jun 2009 94Holiday Inn Express & Suites Statesville Upper Midscale Class Jun 2009 77Hilton Garden Inn Statesville Upscale Class Apr 2017 104
20 Lodging Properties Rooms = 1703
1980’s6 hotels, 623 rooms, 37% of inventory
1990’s6 hotels, 351 rooms, 21% of inventory
2000’s3 hotels, 251 rooms, 15% of inventory
Last Decade1 hotel, 104 rooms, 6% of inventory
Prior to 19804 hotels, 374 rooms, 22% of inventory

Research to Identify Target Growth Times- 33 -
10%
20%
30%
40%
50%
60%
70%
80%
90%
100%
52 Week Occupancy TrendJanuary - March, 2018 & April - December, 2017
SUN MON TUES WED THURS FRI SAT
Daily Occupancy %’s # of days % of YR
Days reported at 60% - 69% 52 14.2%
Days reported at 70% - 79% 59 16.2%
Days reported at 80% - 89% 54 14.8%
Days reported at 90% - 100% 24 6.6%
Total # of Days 60% or higher occupancy
189 nights = 51.8% of the year
Source: STR
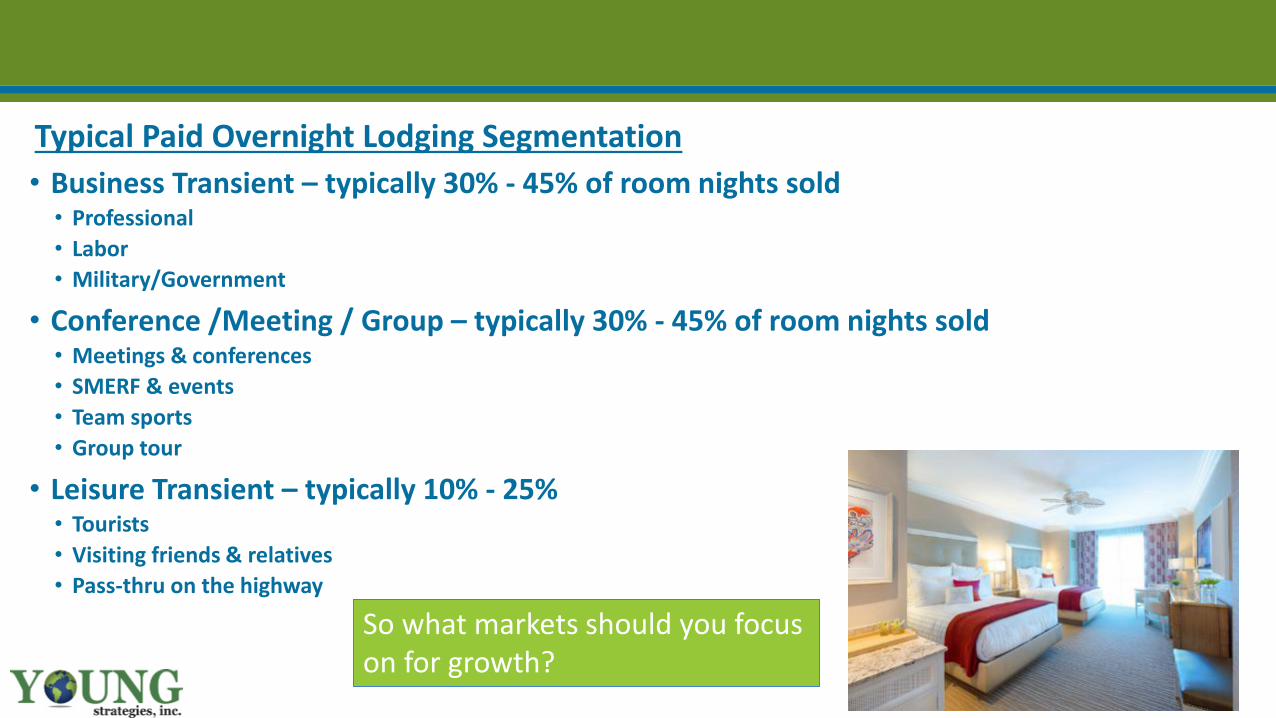
Tourism is a Segment of the Travel IndustryTypical Paid Overnight Lodging Segmentation
• Business Transient – typically 30% - 45% of room nights sold• Professional
• Labor
• Military/Government
• Conference /Meeting / Group – typically 30% - 45% of room nights sold• Meetings & conferences
• SMERF & events
• Team sports
• Group tour
• Leisure Transient – typically 10% - 25%• Tourists
• Visiting friends & relatives
• Pass-thru on the highway
So what markets should you focus on for growth?

CVB/DMO Leadership Structure
Communication & Reporting; Runs the DMO
Board:• Long-Range Vision• Policy & Oversight• Advocacy with partners• Advocacy with electeds
Vision & Plan for thedestination
Board
Exec
Com
Visionary Strategic Plan:• Dedicated Funding• Board of Travel Industry Leaders• Focused Staff• Measurable ROI - Accountability
CEO
Staff-Team
Marketing the Destination
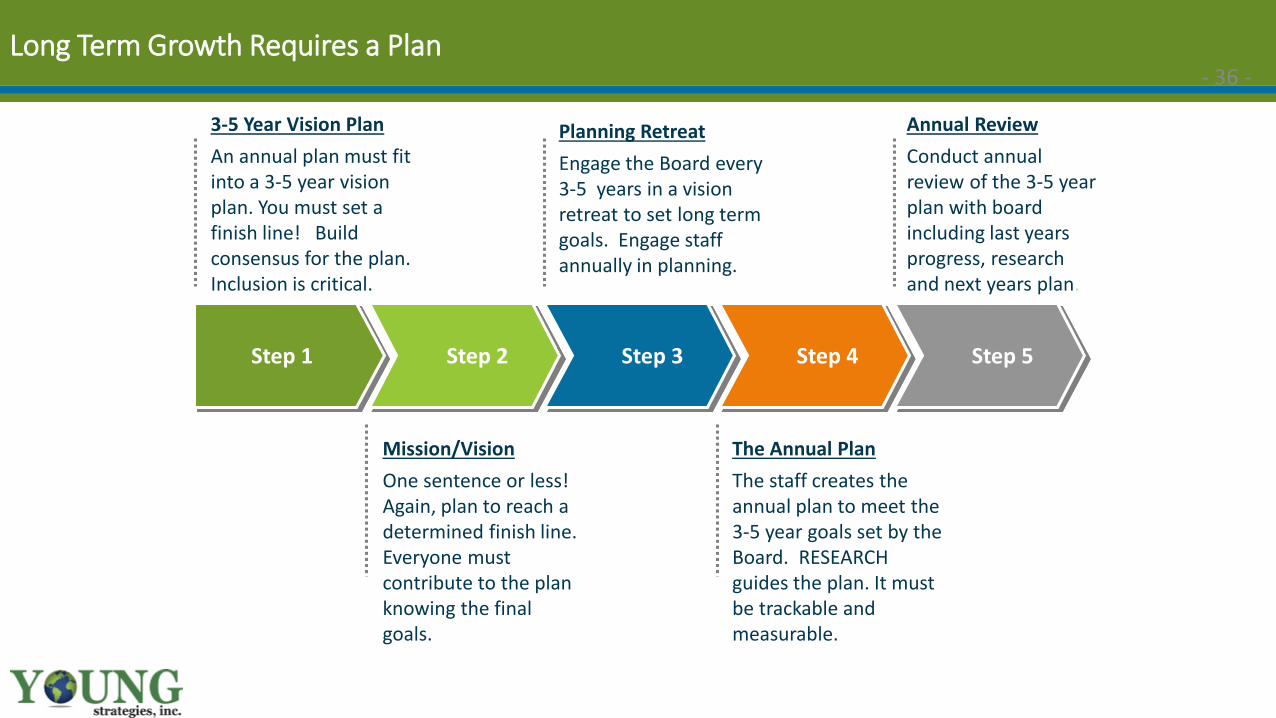
Long Term Growth Requires a Plan- 36 -
3-5 Year Vision Plan
An annual plan must fit into a 3-5 year vision plan. You must set a finish line! Build consensus for the plan. Inclusion is critical.
Step 1 Step 2 Step 3 Step 4 Step 5
Planning Retreat
Engage the Board every 3-5 years in a vision retreat to set long term goals. Engage staff annually in planning.
Annual Review
Conduct annual review of the 3-5 year plan with board including last years progress, research and next years plan.
Mission/Vision
One sentence or less! Again, plan to reach a determined finish line. Everyone must contribute to the plan knowing the final goals.
The Annual Plan
The staff creates the annual plan to meet the 3-5 year goals set by the Board. RESEARCH guides the plan. It must be trackable and measurable.

Standard CVB/DMO Staff Structure- 37 -
Board of Directors
President/CEO
Vice President of Brand
Development
Director of Communication
s
Director of Digital
Marketing
Marketing Manager
Vice President of Business
Development
Director of Business
Development
Marketing Manager
Director of Sports
Development
Director of Business
Development
Vice President of Visitor
Experience
Director of Event Services
Director of Visitor Services
Office Manager
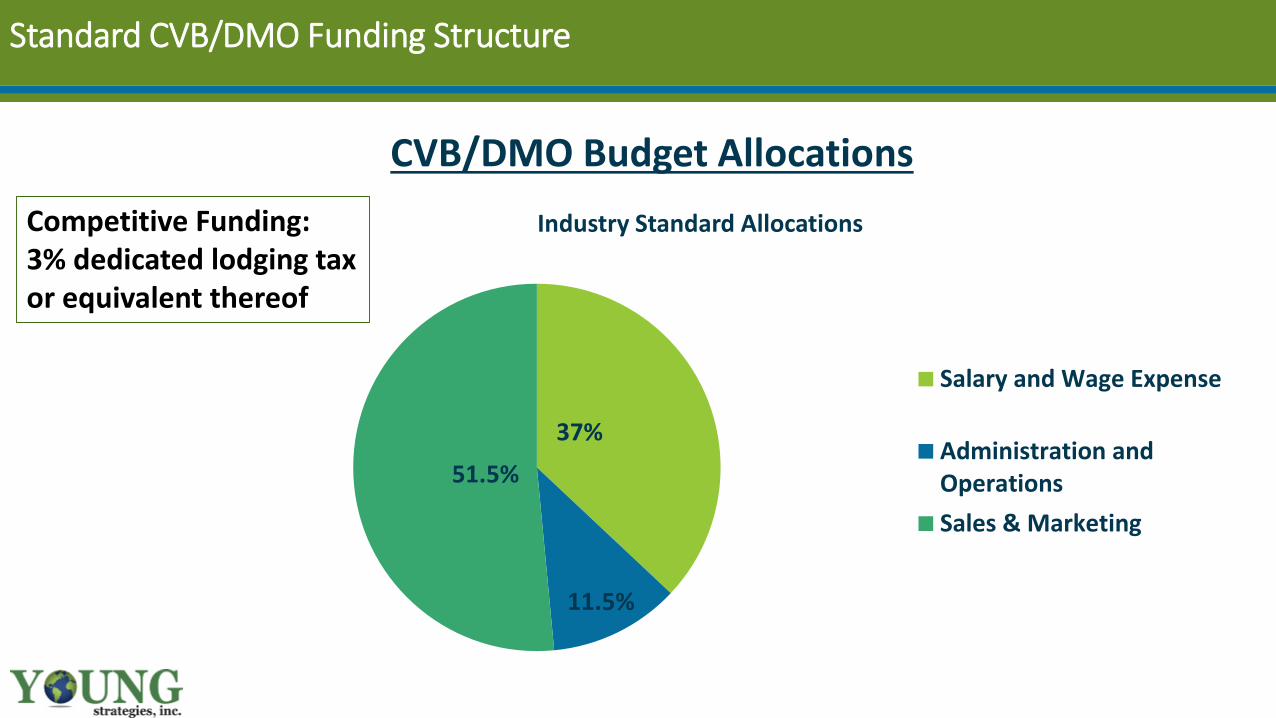
37%
11.5%
51.5%
Industry Standard Allocations
Salary and Wage Expense
Administration andOperations
Sales & Marketing
CVB/DMO Budget Allocations
Standard CVB/DMO Funding Structure
Competitive Funding:3% dedicated lodging taxor equivalent thereof

Growth Opportunity
Insert travel party spending and taxes chart
2018 Overnight Spending Impact
Statesville 2018 Daily Lodging Room Inventory 1,703
Statesville Annual Lodging Room Inventory (1,703 x 365 days) 621,595
2018 Lodging Occupancy Percentage (estimate) 60%
2018 Lodging Room Nights Occupied (estimate) 372,957
2018 Average Daily Spending Per Travel Party (estimate) $225.00
Total Overnight (paid lodging) Visitor Spending $83,915,325
Value of 1% Occupancy in 2018
Statesville Annual Lodging Room Inventory 1,703
1% Occupancy (1,703 X 365 X .01 =) 6,216
Visitor Spending Generated $1,398,600

Take- Aways
• Competition makes us work harder, makes us better!
• Regular competitive Assessments – internal & external (research)
• Invest in sales and marketing to grow travel spending & impact
• You need a sales and marketing team to compete
• You need a vision for Statesville as a destination
• Destination for….Meetings? Team sports? Weekend Getaways?
• A common enemy unites a group – declining market share in NC is the enemy
• Your biggest competitor may be YOU if you don’t embrace change


Contact Information
Berkeley Young,
Young Strategies, Inc
704-677-4018
facebook/young strategies
LinkedIn/berkeleyyoung

YOUNG STRATEGIES, INC
• Destination research and strategic planning
• Research for 150+ destinations in 27 states
• Communities, regions and states
• Travel industry focused
• National research data and trends analysis
• Writing and speaking
• Board workshops & planning sessions
• Listening to travelers