the competitive effects of not-for-profit hospital … competitive effects of not-for-profit...
TRANSCRIPT
* The article reflects the views of the authors, not those of the Federal TradeCommission or any individual Commissioner. We thank Denis Breen, Paul Pautler,Lou Silvia, John Simpson, and participants in the FTC seminar series, for helpfulcomments. Remaining errors are ours.
The Competitive Effects of Not-for-Profit Hospital Mergers: A Case Study
Michael G. Vita U.S. Federal Trade Commission*
and
Seth SacherCharles River Associates
Applying conventional horizontal merger enforcement rules to mergers ofnonprofit hospitals is controversial. Critics contend that the differentobjective function of not-for-profits entities should mitigate, and possiblyeliminate, competitive concerns about mergers involving nonprofithospitals. We provide evidence relevant to this debate by analyzing expost a horizontal merger in a concentrated hospital market. Here, thetransaction reduced the number of competitors (both nonprofit) in thealleged relevant market from three to two. We find that the transactionresulted in significant price increases; we reject the hypothesis that theseprice increases reflect higher post-merger quality. This study should helppolicymakers assess the validity of current merger enforcement rules,especially as they apply to not-for-profit enterprises.
JEL Nos. I11; K21; L31; L41; L44

1 See Complaint In the Matter of Santa Cruz Hospital, et al. 188 F.T.C. 382 (1994).
I. Introduction
Although researchers have made innumerable attempts to analyze the
relationship between competition (as proxied by concentration) and performance (e.g.,
price), empirical evidence on the actual competitive effects of horizontal mergers is
scarce. Perhaps this is not surprising. When assessed by contemporary antitrust
standards, most mergers (even most horizontal mergers) do not present a serious risk of
competitive harm. The handful that do typically either will be blocked in their entirety,
or approved conditional on the completion of some remedial action (e.g., the divestiture
of a critical competitive asset to a third party) designed to ameliorate the risk of
competitive harm. Hence, candidates for the study of (plausibly) anticompetitive
mergers will arise only infrequently; when, for example, the enforcement agencies lose
a merger challenge in court, obtaining no competitive relief, or when the enforcement
agencies do not challenge a transaction for reasons unrelated to the transaction’s
perceived competitive effects.
This paper takes advantage of one of these rare opportunities. We provide an
econometric analysis of a horizontal merger in a concentrated hospital market,
Dominican Santa Cruz Hospital’s acquisition of its sole rival in the city of Santa Cruz,
California, AMI-Community Hospital. According to the FTC, only two competitors --
both not-for-profit -- remained in the relevant market after the transaction.1 Absent
substantial efficiencies, or a credible threat of entry, standard antitrust analysis would
predict that an increase in concentration of this magnitude likely would lead to higher

2 See Statement of Chairman Janet D. Steiger in Support of Final Issuance ofConsent Order In the Matter of Dominican Santa Cruz Hospital, et al. 188 F.T.C. 382 (1994).
2
equilibrium prices. Consequently, this transaction would have been challenged by the
FTC, had the Commission been able to intervene before the transaction was completed.2
However, because the transaction was too small (in absolute size) to trigger the Hart-
Scott-Rodino filing thresholds, the FTC did not receive prior notification of the
transaction, and the parties were able to consummate the acquisition before the FTC
could seek a preliminary injunction. Ultimately, the FTC entered into a consent order
with Dominican Hospital, but the decree required only that Dominican notify the
Commission prior to any further acquisitions in the relevant geographic market – it did
not restore the premerger market structure. For this reason, this acquisition provides
an excellent opportunity to assess, ex post, the actual, as opposed to the predicted,
competitive consequences of a horizontal merger.
This study should be of interest for at least two reasons. First, as noted,
empirical studies of the price effects of horizontal mergers are comparatively rare,
notwithstanding their apparent importance to appraising the efficacy of federal merger
enforcement policy. Studies such as this should help policymakers assess whether the
enforcement decision rules embodied in the Merger Guidelines predict with an
acceptable degree of accuracy the competitive consequences of actual horizontal
mergers.

3 See Lynk (1994, 1995) for a more detailed review of the relevant theory andevidence.
3
Second, and more specifically, the applicability to hospital markets of the
antitrust agencies’ approach to horizontal merger analysis (i.e., the Merger Guidelines)
recently has been called into question. A substantial share of hospital output
(approximately 90 percent) is produced by private and public nonprofit hospitals.
Critics have contended that the antitrust agencies and courts have assumed that these
not-for-profit providers seek maximum profits, notwithstanding the substantial body of
theoretical and empirical analyses suggesting that nonprofit entities -- or more
specifically, certain types of nonprofit entities -- will eschew opportunities to profitably
exercise market power.3 For example (see Lynk (1995), pp. 440-41), it is conceivable that
a private nonprofit hospital sponsored and administered by the local community, might
function something like a consumer cooperative. If so, the incentives of producers and
consumers would be aligned, and any incentives the hospital might otherwise have to
raise prices anticompetitively would be attenuated. Alternatively, the behavior of a
nonprofit hospital whose profits are used to fund some particular set of activities
valued the firm’s managers – e.g., providing charity care to the poor – might be
indistinguishable from that of an identically situated for-profit entity.
Whether the (potentially) different incentive structure of not-for-profit hospitals
could attenuate the exercise of market power is of more than just academic interest.
The courts that must adjudicate horizontal merger challenges also have found such
4 See F.T.C. v. Butterworth Health Corporation and Blodgett Memorial Medical Center,(U.S. District Court, Western District of Michigan, Southern Division), September 26,1996, slip. op. at 27.
4
arguments compelling. In at least one case,4 a U.S. Federal District Court found that
the nonprofit, community-sponsored status of the merging parties was an important
factor in rebutting an otherwise convincing prima facie case against the merger of two
rival hospitals.
The transaction analyzed here provides an excellent opportunity to explore these
possibilities. The acquiring entity (Dominican Santa Cruz Hospital) is part of a chain of
Catholic hospitals operating in the western United States. Its sole remaining rival in
Santa Cruz county, Watsonville Community, is a locally-sponsored community
hospital. According to the arguments set forth above, Watsonville Community would
appear to be the type of nonprofit hospital least prone to exercise market power; any
such propensity to charge competitive prices would, moreover, place a powerful post-
merger competitive constraint on Dominican’s ability to raise prices. Consequently, an
analysis of both entities’ (but especially Watsonville’s) post-merger pricing behavior
should provide a valuable insight into the behavior of nonprofit producers.
The next section reviews briefly the empirical literature on hospital competition.
We review first those studies that have explored the empirical relationship between
concentration and hospital prices. These studies for the most part are cross-sectional in
nature, and do not specifically investigate the equilibrium effects of actual horizontal

5 The year 1983 is significant in most analyses of hospital markets because this isthe year Medicare instituted the prospective payment system (PPS). It is also the yearin which California enacted legislation permitting selective contracting between healthplans and individual hospitals.
5
mergers. The effects of mergers (including hospital mergers) are the focus of the
second, much smaller (but much more recent) body of research that we review.
Section III describes briefly the details of the Dominican-Santa Cruz transaction.
Section IV outlines the empirical strategy for studying the price effects of that merger.
Section V presents the empirical results.
II. Studies of Hospital Competition
A. Cross Sectional Studies
Most early (i.e.,pre-19835) studies of hospital competition were carried out using
a variant of the well-known “Structure-Conduct-Performance” (S-C-P) paradigm. As
noted by Bresnahan (1989, pp. 1012-13), the distinguishing features of this empirical
paradigm are reflected in the following assumptions: first, that price-cost margins can
be accurately measured with accounting data; and second, that cross-sectional variation
in market structure can be measured with a small number of observable variables
(including market concentration). Early studies of hospital competition varied the
standard SCP approach slightly by assuming that hospitals engaged mainly in quality,
rather than price, competition. Accordingly, the typical study from this period
attempted to discern the relationship between some measure of hospital costs (e.g., cost

6 A notable exception was Noether (1988), who found that increased competitionreduced mark-ups over cost.
7 For a comprehensive review of this literature see Pautler and Vita (1994). Forseminal works see Joskow (1980) and Robinson and Luft (1985).
8 For example, Dranove et al. (1993) found that an increase in the Herfindahl-Hirschman Index (HHI) from 2500 to 5000 results in a price increase of approximately 3percent for a basket of hospital services. Melnick et al. (1992) found that where a mergerreduces the number of competitors from three to two (assuming that the competitorshad equal shares), the per diem price for medical/surgical services increases by 9percent. Other examples are Keeler, Melnick, and Zwanziger (1999), and Simpson andShin (1998).
6
per admission) to some measure of competition.6 Usually, a negative relationship
between hospital concentration and costs was found (e.g., higher costs per admission
were observed in the less concentrated markets).7 Generally, this finding was
interpreted as reflecting the consequences of insurance-induced moral hazard, and
other principal-agent problems.
Studies using data from the mid-1980s and after, and which focus on the
California experience, present a different picture. Typically, these studies addressed
the relationship between market concentration and price, as opposed to market
structure and cost, and generally, they obtained results consistent with the traditional S-
C-P paradigm -- i.e., a positive relationship between concentration and price.8
While suggestive, these price-concentration studies do not provide direct
evidence of the effects of hospital mergers. One problem with drawing inferences about
the competitive effects of mergers from this literature is that the results are almost
surely sensitive to the way the geographic markets are defined, since this definition will

9 For example, see Kessler and McClellan (1999) and Werden (1989). Only theformer have offered an alternative method for defining antitrust markets. Althoughthere seldom may be good practical alternatives to patient flow data, it is nonethelesstrue that antitrust markets defined on this basis may lead to incorrect conclusions aboutthe competitive constraints faced by a particular pair of merging hospitals.
7
determine the value of the concentration index. Most of these studies delineated
markets with political boundaries (e.g., counties or MSAs), although some have
attempted to use patient origin data to define markets (e.g., Melnick et al. (1992)). Even
the latter approach, while seemingly less arbitrary than using political boundaries, has
been criticized as presenting biased view of actual antitrust markets.9 The second
problem is more fundamental, and derives from the disfavor into which the S-C-P
approach has fallen. Although studies continue to be carried out in this paradigm,
many economists have grown skeptical about the validity of its maintained hypotheses
-- in particular, the notion that cross-sectional variation in prices can be explained with
a small number of observable variables (see Bresnahan (1989, pp. 1012-13).
Consequently, alternative approaches to identifying and measuring market power have
been derived. In the following section, we discuss one such approach that has been
adopted as a means for assessing the competitive consequences of horizontal mergers.

10 Another form of “event study” sometimes used by economists are stockmarket event studies, which examine the effect of an event (e.g., the announcement of amerger) on the stock market value of some set of affected firms (e.g., rivals of themerging entities). See MacKinlay (1997) for a general description of this approach. Thestock market event study method on a number of occasions has been used to assess theconsequences of horizontal mergers (see, e.g., Eckbo (1983)), and we are aware of at leastone attempt to use this method to evaluate the competitive consequences of hospitalmergers (Woolley (1989); see Vita and Schumann (1991) for a critique of this study). While the stock market event study method applied to horizontal merger analysis doesnot require the researcher to identify the precise boundaries of the antitrust market, itdoes require the researcher to identify at least some of the firms whose profits likelywould be affected by the transaction.
11 Of course, one can do more. In the empirical section below, we also estimatethe effects of the merger on the price of (what appears to be) the merged entity’s closestrival. Failure to find a positive price effect for this producer might mean either that thisfirm (1) did not produce a close substitute; or (2) the merger did not create marketpower. Finding a positive price effect would suggest (ceteris paribus) that the producer
(continued...)
8
B. Empirical Literature on Actual Mergers
An alternative strategy to the S-C-P paradigm for assessing the equilibrium
consequences of merger-induced changes in market structure is to examine directly,
through a comparison of the pre- and post-merger prices charged by the merged entity
(and, perhaps, its plausible rivals), the equilibrium effects of the transaction. This
“event study” approach obviates the necessity of defining the “relevant market.”10 If
the merger creates market power, then (after suitably controlling for other possible
shifts in the exogenous determinants of price) one should observe the merged entity
raising its price post-merger. It is unnecessary to identify the relevant market to carry
out this test -- at minimum, one requires only data for the merged entity.11

11 (...continued)was in the relevant market, and that the merger was anticompetitive.
12 Connor, Feldman, and Dowd (1998), and Wicks, Meyer, and Carlyn (1998)also attempted to assess the price effects of horizontal hospital mergers, but bothstudies exhibit considerable methodological problems. Connor et al. estimate anequation of the form: %? PRICE it = f(%? Xit, Mi), where the dependent variable is thepercentage change price of the ith hospital from period t-1 to period t, Xit are exogenousvariables, and Mi is a dummy variable set equal to 1 if hospital i merged during thesample period. It is difficult to reconcile this specification with economic theory, whichpredicts a relationship between the price level (not its rate-of-change) and marketstructure. Additionally, it appears that the merger dummy variable is either 0 or 1 forthe entire sample period, instead of taking on different values for the pre- and post-merger periods.
Wicks et al. (1998) compare pre- and post-merger price levels, but do not includeany control variables. Hence, it is difficult to know if any changes in prices reflect theexercise of market power, or are the result of changes in exogenous price determinants.
9
Among the first researchers to employ this strategy were Barton and Sherman
(1984), who found that two mergers of microfilm producers increased both prices and
profits. A very similar empirical strategy was used by Kim and Singal (1993) in their
study of the price effects of airline mergers. Later, Schumann et al. (1992, 1997)
examined the price effects of mergers that took place in three different industries:
cement, corrugated paperboard, and titanium dioxide.12
Barton and Sherman, and Kim and Singal used a very simple -- and restrictive --
empirical strategy for measuring the competitive impact of a horizontal merger.
Essentially, they analyzed movements in the price of the product affected by the
merger, relative to the price of a substitute product hypothesized to face similar
demand and cost conditions, but unaffected (or at least less affected) by the merger.
The competitive effects of the transaction were assessed through a simple t-test of the

13 Kim and Singal (1993, p. 554) rationalize this as follows: “Industry-widechanges, like fluctuations in fuel prices, changes in labor cost, and seasonal or cyclicalvariations in demand are likely to have an equivalent effect on routes of a similardistance.” They go on to observe (footnote 20): “Local economic conditions may affectsome routes differently. We hope the large number of observations in our sampleaverages out the noise.”
14 By “reduced form,” we mean that they regressed price on its exogenousdeterminants (e.g., demand- and cost-shifters).
10
hypothesis that the pre-merger price ratio equaled the post-merger ratio, against the
alternative that the ratio increased. No other control variables were employed in the
analysis – the authors assumed, implicitly, that the reduced form price equations for
both products were identical, and therefore that the differences in the ratios of the
prices could be attributed solely to changes in market structure.13
Schumann et al. (1992, 1997) adopted a different approach – they estimated a
reduced form price equation with data spanning the pre- and post-merger periods.14
The competitive effect of the transaction was captured with a dummy variable set equal
to one for the post-merger period. By using this specification, Schumann et al. assume
that their control variables (consisting mainly of indices of demand and factor prices)
adequately control for the exogenous determinants of price, so that the coefficient on
the merger dummy variable can be interpreted as reflecting the competitive effects of
the transaction. If, however, there are unobserved exogenous determinants of price that
are correlated with the merger dummy, then the coefficient on this variable will reflect
the competitive effects of the transaction, as well as movements in these unobserved
11
price determinants. As a consequence, one will incorrectly estimate the price effects of
the transaction.
In the empirical section below, we propose an empirical framework that
combines elements of the Barton and Sherman, and Schumann et al. approaches. We
believe that this strategy will provide the best method for identifying accurately the
competitive effects of the acquisition. Before setting forth this empirical strategy, we
first describe in greater detail the events of the Dominican-Santa Cruz transaction.
III. History of the Transaction
On March 8, 1990, Dominican Santa Cruz Hospital (“Dominican”), a 259-bed,
not-for-profit hospital, affiliated with the Catholic Healthcare West system, purchased
the only other hospital in the city of Santa Cruz, AMI-Community Hospital
(“Community”). Community, which was affiliated with American Medical
International, was licensed for 180 beds and was a for-profit entity. Dominican and
Community were located about two miles apart. The only other hospital in Santa Cruz
county was Watsonville Community Hospital, located about 14 miles south of the city.
The city of Santa Cruz is located about 40 miles south of San Jose, and 80 miles south of
San Francisco. Santa Cruz county is bordered on the south and west by the Pacific
ocean, and on the north and east by the Santa Cruz mountains.
The FTC’s analysis of patient flows suggested that the overwhelming majority of
the three Santa Cruz county hospitals’ patients resided in Santa Cruz county, and that

15 According to the 1992 Merger Guidelines (§1.51(c)), “the [FTC] regards markets[with HHIs above 1800] to be highly concentrated . . . [when] the post-merger HHIexceeds 1800, it will be presumed that mergers producing an increase in the HHI ofmore than 100 points are likely to create or enhance market power or facilitate itsexercise.”
16 As then-FTC Chairman Steiger observed at the time, “[t]he facts of this caseprovide sufficient reason to believe that this acquisition violates Section 7 of the ClaytonAct. Ordinarily, such facts would lead the Commission to seek a preliminary injunctionin federal district court.” See Statement of Chairman Janet D. Steiger in Support of Final
(continued...)
12
most Santa Cruz residents receiving inpatient hospital care received it from hospitals in
the county. Accordingly, the FTC’s complaint alleged that the relevant geographic
market was “Santa Cruz County and/or portions of Santa Cruz County.” According to
the Complaint, the merger increased the market share (of patient-days) of Dominican
from 62 percent to approximately 73 percent, and increased the market share (measured
by available beds) from 50 percent to 73 percent. The Herfindahl-Hirschman Index for
the relevant antitrust market increased by over 1,700 points, from approximately 4,620
to approximately 6,350 (measured by patient-days); and by over 2,300 points (from
approximately 3,770 to approximately 6,090) when measured by available beds. Under
the Merger Guidelines enforcement criteria, a transaction generating concentration
figures of this magnitude would be presumed anticompetitive. Absent compelling
evidence that such a merger would create substantial efficiencies, or that the exercise of
market power would be constrained by the threat of entry, normally the FTC would
seek to preliminarily enjoin such a transaction.15 Had the FTC had the opportunity to
seek a preliminary injunction in this case, it would have done so.16 However, as noted
16 (...continued)Issuance of Consent Order In the Matter of Dominican Santa Cruz Hospital, et al. 188 F.T.C.382 (1994).
17 See Statements of Chairman Steiger, Commissioner Azcuenaga, andCommissioner Yao In the Matter of Dominican Santa Cruz Hospital, et al. 118 F.T.C. 382(1994).
13
earlier, the small absolute size of the transaction failed to trigger the Hart-Scott-Rodino
filing thresholds, and the FTC was not able to seek an enforcement action until after the
transaction was completed.
In March, 1993, approximately three years after the merger was consummated,
the FTC accepted a consent agreement with Dominican Santa Cruz Hospital and
Catholic Healthcare West. The consent order did nothing to restore the pre-merger
competitive environment; it required only that the respondents obtain the
Commission’s prior approval before acquiring any other hospitals in Santa Cruz
County. Although all of the FTC Commissioners concluded that the merger probably
had created significant market power, a majority of the FTC Commissioners concluded
that the agency had few good remedies available to it.17 The acquired hospital,
Community, already had been converted to a skilled nursing/rehabilitative care
facility. Thus, the effects of the merger could have been reversed only at considerable
cost. Further, Sutter Health, a major Northern California hospital chain, had announced
plans to construct an acute care hospital in Santa Cruz, and had already purchased a 3.8

18 Sacramento Business Journal, March 16, 1992.
19 “Sutter Health, a major Northern California hospital chain, announced plansto construct an acute care hospital in Santa Cruz, which would restore a third hospitalcompetitor in the market. The very real prospect that Sutter will enter this market,before a divestiture decree could be obtained through litigation and a willing buyerfound, is an additional factor weighing against pursuit of a divestiture order.” SeeStatement of Chairman Janet D. Steiger in Support of Final Issuance of Consent Order Inthe Matter of Santa Cruz Hospital, et al. 188 F.T.C. 382 (1994).
14
Pit ' P(Wit, Zit, Mt)
acre site toward that end.18 The FTC reasoned that entry by this entity likely would
already have occurred by the time divestiture could be completed, thereby moving the
market closer to the pre-merger status quo more rapidly than could be accomplished
through the FTC’s administrative process.19 As it turned out, some time in the second
quarter of 1996, Sutter Health opened the Sutter Maternity and Surgery Center with 30
licensed and 21 staffed beds.
IV. Methods and Data
A. The Empirical Model
To identify the equilibrium price effects of the Dominican/Santa Cruz
acquisition, we employ an empirical specification that borrows elements from
Schumann et al. (1992) and Barton and Sherman (1984). Like Schumann et al., we
estimate the reduced form equation for price:
20 See note 13, above.
15
[1]
where Pit is the price of hospital i at time t; Zit is a vector of demand shifters (e.g.,
income); Wit is a vector of input prices; and Mt is a dummy variable set equal to one for
all time periods subsequent to the transaction. In section V, below, we estimate
equation [1] separately for Dominican Hospital and its closest remaining rival,
Watsonville Hospital.
Because we cannot observe all of the exogenous factors that might affect the
equilibrium prices of the merged entity and its competitors, we incorporate elements of
the approach used by Barton and Sherman (1984) and Kim and Singal (1993) in their
merger studies. Essentially, these authors analyzed movements in the price of the
product affected by the merger, conditional on the price of a substitute product that
faces similar demand and cost conditions, but which is unaffected by the merger. In
other words, this other product serves as a control group; it is assumed that the
exogenous determinants of price (e.g., input prices) affect the “control group” and the
“treatment group” equally.20 If true, and if the merger had no impact on equilibrium
price, then the relationship of the price of the merged entity to the price of the “control”
would be unchanged post-merger. Post-merger changes in this ratio can then be
imputed entirely to the transaction.
As noted earlier, the assumption that exogenous factors affect the merged entity
and the control group equally is restrictive – it is unlikely that all of the determinants of
21 As we discuss below, a positive coefficient potentially is also consistent withpost-merger quality improvements.
22 Knowing the dimensions of the market would be important if the merger wasanticompetitive, and if we wished to estimate the welfare loss associated with thetransaction. Then, we would also wish to know which other hospitals also raised theirprices (and by how much). This paper attempts to address a much simpler question: did the merged entity (and its closest rival) raise price post-merger?
16
price will be matched across the two groups. Accordingly, we include as regressors, in
addition to the price of the control group, the observable determinants of that price (e.g.,
factor prices faced by the peer group hospitals). This specification avoids the
unnecessarily restrictive assumption that all intertemporal differences in the covariance
of the two prices is attributable to the change in market structure. Below, the criteria
used to construct this control group (which we refer to as the “peer group”) are
discussed in greater detail.
Carrying out the analysis via the estimation of equation [1] eliminates the
necessity of specifying a geographic market for the outputs produced by the merging
hospitals. If the Dominican-Community merger was anticompetitive, then the
coefficient on the merger dummy variable should be positive,21 irrespective of the
dimensions of the market in which Dominican and Community competed prior to
merger.22 Conversely, if the merger was not anticompetitive, for whatever reason (e.g.,
low concentration in the relevant market, subsequent entry, offsetting efficiencies, or
not-for-profit status), then the coefficient on this variable should be zero (or negative, if

23 In the OSHPD data, there are various categories for both gross and net patientrevenue. Net revenue is equal to a hospital’s gross revenue minus any discounts that itoffers. In the data, the gross revenue figures distinguish between inpatient andoutpatient revenue, however, the net revenue figures do not. As noted by Dranove et al.(1993), failure to account for discounts seriously understates the effect of competition onprice. Thus, several adjustments must be done in order to obtain estimates of netinpatient revenue from the gross inpatient data. While OSHPD has been collectingquarterly data from hospitals since approximately 1980, data prior to 1986 did not inany way distinguish revenue by payer group. As a result, observations from prior to1986 were eliminated. For data from 1986 to 1992, net inpatient price was calculated bymultiplying total net revenues from non-Medicare, non-Medicaid patients by the ratioof gross inpatient revenue to gross total revenue at the hospital. While this net revenuefigure eliminates Medicare and Medicaid patients it does include revenue from somepatients in various non-Medicaid indigent programs. This net revenue figure is thendivided by discharges to obtain the average price paid per non-Medicare, non-Medicaidacute-care inpatient. We also adjusted the number of discharges by the ratio (totalrevenue-bad debt)/total revenue in order to account for bad debt.
For data after 1992, patient revenue for various indigent programs is reported ina separate category. In order to keep the observations consistent over time, revenuefrom this category was added to the revenue figures for commercially insured patients.
(continued...)
17
merger-related efficiencies reduced costs and prices). In neither case need we specify a
geographic market.
B. Description of the Variables
1. Price
Each calendar quarter, California-licensed hospitals file a Financial Data Report
with the Office of Statewide Health Planning and Development (OSHPD). These data
allow us to calculate quarterly observations (for 1986 through 1996, inclusive) of the
average net revenue received per inpatient acute-care admission for privately insured
patients.23 Of course, hospitals provide numerous inpatient services, some of which

23 (...continued)Net price was then calculated using the same methodology as outlined for the 1986 to1992 data.
24 For a critical overview of the “acute care inpatient” product market definitionused in hospital merger investigations, see Sacher and Silvia (1998).
25 DRGs refer to a system of classifying patients based on medical diagnoses andsurgical procedures. Originating at Yale University during the 1970s, the DRG systemhas been widely adopted by payers and providers as a way of classifying patients.
18
may or may not be demand- or supply-side substitutes. Nevertheless, a single measure
of inpatient price is consistent with the so-called “cluster” approach to defining hospital
product markets used in virtually all hospital merger investigations.24
2. Control Variables
As is obvious, the unit of output employed in this study – an inpatient discharge
– is nonhomogeneous. Patient stays can and do vary substantially in terms of their
resource intensity. Consequently, cross-sectional and intertemporal comparisons of the
“price” of this output are meaningless unless one controls somehow for this
heterogeneity.
We employ several such controls. First, like other researchers (e.g., Simpson and
Shin (1998)), we construct an index of hospital “casemix.” The Healthcare Financing
Administration (HCFA) assigns a “caseweight” to each diagnostic related group
(DRG).25 This index measures the “resource intensity,” used, on average, for each DRG
relative to other DRGs and over time. The OSHPD discharge data set includes the date

26 All hospitals in our “peer group” were located in an MSA for which HCFAcreates a wage index. The exception is El Centro Regional Medical Center in ImperialCounty. For this hospital we used a composite HCFA wage index for non-metropolitanareas of California.
19
of discharge and DRG for each patient. Using these data, we created a quarterly
casemix indicator for each hospital used in the empirical analysis. This was done as
follows. Each non-Medicare/non-Medicaid discharge at each hospital for each quarter
was weighted using the HCFA caseweight index for the relevant DRG. The weighted
discharges were then summed and divided by the total number of discharges for each
quarter at each hospital to obtain the casemix index.
As a further control for discharge heterogeneity, we also include the average
length-of-stay for privately insured patients. The rationale for including this measure is
straightforward – each additional day of hospitalization requires the consumption of
additional labor and material resources. One cannot compare the price of a discharge
across different time periods, or across different hospitals, unless one controls for
variations in length-of-stay.
Equilibrium hospital prices also will be affected by exogenous changes in factor
prices. We include two variables to control for these shifts. First, HCFA computes a
wage index for all urban areas (a county or set of counties) based on the salaries and
wages of various health care workers in the relevant locale.26 This index is used to
adjust hospital payments under the Prospective Payment System (PPS) for Medicare.

27 Though Watsonville Hospital suffered damage from the earthquake, theOSHPAD data provide little support for the proposition that its productive capacitywas substantively impaired by this damage. Whether measured by total patient days ortotal discharges, the OSHPAD data suggest that Watsonville’s output actually increasedafter the quake. A regression of total patient days against a time trend and the quakedummy (=1 for 3rd quarter 1989 and afterwards) yields a coefficient on quake of 1069.83(t=3.26). A similar regression using total discharges yields a coefficient (t-statistic)on quake equal to 22.03 (0.22).
20
As an additional control variable, we include the BLS Producer Price Index for surgical
and medical instruments and apparatus.
It is well-established empirically that the growth of managed care institutions
(e.g., HMOs, PPOs) has facilitated more intense price competition among hospitals(e.g.,
Dranove, Shanley, and White (1993); Kralewski et al. (1992)), as well as greater
productive efficiency. Consequently, other things equal, we would expect to observe
lower prices in markets where selective contracting by managed care organizations is
more prevalent. Ideally, we would like to utilize some measure of the market share of
managed care institutions in the relevant market. Unfortunately, such data are not
readily available. As a proxy, we calculate for each hospital the percentage of total
discharges for which the expected payment source is an HMO or other prepaid health
plan.
We also control for the effects of the October 1989 northern California
earthquake, which inflicted some damage on Watsonville Hospital, and may have
reduced (exogenously) Watsonville’s productive capacity, leading to higher prices for
reasons unrelated to the Dominican transaction.27 To capture the competitive effects of

21
this event, we create a dummy variable (quake) equal to 1 for the 3rd quarter of 1989
and all subsequent periods, and 0 otherwise.
Last, similar to other empirical studies of hospital mergers (e.g., Lynk (1995),
Simpson and Shin (1998)), we include a number of other variables to control for
exogenous demand- and cost-side variation. These consist of per capita income, the
county-level unemployment rate, county population density, share of admissions
Medicare, and share of admissions MediCal.
Table 1 contains descriptive statistics for the variables used in empirical analysis.
C. Creation of the Peer Group
As noted above, an important element of our study is the creation of a group of
hospitals comparable to Dominican Santa Cruz and other in-market hospitals, and the
inclusion of their prices (and the exogenous determinants of their prices) as an
explanatory variable in the price equation. By so doing, we hope to control for
otherwise unobserved demand and cost factors, unrelated to the merger, that might
influence intertemporal price behavior at the merging hospitals. The State of California
has undertaken two studies to categorize hospitals into peer groups for purposes of
setting Medi-Cal reimbursement levels, the most recent in 1991 (Department of Health
Services, 1991).
22
These studies form the basis for the construction of the peer group used here.
The peer grouping method used by the State of California first placed specialty,
teaching, and prepaid hospitals in their own separate peer groups. The study then used
“cluster” analysis to group rural hospitals and other “unusual” hospitals (see State of
California (1991), § 5). After the latter were classified into these peer groups, only urban
short term facilities remained. These facilities were then subdivided into peer groups
on the basis of licensed bed size. In the 1982 study, Dominican Santa Cruz and
Community Hospital of Santa Cruz were placed in the “moderately-sized”urban
category, while Watsonville was placed in the “small-urban” hospital peer group. In
the 1991 study, Dominican Santa Cruz was placed in the “medium-sized urban”
hospital peer group, which consisted of all hospitals not elsewhere classified with
between 170 and 270 licensed beds. Watsonville was placed in the “moderately small-
sized” urban hospital peer group, which consisted of all hospitals not elsewhere
classified with between 95 and 170 licensed beds.
We used the following procedure to establish a peer group for the current study.
First, to ensure that peer hospitals were located in markets as similar as possible to the
Santa Cruz market, hospitals located in counties that were part of very large Primary
Metropolitan Statistical Areas (PMSAs) were eliminated. This eliminated hospitals
located in the following counties: Los Angeles, Orange, Ventura, Riverside, San
Bernardino, San Diego, San Francisco, Alameda, Contra Costa, Marin, San Mateo and

23
Santa Clara. The competitive environment in such large urbanized areas likely is very
different from that found in the less urbanized area of Santa Cruz.
Next, the peer group was restricted to those hospitals that were placed in any of
the short term urban hospital peer groups in the 1991 California study, and were
licensed with between 100 and 300 beds in that year. While somewhat arbitrary, these
licensed bed cut-offs would appear to limit the sample to hospitals reasonably
comparable to the hospitals in Santa Cruz. This left 41 potential peer group hospitals.
We next eliminated those hospitals in this group that were not between 100 and 300
licensed beds, and/or did not fall under one of the urban hospital groupings in the 1982
California Peer Group survey. This left 33 potential peer group hospitals. We next
eliminated any hospitals that did not report between 100 and 300 beds in the 1996 AHA
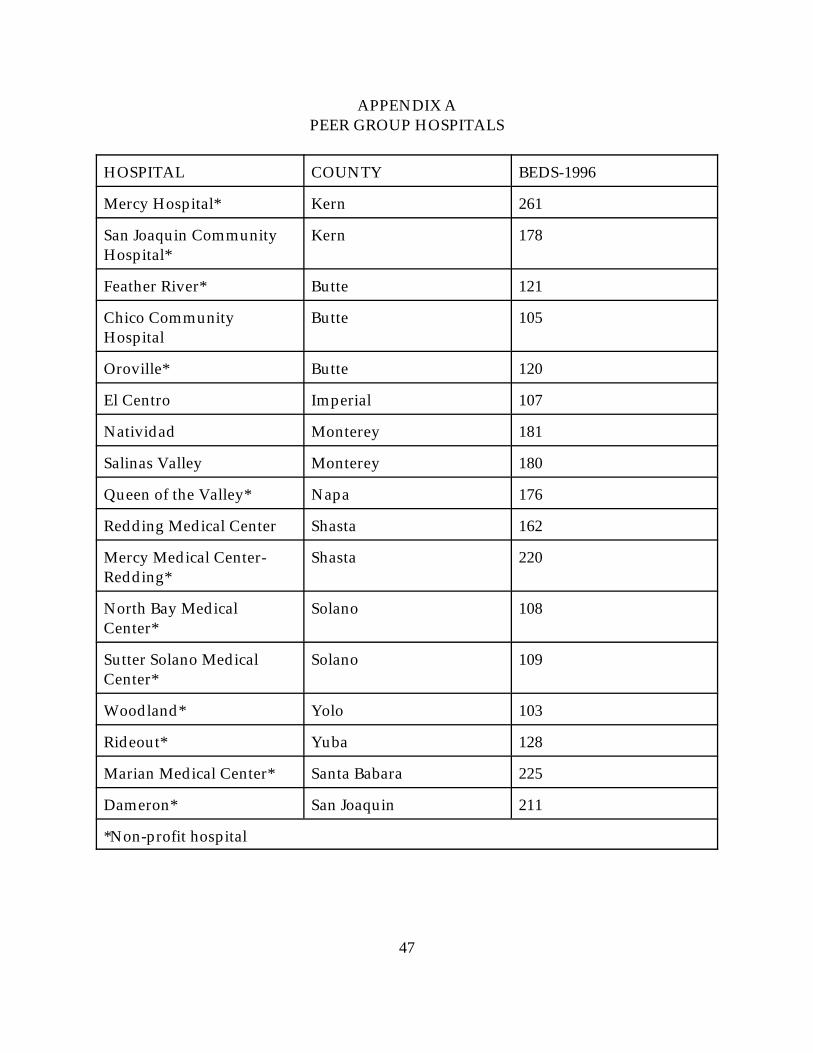
Guide. This left 25 potential peer group hospitals. We then eliminated all hospitals that
had themselves been involved in a horizontal acquisition as reported in the OSHPD
Hospital History Listing database. This group of 17 remaining hospitals comprise our
peer group (see Appendix A).
28 We conducted a Chow test to determine if the Watsonville and Dominicandata should be pooled. The Chow test rejected this restriction at the 5 percentsignificance level. Accordingly, we estimate the price equation separately for eachhospital.
29 See Newey and West (1987) and Greene (1997, p. 506). The Newey-Westestimator is a refinement of the White (1980) heteroskedasticity-consistent estimator; itproduces standard errors that consistently estimate the true covariance estimatorwithout requiring the researcher to specify the precise structure of the covariancematrix. The Newey-West estimator does require the researcher to specify the maximumlength of the autocorrelation relationship; we experimented with lags of 1, 2, and 3. Forthe Dominican equation, the corresponding t-statistics on the merge dummy ranged invalue from 1.986 (lag=1) to 2.47 (lag=3).
We also estimated the parameters of these equations using OLS and feasible GLSusing the Hildreth-Lu correction for first-order autocorrelation. These results aresimilar to those reported in Tables 2 and 3; the principal difference is found in theWatsonville equation, where the statistical significance of the coefficient on merge fell. In the Dominican price equation, the estimated coefficients (t-statistics) on merge were:1153.6 (2.44) [OLS]; 1300.6 (2.66) [Hildreth-Lu]. In the Watsonville equation, theestimated coefficients (t-statistics) on merge were: 497.5 (0.73) [OLS]; 550.6 (0.81)[Hildreth-Lu].
24
V. Empirical Results
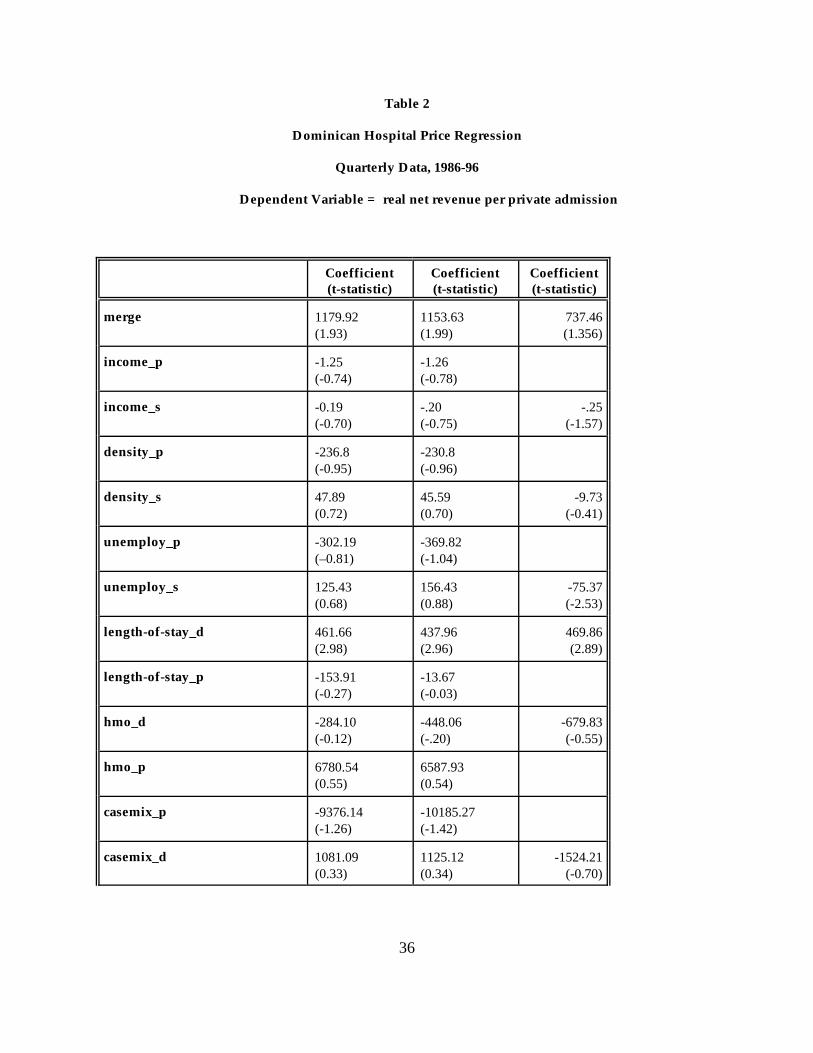
Tables 2 and 3 present the estimated parameters of the reduced form price
equation. Table 2 contains the results for Dominican; Table 3 presents the results for
Watsonville.28 The parameters are estimated using ordinary least squares;
autocorrelation and heteroskedasticity consistent standard errors are computed using
the Newey-West (1987) estimator.29 These results are consistent with the possibility that
the merger was anticompetitive.
30 We also estimate this equation using the log of the ratio of the Dominican(Watsonville) price to the average peer group price. The basic results are unchanged.
25
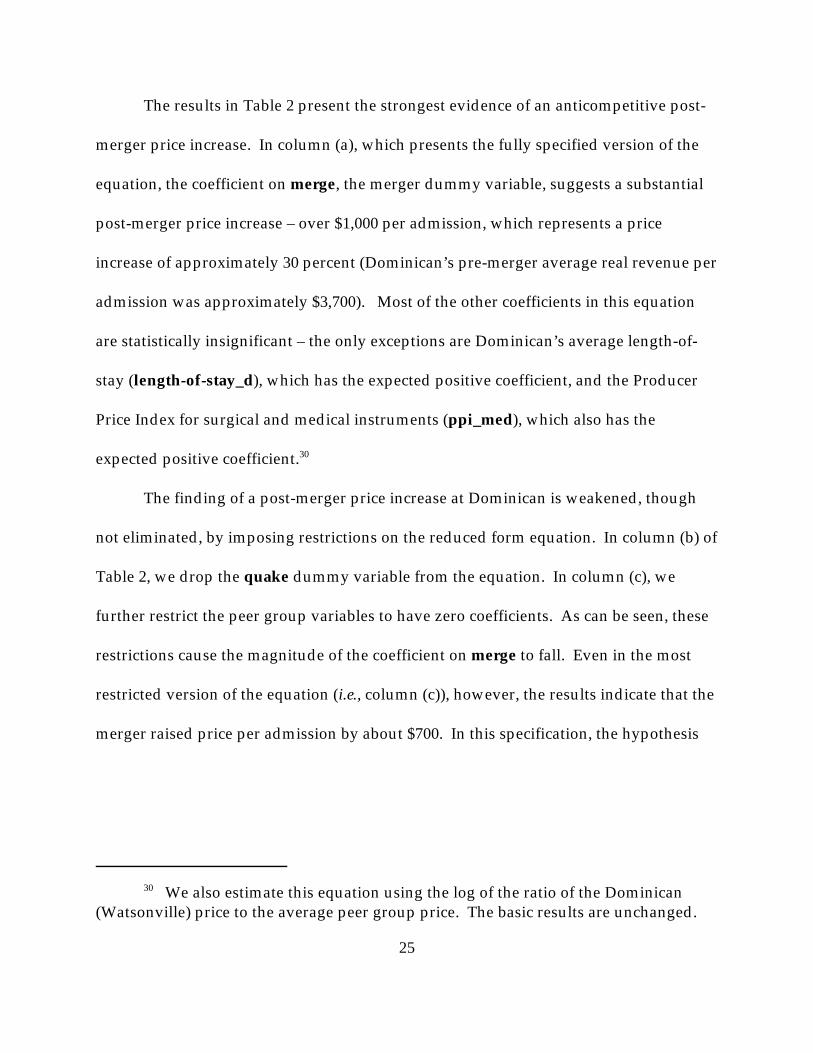
The results in Table 2 present the strongest evidence of an anticompetitive post-
merger price increase. In column (a), which presents the fully specified version of the
equation, the coefficient on merge, the merger dummy variable, suggests a substantial
post-merger price increase – over $1,000 per admission, which represents a price
increase of approximately 30 percent (Dominican’s pre-merger average real revenue per
admission was approximately $3,700). Most of the other coefficients in this equation
are statistically insignificant – the only exceptions are Dominican’s average length-of-
stay (length-of-stay_d), which has the expected positive coefficient, and the Producer
Price Index for surgical and medical instruments (ppi_med), which also has the
expected positive coefficient.30
The finding of a post-merger price increase at Dominican is weakened, though
not eliminated, by imposing restrictions on the reduced form equation. In column (b) of
Table 2, we drop the quake dummy variable from the equation. In column (c), we
further restrict the peer group variables to have zero coefficients. As can be seen, these
restrictions cause the magnitude of the coefficient on merge to fall. Even in the most
restricted version of the equation (i.e., column (c)), however, the results indicate that the
merger raised price per admission by about $700. In this specification, the hypothesis

31 We test the null hypothesis that the parameters on the peer group variablesjointly equal zero. For the Dominican equation, the test statistic (distributed F(10, 19))equals 1.14, which means that the null hypothesis can be rejected only at p=.39. For theWatsonville equation, the corresponding test statistic and significance level are 1.23(p=.33).
32 We can reject the null hypothesis that the true parameter on merge equals zeroat the 31 percent level in the unrestricted version of the equation (see Table 3, column(a)). Columns (b) and (c) of Table 3 present restricted versions of the Watsonville priceequation. Comparing the coefficients on merge across these different specificationsshows that the estimated price effect of the transaction on Watsonville’s price is fairlyrobust – it remains at about $500 per admission. The statistical significance of thiscoefficient increases as these restrictions are imposed -- from p = .31 in column (a) to p =.16 in column (c).
33 See, e.g., Werden and Froeb (1994, p. 413). Werden and Froeb analyze thecompetitive consequences of horizontal mergers in differentiated products marketswhere firms engage in static price competition.
26
that the true value of this parameter equals zero is rejected at the p = .18 significance
level.31
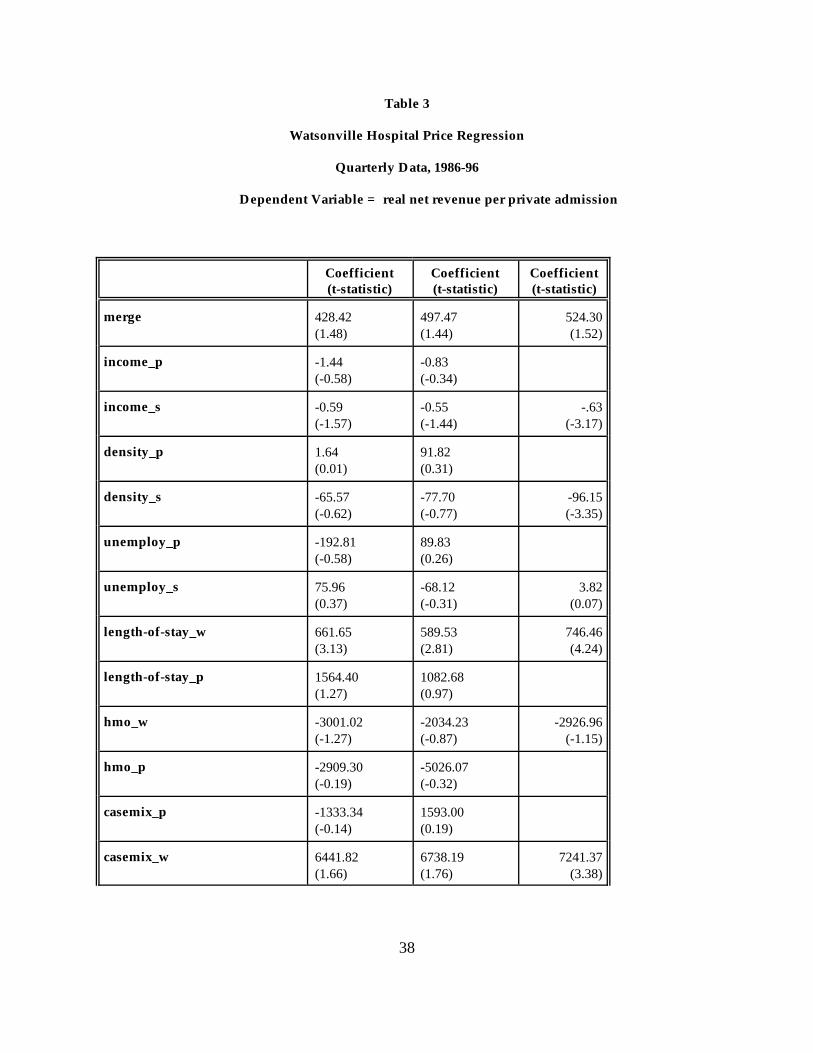
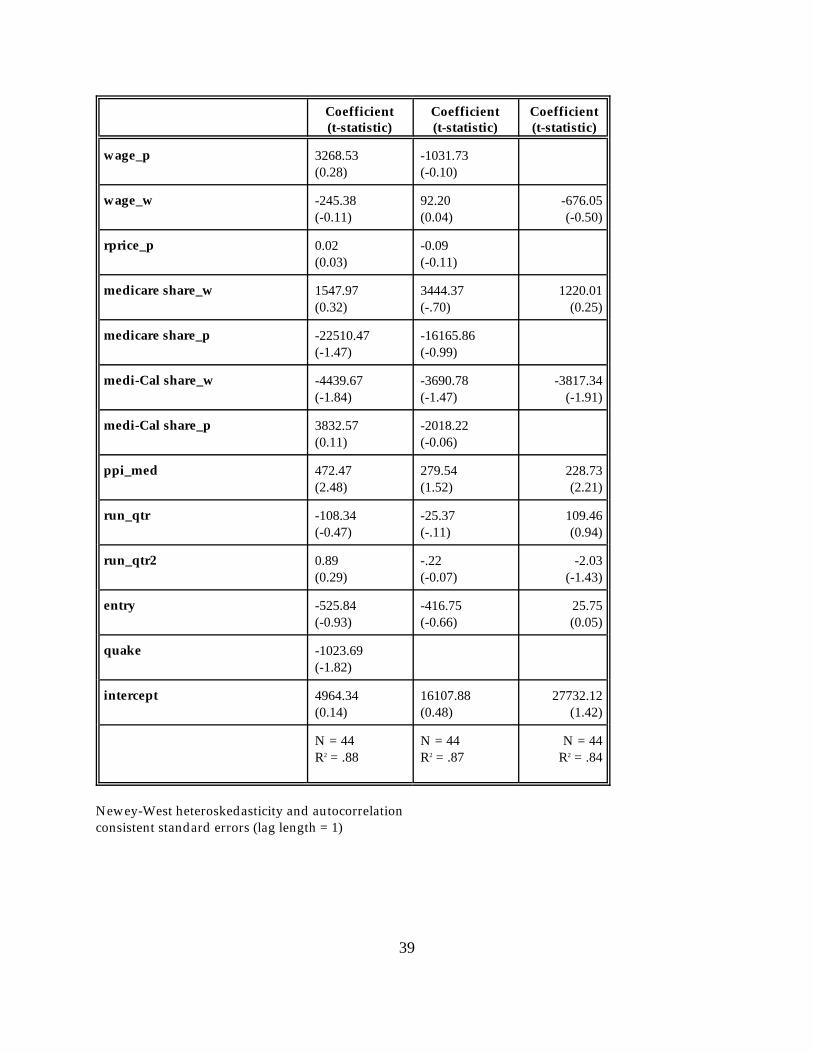
Table 3 presents the estimated coefficients for the Watsonville price equation.
The pattern of results is similar to that for Dominican. Most importantly, the coefficient
on merge in the Watsonville equation suggests a post-merger price increase, albeit of a
smaller economic magnitude (approximately one-half as large) than the estimated
increase at Dominican, and of a lesser degree of statistical significance.32 This finding --
a smaller, but positive price effect -- is consistent with the predictions of many
differentiated products oligopoly models,33 and is particularly noteworthy, given that
Watsonville is the type of hospital – namely, locally sponsored and administered –
hypothesized to be least likely to exercise market power.

34 See Statement of Commissioner Yao. Dominican claimed that CommunityHospital was inefficiently small, and that efficiencies could therefore be realized byconverting it to a skilled nursing/rehabilitation facility, and channeling its patients toDominican.
35 For a large number of clinical procedures there is empirical evidence thatoutcomes improve with patient volume. See, e.g., Begg et al. (1998) and Selby et al.(1996).
27
While the empirical results presented in Tables 2 and 3 are consistent with an
anticompetitive post-merger price increase, our inability to observe and measure
quality perfectly means that we cannot rule out the possibility that the price increases
reflect improvements in quality, rather than increased price-cost markups with
unchanged (or even diminished) quality levels. We are, however, skeptical about the
validity of this interpretation. First and foremost, the parties to the acquisition made no
such claims in defense of the transaction. Rather, the parties claimed that the
efficiencies from the transaction would derive from the realization of scale-related
production efficiencies.34 To the extent that such scale economies were realized, we
would expect prices to fall, other things held constant.
It is perhaps conceivable that consolidation of particular services at Dominican
could lead to volume-related quality increases – for example, because clinical outcomes
for some procedures improve as the procedure is performed with higher frequency at a
particular location.35 Then, Dominican might be able to capture some or all of the value
of this quality increase in the form of higher prices.
36 The other possibility is that marginal cost increases with output. Thispossibility is difficult to reconcile with the efficiency claims actually put forth by theparties; i.e., that the merger allowed the merged entity to enjoy scale-related reductionsin unit cost.
28
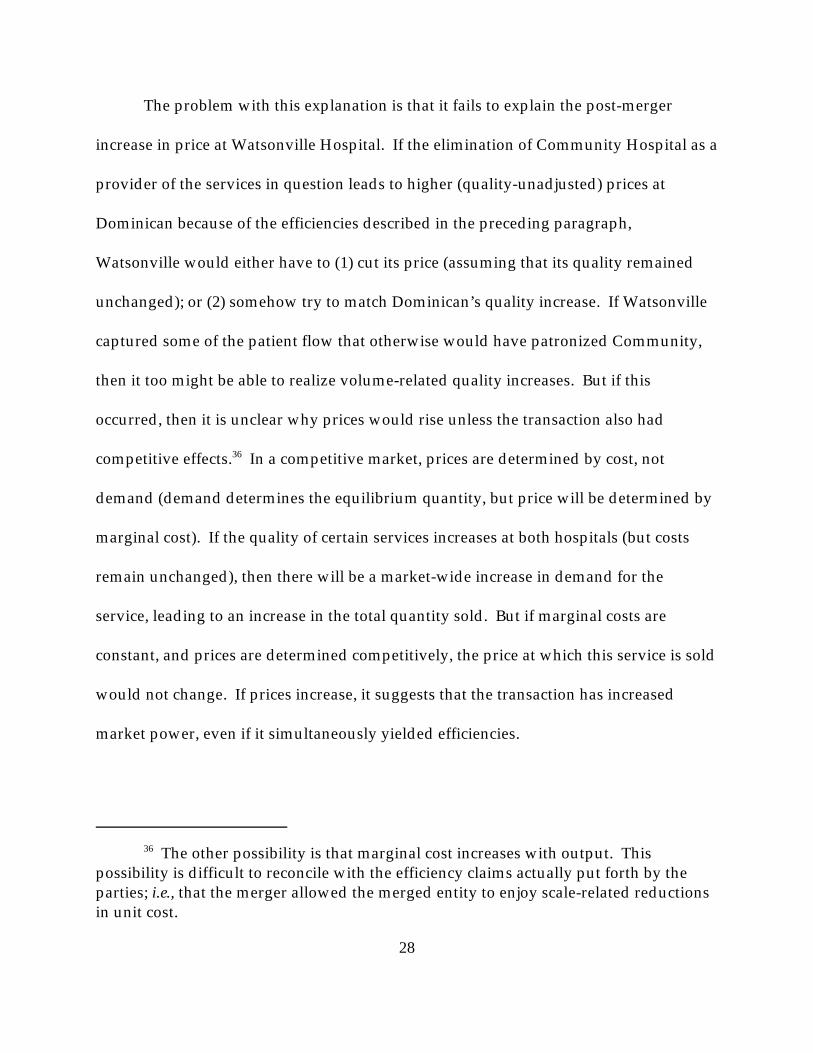
The problem with this explanation is that it fails to explain the post-merger
increase in price at Watsonville Hospital. If the elimination of Community Hospital as a
provider of the services in question leads to higher (quality-unadjusted) prices at
Dominican because of the efficiencies described in the preceding paragraph,
Watsonville would either have to (1) cut its price (assuming that its quality remained
unchanged); or (2) somehow try to match Dominican’s quality increase. If Watsonville
captured some of the patient flow that otherwise would have patronized Community,
then it too might be able to realize volume-related quality increases. But if this
occurred, then it is unclear why prices would rise unless the transaction also had
competitive effects.36 In a competitive market, prices are determined by cost, not
demand (demand determines the equilibrium quantity, but price will be determined by
marginal cost). If the quality of certain services increases at both hospitals (but costs
remain unchanged), then there will be a market-wide increase in demand for the
service, leading to an increase in the total quantity sold. But if marginal costs are
constant, and prices are determined competitively, the price at which this service is sold
would not change. If prices increase, it suggests that the transaction has increased
market power, even if it simultaneously yielded efficiencies.

37 Elzinga and Hogarty (1973).
29
It perhaps is conceivable that the merger led to other types of quality increases at
both Dominican and Watsonville that are not related to volume, but which manifest
themselves in greater resource use per patient. If so, we might observe an increase in
expenses per admission post-merger -- hence prices -- at both hospitals, other things
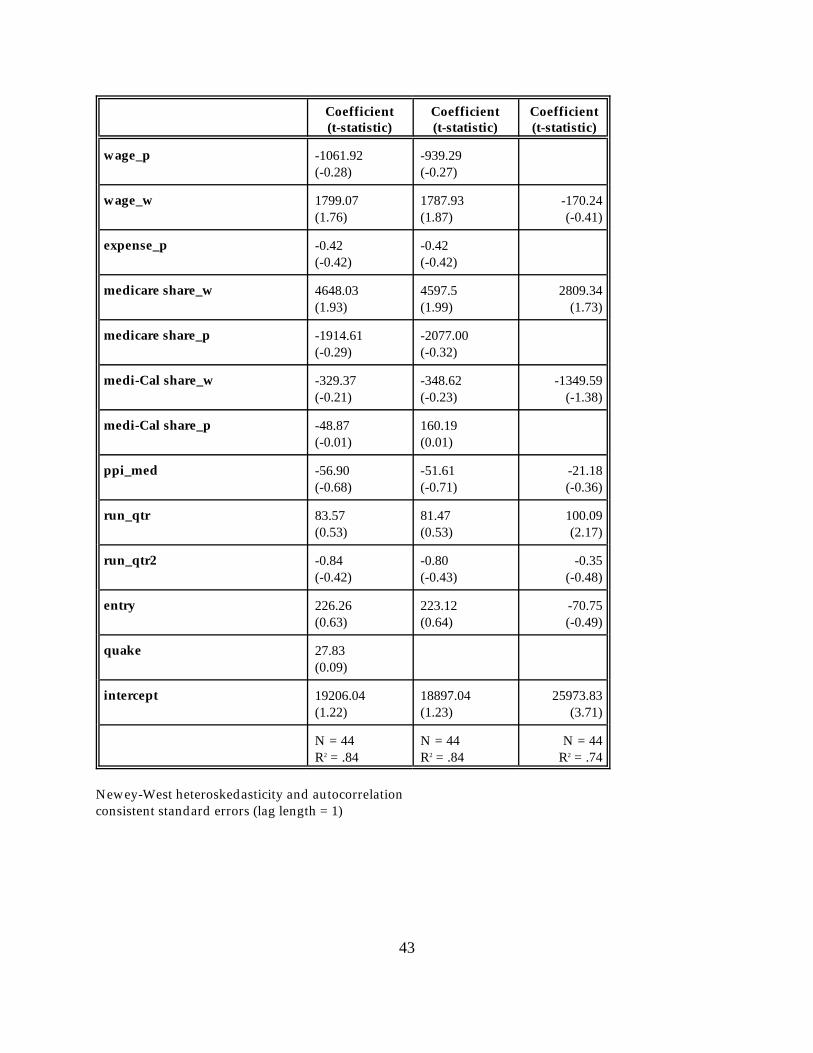
held constant. We carry out two tests of this hypothesis. First, in Tables 4 and 5 we
regress real expenses per inpatient admission against the same explanatory variables
employed in the regressions contained in Tables 2 and 3. We find little evidence that
the merger resulted in greater average expenses. Compared to the coefficients on the
merge dummy in the price equations, the corresponding coefficients in Tables 4 and 5
are small in magnitude, and never differ from zero at conventional levels of statistical
significance.
We conduct a second test of this efficiency hypothesis by examining data on
patient flows. If the transaction improved the quality of hospital care provided in Santa
Cruz County, we would expect to observe (ceteris paribus) a reduction in the proportion
of Santa Cruz County residents who seek hospital care outside of the county. That is,
we would expect to observe an increase in the Elzinga-Hogarty “little in from outside”
(“LIFO”) statistic.37 For a given year, the LIFO statistic equals the total number of
patients admitted at Santa Cruz hospitals who were Santa Cruz County residents,
divided by the total number of Santa Cruz county residents admitted at any hospital
(i.e., whether at a Santa Cruz County hospital or elsewhere). To test the efficiency

38 The estimated regression is: LIFO =.6881 - .0097*merge + e. (77.42) (-0.87)T-statistics are in parentheses.
39 See note 19, above.
40 As noted earlier (see note 34, above), Dominican had argued that Community(180 beds) was inefficiently small. If true, then it surely follows that a 21 bed hospital is
(continued...)
30
hypothesis, we regress the LIFO statistic against a constant and the merge dummy. If
the efficiency hypothesis is correct, we would expect to obtain a positive coefficient on
merge. As it turns out, however, the coefficient is negative and statistically
insignificant.38 Thus, this result also fails to support the efficiency hypothesis.
Two other aspects of these empirical findings merit comment. First, we observe
that the coefficient on entry (the dummy variable set equal to one for those time periods
after the entry of the Sutter mini-hospital) was not consistently negative across
specifications (e.g., compare Table 2 to Table 3), as theory would predict, and was never
different from zero at conventional significance levels. As noted earlier, the FTC’s
rationale for not pursuing a divestiture remedy in this matter was predicated in part on
the decision of Sutter to enter this market.39 It now appears that the FTC overestimated
the competitive impact of this entry. This error probably was attributable to the limited
scale and scope at which entry actually occurred. The new hospital was not a full-scale
acute care institution, but rather a very small (21 staffed beds) maternity and surgery
center. It is implausible that this institution would impose the same competitive
constraints on incumbent producers as did Community hospital.40

40 (...continued)too small to provide efficiently the full range of services necessary to compete withDominican.
31
VI. Conclusion
The combination of Dominican Hospital and Community in Santa Cruz,
California, affords researchers a rare opportunity to study the competitive effects of a
horizontal merger in a concentrated antitrust market dominated by not-for-profit
producers. We have attempted to assess these effects by estimating a reduced form
price equation for the merged entity and its closest rival, Watsonville Community
Hospital. Controlling for casemix, input prices, and other cost- and demand-side
characteristics, our results suggest that both hospitals raised prices in the aftermath of
the transaction. The small scale entry that occurred after the merger was consummated
did not mitigate this price increase. These price increases -- and in particular, the price
increase at Watsonville hospital, a locally-sponsored and administered community
hospital -- suggest strongly that mergers involving not-for-profit hospitals are a
legitimate focus of antitrust concern. While one cannot rule out unequivocally the
possibility that this price increase reflects some unmeasured increase in hospital quality,
a more plausible interpretation is that the merger created market power that allowed
Dominican and Watsonville to increase price-cost markups.

32
Table 1
Descriptive Statistics
VariableName
Description Mean Minimum Maximum
rprice_d real net revenueper admission, DominicanHospital
4434.55 3212.89 5882
rprice_w real net revenueper admission, WatsonvilleHospital
3897.98 1794.32 6490.128
rprice_p real net revenue per admission,peer grouphospitals
4955.76 3454.33 6091.85
length-of-stay_d average length-of-stay,DominicanHospital
4.01 2.71 5.63
length-of-stay_w average length-of-stay,WatsonvilleHospital
3.99 2.71 6.79
length-of-stay_p average length-of-stay,peer grouphospitals
4.38 3.70 4.93
medi-Cal share_d share ofadmissionsMediCal, DominicanHospital
0.14 0.051 0.17
medi-Calshare_w
share ofadmissionsMediCal,WatsonvilleHospital
0.29 0.10 0.48

VariableName
Description Mean Minimum Maximum
33
medi-Cal share_p share ofadmissionsMediCal,peer grouphospitals
0.21 0.17 0.24
medicare share_d share ofadmissionsMedicare,DominicanHospital
0.39 0.33 0.44
medicareshare_w
share ofadmissionsMedicare,WatsonvilleHospital
0.31 0.22 0.40
medicare share_p share ofadmissionsMedicare,peer grouphospitals
0.38 0.34 0.40
casemix_d casemix index,Dominican
0.85 0.75 1.04
casemix_w casemix index,Watsonville
0.76 0.67 0.87
casemix_p casemix index,peer grouphospitals
0.94 0.84 1.05
density_p populationdensity, peergroup counties
101.43 89.97 110.07
density_s populationdensity,Santa CruzCounty
516.96 486.10 539.57
hmo_d share ofadmissions HMOinsured,Dominican
0.25 0 0.50

VariableName
Description Mean Minimum Maximum
34
hmo_w share ofadmissions HMOinsured,Watsonville
0.06 0 0.25
hmo_p share ofadmissions HMOinsured,peer group
0.15 0.06 0.23
income_s real per capitaincome,Santa CruzCounty
16104.97 14464.69 17700.51
income_p real per capitaincome, peer groupcounties
13253.29 12968.84 13703.24
ppi_med producer priceindex,medical &surgicalinstruments
121.19 107.27 131.27
unemploy_p unemploymentrate,peer groupcounties
10.53 8.16 14.40
unemploy_s unemploymentrate,Santa CruzCounty
8.35 5.37 13.83
merge = 1 for quartersafter mergeroccurred
0.6304348 0 1
entry = 1 for quartersafter entryoccurred
0.1086957 0 1
run_qtr time trend 23.54348 1 48

VariableName
Description Mean Minimum Maximum
35
run_qtr2 time trendsquared
732.5435 1 2304
wage_d HCFA wageindex,Dominican
1.22 0.97 1.42
wage_w HCFA wageindex,Watsonville
1.20 0.97 1.39
wage_p HCFA wageindex,peer group
1.16 1.12 1.24
expadm_d real expense peradmission,Dominican
4118.93 3212.4 4986.1
expadm_w real expense peradmission,Watsonville
3343.72 2582.8 3969.6
expadm_p real expense peradmission, peerhospitals
4038.26 3185.02 4628.92
quake = 1 for 3rd quarter1989 and after, 0otherwise
.70 0 1
merge = 1 for 2nd quarter1990 and after, 0otherwise
.63 0 1
entry = 1 for 2nd quarter1996 and after, 0otherwise
.11 0 1
36
Table 2
Dominican Hospital Price Regression
Quarterly Data, 1986-96
Dependent Variable = real net revenue per private admission
Coefficient(t-statistic)
Coefficient(t-statistic)
Coefficient(t-statistic)
merge 1179.92(1.93)
1153.63(1.99)
737.46(1.356)
income_p -1.25(-0.74)
-1.26(-0.78)
income_s -0.19(-0.70)
-.20(-0.75)
-.25(-1.57)
density_p -236.8(-0.95)
-230.8(-0.96)
density_s 47.89(0.72)
45.59(0.70)
-9.73(-0.41)
unemploy_p -302.19(–0.81)
-369.82(-1.04)
unemploy_s 125.43(0.68)
156.43(0.88)
-75.37(-2.53)
length-of-stay_d 461.66(2.98)
437.96(2.96)
469.86(2.89)
length-of-stay_p -153.91(-0.27)
-13.67(-0.03)
hmo_d -284.10(-0.12)
-448.06(-.20)
-679.83(-0.55)
hmo_p 6780.54(0.55)
6587.93(0.54)
casemix_p -9376.14(-1.26)
-10185.27(-1.42)
casemix_d 1081.09(0.33)
1125.12(0.34)
-1524.21(-0.70)

Coefficient(t-statistic)
Coefficient(t-statistic)
Coefficient(t-statistic)
37
wage_p 94.71(0.01)
926.02(0.15)
wage_d -756.33(-0.61)
-713.21(-0.58)
-82.71(-0.13)
rprice_p .14(0.28)
.18(0.36)
medicare share_d 1909.25(0.42)
2625.13(0.55)
3464.04(1.37)
medicare share_p -9161.47(-0.58)
-11677.03(-0.76)
medi-Cal share_d 2410.38(0.45)
1956.57(0.37)
1109.31(0.39)
medi-Cal share_p -4574.66(-0.19)
-3710.94(-0.15)
ppi_med 253.50(1.89)
294.69(3.18)
108.49(2.16)
run_qtr -96.75(-0.60)
-117.87(-0.78)
26.40(0.27)
run_qtr2 0.78(0.40)
1.03(0.56)
-0.74(-0.89)
entry 280.62(0.39)
257.16(0.36)
670.12(2.35)
quake 278.89(0.63)
intercept 4634.23(0.18)
1066.04(0.04)
-1408.28(-0.09)
N = 44R2 = .89
N = 44R2 = .88
N= 44R2 = .84
Newey-West heteroskedasticity and autocorrelation consistent standard errors (lag length = 1)
38
Table 3
Watsonville Hospital Price Regression
Quarterly Data, 1986-96
Dependent Variable = real net revenue per private admission
Coefficient(t-statistic)
Coefficient(t-statistic)
Coefficient(t-statistic)
merge 428.42(1.48)
497.47(1.44)
524.30(1.52)
income_p -1.44(-0.58)
-0.83(-0.34)
income_s -0.59(-1.57)
-0.55(-1.44)
-.63(-3.17)
density_p 1.64(0.01)
91.82(0.31)
density_s -65.57(-0.62)
-77.70(-0.77)
-96.15(-3.35)
unemploy_p -192.81(-0.58)
89.83(0.26)
unemploy_s 75.96(0.37)
-68.12(-0.31)
3.82(0.07)
length-of-stay_w 661.65(3.13)
589.53(2.81)
746.46(4.24)
length-of-stay_p 1564.40(1.27)
1082.68(0.97)
hmo_w -3001.02(-1.27)
-2034.23(-0.87)
-2926.96(-1.15)
hmo_p -2909.30(-0.19)
-5026.07(-0.32)
casemix_p -1333.34(-0.14)
1593.00(0.19)
casemix_w 6441.82(1.66)
6738.19(1.76)
7241.37(3.38)
Coefficient(t-statistic)
Coefficient(t-statistic)
Coefficient(t-statistic)
39
wage_p 3268.53(0.28)
-1031.73(-0.10)
wage_w -245.38(-0.11)
92.20(0.04)
-676.05(-0.50)
rprice_p 0.02(0.03)
-0.09(-0.11)
medicare share_w 1547.97(0.32)
3444.37(-.70)
1220.01(0.25)
medicare share_p -22510.47(-1.47)
-16165.86(-0.99)
medi-Cal share_w -4439.67(-1.84)
-3690.78(-1.47)
-3817.34(-1.91)
medi-Cal share_p 3832.57(0.11)
-2018.22(-0.06)
ppi_med 472.47(2.48)
279.54(1.52)
228.73(2.21)
run_qtr -108.34(-0.47)
-25.37(-.11)
109.46(0.94)
run_qtr2 0.89(0.29)
-.22(-0.07)
-2.03(-1.43)
entry -525.84(-0.93)
-416.75(-0.66)
25.75(0.05)
quake -1023.69(-1.82)
intercept 4964.34(0.14)
16107.88(0.48)
27732.12(1.42)
N = 44R2 = .88
N = 44R2 = .87
N = 44R2 = .84
Newey-West heteroskedasticity and autocorrelation consistent standard errors (lag length = 1)

40
Table 4
Dominican Hospital Expense Regression
Quarterly Data, 1986-96
Dependent Variable = real inpatient expenses per admission
Coefficient(t-statistic)
Coefficient(t-statistic)
Coefficient(t-statistic)
merge 143.94(1.02)
110.41(0.83)
84.87(0.66)
income_p .22(0.21)
0.24(0.21)
income_s -0.27(-1.62)
-0.28(-1.63)
-0.24(-3.93)
density_p -9.94(-0.07)
-6.02(-0.04)
density_s 3.38(0.09)
-0.54(-0.01)
-14.30(-1.84)
unemploy_p 19.05(0.13)
-53.27(-0.37)
unemploy_s -25.51(-0.32)
6.61(0.08)
-15.64(-0.79)
length-of-stay_d 7.34(0.13)
-16.65(-0.25)
-58.95(-0.71)
length-of-stay_p 197.67(0.76)
369.77(1.37)
hmo_d -828.36(-0.70)
-1003.58(-0.87)
-417.71(-0.76)
hmo_p -1170.30(-0.32)
-1122.31(-0.32)
casemix_p -644.95(-0.24)
-1527.72(-0.49)
casemix_d 311.36(0.30)
308.32(0.28)
-238.12(-0.27)

Coefficient(t-statistic)
Coefficient(t-statistic)
Coefficient(t-statistic)
41
wage_p 4986.65(1.69)
5853.47(1.84)
wage_d -491.62(-1.30)
-466.61(-1.23)
294.96(1.17)
expense_p 0.27(0.56)
0.29(0.61)
medicare share_d 735.17(0.44)
1438.33(0.82)
780.20(0.47)
medicare share_p 1082.31(0.18)
-1341.07(-0.23)
medi-Cal share_d 1609.24(0.49)
1045.77(0.33)
395.13(0.26)
medi-Cal share_p -6820.35(-1.17)
-1341.07(-0.23)
ppi_med -46.42(-0.67)
-0.13(-0.002)
22.78(0.81)
run_qtr 138.48(1.54)
120.37(1.36)
80.30(2.94)
run_qtr2 -1.15(-1.04)
-0.93(-0.82)
-0.78(-2.34)
entry 341.79(1.14)
323.94(1.11)
419.14(2.68)
quake 308.11(1.70)
intercept 1780.65(0.15)
-1707.39(-0.17)
11244.89(2.76)
N = 44R2 = .96
N = 44R2 = .96
N = 44R2 = .94
Newey-West heteroskedasticity and autocorrelation consistent standard errors (lag length = 1)

42
Table 4
Watsonville Hospital Expense Regression
Quarterly Data, 1986-96
Dependent Variable = real inpatient expenses per admission
Coefficient(t-statistic)
Coefficient(t-statistic)
Coefficient(t-statistic)
merge 123.47(0.60)
121.37(0.62)
155.93(0.72)
income_p -0.93(-0.90)
-0.95(-0.95)
income_s -0.15(-0.81)
-0.15(-0.82)
-0.32(-3.76)
density_p 63.92(0.43)
61.4(0.44)
density_s -2.58(-0.07)
-2.32(-0.06)
-34.23(-2.86)
unemploy_p 151.03(0.59)
143.26(0.62)
unemploy_s -66.13(-.044)
-62.28(-0.45)
14.56(0.50)
length-of-stay_w 223.34(2.12)
225.21(2.16)
240.91(5.54)
length-of-stay_p -573.39(-1.30)
-559.09(-1.41)
hmo_w 174.69(0.09)
148.52(0.08)
-0.67(0.00)
hmo_p -8915.0(-1.64)
-8837.91(-1.72)
casemix_p 1865.20(0.52)
1785.43(0.55)
casemix_w -793.64(-0.52)
-805.12(-0.53)
-919.8(-0.83)
Coefficient(t-statistic)
Coefficient(t-statistic)
Coefficient(t-statistic)
43
wage_p -1061.92(-0.28)
-939.29(-0.27)
wage_w 1799.07(1.76)
1787.93(1.87)
-170.24(-0.41)
expense_p -0.42(-0.42)
-0.42(-0.42)
medicare share_w 4648.03(1.93)
4597.5(1.99)
2809.34(1.73)
medicare share_p -1914.61(-0.29)
-2077.00(-0.32)
medi-Cal share_w -329.37(-0.21)
-348.62(-0.23)
-1349.59(-1.38)
medi-Cal share_p -48.87(-0.01)
160.19(0.01)
ppi_med -56.90(-0.68)
-51.61(-0.71)
-21.18(-0.36)
run_qtr 83.57(0.53)
81.47(0.53)
100.09(2.17)
run_qtr2 -0.84(-0.42)
-0.80(-0.43)
-0.35(-0.48)
entry 226.26(0.63)
223.12(0.64)
-70.75(-0.49)
quake 27.83(0.09)
intercept 19206.04(1.22)
18897.04(1.23)
25973.83(3.71)
N = 44R2 = .84
N = 44R2 = .84
N = 44R2 = .74
Newey-West heteroskedasticity and autocorrelation consistent standard errors (lag length = 1)

44
References
Barro, Jason R. and David M. Cutler, “Consolidation in the Medical Care Marketplace:A Case Study from Massachusetts,” NBER Working Paper No. 5957, March 1997.
Barton, David M. and Roger Sherman, “The Price and Profit Effects of HorizontalMerger: A Case Study,” Journal of Industrial Economics, 33 (1984), 165-177.
Begg, Colin B. et al. “Impact of Hospital Volume on Operative Mortality for MajorCancer Surgery,” Journal of the American Medical Association 280 (November 25, 1998),1747-51.
Bresnahan, Timothy. “Empirical Studies of Industries With Market Power,” inSchmalensee and Willig, eds., Handbook of Industrial Organization, vol. II, 1989.
Connor, Robert A., Roger D. Feldman, and Bryan E. Dowd, “The Effects of Market Concentration and Horizontal Mergers on Hospital Costs and Prices,” InternationalJournal of the Economics of Business 5 (1998), 159-80.
Connor, Robert A., Roger D. Feldman, Bryan E. Dowd and Tiffany A. Radcliff, “WhichTypes of Hospital Mergers Save Consumer Money?,” Health Affairs, 16 (1997), 62-74.
Department of Health Services, State of California. Hospital Peer Grouping, 1991.
Dranove, David, “Pricing by Non-Profit Institutions: The Case of Hospital Cost-Shifting,” Journal of Health Economics, 7 (1988), 48-49.
Dranove, David, Mark Shanley, and William White, “Price and Concentration inHospital Markets: The Switch from Patient-Driven to Payer-Driven Competition,”Journal of Law & Economics, 36 (1993), 179-204.
Eckbo, B. Espen. “Horizontal Mergers, Collusion, and Stockholder Wealth,” Journal of Financial Economics 11 (1983), 241-73.
Elzinga, Kenneth, and Thomas Hogarty. “The Problem of Geographic MarketDefinition in Antimerger Suits,” Antitrust Bulletin 18 (1973), 45-81.
Greene, William. Econometric Analysis (3rd edition), 1997.
Joskow, Paul, “The Effects of Competition and Regulation on Hospital Bed Supply andthe Reservation Quality of the Hospital,” Bell Journal of Economics, 11(1980), 421-47.

45
Keeler, Emett, Glenn Melnick, and Jack Zwanziger, “The Changing Effects ofCompetition on Non-Profit and For-Profit Hospital Pricing Behavior,” Journal of HealthEconomics 18 (1999), 69-86.
Kessler, Daniel, and Mark McClellan, “Designing Hospital Antitrust Policy to PromoteSocial Welfare,” NBER Working Paper No. 6897, January 1999.
Kim, E. Han and Vijay Singal, “Mergers and Market Power: Evidence From the AirlineIndustry,” American Economic Review 83 (1993), 549-69.
Kralewski, John et al., “Factors Related to the Provision of Hospital Discounts for HMOInpatients,” Health Services Research 27 (1992), 133-53.
Lynk, William J. “Nonprofit Hospital Mergers and the Exercise of Market Power,” Journalof Law & Economics, 38 (1995), 437-461.
MacKinlay, A. Craig. “Event Studies in Economics and Finance,” Journal of EconomicLiterature 35 (1997), 13-39.
Manheim, Larry M., Gloria J. Bazzoli, and Min-Woong Sohn, “Local Hospital Competitionin Large Market Areas,” Journal of Economics & Management Strategy, 3 (1994), 143-167.
Melnick, Glenn A., Jack Zwanziger, Anil Bamezai, and Robert Pattison, Robert, “The Effectsof Market Structure and Bargaining Position on Hospital Prices,” Journal of HealthEconomics, 11 (1992), 217-233.
Newey, Whitney and Kenneth West, “A Simple, Positive Semi-Definite, Heteroskedasticityand Autocorrelation Consistent Covariance Matrix, Econometrica 55 (1987), 703-8.
Noether, Monica, “Competition Among Hospitals,” Journal of Health Economics 7 (1988),259-84.
Pautler, Paul and Michael Vita, “Hospital Market Structure, Hospital Competition, and Consumer Welfare: What Can the Evidence Tell Us?,” Journal of Contemporary Health Law& Public Policy, 10 (1994), pp. 117-167.
Robinson, James and Hal Luft, “The Impact of Hospital Market Structure on PatientVolume, Average Length of Stay, and the Cost of Care,” Journal of Health Economics, 4(1985), 333-56.
Sacher, Seth and Louis Silvia, “Antitrust Issues in Defining the Product Market for HospitalServices,” International Journal of the Economics of Business, 5 (1998), 181-202.

46
Schumann, Laurence, Robert Rogers, and James Reitzes, “Case Studies of the Price Effectsof Horizontal Mergers,” Federal Trade Commission, Bureau of Economics Staff Report, 1992.
___________________. “In the Matter of Weyerhauser Company: The Use of a Hold-Separate Order in a Merger With Horizontal and Vertical Effects,” Journal of RegulatoryEconomics 11 (1997), 271-89.
Selby, Joe V. et al. “Variation Among Hospitals in Coronary-Angiography Practices andOutcomes After Myocardial Infarction in a Large Health Maintenance Organization,” NewEngland Journal of Medicine (1996), 1888-96.
Simpson, John and Richard Shin, “Do Nonprofit Hospitals Exercise Market Power?,”International Journal of the Economics of Business, 5 (1988), 141-57.
Sims, Joe. “A New Approach to the Analysis of Hospital Mergers,” Antitrust Bulletin 64(1996), 633-48.
Vita, Michael and Laurence Schumann, “The Competitive Effects of Hospital Mergers: ACloser Look,” Journal of Health Economics 10 (1991), 359-72.
Werden, Gregory, “The Limited Relevance of Patient Migration Data in Market Delineationfor Hospital Merger Cases,” Journal of Health Economics 8 (1989), 363-76.
Werden, Gregory and Luke Froeb. “The Effects of Mergers in Differentiated ProductsIndustries: Logit Demand and Merger Policy,” Journal of Law, Economics, & Organization10 (1994), 407-26.
White, Halbert, “A Heteroskedasticity-Consistent Covariance Matrix Estimator and aDirect Test for Heteroskedasticity,” Econometrica 48 (1980), 817-38.
Wicks, Elliot, Jack Meyer, and Marcia Carlyn, Assessing the Early Impact of Hospital Mergers,Economic and Social Research (1998).
Woolley, J. Michael. “The Competitive Effects of Horizontal Mergers in the HospitalIndustry,” Journal of Health Economics 8 (1989), 271-91.
47
APPENDIX APEER GROUP HOSPITALS
HOSPITAL COUNTY BEDS-1996
Mercy Hospital* Kern 261
San Joaquin CommunityHospital*
Kern 178
Feather River* Butte 121
Chico CommunityHospital
Butte 105
Oroville* Butte 120
El Centro Imperial 107
Natividad Monterey 181
Salinas Valley Monterey 180
Queen of the Valley* Napa 176
Redding Medical Center Shasta 162
Mercy Medical Center-Redding*
Shasta 220
North Bay MedicalCenter*
Solano 108
Sutter Solano MedicalCenter*
Solano 109
Woodland* Yolo 103
Rideout* Yuba 128
Marian Medical Center* Santa Babara 225
Dameron* San Joaquin 211
*Non-profit hospital