the committee secretariat po box 6100 parliament house
TRANSCRIPT

24 July 2020
The Committee Secretariat
Department of the Senate
PO Box 6100
Parliament House
CANBERRA ACT 2000
Dear Joint Select Committee on Road Safety
iRAP Submission to Joint Select Committee on Road Safety
iRAP as a global charity with the vision for a world free of high-risk roads welcomes the opportunity
to provide this detailed submission on the Joint Select Committee on Road Safety Terms of
Reference following my appearance at the hearings on Tuesday 21 July
400000 Australians will be killed and injured in road crashes between now and 2030 based on
current trends Every community and every electorate will share that tragedy The cost to the
Australian economy business and families will be more than $300 billion The solutions are both
cost effective and proven and an urgency and scale to our reponse is essential
As one of the Special Advisors to the Inquiry into the National Road Safety Strategy 2011-2020 led by
Dr Crozier and Dr Wooley I congratulate the Government on the actions so far I also note that many
of the actions outlined underneath each of the recommendations have yet to be implemented at the
scale and speed required to make a difference Follow-through on these existing actions remains a
priority
Please find attached my opening statement delivered to the Joint Select Committee and response to
the specific Terms of Reference As always iRAP stands ready to partner with the Australian
Government to unlock the full potential of safer roads and safer speeds to save lives and reduce
injuries across every corner of Australia and play a valuable international road safety leadership role
in our region
Yours sincerely
Rob McInerney
wwwiraporg
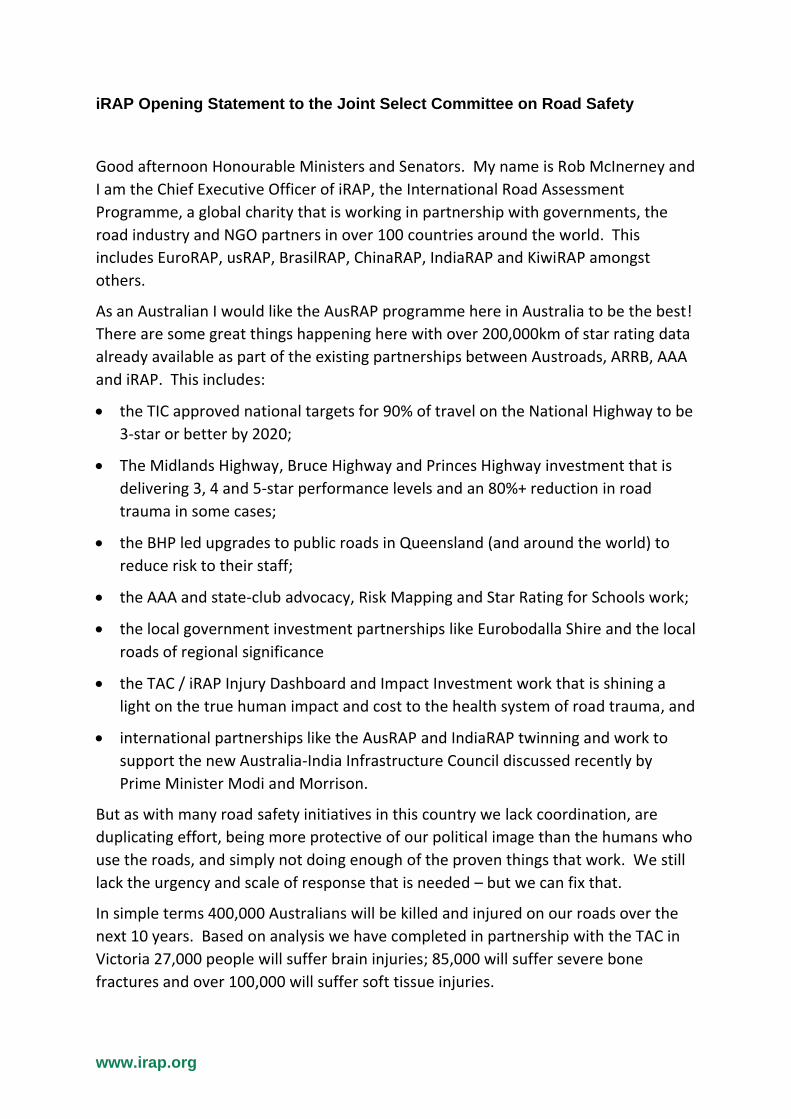
iRAP Opening Statement to the Joint Select Committee on Road Safety
Good afternoon Honourable Ministers and Senators My name is Rob McInerney and
I am the Chief Executive Officer of iRAP the International Road Assessment
Programme a global charity that is working in partnership with governments the
road industry and NGO partners in over 100 countries around the world This
includes EuroRAP usRAP BrasilRAP ChinaRAP IndiaRAP and KiwiRAP amongst
others
As an Australian I would like the AusRAP programme here in Australia to be the best
There are some great things happening here with over 200000km of star rating data
already available as part of the existing partnerships between Austroads ARRB AAA
and iRAP This includes
bull the TIC approved national targets for 90 of travel on the National Highway to be
3-star or better by 2020
bull The Midlands Highway Bruce Highway and Princes Highway investment that is
delivering 3 4 and 5-star performance levels and an 80+ reduction in road
trauma in some cases
bull the BHP led upgrades to public roads in Queensland (and around the world) to
reduce risk to their staff
bull the AAA and state-club advocacy Risk Mapping and Star Rating for Schools work
bull the local government investment partnerships like Eurobodalla Shire and the local
roads of regional significance
bull the TAC iRAP Injury Dashboard and Impact Investment work that is shining a
light on the true human impact and cost to the health system of road trauma and
bull international partnerships like the AusRAP and IndiaRAP twinning and work to
support the new Australia-India Infrastructure Council discussed recently by
Prime Minister Modi and Morrison
But as with many road safety initiatives in this country we lack coordination are
duplicating effort being more protective of our political image than the humans who
use the roads and simply not doing enough of the proven things that work We still
lack the urgency and scale of response that is needed ndash but we can fix that
In simple terms 400000 Australians will be killed and injured on our roads over the
next 10 years Based on analysis we have completed in partnership with the TAC in
Victoria 27000 people will suffer brain injuries 85000 will suffer severe bone
fractures and over 100000 will suffer soft tissue injuries
wwwiraporg
So what would applying the best-in the world look like for AusRAP Building on what
we have done already there would be
bull An AusRAP hub (similar to ANCAP) to coordinate national partnerships data
innovation communications and reporting
bull AusRAP Crash Risk Maps of the National Highway and major state networks
would be published every year like the UK and Spain have done for 20 years and
wersquod have urban risk mapping for pedestrians and cyclists like KiwiRAP
bull Proactive Star Rating and Investment Plan assessments of the National and State
Highway network systematically every 3-5 years that measure progress against
the targets and shapes the investment pipeline for the future as completed by
Mexico China and is now specified by the European Union
bull A large-scale Safer Roads Fund would be mobilised like the ldquoHighway Safety to
Cherish Liferdquo programme in China DoT investment for county roads in the UK
and the new private sector partnerships in Brazil that are taking existing roads
and upgrading them to 3-star or better performance levels
bull Kids would be provided with 4 and 5-star journeys to school like those happening
in Vietnam USA Uruguay and Zambia to name a few
bull The before and after star rating and fatality estimates would be routinely
reported for all road upgrades ndash like the 3 4 and 5-star targets being applied by
Highways England and the Multi-lateral Development Banks are doing from Fiji to
El Salvador and India to Ethiopia
bull And we would celebrate successhellip with you and your Ministerial colleagues
ribbon cutting every upgraded 3-star or better road like the urban roads in
Shanghai that achieved 5-star for pedestrians and cyclists through to the rural
roads in India that have hit the minimum 3-star global targets
Throughout the Covid-19 crisis I have heard commentators talk about the trade-off
between Protecting Lives and Protecting Livelihoods When investing in road trauma
reduction there is no trade-off
Systematic investment in 3-star or better roads for all road users will save lives save
money and create jobs in every corner of this country We can Protect Lives and
Protect Livelihoods We must Protect Lives and Protect Livelihoods
wwwiraporg
Contents
Introduction and background 5
Australian Road Assessment Programme ndash Example Outputs amp Partnerships 6
TOR a Effectiveness of existing programs and Safe System Opportunities 8
Response to the Inquiry into the National Road Safety Strategy 8
Safe System Opportunities 9
TOR b Impact of road trauma on the nation ndash including remote and regional areas 11
The Impact in Rural and Remote Regions 12
TOR c Parliamentary Standing Committee on Road Safety and its functions 13
TOR d Measures to ensure government road infrastructure investment incorporates safe system
principles 14
AusRAP Hub 14
Minimum Star Rating Standards for new roads 16
TOR e road trauma and incident data collection and coordination 19
Annual Risk Maps and Performance Tracking 19
Harmonisation detail and timeliness of injury data 22
TOR f recommended strategies performance measures and targets for next Strategy 24
Road Infrastructure Key Performance Indicators using the iRAP Global Standard 25
Australian Infrastructure Safety KPI Data Snapshot 32
Global Road Safety Performance Targets 33
TOR g recommendations for Office of Road Safety role 34
How to mobilise the $3bn Road Safety Fund 34
TOR h other measures with a focus on the Inquiry Recommendations 36
wwwiraporg
Introduction and background
iRAP is a UK registered global charity with the vision for a world free of high-risk
roads The charity provides the global standard for infrastructure safety
performance monitoring as recommended by WHO Member States UN agencies
the International Transport Forum of the OECD Global Infrastructure Hub the World
Bank PIARC (the World Road Association) European Investment Bank and other
national governments and multi-lateral development agencies The specifications
systems and supporting software are provided in a free-to-air environment for all
partners to use Global partners contribute to the continuous enhancement and
improvement of the programme for the mutual benefit of all partners
The AusRAP programme in Australia has been active since 2004 and was the first RAP
programme outside Europe The programme is currently governed by an MOU
agreement between the Australian State Territory and Local Government road
agencies represented by Austroads ARRB AAA and iRAP Austroads research has
helped underpin the global evidence base used in the models The associated
ANRAM metrics and theory are based on the iRAP methodology coding manual star
rating fatality estimation investment planning and attribute specifications that form
the basis of infrastructure KPI reporting globally It is noted that many practitioners
have major misunderstandings of this link and do not appreciate the significant iRAP
intellectual property and partnership that is provided for free that supports the
integrated AusRAPANRAM solutions
Australian experts have also helped shape the global programme that now reaches
100+ countries 1000000km+ of roads and has made over $100 billion of road
investment safer worldwide from school entrances to major freeways and toll-roads
An approximate estimate of work already completed by the partners in Australia is
provided below
STATE STAR RATING amp
INVESTMENT PLANS
(since 2012)
RISK MAPPING
(crash maps)
STAR RATING OF
ROAD DESIGNS
(new since 2019)
Australian Capital Territory 1000km+
40000km+ 350km+
New South Wales 24000km+
Northern Territory 2000km+
Queensland 50000km+
South Australia 13000km+
Tasmania 800km+
Victoria 28000km+
Western Australia 40000km+ (light data)
wwwiraporg
Australian Road Assessment Programme ndash Example Outputs amp Partnerships
The AusRAP Hub will build on an extensive platform of local experience and application by State and
Local Government Agencies Motoring Clubs Austroads and ARRB The partnership benefits from
and contributes to the global iRAP partnerships that are in place in over 100 countries worldwide
Examples of AusRAP partner activity in Australia are provided below
National Star Rating Policy Targets ndash TIC Statewide Vehicle Star Ratings ndash TMR
Vehicle Star Ratings ndash TMR Queensland
Safer Road Investment Plan ndash TAC
Before and After Star Ratings ndash VicRoads AusRAP Crash Risk Maps ndash AAA RACQ
wwwiraporg
httpswwwmidlandhighwaytasgovauabout_the_action_plan
httpswwwvaccinesforroadsorgcase-studies-of-success
Global first Ai-RAP Partnership to use
big data and artificial intelligence to
generate low-cost scalable RAP data
underway with MRWA Transport for
NSW and the iMove CRC will support
AusRAP KPI measures
wwwiraporg
TOR a Effectiveness of existing programs and Safe System
Opportunities
Response to the Inquiry into the National Road Safety Strategy
While slow we are pleased to see positive progress on some of the Inquiry
Recommendations however there are a few major areas to address
bull Recommendation 3 with the commitment to the minimum $3 billion a year road safety
fund
bull Recommendation 5 with the commitment to the key performance indicators ndash that
should as a minimum align with the Global Road Safety Performance Targets agreed by
WHO Member States including Australia ndash with baseline assessments completed this
year along with the establishment and resourcing of a national road safety observatory
bull Recommendation 8 for speed management initiatives that support harm elimination
(eg Auckland Transport recent activity)
bull Recommendation 9 for all new roads to be 3-star or better for all road users include the
AusRAP data in the Infrastructure Australia audit establish a long-term Safer Roads Fund
and establish a national AusRAP programmehub to complement the ANCAP partnership
that already exists
bull Recommendation 12 to elevate and coordinate DFAT aid and trade partnerships with a
focus on road safety outcomes in the Indo-Pacific Region support for global initiatives
including the Global Road Safety Facility UN Road Safety Fund and key enablers like the
multi-lateral development banks Global Network for Road Safety Legislators iRAP and
Global NCAP
wwwiraporg
Safe System Opportunities
In simple terms Vision Zero and Safe System outcomes will be achieved when we
have 5-star road users in 5-star vehicles on 5-star roads and the safe speeds to
ensure no one is killed or injured
From an iRAP perspective key areas to integrate these safe system principles
include
bull Corporate industry and community use and access to AusRAP Risk Mapping and
Star Rating Data to provide the safest route and mode-choice for their journeys
(as suggested by Hon Minister Thistlethwaite)
bull Spot star ratings completed at fatal and serious injury crash scenes and routinely
reported to the Standing Committee Office of Road Safety and in the public
domain to support discussions like those mentioned by Ms Bird on Picton Road
ldquoThe crash happened on a 1-star road and the driver in the 5-star car survived and
the 3 occupants in the 3-star vehicle were killed None of the fatal five
behaviours were evidentrdquo
bull Design for outcomes not a design to lsquostandardsrsquo This would involve a new
approach where the starting point for designs is a 5-star performance level and
design teams and funding agencies must then justify anything less than 5-star
highlighting any lsquocost savingsrsquo associated with the increased death and injury
expected over 20 years and why it is the design recommended
wwwiraporg
bull Integration of Safe System and AusRAP data and knowledge in the education
system (eg a driver is 6 times more likely to crash on a sharp curve crash risk is
halved for each incremental improvement in road star rating)
bull Building on TAC iRAP Injury Dashboard engage health Ministers and
professionals to understand lifetime cost of road trauma and impact on
resources
The relationship between Star Ratings and crash costs per kilometre travelled
httpswwwoecdorgpublicationszero-road-deaths-and-serious-injuries-9789282108055-enhtm
wwwiraporg
TOR b Impact of road trauma on the nation ndash including remote and
regional areas
iRAP believe that a lack of visibility of the true human impact of road crashes has
created the apathy and under-investment we have seen to date Shining a spotlight
on the true impact of road trauma has been a focus of the charity and partnerships
with organisations like TAC have enabled that to happen
The Vaccines for Roads resource has been designed to support this discussion
The Human Impact in Australia
httpswwwvaccinesforroadsorgglobal-impact-of-injuries
wwwiraporg
The human impact of road trauma is also personalhelliphellip
httpswwwvaccinesforroadsorghuman-impact
The Impact in Rural and Remote Regions
The public version of the TAC iRAP Injury Dashboard allows the human and financial
impact of road crashes to be explored by region The example below shows the rural
region of Loddon Mallee and highlights severe brain injuries are the largest costs
more than half of the claim costs happen more than 2 years after the crash as part of
long term care of the crash victims and 21-25 year olds are the most impacted More
detailed dashboards linking the AusRAP data and claim costs are used for internal
planning and programme management
httpwwwtacvicgovauroad-safetystatisticsonline-crash-databaseirap-road-injury-dashboard
wwwiraporg
TOR c Parliamentary Standing Committee on Road Safety and its
functions
The measurement and accountability for the achievement of key road safety KPIs
over the next ten years is critical to ensuring that 400000 Australians are not killed
and injured during that period Ensuring that accountability is set at the right level of
Government and related stakeholders requires good governance transparency of
reporting resourcing action and measurement of success
iRAP support the establishment of a Parliamentary Standing Committee on Road
Safety to perform this function as it relates to the Federal leadership responsibilities
agreed nationally This will also help ensure that the right level of financial and
human resources are mobilised to this preventable problem that will cost our
economy more than $300 billion over the next ten years
An important part of this function is to make sure that the 2021-2030 National Road
Safety Strategy currently under development includes clear accountability well
defined and measurable targets and a commitment to measure and report on
progress Soft language unambitious targets and blurred accountabilities must be
avoided in the next Strategy This will simplify the role of the Standing Committee in
providing the necessary leadership and oversight of Australiarsquos performance sharing
of success and refocussed action and learnings when performance is poor
wwwiraporg
TOR d Measures to ensure government road infrastructure
investment incorporates safe system principles
The Actions associated with the Inquiry Recommendations 3 4 5 8 and in particular
Recommendation 9 are reinforced
AusRAP Hub
The establishment of an AusRAP hub within the Office of Road Safety or supported
as a separate entity like ANCAP has the support of all of the existing local AusRAP
partners including Austroads AAA and ARRB
The process by which this can happen
is straight forward and follows well-
established global guidance by iRAP
Local ownership and leadership by
relevant government research and
consumer partners is encouraged in all
countries and supports the transparent
reporting of infrastructure safety
performance and the important
optimisation of investment to
maximise lives saved
Concept papers on how AusRAP can be
structured have been shared with the
Australian Government and Office of
Road Safety teams (refer excerpt on
following page) Other key
stakeholders including Roads Australia
Infrastructure Australia and ACRS could
also play important roles
Some recent examples from the UK and Brazil show how this can be undertaken and
launched as a positive initiative for road safety
wwwiraporg
AusRAP Hub - Infrastructure Safety Concept Paper
Other ORS
Responsibilities
Other ORS BITRE
Safe System KPIrsquos and
Performance Management
Programme Leadership
bull National Policy Coordination in support of Vision Zero target
bull Coordinate and monitor infrastructure-related KPIs for safety
bull Collate national road network risk assessment data
bull Secure and Deploy Federal Infrastructure Funding to eliminate high-risk roads
bull National Performance Tracking
Office of Road Safety amp AusRAP ndash Australia free of high-risk roads
Maximising the life-saving potential of Australiarsquos $30 billion+ per year
investment in road infrastructure for the benefit of all Australians
AusRAP ndash Implementation Leadership
bull Investment Planning Optimisation
bull Construction and Maintenance
bull Collection and Provision of Data
bull Before and After Measurement
bull National Research
bull National Policy Advice
bull National Guidelines on design
construction and management
AusRAP ndash Technical Leadership
bull Global Technical Committee
bull Training and Accreditation
bull Quality Assurance Certification
bull Infrastructure Australia Audit
bull Star Rating for Designs
bull Evaluation Studies
bull Data Cleansing Calibration
bull Innovation (eg AI Smart
Motorways Urban Safe System)
AusRAP ndash Communications Leadership
bull Ribbon Cutting Project Success
bull Results ndash Internal
bull Results ndash External
bull Media and Events Coordination
bull Star Rating for Schools
AusRAP ndash Global Support
bull Global Policy Programme Technical
Product Innovation and Event
Support
wwwiraporg
Minimum Star Rating Standards for new roads
BITRE reports as early as 2014 propose the use of the Star Rating global standard as a
simple and immediate evidence-based measure to apply to road infrastructure
investment This includes the concept that road funding would be subject to
meeting a minimum 3 4 or 5-star standard as required It is noted that significant
Australian research underpins the global RAP models that form the basis of the
global Star Rating standard used in over 100 countries worldwide
Road agencies have already applied the star rating standard on new projects (eg
Midlands Highway Prices Highway) and Austroads has included the star rating
standard in a number of their peak guidance documents
It is noted that the Star Rating standard for pedestrians cyclists and motorcyclists is
available and in wide use around the world but has had limited application by key
agencies so far in Australia While a lot of safe system work and discussions in
Australia is focussed on passenger vehicles the inclusion of the 3 4 and 5-star
performance targets for vulnerable road users is a simple and immediately available
solution for enhanced outcomes for all road users in Australian infrastructure
investment For example any new Metro public transport projects could include a
requirement that the 1km radius around the passenger stations are 5-star for
pedestrians and cyclists
Together with the World Bank and FIA Foundation iRAP developed the dedicated
and freely available Star Rating for Designs software solution that allows road
designs to be assessed in a simple and systematic way (httpswwwiraporgstar-
rating-for-designs)
Safe system can be characterised as 5-star users in 5-star vehicles on 5-star roads
Speed is a key component of each part of the system In terms of road design
Government can specify that a 5-star facility must be designed and any departure
from that 5-star standard must be justified along with the associated trauma levels
expected Australian state road agencies are already working with iRAP to integrate
the safe system reporting of both star rating and key attribute reporting (eg
protected roadsides for run-off road crashes protected medians for head-on crash
risk) in their road projects
wwwiraporg
The key elements for success to ensure government road infrastructure investment
incorporates safe system principles include
bull A national policy target for the of travel on 3-star or better road
infrastructure that will support the setting of star rating targets for all road
infrastructure investment
bull Associated targets for travel on 5-star roads that supports full safe system
outcomes on high-volume strategic roads where Vision Zero outcomes are
desired by 2030 on the journey to Vision Zero everywhere by 2050 (refer
Recommendation 4 of the Inquiry)
As an example the following clause can be added to all Federal road funding
allocations for both major projects and road safety targeted funding Similar
approaches are being adopted by high-income governments and low and middle-
income country governments via the multi-lateral development banks
ldquoThe new road shall be built to an lsquoxrsquo-star standard for all road users This includes
for pedestrians cyclists motorcyclists and vehicle occupants where present The
before and after star rating and the before and after fatality and serious injury
estimates shall be reported
Before Star Ratings and Fatal and Serious Injury Estimate
Road User FSI Estimate
After Star Ratings and Fatal and Serious Injury Estimate
Road User FSI Estimate
wwwiraporg
The Federal Department and the Standing Committee could then have simple annual
reports detailing the length of road and kilometres of travel moved to a 3 4 and 5-
star standard across the entire funding portfolio This will provide good governance
and reporting supportive of the current national targets agreed by Ministers for
increasing the percent of travel on 3-star or better roads across Australia
Within the safe system context iRAP is working with the European Union and other
partners to ensure the combined performance of new driver assistance technologies
vehicle safety standards road design standards and technology ITS deployment are
implemented to minimise the occurrence of death and injury For further details see
httpseuroraporgslain-project and httpswwwiraporg201712event-
snapshot-innovation-2017 As part of the global programme all AusRAP partners
will immediately benefit from any breakthroughs and methodologies and global
partners will benefit from Australian ingenuity
While not the core expertise of iRAP the approaches for the other elements of the
safe system can be easily included For example
bull All Federal Government National Highway investment shall include point to
point speed cameras distraction and seat-belt monitoring and rest areas to
support safe user behaviour
bull In line with Federal Government leadership of vehicle safety (refer
Recommendation 7 of the Inquiry Recommendations) to support ANCAP
Heavy Vehicle Regulation and rapid adoption and alignment with minimum
European vehicle standards all major projects can include targeted
communications with communities along new corridors about vehicle safety
standards and potential incentives for after-market retrofit technologies
wwwiraporg
TOR e road trauma and incident data collection and coordination
Annual Risk Maps and Performance Tracking
The use of the AusRAP Risk Maps as an annual reporting tool to provide crash data in
a map-based format will provide high-value for all Australians This includes the new
Office of Road Safety and potential Standing Committee in measuring performance
of the Australian National Road Safety Strategy The risk maps ndash prepared in
accordance with the iRAP global standard - will provide the ultimate measure of
success in reducing crash rates over time from all action areas and allow
benchmarking within Australia and across other leading countries in Europe
The Risk Maps will also benefit fleet managers companies and community members
in understanding some roads are safer than others As mentioned by Minister
Thistlethwaite this can ultimately support the introduction of apps to allow the safest
route and mode choice from A to B to be mapped for all journeys for all Australians
Ready examples of this annual risk mapping approach are available from countries
like the UK and Spain and highlight the potential of this approach to support
transparent performance tracking This can ensure success can be celebrated when
high -risk roads become low-risk ndash and also to continuously target any persistently
high-risk roads
Refer to the following overseas examples for more information
bull httpsroadsafetyfoundationorgprojecthow-safe-are-you-on-britains-main-
road-networks-eurorap-results-2019
bull httpseuroraporgwp-contentuploads20200120170608-5-EuroRAP-in-
Spain-L-Puertopdf
bull httpwwwkiwiraporgnzrisk_mapshtml
wwwiraporg
EuroRAP UK Risk Mapping Dashboard
Risk Distribution per billion kilometre travelled (UK)
of travel on low to high crash rates by road type (UK)
wwwiraporg
Performance Tracking (KiwiRAP)
Spanish Risk Maps ndash the improvement from 2004 ndash 2014
wwwiraporg
Harmonisation detail and timeliness of injury data
iRAP fully support the harmonisation of injury data collection and the essential work
of Austroads RACS and other partners in enabling this work
In addition it is very important that the Human Impact of Road Trauma is adequately
communicated with the Australian population The accountability scale and urgency
of our response ndash from politicians to business from road agencies to road users ndash
requires a much better understanding that deaths are just the tip of the iceberg
The TAC and iRAP has already completed world-leading work to shine a spotlight on
the human impact of road trauma as detailed in the images below
The Australian Impact of Road Injuries every year (projected)
httpswwwvaccinesforroadsorgglobal-impact-of-injuries
wwwiraporg
In addition to the public projections more detailed analysis and dashboards have
been developed for the public to access (httpwwwtacvicgovauroad-
safetystatisticsonline-crash-databaseirap-road-injury-dashboard) and also for TAC
internal use
Individual human impact stories have also been shared to demonstrate the personal
impact of every crash one by one
httpswwwvaccinesforroadsorghuman-impact
In addition to the TAC work in Victoria the extensive work of Transport for NSW
Centre for Road Safety in providing valuable road safety data and performance
metrics for the benefit of all NSW stakeholders is a great example of best practice in
Australia
wwwiraporg
TOR f recommended strategies performance measures and targets
for next Strategy
First and foremost the new Strategy must implement the 12 Inquiry
Recommendations and associated actions in full and the key elements of the many
submissions and consultations that have occurred over recent years Accountability
and Action Urgency and Scale are the key themes that must drive action
The core elements of Road Safety Management Safe Speeds Safe Roads Safe
Vehicles Safe Road Users and Improved Post Crash Care are globally accepted and
aligning with this proven structure is essential This will also align with State-level
strategies and also allow global best practice to be mobilised here also
Within the Road Safety Management action area it is essential that the new strategy
is very clear on accountabilities As a special advisor to the National Inquiry we
recommended a national governance review What we expected was a simple
outline of where the Federal Government should lead ndash and where the established
expertise and ownership of actions at a State local and non-government area are
clearly articulated and understood
As an example the Federal Government should lead on
bull Owning the National Road Safety Strategy and accountabilities
bull Owning KPI reporting through national road safety observatory functions and
harmonised data reporting and incentivising data collection and reporting
from other relevant stakeholders
bull Supporting safe system national coordination through ANCAP AusRAP
National Road Rules and Trauma Registry hubs functions
bull Leading on vehicle standards and vehicle import requirements and the
accelerated uptake of new technologies
bull Providing enabling funds (Recommendation 3 ndash the $3 bn a year road safety
fund) for National Highway 5-star investments and for local government to
bring roads to 3-star or better standards This can be targeted using the
annual Risk Maps and Star Rating benchmarks every 3-5 years as mandated
in Europe
bull Supporting initiatives for research capacity development efficient delivery
mechanisms for local government in particular innovation and key enablers
wwwiraporg
Importantly the National Strategy should recognise the state-level leadership and
strategies in their areas of clear accountability ndash and not try and duplicate or cross-
over those issues The well-set ambitious optimised and resourced work to achieve
the key performance indicators will provide the ultimate coordinating function for
national action and accountability
Road Infrastructure Key Performance Indicators using the iRAP Global Standard
The following pages outline the global Safer Roads Road Infrastructure KPIs
recommended for use globally as part of the iRAP Global Standard and the Global
Road Safety Performance Targets This work is informing target and KPI setting
across Europe and worldwide through the Regional Road Safety Observatories in
Latin America Africa and Asia Global alignment on these KPIs will also ensure Ai-
RAP initiatives to ensure big-data approaches to streamline data collection is
immediately available for all partners to benefit from in Australia
Australian adoption of these targets as a minimum requirement will ensure the
significant investment in AusRAP data collection nationally already (100000km+)
provides a great starting point for performance tracking across Australia The
approach will also allow simple benchmarking with other countries (eg performance
of Australian motorways versus French Spanish and UK Motorways pedestrian star
ratings in inner CBD areas comparing Stockholm versus Sydney)
It is worth noting that the Federal Government may choose to undertake
independent measurement of National Highway performance but in most cases all
data collection will be undertaken by States using full high tech Ai-RAP or light data
AusRAP methodologies as required The same data is the basis for any ANRAM crash
FSI data estimates
Given the $100 billion investment in infrastructure by the Federal Government over
the next ten years ensuring good road safety data drives investment decisions and
measurement of success is a very small element when considered as an integral part
of each multi-million dollar project and funding allocation
wwwiraporg
Road Infrastructure Key Performance Indicators
using the iRAP Global Standard
Harmonisation of road safety data is a major focus of all stakeholders across the world This includes
fatality and injury data road infrastructure performance data vehicle performance data road user
behaviour data and post-crash response data
The recommended road infrastructure Key Performance Indicators (KPIrsquos) will ensure harmonised
collection of data in support of the following
bull the United Nations Sustainable Development Goals
bull the 12 Global Road Safety Performance Targets agreed by Member States
bull the EU RISM Directive
bull the Regional Road Safety Observatories
bull WHO Global Status Report on Road Safety
bull the Sum4All initiative and
bull policies and strategies set by Governments development organisations donors and NGOs
worldwide
Member State agreed Global Road Safety Performance Targets
httpswwwwhointroadsafetypublicationsen
About iRAP
iRAP is a registered charity The iRAP specifications methodologies and software provide the global
standard with all resources published in the public domain for free use by partners globally
(httpswwwiraporgresources) The iRAP methodologies are overseen by an independent Global
Policy Advisory Committee and Global Technical Committee and are supported with training courses
and an accreditation scheme for partners and suppliers worldwide
wwwiraporg
The iRAP Global Standard
iRAP methodologies have been applied by partners in more than 100 countries across more than
1 million kilometres of road These safety assessments are informing more than US$75 billion of road
investment and provide harmonised road infrastructure KPIrsquos for the mutual benefit of all stakeholders
worldwide Local ownership and application of the iRAP Global Standard is encouraged and
supported in every country To date more than 25000 people have participated in training
workshops and presentations on iRAP content
The global iRAP standard provides numerous benefits including
bull an objective evidence-based approach to assessing infrastructure related risk that all
jurisdictions and stakeholders can access
bull a way to benchmark performance between jurisdictions and road classes
bull a mechanism to fast-track safety assessments through innovative initiatives such as linkages
to road asset data Ai-RAP and the light data methodology and
bull alignment with the UN WHO EU PIARC and multi-lateral development bank policies and
recommendations
Achieving UN Targets 3 and 4 by 2030 will mean
To understand what achieving the KPIs would mean for your country
see iRAPrsquos Business Case for Safer Roads
For more information
bull To learn more about IRAP and its global programmes and activities visit iraporg
bull To apply the Step by Step Approach to Safer Roads with the KPIs providing the confidence to
invest and the metrics to measure success visit vaccinesforroadsorgtake-action
bull To understand the human impact of road crashes how safe the worldrsquos roads are and what is
possible for your country ndash in terms of fatal and serious injuries prevented and economic
savings that could be achieved by maximising the percentage of travel on 3-star or better
roads by 2030 - explore iRAPrsquos Big Data Tool at vaccinesforroadsorg
bull To learn about or establish an iRAP programme in your country or state contact your local
representative by visiting the where we work map at iraporgabout-us
bull For details on iRAPrsquos protocols and how to apply them to your infrastructure projects visit
iraporghow-we-can-help
bull For training to support achieving the KPIs visit iraporgtraining
wwwiraporg
GLOBAL ROAD INFRASTRUCTURE KEY PERFORMANCE INDICATORS (KPIrsquoS) ndash
EXISTING ROADS
Crash Data
iRAP Global
Standard
Protocol Attribute
Primary KPI Current Global
Performance 2030 Target
Extended Metrics (with primary performance measure in bold)
Crash Risk Mapping
Collective Crash Risk Maps
Percentage of road length with lt XXX fatal and serious crashes per kilometre per year
To be set by jurisdiction
in each category (low low-medium medium medium-high and high risk)
Crash Risk Mapping
Individual Crash Risk Maps
Percentage of road length with lt XXX fatal and serious crashes per billion vehicle kilometres travelled
To be set by jurisdiction
in each category (low low-medium medium medium-high and high risk)
Infrastructure and Speed Management for existing roads (Global Road Safety Performance Target 4)
iRAP Global
Standard
Protocol Attribute
Primary KPI (Refer httpswwwvaccinesforroadsorg for sample of
global and national performance)
Current Global
Performance 2030 Target
Extended Metrics (with primary performance measure in bold)
Star Rating
Pedestrian Star Rating
Percentage of travel on 3-star or better roads for pedestrians
12
gt75
of length and of travel in each category (5-star 4-star 3-star 2-star 1-star)
Star Rating
Bicyclist Star Rating
Percentage of travel on 3-star or better roads for cyclists 14 gt75
of length and of travel in each category (5-star 4-star 3-star 2-star 1-star)
Star Rating
Motorcyclist Star Rating
Percentage of travel on 3-star or better roads for motorcyclists 33 gt75
of length and of travel in each category (5-star 4-star 3-star 2-star 1-star)
Star Rating
Vehicle Occupant Star Rating
Percentage of travel on 3-star or better roads for vehicle occupants 56 gt75
of length and of travel in each category (5-star 4-star 3-star 2-star 1-star)
wwwiraporg
INFRASTRUCTURE ATTRIBUTE PERFORMANCE KPIS ndash BY ROAD LENGTH
iRAP Global Standard
Protocol Attribute
Primary KPI (Refer httpswwwvaccinesforroadsorg for sample of global and national performance)
Current Global Performance
2030 Target
iRAP Coding Manual
Sidewalk Operating Speed
Percentage of roads where pedestrians are present and traffic flows at 40kmh (25mph) or more have formal footpaths or sidewalks
15
To be set by jurisdictions
iRAP Coding Manual
Pedestrian crossing ndash inspected road Operating Speed
Percentage of roads where pedestrians cross and traffic flows at 40kmh (25mph) or more have pedestrian crossing facilities
8
iRAP Coding Manual
Pedestrian crossing quality Operating Speed
Percentage of pedestrian crossings that are adequately signed or maintained
88
iRAP Coding Manual
Facilities for motorised two wheelers Operating Speed
Percentage of roads where motorcyclists are present and traffic flows at 60kmh (40mph) or more have dedicated motorcycle facilities
1
iRAP Coding Manual
Bicycle facility Operating Speed
Percentage of roads where bicyclists are present and traffic flows at 40kmh (25mph) or more have dedicated bicycle facilities
9
iRAP Coding Manual
Median Type Operating Speed
Percentage of roads where traffic flows at 80kmh (50mph) or more have divided carriageways
19
iRAP Coding Manual
Roadside severity (object amp distance) Operating Speed
Percentage of roads where traffic flows at 80kmh (50mph) or more have low-risk roadsides
21
iRAP Coding Manual
Curvature Operating Speed
Percentage of roads where traffic flows at 80kmh (50mph) or more do not have sharp curves
97
iRAP Coding Manual
Intersection Type Operating Speed
Percentage of intersections where traffic flows at 60kmh (40mph) or more have turning provision
27
iRAP Coding Manual
Intersection Type Operating Speed
Percentage of railway crossings where traffic flows at 60kmh (40mph) or more have active protection
47
iRAP Coding Manual
Number of lanes Operating Speed
Percentage of roads where traffic flows at 80kmh (50mph) or more have dedicated overtaking provision
35
Star Rating for Schools
Pedestrian Star Rating
Percentage of school star rating data points that are 3-star or better for children
potential to present by of travel where volume data is available and reliable
wwwiraporg
GLOBAL ROAD INFRASTRUCTURE KEY PERFORMANCE INDICATORS
ndash NEW AND UPGRADED ROADS
Infrastructure and Speed Management for New and Upgraded Roads (Global Road Safety Performance Target 3)
iRAP Global
Standard
Protocol Attribute
Primary KPI (Refer httpswwwvaccinesforroadsorg for sample of
global and national performance)
Current Global
Performance 2030 Target
Extended Metrics (with primary performance measure in bold)
Star Rating
Pedestrian Star Rating
Percentage of travel on new or upgraded roads that are 3-star or better roads for pedestrians
100
of length and of travel in each category (5-star 4-star 3-star 2-star 1-star)
Star Rating
Bicyclist Star Rating
Percentage of travel on new or upgraded roads that are 3-star or better roads for cyclists
100 of length and of travel in each category (5-star 4-star 3-star 2-star 1-star)
Star Rating
Motorcyclist Star Rating
Percentage of travel on new or upgraded roads that are 3-star or better roads for motorcyclists
100 of length and of travel in each category (5-star 4-star 3-star 2-star 1-star)
Star Rating
Vehicle Occupant Star Rating
Percentage of travel on new or upgraded roads that are 3-star or better roads for vehicle occupants
100 of length and of travel in each category (5-star 4-star 3-star 2-star 1-star)
Regular measurement of existing road networks (eg every 5 years as legislated in Europe) will provide an opportunity to measure progress World Bank
GRSF is currently undertaking a worldwide project measuring progress The recently launched Star Rating for Designs tool supports performance tracking
wwwiraporg
Risk Mapping Examples
EuroRAP UK Risk Mapping
KiwiRAP Risk Mapping
Star Rating and iRAP Attribute Data Examples
vaccinesforroadsorghow-safe-are-the-worlds-roads
wwwiraporg
Australian Infrastructure Safety KPI Data Snapshot
In general many of our roads do not provide a safe workplace for Australians who
use the roads each and every day As an example (noting that the source data is a
sample only of AusRAP data collected up to 2018) the Australian Star Rating and KPI
attribute data performance is provided below
bull 73 of the high-speed roads assessed have dangerous roadsides - typically 30 of
deaths in Australia come from run-off road crashes
bull 91 of the high-speed roads assessed are undivided - typically 20 of deaths in Australia
are head-on crashes
bull 62 of intersection have no safe turning provision - typically 20 of fatal crashes happen
at intersections
bull 15 of roads have no footpaths and 76 of the road length provides no facility for a
pedestrian to cross the road safely - typically 10 of fatalities are pedestrians
bull 91 of roads assessed where bicycles are present have no dedicated bicycle facilities -
the June data published by BITRE highlights an 83 increase in bicycle fatalities this year
wwwiraporg
Global Road Safety Performance Targets
In terms of all safe system activities the performance targets should at a very
minimum allow Australia to systematically report against the Global Road Safety
Performance Targets agreed by Member States at the global level ndash including
Australia ndash and the WHO Global Status Report on Road Safety
See httpswwwwhointroadsafetypublicationsen for further details
wwwiraporg
TOR g recommendations for Office of Road Safety role
The Office of Road Safety role must be elevated within the Department Without the
authority to convene and support a potential Standing Committee for Road Safety
the desired impact of national leadership and governance will not be achieved
A number of key initiatives have been enacted by the Federal Government already in
relation to the Inquiry Recommendations In many cases the scale of the individual
elements are not yet at the level envisioned as part of the Inquiry Recommendations
While the Inquiry authors did not specifically prescribe where and how budgets
should be allocated for the $3 billion Road Safety Fund seeing this an important
function of the new national leadership team high-level work was done to consider
where funding should be allocated and is provided below for information
How to mobilise the $3bn Road Safety Fund
Pillar Per annum budget Areas of investment
Road Safety Management
$ 500 million ORS ($50m) National Road Safety Observatory ($50m) Trauma Registry ($50m) Baseline Data and KPI measurement and incentives ($50m) RampD Innovation ($150m) and Enablers Capacity Development Fund ($150m)
Safer Roads $ 2 billion AusRAP hub National Highways Safety enhancement ($1 billion on top of existing commitments) Local Government Safer Roads Fund to raise roads to 3-star or better ($1 billion)
Safer Vehicles $ 300 million ANCAP Vehicle Regulations ($100 million) ADVI coordinated trials and new technologies ($100 million) Accelerated deployments incentives ($100 million)
Safer Road Users
$ 50 million Funds to support road user behaviour technology trials speed management on National Highway research and sharing between jurisdictions ($50 million)
Safer Speeds $ 50 million Incentive funding for State-based acceleration of safe system speed management initiatives across all roads
Post Crash Care
$ 100 million Trauma Centre TAC T4NSW data extension Australia wide NDIS links Insurance reform ($100 million)
wwwiraporg
As highlighted in the previous sections on the strategy development the Office of
Road Safety role should include
bull Accountability for the national road safety strategy and the setting of
ambitious targets
bull Accountability for the management of the $3 billion a year funding and the
associated governance and performance of outcomes supported with that
funding
bull Setting and monitoring national KPIs and ensuring accountability for the
achievement of those KPI targets across all jurisdictions and annual reporting
on progress
bull Accountability for vehicle safety ndash of all vehicle types
bull Establishing funding criteria with star rating and safety performance outcomes
for the infrastructure funding support for States Territories and Local
Government
bull Accountability for convening the multi-stakeholder forums within the Federal
Government including Transport Health Education and DFAT portfolios
bull Coordinating international engagement and support for our neighbours in the
Pacific and Asian regions who can benefit from Australian road safety
expertise aid and trade opportunities
wwwiraporg
TOR h other measures with a focus on the Inquiry Recommendations
iRAP is already actively supporting the Global Infrastructure Hub and also DFAT with
positive economic aid and trade related activities including but not limited to
bull The G20 Quality Infrastructure guidance
bull The Australia-India Infrastructure Council
bull Road infrastructure safety in Vietnam
bull AusRAP and IndiaRAP twinning partnerships
This could be actively expanded with PacificRAP and AusRAP partnerships to deliver
3-star and better roads across the Pacific Integrating the IndonesiaRAP development
in Indonesia with the KIAT activities and the IndiaRAP and AusRAP twinning
expansion for industry level cooperation and partnerships
The Australia Government should recommitcommit to important global initiatives
including the World Bank Road Safety Facility and the UN Road Safety Fund
The Australian Government should also ensure as a shareholder of the multi-lateral
development banks that their investment is in line with the Global Road Safety
Performance Targets
Long term results-based financing partnerships with low and middle-income
countries to bring their roads to 75 of travel at the 3-star or better global standard
will be a win for health for transport for poverty alleviation and government to
government relationships Both aid and trade outcomes can be significant if
managed with the focus on win-win outcomes for all
The recommended actions from the Inquiry Recommendations are reproduced here
for information
raquo Establish an international road safety consultative committee that draws on the expertise of numerous Australian and international road safety specialists The committee would inform DFAT of road safety priorities and strategies
raquo Continue to support the United Nations Decade of Action for Road Safety and the Sustainable Development Goals with particular focus on the Indo-Pacific
raquo Ensure all development projects using Australian finance and capital include minimum standards and outcomes that support the UN Global Road Safety Targets Importantly these must not increase death and injury on affected roads
raquo Provide seed funding for targeted international road safety collaboration research and demonstration programs and partnerships These include the Global Road Safety Facility Global Network for Road Safety Legislators iRAP GNCAP and the UN Road Safety Fund
wwwiraporg
iRAP Opening Statement to the Joint Select Committee on Road Safety
Good afternoon Honourable Ministers and Senators My name is Rob McInerney and
I am the Chief Executive Officer of iRAP the International Road Assessment
Programme a global charity that is working in partnership with governments the
road industry and NGO partners in over 100 countries around the world This
includes EuroRAP usRAP BrasilRAP ChinaRAP IndiaRAP and KiwiRAP amongst
others
As an Australian I would like the AusRAP programme here in Australia to be the best
There are some great things happening here with over 200000km of star rating data
already available as part of the existing partnerships between Austroads ARRB AAA
and iRAP This includes
bull the TIC approved national targets for 90 of travel on the National Highway to be
3-star or better by 2020
bull The Midlands Highway Bruce Highway and Princes Highway investment that is
delivering 3 4 and 5-star performance levels and an 80+ reduction in road
trauma in some cases
bull the BHP led upgrades to public roads in Queensland (and around the world) to
reduce risk to their staff
bull the AAA and state-club advocacy Risk Mapping and Star Rating for Schools work
bull the local government investment partnerships like Eurobodalla Shire and the local
roads of regional significance
bull the TAC iRAP Injury Dashboard and Impact Investment work that is shining a
light on the true human impact and cost to the health system of road trauma and
bull international partnerships like the AusRAP and IndiaRAP twinning and work to
support the new Australia-India Infrastructure Council discussed recently by
Prime Minister Modi and Morrison
But as with many road safety initiatives in this country we lack coordination are
duplicating effort being more protective of our political image than the humans who
use the roads and simply not doing enough of the proven things that work We still
lack the urgency and scale of response that is needed ndash but we can fix that
In simple terms 400000 Australians will be killed and injured on our roads over the
next 10 years Based on analysis we have completed in partnership with the TAC in
Victoria 27000 people will suffer brain injuries 85000 will suffer severe bone
fractures and over 100000 will suffer soft tissue injuries
wwwiraporg
So what would applying the best-in the world look like for AusRAP Building on what
we have done already there would be
bull An AusRAP hub (similar to ANCAP) to coordinate national partnerships data
innovation communications and reporting
bull AusRAP Crash Risk Maps of the National Highway and major state networks
would be published every year like the UK and Spain have done for 20 years and
wersquod have urban risk mapping for pedestrians and cyclists like KiwiRAP
bull Proactive Star Rating and Investment Plan assessments of the National and State
Highway network systematically every 3-5 years that measure progress against
the targets and shapes the investment pipeline for the future as completed by
Mexico China and is now specified by the European Union
bull A large-scale Safer Roads Fund would be mobilised like the ldquoHighway Safety to
Cherish Liferdquo programme in China DoT investment for county roads in the UK
and the new private sector partnerships in Brazil that are taking existing roads
and upgrading them to 3-star or better performance levels
bull Kids would be provided with 4 and 5-star journeys to school like those happening
in Vietnam USA Uruguay and Zambia to name a few
bull The before and after star rating and fatality estimates would be routinely
reported for all road upgrades ndash like the 3 4 and 5-star targets being applied by
Highways England and the Multi-lateral Development Banks are doing from Fiji to
El Salvador and India to Ethiopia
bull And we would celebrate successhellip with you and your Ministerial colleagues
ribbon cutting every upgraded 3-star or better road like the urban roads in
Shanghai that achieved 5-star for pedestrians and cyclists through to the rural
roads in India that have hit the minimum 3-star global targets
Throughout the Covid-19 crisis I have heard commentators talk about the trade-off
between Protecting Lives and Protecting Livelihoods When investing in road trauma
reduction there is no trade-off
Systematic investment in 3-star or better roads for all road users will save lives save
money and create jobs in every corner of this country We can Protect Lives and
Protect Livelihoods We must Protect Lives and Protect Livelihoods
wwwiraporg
Contents
Introduction and background 5
Australian Road Assessment Programme ndash Example Outputs amp Partnerships 6
TOR a Effectiveness of existing programs and Safe System Opportunities 8
Response to the Inquiry into the National Road Safety Strategy 8
Safe System Opportunities 9
TOR b Impact of road trauma on the nation ndash including remote and regional areas 11
The Impact in Rural and Remote Regions 12
TOR c Parliamentary Standing Committee on Road Safety and its functions 13
TOR d Measures to ensure government road infrastructure investment incorporates safe system
principles 14
AusRAP Hub 14
Minimum Star Rating Standards for new roads 16
TOR e road trauma and incident data collection and coordination 19
Annual Risk Maps and Performance Tracking 19
Harmonisation detail and timeliness of injury data 22
TOR f recommended strategies performance measures and targets for next Strategy 24
Road Infrastructure Key Performance Indicators using the iRAP Global Standard 25
Australian Infrastructure Safety KPI Data Snapshot 32
Global Road Safety Performance Targets 33
TOR g recommendations for Office of Road Safety role 34
How to mobilise the $3bn Road Safety Fund 34
TOR h other measures with a focus on the Inquiry Recommendations 36
wwwiraporg
Introduction and background
iRAP is a UK registered global charity with the vision for a world free of high-risk
roads The charity provides the global standard for infrastructure safety
performance monitoring as recommended by WHO Member States UN agencies
the International Transport Forum of the OECD Global Infrastructure Hub the World
Bank PIARC (the World Road Association) European Investment Bank and other
national governments and multi-lateral development agencies The specifications
systems and supporting software are provided in a free-to-air environment for all
partners to use Global partners contribute to the continuous enhancement and
improvement of the programme for the mutual benefit of all partners
The AusRAP programme in Australia has been active since 2004 and was the first RAP
programme outside Europe The programme is currently governed by an MOU
agreement between the Australian State Territory and Local Government road
agencies represented by Austroads ARRB AAA and iRAP Austroads research has
helped underpin the global evidence base used in the models The associated
ANRAM metrics and theory are based on the iRAP methodology coding manual star
rating fatality estimation investment planning and attribute specifications that form
the basis of infrastructure KPI reporting globally It is noted that many practitioners
have major misunderstandings of this link and do not appreciate the significant iRAP
intellectual property and partnership that is provided for free that supports the
integrated AusRAPANRAM solutions
Australian experts have also helped shape the global programme that now reaches
100+ countries 1000000km+ of roads and has made over $100 billion of road
investment safer worldwide from school entrances to major freeways and toll-roads
An approximate estimate of work already completed by the partners in Australia is
provided below
STATE STAR RATING amp
INVESTMENT PLANS
(since 2012)
RISK MAPPING
(crash maps)
STAR RATING OF
ROAD DESIGNS
(new since 2019)
Australian Capital Territory 1000km+
40000km+ 350km+
New South Wales 24000km+
Northern Territory 2000km+
Queensland 50000km+
South Australia 13000km+
Tasmania 800km+
Victoria 28000km+
Western Australia 40000km+ (light data)
wwwiraporg
Australian Road Assessment Programme ndash Example Outputs amp Partnerships
The AusRAP Hub will build on an extensive platform of local experience and application by State and
Local Government Agencies Motoring Clubs Austroads and ARRB The partnership benefits from
and contributes to the global iRAP partnerships that are in place in over 100 countries worldwide
Examples of AusRAP partner activity in Australia are provided below
National Star Rating Policy Targets ndash TIC Statewide Vehicle Star Ratings ndash TMR
Vehicle Star Ratings ndash TMR Queensland
Safer Road Investment Plan ndash TAC
Before and After Star Ratings ndash VicRoads AusRAP Crash Risk Maps ndash AAA RACQ
wwwiraporg
httpswwwmidlandhighwaytasgovauabout_the_action_plan
httpswwwvaccinesforroadsorgcase-studies-of-success
Global first Ai-RAP Partnership to use
big data and artificial intelligence to
generate low-cost scalable RAP data
underway with MRWA Transport for
NSW and the iMove CRC will support
AusRAP KPI measures
wwwiraporg
TOR a Effectiveness of existing programs and Safe System
Opportunities
Response to the Inquiry into the National Road Safety Strategy
While slow we are pleased to see positive progress on some of the Inquiry
Recommendations however there are a few major areas to address
bull Recommendation 3 with the commitment to the minimum $3 billion a year road safety
fund
bull Recommendation 5 with the commitment to the key performance indicators ndash that
should as a minimum align with the Global Road Safety Performance Targets agreed by
WHO Member States including Australia ndash with baseline assessments completed this
year along with the establishment and resourcing of a national road safety observatory
bull Recommendation 8 for speed management initiatives that support harm elimination
(eg Auckland Transport recent activity)
bull Recommendation 9 for all new roads to be 3-star or better for all road users include the
AusRAP data in the Infrastructure Australia audit establish a long-term Safer Roads Fund
and establish a national AusRAP programmehub to complement the ANCAP partnership
that already exists
bull Recommendation 12 to elevate and coordinate DFAT aid and trade partnerships with a
focus on road safety outcomes in the Indo-Pacific Region support for global initiatives
including the Global Road Safety Facility UN Road Safety Fund and key enablers like the
multi-lateral development banks Global Network for Road Safety Legislators iRAP and
Global NCAP
wwwiraporg
Safe System Opportunities
In simple terms Vision Zero and Safe System outcomes will be achieved when we
have 5-star road users in 5-star vehicles on 5-star roads and the safe speeds to
ensure no one is killed or injured
From an iRAP perspective key areas to integrate these safe system principles
include
bull Corporate industry and community use and access to AusRAP Risk Mapping and
Star Rating Data to provide the safest route and mode-choice for their journeys
(as suggested by Hon Minister Thistlethwaite)
bull Spot star ratings completed at fatal and serious injury crash scenes and routinely
reported to the Standing Committee Office of Road Safety and in the public
domain to support discussions like those mentioned by Ms Bird on Picton Road
ldquoThe crash happened on a 1-star road and the driver in the 5-star car survived and
the 3 occupants in the 3-star vehicle were killed None of the fatal five
behaviours were evidentrdquo
bull Design for outcomes not a design to lsquostandardsrsquo This would involve a new
approach where the starting point for designs is a 5-star performance level and
design teams and funding agencies must then justify anything less than 5-star
highlighting any lsquocost savingsrsquo associated with the increased death and injury
expected over 20 years and why it is the design recommended
wwwiraporg
bull Integration of Safe System and AusRAP data and knowledge in the education
system (eg a driver is 6 times more likely to crash on a sharp curve crash risk is
halved for each incremental improvement in road star rating)
bull Building on TAC iRAP Injury Dashboard engage health Ministers and
professionals to understand lifetime cost of road trauma and impact on
resources
The relationship between Star Ratings and crash costs per kilometre travelled
httpswwwoecdorgpublicationszero-road-deaths-and-serious-injuries-9789282108055-enhtm
wwwiraporg
TOR b Impact of road trauma on the nation ndash including remote and
regional areas
iRAP believe that a lack of visibility of the true human impact of road crashes has
created the apathy and under-investment we have seen to date Shining a spotlight
on the true impact of road trauma has been a focus of the charity and partnerships
with organisations like TAC have enabled that to happen
The Vaccines for Roads resource has been designed to support this discussion
The Human Impact in Australia
httpswwwvaccinesforroadsorgglobal-impact-of-injuries
wwwiraporg
The human impact of road trauma is also personalhelliphellip
httpswwwvaccinesforroadsorghuman-impact
The Impact in Rural and Remote Regions
The public version of the TAC iRAP Injury Dashboard allows the human and financial
impact of road crashes to be explored by region The example below shows the rural
region of Loddon Mallee and highlights severe brain injuries are the largest costs
more than half of the claim costs happen more than 2 years after the crash as part of
long term care of the crash victims and 21-25 year olds are the most impacted More
detailed dashboards linking the AusRAP data and claim costs are used for internal
planning and programme management
httpwwwtacvicgovauroad-safetystatisticsonline-crash-databaseirap-road-injury-dashboard
wwwiraporg
TOR c Parliamentary Standing Committee on Road Safety and its
functions
The measurement and accountability for the achievement of key road safety KPIs
over the next ten years is critical to ensuring that 400000 Australians are not killed
and injured during that period Ensuring that accountability is set at the right level of
Government and related stakeholders requires good governance transparency of
reporting resourcing action and measurement of success
iRAP support the establishment of a Parliamentary Standing Committee on Road
Safety to perform this function as it relates to the Federal leadership responsibilities
agreed nationally This will also help ensure that the right level of financial and
human resources are mobilised to this preventable problem that will cost our
economy more than $300 billion over the next ten years
An important part of this function is to make sure that the 2021-2030 National Road
Safety Strategy currently under development includes clear accountability well
defined and measurable targets and a commitment to measure and report on
progress Soft language unambitious targets and blurred accountabilities must be
avoided in the next Strategy This will simplify the role of the Standing Committee in
providing the necessary leadership and oversight of Australiarsquos performance sharing
of success and refocussed action and learnings when performance is poor
wwwiraporg
TOR d Measures to ensure government road infrastructure
investment incorporates safe system principles
The Actions associated with the Inquiry Recommendations 3 4 5 8 and in particular
Recommendation 9 are reinforced
AusRAP Hub
The establishment of an AusRAP hub within the Office of Road Safety or supported
as a separate entity like ANCAP has the support of all of the existing local AusRAP
partners including Austroads AAA and ARRB
The process by which this can happen
is straight forward and follows well-
established global guidance by iRAP
Local ownership and leadership by
relevant government research and
consumer partners is encouraged in all
countries and supports the transparent
reporting of infrastructure safety
performance and the important
optimisation of investment to
maximise lives saved
Concept papers on how AusRAP can be
structured have been shared with the
Australian Government and Office of
Road Safety teams (refer excerpt on
following page) Other key
stakeholders including Roads Australia
Infrastructure Australia and ACRS could
also play important roles
Some recent examples from the UK and Brazil show how this can be undertaken and
launched as a positive initiative for road safety
wwwiraporg
AusRAP Hub - Infrastructure Safety Concept Paper
Other ORS
Responsibilities
Other ORS BITRE
Safe System KPIrsquos and
Performance Management
Programme Leadership
bull National Policy Coordination in support of Vision Zero target
bull Coordinate and monitor infrastructure-related KPIs for safety
bull Collate national road network risk assessment data
bull Secure and Deploy Federal Infrastructure Funding to eliminate high-risk roads
bull National Performance Tracking
Office of Road Safety amp AusRAP ndash Australia free of high-risk roads
Maximising the life-saving potential of Australiarsquos $30 billion+ per year
investment in road infrastructure for the benefit of all Australians
AusRAP ndash Implementation Leadership
bull Investment Planning Optimisation
bull Construction and Maintenance
bull Collection and Provision of Data
bull Before and After Measurement
bull National Research
bull National Policy Advice
bull National Guidelines on design
construction and management
AusRAP ndash Technical Leadership
bull Global Technical Committee
bull Training and Accreditation
bull Quality Assurance Certification
bull Infrastructure Australia Audit
bull Star Rating for Designs
bull Evaluation Studies
bull Data Cleansing Calibration
bull Innovation (eg AI Smart
Motorways Urban Safe System)
AusRAP ndash Communications Leadership
bull Ribbon Cutting Project Success
bull Results ndash Internal
bull Results ndash External
bull Media and Events Coordination
bull Star Rating for Schools
AusRAP ndash Global Support
bull Global Policy Programme Technical
Product Innovation and Event
Support
wwwiraporg
Minimum Star Rating Standards for new roads
BITRE reports as early as 2014 propose the use of the Star Rating global standard as a
simple and immediate evidence-based measure to apply to road infrastructure
investment This includes the concept that road funding would be subject to
meeting a minimum 3 4 or 5-star standard as required It is noted that significant
Australian research underpins the global RAP models that form the basis of the
global Star Rating standard used in over 100 countries worldwide
Road agencies have already applied the star rating standard on new projects (eg
Midlands Highway Prices Highway) and Austroads has included the star rating
standard in a number of their peak guidance documents
It is noted that the Star Rating standard for pedestrians cyclists and motorcyclists is
available and in wide use around the world but has had limited application by key
agencies so far in Australia While a lot of safe system work and discussions in
Australia is focussed on passenger vehicles the inclusion of the 3 4 and 5-star
performance targets for vulnerable road users is a simple and immediately available
solution for enhanced outcomes for all road users in Australian infrastructure
investment For example any new Metro public transport projects could include a
requirement that the 1km radius around the passenger stations are 5-star for
pedestrians and cyclists
Together with the World Bank and FIA Foundation iRAP developed the dedicated
and freely available Star Rating for Designs software solution that allows road
designs to be assessed in a simple and systematic way (httpswwwiraporgstar-
rating-for-designs)
Safe system can be characterised as 5-star users in 5-star vehicles on 5-star roads
Speed is a key component of each part of the system In terms of road design
Government can specify that a 5-star facility must be designed and any departure
from that 5-star standard must be justified along with the associated trauma levels
expected Australian state road agencies are already working with iRAP to integrate
the safe system reporting of both star rating and key attribute reporting (eg
protected roadsides for run-off road crashes protected medians for head-on crash
risk) in their road projects
wwwiraporg
The key elements for success to ensure government road infrastructure investment
incorporates safe system principles include
bull A national policy target for the of travel on 3-star or better road
infrastructure that will support the setting of star rating targets for all road
infrastructure investment
bull Associated targets for travel on 5-star roads that supports full safe system
outcomes on high-volume strategic roads where Vision Zero outcomes are
desired by 2030 on the journey to Vision Zero everywhere by 2050 (refer
Recommendation 4 of the Inquiry)
As an example the following clause can be added to all Federal road funding
allocations for both major projects and road safety targeted funding Similar
approaches are being adopted by high-income governments and low and middle-
income country governments via the multi-lateral development banks
ldquoThe new road shall be built to an lsquoxrsquo-star standard for all road users This includes
for pedestrians cyclists motorcyclists and vehicle occupants where present The
before and after star rating and the before and after fatality and serious injury
estimates shall be reported
Before Star Ratings and Fatal and Serious Injury Estimate
Road User FSI Estimate
After Star Ratings and Fatal and Serious Injury Estimate
Road User FSI Estimate
wwwiraporg
The Federal Department and the Standing Committee could then have simple annual
reports detailing the length of road and kilometres of travel moved to a 3 4 and 5-
star standard across the entire funding portfolio This will provide good governance
and reporting supportive of the current national targets agreed by Ministers for
increasing the percent of travel on 3-star or better roads across Australia
Within the safe system context iRAP is working with the European Union and other
partners to ensure the combined performance of new driver assistance technologies
vehicle safety standards road design standards and technology ITS deployment are
implemented to minimise the occurrence of death and injury For further details see
httpseuroraporgslain-project and httpswwwiraporg201712event-
snapshot-innovation-2017 As part of the global programme all AusRAP partners
will immediately benefit from any breakthroughs and methodologies and global
partners will benefit from Australian ingenuity
While not the core expertise of iRAP the approaches for the other elements of the
safe system can be easily included For example
bull All Federal Government National Highway investment shall include point to
point speed cameras distraction and seat-belt monitoring and rest areas to
support safe user behaviour
bull In line with Federal Government leadership of vehicle safety (refer
Recommendation 7 of the Inquiry Recommendations) to support ANCAP
Heavy Vehicle Regulation and rapid adoption and alignment with minimum
European vehicle standards all major projects can include targeted
communications with communities along new corridors about vehicle safety
standards and potential incentives for after-market retrofit technologies
wwwiraporg
TOR e road trauma and incident data collection and coordination
Annual Risk Maps and Performance Tracking
The use of the AusRAP Risk Maps as an annual reporting tool to provide crash data in
a map-based format will provide high-value for all Australians This includes the new
Office of Road Safety and potential Standing Committee in measuring performance
of the Australian National Road Safety Strategy The risk maps ndash prepared in
accordance with the iRAP global standard - will provide the ultimate measure of
success in reducing crash rates over time from all action areas and allow
benchmarking within Australia and across other leading countries in Europe
The Risk Maps will also benefit fleet managers companies and community members
in understanding some roads are safer than others As mentioned by Minister
Thistlethwaite this can ultimately support the introduction of apps to allow the safest
route and mode choice from A to B to be mapped for all journeys for all Australians
Ready examples of this annual risk mapping approach are available from countries
like the UK and Spain and highlight the potential of this approach to support
transparent performance tracking This can ensure success can be celebrated when
high -risk roads become low-risk ndash and also to continuously target any persistently
high-risk roads
Refer to the following overseas examples for more information
bull httpsroadsafetyfoundationorgprojecthow-safe-are-you-on-britains-main-
road-networks-eurorap-results-2019
bull httpseuroraporgwp-contentuploads20200120170608-5-EuroRAP-in-
Spain-L-Puertopdf
bull httpwwwkiwiraporgnzrisk_mapshtml
wwwiraporg
EuroRAP UK Risk Mapping Dashboard
Risk Distribution per billion kilometre travelled (UK)
of travel on low to high crash rates by road type (UK)
wwwiraporg
Performance Tracking (KiwiRAP)
Spanish Risk Maps ndash the improvement from 2004 ndash 2014
wwwiraporg
Harmonisation detail and timeliness of injury data
iRAP fully support the harmonisation of injury data collection and the essential work
of Austroads RACS and other partners in enabling this work
In addition it is very important that the Human Impact of Road Trauma is adequately
communicated with the Australian population The accountability scale and urgency
of our response ndash from politicians to business from road agencies to road users ndash
requires a much better understanding that deaths are just the tip of the iceberg
The TAC and iRAP has already completed world-leading work to shine a spotlight on
the human impact of road trauma as detailed in the images below
The Australian Impact of Road Injuries every year (projected)
httpswwwvaccinesforroadsorgglobal-impact-of-injuries
wwwiraporg
In addition to the public projections more detailed analysis and dashboards have
been developed for the public to access (httpwwwtacvicgovauroad-
safetystatisticsonline-crash-databaseirap-road-injury-dashboard) and also for TAC
internal use
Individual human impact stories have also been shared to demonstrate the personal
impact of every crash one by one
httpswwwvaccinesforroadsorghuman-impact
In addition to the TAC work in Victoria the extensive work of Transport for NSW
Centre for Road Safety in providing valuable road safety data and performance
metrics for the benefit of all NSW stakeholders is a great example of best practice in
Australia
wwwiraporg
TOR f recommended strategies performance measures and targets
for next Strategy
First and foremost the new Strategy must implement the 12 Inquiry
Recommendations and associated actions in full and the key elements of the many
submissions and consultations that have occurred over recent years Accountability
and Action Urgency and Scale are the key themes that must drive action
The core elements of Road Safety Management Safe Speeds Safe Roads Safe
Vehicles Safe Road Users and Improved Post Crash Care are globally accepted and
aligning with this proven structure is essential This will also align with State-level
strategies and also allow global best practice to be mobilised here also
Within the Road Safety Management action area it is essential that the new strategy
is very clear on accountabilities As a special advisor to the National Inquiry we
recommended a national governance review What we expected was a simple
outline of where the Federal Government should lead ndash and where the established
expertise and ownership of actions at a State local and non-government area are
clearly articulated and understood
As an example the Federal Government should lead on
bull Owning the National Road Safety Strategy and accountabilities
bull Owning KPI reporting through national road safety observatory functions and
harmonised data reporting and incentivising data collection and reporting
from other relevant stakeholders
bull Supporting safe system national coordination through ANCAP AusRAP
National Road Rules and Trauma Registry hubs functions
bull Leading on vehicle standards and vehicle import requirements and the
accelerated uptake of new technologies
bull Providing enabling funds (Recommendation 3 ndash the $3 bn a year road safety
fund) for National Highway 5-star investments and for local government to
bring roads to 3-star or better standards This can be targeted using the
annual Risk Maps and Star Rating benchmarks every 3-5 years as mandated
in Europe
bull Supporting initiatives for research capacity development efficient delivery
mechanisms for local government in particular innovation and key enablers
wwwiraporg
Importantly the National Strategy should recognise the state-level leadership and
strategies in their areas of clear accountability ndash and not try and duplicate or cross-
over those issues The well-set ambitious optimised and resourced work to achieve
the key performance indicators will provide the ultimate coordinating function for
national action and accountability
Road Infrastructure Key Performance Indicators using the iRAP Global Standard
The following pages outline the global Safer Roads Road Infrastructure KPIs
recommended for use globally as part of the iRAP Global Standard and the Global
Road Safety Performance Targets This work is informing target and KPI setting
across Europe and worldwide through the Regional Road Safety Observatories in
Latin America Africa and Asia Global alignment on these KPIs will also ensure Ai-
RAP initiatives to ensure big-data approaches to streamline data collection is
immediately available for all partners to benefit from in Australia
Australian adoption of these targets as a minimum requirement will ensure the
significant investment in AusRAP data collection nationally already (100000km+)
provides a great starting point for performance tracking across Australia The
approach will also allow simple benchmarking with other countries (eg performance
of Australian motorways versus French Spanish and UK Motorways pedestrian star
ratings in inner CBD areas comparing Stockholm versus Sydney)
It is worth noting that the Federal Government may choose to undertake
independent measurement of National Highway performance but in most cases all
data collection will be undertaken by States using full high tech Ai-RAP or light data
AusRAP methodologies as required The same data is the basis for any ANRAM crash
FSI data estimates
Given the $100 billion investment in infrastructure by the Federal Government over
the next ten years ensuring good road safety data drives investment decisions and
measurement of success is a very small element when considered as an integral part
of each multi-million dollar project and funding allocation
wwwiraporg
Road Infrastructure Key Performance Indicators
using the iRAP Global Standard
Harmonisation of road safety data is a major focus of all stakeholders across the world This includes
fatality and injury data road infrastructure performance data vehicle performance data road user
behaviour data and post-crash response data
The recommended road infrastructure Key Performance Indicators (KPIrsquos) will ensure harmonised
collection of data in support of the following
bull the United Nations Sustainable Development Goals
bull the 12 Global Road Safety Performance Targets agreed by Member States
bull the EU RISM Directive
bull the Regional Road Safety Observatories
bull WHO Global Status Report on Road Safety
bull the Sum4All initiative and
bull policies and strategies set by Governments development organisations donors and NGOs
worldwide
Member State agreed Global Road Safety Performance Targets
httpswwwwhointroadsafetypublicationsen
About iRAP
iRAP is a registered charity The iRAP specifications methodologies and software provide the global
standard with all resources published in the public domain for free use by partners globally
(httpswwwiraporgresources) The iRAP methodologies are overseen by an independent Global
Policy Advisory Committee and Global Technical Committee and are supported with training courses
and an accreditation scheme for partners and suppliers worldwide
wwwiraporg
The iRAP Global Standard
iRAP methodologies have been applied by partners in more than 100 countries across more than
1 million kilometres of road These safety assessments are informing more than US$75 billion of road
investment and provide harmonised road infrastructure KPIrsquos for the mutual benefit of all stakeholders
worldwide Local ownership and application of the iRAP Global Standard is encouraged and
supported in every country To date more than 25000 people have participated in training
workshops and presentations on iRAP content
The global iRAP standard provides numerous benefits including
bull an objective evidence-based approach to assessing infrastructure related risk that all
jurisdictions and stakeholders can access
bull a way to benchmark performance between jurisdictions and road classes
bull a mechanism to fast-track safety assessments through innovative initiatives such as linkages
to road asset data Ai-RAP and the light data methodology and
bull alignment with the UN WHO EU PIARC and multi-lateral development bank policies and
recommendations
Achieving UN Targets 3 and 4 by 2030 will mean
To understand what achieving the KPIs would mean for your country
see iRAPrsquos Business Case for Safer Roads
For more information
bull To learn more about IRAP and its global programmes and activities visit iraporg
bull To apply the Step by Step Approach to Safer Roads with the KPIs providing the confidence to
invest and the metrics to measure success visit vaccinesforroadsorgtake-action
bull To understand the human impact of road crashes how safe the worldrsquos roads are and what is
possible for your country ndash in terms of fatal and serious injuries prevented and economic
savings that could be achieved by maximising the percentage of travel on 3-star or better
roads by 2030 - explore iRAPrsquos Big Data Tool at vaccinesforroadsorg
bull To learn about or establish an iRAP programme in your country or state contact your local
representative by visiting the where we work map at iraporgabout-us
bull For details on iRAPrsquos protocols and how to apply them to your infrastructure projects visit
iraporghow-we-can-help
bull For training to support achieving the KPIs visit iraporgtraining
wwwiraporg
GLOBAL ROAD INFRASTRUCTURE KEY PERFORMANCE INDICATORS (KPIrsquoS) ndash
EXISTING ROADS
Crash Data
iRAP Global
Standard
Protocol Attribute
Primary KPI Current Global
Performance 2030 Target
Extended Metrics (with primary performance measure in bold)
Crash Risk Mapping
Collective Crash Risk Maps
Percentage of road length with lt XXX fatal and serious crashes per kilometre per year
To be set by jurisdiction
in each category (low low-medium medium medium-high and high risk)
Crash Risk Mapping
Individual Crash Risk Maps
Percentage of road length with lt XXX fatal and serious crashes per billion vehicle kilometres travelled
To be set by jurisdiction
in each category (low low-medium medium medium-high and high risk)
Infrastructure and Speed Management for existing roads (Global Road Safety Performance Target 4)
iRAP Global
Standard
Protocol Attribute
Primary KPI (Refer httpswwwvaccinesforroadsorg for sample of
global and national performance)
Current Global
Performance 2030 Target
Extended Metrics (with primary performance measure in bold)
Star Rating
Pedestrian Star Rating
Percentage of travel on 3-star or better roads for pedestrians
12
gt75
of length and of travel in each category (5-star 4-star 3-star 2-star 1-star)
Star Rating
Bicyclist Star Rating
Percentage of travel on 3-star or better roads for cyclists 14 gt75
of length and of travel in each category (5-star 4-star 3-star 2-star 1-star)
Star Rating
Motorcyclist Star Rating
Percentage of travel on 3-star or better roads for motorcyclists 33 gt75
of length and of travel in each category (5-star 4-star 3-star 2-star 1-star)
Star Rating
Vehicle Occupant Star Rating
Percentage of travel on 3-star or better roads for vehicle occupants 56 gt75
of length and of travel in each category (5-star 4-star 3-star 2-star 1-star)
wwwiraporg
INFRASTRUCTURE ATTRIBUTE PERFORMANCE KPIS ndash BY ROAD LENGTH
iRAP Global Standard
Protocol Attribute
Primary KPI (Refer httpswwwvaccinesforroadsorg for sample of global and national performance)
Current Global Performance
2030 Target
iRAP Coding Manual
Sidewalk Operating Speed
Percentage of roads where pedestrians are present and traffic flows at 40kmh (25mph) or more have formal footpaths or sidewalks
15
To be set by jurisdictions
iRAP Coding Manual
Pedestrian crossing ndash inspected road Operating Speed
Percentage of roads where pedestrians cross and traffic flows at 40kmh (25mph) or more have pedestrian crossing facilities
8
iRAP Coding Manual
Pedestrian crossing quality Operating Speed
Percentage of pedestrian crossings that are adequately signed or maintained
88
iRAP Coding Manual
Facilities for motorised two wheelers Operating Speed
Percentage of roads where motorcyclists are present and traffic flows at 60kmh (40mph) or more have dedicated motorcycle facilities
1
iRAP Coding Manual
Bicycle facility Operating Speed
Percentage of roads where bicyclists are present and traffic flows at 40kmh (25mph) or more have dedicated bicycle facilities
9
iRAP Coding Manual
Median Type Operating Speed
Percentage of roads where traffic flows at 80kmh (50mph) or more have divided carriageways
19
iRAP Coding Manual
Roadside severity (object amp distance) Operating Speed
Percentage of roads where traffic flows at 80kmh (50mph) or more have low-risk roadsides
21
iRAP Coding Manual
Curvature Operating Speed
Percentage of roads where traffic flows at 80kmh (50mph) or more do not have sharp curves
97
iRAP Coding Manual
Intersection Type Operating Speed
Percentage of intersections where traffic flows at 60kmh (40mph) or more have turning provision
27
iRAP Coding Manual
Intersection Type Operating Speed
Percentage of railway crossings where traffic flows at 60kmh (40mph) or more have active protection
47
iRAP Coding Manual
Number of lanes Operating Speed
Percentage of roads where traffic flows at 80kmh (50mph) or more have dedicated overtaking provision
35
Star Rating for Schools
Pedestrian Star Rating
Percentage of school star rating data points that are 3-star or better for children
potential to present by of travel where volume data is available and reliable
wwwiraporg
GLOBAL ROAD INFRASTRUCTURE KEY PERFORMANCE INDICATORS
ndash NEW AND UPGRADED ROADS
Infrastructure and Speed Management for New and Upgraded Roads (Global Road Safety Performance Target 3)
iRAP Global
Standard
Protocol Attribute
Primary KPI (Refer httpswwwvaccinesforroadsorg for sample of
global and national performance)
Current Global
Performance 2030 Target
Extended Metrics (with primary performance measure in bold)
Star Rating
Pedestrian Star Rating
Percentage of travel on new or upgraded roads that are 3-star or better roads for pedestrians
100
of length and of travel in each category (5-star 4-star 3-star 2-star 1-star)
Star Rating
Bicyclist Star Rating
Percentage of travel on new or upgraded roads that are 3-star or better roads for cyclists
100 of length and of travel in each category (5-star 4-star 3-star 2-star 1-star)
Star Rating
Motorcyclist Star Rating
Percentage of travel on new or upgraded roads that are 3-star or better roads for motorcyclists
100 of length and of travel in each category (5-star 4-star 3-star 2-star 1-star)
Star Rating
Vehicle Occupant Star Rating
Percentage of travel on new or upgraded roads that are 3-star or better roads for vehicle occupants
100 of length and of travel in each category (5-star 4-star 3-star 2-star 1-star)
Regular measurement of existing road networks (eg every 5 years as legislated in Europe) will provide an opportunity to measure progress World Bank
GRSF is currently undertaking a worldwide project measuring progress The recently launched Star Rating for Designs tool supports performance tracking
wwwiraporg
Risk Mapping Examples
EuroRAP UK Risk Mapping
KiwiRAP Risk Mapping
Star Rating and iRAP Attribute Data Examples
vaccinesforroadsorghow-safe-are-the-worlds-roads
wwwiraporg
Australian Infrastructure Safety KPI Data Snapshot
In general many of our roads do not provide a safe workplace for Australians who
use the roads each and every day As an example (noting that the source data is a
sample only of AusRAP data collected up to 2018) the Australian Star Rating and KPI
attribute data performance is provided below
bull 73 of the high-speed roads assessed have dangerous roadsides - typically 30 of
deaths in Australia come from run-off road crashes
bull 91 of the high-speed roads assessed are undivided - typically 20 of deaths in Australia
are head-on crashes
bull 62 of intersection have no safe turning provision - typically 20 of fatal crashes happen
at intersections
bull 15 of roads have no footpaths and 76 of the road length provides no facility for a
pedestrian to cross the road safely - typically 10 of fatalities are pedestrians
bull 91 of roads assessed where bicycles are present have no dedicated bicycle facilities -
the June data published by BITRE highlights an 83 increase in bicycle fatalities this year
wwwiraporg
Global Road Safety Performance Targets
In terms of all safe system activities the performance targets should at a very
minimum allow Australia to systematically report against the Global Road Safety
Performance Targets agreed by Member States at the global level ndash including
Australia ndash and the WHO Global Status Report on Road Safety
See httpswwwwhointroadsafetypublicationsen for further details
wwwiraporg
TOR g recommendations for Office of Road Safety role
The Office of Road Safety role must be elevated within the Department Without the
authority to convene and support a potential Standing Committee for Road Safety
the desired impact of national leadership and governance will not be achieved
A number of key initiatives have been enacted by the Federal Government already in
relation to the Inquiry Recommendations In many cases the scale of the individual
elements are not yet at the level envisioned as part of the Inquiry Recommendations
While the Inquiry authors did not specifically prescribe where and how budgets
should be allocated for the $3 billion Road Safety Fund seeing this an important
function of the new national leadership team high-level work was done to consider
where funding should be allocated and is provided below for information
How to mobilise the $3bn Road Safety Fund
Pillar Per annum budget Areas of investment
Road Safety Management
$ 500 million ORS ($50m) National Road Safety Observatory ($50m) Trauma Registry ($50m) Baseline Data and KPI measurement and incentives ($50m) RampD Innovation ($150m) and Enablers Capacity Development Fund ($150m)
Safer Roads $ 2 billion AusRAP hub National Highways Safety enhancement ($1 billion on top of existing commitments) Local Government Safer Roads Fund to raise roads to 3-star or better ($1 billion)
Safer Vehicles $ 300 million ANCAP Vehicle Regulations ($100 million) ADVI coordinated trials and new technologies ($100 million) Accelerated deployments incentives ($100 million)
Safer Road Users
$ 50 million Funds to support road user behaviour technology trials speed management on National Highway research and sharing between jurisdictions ($50 million)
Safer Speeds $ 50 million Incentive funding for State-based acceleration of safe system speed management initiatives across all roads
Post Crash Care
$ 100 million Trauma Centre TAC T4NSW data extension Australia wide NDIS links Insurance reform ($100 million)
wwwiraporg
As highlighted in the previous sections on the strategy development the Office of
Road Safety role should include
bull Accountability for the national road safety strategy and the setting of
ambitious targets
bull Accountability for the management of the $3 billion a year funding and the
associated governance and performance of outcomes supported with that
funding
bull Setting and monitoring national KPIs and ensuring accountability for the
achievement of those KPI targets across all jurisdictions and annual reporting
on progress
bull Accountability for vehicle safety ndash of all vehicle types
bull Establishing funding criteria with star rating and safety performance outcomes
for the infrastructure funding support for States Territories and Local
Government
bull Accountability for convening the multi-stakeholder forums within the Federal
Government including Transport Health Education and DFAT portfolios
bull Coordinating international engagement and support for our neighbours in the
Pacific and Asian regions who can benefit from Australian road safety
expertise aid and trade opportunities
wwwiraporg
TOR h other measures with a focus on the Inquiry Recommendations
iRAP is already actively supporting the Global Infrastructure Hub and also DFAT with
positive economic aid and trade related activities including but not limited to
bull The G20 Quality Infrastructure guidance
bull The Australia-India Infrastructure Council
bull Road infrastructure safety in Vietnam
bull AusRAP and IndiaRAP twinning partnerships
This could be actively expanded with PacificRAP and AusRAP partnerships to deliver
3-star and better roads across the Pacific Integrating the IndonesiaRAP development
in Indonesia with the KIAT activities and the IndiaRAP and AusRAP twinning
expansion for industry level cooperation and partnerships
The Australia Government should recommitcommit to important global initiatives
including the World Bank Road Safety Facility and the UN Road Safety Fund
The Australian Government should also ensure as a shareholder of the multi-lateral
development banks that their investment is in line with the Global Road Safety
Performance Targets
Long term results-based financing partnerships with low and middle-income
countries to bring their roads to 75 of travel at the 3-star or better global standard
will be a win for health for transport for poverty alleviation and government to
government relationships Both aid and trade outcomes can be significant if
managed with the focus on win-win outcomes for all
The recommended actions from the Inquiry Recommendations are reproduced here
for information
raquo Establish an international road safety consultative committee that draws on the expertise of numerous Australian and international road safety specialists The committee would inform DFAT of road safety priorities and strategies
raquo Continue to support the United Nations Decade of Action for Road Safety and the Sustainable Development Goals with particular focus on the Indo-Pacific
raquo Ensure all development projects using Australian finance and capital include minimum standards and outcomes that support the UN Global Road Safety Targets Importantly these must not increase death and injury on affected roads
raquo Provide seed funding for targeted international road safety collaboration research and demonstration programs and partnerships These include the Global Road Safety Facility Global Network for Road Safety Legislators iRAP GNCAP and the UN Road Safety Fund

wwwiraporg
The iRAP Global Standard
iRAP methodologies have been applied by partners in more than 100 countries across more than
1 million kilometres of road These safety assessments are informing more than US$75 billion of road
investment and provide harmonised road infrastructure KPIrsquos for the mutual benefit of all stakeholders
worldwide Local ownership and application of the iRAP Global Standard is encouraged and
supported in every country To date more than 25000 people have participated in training
workshops and presentations on iRAP content
The global iRAP standard provides numerous benefits including
bull an objective evidence-based approach to assessing infrastructure related risk that all
jurisdictions and stakeholders can access
bull a way to benchmark performance between jurisdictions and road classes
bull a mechanism to fast-track safety assessments through innovative initiatives such as linkages
to road asset data Ai-RAP and the light data methodology and
bull alignment with the UN WHO EU PIARC and multi-lateral development bank policies and
recommendations
Achieving UN Targets 3 and 4 by 2030 will mean
To understand what achieving the KPIs would mean for your country
see iRAPrsquos Business Case for Safer Roads
For more information
bull To learn more about IRAP and its global programmes and activities visit iraporg
bull To apply the Step by Step Approach to Safer Roads with the KPIs providing the confidence to
invest and the metrics to measure success visit vaccinesforroadsorgtake-action
bull To understand the human impact of road crashes how safe the worldrsquos roads are and what is
possible for your country ndash in terms of fatal and serious injuries prevented and economic
savings that could be achieved by maximising the percentage of travel on 3-star or better
roads by 2030 - explore iRAPrsquos Big Data Tool at vaccinesforroadsorg
bull To learn about or establish an iRAP programme in your country or state contact your local
representative by visiting the where we work map at iraporgabout-us
bull For details on iRAPrsquos protocols and how to apply them to your infrastructure projects visit
iraporghow-we-can-help
bull For training to support achieving the KPIs visit iraporgtraining
wwwiraporg
GLOBAL ROAD INFRASTRUCTURE KEY PERFORMANCE INDICATORS (KPIrsquoS) ndash
EXISTING ROADS
Crash Data
iRAP Global
Standard
Protocol Attribute
Primary KPI Current Global
Performance 2030 Target
Extended Metrics (with primary performance measure in bold)
Crash Risk Mapping
Collective Crash Risk Maps
Percentage of road length with lt XXX fatal and serious crashes per kilometre per year
To be set by jurisdiction
in each category (low low-medium medium medium-high and high risk)
Crash Risk Mapping
Individual Crash Risk Maps
Percentage of road length with lt XXX fatal and serious crashes per billion vehicle kilometres travelled
To be set by jurisdiction
in each category (low low-medium medium medium-high and high risk)
Infrastructure and Speed Management for existing roads (Global Road Safety Performance Target 4)
iRAP Global
Standard
Protocol Attribute
Primary KPI (Refer httpswwwvaccinesforroadsorg for sample of
global and national performance)
Current Global
Performance 2030 Target
Extended Metrics (with primary performance measure in bold)
Star Rating
Pedestrian Star Rating
Percentage of travel on 3-star or better roads for pedestrians
12
gt75
of length and of travel in each category (5-star 4-star 3-star 2-star 1-star)
Star Rating
Bicyclist Star Rating
Percentage of travel on 3-star or better roads for cyclists 14 gt75
of length and of travel in each category (5-star 4-star 3-star 2-star 1-star)
Star Rating
Motorcyclist Star Rating
Percentage of travel on 3-star or better roads for motorcyclists 33 gt75
of length and of travel in each category (5-star 4-star 3-star 2-star 1-star)
Star Rating
Vehicle Occupant Star Rating
Percentage of travel on 3-star or better roads for vehicle occupants 56 gt75
of length and of travel in each category (5-star 4-star 3-star 2-star 1-star)
wwwiraporg
INFRASTRUCTURE ATTRIBUTE PERFORMANCE KPIS ndash BY ROAD LENGTH
iRAP Global Standard
Protocol Attribute
Primary KPI (Refer httpswwwvaccinesforroadsorg for sample of global and national performance)
Current Global Performance
2030 Target
iRAP Coding Manual
Sidewalk Operating Speed
Percentage of roads where pedestrians are present and traffic flows at 40kmh (25mph) or more have formal footpaths or sidewalks
15
To be set by jurisdictions
iRAP Coding Manual
Pedestrian crossing ndash inspected road Operating Speed
Percentage of roads where pedestrians cross and traffic flows at 40kmh (25mph) or more have pedestrian crossing facilities
8
iRAP Coding Manual
Pedestrian crossing quality Operating Speed
Percentage of pedestrian crossings that are adequately signed or maintained
88
iRAP Coding Manual
Facilities for motorised two wheelers Operating Speed
Percentage of roads where motorcyclists are present and traffic flows at 60kmh (40mph) or more have dedicated motorcycle facilities
1
iRAP Coding Manual
Bicycle facility Operating Speed
Percentage of roads where bicyclists are present and traffic flows at 40kmh (25mph) or more have dedicated bicycle facilities
9
iRAP Coding Manual
Median Type Operating Speed
Percentage of roads where traffic flows at 80kmh (50mph) or more have divided carriageways
19
iRAP Coding Manual
Roadside severity (object amp distance) Operating Speed
Percentage of roads where traffic flows at 80kmh (50mph) or more have low-risk roadsides
21
iRAP Coding Manual
Curvature Operating Speed
Percentage of roads where traffic flows at 80kmh (50mph) or more do not have sharp curves
97
iRAP Coding Manual
Intersection Type Operating Speed
Percentage of intersections where traffic flows at 60kmh (40mph) or more have turning provision
27
iRAP Coding Manual
Intersection Type Operating Speed
Percentage of railway crossings where traffic flows at 60kmh (40mph) or more have active protection
47
iRAP Coding Manual
Number of lanes Operating Speed
Percentage of roads where traffic flows at 80kmh (50mph) or more have dedicated overtaking provision
35
Star Rating for Schools
Pedestrian Star Rating
Percentage of school star rating data points that are 3-star or better for children
potential to present by of travel where volume data is available and reliable
wwwiraporg
GLOBAL ROAD INFRASTRUCTURE KEY PERFORMANCE INDICATORS
ndash NEW AND UPGRADED ROADS
Infrastructure and Speed Management for New and Upgraded Roads (Global Road Safety Performance Target 3)
iRAP Global
Standard
Protocol Attribute
Primary KPI (Refer httpswwwvaccinesforroadsorg for sample of
global and national performance)
Current Global
Performance 2030 Target
Extended Metrics (with primary performance measure in bold)
Star Rating
Pedestrian Star Rating
Percentage of travel on new or upgraded roads that are 3-star or better roads for pedestrians
100
of length and of travel in each category (5-star 4-star 3-star 2-star 1-star)
Star Rating
Bicyclist Star Rating
Percentage of travel on new or upgraded roads that are 3-star or better roads for cyclists
100 of length and of travel in each category (5-star 4-star 3-star 2-star 1-star)
Star Rating
Motorcyclist Star Rating
Percentage of travel on new or upgraded roads that are 3-star or better roads for motorcyclists
100 of length and of travel in each category (5-star 4-star 3-star 2-star 1-star)
Star Rating
Vehicle Occupant Star Rating
Percentage of travel on new or upgraded roads that are 3-star or better roads for vehicle occupants
100 of length and of travel in each category (5-star 4-star 3-star 2-star 1-star)
Regular measurement of existing road networks (eg every 5 years as legislated in Europe) will provide an opportunity to measure progress World Bank
GRSF is currently undertaking a worldwide project measuring progress The recently launched Star Rating for Designs tool supports performance tracking
wwwiraporg
Risk Mapping Examples
EuroRAP UK Risk Mapping
KiwiRAP Risk Mapping
Star Rating and iRAP Attribute Data Examples
vaccinesforroadsorghow-safe-are-the-worlds-roads
wwwiraporg
Australian Infrastructure Safety KPI Data Snapshot
In general many of our roads do not provide a safe workplace for Australians who
use the roads each and every day As an example (noting that the source data is a
sample only of AusRAP data collected up to 2018) the Australian Star Rating and KPI
attribute data performance is provided below
bull 73 of the high-speed roads assessed have dangerous roadsides - typically 30 of
deaths in Australia come from run-off road crashes
bull 91 of the high-speed roads assessed are undivided - typically 20 of deaths in Australia
are head-on crashes
bull 62 of intersection have no safe turning provision - typically 20 of fatal crashes happen
at intersections
bull 15 of roads have no footpaths and 76 of the road length provides no facility for a
pedestrian to cross the road safely - typically 10 of fatalities are pedestrians
bull 91 of roads assessed where bicycles are present have no dedicated bicycle facilities -
the June data published by BITRE highlights an 83 increase in bicycle fatalities this year
wwwiraporg
Global Road Safety Performance Targets
In terms of all safe system activities the performance targets should at a very
minimum allow Australia to systematically report against the Global Road Safety
Performance Targets agreed by Member States at the global level ndash including
Australia ndash and the WHO Global Status Report on Road Safety
See httpswwwwhointroadsafetypublicationsen for further details
wwwiraporg
TOR g recommendations for Office of Road Safety role
The Office of Road Safety role must be elevated within the Department Without the
authority to convene and support a potential Standing Committee for Road Safety
the desired impact of national leadership and governance will not be achieved
A number of key initiatives have been enacted by the Federal Government already in
relation to the Inquiry Recommendations In many cases the scale of the individual
elements are not yet at the level envisioned as part of the Inquiry Recommendations
While the Inquiry authors did not specifically prescribe where and how budgets
should be allocated for the $3 billion Road Safety Fund seeing this an important
function of the new national leadership team high-level work was done to consider
where funding should be allocated and is provided below for information
How to mobilise the $3bn Road Safety Fund
Pillar Per annum budget Areas of investment
Road Safety Management
$ 500 million ORS ($50m) National Road Safety Observatory ($50m) Trauma Registry ($50m) Baseline Data and KPI measurement and incentives ($50m) RampD Innovation ($150m) and Enablers Capacity Development Fund ($150m)
Safer Roads $ 2 billion AusRAP hub National Highways Safety enhancement ($1 billion on top of existing commitments) Local Government Safer Roads Fund to raise roads to 3-star or better ($1 billion)
Safer Vehicles $ 300 million ANCAP Vehicle Regulations ($100 million) ADVI coordinated trials and new technologies ($100 million) Accelerated deployments incentives ($100 million)
Safer Road Users
$ 50 million Funds to support road user behaviour technology trials speed management on National Highway research and sharing between jurisdictions ($50 million)
Safer Speeds $ 50 million Incentive funding for State-based acceleration of safe system speed management initiatives across all roads
Post Crash Care
$ 100 million Trauma Centre TAC T4NSW data extension Australia wide NDIS links Insurance reform ($100 million)
wwwiraporg
As highlighted in the previous sections on the strategy development the Office of
Road Safety role should include
bull Accountability for the national road safety strategy and the setting of
ambitious targets
bull Accountability for the management of the $3 billion a year funding and the
associated governance and performance of outcomes supported with that
funding
bull Setting and monitoring national KPIs and ensuring accountability for the
achievement of those KPI targets across all jurisdictions and annual reporting
on progress
bull Accountability for vehicle safety ndash of all vehicle types
bull Establishing funding criteria with star rating and safety performance outcomes
for the infrastructure funding support for States Territories and Local
Government
bull Accountability for convening the multi-stakeholder forums within the Federal
Government including Transport Health Education and DFAT portfolios
bull Coordinating international engagement and support for our neighbours in the
Pacific and Asian regions who can benefit from Australian road safety
expertise aid and trade opportunities
wwwiraporg
TOR h other measures with a focus on the Inquiry Recommendations
iRAP is already actively supporting the Global Infrastructure Hub and also DFAT with
positive economic aid and trade related activities including but not limited to
bull The G20 Quality Infrastructure guidance
bull The Australia-India Infrastructure Council
bull Road infrastructure safety in Vietnam
bull AusRAP and IndiaRAP twinning partnerships
This could be actively expanded with PacificRAP and AusRAP partnerships to deliver
3-star and better roads across the Pacific Integrating the IndonesiaRAP development
in Indonesia with the KIAT activities and the IndiaRAP and AusRAP twinning
expansion for industry level cooperation and partnerships
The Australia Government should recommitcommit to important global initiatives
including the World Bank Road Safety Facility and the UN Road Safety Fund
The Australian Government should also ensure as a shareholder of the multi-lateral
development banks that their investment is in line with the Global Road Safety
Performance Targets
Long term results-based financing partnerships with low and middle-income
countries to bring their roads to 75 of travel at the 3-star or better global standard
will be a win for health for transport for poverty alleviation and government to
government relationships Both aid and trade outcomes can be significant if
managed with the focus on win-win outcomes for all
The recommended actions from the Inquiry Recommendations are reproduced here
for information
raquo Establish an international road safety consultative committee that draws on the expertise of numerous Australian and international road safety specialists The committee would inform DFAT of road safety priorities and strategies
raquo Continue to support the United Nations Decade of Action for Road Safety and the Sustainable Development Goals with particular focus on the Indo-Pacific
raquo Ensure all development projects using Australian finance and capital include minimum standards and outcomes that support the UN Global Road Safety Targets Importantly these must not increase death and injury on affected roads
raquo Provide seed funding for targeted international road safety collaboration research and demonstration programs and partnerships These include the Global Road Safety Facility Global Network for Road Safety Legislators iRAP GNCAP and the UN Road Safety Fund
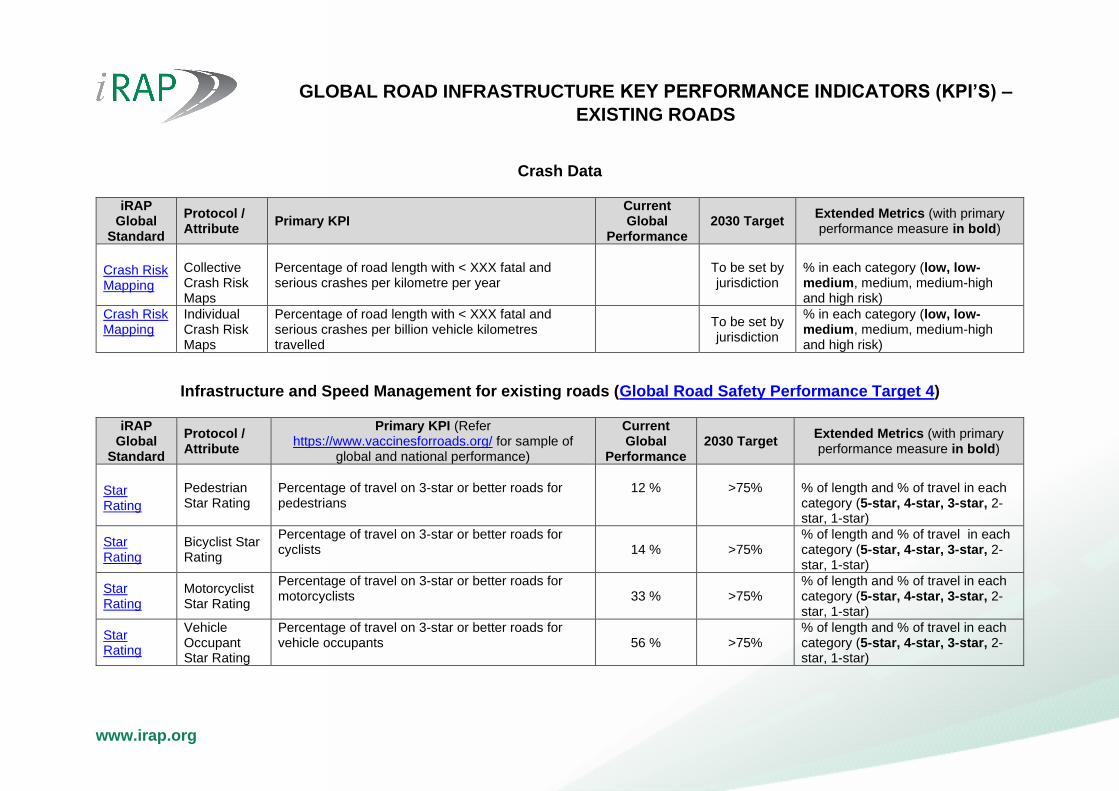
wwwiraporg
GLOBAL ROAD INFRASTRUCTURE KEY PERFORMANCE INDICATORS
ndash NEW AND UPGRADED ROADS
Infrastructure and Speed Management for New and Upgraded Roads (Global Road Safety Performance Target 3)
iRAP Global
Standard
Protocol Attribute
Primary KPI (Refer httpswwwvaccinesforroadsorg for sample of
global and national performance)
Current Global
Performance 2030 Target
Extended Metrics (with primary performance measure in bold)
Star Rating
Pedestrian Star Rating
Percentage of travel on new or upgraded roads that are 3-star or better roads for pedestrians
100
of length and of travel in each category (5-star 4-star 3-star 2-star 1-star)
Star Rating
Bicyclist Star Rating
Percentage of travel on new or upgraded roads that are 3-star or better roads for cyclists
100 of length and of travel in each category (5-star 4-star 3-star 2-star 1-star)
Star Rating
Motorcyclist Star Rating
Percentage of travel on new or upgraded roads that are 3-star or better roads for motorcyclists
100 of length and of travel in each category (5-star 4-star 3-star 2-star 1-star)
Star Rating
Vehicle Occupant Star Rating
Percentage of travel on new or upgraded roads that are 3-star or better roads for vehicle occupants
100 of length and of travel in each category (5-star 4-star 3-star 2-star 1-star)
Regular measurement of existing road networks (eg every 5 years as legislated in Europe) will provide an opportunity to measure progress World Bank
GRSF is currently undertaking a worldwide project measuring progress The recently launched Star Rating for Designs tool supports performance tracking
wwwiraporg
Risk Mapping Examples
EuroRAP UK Risk Mapping
KiwiRAP Risk Mapping
Star Rating and iRAP Attribute Data Examples
vaccinesforroadsorghow-safe-are-the-worlds-roads
wwwiraporg
Australian Infrastructure Safety KPI Data Snapshot
In general many of our roads do not provide a safe workplace for Australians who
use the roads each and every day As an example (noting that the source data is a
sample only of AusRAP data collected up to 2018) the Australian Star Rating and KPI
attribute data performance is provided below
bull 73 of the high-speed roads assessed have dangerous roadsides - typically 30 of
deaths in Australia come from run-off road crashes
bull 91 of the high-speed roads assessed are undivided - typically 20 of deaths in Australia
are head-on crashes
bull 62 of intersection have no safe turning provision - typically 20 of fatal crashes happen
at intersections
bull 15 of roads have no footpaths and 76 of the road length provides no facility for a
pedestrian to cross the road safely - typically 10 of fatalities are pedestrians
bull 91 of roads assessed where bicycles are present have no dedicated bicycle facilities -
the June data published by BITRE highlights an 83 increase in bicycle fatalities this year
wwwiraporg
Global Road Safety Performance Targets
In terms of all safe system activities the performance targets should at a very
minimum allow Australia to systematically report against the Global Road Safety
Performance Targets agreed by Member States at the global level ndash including
Australia ndash and the WHO Global Status Report on Road Safety
See httpswwwwhointroadsafetypublicationsen for further details
wwwiraporg
TOR g recommendations for Office of Road Safety role
The Office of Road Safety role must be elevated within the Department Without the
authority to convene and support a potential Standing Committee for Road Safety
the desired impact of national leadership and governance will not be achieved
A number of key initiatives have been enacted by the Federal Government already in
relation to the Inquiry Recommendations In many cases the scale of the individual
elements are not yet at the level envisioned as part of the Inquiry Recommendations
While the Inquiry authors did not specifically prescribe where and how budgets
should be allocated for the $3 billion Road Safety Fund seeing this an important
function of the new national leadership team high-level work was done to consider
where funding should be allocated and is provided below for information
How to mobilise the $3bn Road Safety Fund
Pillar Per annum budget Areas of investment
Road Safety Management
$ 500 million ORS ($50m) National Road Safety Observatory ($50m) Trauma Registry ($50m) Baseline Data and KPI measurement and incentives ($50m) RampD Innovation ($150m) and Enablers Capacity Development Fund ($150m)
Safer Roads $ 2 billion AusRAP hub National Highways Safety enhancement ($1 billion on top of existing commitments) Local Government Safer Roads Fund to raise roads to 3-star or better ($1 billion)
Safer Vehicles $ 300 million ANCAP Vehicle Regulations ($100 million) ADVI coordinated trials and new technologies ($100 million) Accelerated deployments incentives ($100 million)
Safer Road Users
$ 50 million Funds to support road user behaviour technology trials speed management on National Highway research and sharing between jurisdictions ($50 million)
Safer Speeds $ 50 million Incentive funding for State-based acceleration of safe system speed management initiatives across all roads
Post Crash Care
$ 100 million Trauma Centre TAC T4NSW data extension Australia wide NDIS links Insurance reform ($100 million)
wwwiraporg
As highlighted in the previous sections on the strategy development the Office of
Road Safety role should include
bull Accountability for the national road safety strategy and the setting of
ambitious targets
bull Accountability for the management of the $3 billion a year funding and the
associated governance and performance of outcomes supported with that
funding
bull Setting and monitoring national KPIs and ensuring accountability for the
achievement of those KPI targets across all jurisdictions and annual reporting
on progress
bull Accountability for vehicle safety ndash of all vehicle types
bull Establishing funding criteria with star rating and safety performance outcomes
for the infrastructure funding support for States Territories and Local
Government
bull Accountability for convening the multi-stakeholder forums within the Federal
Government including Transport Health Education and DFAT portfolios
bull Coordinating international engagement and support for our neighbours in the
Pacific and Asian regions who can benefit from Australian road safety
expertise aid and trade opportunities
wwwiraporg
TOR h other measures with a focus on the Inquiry Recommendations
iRAP is already actively supporting the Global Infrastructure Hub and also DFAT with
positive economic aid and trade related activities including but not limited to
bull The G20 Quality Infrastructure guidance
bull The Australia-India Infrastructure Council
bull Road infrastructure safety in Vietnam
bull AusRAP and IndiaRAP twinning partnerships
This could be actively expanded with PacificRAP and AusRAP partnerships to deliver
3-star and better roads across the Pacific Integrating the IndonesiaRAP development
in Indonesia with the KIAT activities and the IndiaRAP and AusRAP twinning
expansion for industry level cooperation and partnerships
The Australia Government should recommitcommit to important global initiatives
including the World Bank Road Safety Facility and the UN Road Safety Fund
The Australian Government should also ensure as a shareholder of the multi-lateral
development banks that their investment is in line with the Global Road Safety
Performance Targets
Long term results-based financing partnerships with low and middle-income
countries to bring their roads to 75 of travel at the 3-star or better global standard
will be a win for health for transport for poverty alleviation and government to
government relationships Both aid and trade outcomes can be significant if
managed with the focus on win-win outcomes for all
The recommended actions from the Inquiry Recommendations are reproduced here
for information
raquo Establish an international road safety consultative committee that draws on the expertise of numerous Australian and international road safety specialists The committee would inform DFAT of road safety priorities and strategies
raquo Continue to support the United Nations Decade of Action for Road Safety and the Sustainable Development Goals with particular focus on the Indo-Pacific
raquo Ensure all development projects using Australian finance and capital include minimum standards and outcomes that support the UN Global Road Safety Targets Importantly these must not increase death and injury on affected roads
raquo Provide seed funding for targeted international road safety collaboration research and demonstration programs and partnerships These include the Global Road Safety Facility Global Network for Road Safety Legislators iRAP GNCAP and the UN Road Safety Fund
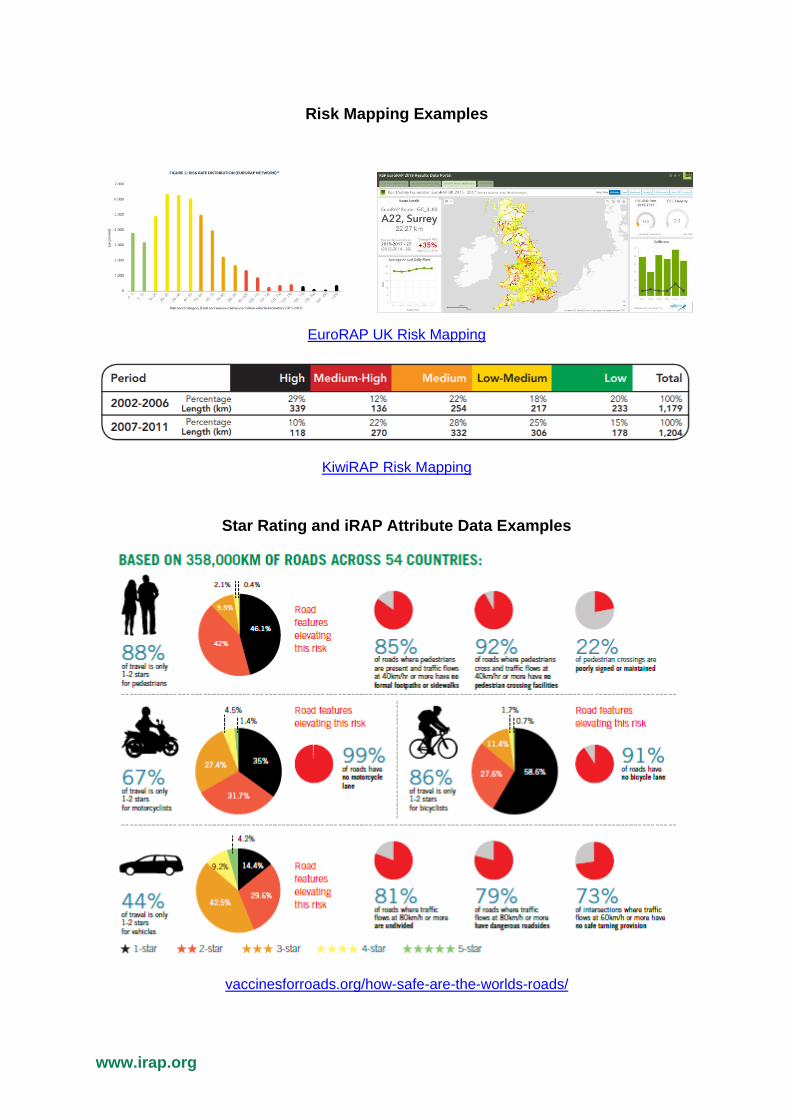
wwwiraporg
TOR h other measures with a focus on the Inquiry Recommendations
iRAP is already actively supporting the Global Infrastructure Hub and also DFAT with
positive economic aid and trade related activities including but not limited to
bull The G20 Quality Infrastructure guidance
bull The Australia-India Infrastructure Council
bull Road infrastructure safety in Vietnam
bull AusRAP and IndiaRAP twinning partnerships
This could be actively expanded with PacificRAP and AusRAP partnerships to deliver
3-star and better roads across the Pacific Integrating the IndonesiaRAP development
in Indonesia with the KIAT activities and the IndiaRAP and AusRAP twinning
expansion for industry level cooperation and partnerships
The Australia Government should recommitcommit to important global initiatives
including the World Bank Road Safety Facility and the UN Road Safety Fund
The Australian Government should also ensure as a shareholder of the multi-lateral
development banks that their investment is in line with the Global Road Safety
Performance Targets
Long term results-based financing partnerships with low and middle-income
countries to bring their roads to 75 of travel at the 3-star or better global standard
will be a win for health for transport for poverty alleviation and government to
government relationships Both aid and trade outcomes can be significant if
managed with the focus on win-win outcomes for all
The recommended actions from the Inquiry Recommendations are reproduced here
for information
raquo Establish an international road safety consultative committee that draws on the expertise of numerous Australian and international road safety specialists The committee would inform DFAT of road safety priorities and strategies
raquo Continue to support the United Nations Decade of Action for Road Safety and the Sustainable Development Goals with particular focus on the Indo-Pacific
raquo Ensure all development projects using Australian finance and capital include minimum standards and outcomes that support the UN Global Road Safety Targets Importantly these must not increase death and injury on affected roads
raquo Provide seed funding for targeted international road safety collaboration research and demonstration programs and partnerships These include the Global Road Safety Facility Global Network for Road Safety Legislators iRAP GNCAP and the UN Road Safety Fund