the commercial p/c insurance industry: overview & outlook 19 th annual nyssa insurance...
TRANSCRIPT

The Commercial P/C Insurance Industry: Overview & Outlook
19th Annual NYSSA Insurance ConferenceNew York, NY
March 17, 2015
Steven N. Weisbart, Ph.D., CLU, Senior Vice President & Chief EconomistInsurance Information Institute 110 William Street New York, NY 10038
Tel: 212.346.5540 Cell: 917.494.5945 [email protected] www.iii.org

2
Insurance Industry:Financial Update & Outlook
2014 Was a Reasonably Good Year2013 Was the Industry’s Best Year
in the Post-Crisis Era
2

P/C Industry Net Income After Taxes1991–2014E 2005 ROE*= 9.6% 2006 ROE = 12.7% 2007 ROE = 10.9% 2008 ROE = 0.1% 2009 ROE = 5.0% 2010 ROE = 6.6% 2011 ROAS1 = 3.5% 2012 ROAS1 = 5.9% 2013 ROAS1 = 10.3% 2014 ROAS1 = 7.6%
• ROE figures are GAAP; 1Return on avg. surplus. Excluding Mortgage & Financial Guaranty insurers yields a 7.7% ROAS through 2014:Q2, 9.8% ROAS in 2013, 6.2% ROAS in 2012, 4.7% ROAS for 2011, 7.6% for 2010 and 7.4% for 2009.
Sources: A.M. Best, ISO; Insurance Information Institute
$1
4,1
78
$5
,84
0
$1
9,3
16
$1
0,8
70
$2
0,5
98
$2
4,4
04 $3
6,8
19
$3
0,7
73
$2
1,8
65
$3
,04
6
$3
0,0
29
$6
2,4
96
$3
,04
3
$3
5,2
04
$1
9,4
56 $
33
,52
2
$6
3,7
84
$5
0,2
03
$3
8,5
01
$2
0,5
59
$4
4,1
55
$6
5,7
77
-$6,970
$2
8,6
72
-$10,000
$0
$10,000
$20,000
$30,000
$40,000
$50,000
$60,000
$70,000
$80,000
91 92 93 94 95 96 97 98 99 00 01 02 03 04 05 06 07 08 09 10 11 12 13
14E
Net income rose strongly (+81.9%) in 2013 vs. 2012 on lower cats, capital gains
$ Millions

-5%
0%
5%
10%
15%
20%
25%
50 52 54 56 58 60 62 64 66 68 70 72 74 76 78 80 82 84 86 88 90 92 94 96 98 00 02 04 06 08 10 12
14E
*Profitability = P/C insurer ROEs. 2011-14 figures are estimates based on ROAS data. Note: Data for 2008-2014 exclude mortgage and financial guaranty insurers. 2014 figure is through Q3.Source: Insurance Information Institute; NAIC, ISO, A.M. Best.
ROE
Back to ‘60s? P/C InsuranceIndustry Profitability, 1950 – 2014*
1950-70: ROEs were low due to low
interest rates, low inflation, and “Bureau” rate
regulation.
1970-90: Peak ROEs were much higher but troughs were
comparable. High interest rates, rapid inflation,
economic volatility all played roles.
1990-2010s: Excluding mega-CATs, this period
resembles the 1950-1970 period

A 100 Combined Ratio Isn’t What ItOnce Was: Investment Impact on ROEs
Combined Ratio / ROE
* 2008 -2014 figures are return on average surplus and exclude mortgage and financial guaranty insurers. 2014:9M combined ratio including M&FG insurers is 97.7; 2013 = 96.1; 2012 =103.2, 2011 = 108.1, ROAS = 3.5%. Source: Insurance Information Institute from A.M. Best and ISO Verisk Analytics data.
97.5
100.6 100.1 100.8
92.7
101.299.5
101.0
96.797.9
102.4
106.5
95.7
14.3%
15.9%
12.7%
10.9%
7.4% 7.9%
4.7%6.2%
7.4%
9.6%8.8%
4.3%
9.8%
80
85
90
95
100
105
110
1978 1979 2003 2005 2006 2007 2008 2009 2010 2011 2012 2013 2014:Q30%
3%
6%
9%
12%
15%
18%
Combined Ratio ROE*
Combined Ratios Must Be Lower in Today’s DepressedInvestment Environment to Generate Risk Appropriate ROEs
A combined ratio of about 100 generates an ROE of ~7.0% in 2012/13, ~7.5% ROE in 2009/10,
10% in 2005 and 16% in 1979
Lower CATs helped ROEs
in 2013

8
RNW All Lines by State, 2004-2013 Average:Highest 25 States
20
.5
18
.4
14
.6
14
.3
13
.4
13
.3
12
.3
12
.1
12
.0
12
.0
11
.7
11
.4
11
.1
11
.1
10
.9
10
.8
10
.7
10
.7
10
.5
10
.5
10
.3
9.9
9.8
9.8
9.6
9.5
02468
1012141618202224
HI AK VT ME WY ND VA ID NH UT WA SC MA NC OH DC CA OR RI WV CT IA NE SD MT MD
The most profitable states over the past decade are
widely distributed geographically, though none
are in the Gulf region
Source: NAIC; Insurance Information Institute.
Profitability Benchmark: All P/C
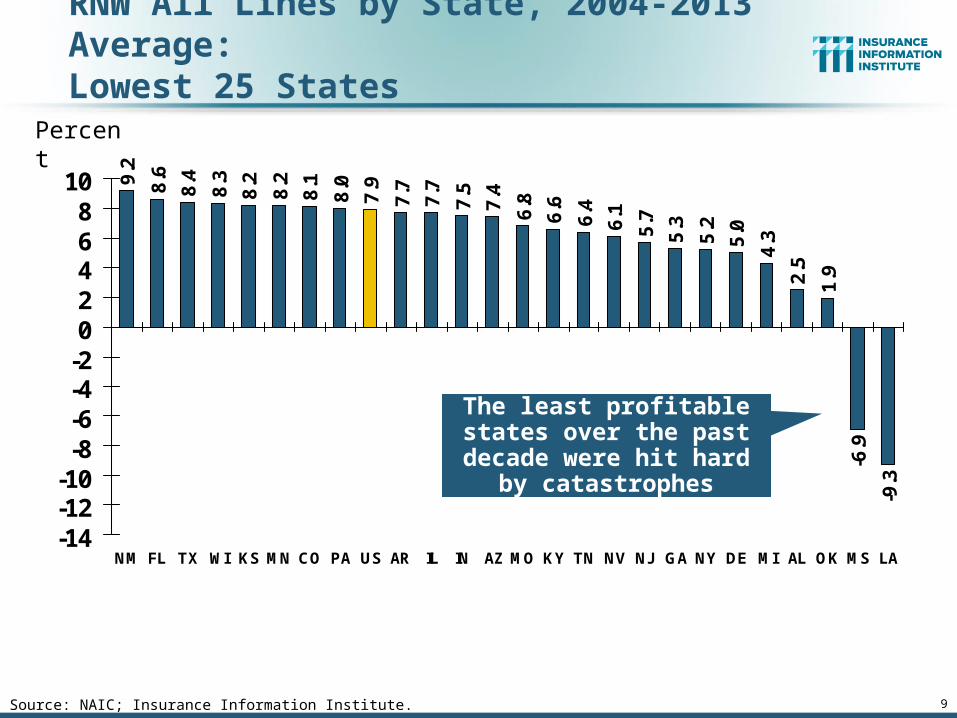
US: 7.9%
Percent
9
9.2
8.6
8.4
8.3
8.2
8.2
8.1
8.0
7.9
7.7
7.7
7.5
7.4
6.8
6.6
6.4
6.1
5.7
5.3
5.2
5.0
4.3
2.5
1.9
-6.9
-9.3
-14-12-10-8-6-4-202468
10
NM FL TX WI KS MN CO PA US AR IL IN AZ MO KY TN NV NJ GA NY DE MI AL OK MS LA
RNW All Lines by State, 2004-2013 Average: Lowest 25 States
Source: NAIC; Insurance Information Institute.
The least profitable states over the past decade were hit hard by catastrophes
Percent

10
U.S. Insured Catastrophe Loss Update
2013/14 Had Below-Average CAT Activity Following Very High CAT Losses in
2011/12
10

11
$1
2.8
$1
1.1
$3
.8
$1
4.5
$1
1.7
$6
.2
$3
5.2
$7
.7
$1
6.5
$3
4.2
$7
4.5
$1
0.7
$7
.6
$2
9.6
$1
1.6
$1
4.6
$3
4.1
$3
5.5
$1
2.9
$1
5.3
$1
4.2
$4
.9 $8
.1
$3
8.3
$8
.9
$2
6.8
$0
$10
$20
$30
$40
$50
$60
$70
$80
89 90 91 92 93 94 95 96 97 98 99 00 01 02 03 04 05 06 07 08 09 10 11 12 13 14E
U.S. Insured Catastrophe Losses
*Through 12/31/14.Note: 2001 figure includes $20.3B for 9/11 losses reported through 12/31/01 ($25.9B 2011 dollars). Includes only business and personal property claims, business interruption and auto claims. Non-prop/BI losses = $12.2B ($15.6B in 2011 dollars.) Sources: Property Claims Service/ISO; Insurance Information Institute.
2013 Was a Welcome Respite from 2012, the 3rd Costliest Year for Insured Disaster Losses in US
History. Longer-term Trend is for more—not fewer—Costly Events
2012 was the 3rd most expensive year ever for
insured CAT losses
$15.3 billion in insured CAT
losses estimated for 2014
($ Billions, $ 2013)
11
12
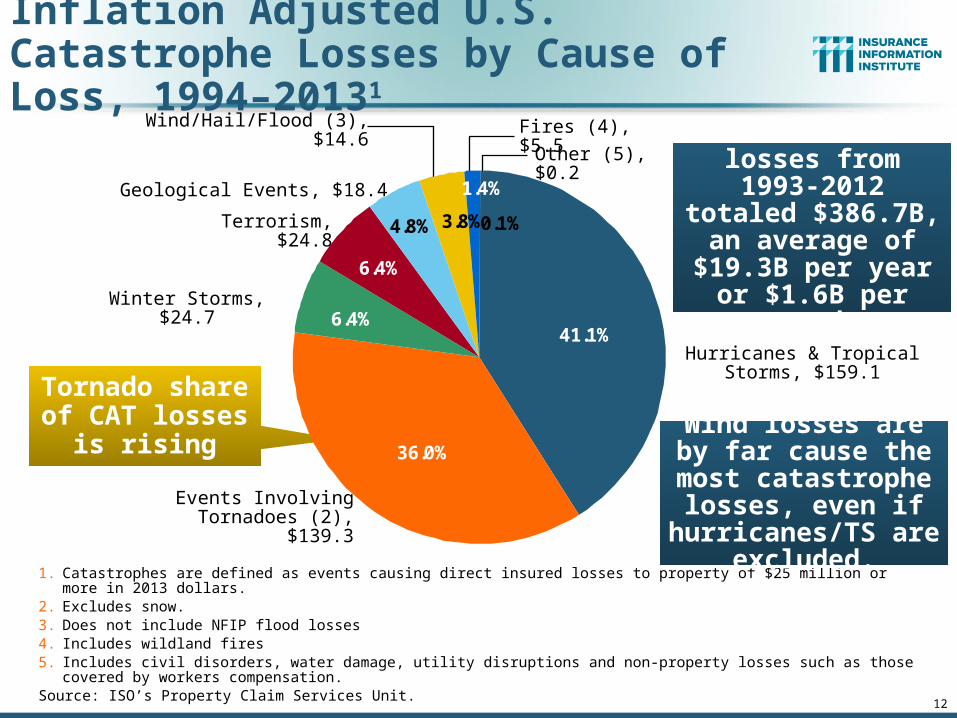
Inflation Adjusted U.S. Catastrophe Losses by Cause of Loss, 1994–20131
0.1%
1.4%
3.8%4.8%
6.4%
6.4%
36.0%
41.1%
1. Catastrophes are defined as events causing direct insured losses to property of $25 million or more in 2013 dollars.2. Excludes snow.3. Does not include NFIP flood losses4. Includes wildland fires5. Includes civil disorders, water damage, utility disruptions and non-property losses such as those covered by workers compensation.Source: ISO’s Property Claim Services Unit.
Hurricanes & Tropical Storms, $159.1
Fires (4), $5.5
Events Involving Tornadoes (2), $139.3
Winter Storms, $24.7
Terrorism, $24.8
Geological Events, $18.4
Wind/Hail/Flood (3), $14.6
Other (5), $0.2
Wind losses are by far cause the most catastrophe losses,
even if hurricanes/TS are excluded.
Tornado share of CAT losses is
rising
Insured cat losses from 1993-2012
totaled $386.7B, an average of $19.3B per year or $1.6B
per month

13
Top 16 Most Costly Disastersin U.S. History
(Insured Losses, 2013 Dollars, $ Billions)
$7.9 $8.8 $9.3 $11.2$13.6
$19.0$24.2 $24.9$25.9
$49.4
$7.6$7.2$6.8$5.7$5.6$4.5
$0
$10
$20
$30
$40
$50
$60
Irene (2011) Jeanne(2004)
Frances(2004)
Rita (2005)
Tornadoes/T-Storms
(2011)
Tornadoes/T-Storms
(2011)
Hugo (1989)
Ivan (2004)
Charley(2004)
Wilma(2005)
Ike (2008)
Sandy*(2012)
Northridge(1994)
9/11 Attack(2001)
Andrew(1992)
Katrina(2005)
Superstorm Sandy in 2012 was the last
mega-CAT to hit the US
Includes Tuscaloosa, AL,
tornado
Includes Joplin, MO, tornado
12 of the 16 Most Expensive Events in US History Have
Occurred Over the Past Decade
Sources: PCS; Insurance Information Institute inflation adjustments to 2013 dollars using the CPI.

CYBER RISK:A Rapidly Emerging Exposurefor Businesses Large and Small
in Every Industry
14
Rapidly Increasing Interest from Businesses, Media, & Public Policymakers
14

Data Breaches 2005-2014, by Number of Breaches and Records Exposed# Data Breaches/Millions of Records Exposed
* 2014 figures as of Jan. 12, 2014 from the ITRC.Source: Identity Theft Resource Center.
157
321
446
656
498
419447
619
783
662
85.687.9
17.322.9
35.7
19.1
66.9
222.5
16.2
127.7
100
200
300
400
500
600
700
800
2005 2006 2007 2008 2009 2010 2011 2012 2013 20140
20
40
60
80
100
120
140
160
180
200
220
# Data Breaches # Records Exposed (Millions)
The Total Number of Data Breaches Rose 28% While the Number of Records Exposed Was Relatively Flat (-2.6%)
Millions
15

Worldwide Cybersecurity Spending, 2011- 2016F ($ Billions)
$55.0
$60.0
$65.9
$71.1
$76.9
$83.2
7.9%8.4%8.2%
8.2%9.8%
$50
$55
$60
$65
$70
$75
$80
$85
2011 2012 2013 2014F 2015F 2016F0%
2%
4%
6%
8%
10%
12%
Worldwide Cybersecurity Spending % Change from Previous Year
Cybersecurity Spending Is Rising Sharply, Up by About 8%+ Annually through 2016—a Projected Increase of $12.1 Billion from 2014 to 2016
Cybersecurity spending increased by an estimated $5.2B in 2014, $5.8B
in 2015 and $6.3B in 2016
Source: Gartner Group; Insurance Information Institute; Adapted from Wall Street Journal: “Financial Firms Boost Cybersecurity Funds,” Nov. 17, 2014.
16

Data/Privacy Breach:Many Potential Costs Can Be Insured
Source: Zurich Insurance; Insurance Information Institute
Forensic costs to discover
cause
17

Source: Insurance Information Institute research.
The Three Basic Elements of Cyber Coverage: Prevention, Transfer, Response
Loss Prevention
Post-Breach Response(Insurable)
Loss Transfer (Insurance)
Cyber risk management today involves three essential components, each designed
to reduce, mitigate or avoid loss. An increasing number of cyber risk products
offered by insurers today provide all three.
18
19
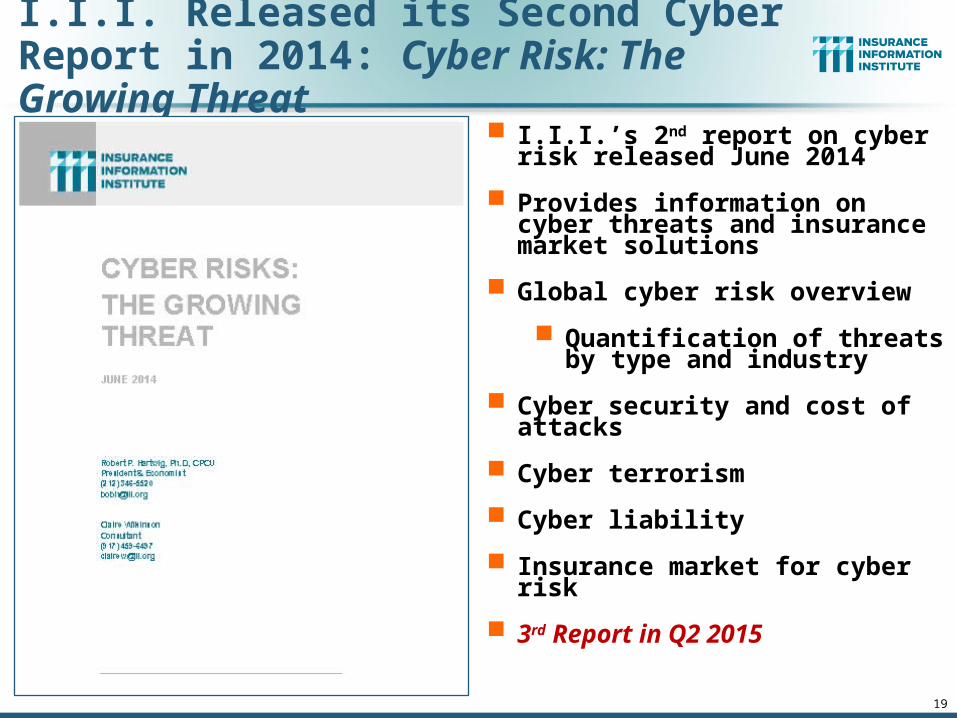
I.I.I. Released its Second Cyber Report in 2014: Cyber Risk: The Growing Threat
I.I.I.’s 2nd report on cyber risk released June 2014
Provides information on cyber threats and insurance market solutions
Global cyber risk overview
Quantification of threats by type and industry
Cyber security and cost of attacks
Cyber terrorism
Cyber liability
Insurance market for cyber risk
3rd Report in Q2 2015

INVESTMENTS:A Key Driver of Profitability
20
Depressed Yields Will Continueto Affect Underwriting & Pricing
20

Distribution of Invested Assets:P/C Insurance Industry, 2013
Stocks, 22%
Bonds, 62%All Other, 10%
Cash, Cash Equiv. & ST Investments, 6%
Source: Insurance Information Institute Fact Book 2015, A.M. Best.
Total Invested Assets = $1.5
Trillion
$ Billions

22
Distribution of Bond Maturities,P/C Insurance Industry, 2004-2013
2004
2005
2006
2007
2008
2009
2010
2011
2012
2013
0% 20% 40% 60% 80% 100%
15.4%
16.0%
16.0%
15.2%
15.7%
16.2%
16.3%
15.2%
16.5%
15.6%
29.2%
28.8%
29.5%
30.0%
32.4%
36.2%
39.5%
41.4%
40.4%
36.4%
32.5%
34.1%
34.1%
33.8%
31.2%
28.7%
26.7%
26.8%
27.6%
29.0%
15.4%
13.6%
13.1%
12.9%
12.7%
11.7%
11.1%
10.3%
9.8%
11.9%
7.6%
7.6%
7.4%
8.1%
8.1%
7.3%
6.4%
6.3%
5.7%
7.1%
Under 1 year
1-5 years
5-10 years
10-20 years
over 20 years
Sources: SNL Financial; Insurance Information Institute.
The main shift over these years has been from longer maturities to shorter maturities, but the 2013 data suggest a shift back has begun.
The 2013 distribution resembles that at year-end 2009.

Property/Casualty Insurance Industry Investment Income: 2000–20141
$38.9$37.1 $36.7
$38.7
$54.6
$51.2
$47.1 $47.6$49.2
$48.0 $47.4$45.7
$39.6
$49.5
$52.3
$30
$40
$50
$60
00 01 02 03 04 05 06 07 08 09 10 11 12 13 14*
Due to persistently low interest rates,investment income fell in 2012, 2013 and 2014.
1 Investment gains consist primarily of interest and stock dividends. *2014 figure is estimated based on annualized data through Q3.Sources: ISO; Insurance Information Institute.
($ Billions) Investment earnings are still below their 2007 pre-crisis peak

24
U.S. Treasury 2- and 10-Year Note Yields*: Monthly, 1990–2015
*Monthly, constant maturity, nominal rates, through January 2015.Sources: Federal Reserve Bank at http://www.federalreserve.gov/releases/h15/data.htm. National Bureau of Economic Research (recession dates); Insurance Information Institutes.
Ju Fe
Oc
Ju Fe
Oc
Ju Fe
Oc
Ju Fe
Oc
Ju Fe
Oc
Ju Fe
Oc
Ju Fe
Oc
Ju Ma
Oc
Ju Ma
Oc
Ju 2/
Oc
Ju Fe
Oc
Ju Fe
Oc
Ju
0%
1%
2%
3%
4%
5%
6%
7%
8%
9%
Recession2-Yr Yield10-Yr Yield
Yields on 10-Year U.S. Treasury Notes have been essentially below 5% for over a decade.
Since roughly 80% of P/C bond/cash investments are in 10-year or shorter durations, most P/C insurer portfolios will have low-yielding bonds for years to come.
U.S. Treasury 10-year note
yields “spiked”
24

Book Yield on Property/Casualty Insurance Invested Assets, 2007–2016F
4.42
4.19
3.95
3.71
3.283.20
3.13
3.74
3.523.38
3.0
3.2
3.4
3.6
3.8
4.0
4.2
4.4
4.6
07 08 09 10 11 12 13 14E 15F 16F
The yield on invested assets continues to decline as returns on maturing bonds generally still exceed new money yields. Even
short term interest rate increases are unlikely until mid-to-late 2015
Sources: Conning.
(Percent)
Book yield in 2014 is down 114 BP from pre-crisis levels

26
Interest Rate Forecasts: 2015 – 2020
1.7%
2.9%
3.4%3.4%3.4%3.2%
2.8%
1.8%
2.4%2.6%2.7%
3.5%
4.2%4.4%4.4%4.5%
0.1%0.1%0.1%0.1%0.1%0.4%
0%
1%
1%
2%
2%
3%
3%
4%
4%
5%
5%
10
11
12
13
14
15
F
16
F
17
F
18
F
19
F
20
F 10
11
12
13
14
15
F
16
F
17
F
18
F
19
F
20
F
A Full Normalization of Interest Rates Is Unlikely Until 2018, More than a Decade After the Onset of the Financial Crisis
Yield (%)
Sources: Federal Reserve Board of Governors (historical); Blue Chip Economic Indicators (1/15 for 2015 and 2016; for 2017-2020 10/14 issue); Insurance Info. Institute.
3-Month Treasury 10-Year Treasury
The Fed is expected to
begin raising short-term rates in mid-2015, but
this timeline could easily slip to late 2015 or
even 2016 The end of the Fed’s QE program in 2014 and a stronger economy are
expected to push longer-term yields higher

27
-1.8
%
-1.8
%
-2.0
%
-3.6
%
-3.3
%
-3.3
%
-3.7
%
-4.3
%
-5.2
%
-5.7
%
-7.3%
-1.9
%
-2.1
%
-3.1
%
-8%-7%-6%-5%-4%-3%-2%-1%0%
Perso
nal L
ines
Pvt Pass
Aut
o
Pers P
rop
Comm
ercia
l
Comm
l Auto
Credit
Comm
Pro
p
Comm
Cas
Fidelity
/Sure
ty
Warra
nty
Surplu
s Line
s
Med
Mal
WC
Reinsu
ranc
e**
Lower Investment Earnings Place a Greater Burden on Underwriting and Pricing Discipline
*Based on 2008 Invested Assets and Earned Premiums**US domestic reinsurance onlySource: A.M. Best; Insurance Information Institute.
Reduction in Combined Ratio Necessary to Offset 1% Decline in Investment Yield to Maintain Constant ROE, by Line*
27
28
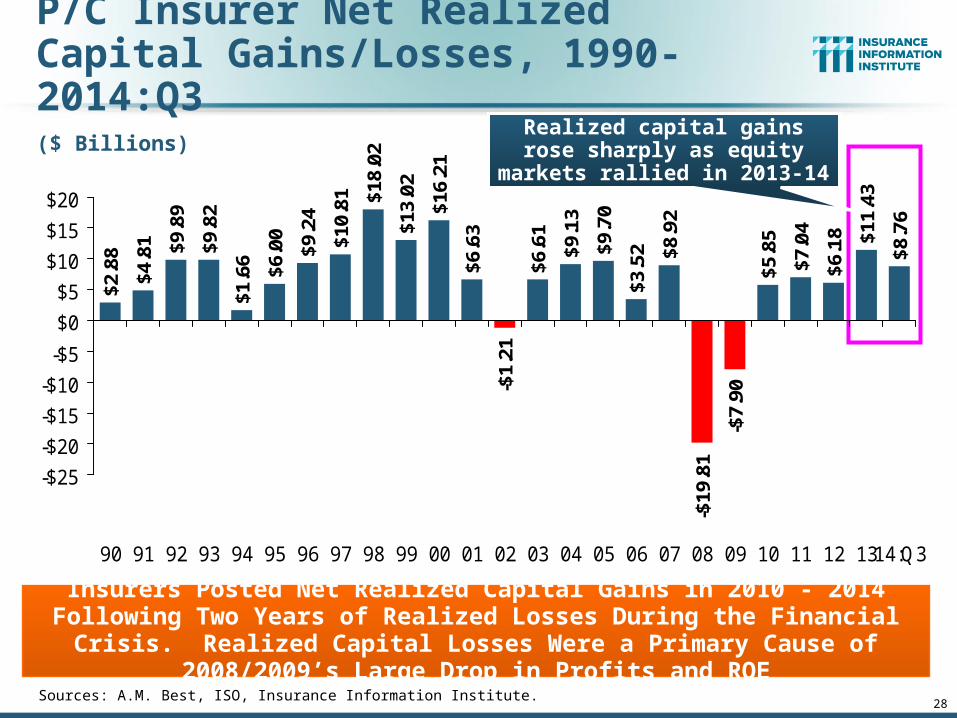
P/C Insurer Net Realized Capital Gains/Losses, 1990-2014:Q3
Sources: A.M. Best, ISO, Insurance Information Institute.
$2.8
8
$4.8
1 $9.8
9
$9.8
2
$10.
81 $18.
02
$13.
02
$16.
21
$6.6
3
-$1.
21
$6.6
1
$9.1
3
$9.7
0
$3.5
2 $8.9
2
-$7.
90
$5.8
5
$7.0
4
$6.1
8 $11.
43
$8.7
6
-$19
.81
$9.2
4
$6.0
0
$1.6
6
-$25
-$20
-$15
-$10
-$5
$0
$5
$10
$15
$20
90 91 92 93 94 95 96 97 98 99 00 01 02 03 04 05 06 07 08 09 10 11 12 1314:Q3
Insurers Posted Net Realized Capital Gains in 2010 - 2014 Following Two Years of Realized Losses During the Financial Crisis. Realized Capital
Losses Were a Primary Cause of 2008/2009’s Large Drop in Profits and ROE
($ Billions)Realized capital gains rose
sharply as equity markets rallied in 2013-14

Property/Casualty Insurance Industry Investment Gain: 1994–2014E1
$35.4
$42.8$47.2
$52.3
$44.4
$36.0
$45.3$48.9
$59.4$55.7
$64.0
$31.7
$39.2
$53.4$56.2$54.2
$58.8
$57.
4
$58.0
$51.9$56.9
$0
$10
$20
$30
$40
$50
$60
$70
94 95 96 97 98 99 00 01 02 03 04 05* 06 07 08 09 10 11 12 13 14E
Total Investment Gains Were Flat in 2014 as Low Interest Rates Pressured Investment Income but Realized Capital Gains Remained Robust
1 Investment gains consist primarily of interest, stock dividends and realized capital gains and losses.* 2005 figure includes special one-time dividend of $3.2B; Sources: ISO; Insurance Information Institute.
($ Billions)
Investment gains in 2014 will rival the post-crisis
high reached in 2013

CAPITAL/CAPACITY
30
Capital Accumulation Has Multiple Impacts
30

31
Policyholder Surplus, 2006:Q4–2014:Q3
Sources: ISO, A.M .Best.
($ Billions)$4
87.1
$496
.6
$512
.8
$521
.8
$478
.5
$455
.6
$437
.1 $463
.0 $490
.8 $511
.5 $540
.7
$530
.5
$544
.8
$559
.2
$559
.1
$538
.6
$550
.3
$567
.8
$583
.5
$586
.9 $607
.7
$614
.0
$624
.4 $653
.3
$671
.6
$673
.9
$662
.0
$570
.7
$566
.5
$505
.0
$515
.6
$517
.9
$400
$450
$500
$550
$600
$650
$700
06:Q
4
07:Q
1
07:Q
2
07:Q
3
07:Q
4
08:Q
1
08:Q
2
08:Q
3
08:Q
4
09:Q
1
09:Q
2
09:Q
3
09:Q
4
10:Q
1
10:Q
2
10:Q
3
10:Q
4
11:Q
1
11:Q
2
11:Q
3
11:Q
4
12:Q
1
12:Q
2
12:Q
3
12:Q
4
13:Q
1
13:Q
2
13:Q
3
13:Q
4
14:Q
1
14:Q
2
14:Q
3
2007:Q3Pre-Crisis Peak
Surplus as of 9/30/14 stood at a record high $673.9B
2010:Q1 data includes $22.5B of paid-in capital from a holding company parent for one insurer’s investment in a non-insurance business .
The industry now has $1 of surplus for every $0.73 of NPW,close to the strongest claims-paying status in its history.
Drop due to near-record 2011 CAT losses
The P/C insurance industry entered 2015in very strong financial condition.

$0.50
$0.75
$1.00
$1.25
$1.50
$1.75
$2.00
85 86 87 88 89 90 91 92 93 94 95 96 97 98 99 00 01 02 03 04 05 06 07 08 09 10 11 12 13 14*
Premium-to-Surplus Ratio:1985–2014*
* As of 9/30/14.Source: A.M. Best, ISO, Insurance Information Institute.
The larger surplus is in relation to premiums—the lower the P:S ratio—the greater the industry’s capacity to
handle the risk it has accepted
(Ratio of NWP to PHS)
The Premium-to-Surplus Ratio Stood at $0.75:$1 as of9/30/14, a Record Low (at Least in Recent History)
Surplus as of 9/30/14 was $0.75:$1, a near-record low (at least in modern history)
9/11, Recession & Hard Market

35
Alternative Capital
35
New Investors are Changingthe Reinsurance Landscape
The First I.I.I. White Paper on This Issue Will Be Released Q1 2015

Global Reinsurance Capital (Traditional and Alternative), 2006 - 2014
2014 data is as of June 30, 2014.Source: Aon Benfield Analytics; Insurance Information Institute.
Total reinsurance capital reached a record $570B in 2013, up 68% from
2008.
But alternative capacity has grown 210% since 2008, to $50B. It has more than doubled in the past three years.

38
I.I.I. Will Release its First Report on Alternative Capital During Q1 2015
Issue of alternative capital in (re)insurance has received increased attention in recent years
Significant structural changes in property catastrophe reinsurance space
Questions addressed include:
Sources of new capital
Reasons/Drivers of growth
New structures
Impact of major triggering event(s)
Impacts of higher interest rates
Cat bond yield compression
Forthcoming: Q1 2015

39
Questions Arising from Influence of Alternative Capital What Will Happen When Investors Face Large-Scale
Losses?
What Happens When Interest Rates Rise?
Does ILS Have a Higher Propensity to Litigate?
How Much Lower Will Risk Premiums Shrink/ROLs Fall?
Will There Be Spillover Into Casualty Reinsurance?
Will Alternative Capital Drive Consolidation?

The Strength of the Economy Will Influence P/C Insurer
Growth Opportunities
40
Growth Will Expand Insurer Exposure Base Across Most Lines
40

41
Real U.S. Quarterly GDP GrowthSince the “Great Recession
Data are quarterly changes at annualized rates. 2014:Q4 is revised estimateSources: US Department of Commerce, at http://www.bea.gov/national/index.htm#gdp ; Insurance Information Institute.
-1.5
%
2.9%
0.8%
4.6%
2.3%
1.6% 2.
5%
0.1%
1.8%
4.5%
3.5%
-2.1
%
4.6% 5.0%
2.2%2.
7%
1.3%
3.9%
1.7%
3.9%
2.7%
2.5%
-3%
-2%
-1%
0%
1%
2%
3%
4%
5%
09:3
Q
09:4
Q
10:1
Q
10:2
Q
10:3
Q
10:4
Q
11:1
Q
11:2
Q
11:3
Q
11:4
Q
12:1
Q
12:2
Q
12:3
Q
12:4
Q
13:1
Q
13:2
Q
13:3
Q
13:4
Q
14:1
Q
14:2
Q
14:3
Q
14:4
Q
Since the Great Recession ended, even 3% real growth (at an annual rate) in a quarter has been unusual. It happened only 7 times in 22 quarters,
but 4 of those 7 were in the most recent 6 quarters.

32904 34730 36556 38383 4020960
65
70
75
80
85
90
95
100
105
110
Recession
42
Index of Total Industrial Production:*A Near Peak as of December 2014
*Monthly, seasonally adjusted, through December 2014 (which is preliminary). Index based on year 2007 = 100Sources: Federal Reserve Board at http://www.federalreserve.gov/releases/g17/ipdisk/ip_sa.txt . National Bureau of Economic Research (recession dates); Insurance Information Institute.
Peak at 100.82 in December 2007 (officially the 1st
month of the Great Recession)
Insurance exposures for industrial production will continue growing in 2015, and commercial insurance premium volume with them. Y-o-Y growth to December 2014
was 4.6%. Both production and premium volume growth for 2015 should exceed this.
42
December 2014 Index at 106.5
Many economists expect business
investment to rise in 2015

NFIB Small Business Optimism Index
January 1985 through January 2015
Source: National Federation of Independent Business at http://www.advisorperspectives.com/dshort/charts/indicators/Sentiment.html?NFIB-optimism-index.gif ; Insurance Information Institute. 43

44
Business Bankruptcy Filings: Still Falling(1994:Q1 – 2014:Q3)
13.9
13.6
12.9
12.0
13.1
12.2 12
.612
.9 13.4 14
.013
.212
.9 13.8
14.0
13.5
12.7
12.4
11.6
10.3
9.9
9.2
10.4
9.0
9.0 9.
59.
28.
2 8.4
10.0
10.3
9.5 10
.09.
89.
79.
49.
58.
8 9.3
8.3
10.6
8.2
7.6 7.8 8.1 8.
7 9.5
12.8
4.1 4.
9 5.3 5.6 6.
3 6.7 7.
2 8.0 8.
79.
711
.512
.914
.316
.014
.2 15.0
14.6
14.5
14.0
13.0
12.4
12.3
11.7
11.1
11.0
10.4
9.2
9.3
8.5 8.9
8.1
7.6
7.0 7.3
6.4
8.4
0
2
4
6
8
10
12
14
16
18
94:Q
194
:Q3
95:Q
195
:Q3
96:Q
196
:Q3
97:Q
197
:Q3
98:Q
198
:Q3
99:Q
199
:Q3
00:Q
100
:Q3
01:Q
101
:Q3
02:Q
102
:Q3
03:Q
103
:Q3
04:Q
104
:Q3
05:Q
105
:Q3
06:Q
106
:Q3
07:Q
107
:Q3
08:Q
108
:Q3
09:Q
109
:Q3
10:Q
110
:Q3
11:Q
111
:Q3
12:Q
112
:Q3
13:Q
113
:Q3
14:Q
114
:Q3
Business bankruptcies in 2014 were below both the Great Recession levels and the 2003:Q3-2005:Q1 period (the best five-quarter stretch in the last 20 years).
Bankruptcies restrict exposure growth in all commercial lines.
Sources: U.S. Courts at http://www.uscourts.gov/uscourts/Statistics/BankruptcyStatistics/BankruptcyFilings/2013/0913_f2q.pdf ; Insurance Information Institute
(Thousands) New Bankruptcy Law Takes
EffectRecessions in orange
Below pre-recession
level

www.iii.org
Thank you for your timeand your attention!
Insurance Information Institute Online:
45