the combined effect of in-situ tumor and irradiation on
TRANSCRIPT

University of Tennessee Health Science Center University of Tennessee Health Science Center
UTHSC Digital Commons UTHSC Digital Commons
Theses and Dissertations (ETD) College of Graduate Health Sciences
5-2009
The Combined Effect of In-Situ Tumor and Irradiation on The Combined Effect of In-Situ Tumor and Irradiation on
Peritumoral Brain Vasculature Peritumoral Brain Vasculature
Janice Ann Zawaski University of Tennessee Health Science Center
Follow this and additional works at: https://dc.uthsc.edu/dissertations
Part of the Medical Neurobiology Commons, Neoplasms Commons, Neurosciences Commons, and
the Therapeutics Commons
Recommended Citation Recommended Citation Zawaski, Janice Ann , "The Combined Effect of In-Situ Tumor and Irradiation on Peritumoral Brain Vasculature" (2009). Theses and Dissertations (ETD). Paper 315. http://dx.doi.org/10.21007/etd.cghs.2009.0370.
This Dissertation is brought to you for free and open access by the College of Graduate Health Sciences at UTHSC Digital Commons. It has been accepted for inclusion in Theses and Dissertations (ETD) by an authorized administrator of UTHSC Digital Commons. For more information, please contact [email protected].

The Combined Effect of In-Situ Tumor and Irradiation on Peritumoral Brain The Combined Effect of In-Situ Tumor and Irradiation on Peritumoral Brain Vasculature Vasculature
Abstract Abstract In the USA, 200,000 brain tumors are diagnosed each year with glioma representing 8.4% of the 200,000. The standard treatment for glioma consists of surgical resection, when possible, followed by radiation therapy (RT) and/or chemotherapy. Radiation therapy is one of the most effective treatments of brain tumors; however, the therapeutic ratio of RT is limited by damage to the normal tissue. We hypothesize that tumor growth has an adverse effect on the peritumoral tissue through the angiogenic/inflammatory environment it creates rendering it susceptible to further damage by RT which may be prevented by using anti-angiogenic/anti-inflammatory agents. We have developed a rat C6 glioma brain tumor model to study the combination of tumor presence and radiation treatment on the peritumoral region both at early and late time points. We have also used this model to test the effect of thalidomide on limiting radiation toxicity to the normal tissue while not interfering with radiation efficacy.
Intravital microscopy was used in combination with a cranial window brain tumor model to assess the effect of glioma presence on neighboring tissue with and without RT (40Gy total, 8Gy/day starting on day 5 post-implant/surgery) and when RT was administered in combination with thalidomide (100mg/kg/day). Permeability of the blood-brain barrier (BBB) was determined by measuring the rate of extravasation of 3kDa Texas-Red dextran from the vasculature into the tissue. Leukocytes were stained using an intravenous injection of Rhodamine 6G and leukocyte interactions, an indicator of inflammation, were counted in venules ranging in size from 45 to 90μm. Staining for vascular endothelial growth factor (VEGF) and glial fibrillary acidic protein (GFAP), a marker of astrocytes, was also performed.
Our studies show that the presence of the tumor alone caused quantifiable changes in BBB permeability, and caused an increased in vascular endothelial growth factor (VEGF) protein expression in the peritumoral region. Astrogliosis, an increase in reactive astrocytes associated with inflammation, was detected in the peritumoral region and contralateral to the tumor.
RT of the implanted tumors caused a significant increase in BBB permeability and in adhered leukocytes in the peritumoral region, compared to the sham implant group. In addition following RT, VEGF increased both in the peritumoral region and in the middle of the tumor. Astrogliosis was also significantly higher in the tumor implant + RT animals compared to sham and tumor implanted animals. At 66 days post tumor-implantation the RT the BBB permeability and astrogliosis were still significantly higher compared to sham implanted animals.
We have also evaluated thalidomide as a potential anti-angiogenic/anti-inflammatory agent with the prospective to protect normal tissue and have shown that it had limited effects in a rat C6 brain tumor model and it interfered with RT tumor treatment efficacy. In addition, at 66 post tumor implant there was a significantly higher incidence of astrogliosis, BBB permeability, and adhered leukocyte counts in the animals treated with thalidomide compared to sham implanted animals.
In this work, we have developed and characterized a new rat radiation brain tumor model to study the effect of a brain tumor and RT on the normal brain tissue at acute and late time points. We have quantified the effect of tumor presence on the peritumoral microvasculature and observed a significant increase in vascular permeability but no significant effect on leukocyte interactions. The lack of leukocyte interactions might indicate that the increase in permeability is associated with the angiogenic signaling induced by tumor presence. In support of this conclusion, we observed an increased VEGF expression in the peritumoral region. The combination of RT and tumor presence had a greater damaging effect on peritumoral BBB integrity measured by an increase in leukocyte interactions and permeability which could

not be inhibited by using thalidomide. Furthermore, the regression of tumor after RT and the achievement of 100% survival at 65 days post implant have allowed us to investigate late radiation damage.
Document Type Document Type Dissertation
Degree Name Degree Name Doctor of Philosophy (PhD)
Program Program Biomedical Engineering and Imaging
Research Advisor Research Advisor Gary S. Keyes, Ph.D.
Keywords Keywords Blood-Brain Barrier, Brain Tumor, Peritumoral, Radiation, Thalidomide, Vasculature
Subject Categories Subject Categories Analytical, Diagnostic and Therapeutic Techniques and Equipment | Diseases | Medical Neurobiology | Medical Sciences | Medicine and Health Sciences | Neoplasms | Neurosciences | Therapeutics
This dissertation is available at UTHSC Digital Commons: https://dc.uthsc.edu/dissertations/315

THE COMBINED EFFECT OF IN-SITU TUMOR AND IRRADIATION ON PERITUMORAL BRAIN VASCULATURE
A Dissertation Presented for
The Graduate Studies Council The University of Tennessee
Health Science Center
In Partial Fulfillment Of the Requirements for the Degree
Doctor of Philosophy In the Joint Graduate Program in Biomedical Engineering and Imaging
From The University of Tennessee and
The University of Memphis
By Janice Ann Zawaski
May 2009

Copyright © 2009 by Janice Ann Zawaski All rights reserved
ii

DEDICATION
This dissertation is dedicated to the memory of my father Mr. David Zawaski who taught me much about life.
iii

ACKNOWLEDGEMENTS
I would first like to thank my primary advisor, Dr. M. Waleed Gaber, for his constant encouragement, support, and advice throughout my tenure. Without his guidance this dissertation would not have been possible. I would also like to express my appreciation to the committee members, Gary S. Keyes Ph.D., Thomas E. Merchant D.O., Ph.D., Mohammad Kiani Ph. D., and Erno Lindner Ph.D. for their support, guidance, encouragement, and advice over the past five year. A lot of the work in this dissertation would not have been possible without the help from other laboratory members and I would like to extend my thanks to Christy M. Wilson Ph.D., and Bharathi Gogula M.S. I also would like to thank the individuals in the School of Biomedical Engineering and Imaging and The University of Tennessee Health Science Center. I also would like to recognize the American Heart Association which granted me a pre-doctoral fellowship. Thanks are also due to Braden Kimball M.S. for offering support. Lastly I would like to thank my family for their continual support, especially my sister Christine Zawaski M.S., who was always there to listen.
iv

ABSTRACT In the USA, 200,000 brain tumors are diagnosed each year with glioma representing 8.4% of the 200,000. The standard treatment for glioma consists of surgical resection, when possible, followed by radiation therapy (RT) and/or chemotherapy. Radiation therapy is one of the most effective treatments of brain tumors; however, the therapeutic ratio of RT is limited by damage to the normal tissue. We hypothesize that tumor growth has an adverse effect on the peritumoral tissue through the angiogenic/inflammatory environment it creates rendering it susceptible to further damage by RT which may be prevented by using anti-angiogenic/anti-inflammatory agents. We have developed a rat C6 glioma brain tumor model to study the combination of tumor presence and radiation treatment on the peritumoral region both at early and late time points. We have also used this model to test the effect of thalidomide on limiting radiation toxicity to the normal tissue while not interfering with radiation efficacy. Intravital microscopy was used in combination with a cranial window brain tumor model to assess the effect of glioma presence on neighboring tissue with and without RT (40Gy total, 8Gy/day starting on day 5 post-implant/surgery) and when RT was administered in combination with thalidomide (100mg/kg/day). Permeability of the blood-brain barrier (BBB) was determined by measuring the rate of extravasation of 3kDa Texas-Red dextran from the vasculature into the tissue. Leukocytes were stained using an intravenous injection of Rhodamine 6G and leukocyte interactions, an indicator of inflammation, were counted in venules ranging in size from 45 to 90μm. Staining for vascular endothelial growth factor (VEGF) and glial fibrillary acidic protein (GFAP), a marker of astrocytes, was also performed.
Our studies show that the presence of the tumor alone caused quantifiable changes in BBB permeability, and caused an increased in vascular endothelial growth factor (VEGF) protein expression in the peritumoral region. Astrogliosis, an increase in reactive astrocytes associated with inflammation, was detected in the peritumoral region and contralateral to the tumor.
RT of the implanted tumors caused a significant increase in BBB permeability
and in adhered leukocytes in the peritumoral region, compared to the sham implant group. In addition following RT, VEGF increased both in the peritumoral region and in the middle of the tumor. Astrogliosis was also significantly higher in the tumor implant + RT animals compared to sham and tumor implanted animals. At 66 days post tumor-implantation the RT the BBB permeability and astrogliosis were still significantly higher compared to sham implanted animals.
We have also evaluated thalidomide as a potential anti-angiogenic/anti-
inflammatory agent with the prospective to protect normal tissue and have shown that it had limited effects in a rat C6 brain tumor model and it interfered with RT tumor treatment efficacy. In addition, at 66 post tumor implant there was a significantly higher
v

incidence of astrogliosis, BBB permeability, and adhered leukocyte counts in the animals treated with thalidomide compared to sham implanted animals.
In this work, we have developed and characterized a new rat radiation brain tumor
model to study the effect of a brain tumor and RT on the normal brain tissue at acute and late time points. We have quantified the effect of tumor presence on the peritumoral microvasculature and observed a significant increase in vascular permeability but no significant effect on leukocyte interactions. The lack of leukocyte interactions might indicate that the increase in permeability is associated with the angiogenic signaling induced by tumor presence. In support of this conclusion, we observed an increased VEGF expression in the peritumoral region. The combination of RT and tumor presence had a greater damaging effect on peritumoral BBB integrity measured by an increase in leukocyte interactions and permeability which could not be inhibited by using thalidomide. Furthermore, the regression of tumor after RT and the achievement of 100% survival at 65 days post implant have allowed us to investigate late radiation damage.
vi

TABLE OF CONTENTS
CHAPTER 1. OBJECTIVE ................................................................................................ 1
1.1 Specific Aims .......................................................................................................... 1 1.2 Hypothesis............................................................................................................... 1
CHAPTER 2. INTRODUCTION ....................................................................................... 2
2.1 Brain Tumors .......................................................................................................... 2 2.2 Understanding of the Peritumoral Region .............................................................. 4 2.3 Radiation ................................................................................................................. 5
2.3.1 Radiation Planning ...................................................................................5 2.3.2 Radiation Side Effects..............................................................................7 2.3.3 Radiation Damage ....................................................................................7
2.4 Brain Irradiation ...................................................................................................... 9 2.4.1 Vascular Theory: Endothelial Cells .........................................................9 2.4.2 Glial Theory: Oligodendrocytes/O-2A Progenitor Cells .......................13 2.4.3 Effects of RT on CNS Cells: Astrocytes, Microglia, Neurons and
Subependymal Cells...............................................................................13 2.5 Thalidomide .......................................................................................................... 14
CHAPTER 3. MATERIALS AND METHODS .............................................................. 16
3.1 Culture................................................................................................................... 16 3.2 C6 In Vitro Experiments ....................................................................................... 16
3.2.1 Viability Assay.......................................................................................16 3.2.2 Cell Proliferation ....................................................................................16
3.3 Animal Studies ...................................................................................................... 16 3.4 Radiation ............................................................................................................... 17
3.4.1 Cranial Tumor Irradiation ......................................................................17 3.4.2 Flank Tumor Irradiation .........................................................................17 3.4.3 C6 Cells ..................................................................................................17
3.5 Thalidomide Treatment ......................................................................................... 17 3.6 Flank Tumor Inoculation ...................................................................................... 18 3.7 Cranial Window Technique .................................................................................. 18 3.8 Cranial Tumor Implantation ................................................................................. 18 3.9 Intravital Imaging.................................................................................................. 18
3.9.1 BBB Permeability Measurement ...........................................................19 3.9.2 Leukocyte-Endothelial Cell Interactions ...............................................19 3.9.3 Tumor Size (Surface Area and Volume) ...............................................23 3.9.4 Permeability Kinetics Measurement ......................................................23
3.10 Tissue Extraction .................................................................................................. 23 3.11 Immunofluorescence Staining .............................................................................. 23
3.11.1 VEGF Immunofluorescence Staining ....................................................24
vii

3.11.2 Glial Fibrillary Acidic Protein (GFAP) Staining ...................................24 3.12 Statistics ................................................................................................................ 24
CHAPTER 4. RESULTS .................................................................................................. 26
4.1 Model Characterization ......................................................................................... 26 4.1.1 Animal Survival .....................................................................................26 4.1.2 Animal Weight .......................................................................................28 4.1.3 Tumor Surface Area ...............................................................................28 4.1.4 Correlation between Tumor Surface Area, Cross Sectional Area, and
Tumor Volume .......................................................................................28 4.1.5 Astrogliosis in the Tumor Model ...........................................................28
4.2 Early Effects of Tumor Presence and Radiotherapy ............................................. 32 4.2.1 Animal Survival Post RT .......................................................................32 4.2.2 Weight Change within the Four Experimental Groups ..........................32 4.2.3 Change in Tumor Surface Area Post RT ...............................................32 4.2.4 BBB Permeability Changes in the Peritumoral Region .........................36 4.2.5 Adhered Leukocytes in the Brain Vasculature Following Tumor
Implant and RT ......................................................................................36 4.2.6 Rolling Leukocytes in the Brain Vasculature Following Tumor
Implant and RT ......................................................................................36 4.2.7 Astrogliosis Following Tumor Implantation and Radiation ..................36 4.2.8 VEGF Immunoflourescence Staining ....................................................40
4.3 Late Effects of Tumor Presence and Radiotherapy .............................................. 40 4.3.1 Radiation-Induced Late Effects on BBB Permeability ..........................40 4.3.2 Radiation-Induced Late Effects on Leukocyte Adhesion ......................40 4.3.3 Radiation-Induced Late Effects on Leukocyte Rolling .........................47 4.3.4 Radiation-Induced Late Effects on Astrocytes ......................................47
4.4 The Use of Thalidomide to Minimize RT-Induced Damage ................................ 47 4.4.1 Animal Survival .....................................................................................47 4.4.2 Percent Change in Weight over Time ....................................................47 4.4.3 Comparison of the Growth Kinetics between Experimental Groups .....50 4.4.4 Ex Vivo Tumor Volume Estimation ......................................................50 4.4.5 Tumor Growth in Immunocompromised Mice Following Treatment ...50 4.4.6 In Vitro Testing of Thalidomide Treatment...........................................50 4.4.7 BBB Permeability Following Treatment with Thalidomide ..................55 4.4.8 New Method of Measuring Permeability in Tissue ...............................55 4.4.9 Changes in Leukocyte Adhesion Following Treatment .........................55 4.4.10 Changes in Leukocyte Rolling Following Treatment ............................59 4.4.11 Changes in Number of Reactive Astrocytes ..........................................59
CHAPTER 5. DISCUSSION ............................................................................................ 62
5.1 Model Characterization ......................................................................................... 62 5.2 Tumor and Radiation-Induced Early Changes ...................................................... 64 5.3 Tumor Radiation-Induced Late Changes .............................................................. 65
viii

5.4 Thalidomide Treatment ......................................................................................... 66
CHAPTER 6. FUTURE DIRECTIONS ........................................................................... 68
6.1 Summary ............................................................................................................... 68 6.2 Future Directions .................................................................................................. 68
LIST OF REFERENCES .................................................................................................. 70
APPENDIX A. SUPPLEMENTAL DATA ...................................................................... 79
APPENDIX B. DIFFERENCE BETWEEN PERMEABILITY DYES ........................... 84
APPENDIX C. BIOLOGICAL EFFECT DOSE (BED) CALCULATIONS .................. 87
VITA ................................................................................................................................. 88
ix

LIST OF TABLES
Table The gross tumor volume (GTV) and planning target volume (PTV) of three different spherical tumors .................................................................... 6
2-1.
Table 3-1. Table showing the experimental groups and measurements performed at
the early time points .................................................................................... 21 Table 3-2. Table showing the experimental groups and measurements performed at
the late time points ...................................................................................... 21 Table B-1. Comparisons of average intensities ............................................................ 86 Table C-1. Comparisons of the different radiation regimens ....................................... 87
x

LIST OF FIGURES
Figure 2-1. Schematic of a tumor cross section to illustrate the determination of
the lanning target volume which is composed of the gross tumor volume, and an additional 1.5 cm margin ....................................................6
Figure 2-2. A cartoon depicting a cross section of brain parenchyma showing the
structure of the blood brain barrier (BBB) and the damage induced by radiotherapy (RT) of brain tumors .............................................................10
Figure 2-3. Flowchart of the sequences of events following cranial irradiation ..........12 Figure 2-4. Cartoon depicting our hypothesis that the combined effect of tumor
presence and radiation therapy (RT) induces an inflammatory and angiogenic environment that initiates normal tissue damage ....................15
Figure 3-1. Time line of the intravital experiments performed in vivo ........................20 Figure 3-2. A collage showing the process of our intravital microscopy BBB
permeability measurement .........................................................................22 Figure 3-3. GFAP staining of rat brain tissue in a tumor implant brain 15 days
post surgery and in a tumor implant brain following RT at 66 days .........25 Figure 4-1. Percent survival of rats with brain tumor implants that received no
treatment ....................................................................................................27 Figure 4-2. Percent changes in animal weight over time in sham and tumor
implant animals ..........................................................................................29 Figure 4-3. The difference in normalized tumor surface area within the tumor
implant group .............................................................................................30 Figure 4-4. Correlations between in vivo tumor surface area acquired using
intravital imaging, and (A) cross sectional surface area acquired histologically, and (B) estimated tumor volume from histological samples .......................................................................................................31
Figure 4-5. The number of activated astrocytes ............................................................33 Figure 4-6. Percent survival of rats with brain tumor-implants with and without
radiation treatment .....................................................................................34
xi

Figure 4-7. Percent weight change measured in the four experimental animal groups; sham implant, tumor implant, sham implant + RT, and tumor implant + RT ..............................................................................................35
Figure 4-8. Normalized tumor surface area measured using intravital imaging ...........37 Figure 4-9. Changes in BBB permeability following tumor implant and
radiotherapy ...............................................................................................38 Figure 4-10. The effect of tumor growth and radiation on leukocyte-endothelial
cell interactions in non-tumor vessels ........................................................39 Figure 4-11. The number of reactive astrocytes following tumor implant and RT ........41 Figure 4-12. Images of GFAP stained rat brain tissue in sham implant, tumor
implant + RT, and tumor implanted animals .............................................42 Figure 4-13. Immuflourescence staining of VEGF at 10 and 15 days in tumor
implant and tumor implant + RT animals ..................................................43 Figure 4-14. Change in BBB permeability at 66 days following RT .............................45 Figure 4-15. Quantification of the leukocyte-endothelial interactions at 65 days
post-surgery................................................................................................46 Figure 4-16. The late effect of RT and tumor presence on astrogliosis ..........................48 Figure 4-17. Percent survival of rats with brain tumors with and without treatment .....49 Figure 4-18. Percent weight change over time in three experimental groups; sham
implant, tumor implant + RT, tumor implant + RT + thalidomide ............51 Figure 4-19. The difference in normalized tumor surface area between treatment
groups using our cranial window technique ..............................................52 Figure 4-20. Ex vivo estimated tumor volume in tumor implant, tumor implant +
RT, and tumor implant + RT + thalidomide animals .................................53 Figure 4-21. Normalized tumor growth of flank tumors in immunocompromised
mice following treatment ...........................................................................54 Figure 4-22. A C6 rat glioma in vitro cell experiment ...................................................56 Figure 4-23. Combined graph of the early and late changes in BBB permeability ........57 Figure 4-24. Novel method of measuring permeability in tumor tissue .........................58
xii
Figure 4-25. Early and late changes in leukocyte-endothelial interactions ....................60 Figure 4-26. Number of activated astrocytes at 66 days post surgery ............................61 Figure A-1. Graph depiction of the number of surviving animals at each five day
time point ...................................................................................................79 Figure A-2. Correlation between tumor volume estimated from the tumor area on
the surface of the brain and coronal cross sectional area ...........................80 Figure A-3. Plots of the rate of growth from 5 to 15 days in the tumor implant
group ..........................................................................................................81 Figure A-4. Cross sectional area of the tumor post sacrifice .........................................82 Figure A-5. Correlation between change in permeability and leukocyte
interactions .................................................................................................83 Figure B-1. Images of the brain vasculature post dye injection of Texas-Red and
FITC dextran ..............................................................................................84
xiii

xiv
LIST OF ABBREVIATIONS ANOVA Analysis of variance BBB Blood-brain barrier BED Biological effective dose CNS Central nervous system CT Computed tomography CTV Clinical target volume DNA Deoxyribonucleic acid EC Endothelial cell ECM Extracellular matrix EF5 Pentafluorinated derivative of etanidazole FITC Fluorescein isothiocyanate GFAP Glial fibrillary acidic protein GFP Green fluorescent protein GTV Gross tumor volume Gy Gray of radiation ICAM-1 Intracellular adhesion molecule-1 i.m. Intramuscular i.p. Intraperitoneal i.v. Intravenous kDa Kilodaltons MRI Magnetic resonance imaging mRNA Messenger ribonucleic acid NF-κB Nuclear factor-kappa B PTV Planning target volume ROI Region of interst RT Radiatiotherapy SE Subependymal SEM Standard error of the mean TJ Tight junctions TNF, TNF-α Tumor necrosis factor VEGF Vascular endothelial growth factor VEGF-A Vascular endothelial growth factor-A VVO Vesiculo-vacuolar organelles

CHAPTER 1. OBJECTIVE
Radiation therapy is one of the principal treatments for brain tumor patients. The therapeutic ratio of RT is limited by damage to the normal tissue. Our ultimate goal is to eliminate the side effects of cranial irradiation in order to improve the quality of life for patients after RT and possibly allow radiotherapists to increase RT dose. The purpose of this study was to characterize the effects of radiation in a more clinically relevant rat brain tumor model to determine if the presence of tumor renders the tissue more susceptible to damage by RT and to evaluate whether thalidomide can limit radiation toxicity to normal tissue without interfering with RT treatment efficacy. 1.1 Specific Aims
(1) Establish a rat brain tumor model in combination with the cranial window technique.
(2) Characterize the effects of RT in the rat brain tumor model using intravital
microscopy and histopathology at early time points post-RT (10 and 15 days post-surgery).
(3) Investigate whether thalidomide could be used concomitantly with RT to limit the adverse side effects of radiation on normal tissue toxicity using our rat brain tumor model at early and late time points post-RT (10, 15, and 65 days post-surgery) using intravital microscopy.
1.2 Hypothesis
(1) Tumor growth has an adverse effect on the peritumoral BBB through the angiogenic/inflammatory environment it creates rendering it susceptible to further damage by RT.
(2) Thalidomide treatment administered concomitantly with RT will protect the
normal tissue from RT-induced side effects at early and late time points post RT and due to its anti-angiogenic properties it will increase RT efficacy of the tumor.
1

CHAPTER 2. INTRODUCTION 2.1 Brain Tumors There are two types of brain tumors: primary brain tumors which originate from cells already in the brain, mainly glia cells such as astrocytes, oligodendrocytes, and ependymal cells,1 and metastatic brain tumors which are secondary tumors created from tumor cells that have traveled from other cancerous tissue located elsewhere in the body. Half of all brain metastases originate from lung cancer, 15-20% from breast cancer and 10% from melanoma skin cancer.2 Metastatic brain tumors are more prevalent than primary tumors and approximately 98,000 to 170,000 new cases of metastatic brain tumors are diagnosed in the United States each year.3,4 From the 51,410 cases of primary brain tumors diagnosed in 2007, only about 20,500 were malignant.5 Although the origins of brain tumors can be different, their treatment is similar. In general, both receive radiation therapy. The etiology of primary brain tumors is not known. However, epidemiological studies show that males have a 40% higher risk for developing a glioma than females. High doses of radiation to the brain increase the risk of glioma, meningioma, and nerve sheath tumors. The possibility of malignant glioma formation is increased in patients with genetic syndromes such as types I and II neurofibromatosis, Li-Fraumeni syndrome, and Turcot’s syndrome. They are recorded in 5% of all malignant glioma cases.6 In addition, similar to other types of cancer, the tumor suppressor genes are mutated in brain tumors, such as, the phosphatase and tensin homolog and the P53 genes.6 In general, patients with malignant brain tumors are assumed to have accumulated genetic abnormalities. These abnormalities affect detoxification, cell-cycle regulation, and deoxyribonucleic acid (DNA) repair mechanisms in the brain, which could lead to tumor development. Two common pathways have been identified in primary brain tumors: the ras mitogen-activated protein kinase pathway and the phosphatidylinositol 3 kinase pathway.7 An abnormality in one of the pathways or in one of the genes will most likely not result in a brain tumor. It is the accumulation of abnormalities that increases the risk of increased cellular growth and hence of tumor initiation. Angiogenesis, the process of new vasculature growth from pre-existing vessels, is a hallmark of tumors. This continuous expansion of the vascular network is necessary for tumor growth. There are three stages of vascular development during tumor progression. The first stage is during the early phases of tumor growth when the tumor co-opts existing vessels for its growth. In this stage existing vessels become more permeable to allow for increased delivery of nutrition to cope with the increased demand by the fast growing tumor mass. This process also weakens the basement membrane of existing vessels in preparation for vascular sprouting. However, as the tumor reaches a size of 1-2 mm3, the existing vasculature is no longer adequate to handle its growth demands.8 It is during the second stage, when the rapid tumor growth results in a shortage of oxygen supply that the tumor microenvironment experiences an increase in hypoxia and the formation of an acidic milieu which tumor cells can tolerate while normal cells cannot.
2

This environmental advantage provides tumor cells with a competitive edge over normal cells and initiates a rapid growth phase that increases the demand for vascular formation resulting in the production of growth factors, such as vascular endothelial growth factor (VEGF), that induces angiogenesis.9 The vessels of the new vascular networks are dilated, higher in density, chaotic, immature, and tortuous.10 The rapid increase in VEGF production does not allow the neo-vessels to mature into normal vasculature but instead results in vessels that are leaky because they lack a basement membrane and have decreased pericyte coverage. The third, and final stage of vascular development is caused by the extravasation of serum, plasma proteins, and blood cells from the dense network of leaky vessels, resulting in the formation of edema and an increase in the tumor interstitial pressure.11 This increase in interstitial pressure can cause vasculature to collapse perpetuating a cycle of increased hypoxia and acidic environment, which can also lead to necrotic areas in the tumor.12,13,14 In brain tumors, the increase in permeability associated with angiogenesis creates numerous problems during treatment. The first of these is caused by the excessive edema and results in the inability to accurately image the tumor margin. This in turn affects the volume of tumor and normal tissue irradiated. The increase in tumor permeability leads to an increase in the interstitial pressure within the tumor which together with the blood-brain barrier (BBB) further hinders the delivery of chemotherapeutics to the tumor. Furthermore, the edema affects the oxygenation levels in and around the tumor decreasing the efficacy of radiation therapy. Finally the tightly regulated homeostasis of the brain is disrupted by the extravasation of serum, plasma proteins and cells from the blood system, further weakening the whole organ. Inflammation is reported to play a role in angiogenesis. However, this role is unclear and seems to depend on tumor cell origin, location, and stage of growth.15-18 Gliomas have been shown to upregulate a host of inflammatory mediators such as tumor necrosis factor (TNF), interleukin-8 and -6, hypoxia-inducible factor-1α, and tumor growth factor-β.19,20 There has been some evidence that TNF can promote tumor growth through stabilization of angiogenic factors and promotion of cell proliferation and induction of inflammation.15,21 TNF knockout mice have shown resistance to skin carcinogens22 and TNF receptor-1 knockout mice had a significant decrease in the chances of developing liver metastasis of colon cancer.23 Several anti-TNF agents have been studied for their anti-tumor activity including infliximab, thalidomide, and lenalidomide.24-26 Recent studies show that inflammation precedes VEGF mediated angiogenesis and acts to increase leukocyte extravasation and permeability of the BBB in rats.27 The increase in permeability has been shown to be caused, in part, by the formation of endothelial fenestrations (vesicles).28,29 Inflammation in different diseases has been shown to increase vesicular activities.30,31 Lossinsky et al.32 have shown that intracellular adhsion molecule-1 (ICAM-1) is present within the inner membrane of vesicles in developmental and tumor tissues. The expression of ICAM-1 has also been shown to occur following treatment with VEGF and is proposed to be part of the preparatory step towards angiogenesis.33,34 Treatments to shut down this angiogenic process are already in clinical trials.35,36 Anti-angiogenic therapies work by normalizing the tumor vasculature by pruning the immature vasculature resulting in better blood flow within the tumor. Normalized
3

vasculature within a tumor would result in better tumor oxygenation, increasing the efficacy of radiation, and would allow for better delivery of therapeutics. Bevacizumab, a monoclonal antibody to VEGF-A, is the first U.S Food and Drug Administration approved anti-angiogenic inhibitor for use in metastatic cancers such as colon, non-small cell lung, and breast cancer. It is also undergoing clinical trials in non-metastatic colon cancer, non-metastatic breast cancer, renal cell carcinoma, glioblastoma multiforme, ovarian cancer, hormone-refractory prostate cancer, non-metastatic unresectable liver cancer and metastatic or unresectable locally advanced pancreatic cancer. 2.2 Understanding of the Peritumoral Region
The peritumoral region refers to the area surrounding the tumor. It is an amorphous region that is hard to define. Consequently, the peritumoral region is defined in different terms in imaging studies. Provenzale et al. defines it as the “hyperintense area seen on T2-weighted MR images that surrounded the region corresponding to the enhancing area seen on the T1-weighted MR images”.37 Julien et al. defines it as “the region at the edge of the tumor having the largest [blood volume] due to a high vessel density” using magnetic resonance imaging (MRI).38 Nevertheless, the microenvironment of the peritumoral region is of interest because it is the interface between normal tissue cells and tumor cells. Understanding the influence of the tumor cells on the microenvironment of this interface may lead to therapies that could aid in the fight against tumors. Further, the peritumoral region is the common site of tumor invasion. In gliomas, the invasion of the tumor cells into the normal tissue is a consequence of the degradation of the extra cellular matrix (ECM) by proteolytic enzymes expressed by the tumor cells. The in vivo studies of Sandstrom et al. have shown that glioma tumors exceeding a size of 10 mm3 both tissue plasminogen activators mRNA and urikinase plasminogen activator mRNA, (both precursor to plasmin which is a protease) were expressed at the edge of the tumor and branched into the normal brain.39 In addition, VEGF mRNA expression was found in the peritumoral border of tumors larger than 10 mm3.39 Other proteases have also been associated with glioma cell invasion. Guo et al. have shown that angiopoietin-2, a protein growth factor, is co-overexpressed with matrix metalloproteinase-2, and membrane type 1 matrix metalloproteinase (matrix metalloproteinases that are involved in ECM degradation and remodeling) in invasive areas of human primary glioma specimens.40 Currently the standard of care for the majority of brain tumors is surgical resection when feasible. The tumor area to be resected is primarily based on computed tomography (CT) and MRI. A major problem with tumor resection is the difficulty in defining the boundary between the tumor and normal tissue, which introduces uncertainty in the resected volume.41 Uncertainties in demarcating the boundary between normal and tumor tissue related to edema (with and without resection) makes the planning of radiation therapy difficult i.e, to draw the dosage map without under or over estimating the irradiation region. Underestimating the gross tumor volume (GTV) can lead to tumor cells not being irradiated and can increase the chances of tumor reoccurrence.42 Over estimating the GTV can lead to unnecessary irradiation of the normal tissue that can lead
4

to long-term detrimental effects. A clear characterization of the peritumoral region may help clinicians in more accurate demarcation of the tumor and normal tissue boundaries leading to improved resection and radiation mapping. During radiation therapy, patients are repeatedly examined by imaging techniques to evaluate the progression of the cancer. Edema during and following radiation therapy can inhibit the clinician’s ability to evaluate the efficacy of treatment. Following radiotherapy, 40% of gliomas are typically enhanced when imaged with MRI; and of these cases, 50% are due to an increase in vessel permeability resulting from radiation which improves over time.6 The apparent increase in tumor size can mask actual progression of the tumor which may not have responded to radiation treatment. Brain tumors, especially gliomas, frequently present peritumoral edema which is commonly treated with corticosteroids such as dexamethasone.43 The use of corticosteroids can lead to Cushing’s syndrome caused by high levels of cortisol in the body, can cause symptoms ranging from central obesity to neurological or psychiatric syndromes. Cushing’s syndrome is treated by tapering the amount of steroids given, but if left untreated it can lead to cardiovascular disease and increase mortality. Patients using corticosteroids are also at higher risk of Pneumocystis jiroveci pneumonitis, acute corticosteroid myopathy during treatment, and long term complications of chronic corticosteroid myopathy, osteoporosis, and compression fractures.43,44 The discovery of new therapies to treat peritumoral edema may allow for a reduction in the use of corticosteroids. 2.3 Radiation 2.3.1 Radiation Planning
In the process of treatment planning, the oncologist first defines the clinical target volume (CTV) which consists of the tumor delineated on radiological scans, gross tumor volume (GTV), plus a 1cm margin to account for any microscopic tumor spread (some protocols use a 2 cm margin).42 Next the oncologist defines the planning target volume (PTV) which includes the CTV plus a ½ cm margin45 that takes into account inaccuracies such as patient movement and differences in patient positioning in repeated imaging examinations (Figure 2-1). Therefore, the irradiated volume includes not only tumor tissue, but also peritumoral tissue (combination of tumor and normal tissue) and normal tissue (Table 2-1). The radiation regimen for primary malignant tumors is from 60Gy up to 80Gy of partial-field external beam irradiation in fractions between 1.8Gy and 2.0Gy (5days/week).6 The radiation regimen for metastatic brain tumors is different due to the diffuse nature of metastatic tumors and the common occurrence of more than one tumor. Therefore, the majority of patients with metastatic tumors receive whole brain radiotherapy with a standard regimen of 30Gy in 10 fractions over 2 weeks.2
5

Gross Tumor Volume (GTV)
Clinical Target Volume (CTV)
CTV=1cm+GTV
Planning Target Volume (PTV)
PTV= 0.5cm+CTV
Figure 2-1. Schematic of a tumor cross section to illustrate the determination of the planning target volume which is composed of the gross tumor volume, and an additional 1.5 cm margin. Table 2-1. The gross tumor volume (GTV) and planning target volume (PTV) of three different spherical tumors.
Tumor Diameter
(cm)
Gross Tumor Volume (GTV) (cm3)
Planning Target Volume
PTV = GTV + 1.5 cm (cm3)
Ratio of PTV/GTV
Percentage of PTV compared
to the brain (assumed as 1200cm3)
2.5 8.18 87.11 10.65 7.26% 3.75 27.61 161.03 5.83 13.41% 5.0 65.45 268.08 4.10 22.34%
The ratio of PTV/GTV has been calculated to demonstrate how much the PTV adds to the GTV. Note the larger PTV/GTV ratio for the smallest tumor volume and the percentage of brain targeted to receive radiation compared to brain volume (assumed to be 1200 cm3).
6

2.3.2 Radiation Side Effects Radiation toxicity in humans is usually organized chronologically as: acute (within days), early (1-6 month post treatment), and late toxicity.46 Late-term effects are common in tissues with limited potential for self-renewal, such as in the central nervous system (CNS).47 Radiation side effects in the brain are further amplified by the effects related to surgical resection, chemotherapy, patient age, tumor size and location.47 Radiation toxicity of the CNS can be identified by several markers. Apoptosis is one of the early effects of RT together with astrogliosis, BBB damage and the inflammatory cascade that occurs in the acute phase following RT. Transient demyelination is observed between one and three months following RT and is usually accompanied by oligodendrocyte damage. Impairment of neurogenesis and depletion of progenitor cell populations occurs at all times following RT. Finally late vasculopathy, necrosis and glial atrophy are hallmarks of late radiation damage and signs of treatment morbidity.48,49 This chronological division of radiation injury does not necessarily reflects a mechanistic disparity50 however, early events may initiate a cascade of events leading to the observed changes. 2.3.3 Radiation Damage
Radiation therapy is one of the principal treatments for brain tumor patients. As the high-energy x-ray photons travel through tissue, their primary interaction with the atoms and molecules of the tissue is through Compton scattering.51 The result of such scattering is the emergence of an electron and photon, roughly dividing the original photon energy and moving in almost the same direction. This process continues, now with more vigor because of the freed electrons, initiating an avalanche of free electrons that proceed to ionize atoms along its path. The newly formed ions produce free radicals that can interact chemically to alter or destroy important protein structures or DNA strands damaging or destroying the cells affected. Ionic interactions are strongly dependent on the ion’s mass, and the most lethal of such ions are those formed through the ionization of water, or oxygen, molecules. There are two types of radiation damage; direct damage, and indirect damage. Direct damage is defined as damage to one of the chemical bounds of a deoxyribonucleic acid (DNA) molecule through interaction with an X ray or gamma photon of the radiation therapy. Indirect damage from radiation is a result of free radical production within the cell and the damage to the DNA molecules due to their interaction with these radicals. Since water is in high abundance in the human body, 70% to 80%, the majority of free radicals formed are a result of radiolysis of water. Due to the short life time of free radicals, ~10-10 seconds, only free radicals generated from water molecules can damage DNA molecules located within 2-3nm distance. Direct or indirect damage can result in breaks in a single strand of DNA, in both strands at separate locations (not close to each other), and/or in double strand breaks of DNA relatively close in proximity. The first two types of damage, single strand breaks and double stranded breaks at separate locations, have little biological consequence on the cell and are not lethal. Double strand breaks occurring in close proximity, as a result of radiation exposure, are responsible for cell killing, mutation, and carcinogenesis.51 Since
7

cancerous cells divide more rapidly than most normal cells, probability that cancerous cells will interact with destructive radicals during their mitotic phase when they are most vulnerable to damage is much larger than for normal cells. One of the major predicaments in RT is that oxygen abundance is beneficial for the formation of free radicals which cause damage to the tumor cells but in general the tumor microenvironment is hypoxic and lacks the normal levels of oxygen.9 Radiation damage has also been hypothesized to be induced, in part, by the bystander effect. The bystander effect is a term that encompasses the biological effects seen in non-irradiated cells resulting from exposure to irradiated cells. Numerous inter- and intra- cellular pathways have been shown to contribute to the bystander effect in cells. DNA mutations have been found in bystander cells upon exposure to other irradiated cells or growth media from these cells. The growth media may induce bystander effects because it has been shown that irradiated cells secrete tansforming growth factor-α and TNF-α which can cause mutagenesis, decrease survival, and modulate the expression of cell cycle-related genes.52 Other possible explanations of the bystander effect are related to increases in intracellular ROS (reactive oxygen species) and Ca2+ levels.53 Bystander effects have been noted with cell to cell distances as large as of 7.5 mm. However, the spatial extension of the bystander effect is not lucid and apparently depends on the type of culture and the measurement used.54,55 In vivo the bystander effect, measured by RAD51 upregulation, was detected at more than 1 cm of distance from the irradiated tissue.56 The exact mechanisms responsible for the bystander effect are still unknown and further research will provide a better understanding of this phenomenon and its consequences.
The sensitivity of organs and/or cells to radiation is dependent on a numerous
factors such as dose of RT, time between RT fractions, rate of cellular division, differentiation of tissue, and the volume of organ irradiated. One major factor is the percentage of the cell population undergoing G2 phase and mitosis phase of the cell separation when cells are most sensitive to radiation, according to the the Bergonie-Tribondeau Law.57 The increased sensitivity in the G2 phase is related to its short duration and thus the cell does not have enough time to repair damaged DNA. The sensitivity of cells to radiation during mitosis is increased because the probability of lethal mutations is larger since damaged DNA cannot be repaired during division. This is the reason why tumor cells, which have very high proliferation rates, are more sensitive to radiation than the majority of normal cells in the body. Another factor is the degree of cell differentiation in the organ. The more differentiated the cell population the less sensitive the organ is to radiation. This phenomenon is again related to the cell cycle. The more differentiated cells are usually the less proliferative thus the probability that cells are in either the G2 or mitosis phases is smaller than for less differentiated cells. In addition, organs with cell populations that are not fully differentiated result in increased damage because the cells that are lost are potential progenitors of other cells causing a decrease in cell population related to cell death and the potential offspring the cells would have produced. For example when stem cells are lost it can be very damaging because stem cells are responsible for replenishing the cell populations. The rate of cellular turnover in tissue effects when RT damage becomes evident. In tissues with high
8

turnover rates the RT damage can be recognized early. An example of this type of tissue would be the intestinal epithelium or bone marrow.57 In tissues with slow turnover, the number of cells damaged is decreased due to the smaller number of cells in mitosis, and the number of offspring they produced is few. Therefore damage is not evident until later time points. The brain is a good example of an organ with this quality. 2.4 Brain Irradiation The brain is a unique organ. It controls the central nervous system and is functionally responsible for coordinating movements, senses, consciousness, and production of certain hormones.58 Following radiation treatment, brain tumor patients suffer from long-term side effects such as memory loss, fatigue, and decreased attention/concentration.59 These side effects can be attributed to physical changes in the brain such as demyelination, necrosis, vasculopathy, and astrogliosis seen at late time points. The exact nature and cause of this late term damage is still not clear but two main theories are currently being researched. 2.4.1 Vascular Theory: Endothelial Cells
This theory advocates that late term damage in the brain is caused by early damage to the vasculature of the brain. The microenvironment of the brain is regulated and protected by specific barriers, which include the vascular-endothelial barrier (referred to as the BBB) at the capillary-parenchyma interface and the epithelial barrier (blood-cerebrospinal fluid barrier) at the choroid plexus.60 The BBB is more than a physical barrier: it plays a fundamental role in regulating the movement of substances between the blood and the CNS, see Figure 2-2. The microvascular network is defined as a series of interconnected arterioles, venules, and capillaries with low Reynolds numbers and large surface areas which provide an optimal environment for the supply of oxygen, nutrients, removal of waste products and interaction of blood cells (i.e., red blood cells, white blood cells, platelets, etc.) with endothelial cells (ECs).61,62 The overall design of the microvascular network is a function of metabolic stimuli, biochemical growth factors, feedback control, external stimuli, and hemodynamic parameters.63 The microvascular network is also the site of the BBB, and the endothelial cells that make up the microvascular network-barrier contain few pinocytotic vesicles and adhere to each other via tight junctions (TJ)64 which are formed by junction-specific proteins such as occludin. TJ limit paracellular transport of hydrophilic compounds into the CNS as compared to non-CNS vessels.65,66 Damage to the endothelial cells compromises the integrity of the BBB. Also, astrocytes in close proximity to the endothelial cells add another impediment to paracellular transport by biochemically conditioning the endothelial cells and strengthening the TJ between them.67 The ECs also play an important immune function through leukocyte surveillance and extravasation by regulating adhesion integrins and cytokine production.68 In particular, they have been shown to directly secrete TNF.69 This complex vascular network is essential to supplying the brain with nutrients and helps to maintain the homeostasis of the brain.
9

(A) Normal BBB
Pericyte
Astrocyte
Demyelinated neuron
Adhered Leukocyte
Swollen mitochondria
EC
Damaged TJ
Vesicles
Extravasated molecules
(B) Damaged BBB
Pericyte
Astrocyte
Myelinated neuron
Mitochondria
EC
TJ
Figure 2-2. A cartoon depicting a cross section of brain parenchyma showing the structure of the blood brain barrier (BBB) and the damage induced by radiotherapy (RT) of brain tumors.
(A) Normal BBB showing: intact tight junctions (TJ); lack of vesicles; astrocytes and pericytes abutting the endothelial cell (EC) providing additional barrier support; neuron with thick, healthy myelin. (B) Damaged parenchyma; astrocytes and pericytes have pulled away from the EC; leukocyte has adhered to the EC; loss of TJ integrity; and vesicle formation. The damage to the BBB resulted in molecule extravasation out of the blood vessel and into the extracellular space. Further, neurons show signs of damage which resulted in thinning of their myelin increasing demand for energy (for signal transmission) resulting in the swelling of the mitochondria.
10

When the barrier between the vascular supply of the brain and the CNS parenchyma is disrupted, excess extravasation of proteins, biologic-response molecules (e.g. growth factors, cytokines, and clotting factors), inflammatory cells, and therapeutic drugs can damage the brain.60,70-72 The disruption of the BBB has been identified as a consequence of various diseases/injuries such as multiple sclerosis, ischemia, human immunodeficiency virus, hypertension, brain tumors, CNS injury and radiation exposure.72-76 In these diseases, the inflammatory cells are able to penetrate the BBB and destroy the myelin surrounding the axons. Demyelination and myelin thinning have been reported in the CNS following RT.77-80 Felt et al. have shown that RT-induced BBB permeability prolongs induced demylination of neurons.81,82 One of the major adverse effects of brain tumor irradiation is the increase in BBB permeability following RT. In agreement with others, we83-86 have demonstrated there is an increase in BBB permeability following RT. This increased permeability is caused in part by EC damage, as expressed by changes in tight junction integrity, and by vesicle formation post-irradiation. RT-induced EC damage has been investigated by several scientists87-89 aiming to elucidate the effect of RT on initiating and/or sustaining radiation side effects. Eissner et al.,90 as well as others,88,89 have shown that irradiated ECs both in vitro and in vivo undergo apoptosis at a higher percentage than other cells. Our studies using electron microscopy showed that RT damages TJ,84 which is connected to the increase in BBB permeability. In addition, several studies, including our own, have shown an increase in BBB permeability and an increase in the number of vesicles following fractionated cranial irradiation.84-86 RT has been shown to induce changes in the microvasculature which in turn have a marked effect on tissue oxygenation and could lead to the development of acute and/or chronic hypoxia.91 Ansari and Gaber et al. have shown that brain irradiation causes a reduction in tissue oxygenation, as measured by EF5 (a pentafluorinated derivative of etanidazole) staining.92 Hypoxia has been shown to activate inflammatory mediators, and the inflammation marker ICAM-1 on ECs93,94 and to promote angiogenesis by upregulating VEGF and its receptors.9 Hypoxia also plays a role in the tumor’s radio-resistance caused by the shortage of oxygen available to produce reactive oxygen species (free radicals are in large part responsible for the destruction of DNA by ionizing radiation) (Figure 2-3).95-98
The damage to the microvasculature and the breach of the BBB related to RT can also disturb the delicate brain microenvironment through exposure of the brain parenchyma and neural cells to noxious substances.76,84,97 An imbalance in the brains microenvironment can set a chain of events into motion (such as the release of cytokines), magnifying the original signal, and contributing to late-term tissue damage which might play a role in cognitive impairment.99 In this study we have used BBB permeability as a measure of radiation damage at early and late time points. In addition we have also measured the degree of leukocyte-endothelial interactions as a measure of inflammation.
11

BBB Damage
RT
• Necrosis ● Demyelination • Gliosis ● Vasculaopathy • Neurogenesis impairment
• Permeability • Leukocyte
interactions • Gliosis
Apoptosis Inflammatory Cascade
• Leukocyte interactions
• Gliosis
Late Parenchymal Damage
Figure 2-3. Flowchart of the sequences of events following cranial irradiation. Two of the main events that occur following exposure to radiation are apoptosis of cells and inflammation, which then can lead to parenchymal and blood brain-barrier (BBB) damage in the brain.
12

2.4.2 Glial Theory: Oligodendrocytes/O-2A Progenitor Cells
The glial theory attributes the late term side effects of radiation to the loss of oligodendrocytes in the brain. Oligodendrocytes are responsible for producing and repairing the myelin sheaths which insulate the axons in the brain, and therefore, the loss of oligodendrocytes can lead to demyelination of axons. The decline in oligodendrocyte cell population after radiation has been attributed to the loss of oligodendrocyte precursor cells, O-2A progenitor cells. Following radiation exposure O-2A precursor cells can lose their ability to reproduce and may undergo apoptosis therefore limiting the number of progeny produced.100 In addition, it has also been shown that oligodendrocytes undergo apoptosis following radiation, which may be a result of direct/indirect radiation damage and possibly the changes in oligodendrocyte microenvironment such as BBB breakdown.46,87,101
2.4.3 Effects of RT on CNS Cells: Astrocytes, Microglia, Neurons and Subependymal Cells
Astrocytes are a subtype of glial cells and are the most common phenotype in the brain. Astrocytes have numerous functions such as calcium signaling, neurotransmitter function, cytokine secretion, and structural support of the BBB. RT damages astrocytes in the brain. We and others have reported activated astrocytes after treatment with fractionated irradiation.84,91,102 Astrogliosis (or gliosis), the up-regulation of astrocytes present in an area of the brain is induced by a host of inflammatory mediators. Prolonged gliosis can create glial scar sites which have been theorized to inhibit axonal regeneration or remylination.103,104 Whether RT-induced gliosis is caused by direct ionization damage or due to the breach in the BBB exposing the parenchyma to noxious substances and inflammatory cytokines is unclear. However, activated astrocytes have been shown to secrete inflammatory agents105,106 which, could contribute to EC and microvascular damage and have detrimental effects on oligodendrocytes and O-2A progenitor cells. In this study we have used the degree of astrogliosis as an inflammation marker resulting from irradiation. The advantage of using astrogliosis as a marker of damage is that it is seen both in the parenchyma and BBB damage and therefore it is not biased. Microglia are the brains immune defense cells which are involved in local inflammatory response, phagocytoses and can produce and secrete hydrolytic enzymes, lipid metabolites, and oxygen radicals. It has been shown that following irradiation the number of microglia increased and became activate,46,107 in addition, microglia have close functional relationships due to their ability to recruit each other and communicate through extracellular signaling. However the exact role microglia have in radiation-induced damage is unclear. Neurons are the cells in the brain that transmit and process signals through electrochemical signaling. Most likely neurons do not contribute to radiation-induced damage in the brain. Studies in vitro and in immature rats have shown that following radiation there was death of neurons through apoptosis but these results could not be
13

duplicated in adult animals. It is believed that astrocytes protect the neurons after radiation. In vivo studies have shown that the radioresistance of neurons increased in coculture with astrocytes and in astrocyte-conditioned media possibly through their ability to take up extracellular glutamate or through their catalase activity which protects against H2O2, a byproduct radiolysis of water.46 In the subependymal (SE) area of the brain there are stem cells which are the source of neurons, astrocytes, and oligodendrocytes in the brain. SE cells are able to migrate within the brain and differentiate into a variety of brain cells. The function of the SE cells has been hypothesized to be a reserve of undifferentiated cells capable of being recruited after insult to the brain. An in vivo study demonstrated that induced demyelination in a mouse resulted in SE cells migrating to the injured site and differentiating into myelin-like structures.108 Hopewell et al.109 has shown that there is a dose dependent loss of SE cells following radiation, but a cause-and-effect relationship has not been established between late effects of radiation and SE cell loss. 2.5 Thalidomide
Thalidomide is a derivative of glutamic acid which has anti-inflammatory and angiogenic activities. It inhibits the production of TNF, cycloxygenas-1 and -2, VEGF, and decreases the binding activity of nuclear factor –kappa B (NF-κB).110,111 The mechanism by which thalidomide aids in control of tumors is not known. There have been 16 clinical trials on thalidomide of which 15 were phase II and one was phase III. In a phase II trial for the treatment of recurrent glioblastoma, Groves et al. showed that the combination of temozolomide and thalidomide was safe but provided little improvement of tumor control over temozolomide alone.112 In addition, numerous studies have reported thalidomide toxicity what resulted in patient death, discontinuation of treatment, and patients dropping out of the studies. Thalidomide is a small molecule113 that can cross the BBB in therapeutic quantities and has been shown to significantly increase survival rate and decrease motor neuron cell death in transgenic mice with amyotrophic lateral sclerosis symptoms.114
In this study we have chosen thalidomide as a potential therapeutic to minimize
radiation-induced damage to the normal tissue due to its ability to reduce TNF levels which we have studied in the past using a mouse model.91 Thalidomide is widely available U.S Food and Drug Administration approved and currently in numerous phase II studies. In addition, thalidomide has the ability to cross the BBB which means it may be able to protect the brain parenchyma in addition to the vasculature from radiation induced damage (Figure 2-4).
14

Activated astrocyte
× ×
Tumor Region
Tumor Cell
Irradiated Non-Tumor Region
Irradiated and anti-TNF Treated Tumor
Region
Irradiated and anti-TNF treated Non-
Tumor Region
EC EC EC EC EC EC EC EC
Tumor Cell
Vesicles
Tumor Cell
VEGF TNF
Thalidomide
Tight junction
×
RT
Leukocyte
× ×Thalidomide
x×
× ×
RT
×
Figure 2-4. Cartoon depicting our hypothesis that the combined effect of tumor presence and radiation therapy (RT) induces an inflammatory and angiogenic environment that initiates normal tissue damage. This new environment is characterized by an increased TNF, NF-κB, and VEGF expression, leukocyte adhesion, and BBB permeability. Treatment with anti-TNF treatment (thalidomide) concomitant with RT would block the inflammation following RT leading to a reduction in the RT-induced damage to normal tissue. This could allow us to reach the maximum biologically effective RT dose.
15

CHAPTER 3. MATERIALS AND METHODS 3.1 Culture
Rat glioma cells C6 (American Type Culture Collection, Manassas, Va) were transfected to express green fluorescent protein (GFP) and obtained from Dr. Duntsch’s laboratory at the University of Tennessee, Health Science Center. Cells were monolayer cultured in 75cm2 flasks and maintained in Ham's F12K medium with 2 mM L-glutamine, supplemented with 15% Horse serum, 2.5% Fetal Bovine serum and 1% penicillin-streptomycin at 37°C in humid air containing 5% CO2. 3.2 C6 In Vitro Experiments
C6-GFP cells were plated per well at a concentration of 2x10⁵ cells in 25cm2 flasks 72 hrs prior to RT. There were five groups of cultures: control cells (underwent transportation to the irradiator), RT-only (8Gy), and RT + Thalidomide (8Gy of irradiation and 3 different concentrations 1µg/ml, 10µg/ml, and 100µg/ml of media). 3.2.1 Viability Assay
At 48, 72, and 96 hrs post treatment the cells and supernate were removed from the flask using 0.25% trypsin mixed with 1:1 ratio with trypan blue 0.4% solution and were counted 5 minutes later using a hemocytometer. 3.2.2 Cell Proliferation
At 48, 72, and 96 hrs post treatment the cells and supernate were removed from the flask using 0.25% trypsin mixed and centrifuged for 5 minutes, at 150 relative centrifugal force, 900 rotations per minute. Supernate was removed and cells resuspended in 2 mls of phosphate buffered solution and counted using a hemocytometer. 3.3 Animal Studies
Male Wistar rats 6-8 weeks were obtained from Harlan (Indianapolis, IN). Rats were anesthetized using isoflurane/oxygen mixture followed by an intraperitoneal (i.p.) or intramuscular (i.m.) injection of a ketamine and xylazine mixture (87/13mg/kg respectively) at a dose of 1ml/kg body weight (Henry Schein, Melville, NY). Female athymic CD1 nu/nu mice (8 to 10 weeks of age) were purchased from Charles River Laboratories (Wilmington, MA) for use in the study. Mice were anesthetized using isoflurane/oxygen mixture followed by an i.p. or i.m injection of a ketamine and xylazine mixture (50/50mg/kg respectively) at a dose of 1ml/kg body weight (Henry Schein,
16

Melville, NY) Animal studies were done in accordance with guidelines established by the University of Tennessee, Health Science Center Institutional Animals Care and Use Committee. 3.4 Radiation
Animals were irradiated using cesium irradiation (Mark 1 Model 25 irradiator, JL Shepard and Associates, CA) at the VA Medical Center in Memphis TN. Briefly, animals were anesthetized and then secured to a chamber that was then placed inside the irradiator. The radiation was localized to the cranial region (width of 1cm) using a model 335 collimator (JL Shepard and associates, CA) that collimated the radiation field to a 1cm band. Adequate lead shielding was used in the design of the collimator to ensure that volumes outside the radiation field received less than 3% of the prescribed dose
3.4.1 Cranial Tumor Irradiation
Animals received a hypofractionated regime of 8Gy /day for 5 days starting at 5 days post surgery for a total of 40Gy. The biological effective dose (BED) of this RT regimen is 200Gy which is 1.67x higher than a patient regimen of 60Gy, and 1.25x higher than a patient RT regimen of 80Gy(Appendix C). 3.4.2 Flank Tumor Irradiation
All mice received three daily fractions of 8Gy RT (24Gy total) delivered locally to the flank tumors using a cesium source starting at day zero i.e., when the tumors reach a size of approximately 550mm3 (usually at 11 days post-tumor implantation). A lead collimator was used to localize radiation only to the tumor and flank area.
3.4.3 C6 Cells
All cells in 25cm2 flask were transported to the VA Medical Center in Memphis TN. A stack of 3 flasks were placed at center height (middle flask) inside the irradiator on a turntable which rotated during administration of 8Gy of radiation to ensure a uniform dose within the flasks. 3.5 Thalidomide Treatment
Racemic thalidomide purchased from Sigma-Aldrich (St. Loius, MO, catalog # T144) was dissolved in DMSO (0.1mg of Thalidomide /1ul of DMSO) and was injected i.p. (100mg/kg/day) 30 minutes prior to radiation. For in vivo experiments thalidomide was diluted with DMSO (0.1mg Thalidomide /1µl of DMSO) and then further diluted
17

accordingly with DMSO until in 1µl there was 100µg, 10µg, and 1µg. Thalidomide was added to the cultures 30 minutes prior to irradiation. 3.6 Flank Tumor Inoculation
Rat C6-GFP glioma cells were prepared at a concentration of 4 x 10⁶ cells in 200μl of phosphate buffer saline and injected subcutaneously into the right flank of each mouse. The tumor volume was assessed every 3 days using skin calipers for 3 weeks using an ellipsoidal tumor volume formula, see Equation 3-1.
Volume = 0.52*(major axis)*(minor axis)2 (Equation 3-1)
Measurements were made using skin calipers 3, 6 and 9 days following the start of treatment. 3.7 Cranial Window Technique
As previously described by Gaber et al.115 animals were anesthetized and placed in a stereotaxic frame (Kopf Instruments, Tujunga, CA) with their body temperature maintained at approximately 37°C by a silicon-heating mat. The scalp and underlying soft tissue over the parietal cortex were removed bilaterally. Then a dental drill was used to create a rectangular cranial window that extends from the bregma to the lambdoid sutures and centered on the midsagittal suture. The dura mater was then punctured and excised using iris microscissors. Using cyanoacrylate glue, a glass plate was fixed to the bone surrounding the cranial window. All surgical procedures were carried out using sterile techniques. 3.8 Cranial Tumor Implantation
C6-GFP cells were implanted in the upper right hemisphere of the brain between the bregma and lambda sutures avoiding any visible vessels. C6-GFP cells were prepared prior to surgery at a concentration of 2x10⁵ cells/μL of BD Matrigel Matrix (BD Bioscience, CA) and placed on ice. A 10µL Hamilton syringe was then used to implant 1x10⁶ cells in 5µL: 2.5µl of cell mixture and/or matrigel injected at a depth of 2.5 mm, 1.25μL of the cell mixture and or/matrigel injected, at a depth of 1.5mm in the brain, and 1.25μL of cell mixture and or/matrigel, and at a depth of 0.5mm (sham implant animals had matrigel implanted). 3.9 Intravital Imaging
To visualize the cerebral microcirculation, the animals were anesthetized and then placed in the stereotaxic frame under the intravital fluorescence microscope. The
18

intravital measurement of BBB permeability was performed on days 11, 16 and 66 post implant. Leukocyte-endothelial interactions were performed on days 10, 15 and 65 post tumor implant. Images of tumor size were acquired every 5 days post-implant to 30 days. (Figure 3-1, Tables 3-1 and 3-2 for experimental design). 3.9.1 BBB Permeability Measurement
As previously published by Gaber et al.,83,115 Texas-Red dextran 3 kDa (1% solution, 0.4ml/kg) (Invitrogen # D3329) was administered intravenously and used as a permeability tracer. Images were made using an industrial-scale microscope (model MM-40, Nikon) having a digital camera (CoolSnap ES, Roper Scientific) with a 100W mercury light source. Images were analyzed using MetaMorph software (Universal Imaging Co., PA) to measure the permeability of the brain pial vessels. Two rectangular regions of interest (ROI) were chosen in the vessel (restricted to vessels 45-90µm) and in the surrounding tissue and their average intensities recorded. Our analysis method follows Wu et al.116 and Yuan et al.83 with some modifications. For slow extravasation processes, Fick’s law can be used to show that the permeability (P) and the rate of change of the tissue intensity due to dye extravasation (dIt dt) are related.83
td
IdSV
IP t
v
1= (Equation 3-2)
It is the tissue intensity, Iv is the initial fluorescence intensity in the vessel, V/S is the ratio of vessel volume to surface area.117,118 We limited our calculation of dIt/dt to the time period between 30 s and 2 min after tracer injection. During this period, the extravasation process was approximately linear, and back flux of the tracer into the plasma compartment could be ignored (Figure 3-2 and Equation 3-2).
Due to the green fluorescence of the C6 cells, the permeability tracer used was
Texas-Red dextran to avoid the florescence overlap with the tumor. One major difference between the two dyes is their wavelengths. Due to the higher wavelength of Texas-Red, about 615nm, the signal is not absorbed by the hemoglobin. As a result, unlike flourescein isothiocyanate dextran (FITC) the vasculature will stay fluorescent over a long period of time, which could possibly lead to noise in the data from the scatter associated with the fluorescent vasculature (Appendix B). 3.9.2 Leukocyte-Endothelial Cell Interactions
Rhodamine-6G (Sigma), a lipophillic positively charged molecule that selectively stains 99.9% leukocytes mitochondria within minutes of being administered, was injected i.v. (0.5% solution) (0.4mg/kg). Adhesion was measured in the same vessels used in the extravasation measurement and in the immediate surrounding vessels. A leukocyte is considered adhered if it does not move for 30seconds; this measurement is expressed as
19

0 5 6 7 8 9 10 11 15 16 65 66 Days post implant
Leukocyte Interactions
Permeability Radiation (8Gy/day)
Figure 3-1. Time line of the intravital experiments performed in vivo. Radiation treatment started on day 5 post tumor implant. Measurements of Leukocyte endothelial interactions were performed on days 10, 15 and 65 days post surgery. Permeability measurements could not be performed on the same days of leukocyte endothelial interaction because of the overlap in fluorescence of the dyes used. Therefore permeability measurements were performed on days 11, 16 and 66. Tumor surface area measurements and bright light images were on days 5, 10, 15 and every 5 days after or until no tumor was visible.
20

Table 3-1. Table showing the experimental groups and measurements performed at the early time points.
Experimental Group
Measurements Intravital Microscopy Histology
Tumor size Permeability Leukocyte
InteractionsGlial Fibrillary Acidic Protein
Vascular Endothelial
Growth Factor
Sham Implant
Tumor Implant Sham Implant +RT (40Gy)
Tumor Implant + RT (40Gy)
Tumor Implant + RT + Thalidomide (40 Gy, 100mg/kg/d prior to RT)
Table 3-2. Table showing the experimental groups and measurements performed at the late time points.
Experimental Group
Measurements Intravital Microscopy Histology
Permeability Leukocyte Interactions Glial Fibrillary
Acidic Protein
Sham Implant
Tumor Implant + RT (8Gy/day, total of 40Gy)
Tumor Implant + RT + Thalidomide (8Gy/day , total of 40 Gy) (100mg/kg/day prior to RT)
21

Figure 3-2. A collage showing the process of our intravital microscopy BBB permeability measurement. (A) Picture of a rat with cranial window secured in a stereotaxic frame, (B) the image as seen through the cranial window (large white mass is the fluorescent tumor), (C) The vasculature following injection of a fluorescent dye, and (D) the average intensity over time measured in the tissue and venule.
22

the number of adhered leukocytes per 100µm of vessel length.115 Leukocyte rolling was also performed in these vessels. Any leukocytes that is rolling within the 100µm of vessel length was counted. 3.9.3 Tumor Size (Surface Area and Volume)
Images of the animal’s cranial window were acquired using a 1.3x objective and GFP fluorescence filter set of the animal’s cranial window at a set exposure of 100ms. A threshold was then applied that was 150 intensity units above the average background. The area was calculated from the pixels within the threshold limit and in the tumor area. This technique was used for in vivo measurements through the cranial window and also for the ex vivo measurements of tumor dimensions used to estimate volume using ellipsoidal tumor volume formula (Equation 3-1).
3.9.4 Permeability Kinetics Measurement
Rats were injected with Texas-Red dextran 3 kDa (1% solution, 0.4ml/kg). Images were acquired using a 1.3x objective and a Texas-Red filter set at an exposure of 100ms. Images were acquired at 5, 10, 15, and 20 minutes post dye injection. ROI were drawn in tissue regions of interest (normal, peritumoral, and tumor tissue) and the average intensity recorded. The average intensities were normalized to their 5 minute value to account for differences in dye injection, light intensity, and vascular density. 3.10 Tissue Extraction
Animals were anesthetized, and 0.1ml of heparin (1000 USP units/ml, H3393, Sigma) was injected intracardially. Animals were then perfused with saline through the left ventricle of the heart after the inferior vena cava was severed. Once the blood ran clear and liver had turned from red to yellow/pink, the brain was extracted and coronally sectioned through the tumor/implantation site. Brain halves were then either snap frozen in OTC using liquid nitrogen and stored at -80ºC or placed in formalin and paraffin embedded. 3.11 Immunofluorescence Staining
Frozen brains were sectioned (10µm) using a cryostat and mounted on poly-1-lyisne-coated glass slide. Slides will be fixed in 95% alcohol for 2.5minutes and then washed in distilled water. Slides were then washed 3x for 5minutes in phosphate buffered solution.
23

3.11.1 VEGF Immunofluorescence Staining
After preparation, slides were incubated with 10% normal goat serum (sc-2043) for 40minutes and then incubated with mouse anti-rat VEGF antibody (sc-7269, Santa Cruz Biotechnology, CA) (1:50 dilution ) for one hour. Finally slides were incubated with Texas-Red-labeled goat anti-mouse IgG (sc-2980, Santa Cruz Biotechnology, CA) (1:400) for 45 minutes. Slides were then imaged with Leica microscopescope. 3.11.2 Glial Fibrillary Acidic Protein (GFAP) Staining
Paraffin embedded tissue was sectioned at 4µm and mounted on a poly-1-lyisne-coated glass slide. Slides were stained with rabbit anti-human glial fibrillary acidic protein (GFAP, cat # Z0334) and rabbit immunoglobulins (negative control, cat # X0903) purchased from DAKO (Carpinteria, CA). The secondary antibody for GFAP, biotinylated goat anti-rabbit, was purchased from Vector (cat # BA-1000, Burlingame, CA) and used at a 1:200 dilution. Immunohistochemistry assays were performed on the DAKO autostainer at room temperature. Light microscopic images were captured using a Nikon E800 Scope. The number of GFAP-stained astrocytes was counted in five fields at 200x magnification in the cerebral cortex overlying the hippocampus. Reactive astrocytes, identifiable by their star-like shape, were then manually counted and averaged per animal on days 15 and 66 post implant (Figure 3-3).
3.12 Statistics
Statistical analyses were conducted using SigmaStat software (SPSS Science, Chicago, IL). The change due to treatments , tumor, RT, Tumor + RT, Tumor + RT + peritumoral, compared to sham implant was determined by analysis of variance (ANOVA and Dunnett’s test), and a multiple comparison procedure (Tukey’s test) was used to discriminate among the means between groups. Data are presented as mean±SEM, and differences between the means were considered to be statistically significant at a probability of P<0.05.
24
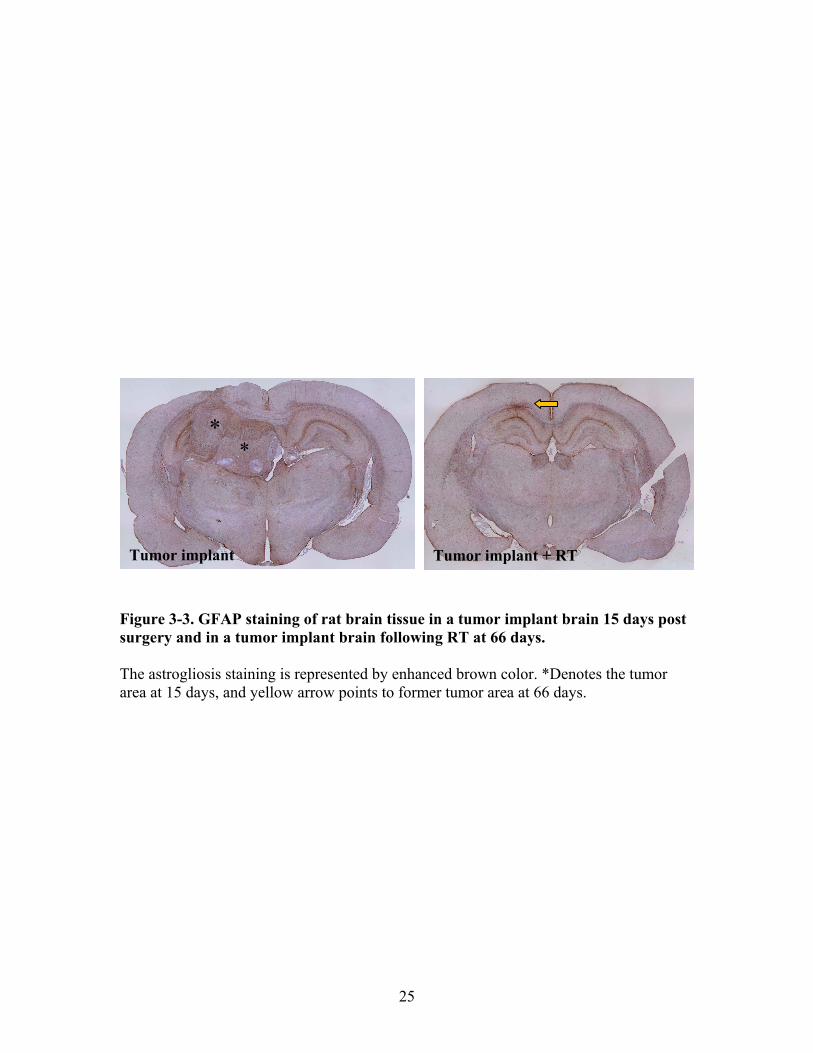
**
Tumor implant + RT Tumor implant
Figure 3-3. GFAP staining of rat brain tissue in a tumor implant brain 15 days post surgery and in a tumor implant brain following RT at 66 days. The astrogliosis staining is represented by enhanced brown color. *Denotes the tumor area at 15 days, and yellow arrow points to former tumor area at 66 days.
25

CHAPTER 4. RESULTS
Radiation initiates an inflammatory signaling cascade that is linked to early and late radiation sequela. Understanding the initiating events, especially those involving damage to the microvasculature is an important first step in any study designed to mitigate early and late effects of this treatment. While most normal tissue damage studies are carried out in irradiated normal animals, we propose a novel approach by using an animal brain glioma tumor model to ensure the attribution of tumor effects and improve the clinical relevance of our research. Tumorigenesis and progression is a complicated process that subverts normal homeostasis imposing new conditions favorable to tumor cell growth. In tumors, angiogenic processes, including those mediated through the secretion of VEGF, are initiated to expand the microvascular infrastructure or “network” and to provide support to the rapidly proliferating and very often densely cellular tumor. Part of the subversion process has been shown to involve the creation of an inflammatory milieu through the secretion of inflammatory molecules. This changing milieu is known to be active at the periphery of the tumor creating an angiogenic/inflammatory microenvironment which damages the microvasculature. The end result is a permeable BBB which deprives the brain of its protective barrier. The studies designed in the current work are unique in their use of a realistic rodent radiation toxicity model that includes the combined effects of tumor presence and irradiation on non-tumor (normal) microvasculature and tissue. This unique model has allowed us to study the long term effects of fractionated radiation and brain tumor presence on the tissue. 4.1 Model Characterization
We used a set of measurements to characterize our C6 glioma in situ rat tumor model. First, we used animal survival which is an indicator of the growth of the tumor. In addition, the weights of the animals were monitored every 5 days which can also be an indicator of tumor growth due to the drop in weight that occurs following the onset of tumor symptoms. Secondly, we used intravital microscopy to measure the surface area of the tumor to follow the progression of the tumor and correlate the surface area of the tumor with the ex-vivo size of the tumor following sacrifice. Thirdly we have performed staining for GFAP to indicate the degree of astrogliosis in the brain.
4.1.1 Animal Survival
Animal survival, an indicator of tumor growth, was measured over 30 days following surgery. The criterion for euthanasia of animals was set at loss of more than 10% of body weight. In the tumor only group, animals either died or satisfied the euthanasia criterion starting at 15 days post tumor implant. 78% of animals were euthanized by day 25 and 22% of the rats lived to 30 days (n=18), (Figure 4-1).
26

Days post surgery
0 5 10 15 20 25 30 35
Per
cent
Sur
viav
al
0
20
40
60
80
100
120
Tumor only
Figure 4-1. Percent survival of rats with brain tumor implants that received no treatment. By 30 days, post tumor implant, only 22% of rats that did not receive any treatment were alive. This graph represents data collected from n=18 rats.
27

4.1.2 Animal Weight
Animal weight was measured to indicate when the burden of the tumor became symptomatic in the animal. There was difference in the rate of the percent weight change between the two groups. At day 20, the sham implant group percent change in weight was significantly different when compared within the group versus the tumor implant group which was not significantly different until day 25 (P<0.05) (Figure 4-2). 4.1.3 Tumor Surface Area
Tumor surface area was measured through the cranial window every 5 days post implant. In the tumor implant group there was two distinct groups of animals: one group which succumbed to the tumor burden and another in which the tumor regressed over time. Even though there were two distinct patterns of growth there was no significant difference at 10,15,or 20 days post implant (P=0.85, P=0.54, P=0.34 respectively), between the two groups (Figure 4-3). The rate of tumor growth between day 5 to 15 was also compared between the two groups, and there was no significant difference (P=0.54) between the two growth rates (Figure A-3). 4.1.4 Correlation between Tumor Surface Area, Cross Sectional Area, and Tumor Volume
Tumor surface area was measured on the surface of the brain and correlated with the cross sectional surface area of the tumor, which revealed a R2 of 0.38 (P=0.055) (Figure 4-4A). Using the major and minor axis lengths of the tumor, measured from the cross section, tumor volume was estimated using the formula for a ellipsoid volume and correlated with the tumor surface area which produced an R2 of 0.548 (P<0.05) which is indicative of a medium correlations (Figure 4-4B).
4.1.5 Astrogliosis in the Tumor Model
Astrogliosis, indicative of inflamed astrocytes, was quantified from tissue cross sections of the brains with intact tumors and compared to sham tissue. However, since glioma is an astrocytic neoplasm which demonstrates several gross pathological features that are in common with astrogliosis, studying astrogliosis requires special care in choosing the studied region (Figure 3-3). Three distinct regions were chosen for our studies: first non-tumor cortex region contralateral to the tumor, second a primary-peritumoral region 200µm from the edge of the tumor (defined by dense cellular mass) and a secondary-peritumoral region 500µm from the edge of the tumor. Two peritumoral regions were chosen to account for the uncertainty in delineating the edge of the tumor, given the astrocytic nature of the tumor cells. The number of inflamed astrocytes, defined by staining with GFAP, was counted in all three regions at 15 days post implant. A significant difference in the number of inflamed astrocytes was found in the non-tumor
28

-10
0
10
20
30
40
50
60
0 5 10 15 20 25 30
Cha
nge i
n w
eigh
t (pe
rcen
t)
Days post surgery
Sham implant
Tumor implant
Figure 4-2. Percent changes in animal weight over time in sham and tumor implant animals. The percent weight change in the tumor-implant group is higher than that observed in the sham-implant group at 30 days. However, note that this weight increase might be skewed by the fact that it is a mean of the weights of the few animals (22%, survived) that survived to 30 days. (n=19 for sham implant P<0.05, n=12 for tumor implant at day 0 P<0.05, mean±SEM is shown) Arrows indicate when percent weight change became significantly different compared to day 0 (Dunnett’s test).
29

Figure 4-3. The difference in normalized tumor surface area within the tumor implant group. Within the tumor-only group there are two patterns of growths either the tumor continually grows until the animal has to be sacrificed due to side effects (78% of animals) or after 15 days the tumor begins to decline in size and the animal does not present tumor induced symptoms (22% of animals). Note that there is no significant difference between either group from 5 to 20 days. Images of the surface of the tumors were acquired through the cranial window using our intravital microscope every 5 days post surgery. A threshold was applied to the images relative to the background intensity. The cells have been transfected with GFP therefore they are fluorescent, and surface area of the tumor was calculated. (n=13 (terminal), n=4 (regressed), mean±SEM is shown).
30

y = 0.540x - 2.177R² = 0.384
0
5
10
15
20
25
30
0 10 20 30 40 5
(A)
0on th
e su
rfac
e of
the
brai
n
Surface area (mm2) of tumor cross-section
Surf
ace
area
(mm
2 ) o
f tum
or
y = 0.117x + 0.283R² = 0.548
0
5
10
15
20
25
30
0 50 100 150 200Surf
ace
area
(mm
2 ) o
f tum
or
on th
e su
rfac
e of
the
brai
n
Tumor volume (mm3)
(B)
Figure 4-4. Correlations between in vivo tumor surface area acquired using intravital imaging, and (A) cross sectional surface area acquired histologically, and (B) estimated tumor volume from histological samples. We measured a medium correlation between our in vivo imaging and tumor area and volume estimated histologically. This lends support to our model and to the use of intravital surface area measurements to follow tumor progression and effect of treatment. (n=10, P=0.055 (A) and P<0.05 (B)).
31

tissue contralateral to the tumor (33.13±0.71 astrocytes/ROI, P<0.05), and at 500µm from the tumor edge there were (32.08±0.85 astrocytes/ROI, P<0.05) when compared to sham tissue (28.5±0.79 astrocytes/ROI )(Figure 4-5).
4.2 Early Effects of Tumor Presence and Radiotherapy
We used numerous methods to study the combined effect of tumor presence and radiotherapy on the brain. We once again measured animal survival and weight to establish the health of the animal. In addition, in vivo measurements of BBB permeability, leukocyte-endothelial interactions, and tumor surface area using intravital microscopy were performed. Also tissue from brains underwent immunohistochemisty staining for VEGF protein and GFAP. 4.2.1 Animal Survival Post RT
Without any treatment, 78% of tumor implant animals succumbed to the tumor burden by 25 days post surgery. Following cranial irradiation (8Gy/day from day 5 to 9, for a total of 40Gy) there was a drastic change in animal survival: 100% of animals which received RT survived to 30 days (Figure 4-6). 4.2.2 Weight Change within the Four Experimental Groups
Weights of the animals were measured every 5 days post surgery in the 4 experimental groups: Sham implant, Tumor implant, Sham implant + RT, and Tumor implant + RT. At 30 days only the Sham implant + RT group (20.88±1.3 % change in weight) had significantly lower weight then the Sham implant groups(31.81±3.1 % change in weight, P<0.05). The weight in the Tumor implant group (49.03±1.45 % change in weight) was higher than all other experimental groups, but it is only significantly higher than the Sham implant + RT group (P<0.001) (This may be due to the limited number of animals at that time point) (see Figure 4-7). To determine at which time point within each group it became significantly different than day 5 Dunnett’s test was run. For all groups, except for tumor implant, they became significantly different on day 20 and Tumor implant became significant on day 25 (P<0.05) (Figure 4-7).
4.2.3 Change in Tumor Surface Area Post RT
Following treatment with RT (8Gy/day from day 5 to 9, for a total of 40Gy), there was a significant change in tumor surface area at 10, 15, and 20 days in the Tumor implant + RT group (3.81±0.34, P<0.05, 2.37±0.69, P<0.001, 1.40±0.85, P<0.05 respectively) compared to the Tumor implant group (6.46±0.79, 11.63±0.89, 11.26±2.76 respectively). (n=7 for Tumor implant + RT, n=14 day 15 and n=9 day 20 for Tumor
32

0
10
20
30
40
# of
ast
rocy
tes
15 Days post surgery
Sham implant
Tumor implant (contralateral side)
Peritumoral (200um)
Peritumoral (500um)
* *
Figure 4-5. The number of activated astrocytes. Astrogliosis found in three different regions of interest: contralateral to the tumor, at 200µm and 500μm from the tumor. There was a significant increase in the number of activated astrocytes contralateral to the tumor and at a distance of 500μm from the tumor (n=3, *P<0.05 compared to sham implant using Dunnett’s test, mean±SEM are shown).
33

Days post surgery
0 5 10 15 20 25 30 35
Per
cent
Sur
viav
al
0
20
40
60
80
100
120
Tumor implant
Tumor implant+ RT
Figure 4-6. Percent survival of rats with brain tumor-implants with and without radiation treatment. By 30 days post tumor implant, only 22% of the rats which did not receive any treatment were alive. Rats that received RT had a 100% survival at the 30 days time mark. These animals also survived to 65 days (data not shown). Total number of animals in these studies were; n=18 for the tumor-implant only group and n=8 for the Tumor implant + RT group.
34

-10
0
10
20
30
40
50
60
0 5 10 15 20 25 30
Cha
nge i
n w
eigh
t (pe
rcen
t)
Days post surgery
Sham implantTumor implantSham implant + RTTumor implant + RT
*
Figure 4-7. Percent weight change measured in the four experimental animal groups; sham implant, tumor implant, sham implant + RT, and tumor implant + RT. The percent weight change in the tumor-implant group is higher than that observed in the sham-implant group at 30 days. However, note that this is weight increase might be skewed by the fact that it is a mean of the weights of the few animals (22%) that survived to 30 days. Arrows indicate when percent weight change became significantly different compared to day 0 within the group (Dunnett’s Test). For Sham implant, Sham implant +RT, and Tumor implant + RT it was at 20 days, and Tumor implant followed day 25. At 30 days only the Sham implant + RT group (20.88±1.3% change in weight) was significantly different than all other groups (*P<0.05 vs. all other groups) (n=19 sham implant, n=12 tumor implant, n=15 Sham implant + RT, and n=26 Tumor implant + RT at day 0, mean±SEM is shown).
35

implant group. On day 30 following implant there was no detectable tumor presence on the surface of the brain in the Tumor + RT group (Figure 4-8). 4.2.4 BBB Permeability Changes in the Peritumoral Region
Following the administration of RT (8gy/day from day 5 to 9, total of 40Gy), there was no significant increase in BBB permeability at 11 days post surgery compared to the sham implanted animals. However, at 16 days post-surgery there was significant change in permeability in all groups when compared to Sham implant (27.46±1.17 x10⁻⁷ cm/s; Peritumoral 31.75±0.85 x10⁻⁷ cm/s, P<0.05), Sham implant + RT (34.97±1.02 x10⁻⁷ cm/s P<0.001, and Peritumoral + RT 36.74±1.88 x10⁻⁷ cm/s, P<0.001) (Figure 4-9). 4.2.5 Adhered Leukocytes in the Brain Vasculature Following Tumor Implant and RT
Adhered leukocytes were counted in the brain vasculature at 10 and 15 days following surgery. Measurements were limited to venules with diameters between 45-90μm. Number of adhered leukocytes per 100μm of vessel length was found to be significantly higher in the Peritumoral + RT group (1.27±0.46 adhered leukocytes, P<0.05) vasculature at 10 days compared to Sham implant (0.53±0.21 adhered leukocytes). At 15days post surgery there was no significant change in the number of adhered leukocytes compared to the Sham implant group (Figure 4-10A). 4.2.6 Rolling Leukocytes in the Brain Vasculature Following Tumor Implant and RT
Rolling leukocytes were counted at the same time as adhered leukocytes in the same vasculature. Following RT at 10 days post surgery, there was a significant increase in rolling leukocytes in the Sham implant + RT group (8.00±0.93, P<0.001) compared to the Sham implant group 2.73±0.54. In addition, at 10 days the RT-only group had a significantly higher number of rolling leukocytes than the peritumoral group (3.17±0.55, P<0.001). At 15 days post surgery the same pattern was observed. The Sham implant + RT group (7.76±0.41) was higher than the Sham implant group (2.23±0.18 P<0.001) and peritumoral group (1.46±0.46, P<0.001). The Sham implant + RT group also had significantly higher rolling leukocyte than the Peritumoral + RT group (P<0.05). The Peritumoral + RT group also had significantly higher number of rolling leukocytes at 15 days than the Peritumoral group (P<0.01) (Figure 4-10B).
4.2.7 Astrogliosis Following Tumor Implantation and Radiation
Following tumor implantation and RT (38.05±1.45 # of astrocytes/ROI), the degree of astrogliosis was significantly higher than all other groups: Sham implant (28.53±0.79, P<0.001), Tumor implant contralateral to the tumor (33.13±0.72, P<0.05),
36

0
5
10
15
5 10 15 20 25 30
Nor
mal
ized
tum
or su
rfac
e ar
ea
Days post surgery
Tumor implant
Tumor implant + RT
*
***
Figure 4-8. Normalized tumor surface area measured using intravital imaging. Normalized tumor surface area as seen through the cranial window at 5 day intervals post surgery in Tumor implant and Tumor implant + RT groups. By 30 days the tumor had regressed in the Tumor implant + RT group and was not visible on the surface of the brain (*P<0.05, **P<0.001, compared to tumor implant student t-test ) (n=17 Tumor implant, n=7 Tumor implant + RT, mean±SEM are shown).
37

0
10
20
30
40
50
11 16
Perm
eabi
lity
( x 1
0-7 cm
/s)
Days post surgery
Sham implantPeritumoral Sham implant + RT Peritumoral + RT
** **
*
Figure 4-9. Changes in BBB permeability following tumor implant and radiotherapy. We measured a significant increase in BBB permeability at 16 days post surgery for the Tumor-implant, Sham implant + RT, and in the Tumor implant + RT groups compared to Sham implant group. The combination of tumor presence and RT resulted in higher BBB permeability than tumor presence or RT alone (n≥5 for all groups, **P<0.001, *P<0.05 Dunnett’s test compared to sham implant, mean±SEM is shown).
38

0
2
4
6
8
10
10 15# of
rolli
ng le
ukoc
ytes
per
100
µm o
f ve
ssel
len
gth
Days post surgery
## **
(B)
(A)
#
## **
*
Figure 4-10. The effect of tumor growth and radiation on leukocyte-endothelial cell interactions in non-tumor vessels. (A) Number of adhered leukocytes per 100μm of vessel length was significantly higher in the Peritumoral + RT vasculature at 10 days compared to sham implant. (B) Number of rolling leukocytes per 100μm of vessel length at 10 and 15 days. Sham implant + RT and Peritumoral + RT was significantly higher than sham-implant (*P<0.05 vs. sham-implant, **P<0.001 compared to sham implant, #P <0.05 and ##P<0.001 compared to Tumor implant, Tukey’s Test, mean±SEM is shown).
39
and Tumor implant at a distance of 500μm away from the tumor (32.08±0.85, P<0.05) (Figures 4-11, 4-12 and 3-3). 4.2.8 VEGF Immunoflourescence Staining
Brains were extracted at 10 and 15 days following tumor implant in animals with and without RT and coronally sectioned at the tumor location. Tissue sections were then stained for VEGF and images acquired in three different regions: tumor middle, peritumoral, and contralateral to the tumor location (refer to Figure 4-13). At 10 and 15 days following tumor implant, there is more VEGF located in the peritumoral region then the normal tissue. In addition the tumor middle also is expressing VEGF. After RT, intensity of VEGF increased in the peritumoral and tumor tissue at 10 days. Due to the decrease in tumor size following RT, it was difficult to locate the tumor at 15 days following RT therefore no images of the peritumoral tissue could be taken (Figure 4-13).
4.3 Late Effects of Tumor Presence and Radiotherapy
One of the long term objectives of our work is to test the hypothesis that RT-induces an acute response that results in a chronic inflammatory microenvironment leading to the amplification of radiation sequela. Having established a novel brain tumor-radiation model to study side effects of radiotherapy and used this model, in the previous section, to characterize the acute effects of radiation, we proceed to studying the long-term effect of radiation. In this section we will present the results of our studies on the long-term effect of radiation on BBB permeability, leukocyte adhesion, and astrogliosis using intravital imaging and histological analysis. 4.3.1 Radiation-Induced Late Effects on BBB Permeability
Intravital microscopy was performed at 66 days following surgery in tumor implanted animals which had undergone RT and sham implanted animals. At 66 days post RT, there was still significant difference in BBB permeability in the Peritumoral + RT (34.88±0.39 x10⁻⁷ cm/s) compared to sham (30.79±0.83 x10⁻⁷ cm/s, P<0.05) (Figure 4-14).
4.3.2 Radiation-Induced Late Effects on Leukocyte Adhesion
Leukocyte adhesion was measured in the same vascular bed as the BBB permeability measurement at 65 days post surgery in tumor implanted animals which had undergone RT and sham implanted animals. Unlike the BBB permeability the degree of leukocyte adhesion was not significantly different between the peritumoral + RT group and sham implant group (P=0.38) (Figure 4-15A).
40

0
10
20
30
40
15
# of
ast
rocy
tes/
RO
I
Days post surgery
Sham implantTumor implant (contralateral side)Peritumoral (500um)Tumor implant + RT
# $ **
Figure 4-11. The number of reactive astrocytes following tumor implant and RT. Following tumor implantation and RT, the degree of astrogliosis was significantly higher than all other groups; Sham implant, Tumor implant contralateral to the tumor, and Tumor implant at a distance of 500μm away from the tumor (n=3,**P<0.001 compared to sham, # P<0.05 compared to Tumor implant (contralateral), $P<0.05 compared to Peritumoral, Tuckey’s test, mean±SEM are shown).
41

Tumor implant Peritumoral (200μm) Peritumoral (500μm)
Sham implant Tumor implant + RTTumor
Figure 4-12. Images of GFAP stained rat brain tissue in sham implant, tumor implant + RT, and tumor implanted animals. There is an increase in the number of reactive astrocytes in the tumor implant with and without RT. Note the intensity of staining in the middle of the tumor due to the C6 cells being an astrocytic neoplasm (the star shaped brown colored cells are the reactive astrocytes) (n=3).
42

Contralateral to tumor Peritumoral Tumor (middle)
10 Days
Tumor
Tumor+ RT
Figure 4-13. Immuflourescence staining of VEGF at 10 and 15 days in tumor implant and tumor implant + RT animals. Images of coronally sectioned brain tissue at 10 and 15 days post implant with and without RT (400x magnification VEGF= red, C6-GFP cells=green, cell nuclei=blue).
43

Contralateral to tumor Peritumoral Tumor (middle)
44
15
Tumor+RT
Tumor
D a y s Figure 4-13 (continued).
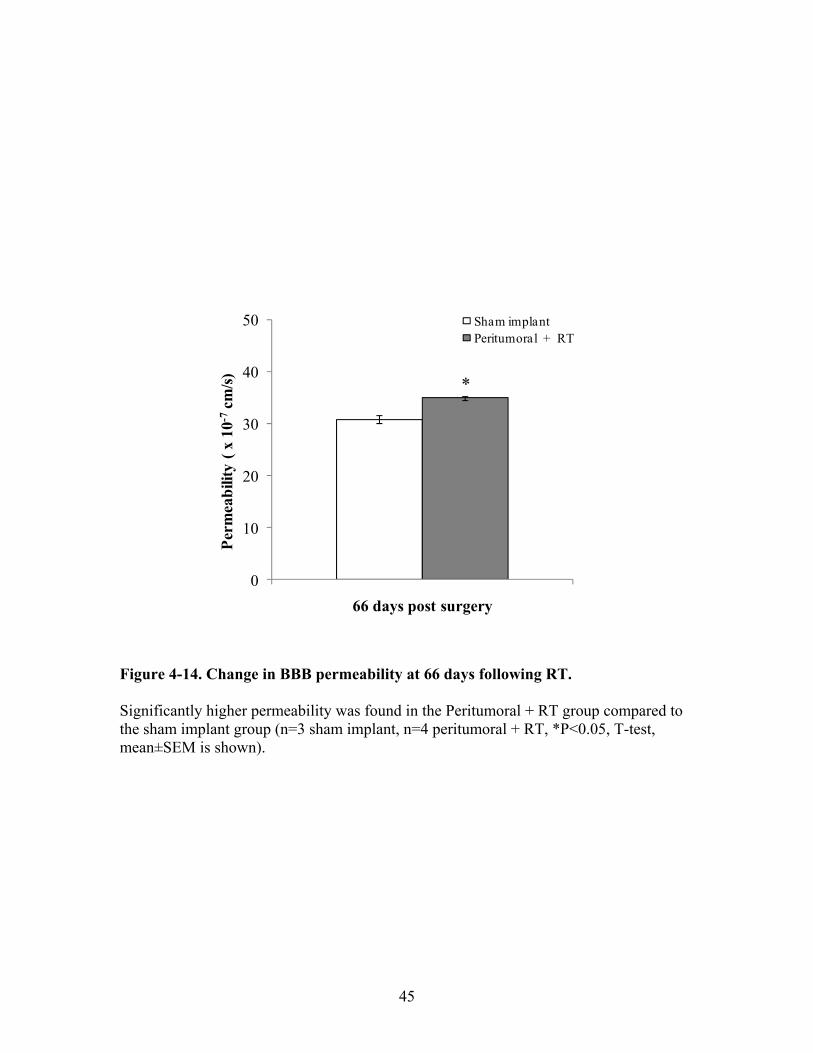
0
10
20
30
40
50
Perm
eabi
lity
( x 1
0-7cm
/s)
66 days post surgery
Sham implantPeritumoral + RT
*
Figure 4-14. Change in BBB permeability at 66 days following RT. Significantly higher permeability was found in the Peritumoral + RT group compared to the sham implant group (n=3 sham implant, n=4 peritumoral + RT, *P<0.05, T-test, mean±SEM is shown).
45

0
0.5
1
# of
adh
ered
leuk
ocyt
es p
er10
0µm
of
ves
sel l
engt
h
65 days post surgery
Sham implantPeritumoral + RT
0
2
4
6
# of
rolli
ng le
ukoc
ytes
per
100
µm
of v
esse
l len
gth
65 days post surgery
(A)
(B)
Figure 4-15. Quantification of the leukocyte-endothelial interactions at 65 days post-surgery. There was no significant difference in the number of (A) adhered and (B) rolling leukocytes between the Sham implant and Peritumoral + RT groups (n=3 sham implant, n=4 peritumoral + RT, mean±SEM is shown).
46

4.3.3 Radiation-Induced Late Effects on Leukocyte Rolling
Leukocyte rolling was quantified at 65 days post surgery in tumor implanted animals which had undergone RT and sham implanted animals. Similar to leukocyte adhesion the degree of leukocyte rolling was not significantly different between the peritumoral + RT group and sham implant group (P=0.62) (Figure 4-15B).
4.3.4 Radiation-Induced Late Effects on Astrocytes
Reactive astrocytes were stained in brain tissue from sham implant and post tumor implant + RT animals at 66 days post surgery. Sections were then imaged and the number of reactive astrocyte quantified. At 66 days post RT in tumor implant animals (29.0±2.28 astrocytes/ROI) there was a significant increase in the number of reactive astrocytes (astrogliosis) compared to sham implanted animals (20.8±2.28 astrocytes/ROI, P<0.05), (Figure 4-16). 4.4 The Use of Thalidomide to Minimize RT-Induced Damage
One of the main goals of our research had been to find potential therapeutics that could be used to minimize the effects of RT-induced damage to the normal tissue. The model we have created is ideal to test potential therapeutics because it has the ability to observe the effect of the treatment and ensures that it does not reduce the efficacy of RT on the tumor. In this section we will present the results of our studies on the early and long-term effect of thalidomide treatment given concomitantly with RT in our brain tumor model on BBB permeability, leukocyte adhesion, and astrogliosis using intravital imaging and histological analysis 4.4.1 Animal Survival
Animal survival, an indicator of tumor growth, was measured over 30 days following surgery. Unlike the tumor implanted group, the Tumor implant + RT + Thalidomide, 100% of animals lived to 30 days and were followed to 65 days post surgery without incident similar to the that of the Tumor implant + RT group (Figure 4-17). To see survival depicted as animal numbers see Figure A-1. 4.4.2 Percent Change in Weight over Time
The weight change in animals was monitored post surgery every 5 days to monitor for symptoms of tumor burden. The animals gained weight to day 5 and then lost to day 10 due to effects of anesthesia and repeated RT. The thalidomide treated animals (10.01±1.23% change in weight) lost more weight than the Sham implant group (2.95±1.9% change in weight, P<0.001) and Tumor implant + RT group (-1.80±1.28
47

0
5
10
15
20
25
30
35
# of
act
ivat
ed a
stro
cyte
s / R
OI
66 days post surgery
Sham implantTumor implant + RT
*
Figure 4-16. The late effect of RT and tumor presence on astrogliosis. At 66 days following surgery in tumor implanted rats which had undergone RT there was a significant increase in the number of reactive astrocytes compared to sham implant animals (n=3, *P<0.05, mean±SEM is shown).
48

Days post surgery
0 5 10 15 20 25 30 35
Per
cent
Sur
viav
al
0
20
40
60
80
100
120
Tumor implant Tumor implant + RT Tumor implant+ RT + Thalidomide
Figure 4-17. Percent survival of rats with brain tumors with and without treatment. By 30 days only 22% of rats were alive who did not receive any treatment. Rats who received RT with and without thalidomide treatment had a 100% survival to 30 days which was followed to 65 days (data not shown) without any deaths.
49

change in weight, P<0.001) which may credited to the lethargy thalidomide induces and combined effect of anesthesia. After day 10 animals proceeded to gain weight up to day 65 post surgery (Figure 4-18). 4.4.3 Comparison of the Growth Kinetics between Experimental Groups
Radiation significantly altered the growth pattern of C6 tumors in rats at 15 and 20 post-implant compared to the tumor implant group leading to regression of the tumor in all animals which underwent treatment(P<0.001, and P<0.05 respectively). However, when the combination of RT and thalidomide were used concomitantly it significantly altered the growth of the C6 tumors causing it to closely mimic the growth pattern of the Tumor-only group. In addition the RT + Thalidomide (7.24±1.25 normalized tumor surface area) group had significantly different tumor growth at 15 days compared to RT only (2.37±0.69 normalized tumor surface area, P<0.05) (Figure 4-19). Even with a significant change the growth kinetics the tumors in the RT + Thalidomide group also regressed over 30 days. 4.4.4 Ex Vivo Tumor Volume Estimation
After animal sacrifice brains, were excised and sectioned into half at the tumor site. Intravital microscopy was then used to measure the axis of the tumor which was then applied to a formula to calculate ellipsoid tumor volume. Unlike the surface area measurement, no significant difference could be determined among the groups (Figure 4-20). In appendix A the corresponding graph of cross sectional area is available (Figure A-4).
4.4.5 Tumor Growth in Immunocompromised Mice Following Treatment
Following treatment, both RT-only and RT + Thalidomide tumors were measured every 3 days following treatment and compared to control tumors. At 3 and 6 days following treatment the RT-only group (0.87±0.12 and 0.15±0.15) had significantly different tumor size compared to control (1.48±0.15 and 2.72±0.27, P<0.05) (comparison at 9 days not possible because control animals were sacrificed due to tumor size). At 6 days the RT + Thalidomide group (1.65±0.14 normalized tumor volume) was also significantly different from the control values (P<0.05). In addition at 9 days following treatment the RT + Thalidomide group (2.46±0.24) had a significantly higher normalized tumor volume than the RT-only group (1.46±0.23, P<0.05) (Figure 4-21).
4.4.6 In Vitro Testing of Thalidomide Treatment
To investigate further the ability of thalidomide to protect during RT we performed an in vitro experiment in which C6 cells were irradiated with 8Gy with and
50

Figure 4-18. Percent weight change over time in three experimental groups; sham implant, tumor implant + RT, tumor implant + RT + thalidomide. The weight change in animals was monitored post surgery every 5 days. The animals gained weight to day 5 and then lost to day 10 due to effects of anesthesia. Note the large decrease in animal weight in the animal treated with thalidomide (P<0.05) which may be due to the lethargy thalidomide induces and combined effect of anesthesia. After day 10 animals proceeded to gain weight up to day 65 post surgery (n=19 Sham implant, n=26 Tumor implant + RT at day 0, n=14 Tumor implant + RT + Thalidomide, arrows indicate when P<0.05 within the group, Dunnett’s test, mean±SEM is shown).
51

***
#
*
Figure 4-19. The difference in normalized tumor surface area between treatment groups using our cranial window technique. Graph showing the difference in tumor surface area between the groups; Tumor implant, Tumor implant + RT (40 Gy total) and Tumor implant + RT (40Gy total) + Thalidomide (100mg/kg). Images of the surface of the tumors were acquired through the cranial window using our intravital microscope every 5 days post surgery. A threshold was applied to the images relative to the background intensity, the cells have been transfected with GFP therefore they are fluorescent, and surface area of the tumor was calculated. (n=17 Tumor implant, n=7 Tumor implant + RT, n=7 Tumor implant + RT+ Thalidomide, *P<0.05 compared to Tumor-only, **P<0.001 compared to Tumor implant, #P<0.05 compared to Tumor + RT +Thalidomide, Tuckey’s test, mean±SEM is shown).
52

0
20
40
60
80
100
120
140
10 15
Tum
or v
olum
e (m
m3 )
Days post surgery
Tumor implant
Tumor implant + RT
Tumor implant + RT + Thalidomide
Figure 4-20. Ex vivo estimated tumor volume in tumor implant, tumor implant + RT, and tumor implant + RT + thalidomide animals. After animal sacrifice brains were excised and the tumor sectioned and imaged. The axis of the tumor were measured and applied to a formula to calculate ellipsoid tumor volume. No significant difference was found between the groups; Tumor implant, Tumor implant + RT, and Tumor implant + RT + Thalidomide. (n≥3 for all groups, Dunnett’s test, mean±SEM is shown).
53

0
1
2
3
0 3 6 9
Nor
mal
ized
tum
or v
olum
e
Days post start of treatment
Control
RT only
RT + Thalidomide
#
*
*
*
Figure 4-21. Normalized tumor growth of flank tumors in immunocompromised mice following treatment. Mice had C6 cell injected into the right flank. When the tumor reached ≈550mm3, treatment was started as either RT-only or RT + Thalidomide. Tumors were measured using calipers every 3 days post start of treatment. The group of animals treated with thalidomide had significantly larger tumor volume at day 9 post treatment (P<0.05). (n=5 Control, n=11 RT only + RT, n=4 RT + Thalidomide, *P<0.05 compared to Control, #P<0.05 compared RT only, Tuckey’s test, mean±SEM is shown).
54

without thalidomide treatment (1ug/ml, 10ug/ml and 100ug/ml of media). To establish if thalidomide protect the cells from RT damage we measured the number of dead cells using a trypan blue assay and also counted the number of cells at each time point. No protective effects were identified because all samples irradiated with thalidomide treatment were significantly different from control cells but not from RT-only cells (Figure 4-22). 4.4.7 BBB Permeability Following Treatment with Thalidomide
Using intravital microscopy, BBB permeability was measured in 5 experimental groups over time: Sham implant, Peritumoral, Sham implant + RT, Peritumoral + RT, Peritumoral + RT + Thalidomide. At 11 days none of the groups was significantly different P=0.466. By day 16 Sham implant + RT (34.97±1.03 x10⁻⁷ cm/s, P<0.001), Peritumoral + RT (x10-7 cm/s 35.59±1.5, P<0.001) and Peritumoral + RT + Thalidomide (33.53±1.3, P<0.05) were significantly different from the sham implant (27.46±1.17 x10⁻⁷ cm/s). In addition at 66 days Peritumoral + RT (34.88±0.39 x10⁻⁷ cm/s, P<0.05) and Peritumoral + RT + Thalidomide (36.037±0.79 x10⁻⁷ cm/s, P<0.05) were still significantly different the sham implant (Figure 4-23).
4.4.8 New Method of Measuring Permeability in Tissue
The current method of measuring permeability restricts us to a small area of vascular bed due to the requirement of needing a high magnification to visualize the tissue. As a side project, we have tried measuring permeability at a low magnification over the period of 20 minutes to see if we would be able to detect change in the permeability of the tissue. We performed this measurement in tumor tissue or the equivalent because technically the tumor tissue should be the most permeable, so we would expect the best chance of seeing a change. To measure changes in permeability in the tumor region (or the equivalent in sham groups), we injected Texas-Red dye and measured the intensity of the tissue at 5, 10, 15 and 20 minutes. We normalized the intensities over 5 minutes to account for difference in the amount of dye, and vascularity of the tissue. At 20 minutes there was a significant difference in intensity between the Tumor tissue (1.016±0.02) compared to Sham tissue (0.85±0.01, P<0.001), Peritumoral + RT (0.88±0.04, P<0.05) and Sham implant + RT (0.89±0.02, P<0.05) (Figure 4-24).
4.4.9 Changes in Leukocyte Adhesion Following Treatment
Leukocyte adhesion was measured at 10, 15 and 65 days post surgery. Changes in leukocyte endothelial adhesion were only evident at 10 and 65 days post surgery. The only group at 10 days that showed a significant increase above Sham implant (0.529±0.21 adhered leukocytes /100μm of vessel length) was the Peritumoral + RT group (1.268±0.16, P<0.05). At 65 days post implant there was a significant difference between Sham implant (0.38±0.18 adhered leukocytes /100μm of vessel length) and the
55

0
2
4
6
8
10
12
14
16
18
48 72 96
% o
f dea
d ce
lls
Post irradiation (hours)
ControlRT - onlyRT + Thalidomide (100ug/ml)RT + Thalidomide (10ug/ml)RT + Thalidomide (1ug/ml)
02468
1012141618
48 72 96
# of
cells
(x1
05 )
Post irradiation (hours)
&
&
& (B)
(A)
& & &
Figure 4-22. A C6 rat glioma in vitro cell experiment. To investigate further the ability of thalidomide to protect during RT, we performed an in vitro experiment in which C6 cells were irradiated with 8Gy with and without thalidomide treatment. (A) Trypan blue assay was used to measure the percent of dead cells and the total (B) number of cells were also counted at the corresponding time points. No protective effects were identified (n=3, &P<0.05 significantly different from all other groups, Tuckey’s test, mean±SEM is shown).
56

* * * ** **
Figure 4-23. Combined graph of the early and late changes in BBB permeability. At 11 days none of the groups was significantly different P=0.466. By day 16 Sham implant + RT (34.97±1.03 x10 -7 cm/s, P<0.001), Peritumoral + RT (x10 -7 cm/s 35.59±1.5, P<0.001) and Peritumoral + RT + Thalidomide ( 33.53±1.3, P<0.05) were significantly different from sham implant ( 27.46±1.17 x10 -7 cm/s). In addition at 66 days Peritumoral + RT (34.88±0.39 x10 -7 cm/s, P<0.05) and Peritumoral + RT + Thalidomide (36.037±0.0.79 x10 -7 cm/s, P<0.05) were still significantly different the sham implant (n= 5 Periutmoral + RT + Thalidomide*P<0.05, *P<0.001 compared to sham implant, Dunnett’s test, mean±SEM is shown).
57

0.8
0.85
0.9
0.95
1
1.05
1.1
5 10 15 20
Aver
age
inte
nsity
in ti
ssue
RO
I (no
rmal
ized
to
5 m
in.)
Post dye injection (minutes)
Sham implantSham implant + RTTumor implantTumor implant + RTTumor implant + RT + Thalidomide
$ % **
Figure 4-24. Novel method of measuring permeability in tumor tissue. To measure changes in permeability in the tumor region (or the equivalent in sham groups), we injected Texas-Red dye and measured the intensity of the tissue at 5, 10, 15 and 20 minutes. We normalized the intensities over 5 minutes to account for difference in the amount of dye, and vascularity of the tissue. At 20 minutes there was a significant difference in intensity between the Tumor tissue compared to Sham tissue, Peritumoral + RT and Sham implant + RT (n≥5 per group, **P<0.001 compared to sham, %P<0.05 compared to Sham implant + RT, $P<0.05 compared to Tumor implant + RT, Tuckey’s test, mean±SEM).
58

Peritumoral + RT group (0.738±0.16, P<0.05). In addition, within the Peritumoral + RT group there was a significant decline in adhered leukocytes between time points 10 and 15 days and 10 vs 65 days post surgery (P<0.05, Dunnett’s test (Figure 4-25A).
4.4.10 Changes in Leukocyte Rolling Following Treatment
Changes in leukocyte rolling along the vasculature wall were evident at 10 and 15 days post surgery. At 10 and 15 days the Sham implant + RT (8.00±0.93, P<0.05 and 7.76±0.41 rolling leukocytes/vessel, P<0.001, respectively) and Peritumoral + RT + Thalidomide (6.35±1.1, P<0.05 and 6.24±1.26 rolling leukocytes/vessel, P<0.05 respectively) were both significantly higher than sham values at both time points (2.74±0.54 and 2.23±0.18 rolling leukocytes/vessel respectively). Also at 10 days the Sham implant + RT had significantly higher numbers of rolling leukocytes then the Peritumoral group (3.17±0.55, P<0.05). At 15 days the groups Sham implant + RT (P<0.001), Peritumoral + RT + Thalidomide (P<0.001), Peritumoral + RT group (4.36±0.62, P<0.05) all had significantly higher leukocyte rolling numbers than the Peritumoral group (1.47±0.46). Also at 15 days there was a significant difference between the RT-only and Peritumoral + RT group enforcing that the presence of the tumor alters RT-induced damage in the BBB (P<0.05). In addition in the Sham implant + RT group, and Peritumoral group the number of rolling leukocytes went down significantly from day 10 to 15 within the group (P<0.05, ANOVA) . Also within the thalidomide treated group there was a significant decrease in leukocytes from day 10 compared to 65 (P<0.05, ANOVA) (Figure 4-25B).
4.4.11 Changes in Number of Reactive Astrocytes
Reactive astrocytes were stained in brain tissue from Sham implant, Tumor implant + RT, Tumor implant + RT + Thalidomide animals at 66 days post surgery. Sections were then imaged and the number of reactive astrocyte quantified. At 66 days post RT in tumor implant animals (29.0±2.28 astrocytes/ROI) and in animals treated with thalidomide (34.3±2.03 astrocytes/ROI), there was a significant increase in the number of reactive astrocytes (astrogliosis) compared to sham implanted animals (20.8±2.28 astrocytes/ROI, P<0.05) (Figures 4-26 and 3-4).
59

0
0.5
1
1.5
2
10 15 65
# of
adh
ered
leuk
ocyt
es p
er 1
00µm
of
ves
sel l
engt
h
Days post surgery
Sham implantPeritumoralSham implant + RTPeritumoral + RT Peritumoral + RT + Thalidomide
0
2
4
6
8
10
10 15 65
# of
rolli
ng le
ukoc
ytes
per
100
µm o
f ve
ssel
leng
th
Days post surgery
*
% *
* *
$
%
% %
*
*
(A)
(B)
Figure 4-25. Early and late changes in leukocyte-endothelial interactions. (A) On day 10 the peritumoral + RT group had a significantly higher number of adhered leukocytes then sham implant. At 65 days post surgery, the animals treated with thalidomide had a significantly higher number of adhered leukocytes then sham(B) On day 10 and 15 rolling leukocytes were significantly different between Sham implant+RT and Thalidomide treated animals vs. sham (n≥4 Peritumoral + RT
implant.
Thalidomide, *P<0.05 compared to sham implant, %P<0.05 vs. Peritumoral, $P<0.05 s. Peritumoral + RT, #P<0.05 vs. peritumoral, Tuckey’s test, mean±SEM is shown).
+v
60

0
5
10
15
20
25
30
35
40
# of
act
ivat
ed a
stro
cyte
s / R
OI
66 days post surgery
Sham implantTumor implant + RTTumor implant + RT +Thalido
mide
*
* Figure 4-26. Number of activated astrocytes at 66 days post surgery. At 66 days following surgery in tumor implanted rats which had undergone RT, there
as a significant increase in the number of reactive astrocytes compared to sham implant nimals (n=3, *P<0.05, Dunnett’s test, mean±SEM is shown).
wa
61

CHAP
n the normal brain e points. Additionally, the characterization of this model has
allowed us to evaluate the efficacy of thalidomide as a potential therapeutic to minimize radiatio
ial ly
potential anti-angiogenic and anti-inflammatory agent with potential to minimize radiation toxicity of normal tissue and dem ited affect in both a rat C6 brain tumor model and in
a C6 flank tumor model.
ine
is that
t is an allograft model which can evoke an alloimmune response in Wistar rats. This immune response could mask, add or change the response of normal tissue t
y. As a result the BED of our
TER 5. DISCUSSION
In this work, we developed and characterized a novel rat radiation brain tumor
model that enabled us to study the effect of a brain tumor and RT otissue at acute and late tim
n toxicity of normal tissue using intravital microscopy and immunohistochemistry.
Our studies show that the presence of the tumor alone caused quantifiable changes
in BBB permeability, leukocyte-endothelial interactions, astrogliosis, and caused an increase in VEGF protein expression in the peritumoral region. Treatment with cranradiation further caused a measurable change in BBB permeability that was significanthigher than sham implant values at 15 days and altered the kinetics and degree of the leukocyte-endothelial interaction rolling, astrogliosis, and VEGF expression in the peritumoral region. We also evaluated thalidomide as a
onstrated that it had limimmunocompromised mice in
5.1 Model Characterization
The broader goal of this study was to develop a clinically relevant animal brain radiation toxicity model. Many in vivo RT studies are performed on normal animals that have no tumors.84 One limitation of such studies is that they do not account for the abnormal microenvironment created by the tumor presence. Ignoring this presence could under or over estimate the true amount of damage caused by RT. In this study we used a cranial window brain tumor model in rats. To the best of our knowledge, our study is the first attempt to evaluate the combination of tumor presence and RT in a murine model on RT-induced damage to normal brain. To this end we employed a C6 rat glioma cell lwhich has been transfected to express GFP. This fluorescence characteristic enabled us to measure tumor size and to delineate the edges of the tumor, making it possible to measure changes in the peritumoral region. This, tumor delineation ability, coupled with our ability to study the same rat and microvascular bed over time using our window modela major step forward in brain radiation studies. One of the limitations of our model is the C6 glioma in ra
o tumor presence. However, in humans high grade tumors can also be weakly immunogenic.119
To further strengthen the clinical relevance of our model, we decided to use a
fractionated radiotherapy regimen. Again, the vast majority of studies use high single doses of irradiation up to 30Gy.120-122 In our current model we decided to fractionate our radiotherapy into 5 doses of 8Gy for a total dose of 40G
62

treatment is 1.25x that a patient would receive (80Gy regimen fractionated RT). This is in contras ly,
ld
f
al.
ile providing them structural proteins and growth factors. While this process may ensure the survival of the cells in
, in hanged
a
-tion
VEGF. Dirkx et al. showed that when tumor-bearing mice were treated with an anti-VEGF antibody, the number of leukocyte-
ays
nd
t to single doses of 20 or 30Gy which are 1.375 and 3 times higher, respectivethen the patient equivalent BED at 80Gy (Table C-1).
To characterize our tumor model in Wistar rats we measured animal weight,
survival, tumor growth, BBB permeability, leukocyte-endothelial interactions, and VEGFexpression. We found that with no treatment to hinder the growth of the tumor, rats fulfilled the criteria set for euthanasia starting from 16 days post-tumor implant due to symptoms induced by tumor burden thus limiting the time frame during which we couperform our experiments. The most common symptom of tumor burden was sudden ataxia which affected the drinking and eating routines of these animals resulting in a decrease in their body weight. In a small percentage of rats, 22%, the tumor began to regress after 15 days of growth resulting in an increase in these animal’s survival time (were followed out to 30 days). The 22% survival rate we observed is higher than that reported by Parsa et al. which found that 11% of Wistar rats following implantation o106 C6 cells survived to 30 days.123 Parsa, et al. have shown that by day 15 post tumor implantation, anti-glioma antibody titers (a measurement of humoral immune response tothe tumor) could be detected which coincides with the time point at which a limitednumber of tumors began to regress. There are some differences between our experimental designs that might explain the discrepancy in our survival times. First, while Parsa etimplanted the tumor cells anterior to the bregma we implanted posterior to it. This difference in anatomical location could affect the tumor growth rate. Second, Parsa, et al.injected the tumor cells using saline while we injected in Matrigel. Matrigel, which solidifies at body temperature, physically encapsulates the cells wh
a foreign environment, it may also hinder their spread, contrary to the cells in saline, confining them to one location and delaying their growth.
To investigate the effect of tumor presence on the peritumoral tissue, we
quantified the number of leukocyte-endothelial interactions, a marker of inflammationthe venules. We found that the number of adhered or rolling leukocytes were uncfrom sham levels in the peritumoral region at 10 and 15 days. Others have observedreduction in leukocyte-endothelial interactions caused by tumor presence which they speculated to be part of the tumor’s mechanism for evasion of the host immune response.124 Studies have shown that one possible mechanism by which leukocyteendothelial interactions are reduced in the tumor is driven in part by the down-regulaof adhesion molecules induced by 125-127
endothelial interactions in the tumor vessels increased, although interactions in non-tumor vessels did not change.128
There was a significant increase in peritumoral BBB permeability at 15 dfollowing tumor implant. This phenomenon is seen in the clinic: brain tumors usually cause excessive edema which leads to increased interstitial pressure in the brain which can hinder the delivery of therapeutics to the tumor. Structurally, in tumors, the vasculature is denser, chaotic, tortuous and immature lacking a basement membrane a
63

have decreased pericyte coverage causing it to be leaky and dilated.10,13,14 Accordingstudies have shown that at certain growth stages tumors are very permeable. Tumpresence, with few exceptions, results in BBB damage.129,130 Furthermore, the tumor induced angiogenic signaling causes an increase in VEGF and its receptor which is known to initiate a signaling cascade that leads to, among other things, vascular permeability. Angiogenic signaling can also cause the formation of vesiculo-vacuolorganelles (VVOs), which are multiple vesicles fused together, endothelial fenestration,and opening of the cell junctions which leads to the deposition of proteins in the interstitium that facilitates angiogenesis.131 Feng et al.29,132 have shown that VVOs regulated transendothelial cell passage when exposed to permeability-inducing factorincluding inflammation, and that regulation of permeability through VVOs has been shown to increase in tumor microvessels. The occurrence of increased BBB p
ly, or
ar
s,
ermeability the peritumoral region may be explained by an increase of VVOs associated with
in the
gliosis was detectable in the contralateral hemisphere. No
significant difference in reactive astrocyte numbers could be measured at 200μm from the tum r but it may be due to the excessive staining in this area making it hard to quantify
ease
as
nnect
of
inVEGF expression, especially considering that a higher level of VEGF protein was foundin the peritumoral region compared to both tumor center and normal tissue. There was also a significant increase in the number of reactive astrocytesperitumoral region (500μm from the tumor) and contralateral to the tumor compared to sham implanted animals. The extent (distance) of the tumor influence is quite interestingconsidering that astro
othe exact numbers.
5.2 Tumor and Radiation-Induced Early Changes
In our study, we irradiated rats with brain tumors to find the effect of the combined presence of radiation and tumor on the normal tissue. Localized brain irradiation was delivered to tumor implanted rats starting from day 5 and for five days until day 9 following tumor implant using a fractionated regimen of 8Gy/day for a total of 40Gy. Radiation treatment hindered tumor growth significantly, from day 10 to 20 compared to the tumor-implant group, and led to tumor regression in all animals. On day 10, following tumor implant (1 day following end of RT), there was a significant incrin adhesion of leukocytes compared to the sham-implant animal group. By day 15 the adhered leukocyte counts had returned to sham levels. In addition, BBB permeability wsignificantly higher in the tumor-implant + RT group compared to the sham-implant group at 15 days but not 10 days. This result is interesting because there is a discobetween increase in BBB permeability and changes in adhered leukocytes. Yuan et al.have shown that when rats underwent irradiation with a localized brain single dose20Gy, changes in BBB permeability mimicked changes in leukocyte-endothelial interactions.83 Wilson et al. observed a strong correlation between BBB permeability changes and leukocyte adhesion; also using a single dose of 20Gy localized brain irradiation.91 There are several possible reasons that might explain the decorrelation between permeability and leukocyte activity changes in our model. The first reason maybe due to the change in RT regimen. Fractionation of radiation consists of lower doses
64

per daily treatment which means the delivery of a lesser insult at any given session and more time for the tissue to heal between doses. These factors together alter the kinetics and magnitude of the inflammatory modulators responsible for upregulation of leukocyte-endothelial interactions. In a different study and using a different fractionation regimen (2Gy/day for 20 days with weekends off; for a total of 40Gy), Yuan et al. showed following fractionated RT, changes in BBB permeability were delayed while changes ileukocyte endothelial interactions were undetectable.84 The second possible reason, for the decorrelation, is that the tumor presence may be responsible for the change in permeability through the upregulation of cytokines such as VEGF without necessarily affecting leukocyte-interactions. Therefore the change in permeability would not dependon changes in leukocyte-endothelial interactions. It is important to note that following radiation we did find an increase in VEGF expression in the tumor and peritumoral tat 10 days. The third possible reason could be the ability of the tumor to down regulate leukocyte-endothelial interactions resulting in the decrease in leukocyte interactions at day 15 post- implant, especially considering that none of the leukocyte-endothelial interactions in the tumor-implant group (without radiation treatment) were significant at any time point compared to the sham-implant group. Wu et al. showed that when tumor bearing tissue was irradiated, the number of leukocytes rolling and adhering to the microvessels either did not change in the peritumoral and tumor vasculature or decreased in number.127,133 Even though we had some change in leukocyte-endothelial interactions,this study demonstrates that the tumor has the ability to alter the kinetics and magnituof interactions and the difference between the two studies, type of tumor, tumor locatioand RT dose could explain contradictions between these two studies. In addition, Wu etal. found that when inflammation was induced (using TNF or lipopolysaccharide) in tumor tissue, the normal vessels responded with an increase in adhesion and rolling of leukocytes whereas the tumor vessels did not.127 Further experiments investigating the causes responsible for pe
that n
issue
de
n,
rmeability increase following RT in our rat radiation brain tumor model are needed, especially considering that in the clinic 40% of glioma patients have increas cy
he
because activated astrocytes have been shown to secrete inflammatory agents which, in turn, could amplify EC and microvascular
amage and have detrimental effects on oligodendrocytes and O-2A progenitor cells thus
ed permeability a month after RT making it difficult to follow treatment efficaand tumor progression.6
Following RT, the degree of astrogliosis, a marker of inflammation, went up
significantly in the tumor bearing brains. This result helps solidify our hypothesis that tcombined effect of brain tumor presence and RT would intensify the degree of RT–induced normal tissue. This is important
105,106
dleading to further damage in the brain.
5.3 Tumor Radiation-Induced Late Changes
One of the most noteworthy findings of our study is the tumor limiting effect ofthis RT regimen which enabled us to study RT-induced longterm damage in a rat radiation tumor model. We found that at 65 days post-tumor implant that BBB permeability was still significantly higher in the peritumoral + RT group compared to
65

sham-implant, however leukocyte-endothelial interactions returned to normal which correlates with studies performed by Yuan et al.84 It is interesting to note that somirradiated rats were afflicted with malocclusion at the later time points. The exact reasonleading to the malocclusion is not known but similar results were found in a study by Nagler who studied the “Extended-term effects of head and neck irradiation in a rodent”.134 Nagler found that starting at 6 months post RT, in doses ranging from 2.5 to 15Gy, rats began to have problems with overeruption of unground anterior incisor teeth in 5 out of 10 rats which was theorized to be due to the decrease in food intake resulting in overgrowth of their teeth. From our observations it seems more likely that the malocclusion was a result of lethargy caused by RT that d
e
ecreased the amount of tooth grinding (thegosis) that rodents do to keep their teeth from becoming overgrown. Brain tumor p igue.59
r
the
ted
at an tion-
icative of inflammation, it is associated with or is a byproduct of brain inflammation. It is also known that prolonged upregulation of astrocytes can create glial scar sites which has been theorized to inhibit axonal
3
n to
ainst f
ial
atients treated with cranial irradiation have been reported to suffer from fatHowever, we did not investigate this matter any further.
At 65 days post surgery we also found that there were significantly highe
numbers of activated astrocytes and astrogliosis compared to sham implant animals. Radiation has been reported to cause an inflammatory response in the parenchyma of mouse brain through the activation of astrocytes and microglial cells.84,101,135,136 Cicciarello et al.102 reported activated astrocytes 90 days after treatment with fractionairradiation. Mildenberger et al.137 also observed a microglial response 6 months after fractionated irradiation. Furthermore, Reuss et al.138 and Willis et al.139 reported thinhibition of astrocyte proliferation can affect the BBB integrity. Although radiainduced gliosis is not directly ind
regeneration or remylination.10
5.4 Thalidomide Treatment In 2006, the FDA approved thalidomide treatment for use in multiple myeloma.
As a result of its success with multiple myeloma, thalidomide treatment is currently undergoing numerous phase II clinical trials for the use in brain tumors and other types of cancer. The exact mechanism of how thalidomide works is not known, but it is has been shown to reduce angiogenesis, alter the expression of adhesion molecules, reduce TNF levels, increase IL-10 and stimulates cytotoxic T cells.140 Unfortunately there is limited ivivo data to support the ongoing clinical trials for brain tumors. Our model enabled ustest the efficacy of thalidomide as an anti-angiogenic and anti-inflammatory agent with potential to minimize radiation toxicity of normal tissue and to monitor its effect on the tumor. Others have shown that thalidomide may exhibit the ability to protect agradiation toxicity, and it was recently used in a phase I clinical trial to study the effect othalidomide on modulating radiation-induced lung injury. Unfortunately the clinical trwas terminated early due to dose limiting toxicity associated with thalidomide treatment.141,142 We showed that thalidomide at a dose of 100mg/kg/day administered concomitantly with RT interfered with RT’s efficacy in controlling tumor growth by measuring the surface of the tumor through the cranial window. There was a significant
66

difference between the tumor surface area in the Tumor + RT group and the Tumor + + Thalidomide at 15 days post implant. Although RT tumor control wa
RT s affected, this
change did not affect animal survival. In addition, thalidomide treatments seem to have no prot
ivo studies have shown that this is not the case. addition, Daruwalla, et al. showed using mice with colorectal cancer that thalidomide
treatme it
in vivo
izing effect of thalidomide usually is not seen using in vitro cultures. Moreira t al. specifically showed that endothelial cell proliferation was inhibited by thalidomide ut not in glioma cells which lends support to why our in vitro study had no significant sults.148
ective effects following RT when we measured BBB permeability, leukocyte-endothelial interactions, and astrogliosis at early and late time points.
Ansiaux et al. showed that thalidomide treatment actually radiosensitized the
tumors to radiation treatment by increasing the amount of oxygen in the tumor.143
Differences in tumor type, thalidomide dose, RT dose and regimen may account for the contradictory results between our study and the Ansiaux’s study. It is hypothesized that thalidomide treatment alone should decrease the growth of tumor due to its anti-angiogenic effect, but numerous in v 143-146
Innt had no early effects on the tumor until it reached its late phase of growth, but
did not improve animal survival.147
Our in vitro results did not demonstrate any protective, radiosensitizing, and/or anti-angiogenic effects on irradiated rat C6 glioma cells. It is speculated that in ansetting the main effect of thalidomide is on the tumor vasculature through its anti-angiogenic effect causing a normalization of the vasculature and hence delivering more oxygen to the tumor bed. This agrees with observations that have shown that the radiosensitebre
67

CHAPTER 6. FUTURE DIRECTIONS
n peutics. We focused our studies on
the peritumoral region in the brain to investigate the combined effect of tumor presence
) The development of a rat radiation brain tumor model combined with the cranial
) The combination of radiation and tumor presence, Tumor-implant + RT group,
) Following our fractionated radiation regimen, the tumor underwent regression and
(4) Treatment with thalidomide, a potential anti-angiogenic and anti-inflammatory drug, concomitantly with RT had no protective effects on radiation-induced
um
l as
al
t to the radiation oncology field. While executing our research plan, we identified several limitation of our original plan and some possible directio
6.1 Summary
One of the aims of this work was to develop and characterize a rat radiation braitumor model that could be used to test potential thera
and radiation on the vasculature and tissue in that region. The major achievements and conclusions from this study can be summarized as:
(1
window technique allowed progressive measurements of the tumor and surrounding area over time.
(2
altered BBB permeability and leukocyte-endothelial interactions compared to the Sham-implant + RT or Tumor-implant groups.
(3
the animal’s survival was 100% at 65 days allowing us to study long term radiation-induced damage.
damage.
6.2 Future Directions
Side effects of radiation therapy are the main limiting factor in treatment planning and have great implications for patient prognosis. Understanding the mechanisms underlying their initiation, development and propagation would allow for the use of preemptive treatments that reduce or ameliorate these side effects allowing the maximbiologically effective RT dose to be reached. This is especially important in the case of brain tumors were the side effects of RT include blood-brain barrier disruption, as welneurological, and cognitive impairment. While most RT-induced damage studies arecarried out in irradiated normal animals, we developed a novel approach using an animbrain glioma model which ensures the incorporation of tumor effects and renders our model more clinically relevan
ns that could be explored in future research. In what follows, we will identify these possible future studies:
Radiation toxicity studies have been focused on normal tissue damage with the
aim of understanding the mechanisms underlying such damage. This approach has an
68

obvious limitation, in that if one’s aim is to maximize the effect of radiation treatment then the effect of radiation on tumor tissue is also a part of this endeavor. Our model allows for such studies of radiation effects on the tumor as well as normal tissue. A logical
mor
e
? One
lay in the regression of the tumor. Another possible experiment would be to study the hematopoietic response to tumor presence alone and combined with RT, by anal
ast lial
d o use
our
r astrocyte expression. However, there are numerous other drugs which work through other mechanisms such as NF-κB pathway that cou
ed al
0, 120 and 180 days need to be characterized. This model would also allow for studies in the same animal that correlate vascular changes such as BBB
ermeability and leukocyte interactions with functional and behavioral changes that occur t later time points.
extension of our work would then be to study radiation effects on tumor tissue using our model.
In our model RT, limited the growth of the tumor which then led to full tu
regression in all animals. One possible area of study would be to investigate what leads tothis regression. Is the regression a result of RT slowing tumor growth and allowing thimmune system to develop an effective response to tumor presence or is the RT sensitizing the immune system to the tumor by upregulation of adhesion moleculesstraightforward study that could address this issue would be to implant the tumor in immunocompromised rats and see if the same phenomenon of RT leading to tumor regression would still occur. This experiment would explain what role the RT and immune system p
yzing the peripheral blood to determine whether the immune system is activated and its kinetics.
Another avenue of research is to continue searching for potential anti-angiogenic
and/or anti-inflammatory agents that would not interfere with RT tumor efficacy. In presearch from our group, we confirmed that BBB permeability and leukocyte endotheinteractions could be abrogated by treating with antibodies of ICAM and TNF before anafter localized cranial irradiation in normal animals.83,91 In this study, we tried tthalidomide, which has been shown to down regulate TNF expression. Although findings are not conclusive and are limited to only one tumor cell line, thalidomide did not exhibit any significant reduction of radiation toxicity as measured by BBB permeability, leukocyte interactions o
ld possibly limit radiation toxicity while not interfering with RT tumor efficacy.Our model is ideal for such studies.
A focus of our research has been to link the early changes in BBB permeability
after RT with late changes that are more clinically relevant. The animal model we creatwill enable us to study the possible link between early and late damage in a more clinicrelevant model due to the presence of the tumor. Further research of this model at later time points, such as 9
pa
69

LIST OF REFERENCES
1. ng SM. Glial tumors: the current state of scientific knowledge.
2.
cer:
and prospects for cost-effective imaging. Neuroimaging Clin N Am
o,
6. n adults. N Engl J Med 2008;359:492-507.
sizing towards new molecularly targeted therapies. Crit
8.
3. 11.
12. Kozin SV, et al. Vascular normalization by vascular
drug penetration in tumors. Cancer Res
13. ine to solid tumors. Adv Drug
14. K. Normalization of tumor vasculature: an emerging concept in
17. ion and cancer: how hot
18. karsky E. Inflammation and cancer: is the link as
19. gliomas. J
20. nous tumour necrosis factor alpha in gliomas. J Clin Pathol 1997;50:559-562.
Butowski NA, ChaClin Neurosurg 2006;53:106-113. Norden AD, Wen PY, Kesari S. Brain metastases. Curr Opin Neurol 2005;18:654-661.
3. Levin V, Leibel S, Gutin P. Neoplasm of the central nervous system. In: CanPrinciples and Practice of Oncology. 6th ed. Lippincott Williams and Wilkins; 2001. pp. 2100-2160.
4. Hutter A, Schwetye KE, Bierhals AJ, et al. Brain neoplasms: epidemiology, diagnosis, 2003;13:237-250, x-xi.
5. CBTRUS. Primary brain tumors in the United States statistical report. ChicagIL; 2007. Wen PY, Kesari S. Malignant gliomas i
7. Argyriou AA, Antonacopoulou A, Iconomou G, et al. Treatment options for malignant gliomas, emphaRev Oncol Hematol 2008;69:199-210. Folkman J. What is the evidence that tumors are angiogenesis dependent? J Natl Cancer Inst 1990;82:4-6.
9. Dewhirst MW, Richardson R, Cardenas-Navia I, et al. The relationship betweenthe tumor physiologic microenvironment and angiogenesis. Hematol Oncol Clin North Am 2004;18:973-990, vii.
10. Jain RK. Molecular regulation of vessel maturation. Nat Med 2003;9:685-69Stohrer M, Boucher Y, Stangassinger M, et al. Oncotic pressure in solid tumors iselevated. Cancer Res 2000;60:4251-4255. Tong RT, Boucher Y,endothelial growth factor receptor 2 blockade induces a pressure gradient across the vasculature and improves2004;64:3731-3736. Jain RK. Delivery of molecular and cellular medicDeliv Rev 2001;46:149-168. Jain Rantiangiogenic therapy. Science 2005;307:58-62.
15. Balkwill F, Coussens LM. Cancer: an inflammatory link. Nature 2004;431:405-406.
16. Coussens LM, Werb Z. Inflammation and cancer. Nature 2002;420:860-867. Aggarwal BB, Shishodia S, Sandur SK, et al. Inflammatis the link? Biochem Pharmacol 2006;72:1605-1621. Nickoloff BJ, Ben-Neriah Y, Pisimple as we think? J Invest Dermatol 2005;124:x-xiv. Kargiotis O, Rao JS, Kyritsis AP. Mechanisms of angiogenesis in Neurooncol 2006;78:281-293. Maruno M, Kovach JS, Kelly PJ, et al. Distribution of endoge
70

21. Szlosarek PW, Balkwill FR. Tumour necrosis factor alpha: a potential target forthe therapy of solid tumours. Lancet Oncol 2003;4:565-573.
tor-
23. l. Essential roles of tumor
24. rosis factor alpha as a ximab at
25. acy MQ, et al. Combination therapy with
r
des
28. endothelial cell pathways in
l -432.
31. emoval ocytes than microglia cells: implications for the role of glial
32. in endothelial cell vesiculotubular structures
.
33. , et al. Increased blood-brain l
34. pathways for macromolecular and cellular
36. t P, Folkman J. Clinical application of antiangiogenic therapy:
22. Moore RJ, Owens DM, Stamp G, et al. Mice deficient in tumor necrosis facalpha are resistant to skin carcinogenesis. Nat Med 1999;5:828-831. Kitakata H, Nemoto-Sasaki Y, Takahashi Y, et anecrosis factor receptor p55 in liver metastasis of intrasplenic administration of colon 26 cells. Cancer Res 2002;62:6682-6687. Harrison ML, Obermueller E, Maisey NR, et al. Tumor necnew target for renal cell carcinoma: two sequential phase II trials of inflistandard and high dose. J Clin Oncol 2007;25:4542-4549. Rajkumar SV, Hayman SR, Llenalidomide plus dexamethasone (Rev/Dex) for newly diagnosed myeloma. Blood 2005;106:4050-4053.
26. Hayden PJ, Mitsiades CS, Anderson KC, et al. Novel therapies in myeloma. CurOpin Hematol 2007;14:609-615.
27. Croll SD, Ransohoff RM, Cai N, et al. VEGF-mediated inflammation preceangiogenesis in adult brain. Experimental Neurology 2004;187:388-402. Feng D, Nagy JA, Dvorak HF, et al. Ultrastructural studies define soluble macromolecular, particulate, and cellular transvenules, lymphatic vessels, and tumor-associated microvessels in man and animals. Microsc Res Tech 2002;57:289-326.
29. Dvorak AM, Feng D. The vesiculo-vacuolar organelle (VVO). A new endotheliacell permeability organelle. J Histochem Cytochem 2001;49:419
30. Hwang SY, Jung JS, Kim TH, et al. Ionizing radiation induces astrocyte gliosis through microglia activation. Neurobiol Dis 2006;21:457-467. Magnus T, Chan A, Linker RA, et al. Astrocytes are less efficient in the rof apoptotic lymphcells in the inflamed central nervous system. J Neuropathol Exp Neurol 2002;61:760-766. Lossinsky AS, Buttle KF, Pluta R, et al. Immunoultrastructural expression of intercellular adhesion molecule-1 and vesiculovacuolar organelles in blood-brain barrier development and injuryCell Tissue Res 1999;295:77-88. Dobrogowska DH, Lossinsky AS, Tarnawski Mbarrier permeability and endothelial abnormalities induced by vascular endotheliagrowth factor. J Neurocytol 1998;27:163-173. Lossinsky AS, Shivers RR. Structural transport across the blood-brain barrier during inflammatory conditions. Review. Histol Histopathol 2004;19:535-564.
35. Folkman J. Antiangiogenesis in cancer therapy-endostatin and its mechanisms of action. Exp Cell Res 2006;312:594-607. Hlatky L, Hahnfeldmicrovessel density, what it does and doesn't tell us. J Natl Cancer Inst 2002;94:883-893.
71

37. Provenzale JM, McGraw P, Mhatre P, et al. Peritumoral brain regions in gliomas and meningiomas: investigation with isotropic diffusion-weighted MR imaging and diffusion-tensor MR imaging. Radiology 2004;232:451-460.
in
Int
40. , Imanishi Y, Cackowski FC, et al. Up-regulation of angiopoietin-2, matrix
d
8;4:9-13. the
mes for glioblastoma. Int J Radiat
43. et al. Medical management of brain tumor
44. al management of patients with brain tumors. Curr
45. cal Imaging. 2nd ed. Philadelphia: W.B.
46. ss. Radiat Res 2000;153:357-370.
orth Am 2006;20:141-
48. HK. Radiation Oncology: Radiobiological and Physiological Perspectives
49. rd Arnold Ltd.;
50. et al. Effects of radiation on normal tissue:
51. , Inc.; 1994.
ing
95.
166:479-487.
38. Julien C, Payen JF, Tropres I, et al. Assessment of vascular reactivity in rat braglioma by measuring regional blood volume during graded hypoxic hypoxia. Br J Cancer 2004;91:374-380.
39. Sandstrom M, Johansson M, Sandstrom J, et al. Expression of the proteolytic factors, tPA and uPA, PAI-1 and VEGF during malignant glioma progression. J Dev Neurosci 1999;17:473-481. Guo Pmetalloprotease-2, membrane type 1 metalloprotease, and laminin 5 gamma 2 correlates with the invasiveness of human glioma. Am J Pathol 2005;166:877-890.
41. Datta NR, David R, Gupta RK, et al. Implications of contrast-enhanced CT-baseand MRI-based target volume delineations in radiotherapy treatment planning forbrain tumors. J Cancer Res Ther 200
42. Chang EL, Akyurek S, Avalos T, et al. Evaluation of peritumoral edema indelineation of radiotherapy clinical target voluOncol Biol Phys 2007;68:144-150. Drappatz J, Schiff D, Kesari S, patients. Neurol Clin 2007;25:1035-1071, ix. Wen PY, Marks PW. MedicOpin Oncol 2002;14:299-307. Bragg DG, Rubin P, Hricak H. OncologiSaunders Company; 2002. Tofilon PJ, Fike JR. The radioresponse of the central nervous system: a dynamic proce
47. FitzGerald TJ, Aronowitz J, Giulia Cicchetti M, et al. The effect of radiation therapy on normal tissue function. Hematol Oncol Clin N163. AwwadVol 60. Dordrecht: Kluwer Academic Publishers; 1990. Steele GG. Basic Clinical Radiobiology. 3rd ed. London: Edwa2002. Stone HB, Coleman CN, Anscher MS, consequences and mechanisms. Lancet Oncol 2003;4:529-536. Cox JD.Moss' Radiation Oncology: Rational, Technique, Results. 7th ed. St. Louis: Mosby-Year Book
52. Hamada N, Matsumoto H, Hara T, et al. Intercellular and intracellular signalpathways mediating ionizing radiation-induced bystander effects. J Radiat Res (Tokyo) 2007;48:87-
53. Shao C, Lyng FM, Folkard M, et al. Calcium fluxes modulate the radiation-induced bystander responses in targeted glioma and fibroblast cells. Radiat Res2006;
72

54. Hu B, Wu L, Han W, et al. The time and spatial effects of bystander response imammalian cells induced by low dose radiation. Carcinogenesis 2006;27:245-251.
n
Sci 3-14208.
age and rs in distant bystander tissue in vivo. Oncogene
57. logy for the Radiologist. 6th ed. Lippincott
58.
summary report of the Sixth Annual Meeting of the
61. . New York: Oxford Press; 1992.
induced microvascular dysfunction in rats.
63. es
tion is ners. J
65. cular permeability. Microcirculation 1999;6:45-54.
f ocyte-endothelial cell interactions. Int J Cancer
67. the blood-brain barrier. Annu Rev
68. asculitis.
r Thromb Vasc Biol 2000;20:410-415. r
enesis, drug delivery and neurodegenerative disorders. J
71. irculation
72. s the
55. Belyakov OV, Mitchell SA, Parikh D, et al. Biological effects in unirradiated human tissue induced by radiation damage up to 1 mm away. Proc Natl AcadU S A 2005;102:1420
56. Koturbash I, Rugo RE, Hendricks CA, et al. Irradiation induces DNA dammodulates epigenetic effecto2006;25:4267-4275. Hall JE, Giaccia AJ. RadiobioWilliams & Wilkins; 2006. Ganong WF. Review of Medical Physiology. 14th ed. East Norwalk: Lange Medical Publications; 1989.
59. Doolittle ND, Anderson CP, Bleyer WA, et al. Importance of dose intensity in neuro-oncology clinical trials: Blood-Brain Barrier Disruption Consortium. Neuro-oncol 2001;3:46-54.
60. Davson H, Segal MB. Physiology of the CSF and Blood-Brain Barriers. Boca Raton, FL: CRC Press; 1996. Acheson DJ. Elementary Fluid Dynamics
62. Panes J, Anderson DC, Miyasaka M, et al. Role of leukocyte-endothelial cell adhesion in radiation-Gastroenterology 1995;108:1761-1769. Pries AR, Secomb TW, Gaehtgens P. Design principles of vascular beds. Circ R1995;77:1017-1023.
64. Burns AR, Walker DC, Brown ES, et al. Neutrophil transendothelial migraindependent of tight junctions and occurs preferentially at tricellular corImmunol 1997;159:2893-2903. Michel CC, Neal CR. Openings through endothelial cells associated with increased microvas
66. Quarmby S, Kumar P, Kumar S. Radiation-induced normal tissue injury: role oadhesion molecules in leuk1999;82:385-395. Rubin LL, Staddon JM. The cell biology ofNeurosci 1999;22:11-28. Buckley CD, Ed RG, Nash GB, et al. Endothelial cells, fibroblasts and vRheumatology (Oxford) 2005;44:860-863.
69. Imaizumi T, Itaya H, Fujita K, et al. Expression of tumor necrosis factor-alpha in cultured human endothelial cells stimulated with lipopolysaccharide or interleukin-1alpha. Arterioscle
70. Banks WA. Physiology and pathology of the blood-brain barrier: implications fomicrobial pathogNeurovirol 1999;5:538-555. Mayhan WG. Regulation of blood-brain barrier permeability. Microc2001;8:89-104. Rubin P, Gash DM, Hansen JT, et al. Disruption of the blood-brain barrier aprimary effect of CNS irradiation. Radiother Oncol 1994;31:51-60.
73

73. Brosnan CF. Brain microvasculature in multiple sclerosis. In: Pardridge WM, editor. Introduction to the Blood-Brain Barrier Methodology, Biology, and
74. ; 1998.
gy, and Pathology.
76. at Oncol Biol Phys 2005;62:279-287.
e
diat Oncol Biol
79. other Oncol 1993;27:229-236.
nerve 99:101-122.
of ce
82. 86;46:1732-1742.
84. , Boyd K, et al. Effects of fractionated radiation on the brain
lood-brain
therapy: an
87. -
88. 3:293-297.
ls
Pathology. Cambridge: Cambridge University Press; 1998. pp. 386-400. Wisniewski HM. Introduction to the Blood Brain-Barrier Methodology, Biologyand Pathology. 1st ed. New York Cambridge University Press
75. Petito CK. HIV infection and the blood-brain barrier. In: Pardridge WM, editor. Introduction to the Blood-Brain Barrier Methodology, BioloCambridge: Cambridge University Press; 1998. pp. 419-433. Nordal RA, Wong CS. Molecular targets in radiation-induced blood-brain barrierdisruption. Int J Radi
77. Atkinson S, Li YQ, Wong CS. Changes in oligodendrocytes and myelin genexpression after radiation in the rodent spinal cord. Int J Radiat Oncol Biol Phys 2003;57:1093-1100.
78. Chiang CS, Mason KA, Withers HR, et al. Alteration in myelin-associated proteins following spinal cord irradiation in guinea pigs. Int J RaPhys 1992;24:929-937. Chiang CS, McBride WH, Withers HR. Myelin-associated changes in mouse brain following irradiation. Radi
80. Mastaglia FL, McDonald WI, Watson JV, et al. Effects of x-radiation on the spinal cord: an experimental study of the morphological changes in centralfibers. Brain 1976;
81. Felts PA, Smith KJ. Blood-brain barrier permeability in astrocyte-free regions the central nervous system remyelinated by Schwann cells. Neuroscien1996;75:643-655. Smith QR, Rapoport SI. Cerebrovascular permeability coefficients to sodium, potassium, and chloride. J Neurochem 19
83. Yuan H, Gaber MW, McColgan T, et al. Radiation-induced permeability and leukocyte adhesion in the rat blood- brain barrier: modulation with anti-ICAM-1 antibodies. Brain Res 2003;969:59-69. Yuan H, Gaber MWvasculature in a murine model: blood-brain barrier permeability, astrocyte proliferation, and ultrastructural changes. Int J Radiat Oncol Biol Phys 2006;66:860-866.
85. d'Avella D, Cicciarello R, Albiero F, et al. Quantitative study of bbarrier permeability changes after experimental whole-brain radiation. Neurosurgery 1992;30:30-34.
86. Debbage PL, Seidl S, Kreczy A, et al. Vascular permeability and hyperpermeability in a murine adenocarcinoma after fractionated radioultrastructural tracer study. Histochem Cell Biol 2000;114:259-275. Belka C, Budach W, Kortmann RD, et al. Radiation induced CNS toxicity-molecular and cellular mechanisms. Br J Cancer 2001;85:1233-1239. Paris F, Fuks Z, Kang A, et al. Endothelial apoptosis as the primary lesion initiating intestinal radiation damage in mice. Science 2001;29
89. Pena LA, Fuks Z, Kolesnick RN. Radiation-induced apoptosis of endothelial celin the murine central nervous system: protection by fibroblast growth factor andsphingomyelinase deficiency. Cancer Res 2000;60:321-327.
74

90. Eissner G, Kohlhuber F, Grell M, et al. Critical involvement of transmembranetumor necrosis factor-alpha in endothelial programmed cell death mediated by ionizing radiation and bacterial endotox
in. Blood 1995;86:4184-4193.
4:934-941 ates
0-86.
94. ary vascular
95. iologic,
96. 11:1727-1735.
erapy.
rvous system radiation injury: a role for vascular
99. adiation on human cognition. Neurosci
100. adiation therapy and damage to hippocampal neurogenesis.
101.
38:772-779.
46-
.
3:765-781. a 1 in
ion. J Korean Med Sci 2002;17:242-248.
91. Wilson C, Gaber M, Sabek O, et al. Radiation-induced astrogliosis and blood-brain barrier damage can be abrogated using anti-TNF treatment. Int J Radiation Oncology Biol Phys 2009;7
92. Ansari R, Gaber MW, Wang B, et al. Anti-TNFA (TNF-a) treatment abrogradiation-induced changes in vascular density and tissue oxygenation. Radiation Research 2007;167:8
93. Ogawa S, Clauss M, Kuwabara K, et al. Hypoxia induces endothelial cell synthesis of membrane-associated proteins. Proc Natl Acad Sci U S A 1991;88:9897-9901. Stenmark KR, Fagan KA, Frid MG. Hypoxia-induced pulmonremodeling: cellular and molecular mechanisms. Circ Res 2006;99:675-691.Hockel M, Vaupel P. Tumor hypoxia: definitions and current clinical, band molecular aspects. J Natl Cancer Inst 2001;93:266-276. Hunter A, Hendrikse A, Renan M, et al. Does the tumor microenvironment influence radiation-induced apoptosis? Apoptosis 2006;
97. Anscher MS, Chen L, Rabbani Z, et al. Recent progress in defining mechanismsand potential targets for prevention of normal tissue injury after radiation thInt J Radiation Oncology Biol Phys 2005;62:255-259.
98. Nordal RA, Nagy A, Pintilie M, et al. Hypoxia and hypoxia-inducible factor-1 target genes in central neendothelial growth factor. Clin Cancer Res 2004;10:3342-3353. Sarkissian V. The sequelae of cranial irrLett 2005;382:118-123. Monje M. Cranial rDev Disabil Res Rev 2008;14:238-242. Monje ML, Palmer T. Radiation injury and neurogenesis. Curr Opin Neurol 2003;16:129-134.
102. Cicciarello R, d'Avella D, Gagliardi ME, et al. Time-related ultrastructural changes in an experimental model of whole brain irradiation. Neurosurgery 1996;
103. Balasingam V, Tejada-Berges T, Wright E, et al. Reactive astrogliosis in the neonatal mouse brain and its modulation by cytokines. J Neurosci 1994;14:8856.
104. Selmaj KW, Farooq M, Norton WT, et al. Proliferation of astrocytes in vitro in response to cytokines. A primary role for tumor necrosis factor. J Immunol 1990;144:129-135
105. Botchkina GI, Meistrell ME, III, Botchkina IL, et al. Expression of TNF and TNFreceptors (p55 and p75) in the rat brain after focal cerebral ischemia. Mol Med 1997;
106. Kim SH, Lim DJ, Chung YG, et al. Expression of TNF-alpha and TGF-betthe rat brain after a single high-dose irradiat
75

107. Fike JR, Rola R, Limoli CL. Radiation response of neural precursor cells. Neurosurg Clin N Am 2007;18:115-127, x. Nait-Oumesmar B, Picard-Riera N, Kern108. inon C, et al. The role of SVZ-derived
;45:461-465.
111. idomide to alpha1-acid glycoprotein oc
112. n tumor for
113. and drug
114. iani K, et al. Thalidomide and lenalidomide extend survival
115. ility and leukocyte-endothelial cell
116. , Rosner G, et al. Measurement of material extravasation in s
118. J, Levasseur JE, et al. Effect of hematocrit variations on
120. lin basic protein and demyelination
122. et al. Longitudinal diffusion tensor magnetic resonance cer
123. f the C6/Wistar rat intracerebral glioma model: implications for evaluating immunotherapy. Neurosurgery 2000;47:993-999; discussion 999-1000.
neural precursors in demyelinating diseases: from animal models to multiple sclerosis. J Neurol Sci 2008;265:26-31.
109. Hopewell JW, Cavanagh JB. Effects of X irradiation on the mitotic activity of thesubependymal plate of rats. Br J Radiol 1972
110. Richardson P, Hideshima T, Anderson K. Thalidomide: emerging role in cancermedicine. Annu Rev Med 2002;53:629-657. Turk BE, Jiang H, Liu JO. Binding of thalmay be involved in its inhibition of tumor necrosis factor alpha production. PrNatl Acad Sci U S A 1996;93:7552-7556. Groves MD, Puduvalli VK, Chang SM, et al. A North American braiconsortium (NABTC 99-04) phase II trial of temozolomide plus thalidomiderecurrent glioblastoma multiforme. J Neurooncol 2007;81:271-277. Greig NH, Mattson MP, Perry T, et al. New therapeutic strategiescandidates for neurodegenerative diseases: p53 and TNF-alpha inhibitors, and GLP-1 receptor agonists. Ann N Y Acad Sci 2004;1035:290-315. Kiaei M, Petri S, Kipin a transgenic mouse model of amyotrophic lateral sclerosis. J Neurosci 2006;26:2467-2473. Gaber MW, Yuan H, Killmar JT, et al. An intravital microscopy study of radiation-induced changes in permeabinteractions in the microvessels of the rat pia mater and cremaster muscle. Brain Res Brain Res Protoc 2004;13:1-10. Wu NZ, Klitzman Bmicrovascular networks using fluorescence video-microscopy. Microvasc Re1993;46:231-253.
117. House SD, Lipowsky HH. Microvascular hematocrit and red cell flux in rat cremaster muscle. Am J Physiol 1987;252:H211-H222. Muizelaar JP, Bouma Gcerebral blood flow and basilar artery diameter in vivo. Am J Physiol 1992;262:H949-H954.
119. Barth RF. Rat brain tumor models in experimental neuro-oncology: the 9L, C6, T9, F98, RG2 (D74), RT-2 and CNS-1 gliomas. J Neurooncol 1998;36:91-102. Tian Y, Shi Z, Yang S, et al. Changes in myein the rat brain within 3 months of single 2-, 10-, or 30-Gy whole-brain radiation treatments. J Neurosurg 2008;109:881-888.
121. Panagiotakos G, Alshamy G, Chan B, et al. Long-term impact of radiation on the stem cell and oligodendrocyte precursors in the brain. PLoS ONE 2007;2:e588. Wang S, Wu EX, Qiu D, imaging study of radiation-induced white matter damage in a rat model. CanRes 2009;69:1190-1198. Parsa AT, Chakrabarti I, Hurley PT, et al. Limitations o
76

124. Fukumura D, Salehi HA, Witwer B, et al. Tumor necrosis factor alpha-induced leukocyte adhesion in normal and tumor vessels: effect of tumor type, transplantation site, and host strain. Cancer Res 1995;55:4824-4829.
125. Tromp SC, oude Egbrink MG, Dings RP, et al. Tumor angiogenesis factors reduce leukocyte adhesion in vivo. Int Immunol 2000;12:671-676.
126. Griffioen AW, Molema G. Angiogenesis: potentials for pharmacologic intervention in the treatment of cancer, cardiovascular diseases, and chronic inflammation. Pharmacol Rev 2000;52:237-268.
127. Wu NZ, Klitzman B, Dodge R, et al. Diminished leukocyte-endothelium interaction in tumor microvessels. Cancer Res 1992;52:4265-4268.
128. Dirkx AE, oude Egbrink MG, Castermans K, et al. Anti-angiogenesis therapy can overcome endothelial cell anergy and promote leukocyte-endothelium interactions and infiltration in tumors. Faseb J 2006;20:621-630.
129. Pardridge WM. Blood-brain barrier biology and methodology. J Neurovirol 1999;5:556-569.
130. Yuan F, Salehi HA, Boucher Y, et al. Vascular permeability and microcirculation of gliomas and mammary carcinomas transplanted in rat and mouse cranial windows. Cancer Res 1994;54:4564-4568.
131. Lin ZX, Yang LJ, Huang Q, et al. Inhibition of tumor-induced edema by antisense VEGF is mediated by suppressive vesiculo-vacuolar organelles (VVO) formation. Cancer Sci 2008;99:2540-2546.
132. Dvorak HF, Nagy JA, Feng D, et al. Vascular permeability factor/vascular endothelial growth factor and the significance of microvascular hyperpermeability in angiogenesis. Curr Top Microbiol Immunol 1999;237:97-132.
133. Wu NZ, Ross BA, Gulledge C, et al. Differences in leucocyte-endothelium interactions between normal and adenocarcinoma bearing tissues in response to radiation. Br J Cancer 1994;69:883-889.
134. Nagler RM. Extended-term effects of head and neck irradiation in a rodent. Eur J Cancer 2001;37:1938-1945.
135. Chiang CS, McBride WH, Withers HR. Radiation-induced astrocytic and microglial responses in mouse brain. Radiother Oncol 1993;29:60-68.
136. Price RE, Langford LA, Jackson EF, et al. Radiation-induced morphologic changes in the rhesus monkey (Macaca mulatta) brain. J Med Primatol. 2001;30:81-87.
137. Mildenberger M, Beach TG, McGeer EG, et al. An animal model of prophylactic cranial irradiation: histologic effects at acute, early and delayed stages. Int J Radiat Oncol Biol Phys 1990;18:1051-1060.
138. Reuss B, Dono R, Unsicker K. Functions of fibroblast growth factor (FGF)-2 and FGF-5 in astroglial differentiation and blood-brain barrier permeability: evidence from mouse mutants. J Neurosci 2003;23:6404-6412.
139. Willis CL, Leach L, Clarke GJ, et al. Reversible disruption of tight junction complexes in the rat blood-brain barrier, following transitory focal astrocyte loss. Glia 2004;48:1-13.
140. Singhal S, Mehta J, Desikan R, et al. Antitumor activity of thalidomide in refractory multiple myeloma. N Engl J Med 1999;341:1565-1571.
77

141. Anscher MS, Garst J, Marks LB, et al. Assessing the ability of the antiangiogenic and anticytokine agent thalidomide to modulate radiation-induced lung injury. Int J Radiat Oncol Biol Phys 2006;66:477-482.
142. Kim KT, Chae HS, Kim JS, et al. Thalidomide effect in endothelial cell of acute radiation proctitis. World J Gastroenterol 2008;14:4779-4783.
143. Ansiaux R, Baudelet C, Jordan BF, et al. Thalidomide radiosensitizes tumors through early changes in the tumor microenvironment. Clin Cancer Res 2005;11:743-750.
144. Gutman M, Szold A, Ravid A, et al. Failure of thalidomide to inhibit tumor growth and angiogenesis in vivo. Anticancer Res 1996;16:3673-3677.
145. Minchinton AI, Fryer KH, Wendt KR, et al. The effect of thalidomide on experimental tumors and metastases. Anticancer Drugs 1996;7:339-343.
146. Segers J, Di Fazio V, Ansiaux R, et al. Potentiation of cyclophosphamide chemotherapy using the anti-angiogenic drug thalidomide: importance of optimal scheduling to exploit the 'normalization' window of the tumor vasculature. Cancer Lett 2006;244:129-135.
147. Daruwalla J, Nikfarjam M, Malcontenti-Wilson C, et al. Effect of thalidomide on colorectal cancer liver metastases in CBA mice. J Surg Oncol 2005;91:134-140.
148. Moreira AL, Friedlander DR, Shif B, et al. Thalidomide and a thalidomide analogue inhibit endothelial cell proliferation in vitro. J Neurooncol 1999;43:109-114.
78

APPENDIX A. SUPPLEMENTAL DATA
Days post surgery
0 5 10 15 20 25 30 35
# of
ani
mal
s
2
4
6
8
10
12
14
16
18
20
Tumor only Tumor + RT Tumor + RT + Thalidomide
Figure A-1. Graph depiction of the number of surviving animals at each five day time point. Animals which did not undergo RT had drastically reduced survival times compared to those who received RT. Thalidomide treatment did not affect the survival to 65 days post surgery (not shown).
79

y = 0.456x - 7.387R² = 0.376
0
50
100
150
0 50 100 150 200
Tum
or v
olum
e (m
m3 )
es
timat
ed fr
om su
rfac
e of
the
brai
n
Tumor volume (mm3) estimated from coronal section
Figure A-2. Correlation between tumor volume estimated from the tumor area on the surface of the brain and coronal cross sectional area. Volume was estimated using the axis measurements of the tumor on surface of the brain and the cross sectional measurements. There is a correlation factor of R2 = 0.376 (P=0.059, n=10).
80

y = 0.892x - 3.683R² = 0.992
y = 1.069x - 5.275R² = 0.917
y = 0.413x - 1.022R² = 0.998
y = 0.932x - 4.071R² = 0.977
y = 1.327x - 6.175R² = 0.980
y = 1.378x - 5.758R² = 0.998
y = 1.428x - 7.062R² = 0.952
y = 0.828x - 3.011R² = 0.996
y = 1.252x - 5.596R² = 0.991
y = 1.470x - 7.343R² = 0.948
0
2
4
6
8
10
12
14
16
0 5 10 15
Nor
mal
ized
surf
ace
area
Days post surgery
1
2
3
4
5
6
7
8
9
10
y = 1.111x - 4.149R² = 0.984
y = 0.454x - 1.259R² = 0.999
y = 1.273x - 5.157R² = 0.996
y = 1.050x - 3.684R² = 0.966
0
2
4
6
8
10
12
14
16
0 5 10 15
Nor
mal
ized
surf
ace
area
Days post surgery
1
2
3
4
Figure A-3. Plots of the rate of growth from 5 to 15 days in the tumor implant group. To try and distinguish between the terminal tumor implant group (top graph) and the tumor implant group that regressed (bottom graph) the slopes of their growth were graphed. No significant difference could be found between the two groups (n=14).
81

Figure A-4. Cross sectional area of the tumor post sacrifice. The cross sectional area of the tumor was measured post sacrifice to investigate if there was a significant difference between the groups. No significance was found (mean±SEM are shown, Dunnett’s test).
82

y = 0.257x - 3.618R² = 0.096
0
2
4
6
8
10
12
14
0 10 20 30 40 5
# of
rol
ling
leuk
ocyt
es p
er
vess
el
Permeability (cm/s x 10-7)0
y = 0.028x + 0.186R² = 0.007
0
1
2
3
4
5
6
7
8
20 25 30 35 40 45# of
adh
ered
leuk
ocyt
es /
100µ
m
of v
esse
l len
gth
Permeability (cm/s x 10-7)
Figure A-5. Correlation between change in permeability and leukocyte interactions. No significant correlation could be found between permeability and leukocyte interactions.
83

APPENDIX B. DIFFERENCE BETWEEN PERMEABILITY DYES
Texas Red Dextran 3kDa FITC Dextran 4kDa
Pre-injection
0.5 min post-injection
5 min post-injection
Pre-injection
0.5 min post-injection
5 min post-injection
Figure B-1. Images of the brain vasculature post dye injection of Texas-Red and FITC dextran.
84

10 min post-injection 10 min post-injection
15 min post-injection
20 min post-injection
40 min post-injection
15 min post-injection
20 min post-injection
40 min post-injection
Figure B-1 (continued).
85

Table B-1. Comparisons of average intensities.
Average Intensity Average Intensity Vessel Tissue Difference Vessel Tissue Difference Pre 166 162 6 Pre 192 287 -95* 0.5 1487 829 658 0.5 1054 742 312 5 776 482 294 5 438 427 11 10 607 398 209 10 313 349 -36* 15 534 364 170 15 286 345 -59* 20 459 328 131 20 284 346 -62* 40 373 283 90 40 209 292 -83*
FITC would be the permeability tracer of choice because the hemoglobin blocks its fluorescence therefore it limits the amount of fluorescence in the tissue from vasculature fluorescence scatter. * Negative number indicates that the tissue is brighter in intensity than the vessel.
86

APPENDIX C. BIOLOGICAL EFFECT DOSE (BED) CALCULATIONS
BED formula:
BED= D x (1 + d/ (α/β)) (Equation C-1) α/β = 2 (for the brain) d = dose per fraction D = total dose BED = biological effect dose Single dose: High Single Dose of 20 Gy: 20(1+(20/2)) = 220 BED High Single Dose of 30 Gy: 30(1+(30/2)) = 480 BED Fractionated regimen: Fractionated Regimen of 40 Gy Total: 40(1+(8/2)) = 200 BED Reverse calculation to find the equivalent dose (Gy) 200/(1+(2/2)) = 100 Gy Clinical regimen: 60Gy in Patients: 60(1+(2/2)) = 120 BED 80Gy in Patients: 80(1+2/2)) =160 Table C-1. Comparisons of the different radiation regimens.
Radiation Regimen Dose (Gy) Fraction (Gy) BED
Single Dose 20 N/A 220 30 N/A 480
Fractionated Dose 40 8 200
Patient Dose 60 2 120 80 2 160
87

88
VITA
Janice Ann Zawaski was born in Edmonton, Alberta, Canada in 1982. She attended Ecole Secondaire Beaumont Composite High School, Beaumont, Alberta where she graduated in 1999. Following graduation, she attended Mississippi State University, on a track and field scholarship, where she studied Biological Engineering. In 2004, she moved to Memphis, Tennessee to study Biomedical Engineering in the University of Tennessee Health Science Center and University of Memphis Joint Program in Biomedical Engineering. She obtained her PhD in Biomedical Engineering and Imaging in May 2009.