the combination of proteins, amino-acids, etc., with acids...
TRANSCRIPT

364
The Combination of Proteins, Amino-Acids, etc., with Acids and Alkalis, and their Combining Weights as determined by Physico-Chemical Measurements.—Preliminary Paper.
By Leslie J. H arris.
(Communicated by Prof. F. G. Hopkins, F.R.S.—Received September 18, 1924.)
In previous communications (1) the writer described a system for estimating and characterising the amino-acids which depends on the ka and kb* values of these bodies. The modus operandi of the technique is to determine the amounts of acid or alkali required to titrate the amino-acid- (or dipeptide-, etc.) solutions over definite ranges of pn or to definite pn end-points ; it rests on the knowledge that the weaker an acidic (or a basic) group the greater will be the degree of alkalinity (or acidity) developed during its titration with strong alkali (or acid).
After the addition of each increment of acid or alkali the pH is determined. One plots pa against, not the actual amount of alkali (or acid) added, but against this amount corrected for the “ hydrogen ion error.” The correction is made by subtracting from the amount of alkali (or acid) added, the amount of alkali (or acid) which would have to be added to a hypothetical blank consisting of water only in order to produce the same total volume of liquid having the same pB as the amino-acid alkali (or acid) mixture, f The corrected value represents the amount of alkali (or acid) required to bring the amino- acid itself to the given value, while the correction is the amount required by the water present.
The curves obtained by plotting pn against such corrected titration readings will henceforth be referred to as “ pn-acid combination curves ” or “ pn-alkali combination curves.”\
* Jca and being the apparent dissociation constants, the symbols K A and K 1; being used by Bjerrum for the true constants of the zwitterion.
t The assumption may be made that the activity of the hydroxyl (or hydrogen) ion is the same in the hypothetical blank and in the ampholyte mixture without appreciably affecting the accuracy of the results discussed in this paper.
X It will be shown (p. 371) that the pH-acid combination curve may represent either the dissociation curve of the amino group or the dissociation residue curve of the carboxyl group. In either case the added acid actually enters into combination with the amino-acid. Similarly, the -alkali combination curve may be either the dissociation curve of the carboxyl group or the dissociation residue curve of the amino group.
on July 15, 2018http://rspb.royalsocietypublishing.org/Downloaded from

Combination o f A m pholytes w ith A c id s a n d A lka lis . 365
Similar methods for correcting titration curves have been employed by Hitchcock (2) for protein solutions, and by Tague—in part—(3) for the action of soda on amino-acids.
Dissociation Constants of Amino-Acids.For the work previously described it was necessary to give as complete
a list as possible of the dissociation constants of the various amino-acids of biochemical occurrence; and several values, for tyrosin, lysine and arginine, due to Kanitz were corrected, and alternative values depending on titration curves were put forward. The dissociation constants of arginine have since been determined by Prof. Andrew Hunter (private communication), who finds =4-97 , pkb2 — 11*92, pk>a — 12*85, all of which are in good accord with the predictions made by the writer for titration purposes. In the case of tyrosin, I am indebted to Dr. Aristides Kanitz for pointing out that the inaccuracy of his values arose from neglecting (4) the dissociation of the acid salt in neutral salt and free acid ; and Dr. Kanitz proposes to recalculate his measurements and probably reinvestigate the whole question.
To make the titration method strictly applicable to mixtures containing all the amino-acids resulting from protein hydrolysis, the writer has still to determine the exact dissociation constants of the following:—tryptophane, cystine; hydroxyglutamic acid, proline and oxyproline, Mueller’s amino-acid (5) and the unidentified sulphur containing grouping in ovalbumin (6). I have shown that the first two of these amino-acids have constants approximating to those of the other “ neutral ” or monoamino-monocarboxylic acids (7).
Application to Proteolysis Mixtures.By titrating to definite pn end-points the writer was able to estimate
separately each of the following amino-acids present in complex mixtures of monoamino-monocarboxylic acids : glutamic (and/or aspartic acid), lysine (and/or arginine), histidine (8). More detailed information can be obtained by determining the complete pH-acid (-alkali) combination curve of a hydrolysis fluid, and resolving it into its various components. This method depends on the fact that different fractions of the various amino-acids present are neutralised over varying pn zones. For example, the corrected amount of standard acid required to titrate a mixture of amino-acids from pu7 to 6 is stoichio- metrically equal to a per cent, of the total histidine present, plus b per cent. * of the total glutaminic acid present, plus c per cent, of the total aspartic acid present; where the values of a, b, c, etc., can be calculated from the respective
on July 15, 2018http://rspb.royalsocietypublishing.org/Downloaded from
366 L. J. Harris.
dissociation constants of the amino-acids, and > > c. Similar readings are taken over other pu ranges and a series of simultaneous equations obtained which on solution gives the amounts of the various groups of amino-acids present. Owing to overlapping of the various curves greater accuracy can be obtained when a previous separation into groups has been effected, e.g., after separation of the hexone bases. In any solution of free amino-acids, polypeptides, etc., very accurate estimate can be obtained of (1) the total amino groups or (2) total carboxyl and other acidic groups, since these are equivalent to the amounts of (1) acid or (2) alkali required in the pH-alkali combination curve taking the titration respectively to (1) pH ^ 0 • 5, and (2) pHs 11-7.* Beyond these pn limits the amounts of acid or alkali remain constant and parallel with the pa axis. The writer has evidence that the results obtained by such methods are far more nearly quantitative than those by the methods of separation and estimation hitherto in use.
I.—D issociation Constants of Methylene-imino Acids.
In examining the theoretical basis of the Sorensen method of estimating amino-acids, i.e., by titrating in presence of formol with soda to phenol- phthalein, I expressed the view (9) that the method depended on the formation of methylene derivatives having dissociation constants of the order 103 times as great as those of the amino-acids from which they were derived. As a result of more recent calculations I am now able to confirm the accuracy of this hypothesis.!
To solutions of amino-acids in presence of formol, soda was added little by little and the pn determined colorimetrically after each addition. Each reading of the burette was corrected for the amount of N/10 soda which had to be added to a blank consisting of water and formol in order to produce the same final volume and the same pn. The acid dissociation constant was determined from the mid-point of the resulting pH-alkali combination curve, where
p K 0 = p n .
The curves throughout their length conform closely with the theoretical curves for the given Ka values, and therefore show no appreciable sign of the suggested reaction
R (COONa) -NH = CH2 ^ R(COOH) NH2+ OCH2 + NaOH *T" 2H20
* Starting from the actual pH of the free amino-acid mixture. •f In the case of one amino-acid, glycine, the increase is more nearly 101.
on July 15, 2018http://rspb.royalsocietypublishing.org/Downloaded from

Combination o f Ampholytes ivith Acids and A lkalis. 367“
Table I.—Approximate Dissociation Constants of Methylene-Imino Derivativesof Amino-Acids.
Methylene derivative. Free amino-acid. Order of increase.
pK'a K'a. 3>K„. K,;. K//Ka.
Glycine .................... 5-4 4 X 10⁻⁶ 9-7 2 X10_1° 10*
Alanine....................... 6-3 5 X 10~7 9-7 2 X 10⁻¹⁰ 103
Phenyl-alanine............ 5-9 1 - 3x 10~® 8-6 2-5x10-® 103
Tyrosine—K„ ...................... 6-2 6-3X 10~7 9-4 4X10⁻¹⁰ 103
Ka,...................... (ca. 9 ca. 10-9) 10-4 4X 10~n —
Apartic acid—K,, ...................... < 3 > 10-3 3-8 1- 5X 10"J —
Ka2 ...................... 6*9 l-3xl0~7 9-9 1-3X10-™ 103
Glutamic acid—K.,i ...................... <3 - 5 > 3X10⁻¹ 4-4 4 X 10⁻⁵ —
K»; ...................... 6-8 1*6 x 10“7 9-8 1 - 6x 10_1° 103
which Sorensen supposed to proceed from left to right in presence of insufficient soda. Such a reaction may possibly occur in more acid solutions than those examined, in absence of soda, or with the addition of mineral acid.
The dissociation curves of the methylene compounds confirm the writer’s observation (9) that amino groups in the “ neutral ” and “ acidic ” amino- acids may be estimated by back titration from phenolphthalein or thymol- phthalein (end point in Sorensen titration), to methyl red. The explanation therein advanced {loc. cit.) is shown to be the correct one, at pH5 (end point in methyl red back titration) the methylene derivatives of the “ neutral ” ampholytes being in the form of the uncombined molecule and the methylene derivatives of the “ acidic ” ampholytes as mono-sodium salts. This procedure is not available for diamino acids owing to the formation of acidic derivatives ; accordingly the general methods devised by the writer for estimating amino- and carboxyl- groups consisted of titration in alcohol instead of formol to thvmolphthalein and back titration to methyl red respectively. The effect of alcohol on the acid dissociation constants of the amino-acids is similar to that of formol.
II.— E stimation of Amino-Acids by Conductivity Measurements.Widmark and Larsson (10) in a recent paper state that amino-acids on con
ductometric titration with soda behave as weak acids, and exhibit no signs of
on July 15, 2018http://rspb.royalsocietypublishing.org/Downloaded from

368 L. J. Harris.
amphoteric behaviour. The present writer, however, finds that both amino- and carboxyl-groups in amino-acids may be estimated by conductivity measurements. Plotting conductivity against burette reading the end-point in the addition of one equivalent of alkali or acid is indicated by a sharp change in the direction of the conductivity curve.
The calculation from dissociation constants of the conductivities of ampholytes in presence of acids and alkali will be dealt with subsequently.
III.—The H ypothetical E xtra-Amino and E xtra-Carboxyl Addition of
Acids and Alkalis.
It is well known that in the removal of free -NH2 groups in proteins by the action of nitrous acid, as in the production from gelatin of deaminised-gelatin, the power of combining with acids is only partially lost. The explanation has frequently been advanced that the peptide linkage may be able to combine with acids or alkalis with accompanying keto -> enol transformation. The writer has shown that this explanation is untrue in the case of dipeptides, where combination with acids and alkalis is apparently restricted to the amino- and carboxyl-groups respectively, the fact that dipeptides require more acid or alkali than is the case with amino-acids to bring to a given value being simply a result of their higher kb and ka values.
It seems not unlikely therefore that the residual combining power of de- aminised protein for acids may be due to the survival of basic groups, such as imino and amide radicles, rather than to addition at the peptide linkage.
With a view to the solution of this problem I am pursuing enquiries into the pH-combination curves of tripeptides and the more complex ampholytes.
IV.—E stimation of Proteins by Titrations.
No attempt has hitherto been made, so far as the present writer is aware, to utilise a pH-combination curve of a protein for analytical purposes, although the writer has previously (1) indicated the possibility.
The work of Loeb (11) and his co-workers has established the fact that proteins combine with acids on the acid side of the iso-electric point and with bases on the alkaline side. Hitchcock (2) has examined the pB value of solutions of fixed volume containing known amounts of hydrochloric acid, and has corrected for the effect of hydrochloric acid on the solvent in a manner similar to that employed by the writer for the titration of amino-acids with HC1 and soda, and by Tague (3) for soda.
In the case of amino-acids and dipeptides the conditions of titration were
on July 15, 2018http://rspb.royalsocietypublishing.org/Downloaded from
Combination o f Ampholytesivith Acids and Alkalis. 369
pre-determined from the magnitude of the dissociation constants (1) (determined from conductivity measurements, or pH-acid or -alkali combination curves), but in the case of the more complex ampholytes the dissociation constants have not been determined and the analyst must be guided by the experimentally determined pH-acid or -alkali combination curves. These curves admit of a number of possible alternative values of Ka and Kfc (see below).
The method adopted for estimating proteins is to determine the amount of HC1 (or alkali) required to titrate a given volume of a solution from one definite pH to another, correcting for the amounts of HC1 (or alkali)—of the same activity—required in a hypothetical blank free from protein which in each case is taken to the same pH value and to the same final volume. The corrected amount so required is strictly proportional to the amount of protein present. This relation is required by the mass law, since at any pH value there must be a constant ratio between the amount of any free weak base (or free weak acid) and that present as hydrochloride (or sodium salt) in thensolution.*
[H*] [A'] [HA]
i.e.,log[ H - r IogK0 + % - « )
= log 1 4- locr tSalt •
and [B*] [OH]BOH 6
i.e.,,0g[ H - r ,0g£ + l0g( a ’
the well-known Hasselbach(12) equation.Each protein comprises a mixture in definite proportions of such weakly basic
and acidic groups.Controls may be taken if desired consisting of solutions of the protein at
varying dilutions and temperatures in order to make allowance for any slight change in Ka, K6, ionic activity, or K w, with these factors.
* Cases where either the protein or its salts are removed from the sphere of equilibrium owing to insolubility require special treatment.
VOL. XCVII,— B. 2 E
on July 15, 2018http://rspb.royalsocietypublishing.org/Downloaded from

370 L. J. Harris.
My estimations have been carried out mainly with casein. Solutions were prepared containing 0*5, 1-0, 1*5, 2, 2-5, 3, 4, etc., per cent, of this protein, and it was found possible to estimate the amount present with an accuracy equal to that attained in an ordinary acid-base titration. Most accurate results were obtained from titrations which were nob carried out to highly acid or alkaline points, because there the blank corrections assume very large magnitudes in proportion to the amount of titrant required by the protein itself. Thus the approximate blank corrections per 100 cubic centimetres of solution a tp H 3, 2, 1 are 1, 10, 100 cubic centimetres of N/10 soda respectively. Fuller details of the estimations with casein will be published in a later paper.
It is often possible to discriminate between two or more proteins in a solution and estimate each. The amount of N/10 HC1 required by a mixture in the pH-acid combination curve between two given pH values is the sum of the amounts required separately for each of the constituents. Each protein possesses a characteristic pn neutralisation curve, and often widely different amounts of acid or alkali are required to titrate equal amounts of two different proteins over the same ps range. The greater the variation of such differences over different pn zones the greater is the accuracy with which each of two constituents in a mixture may be determined.
Let readings be taken over two pn ranges from pna to and from pnb to pnc. Of two proteins, “ X ” and “ Y,” let the first require x cubic centimetres and x' cubic centimetres of N/10 HC1 per gm. respectively in the pH-acid combination curve over the two stated pn ranges, and let the second require y and y' cubic centimetres respectively. Now suppose that a mixture of the two proteins requires m and m' cubic centimetres respectively.
The amount of each protein present may then be calculated from the simultaneous equation
m = Xx -f- Ym' = Xz' + Yy'
where X and Y are the unknowns, viz., amounts of the two proteins present.When the pH neutralisation curves of the two proteins are of the same form
throughout, no discrimination is possible, since
xjx’ =
and the equations become insoluble.If there are three unknowns, at least three titration readings must be taken,
and so on. The same applies for titration with alkali.For any given protein the pH-acid (or alkali) combination curve is practically
on July 15, 2018http://rspb.royalsocietypublishing.org/Downloaded from
Combination o f Ampholytes with Acids and Alkalis. 371
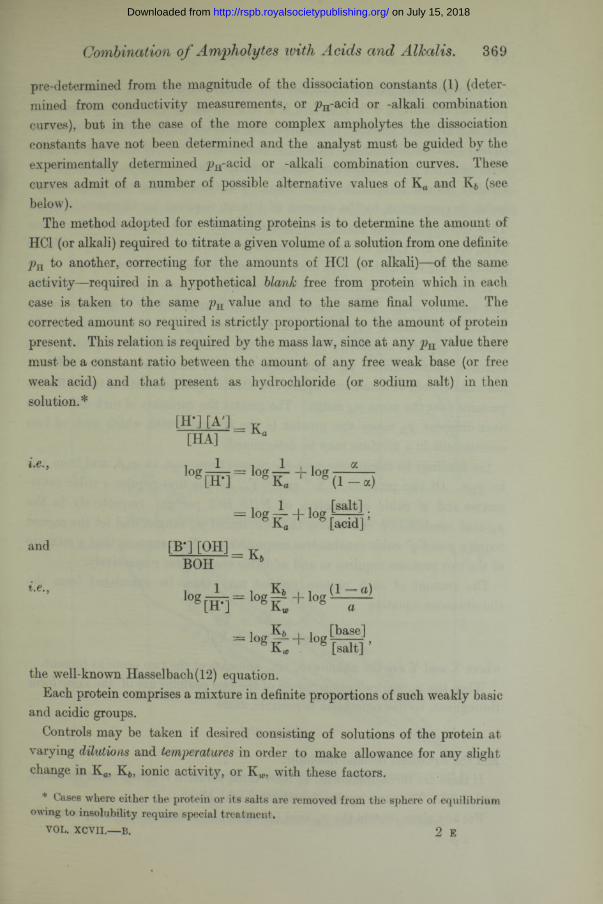
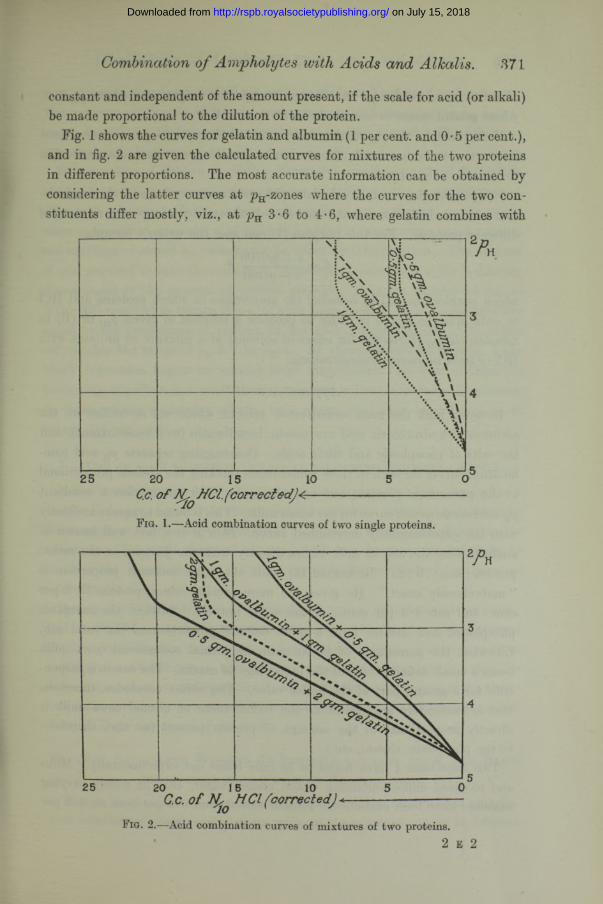
constant and independent of the amount present, if the scale for acid (or alkali) be made proportional to the dilution of the protein.
Fig. 1 shows the curves for gelatin and albumin (1 per cent, and 0 • 5 per cent.), and in fig. 2 are given the calculated curves for mixtures of the two proteins in different proportions. The most accurate information can be obtained by- considering the latter curves at pH-zones where the curves for the two constituents differ mostly, viz., at pn 3-6 to 4*6, where gelatin combines with
\ 1
> . %
S\o
% \%
%* \\ \%. "X '=\ vi \
% \ \ \ \ i
25 20 15 10 5 0
%
3
4
5
Cc. o f (corrected]<
Fig. 1.—Acid combination curves of two single proteins.
20 15 10C.c. o f N/q MCI (corrected] ■
2A
3
A
5
Fig. 2.—Acid combination curves of mixtures of two proteins.2 E 2
on July 15, 2018http://rspb.royalsocietypublishing.org/Downloaded from

372 L. J. Harris.
about twice as much acid as albumin (weight for weight), and above pH 2-6, where gelatin ceases to combine with further acid.
Unfortunately, the pn combination curves of the various proteins are found in practice to be too much alike to render possible very much discrimination in the case of mixtures.
It is possible, however, to calculate with great accuracy both (1) the combination curve and (2) the actual (uncorrected) titration readings of a mixture of different proteins. For this purpose (2) one uses the writer’s formula
.7 i4~ *l - g / 1 ’
which enables one (A) to calculate the proportions in which proteins and HC1 or soda must be mixed in order to produce a solution of given pH, or (B) to calculate the pn (corrected for effect of solvent) of a mixture of proteins with HC1 or soda in known concentrations.
Application to Milk.In cowrs’ milk the main constituents present which act as buffers on the
addition of hydrochloric acid are casein, lactalbumin (to a lesser extent), and the salts of phosphoric and citric acids. Constructing separate pH-acid combination curves for each of these constituents (making the absissse proportional to the percentage present) one can obtain by their summation a resultant pH-acid combination curve for the whole milk. This is found to agree excellently with the experimentally determined curve. Now it is a fact well known to analysts that the ash in milk varies directly with the protein, in the ratio : protein : ash :: 9 : 2. Richmond(13) finds that this constant proportion is “ marvellously exact.” He gives the more precise values, protein 37-8 per cent, and ash 8-3 per cent., of the solids not fat. Further, the inorganic phosphates and citrates form a quite definite proportion of the total ash. Likewise, the percentage of lactalbumin in normal commercial cows’ milk bears a small definite ratio to the percentage of casein. The casein is responsible for a greater part of the buffer value. The writer concludes, therefore, that in moderately acid solutions the buffer value of normal cows’ milk is directly proportional to tfie amount of protein present (as also, therefore, to the phosphate, citrate, etc.).
This conclusion I have found to be fully borne out experimentally. Milks and modified milks containing water, cream, sugar, etc., in widely varying amounts have been examined. Protein varied from 0-3 per cent, to 3-5 per
* ‘ Roy. Soc. Proc.,’ B, vol. 95, p. 459 (1923).
on July 15, 2018http://rspb.royalsocietypublishing.org/Downloaded from

Combination o f Ampholytes with Acids and Alkalis. 373
cent., fat from 4 per cent, to 0-7 per cent., sugar from 7 per cent, to 3 per cent. The presence or absence of fat and sugar made no difference to the pu curve, which depended entirely on the percentage of protein present. The following directions may be given :—
Determination of Protein in Milk.—Successive small amounts of N/10 HCl are run from a burette into a given volume of milk and the is determined after each addition. Three or four such readings are sufficient, as the result when pHis plotted against c.c. of N/10 HOI added is practically a linear relation and readings at stated pK values may be taken by intrapolation. The amount of acid required to take the milk from one given pa value to another is directly proportional to the amount of protein present. Thus the number of c.c. of N/10 HCl required to titrate 10 c.c. of milk from 6 • 65 to 5-2 is numerically equal to the percentage of protein in the milk. Readings should be taken only within the range of pH 6-7 to pK 4. At values more acid than pu 4 the blank correction begins to assume large magnitudes. By this method the percentage of protein in normal commercial cows’ milk or modified milk mixtures (including those containing alkalis, lime water, etc.) may be determined to within 0-1 per cent.
V.— U se of p h-0 ombination Curves in following Chemical Changes.
Is the transformation of a native protein into a metaprotein a physical or a chemical change ; merely a change in the colloidal system; a tautomeric rearrangement; or a slight hydrolysis ? Each of these possibilities has its advocates. The only chemical change which has been shown definitely to occur is the liberation of a grouping (presumably sulphydryl) reactive to nitroprusside (14).
During the hydrolysis of a given weight of protein with ferments or strong acid or alkali, it can be shown that the acid and alkali binding power as measured by the pH-combination curve continually increases owing to liberation of fresh —NH2 and —COOH groups, and that the apparent (or mean) basic and acidic dissociation constants undergo a like change. Similarly, if a protein in denatura- tion undergoes hydrolysis it will be revealed by the pH-eombination curves. Further experiments are in progress.
VI.—The E quivalent Weights of P roteins towards Acids and Bases determined from P hysical Measurements.
Loeb in his classical investigations (11) on the colloidal behaviour of proteins, took solutions of proteins which were made up to a constant volume at different
on July 15, 2018http://rspb.royalsocietypublishing.org/Downloaded from

374 L. J. Harris.
ps values, and determined conductivity, membrane potential, cataphoretic charge, swelling, viscosity, osmotic pressure, all of which he plotted against pn.
Adopting a different procedure I have devised a method which appears capable of determining the equivalent weights of the proteins. Increasing amounts of acid or alkali are added to a protein solution and after each addition a measurement is made of a physical constant (either viscosity, total swelling, osmotic pressure, or conductivity, etc.). The latter is then plotted against amount of acid or alkali added, not pn. The curve is marked by a very sharp maximum or kink,* which, in cases where the equivalent weight of the protein is already known from the combination curve (or from conductivity) is found to coincide with the addition of exactly one equivalent of acid or alkali.
Loeb attributed the maxima in his pn curves to the fact that “ the solubility of the protein increases considerably at this point.” It must, however, be emphasised that the addition of an equivalent amount of acid or alkali to a given protein does not necessarily produce a constant pn. The pn depends on factors such as concentration of protein, change of Kw with temperature.f The relative difference between the number of cubic centimetres of acid or alkali required to titrate a protein solution to a given pn and that actually in combination with the protein at that pH (viz., the distance between the uncorrected ps titration curvej and the ps combination curvej) increases with increasing dilution of the protein and varies inversely with the strength of the acid or alkali employed for the titration. Therefore, while the maxima for conductivity, etc., occur with the addition of a constant proportion of acid or alkali to the protein (practically irrespective of dilution), the observed pK may show considerable variation. Good agreement is generally obtained between the values for the equivalent weight of the protein as estimated by the several methods. The following values were calculated on the assumption that the maximum or kink occurs with the addition of one equivalent of acid or alkali. They must be regarded as first approximations only.
Loeb’s figures have been freely used in the calculations for the above table.
* It may be noted that Graham (‘ Phil. Trans.,’ A, vol. 157, p. 373 (1861)) inclined to the view that a maximum point in a viscosity curve indicated the existence of a compound and established its composition. Nevertheless, this “ simple view,” although it has been proved to be true for a considerable number of cases, has been generally criticised by subsequent writers.
f This has a considerable effect on the blank correction curve for NaOH.X The scale for acid or alkali added being drawn inversely proportional to amount of
protein present, so that the pn combination curve is identical at all dilutions.
on July 15, 2018http://rspb.royalsocietypublishing.org/Downloaded from

Combination o f Ampholytes with Acids and Alkalis. 375
Table II.—Approximate Equivalent Weights of Proteins expressed in Termsof Decinormal Acid or Alkali.
Protein. Method.
As a base. Cubic centimetres
of N/10 acid equivalent to 1 gm.
of protein.
As an acid.Cubic centimetres
of N/10 alkali equivalent to 1 gm.
of protein.
Gelatin. ^-combination ......................... 9 > 6Relative volume ......................... 8-5 6-5—8-7Viscosity ...................................... 9Sp. conductivity ......................... 9Donnan equilibrium
Osmotic pressure (calc.) ....... 9
Edestin. Donnan equilibriumOsmotic pressure (calc.) ....... 5-6
^-combination ........................ 5 ’6
Serum globulin. Donnan equilibriumOsmotic pressure (calc.) ....... 7
Isoelectric casein* ^^-combination ............... ......... > 7 - 5 > 224-6). Solubility ...................................... 15
Viscosity ...................................... 15Relative volume in solution....... 15 24
Ovalbumin. pH-combination ......................... = 8-5 > »Donnan equilibrium
Osmotic pressure (calc.) ....... ca. 8*5
* The protein was not necessarily at the isoelectric point at the commencement of the curve, but a rough correction, found by interpolation, was applied for the amount of acid or alkali required to bring it from the isoelectric point into solution at the given initial p
In'plotting conductivity either of two procedures may be adopted : (1) Observed conductivity may be plotted against acid or alkali added. The curve is practically linear up to the addition of one equivalent of acid or alkali when the direction sharply changes and a fresh linear relation is taken up showing less increase of conductivity per unit addition of titrant. (2) Alternatively, from each conductivity value one may deduct the specific conductivity of a blank consisting of the same volume of water plus acid at the same pH. The curve thus obtained increases linearly up to the addition of one equivalent of acid or alkali (complete conversion of protein into protein-salt), beyond which it remains constant and represents the specific conductivity of the protein- salt.
Loeb (‘ J. Gen. Physiol.,’ vol. 1, p. 569 (1919)) plotted such conductivity
on July 15, 2018http://rspb.royalsocietypublishing.org/Downloaded from
376 L. J. Harris.
measurements against pK but failed to mark a break in the curve. This was largely due to his preoccupation with pH values rather than amounts of acid added. “ The knowledge of these curves ” readings) “ forces the experimenter to change his methods and to base all the comparisons of the influence of ions on the physical properties on protein solutions of equal hydrogen ion concentration ” (Loeb : “ Proteins and the Theory of Colloidal Behaviour,” 1922, p. 64; present writer’s italics). There is here a failure to realise that the same protein salt having identical amounts of anions or cations in combination gives rise to solutions of varying pu in the presence of varying volumes of water; owing to dependence of percentage hydrolysis on relative dilution, as mentioned above.*
Osmotic pressure (Donnan equilibrium) curves of several proteins examined give values for equivalent weights of the proteins agreeing well with those determined from the other curves, provided that the osmotic pressure be calculated from the observed pH within and without the membrane by Loeb’s Donnan Equilibrium formula (15). The maximum osmotic pressure occurs when the liquid inside the membrane contains an amount of acid or alkali equivalent to the protein present. There are serious experimental difficulties and errors in the direct determination of osmotic pressure, and the values for equivalents deduced therefrom are consistently low (vide section VII).
The determination of membrane potentials leads to a number of anomalous results, as has been observed by Loeb (15). The writer notes, however, that for several proteins an experimental maximum appears to occur when the pn outside the membrane is of that pH which would result inside the membrane if an equivalent of acid (or alkali) were added to the protein therein. A discussion of the theoretical basis of this observation must be postponed. Diffusion and change of volume and other causes tend to complicate the experimental investigation.
VII.— Osmotic Pressure and the D onnan E quilibrium in Acid-Base
Titrations.
Let a protein solution or suspension be enclosed in a collodion membrane immersed in water and increasing amounts of HC1 be run into it. Owing to the non-permeability of the protein molecules and ions a Donnan equilibrium is set up, the concentration of hydrogen ions being greater outside than inside the membrane. It will be shown below that the osmotic pressure reaches a
* Hitchcock has since given the N/10 HCl-conductivity curve for gelatin (‘ J. Gen. Physiol.,’ vol. 6, No. 2 (1924)).
on July 15, 2018http://rspb.royalsocietypublishing.org/Downloaded from

Combination o f Ampholytes with Acids and Alkalis. 377
maximum when the protein (or other non-diffusible base) is fully converted into protein chloride, i.e., when the added HC1 inside is equivalent to the total protein base present.*
The relative concentrations of ions is governed by two factors : (1) the Donnan Equilibrium; (2) the Mass Law Titration relation inside themembrane.
Osmotic pressure inside the membrane where [a]
Osmotic pressure outside membrane where x
[H‘] + [Cl'] + [a]= cone, of protein ions and molecules. = 2x= hydrian concentration outside
= chloridian concentration outside.Resultant osmotic pressure — [H*] + [CT] -f- [a] —
But by the Donnan Equilibrium principle
x- — [H‘] [CT]. Substituting in (1) and neglecting [a]
Osmotic pressure — [H*] 4 - [CT] — 2V [H ‘] [CT].
Now [H*] in this expression depends on the mass law relation. For each basic group present
(1)
7. _ [B‘][O H 'J_ [B‘] K„,6 [BOH] [BOH] [H‘]
x.e., 1 _kb [undissociated Protein Base][H* J K , [Protein Base*]
_ kb [undissociated Base] ,0vKW[CT]
assuming that there is complete electrolytic dissociation of the protein chloride
i-e-, rxj.-, Kw [CT][H*] =which may be written
kb [undissociated Base]
hjflOC[H‘]
wherekb (1 — a)
a =-- fraction of protein converted to chloride= fraction of one equivalent of HC1 added.
Substituting in (1) and neglecting [a]; for unit protein concentration
Osmotic pressure = 7~ — + a — 2 a / , K — — - .kb(1 — a) V (1 — a)* Ignoring for the moment the 44 hydrogen ion error.”
on July 15, 2018http://rspb.royalsocietypublishing.org/Downloaded from
378 L. J. Harris.
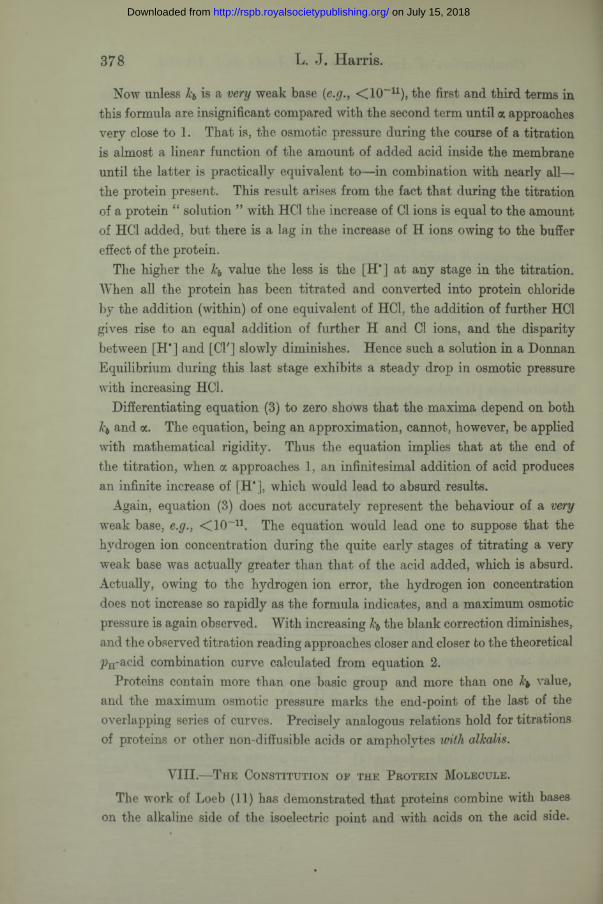
Now unless kb is a very weak base (e.g., <10~u ), the first and third terms inthis formula are insignificant compared with the second term until a approaches very close to 1. That is, the osmotic pressure during the course of a titration is almost a linear function of the amount of added acid inside the membrane until the latter is practically equivalent to—in combination with nearly all— the protein present. This result arises from the fact that during the titration of a protein “ solution ” with HC1 the increase of Cl ions is equal to the amount of HC1 added, but there is a lag in the increase of H ions owing to the buffer effect of the protein.
The higher the kb value the less is the [H*] at any stage in the titration. When all the protein has been titrated and converted into protein chloride by the addition (within) of one equivalent of HCl, the addition of further HC1 gives rise to an equal addition of further H and Cl ions, and the disparity between [H*] and [CT] slowly diminishes. Hence such a solution in a Donnan Equilibrium during this last stage exhibits a steady drop in osmotic pressure with increasing HCl.
Differentiating equation (3) to zero shows that the maxima depend on both Jcb and a. The equation, being an approximation, cannot, however, be applied with mathematical rigidity. Thus the equation implies that at the end of the titration, when a approaches 1, an infinitesimal addition of acid produces an infinite increase of [H*], which would lead to absurd results.
Again, equation (3) does not accurately represent the behaviour of a very weak base, e.g., <O0~u . The equation would lead one to suppose that the hydrogen ion concentration during the quite early stages of titrating a very weak base was actually greater than that of the acid added, which is absurd. Actually, owing to the hydrogen ion error, the hydrogen ion concentration does not increase so rapidly as the formula indicates, and a maximum osmotic pressure is again observed. With increasing the blank correction diminishes, and the observed titration reading approaches closer and closer to the theoretical pH-acid combination curve calculated from equation 2.
Proteins contain more than one basic group and more than one kb value, and the maximum osmotic pressure marks the end-point of the last of the overlapping series of curves. Precisely analogous relations hold for titrations of proteins or other non-diffusible acids or ampholytes with alkalis.
VIII.—The Constitution of the Protein Molecule.
The work of Loeb (11) has demonstrated that proteins combine with bases on the alkaline side of the isoelectric point and with acids on the acid side.
on July 15, 2018http://rspb.royalsocietypublishing.org/Downloaded from

Combination of Ampholytes with Acids an d . 3 7 9
This has led to the assumption that the iso-electric protein is practically non- ionised, either as an acid or as a base. That the isoelectric protein molecule is ionised to a considerable extent as a base, and therefore also simultaneously as an acid, can be very easily shown in the case of gelatin as follows.
The acid combination curve of a monoacidic base, from 1 per cent, combination to 99 per cent., covers a range of 4 units, with the mid-point (where yjKtc — pKb — pH) at pu 2 units less than the approximate “ starting point ” of the titration (1 per cent, combination): this relation is found to hold with great accuracy (1). Now if isoelectric protein at pH 4 • 7 were practically non-ionised as a base, its pH combination curve could not be complete (99 per cent, combination) at ps less acid than 0-7 and half transformation could not occur at pu less acid than 2 • 7, as shown in BC, fig. 3. Actually, it will be noticed, the experimental titration curve lies over a much less acid range. Combination is practically complete (99 per cent.) at pH 2 • 4. Again, this fact implies that basic groups of gelatin can exist in the completely (>99 per cent.) non-ionised form only at reactions less acid than pK2 • 4 -(- 4 = pn6 • 4, as shown in EA, which is the pu combination curve for a base with end-point (99 per cent.) at pu 2-4. Since gelatin appears to contain more than one basic group, and the curves BC and EA represent minimal values for the case for non-ionised isoelectric gelatin is even more unfavourable than indicated by these curves. At pn 4-7, curve EA shows 34 per cent, ionisation. Hence isoelectric gelatin must be ionised as a base to at least 34 per cent.*
Since the isoelectric protein molecule is electrically neutral, it must be concluded that at the isoelectric point it is ionised equally as a base and as an acid. The curve BA, however, may represent equally either (1) the titration of the greater part of a basic group or (2) the back titration (replacement curve) of the greater part of a fairly strong acid group. In the latter case the isoelectric molecule is very highly ionised as both acid and base, and in a form analogous to Bjerrum’s (16) amino-acid “ zwitterion,” and total ionisation as both acid and base is at a maximum at the isoelectric point. In the former case total ionisation is at a minimum at the isoelectric point. Isoelectric gelatin therefore contains an equal number of basic and acidic groups, which may arise either (1) from two species of molecules, one functioning as an acid and one as a base, or (2) from the same molecule functioning simultaneously as acid and base, giving rise to an ammonium salt or “ zwitterion.”
Hitchcock (2) found that the half-ionisation ordinate in the titration curve
* In the foregoing argument complications arising from the insolubility of the isoelectric protein are ignored.
on July 15, 2018http://rspb.royalsocietypublishing.org/Downloaded from

0r
1
2A
3
4
5
6
7
8
9
10
1 1
12
L. J. Harris.
Cc. o f / f N a OK(corrected;Cc o f ^ N C I (corrected) +
Fig. 3.—-p combination curves of gelatin. ABX = experimental curves.
latin occurred at datin, assuming
>H 3 • 6, and therefore assumed that the “ ionising constant b to react as a mono-acid base,” was K = 2*4 X 10 4.
on July 15, 2018http://rspb.royalsocietypublishing.org/Downloaded from
In fig. 2 (p. 371), HG would represent the combination curve for gelatin if it had the suggested ionisation constant, and obviously leads to erroneous results. The observed combination curve does not cover the full jhi range for a complete undisturbed combination curve for a basic group, and hence it is illegitimate to deduce this ionisation constant from the mid-point.
It is difficult to find any combination of simple basic and acidic curves which on summation will result in the experimental curves shown in fig. 3.
IX.—B j ERRUM’S “ ZwiTTERION ” THEORY IN RELATION TO THE TlTRATION
T h e o r y a n d to P r o t e in s .
Bjerrum’s zwitterion theory as it affects the titration of ampholytes is discussed below in more special relation to the simple ampholyte glycine.
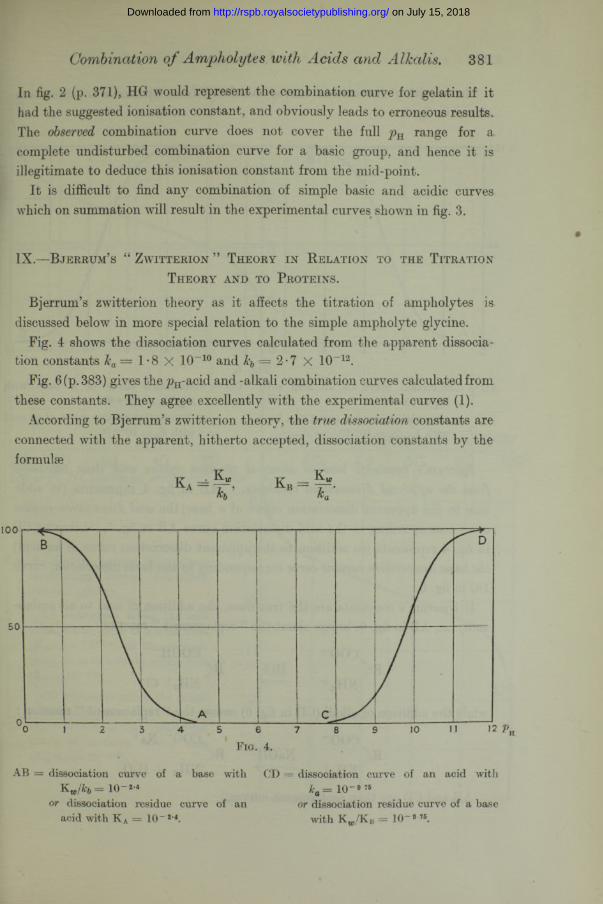
Fig. 4 shows the dissociation curves calculated from the apparent dissociation constants ka= 1*8 X 10~10 and kb = 2*7 X 10~12.
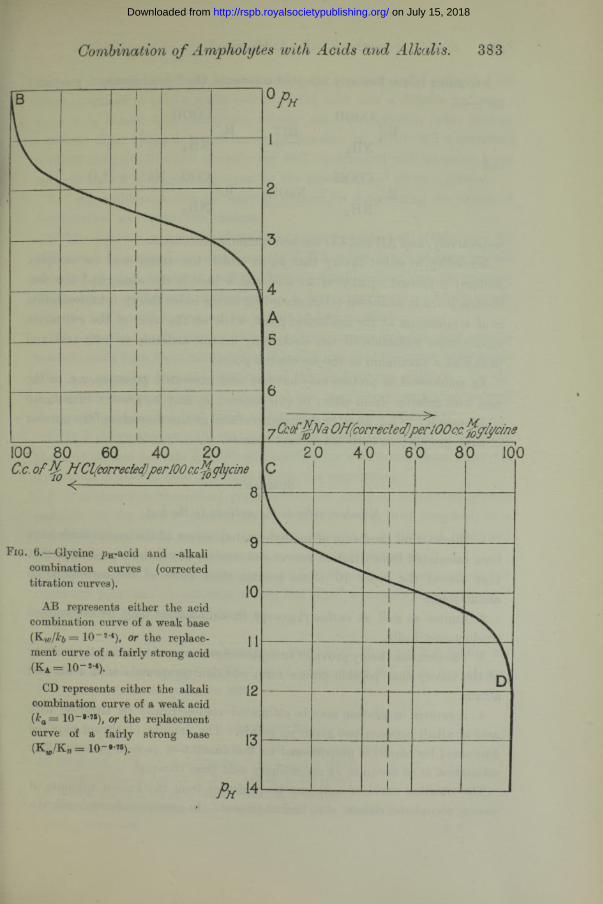
Fig. 6 (p. 383) gives the joH-acid and -alkali combination curves calculated from these constants. They agree excellently with the experimental curves (1).
According to Bjerrum’s zwitterion theory, the true dissociation constants are connected with the apparent, hitherto accepted, dissociation constants by the formula?
Combination o f Ampholytes Acids and Alkalis. 381
Fig. 4.
AB = dissociation curve of a base with CD = dissociation curve of an acid with Kw/i%=10-M 10-9 75
or dissociation residue curve of an or dissociation residue curve of a baseacid with K x = 10" *•«. with K w/K b = 10~9 76.
on July 15, 2018http://rspb.royalsocietypublishing.org/Downloaded from
382 L. J. Harris.
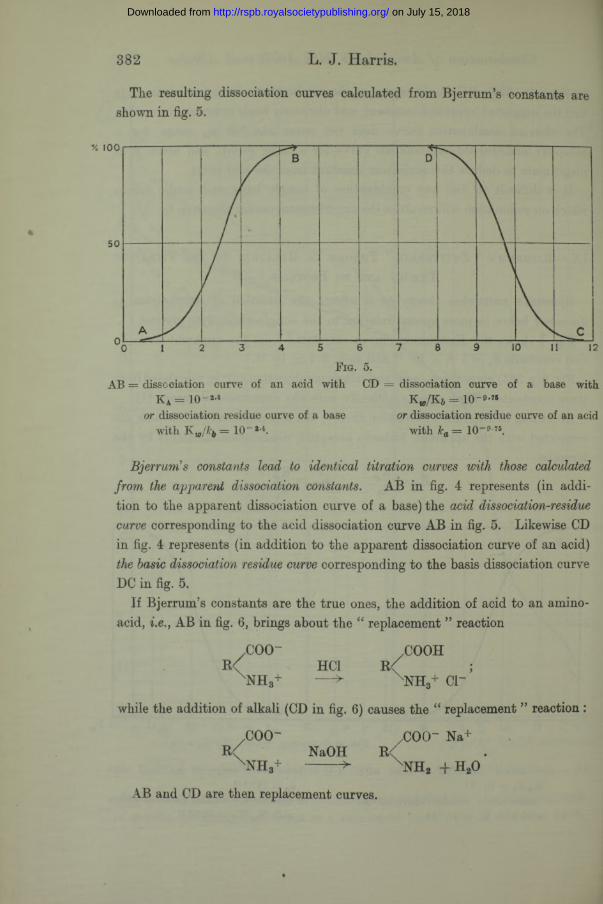
The resulting dissociation curves calculated from Bjerrum’s constants are shown in fig. 5.
Fig. 5.AB = dissociation curve of an acid with CD = dissociation curve of a base with
K a = 1 0 - 24 K w/K 6 = 1 0 -® -«or dissociation residue curve of a base or dissociation residue curve of an acid
with K JJcb = 10“ m with ka = lO"9 7S.
Bjerrum’s constants lead to identical titration curves with those calculated from the apparent dissociation constants. AB in fig. 4 represents (in addition to the apparent dissociation curve of a base) the acid dissociation-residue curve corresponding to the acid dissociation curve AB in fig. 5. Likewise CD in fig. 4 represents (in addition to the apparent dissociation curve of an acid) the basic dissociation residue curve corresponding to the basis dissociation curve DC in fig. 5.
If Bjerrum’s constants are the true ones, the addition of acid to an amino- acid, i.e.,AB in fig. 6, brings about the “ replacement ” reaction
.COO" COOHR< HC1 R< ;
nh3+ —> xnh3+ crwhile the addition of alkali (CD in fig. 6) causes the “ replacement ” reaction :
.COO' /COO- Na+R< NaOH R<
xNH3+ -----^ XNH2 + h2oAB and CD are then replacement curves.
on July 15, 2018http://rspb.royalsocietypublishing.org/Downloaded from
Combination o f Ampholytes with Acids and Alkalis. 383
y CcofJdffa OH(corrected)perlOOc pli/cine
C.c. o f # HCl(correcled)perlOO glycine< ------------------------------------- 8
Fig. 6.—Glycine pH-acid and -alkali combination curves (corrected titration curves). ^
AB represents either the acid combination curve of a weak base (K w /H = 10~2 4), or the replace- j Jment curve of a fairly strong acid(Ka = io -*-«).
CD represents either the alkali 12combination curve of a weak acid (ka — 10~*'75), or the replacement curve of a fairly strong base I-7
(Kw./Kb = 10-#-7S). 10
Pm W
on July 15, 2018http://rspb.royalsocietypublishing.org/Downloaded from

384 L. J. Harris.
According to the formerly accepted constants, the “ combination ” reactions a re :—
and
COOH .COOHHC1 E<
n h 2 -— > x n h 3+ cr
.COOH /COO~ Na+ + H 20NaOH R\
n h 2 — ---- >- x n h 2
respectively, and AB and CD are true combination curves.According to either theory that pH at which the amino-acid (or complex
protein) is ionised equally as an acid and a base is the same, and the isoelectric point is unaltered ; but according to the older theory total ionisation is at a minimum at the isoelectric point, while on the basis of the zwitterion theory total ionisation of the electrically neutral molecule as both acid and base is at a maximum at the iso-electric point.
An amino-acid or protein may have an acid isoelectric point, as, is the case with gelatin—from either of two causes ; ka may be greater than Icb (in which case KA > KB, also), or the number of acid groups may exceed the number of basic groups ; or both causes may operate.
Summary.
Numbers refer to the sections the text.1. Dissociation constants of methylene derivatives of the amino-acids have
been calculated from titration curves and confirm the writer’s prediction that they are of the order 103 times greater than those of the corresponding amino-acids.
2. Amino- as well as carboxyl-groups in amino-acids may be determined conductometrically.
3. The titration theory provides an experimentum crucis for testing the validity of the theory that peptide groups form addition compounds with acids and alkalis.
4. A protein in solution may be estimated volumetrically by titrating with acid or alkali between two given pn points. The amount of titrant required (corrected for blank) is proportional to the amount of protein present. The estimation is as accurate as an ordinary acid base titration.
The titration curve of milk can be predicted from the known amounts of casein, phosphate, citrate, etc., buffers present. In commercial cows’ milk the
on July 15, 2018http://rspb.royalsocietypublishing.org/Downloaded from

Combination o f Ampholytes wit Acids and Alkalis. 385
amount of protein is directly proportional to the amount of HC1 (corrected for blank) required to take a given volume of the milk over a definite p a range ; since it is known that phosphate, citrate, etc., vary directly with protein content. E.g., the number of cubic centimetres of N/10 HC1 (corrected) required to titrate 10 c.c. of normal cows’ milk, or modified milk mixtures, from pB 6• 65 to 5*2 is numerically equal to the percentage of protein present.
5. “ pH-combination curves ” may be utilised for determining the nature of denaturation and hydrolytic changes.
6. The equivalent weights of proteins towards acids and alkalis may be determined by adding increasing amounts of HC1 or NaOH and plotting against observed physical constants, such as viscosity, total swelling, osmotic pressure (in Donnan equilibrium), conductivity. A sharp maximum or break occurs with the addition of a constant equivalent of acid or alkali.
The equivalent combining weights of gelatin, serum-globulin, and edestin towards acids have been calculated in this way and found to agree with determinations resulting from the titration and the conductivity methods. On the assumption that the relation is a general one, equivalent combining weights of various proteins for both acids and alkalis have been calculated.
7. It is shown theoretically that the osmotic pressure produced in a protein plus acid or base mixture in a Donnan equilibrium is at a maximum when one equivalent of acid or base is present (inside the membrane).
8. It is shown on theoretical grounds that the free ( ., isoelectric) proteinmolecule (in the case of gelatin) cannot consist, as has been supposed, of a practically non-ionised molecule, but must exist as a mixture of basic and acidic ions, or probably as an ammonium salt, or a “ zwitterion.”
9. In the latter case total ionisation as acid and base is at a maximum at the isoelectric point and the addition of acid and alkali represents “ replacement ” rather than “ combination ” reactions.
I wish to express my sincere thanks to Prof. F. Gr. Hopkins, F.R.S., for his interest in this work, and to Prof. R. A. Peters and Mr. J. B. S. Haldane, M.A., for reading the paper in MS.
REFERENCES.
(1) Harris, L. J., ‘ Roy. Soc. Proc.,’ R, vol. 95, pp. 440-484 (1923).(2) Hitchcock, D. I., ‘ J. Gen. Physiol.,’ vol. 4, p. 733 (1922).(3) Tague, E. L., ‘ J. Am. Chem. Soc.,’ vol. 42, p. 173 (1920).(4) Kanitz, A., ‘ Z. f. Physiol. Chem.,’ vol. 116, p. 96 (1921).(5) Mueller, ‘ Proc. Soc. Exp. Biol, and Med.,’ vol. 19, p. 161 (1922).
VOL. XCVII.— B. 2 F
on July 15, 2018http://rspb.royalsocietypublishing.org/Downloaded from

386 C. T. Regan.
(6) Harris, L. J., ‘ Roy. Soc. Proc.,’ B, vol. 94, pp. 442-450 (1923).(7) Harris, L. J., ‘ Roy. Soc. Proc.,’ B, vol. 95, pp. 481, 447, 513 (1923).(8) Harris, L. J., ‘ J. Chem. Soc.,’ vol. 123, pp. 3294-3303 (1923).(9) Harris, L. J., ‘ Roy. Soc. Proc.,’ B, vol. 95, pp. 500-522 (1923).(10) Widmark, E. M. P., and Larsson, E. L., ‘ Biockem. Z.,’ vol. 140, p. 284 (1923).(11) Loeb, J., ‘ Proteins and the Theory of Colloidal Behaviour,’ London and New York
(1923).(12) Hasselbach, K. A., ‘ Biochem. Z.,’ vol. 78, p. 112 (1917).(13) Richmond, H. D., ‘ Dairy Chemistry,’ p. 152, 2nd edition, London (1914).(14) Harris, L. J., ‘ Roy. Soc. Proc.,’ B, vol. 94, pp. 426-441 (1923).(15) Loeb, J., ‘ J. Gen. Physiol.,’ vol. 3, pp. 667, 691 (1920-21).(16) Bjerrum, N., ‘ Z. fiir Physikal. Chem.,’ vol. 104, p. 147 (1923).
Dwarfed Males Parasitic on the Females Oceanic Angler- Fishes (Pediculati Ceratioidea).
By C. Tate R egan, F.R.S., Keeper of Zoology in the British Museum(Natural History).
(Received November 1, 1924.)
P late 20.
CONTENTS.Introduction ........................................................................................................................... 386Ceratias holbolli, Kroyer......................................................................................................... 387Photocorynus spiniceps, gen. et sp. n.................................... ................. 393Probable Occurrence of Dwarfed Males in other Ceratioid Fishes............................ 395Probable Life-history of the Male Ceratioids................................................................... 396Comparison with other Groups............................................................................................ 397Conclusion ...................................................................................................... 397Appendix. Edriolychnus schmidti, gen. et sp. ...................................... 398List of Papers .......................................................................................................................... 399
Introduction.The fishes of the order Pediculati (Regan, 1912) form a remarkable assemblage
of strange types, characterised by the structure of the spinous dorsal fin, which is composed of a few flexible rays, the first of these being placed on top of the head, not far behind the mouth, and modified into a line and bait. The Lophioid and Antennarioid Pediculates are for the most part dwellers on the bottom in shallow or moderately deep water, but the Ceratioids are
on July 15, 2018http://rspb.royalsocietypublishing.org/Downloaded from