the climate change challenge 1: scientific evidence … climate change challenge 1: scientific...
TRANSCRIPT

2
The Climate ChangeChallenge1: Scientific evidence and implications
This report has been printed on recycled paper.
Published in the UK: March 2004.
The Carbon Trust is a company limited by guarantee.
Registered in England and Wales number 4190230. Registered at 9th Floor, 3 Clement’s Inn, London WC2A 2AZ
Whilst the Carbon Trust has taken reasonable steps to ensure that the information contained within this Report is correct,it does not accept any liability for the content, accuracy and completeness of that information or for any loss arising fromreliance on it.
Any trade marks, service marks or logos used in this Report, and copyright in the Report, are the property of the CarbonTrust. Reproduction is permitted only on the following terms. All or part of the contents may be copied for personal use.The supply of any copy to third parties is also permitted provided that the Carbon Trust is acknowledged as the source ofthe material on the copy, it is not supplied as part of another work or publication, and it is not supplied directly in returnfor commercial gain. The supply of any copy to a third party is conditional upon their being made aware of the fact thatthe terms of the above disclaimer and copyright statement apply equally to them. No other reproduction is permittedwithout the written consent of the Carbon Trust.
The Carbon Trust works with business and the public sector to cut carbon emissions and capture the commercial potentialof low carbon technologies.
An independent company set up the Government to help the UK meet its climate change obligations through business-focused solutions to carbon emission reduction, the Carbon Trust is funded by Defra, the Scottish Executive, the NationalAssembly for Wales and Invest Northern Ireland.
© The Carbon Trust 2004. All Rights Reserved CT/2004/01

2
Contents
Is climate change real? 3
Other observed indicators and impacts of our changing climate 5
Projecting climate change 8
Specific impacts and human risks 11
Long term trends and planetary risks 13
How has the world responded and what are the options? 15
Can we just adapt to climate change? 17
Annex: Science assessment, the Intergovernmental Panel on Climate Change, and recent debates 19
About the Carbon Trust 22
Climate change is emerging as a major challenge for modern society. Government,business, and wider society will all be affected and all have a role to play in tackling it.This report is the first in a series of Carbon Trust reports that are designed to helpbusinesses in particular to understand the nature of the challenge, why and howgovernments are acting to address it, and what the implications may be. The reportsare subject to both internal and external international review.
This report summarises the nature of the problem. It explains the fundamental scienceand the accumulating evidence that climate change is real and needs to be addressed.It also explains the future potential impacts, including the outstanding uncertainties.
Professor Michael GrubbAssociated Director of Policy, the Carbon TrustVisiting Professor of Climate Change and Energy Policy, Imperial College, London
Foreword
- 1 - 0.8 - 0.6 - 0.4 - 0.2 0 + 0.2 + 0.4 + 0.6 + 0.8 + 1
Trends in °C per decade
Large-scale warming of both the land and ocean surface occurred in the last quarter of the 20th century, with thelargest increases over mid and high latitudes of North America, Europe and Asia. The pattern, including fasterwarming over land than oceans and faster near the poles than equator, is consistent with that expected fromgreenhouse-gas warming.
Source: Intergovernmental Panel on Climate Change, Third Assessment, Climate Change 2001: Synthesis Report (Figure 2-6b)
Chart 1. Temperature changes around the world in the last quarter of the 20th century

43
Emissions of various gases from industrial and other human activities are changing ouratmosphere. ‘Climate change’ encapsulates the wide variety of accompanying impactson temperature, weather patterns and other natural systems. Despite decades ofresearch, important things remain uncertain, but much is also now established beyondreasonable doubt.
Is climatechange real?
The fundamental science of climate changeThe fundamentals of climate change have long been well understood because they involve the same basicphysics that keeps the earth habitable. Heat-trapping‘greenhouse gases’ in the atmosphere (of which the twomost important are water vapour and carbon dioxide,CO2) let through short-wave radiation from the sun butabsorb the long-wave heat radiation coming back fromthe Earth’s surface and re-radiate it. These gases act like a blanket - and keep the surface and the loweratmosphere about 33 deg. C warmer than it would bewithout them. The Earth’s greenhouse blanket is a goodbalance between the extremes of our neighbours: Mars, exposed without any greenhouse gases, is a frozenwasteland; whilst Venus remains trapped in a denseblanket of hot CO2.
Primarily through the burning of fossil fuels, and long-term deforestation, humans have been increasing theconcentration of CO2 and other greenhouse gases in the atmosphere since the industrial revolution began,thickening the greenhouse blanket.
The world has been warmingSurface warming in recent decades is established beyonddoubt. So too is cooling of the stratosphere (the layerabove the main ‘blanket’), as would be expected fromgreenhouse warming that traps more heat near thesurface. Direct temperature records back to the middleof the last century are considered to be reliable enoughto establish that recent temperatures are warmer thanany since direct measurements began - all of the 10warmest years have occurred since 1990, including each year since 1995.
During the middle of the 20th Century there was aplateau in global temperatures with decline in thenorthern hemisphere. This was due at least partly toother pollutants (notably sulphur) temporarily blockingsunlight and masking the underlying trend. Since the1980s, the clean-up of sulphur emissions (to avoid acidrain damage) has reduced this masking, and theunderlying, long-term greenhouse warming has emergedmore clearly. Better accounting for these and otherfactors can now generate a good fit between theobserved temperature trend and the results of computersimulations that incorporate these multiple factors (Chart 2).
A wide variety of ‘proxy indicators’ (such as tree rings,coral layering, glacier records, etc.) give a highconfidence that the warming observed is unprecedentedfor at least the past 1000-2000 years (see also Annex).Indeed it appears that global average temperatures havevaried by less than half a degree C for thousands ofyears, and probably during the entire post Ice-Age periodduring which human civilisation has developed, so thatrecent years are probably the warmest seen for morethan 100,000 years.
Natural fluctuations can certainly affect globaltemperatures, but scientists have been unable to identifynatural factors that could explain either the degree or
the pattern of the surface warming and stratospherecooling observed over recent decades. In addition,climate change models predict that greenhouse warmingshould be greater over land than over the oceans, andgreater near the poles than the equator. This is what hasbeen observed (Chart 1, page 2).
Understanding is still incomplete. The causes of slightmid-atmosphere cooling near the equator remainuncertain, and debate continues as to whether there isany discrepancy between the long-standing surfacerecords and more recent, more disparate satellite-basedtemperature measurements (see Annex). But thefundamentals are clear and supported by a long list ofother accumulating impacts.
These figures show average global surface temperature as measured (red line), compared to estimates from acomputer simulation, respectively without (left) and with (right) the effects of human emissions included.
Source: Reproduced from Intergovernmental Panel on Climate Change, Third Assessment, Synthesis Report, 2001 (Figure SPM-2).
Chart 2. Global temperature changes since 1860

65
16 29 44 7213
0
10
20
30
40
50
60
70
1998
Annual losses, in thousand million U.S. dollars
1950 199019801960 1970
Global costs of extreme weather events (inflation-adjusted)
Total economic lossesTotal economic lossesT
Insured losses
Number of events
Decadal average
B. Recent
The economic losses from catastrophic weather events have risen globally 10-fold since the 1950s, after accountingfor inflation. Part of the trend is linked to growing wealth and population, which increases economic vulnerabilityto extreme events, and part is linked to regional climatic factors (eg. changes in precipitation and flooding).
Source: Intergovernmental Panel on Climate Change, Third Assessment, Climate Change 2001: Synthesis report (Figure 2-7)
Perhaps the most clear, prominent and consistentindicator is the retreat of mountain glaciers (e.g. Chart 3)which has been a worldwide phenomenon. Impacts on iceare also clear around the poles. The Arctic ice cap isshrinking, whilst in Antarctica, massive calving of theLarsen Ice Shelf combined with rapid rise in localtemperatures around the Antarctic peninsula – stillincompletely understood - has led scientists to predict itscomplete disappearance within decades. Another widely-observed impact is the ‘bleaching’ of coral reefs causedat least in part by rising sea-surface temperatures.
Changes in extreme weather events potentially havethe greatest impacts on humans, but since by definitionthey occur infrequently, trends are hard to prove.Warming increases evaporation and precipitation, and both aggregate rainfall and occurrences of ‘heavy precipitation events’ in northern mid-latitudes (e.g. Europe and the US) - the principal cause offlooding - have increased in recent decades. In tropicalregions, the potential for more intense hurricanes andtyphoons increases in a warmer world, but the data are sufficiently sparse and complex that theobservational trend remains in dispute.
The impact on some other extremes is betterestablished. Many areas (including the UK) have seenfewer long cold spells and more long hot spells, in waysthat are consistent with the predictions of climatemodels. But unlike the general trends of temperature,ice and sea level, it may always be questionable toattribute any one particular weather event to climatechange, because all weather events have multiplecauses. So the question ‘was X due to climate change?’cannot be answered simply – whether X was last year’srecord temperature in the UK (which for the first timeever exceeded 100 deg.F), droughts in the US, or thedevastating floods of Central Europe. But science mayincreasingly be able to estimate ‘how much have pastemissions increased the risk of such events?’ – and thechances, at least of extremes such as these, are rising.
Insurance data (Chart 4) show a dramatic rise in theeconomic costs due to extreme weather events, though amajor part of this is probably due to changes indemographics, property valuation and insurancepractices.
Other observed indicatorsand impacts of ourchanging climate
A. Circa 1900Photo Source: Munich Society for Environmental Research
Chart 3. Alpine Glacier: comparison of present to 1900Pasterze Glacier in Kärtnen, Austria
Chart 4. Global costs of extreme weather events (inflation-adjusted) since 1950
The list of observed changes other than temperature and sea-level is growing rapidly.These include ‘the thawing of permafrost, later freezing and earlier break-up of ice onrivers and lakes, lengthening of mid to high-latitude growing seasons, poleward andaltitudinal shifts of plant and animal ranges, declines of some plant and animalpopulations, and earlier flowering of trees, emergence of insects, and egg-laying inbirds’.1
1Cited from IPCC Third Assessment, Climate Change 2001, Report on Impacts, Adaptation and Vulnerability(Policymakers Summary).
7 8
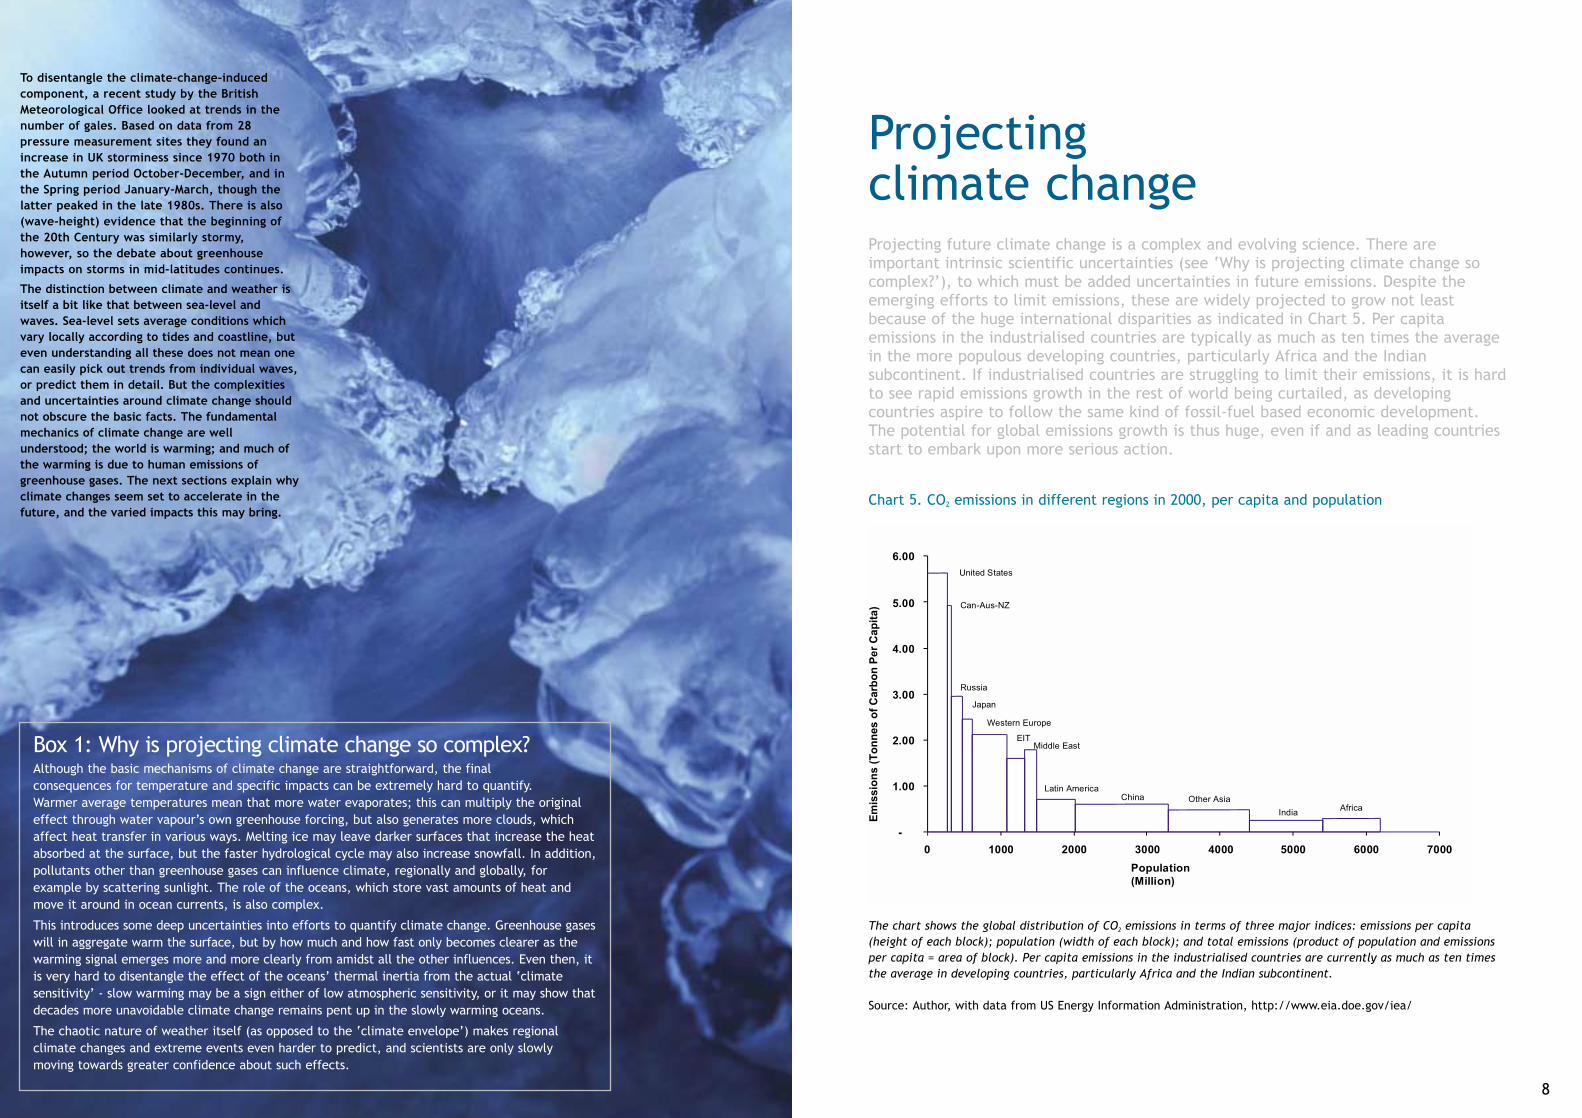
Projecting climate changeProjecting future climate change is a complex and evolving science. There areimportant intrinsic scientific uncertainties (see ‘Why is projecting climate change socomplex?’), to which must be added uncertainties in future emissions. Despite theemerging efforts to limit emissions, these are widely projected to grow not leastbecause of the huge international disparities as indicated in Chart 5. Per capitaemissions in the industrialised countries are typically as much as ten times the averagein the more populous developing countries, particularly Africa and the Indiansubcontinent. If industrialised countries are struggling to limit their emissions, it is hardto see rapid emissions growth in the rest of world being curtailed, as developingcountries aspire to follow the same kind of fossil-fuel based economic development.The potential for global emissions growth is thus huge, even if and as leading countriesstart to embark upon more serious action.
United States
Can-Aus-NZ
Russia
Japan
Western Europe
EIT Middle East
China Latin America
Other AsiaAfricaIndia
-
1.00
2.00
3.00
4.00
5.00
6.00
0 1000 2000 3000 4000 5000 6000 7000
Population(Million)
Em
issi
on
s (T
on
nes
of
Car
bo
n P
er C
apit
a)
The chart shows the global distribution of CO2 emissions in terms of three major indices: emissions per capita(height of each block); population (width of each block); and total emissions (product of population and emissionsper capita = area of block). Per capita emissions in the industrialised countries are currently as much as ten timesthe average in developing countries, particularly Africa and the Indian subcontinent.
Source: Author, with data from US Energy Information Administration, http://www.eia.doe.gov/iea/
To disentangle the climate-change-inducedcomponent, a recent study by the BritishMeteorological Office looked at trends in thenumber of gales. Based on data from 28pressure measurement sites they found anincrease in UK storminess since 1970 both inthe Autumn period October-December, and inthe Spring period January-March, though thelatter peaked in the late 1980s. There is also(wave-height) evidence that the beginning ofthe 20th Century was similarly stormy,however, so the debate about greenhouseimpacts on storms in mid-latitudes continues.
The distinction between climate and weather isitself a bit like that between sea-level andwaves. Sea-level sets average conditions whichvary locally according to tides and coastline, buteven understanding all these does not mean onecan easily pick out trends from individual waves,or predict them in detail. But the complexitiesand uncertainties around climate change shouldnot obscure the basic facts. The fundamentalmechanics of climate change are wellunderstood; the world is warming; and much ofthe warming is due to human emissions ofgreenhouse gases. The next sections explain whyclimate changes seem set to accelerate in thefuture, and the varied impacts this may bring.
Chart 5. CO2 emissions in different regions in 2000, per capita and population
Box 1: Why is projecting climate change so complex?Although the basic mechanisms of climate change are straightforward, the final consequences for temperature and specific impacts can be extremely hard to quantify. Warmer average temperatures mean that more water evaporates; this can multiply the originaleffect through water vapour’s own greenhouse forcing, but also generates more clouds, whichaffect heat transfer in various ways. Melting ice may leave darker surfaces that increase the heatabsorbed at the surface, but the faster hydrological cycle may also increase snowfall. In addition,pollutants other than greenhouse gases can influence climate, regionally and globally, forexample by scattering sunlight. The role of the oceans, which store vast amounts of heat andmove it around in ocean currents, is also complex.
This introduces some deep uncertainties into efforts to quantify climate change. Greenhouse gaseswill in aggregate warm the surface, but by how much and how fast only becomes clearer as thewarming signal emerges more and more clearly from amidst all the other influences. Even then, itis very hard to disentangle the effect of the oceans’ thermal inertia from the actual ‘climatesensitivity’ - slow warming may be a sign either of low atmospheric sensitivity, or it may show thatdecades more unavoidable climate change remains pent up in the slowly warming oceans.
The chaotic nature of weather itself (as opposed to the ‘climate envelope’) makes regionalclimate changes and extreme events even harder to predict, and scientists are only slowlymoving towards greater confidence about such effects.

109
The main estimates of global temperature changeproduced to date, from a wide set of scenarios by theIntergovernmental Panel on Climate Change (see Annex)are illustrated and compared against the past 1000 yearsin Chart 6. This projects that global temperature willincrease by 1.5 to 5.8 deg.C by the end of the century;the latter number is comparable to the rise that occurredbetween ice age and pre-industrial temperatures.
Some of the big, persistent trends indicated for examplein glaciers, which embody a lot of inertia also due topast warming, can already be projected with confidence.The snows of Kilimanjaro, for example, already muchshrunk, are expected to disappear entirely within thenext few decades - it is already too late to avert this
(Chart 7). Glaciers and sea ice will continue to shrink, and there may be no Arctic sea ice in summer by the end of this century. The Antarctic ice sheet, being in a much colder climate, is less likely to lose mass, not withstanding some shrinking ice shelves around it.
Existing zones of preferred vegetation and associatedcrops will migrate towards the poles, requiring farmingpractices and ecosystems to adapt. However, many speciesand ecosystems have limited scope to move, because of awide variety of barriers. The most comprehensive study todate estimates that about a quarter of the world’s knownanimals and plants - more than a million species - willeventually die out because of the warming projected totake place in the next fifty years.
A1BA1T
A1FI
A2
B1
B2
IS92a
Scenarios
Bars show therange in year 2100
produced byseveral models
Several models
all SRES envelope
1000 1200 1400 1600 1800 2000
-0.5
0.0
Departures in temperature in °C (from the 1990 value)
1100 1300 1500 1700 1900 2100
-1.0
Observations, Northern Hemisphere, proxy dataGlobal
instrumentalobservations
Projections
0.5
1.0
1.5
2.0
2.5
3.0
3.5
4.0
4.5
5.0
5.5
6.0
The chart shows projected changes in global temperature (relative to 1990) for this century compared to the recordsince 1000 (northern hemisphere proxy data only available for period before 1860, direct global measurementssince then). The lines show (past) the 50-year averaged and (future) projected temperatures associated with thevarious emission scenarios of the IPCC (see Annex) assuming average climate sensitivity. The grey zones illustrate(past) estimated uncertainties in measurements, and (future) in temperature projections arising from combinationof different scenarios and climate sensitivities.
Source: Intergovernmental Panel on Climate Change, Third Assessment Synthesis Report (Figure. SPM-10b)
Chart 6. Projected temperature change compared to past 1000 years
The picture shows Kilimanjaro with (superimposed) a graph showing the decline in ice cover during the 20thcentury and projection of its disappearance by c.2020.
Data Source: Prof. Lonnie Thompson Byrd Polar Research Center, Ohio State University 1090. Alverson et al., Science 293:47
Chart 7. The snows of Kilimanjaro
1900 1920 1940 1960 1980 2000 2020year
13
12
11
10
9
8
7
6
5
4
3
2
1
0
km2
Box 2: What about Europe - why do some talk about UK cooling? In the global climate, Europe is an anomaly. Northern Europe in particular, despite being at similarlatitude to Newfoundland, is far warmer because of the Gulf Stream - the ocean current systemknown as the North Atlantic Thermohaline Circulation (together with associated wind patterns). This draws heat from the tropics (and in fact more widely) in the warm surface waters, and releasesit in the north-east Atlantic to give Europe the mild conditions to which it has become accustomed.The warm water floats on the cold and more dense returning currents beneath, but evaporationmakes the surface water progressively cooler and more salty and hence heavier, and when it hascooled enough, it sinks under its own weight, powering the continued circulation.
However, the faster hydrological cycle and accelerated melting of ice with global warming -particularly from Greenland and a number of large Siberian rivers - dilutes the surface waters and is thus expected to slow the oceanic circulation. Under most simulations, the net effect would be to slow down projected warming in the North Atlantic region.
But the thermohaline circulation appears to have cut off during ice ages – and indeed this shutdownprobably helps to switch the world between ice-age and non ice-age states. Furthermore, ithappened rapidly – in a matter of a few years – possibly associated with the collapse of ice sheets orice barriers. Scientists do not understand the mechanisms well, but current modelling studies do notsuggest a collapse of the thermohaline circulation this century.

1211
Specific impacts and human risks
Combined with the probability of changing storm patterns,rising sea levels could have huge consequences forhundreds of millions of people living in coastal cities;delta regions such as the Nile Delta, lower Bangladesh,and parts of Florida, may be intrinsically difficult orimpossible to protect.
Scientists rate the following other changes to be verylikely (with more than 90% confidence):2
• Higher maximum temperatures, with more hot daysand heat waves over nearly all land areas. This wouldincrease heat-related deaths, as well as heat-relatedstresses on crops, livestock, etc.;
• Higher minimum temperatures, fewer cold days, frostdays and cold waves over nearly all land areas. Thiswould reduce cold-related deaths and crop andlivestock-related stresses associated with frost andother cold conditions. The balance between this andthe first set of effects obviously depends on thestarting conditions, but also on the rate and degree ofchange. Tentative estimates predict net agriculturalgains for the US and Europe for equilibrium globalchanges up to 2.5 deg.C (this does not includetransitional effects), the balance becomes negative forgreater changes; and
• More intense precipitation events, resulting inincreased floods, landslide, avalanche, and mudslidedamage, with increased soil erosion and increasedflood run-off.
The following changes are rated as likely (with confidence greater than two-thirds):
• Summer drying over most mid-latitude continentalinteriors and associated risk of drought;
• More intense tropical cyclones (in terms of both windand rainfall);
• Intensified droughts and floods associated with thePacific El Niño events, in many different regions; and
• More variable Asian summer monsoon, obviously ofparticular relevance to the half the world’s populationthat live in China, India and surrounding countries.
Two regional examples help to illustrate possibleconsequences. Summer drying and heatwaves in andaround the Mediterranean could further stress watersupplies in some regions that are already politicallysensitive and heavily dependent upon irrigation foragriculture. The suffering could also drive expandedmigration into northern Europe which might itself comeunder growing pressure from increased floods andheatwaves.
On the Indian subcontinent, Bangladesh and north-eastIndia could face a number of diverse pressures: risingseas and storms inundating the Ganges delta region; amore variable monsoon undermining the agriculturalfoundations that feed a quarter of a billion people; andchanging patterns of river flow as climate changeimpacts the Himalayan glaciers that feed the rivers, withcorresponding international tensions across alreadyvolatile borders.
In addition to the broad physical and biological trends of warming and glacier retreat,sea-level rise, and the migration and loss of species and ecosystems, other predictedimpacts of climate change are many and varied, and as research continues andexperience begins to accumulate the list grows longer.
The chart shows how the projected range of temperature changes for this century (left hand panel) would affect therisks posed in terms of five generic ‘reasons for concerns’ (right hand panel). In the columns, white indicates neutral orsmall impacts, yellow indicates negative impacts for some systems or low risk, and red means negative impacts or risksthat are more widespread and/or greater. The five columns concern (i) risks to unique and threatened ecosystems, (ii)the risks from extreme climate events; (iii) the risks posed to specific regions, with only the most vulnerable beingaffected in the white/yellow zone but most in the red zone; (iv) the aggregated impact on the global economy, and (v)the risk from large-scale climatic discontinuities (such as collapse of ocean circulation patterns). The assessment tookaccount only of the magnitude, not the rate, of change.
Source: Intergovernmental Panel on Climate Change, Third Assessment, Report on Impacts, Adaptation, and Vulnerability, (Figure SPM-2)
These are just tentative examples; the possible humanconsequences of climate change are only just beginningto be seriously considered. A particularly complexconsideration is that whilst most scientific studies havefocused upon the possible impacts of a warmer world,most human impacts may flow from the nature of awarming world, in which change - often hard to predictat the local level - may be the most difficultcharacteristic for societies to handle. Farming practices,water industries, and innumerable other social andinfrastructural systems designed for the last century’sclimate will not necessarily adapt easily to theaccelerating change now in prospect, particularly as some of the underlying natural systems are alsopressured by global economic and population growth.
The impacts of projected climate changes have beensummarised in terms of five risk categories (Chart 8).This suggests that even at the most optimistic end ofprojections, some unique and threatened ecosystems willdisappear and some regions will be exposed to adverseimpacts. In the mid range, many unique systems may beat risk and the impact of extreme events would rise,with the developing countries hurt the most althoughimpact on the aggregate global economy could still bemodest. Changes towards the upper end pose risks to alland the risk of large-scale abrupt disruptions becomessignificant.
Chart 8. Five risk indicators associated with projected global temperatures changes
2This list is drawn from the IPCC 3rd Assessment, Report on Impacts, Adaptation, and Vulnerability, Table SPM-1.

1413
CO2 emissions peak0 to 100 years
Today 100 years 300 years200 years
Magnitude of response
CO2 stabilisation:100 to 300 years
Temperature stabilisation:A few centuries
Sea-level rise from thermal expansion and ice meltCenturies to several millenia
Time taken to reachequilibrium
CO2 emissions
Long-term trends and planetary risks
The chart shows how key aspects of climate change will continue to accumulate long after global emissions arereduced even to low levels. Temperatures would continue to rise slowly for a few centuries as the oceans continuedto warm; but sea level rise would continue for hundreds to thousands of years, due to the continuing impact on icesheets in addition to thermal expansion of the oceans. The impact on species might also continue for centuries asthe effects on ecosystem viability play out (not shown).
Source: Adapted from the Intergovernmental Panel on Climate Change, Third Assessment Synthesis Report, (Figure SPM-5)
Global temperatures will continue to rise for decades asthe oceans slowly adjust to the higher heat input. Sealevels will rise due to both thermal expansion and icemelt – effects which will accumulate over hundreds tothousands of years respectively (see Chart 9): overcenturies, sea levels would rise many metres if and as
the Greenland and/or west Antartic ice sheetsdisintegrate. Emission choices over the next few decades(which will affect emissions and concentrations fordecades beyond that) will thus do much to determine[sea] temperatures for centuries, and ultimate sea-levelrise by some metres.
Chart 9. Accumulating impacts of climate change over the long term
One fundamental characteristic of the climate problem is the inertia involved.Atmospheric greenhouse gas concentrations will not stabilise until global greenhousegas emissions are reduced to a small fraction of today’s levels, which few expect beforethe end of the century. Even after the atmosphere stabilises, other effects will continueto accumulate.
Long term trends andplanetary risks
In addition, scientists studying the interaction betweendifferent components of the climate system, and relatednatural systems, express concern about various possibleinstabilities. The North Atlantic ocean circulation is thebest known (see Box 2), but is by no means the onlyexample. Some studies question the stability of monsoonpatterns particularly on the Indian subcontinent. The UKHadley Centre projects that climate changes overAmazonia will lead to loss of the rainforest, and greatercarbon emissions from soils as temperature increases,which then feeds more carbon back into the atmosphereand amplifies the warming. Another feedback effect isthat thawing permafrost in the far north is likely to
release pent-up methane (another and potent greenhousegas) - perhaps the most likely near-term such danger.Other very long-term possibilities include the collapse ofthe west Antarctic ice sheet, and the release of hugeamounts of methane currently locked on the sea bed.
There are inherent uncertainties about such systems; thedynamics that keep them stable, and their limits, are notwell understood. When it comes to such big questionsabout complex systems, uncertainty is endemic. Butespecially given the inertia in all these systems, by thetime the limits are understood - they may already becrossed, possibly with dramatic consequences.
Chart 10: Potentially sensitive ‘switch point’ areas in which local effects might trigger larger-scale changes
The chart shows regions in which specific local phenomena may result in points of sensitivity for larger-scale andpossibly rapid changes in regional or global climatic conditions.
Source: J. Schellnhuber and H. Held, adapted from ‘How Fragile is the Earth System?, in J. Briden, and T. Downing, T.(Eds.),Managing the Earth: the Eleventh Linacre Lectures, Univ. Press., Oxford (2002).
1615
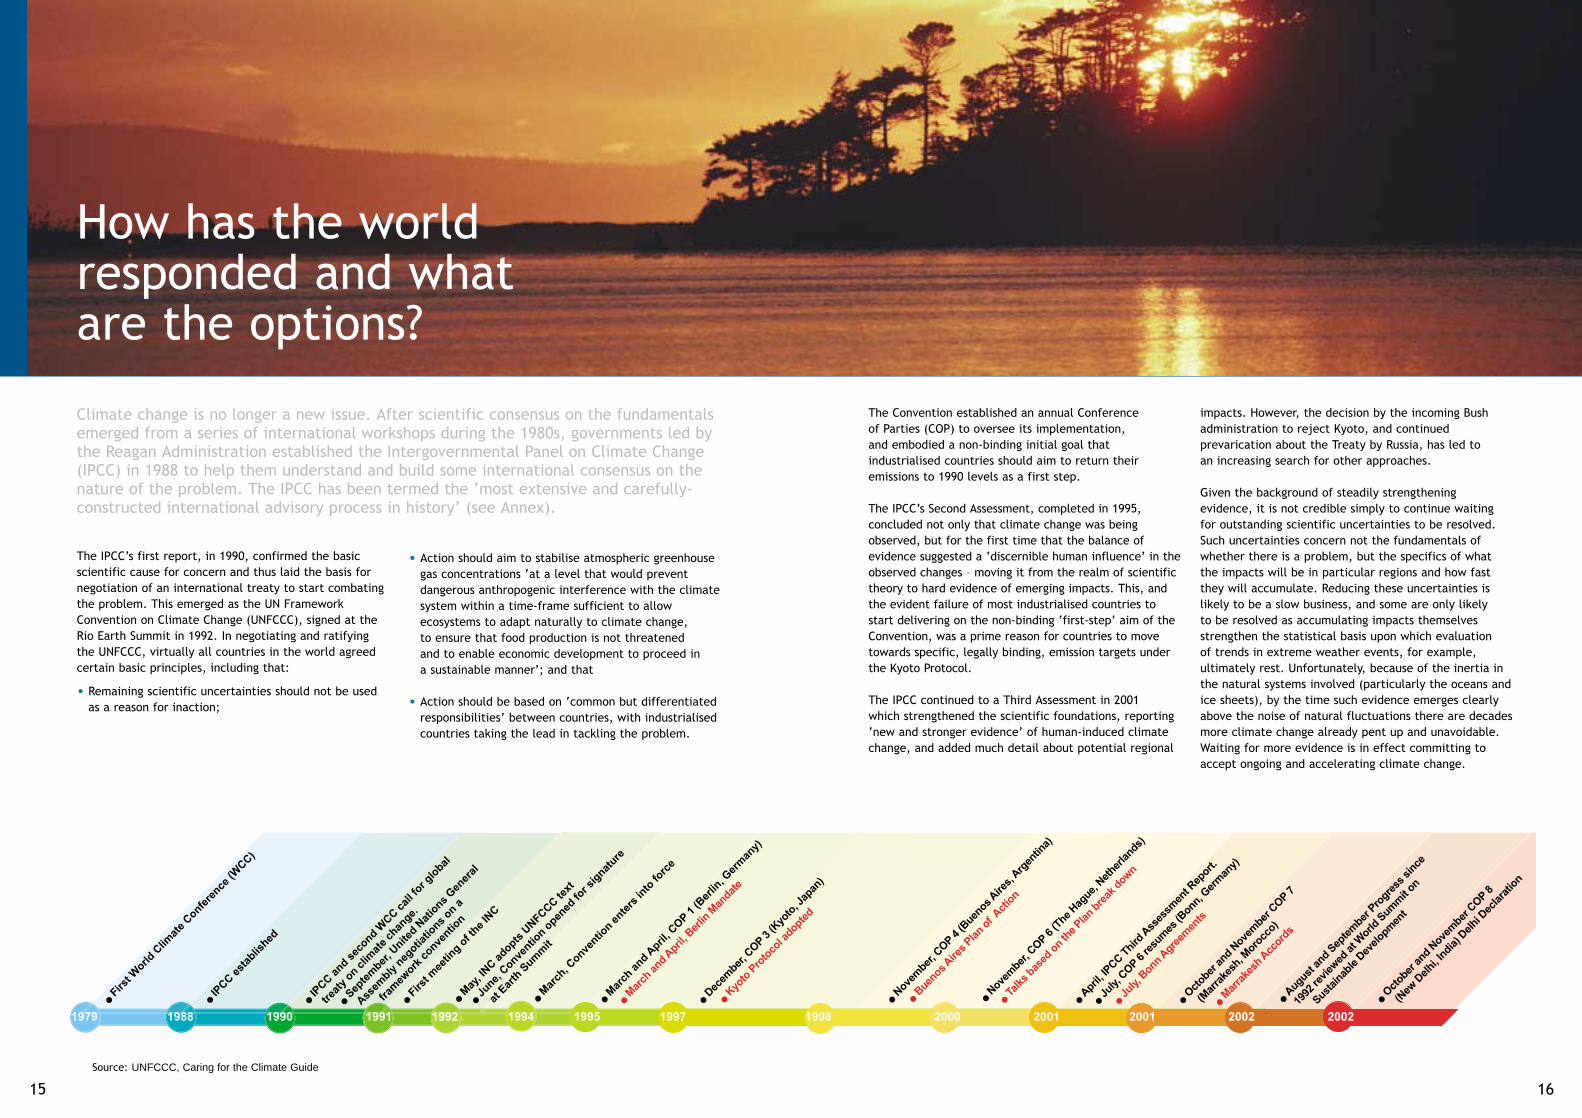
How has the worldresponded and whatare the options?
The IPCC’s first report, in 1990, confirmed the basicscientific cause for concern and thus laid the basis fornegotiation of an international treaty to start combatingthe problem. This emerged as the UN FrameworkConvention on Climate Change (UNFCCC), signed at theRio Earth Summit in 1992. In negotiating and ratifyingthe UNFCCC, virtually all countries in the world agreedcertain basic principles, including that:
• Remaining scientific uncertainties should not be usedas a reason for inaction;
• Action should aim to stabilise atmospheric greenhousegas concentrations ‘at a level that would preventdangerous anthropogenic interference with the climatesystem within a time-frame sufficient to allowecosystems to adapt naturally to climate change, to ensure that food production is not threatened and to enable economic development to proceed in a sustainable manner’; and that
• Action should be based on ‘common but differentiatedresponsibilities’ between countries, with industrialisedcountries taking the lead in tackling the problem.
The Convention established an annual Conference of Parties (COP) to oversee its implementation, and embodied a non-binding initial goal thatindustrialised countries should aim to return theiremissions to 1990 levels as a first step.
The IPCC’s Second Assessment, completed in 1995,concluded not only that climate change was beingobserved, but for the first time that the balance ofevidence suggested a ‘discernible human influence’ in theobserved changes – moving it from the realm of scientifictheory to hard evidence of emerging impacts. This, andthe evident failure of most industrialised countries tostart delivering on the non-binding ‘first-step’ aim of theConvention, was a prime reason for countries to movetowards specific, legally binding, emission targets underthe Kyoto Protocol.
The IPCC continued to a Third Assessment in 2001 which strengthened the scientific foundations, reporting‘new and stronger evidence’ of human-induced climatechange, and added much detail about potential regional
impacts. However, the decision by the incoming Bushadministration to reject Kyoto, and continuedprevarication about the Treaty by Russia, has led to an increasing search for other approaches.
Given the background of steadily strengthening evidence, it is not credible simply to continue waiting for outstanding scientific uncertainties to be resolved. Such uncertainties concern not the fundamentals ofwhether there is a problem, but the specifics of what the impacts will be in particular regions and how fastthey will accumulate. Reducing these uncertainties islikely to be a slow business, and some are only likely to be resolved as accumulating impacts themselvesstrengthen the statistical basis upon which evaluation of trends in extreme weather events, for example,ultimately rest. Unfortunately, because of the inertia inthe natural systems involved (particularly the oceans andice sheets), by the time such evidence emerges clearlyabove the noise of natural fluctuations there are decadesmore climate change already pent up and unavoidable. Waiting for more evidence is in effect committing toaccept ongoing and accelerating climate change.
� F
irst
Worl
d Clim
ate
Confe
rence
(WCC)
� IP
CC e
stab
lished
� IP
CC a
nd sec
ond WCC c
all f
or glo
bal
tr
eaty
on c
limat
e ch
ange.
� S
epte
mber
, Unite
d Nat
ions
Gen
eral
Ass
embly
neg
otiatio
ns on a
fram
ework
conve
ntion
� F
irst
mee
ting o
f the
INC
� M
ay, I
NC a
dopts U
NFC
CC te
xt
�
June,
Conve
ntion o
pened
for si
gnature
at E
arth
Sum
mit
� M
arch
, Conve
ntion e
nters
into
forc
e
� D
ecem
ber, C
OP 3
(Kyo
to, J
apan
)
�
Kyo
to P
roto
col a
dopted
� N
ovem
ber, C
OP 4
(Buen
os Aire
s, A
rgen
tina)
�
Buen
os Aire
s Pla
n of
Act
ion
� N
ovem
ber, C
OP 6
(The
Hag
ue, N
ether
lands)
�
Tal
ks b
ased
on th
e Pla
n bre
ak d
own
� A
pril, IPC
C T
hird A
sses
smen
t Rep
ort.
�
July
, COP 6
resu
mes
(Bonn, G
erm
any)
� J
uly, B
onn Agre
emen
ts
� A
ugust a
nd Sep
tem
ber P
rogre
ss s
ince
19
92 re
view
ed a
t World
Sum
mit
on
S
ustai
nable
Dev
elopm
ent
� O
ctober
and N
ovem
ber C
OP 8
(N
ew D
elhi,
India
) Del
hi Dec
lara
tion
� O
ctober
and N
ovem
ber C
OP 7
(
Mar
rake
sh, M
orocc
o)
�
Mar
rake
sh A
ccord
s
1979 1988 1990 1991 1992 1994 1995 1997 1998 2000 2001 2001 2002 2002
� M
arch
and A
pril,
COP 1
(Ber
lin, G
erm
any)
� M
arch
and A
pril, B
erlin
Man
date
Climate change is no longer a new issue. After scientific consensus on the fundamentalsemerged from a series of international workshops during the 1980s, governments led bythe Reagan Administration established the Intergovernmental Panel on Climate Change(IPCC) in 1988 to help them understand and build some international consensus on thenature of the problem. The IPCC has been termed the ‘most extensive and carefully-constructed international advisory process in history’ (see Annex).
Source: UNFCCC, Caring for the Climate Guide
1817
Can we just adapt to climate change?
Initially, the main impacts of climate change are a slightaggravation of existing weather fluctuations. Victims ofextreme weather events - storms, floods, droughts, etc -have no choice but to adapt as best they can after theevent. Many adverse impacts can however be reduced byanticipatory adaptation, making preparations againstsuch extreme events.
There are however several limitations to relying onadaptation as the prime strategy. It can be very hard topredict exactly what one is trying to adapt to. Sea levelrise is relatively predictable but the storm surges thatactually inflict the coastal damage are not, except in the broad sense of emerging statistical averages and very short-term warnings, so coastal preparations have to be extensive and costly in advance. In thesecircumstances, retreat - often in practice after the fact - may be more realistic.
It should be possible for temperate regions to adapt toconditions that are both hotter and wetter if these canbe predicted, but impacts of both may be dictatedmostly by the extremes that would be hard to predict.
Adapting in others parts of the world may be still moredifficult and this raises issues of equity between thoseresponsible for most of the impacts (predominantly the rich nations) and those likely to suffer the most. The brunt of climate impacts are likely to fall ondeveloping countries that have less capacity to cope withthe consequences, less capacity to invest in long-termpreparatory adaptation, and also have done little tocause the climate problem in the first place.
There are also impacts that can hardly be mitigated byadaptation. Some coastal deltas and swamp habitats maybe impossible to protect against rising sea levels. Nothingcan stop the melting of mountain glaciers, the loss ofmountain ecosystems, or the bleaching of coral reefs dueto warmer waters. And probably not much can be doneto prevent some other ecosystems and species dying outas climatic zones shift.
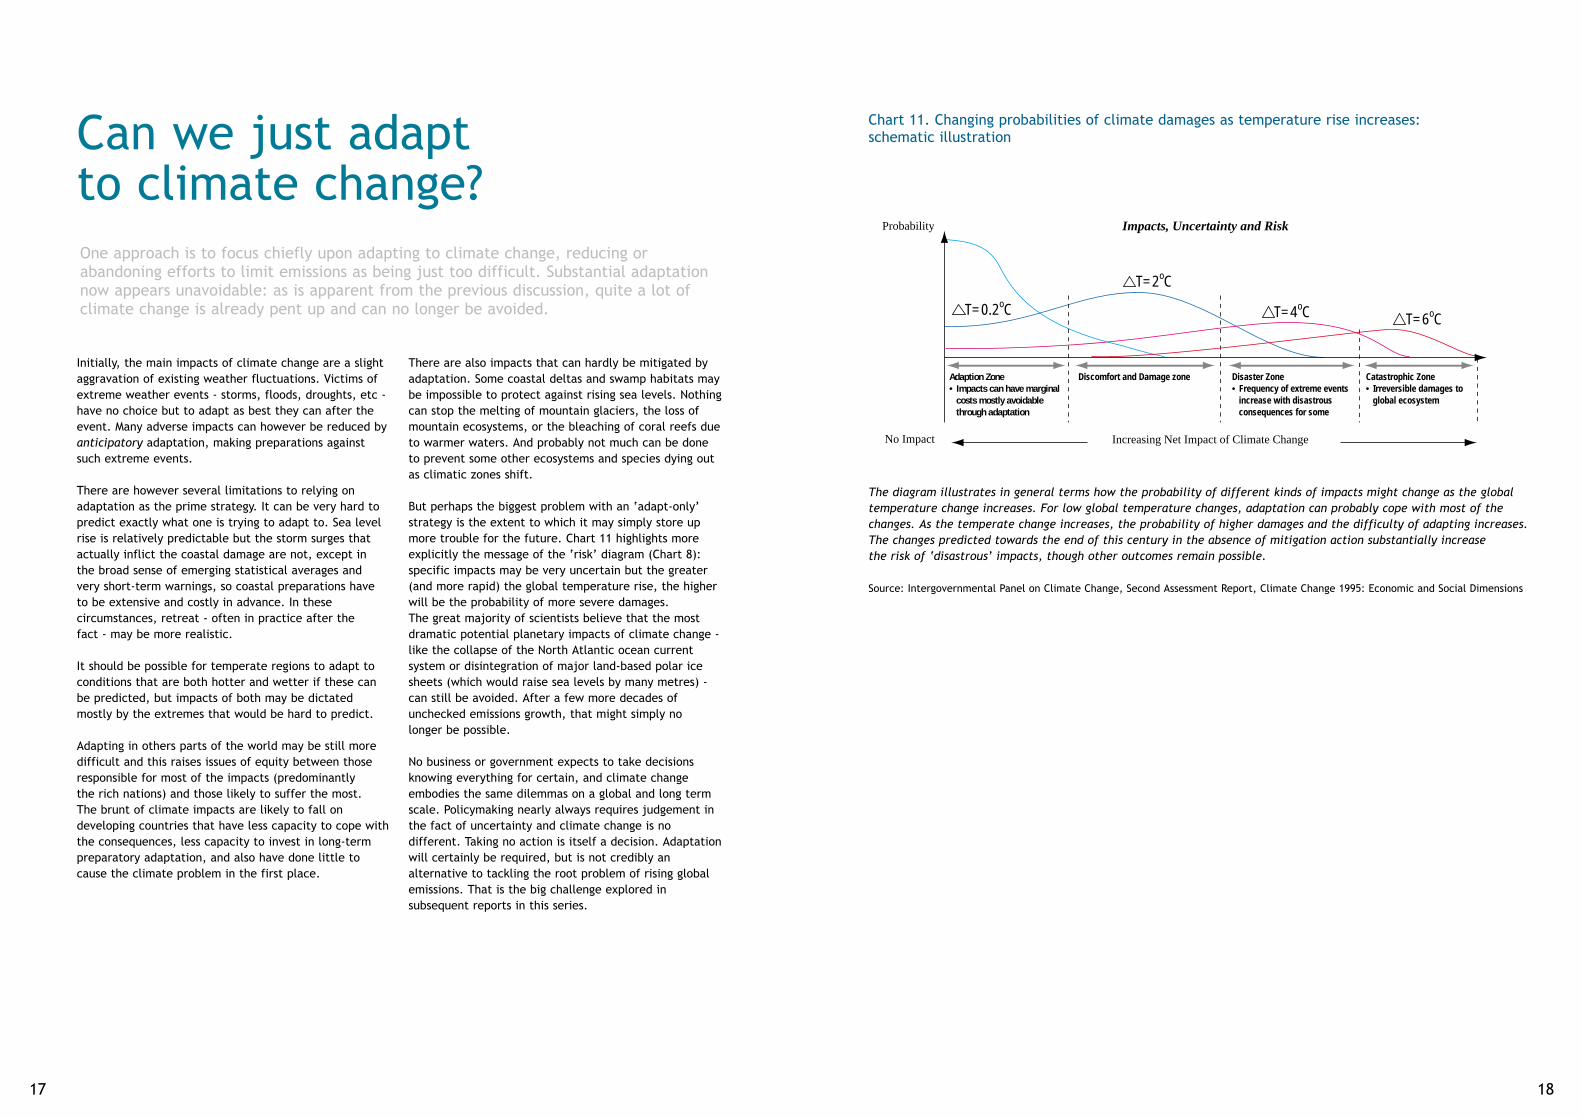
But perhaps the biggest problem with an ‘adapt-only’strategy is the extent to which it may simply store upmore trouble for the future. Chart 11 highlights moreexplicitly the message of the ‘risk’ diagram (Chart 8):specific impacts may be very uncertain but the greater(and more rapid) the global temperature rise, the higherwill be the probability of more severe damages. The great majority of scientists believe that the mostdramatic potential planetary impacts of climate change -like the collapse of the North Atlantic ocean currentsystem or disintegration of major land-based polar icesheets (which would raise sea levels by many metres) -can still be avoided. After a few more decades ofunchecked emissions growth, that might simply no longer be possible.
No business or government expects to take decisionsknowing everything for certain, and climate changeembodies the same dilemmas on a global and long termscale. Policymaking nearly always requires judgement inthe fact of uncertainty and climate change is nodifferent. Taking no action is itself a decision. Adaptationwill certainly be required, but is not credibly analternative to tackling the root problem of rising globalemissions. That is the big challenge explored insubsequent reports in this series.
The diagram illustrates in general terms how the probability of different kinds of impacts might change as the globaltemperature change increases. For low global temperature changes, adaptation can probably cope with most of thechanges. As the temperate change increases, the probability of higher damages and the difficulty of adapting increases. The changes predicted towards the end of this century in the absence of mitigation action substantially increase the risk of ‘disastrous’ impacts, though other outcomes remain possible.
Source: Intergovernmental Panel on Climate Change, Second Assessment Report, Climate Change 1995: Economic and Social Dimensions
Chart 11. Changing probabilities of climate damages as temperature rise increases: schematic illustration
One approach is to focus chiefly upon adapting to climate change, reducing orabandoning efforts to limit emissions as being just too difficult. Substantial adaptationnow appears unavoidable: as is apparent from the previous discussion, quite a lot ofclimate change is already pent up and can no longer be avoided.
Impacts, Uncertainty and Risk
No Impact
Probability
T=0.2oC
T=2oC
T=4oC T=6oC
Increasing Net Impact of Climate Change
Adaption Zone• Impacts can have marginal costs mostly avoidable through adaptation
Discomfort and Damage zone Disaster Zone• Frequency of extreme events increase with disastrous consequences for some
Catastrophic Zone• Irreversible damages to global ecosystem

2019
As explained previously in the section ‘How has the worldresponded?’ (page 15), in the late 1980s governmentsresponded to the rising chorus of scientific concern byestablishing the Intergovernmental Panel on ClimateChange (IPCC). This was designed to assess critically thestate of knowledge and thereby help to foster a commonunderstanding of robust facts about climate change. Inmany ways it is the most elaborate and carefullydesigned international advisory process ever created.
For the IPCC assessments, leading scientists from aroundthe world are selected to form writing teams which thenassess the state of knowledge as expressed in thepublished, peer-reviewed literature. The draft chaptersare in turn sent out for review by a combination of thescientific community and diverse stakeholders - in fact,almost anyone who wishes can request drafts and submitcomments for consideration. A revised draft is then sent out for combined government and peer review. An additional element built into the IPCC ThirdAssessment was the use of Review Editors, whose job is to ensure that all review comments are considered and that their treatment - including reasons if commentsare rejected - are recorded.
Leading scientists from the different chapters then drafttwo summaries of the findings - a detailed technicalsummary, which remains under the authority of thescientists as authors, and a policymakers’ summary. The latter is then handed to a governmental plenary atwhich governmental representatives negotiate line-by-
line their acceptance of or changes to the draft text,with the lead author scientists present to challenge them if they consider the changes proposed to bescientifically inaccurate.
Through this elaborate process, governments effectively‘sign up’ to a statement of knowledge that is consideredto be robust and accepted by consensus - and whichthereby forms an agreed intellectual backdrop forpolitical negotiations on what to do about it.
Given the political import of the IPCC’s findings, it is notsurprising that its reports have been subjected to attacksand attempts to undermine its conclusions. Perhaps themost famous concerned the conclusions of the SecondAssessment Report (1995) of ‘discernible humaninfluence’ in observed climatic changes. Some US lobbygroups both attacked the process and sought toundermine the US scientist Ben Santer who conductedthe seminal ‘fingerprint analysis’ of observed changes in the early 1990s. His findings have since beenreinforced by numerous other ‘fingerprint’ studies,leading the Third Assessment (2001) to strengthen itsfindings with ‘new and stronger evidence that most ofthe warming observed over the last 50 years isattributable to human activities’.
Upon coming into office, President Bush expressedscepticism about the science of climate change andestablished a committee of US scientists, with relativelystrong representation of sceptics, to again evaluate theIPCC findings. The committee broadly endorsed the
Annex: Science assessment,the Intergovernmental Panelon Climate Change, andrecent debates
IPCC’s findings, whilst placing more emphasis upon theuncertainties particularly with respect to quantifiedprojections of future changes.
The most widely-cited attack on the scientific consensussince then has been the publication of a paper thatquestioned estimates of pre-1860 temperatures. This argued in particular that available proxy indicatorssuggested a late mediaeval warm period - challengingthe ‘hockey stick’ shaped long-term temperature record(Chart 6) - and implying by analogy that the currentwarming could be due to natural (perhaps solar-induced)variation, at least to a far greater degree than the IPCCconsidered. The credibility of this analysis wasconsiderably undermined after it was revealed that peerreviews pointing to serious scientific errors in the paperhad been ignored, whereupon the Editor-in-Chief andfour members of the Editorial Board of the journalconcerned resigned. The debate about the precision ofmediaeval temperature estimates rumbles on, however,strained by the now politicised nature of what at root isa highly complex technical discussion over the reliabilityand weighting of over 100 proxy indicators.
A few scientists (including the co-author of the critiqueof the mediaeval temperature studies) have highlightedthe possible role of solar variations. Obviously,fluctuations in solar output can affect the Earth’stemperature, but the size of the direct effect is smallcompared to the radiative impact of accumulatinggreenhouse gases. There is some speculation aboutpossible indirect solar effects, but in addition to themechanisms being unclear it remains hard to see howanything like this could explain the observed upperatmosphere cooling. Nor is there evidence of recent solar activity so exceptional as to explain recenttemperatures, and it would seem a remarkablecoincidence should solar output surge just as greenhouse gases are accumulating.
The recent temperature record itself has been criticised.Queries about the influence of ‘urban heat island’ effectshave been raised for many years and exhaustively andconclusively addressed (for example throughconsideration of remote and sea-based measurements).More recently, critics have pointed to apparentdiscrepancies between surface and satellite-basedtemperature measurements. Most scientists regard themore recent and quite disparate satellite measurementsas being less reliable and subject to a range of problems(including satellite drift); assessments by the US National Academy of Sciences, as well as the IPCC, have concluded that the near-surface warming recordedby thermometers is undoubtedly real and that correctionof satellite data for early calibration problems supportsthis conclusion. Again, debate over the details continues.
The science of climate change is complex and many aspects have been contested,particularly by those reluctant to see action to limit emissions. This Annex indicateshow governments internationally have sought to establish robust facts on which to basedecision-making, and the nature of recent debates.
Another critique, given prominence by The Economist,attacked the scenarios of future emissions that informedthe IPCC’s predictions of future climate change. Two economists argued that the IPCC had madeexcessively high projections of economic growth in thedeveloping world because it had used market exchangerates in comparing economies instead of exchange ratescorrected for variations in purchasing powers. The IPCCauthors responded that their assessment reflected thescenarios literature available at the time and that in fact they had made purchasing power corrections, to the extent they considered feasible.
It is clear that purchasing power corrections wouldchange projected economic growth rates. It is less clearthe extent to which any such corrections would affectemission projections - exchange rate adjustments aseconomies mature would indeed affect economic growth as measured in international terms, but of coursewould not in themselves change physical emissions. The fundamental driving forces of global emissionsgrowth are readily apparent from Chart 5, and indeedmost other criticisms of the IPCC scenarios have beensimply that they span such a very wide range. It remainshard to see how debates about the valuation of exchangerates between countries could fundamentally alter thebasic issues surrounding the projections of growingemissions and associated climatic changes. Nevertheless,the debate reinforced the fact that prediction is not anexact science (which is why the IPCC uses a range ofscenarios), and that there are differing views about how quickly the pressures for emissions growth will play out - and whether and how fast efforts to curtailemissions can catch up so as to lead ultimately to global emission reductions.

2221
About the Carbon TrustThe Carbon Trust is a business-led, government-backed independent company. It was established to help UK business and public sectors understand and manage the risks and opportunities associated with climate change. It works with these sectors tosupport the transition to a low carbon economy in the UK, though programmes which help organisations to reduce their emissions and to invest strategically in low-carbontechnologies. For further information, see www.thecarbontrust.co.uk
Sources of further information This report combines information from many sources and was subject to wide-spread review by diverseinternational scientists. Specific technical queriesseeking clarification or verification of any statements in the report can be submitted [email protected]
Summaries of the scientific reviews conducted throughthe Intergovernmental Panel on Climate Change are allavailable from www.ipcc.ch The full Assessment Reports are published by Cambridge University Press.These contain exhaustive references to the enormous and diverse literature on climate change.
In the UK, which chaired the science working group ofthe IPCC for the first three IPCC Assessments, the HadleyCentre at the Meteorological Office is one of the world’sforemost scientific climate science research groups. Its website, http://www.met-office.gov.uk/research/hadleycentrecontains extensive source data and overviews, as well as links to many other centres of information. In the UKthese include the Climate Change Impacts Programmewhich addresses climate change impacts and adaptation issues.
Internationally, another leading centre is the CarbonDioxide Information Analysis Centre, based at the US Oak Ridge National Laboratory. Its websitehttp://cdiac.esd.ornl.gov/ gives links to the major US research centres on climate change science.
The UN Environment Programme hosts a general websiteon climate change with material ranging from basicexplanations to the results of UN scientific programmesand links on diverse aspects of the issue, athttp://climatechange.unep.net Information on nationaland international responses to climate change arebrought together through the UNFCCC. Its website,www.unfccc.int, includes links to the reports submittedby governments on their national programmes.
Finally, there are innumerable websites of individuals andorganisations promoting various views of the issue. Thewebsite www.aip.org/history/climate/ contains afascinating and excellent overview of the historicalevolution of climate change science. One of the leadingscientists has developed a website covering a wealth ofmaterial, including his experience of media treatment ofthe issue and reference and web links to the variouscontributions to controversies covered in the Annex tothis report (http://stephenschneider.stanford.edu).
Information sources concerning technology and policyresponses will be summarised in the subsequent reportsin this series.