the climate and weather of gisborne - niwadocs.niwa.co.nz/library/public/niwasts70.pdf · 6 summary...
TRANSCRIPT

THE CLIMATE AND WEATHER OF
G I S B O R N E2nd edition P.R. CHAPPELL

Note to Second EditionThis publication replaces the first edition of the New Zealand Meteorological Service Miscellaneous Publication 115 (8), written in 1980 by J. W. D. Hessell. It was considered necessary to update the second edition, incorporat-ing more recent data and updated methods of climatological variable calculation.
NIWA SCIENCE AND TECHNOLOGY SERIES NUMBER 70
ISSN 1173-0382
© 2016. All rights reserved. The copyright for this report, and for the data, maps, figures and other information (hereafter collectively referred to as “data”) contained in it, is held by NIWA. This copyright extends to all forms of copying and any storage of material in any kind of information retrieval system.
While NIWA uses all reasonable endeavours to ensure the accuracy of the data, NIWA does not guarantee or make any representation or warranty (express or implied) regarding the accuracy or completeness of the data, the use to which the data may be put or the results to be obtained from the use of the data. Accordingly, NIWA expressly disclaims all legal liability whatsoever arising from, or connected to, the use of, reference to, reliance on or possession of the data or the existence of errors therein. NIWA recommends that users exercise their own skill and care with respect to their use of the data and that they obtain independent professional advice relevant to their particular circumstances.

THE CLIMATE AND WEATHER OF THE GISBORNE DISTRICT2nd edition P.R. Chappell

Phot
o: ©
myc
hilly
bin.
co.n
z/M
ark
Ewin
gton

5
CONTENTSSUMMARY 6
INTRODUCTION 7
THE WEATHER IN GISBORNE DISTRICT 9
Typical weather situations 9Cyclones of tropical origin 9Westerly or northwesterly situations 10Northerly situations 10Southwesterly and southerly situations 11Southeasterly situations 11Sea breeze situations 11
CLIMATIC ELEMENTS 13Wind 13Rainfall 15
Spatial variability of rainfall 15Rainfall frequency and intensity 18Recent extreme events in Gisborne district 19Periods of low rainfall 20
Temperature 21Sea surface temperature 21Air temperature 22Earth temperatures 24Frosts 25
Sunshine and solar radiation 26Sunshine 26Solar radiation 27UV (Ultra-violet) radiation 27Fog 28
Severe convective storms 29Thunderstorms and hail 29Tornadoes 29Snow 29
Sea swell and waves 29
DERIVED CLIMATOLOGICAL PARAMETERS 31Vapour pressure and relative humidity 31Evapotranspiration and soil water balance 31Degree-day totals 34
ACKNOWLEDGEMENTS 38
REFERENCES 38

6
SUMMARYIn comparison with regions exposed to the west, Gisborne experiences a greater number of weather and climatic extremes. Its position as the easternmost region of New Zealand often results in differing weather conditions from those elsewhere, in that synoptic features over the ocean to the east of New Zealand sometimes affect Gisborne alone among New Zealand regions.
The climate is generally congenial with a large number of sunshine hours per year and a low mean wind speed. However rainfall is unevenly distributed throughout the year with a prominent winter maximum. The shortage of spring rainfall often affects growth and limits some types of agricultural activity. The climate has been found to be generally suitable for sheep, beef cattle, viticulture, and forestry, and there are smaller areas of high productivity of fruit, vegetables, and dairy produce.
Phot
o: ©
myc
hilly
bin.
co.n
z/M
ark
Ewin
gton

7
INTRODUCTIONThe Gisborne district is defined here as the area administered by Gisborne District Council. The district includes East Cape – the most easterly point of the main islands of New Zealand, and is bounded in the west by the main divide of the Raukumara Range, whose highest point is Mt Hikurangi (1753 m). The southwestern extent of the district primarily follows the boundary separating the Waipaoa and Wairoa River catchments. The principal population centre is Gisborne City, in and near which live most of the district’s population.
The North and South Islands of New Zealand, spanning latitudes 34°S to 47°S, lie within the hemispheric temperate zone where weather systems usually migrate from west to east. The ever-changing synoptic patterns cause considerable variability in the weather. Prolonged extremes of heat or cold, flood or drought are rare. Broken only at Cook Strait, the country’s main divide extends from near East Cape to Puysegur Point in the southwest of the South Island; Gisborne is thus the northernmost of the eastern districts that are protected by substantial mountains to the west. The mean wind flow over the country is from slightly south of west and areas east of the main divide have differing climatic characteristics from those in the west.
As New Zealand lies in the mid-latitudes it may experience outbreaks of air originating in the tropics or Antarctica, and the Gisborne district is occasionally affected by these. The effect of the oceans on air of tropical origin is to cool the lower layers creating broad sheets of stratiform cloud capable of producing large amounts of rain especially when they are entrained into cyclonic synoptic systems. Conversely in southerlies the ocean tends to destabilise the cold air by warming it at low levels which causes showery activity. The orography of the Gisborne district
further controls airmass characteristics so that for example southwest winds are often associated with fine weather while southeasterlies (apart from sea breeze) are usually cloudy and wet (see next section).
All numbers given in the following tables are calculated using data from the 1981–2010 normal period (a normal is an average or estimated average over a standard 30 year period), unless otherwise stated.
Figure 1. Map of Gisborne district, with locations of places mentioned in the text, tables, and figures.
Phot
o: ©
myc
hilly
bin.
co.n
z/M
ark
Ewin
gton

9
THE WEATHER IN GISBORNE DISTRICTTypical weather situationsThe weather of the Gisborne district is greatly influenced by the orography of the area. When winds are from the westerly quarter, sheltering by the Raukumara Range causes high temperatures and limited rainfall in the district. Conversely in easterly situations, the uplift caused by the mountains serves to enhance the rainfall and high intensities are recorded at all altitudes. Katabatic (downhill) drainage of cold air on winter nights often results in very low temperatures, and altogether the district has a greater range of weather conditions than many other parts of New Zealand. In situations where the broad scale wind flow is slight, frequent sea breezes occur in summer penetrating considerable distances inland.
Cyclones of tropical originTropical cyclones that reach Gisborne and still retain very low pressures and hurricane force winds are very rare. However, other storms of tropical origin (which may never have been fully developed tropical cyclones) affect New Zealand about once or twice each year, mainly between the months of December and April. They usually bring heavy rain and strong easterly winds. See the ‘Recent extreme events in Gisborne District’ section for a detailed description of the impact of ex-tropical cyclone Bola in March 1988. Figure 2a-e shows, by month, the tracks of tropical cyclones which made landfall in New Zealand during the period between 1970 and 2010.
Figure 2a. Tropical cyclones which made landfall in New Zealand during December, 1970–2010. Source: Southwest Pacific Enhanced Archive of Tropical Cyclones (SPEArTC; Diamond et al., 2012).
Figure 2b. Tropical cyclones which made landfall in New Zealand during January, 1970–2010. Source: SPEArTC (Diamond et al., 2012).
Figure 2c. Tropical cyclones which made landfall in New Zealand during February, 1970–2010. Source: SPEArTC (Diamond et al., 2012).
Figure 2d. Tropical cyclones which made landfall in New Zealand during March, 1970–2010. Source: SPEArTC (Diamond et al., 2012).

10
Figure 2e. Tropical cyclones which made landfall in New Zealand during April, 1970–2010. Source: SPEArTC (Diamond et al., 2012).
Figure 4. Sea level pressure analysis at 0000 NZST, 28 June 1977.
Westerly or northwesterly situationsThe strongest northwesterly winds occur just ahead of cold fronts, moving east or northeast over New Zealand. In periods of prolonged westerlies over New Zealand a high pressure belt lies to the north and a series of eastward-moving depressions to the south of the country. Figure 3, showing the situation at midnight on 2–3 February 1977, is typical of westerly or northwesterly situations. At midday on 2 February 1977 the relative humidity at Gisborne aerodrome was 29% and had dropped to only 19% by 3 pm, reverting to 29% at 6 pm as the temperature fell. A dry day was also recorded on 3 February with a midday humidity of only 26%. During this period surface winds were northwesterly 30–40 km/hr, the passage of the front being detectable only by changes in the high cloud, there being no significant low cloud at any stage.
Northerly situationsA typical north to northeast airflow is caused by situations similar to those of 28 June 1977 (Figure 4). The wind flow was more parallel to the main divide than in the northwesterlies and there was not as marked a descent in the coastal areas. Heavy rain occurred in the ranges, and at Gisborne persistent light rain fell throughout the day. Surface winds were somewhat variable but with a negligible westerly component. Wind strengths at Gisborne varied from 30–50 km/hr from the northeast, the strongest winds being accompanied by the most intense rainfalls of the day. Days such as this with steady light rain and mild temperatures are favourable for plant growth though they may be followed by general heavy rain causing flooding if the depression moves on a track to the north of the district. On this occasion the depression moved southwards and there was no rain in the area on the next day.
Figure 3. Sea level pressure analysis at 0000 NZST, 3 February 1977.

11
Figure 5. Sea level pressure analysis at 0000 NZST, 6 May 1977.
Southwesterly and southerly situationsWhen the general air flow over New Zealand is from the southwest or south, the Gisborne district may receive coastal showers while little rain occurs in the ranges (Figure 5). On 6 May 1977, 17 mm of rain was recorded in Gisborne while places further inland had no rain. Under the usual conditions of atmospheric stability the coastal regions will be cloudy with high relative humidity but the ranges will be clear of cloud. This situation is a complete reversal of northwest situations with respect to the distribution of cloud and precipitation.
Southeasterly situationsWith the main divide and the coastline lying directly across southeasterly airstreams, these flows usually produce heavy rains over the whole district. An extreme example occurred on 21 June 1977 when surface winds at Gisborne were southeast 45–55 km/hr with gusts to 87 km/hr (Figure 6). Rainfall there was 156 mm for 24 hours, 90 mm of this falling between 9 am and noon. Although the overall rain period in the ranges was longer than on the coast, the two-day rainfalls were comparable, the greatest 24 hour maximum occurring in the coastal zone. Flooding in the area was widespread as a result of this weather and a state of emergency was declared for part of Gisborne City where the river overflowed its banks, being some 2 m above its normal level. Gisborne is usually the last region in the country to clear when a moist southeast airstream progresses towards the east as a high latitude anticyclone advances.
Sea breeze situationsSea breezes are common in the Gisborne district in summer, penetrating considerable distances inland in the afternoons. Their development is favoured by clear skies and small pressure gradients and thus they are most frequent during anticyclonic conditions.
Figure 6. Sea level pressure analysis at 0000 NZST, 21 June 1977.

Phot
o: ©
myc
hilly
bin.
co.n
z/Pa
ulin
e Sm
ith

13
CLIMATIC ELEMENTSWindApart from the East Cape area which is very exposed, wind flow over the Gisborne district is lighter than in many coastal areas of New Zealand. Wind roses (mean annual frequency of surface wind speed and direction based on hourly observations) for sites in the Gisborne district are shown in Figure 7. Winds from the west and southeast prevail at Hicks Bay, which also experiences the strongest winds of the selected stations. At Gisborne and Motu, northwest winds are the most frequent (with some winds from the southeast also). At Mahia1, the prevailing wind is north-north-east, but winds from between south and west are also common.
Mean wind speed data (average wind speeds are taken over the 10 minute period preceding each hour), are available for several sites in the Gisborne district, and these illustrate the several very different wind regimes of the district. Hicks Bay is the most exposed station in the district, followed by Mahia. Gisborne is more sheltered due to its location within an embayment. Table 1 gives mean monthly wind speeds for selected stations in Gisborne district.
1Mahia Peninsula is just south of the boundary of the Gisborne District. It is included in this report due to limited available long-term climate data from within the Gisborne District.
Table 1. Mean monthly and annual wind speed (km/hr).
Location Jan Feb Mar Apr May Jun Jul Aug Sep Oct Nov Dec AnnHicks Bay AWS 23 23 23 22 23 25 25 24 26 26 26 24 24Gisborne AWS 12 11 11 10 10 11 11 11 12 13 13 12 11Motu EWS 13 13 12 11 12 13 13 12 14 15 15 14 13Mahia AWS 17 17 17 16 17 19 18 18 18 19 18 18 18
Figure 7. Mean annual wind frequencies (%) of surface wind directions from hourly observations at selected Gisborne district (and surrounding) stations. The plot shows the directions from which the wind blows, e.g. the dominant wind direction at Gisborne Aero is from the northwest.
Table 2. Seasonal proportions of strong or light winds (%) for Gisborne sites.
Location Summer Autumn Winter Spring
Hicks Bay AWSStrong 21 22 28 30
Light 27 26 24 23
Gisborne AWSStrong 16 18 16 50
Light 25 25 25 25
Motu EWSStrong 13 15 32 41Light 25 25 25 24
Mahia AWSStrong 16 22 32 30Light 26 25 24 24
Spring is generally the windiest season throughout the Gisborne district. Summer and autumn are the seasons when the greatest proportions of light wind days are recorded. Table 2 gives the seasonal proportion of strong or light winds as a percentage of the annual total. For example, of all strong winds recorded at Gisborne, 16% occurred in summer, 18% in autumn, 16% in winter and 50% in spring. In compiling this table a strong wind was defined as having a mean wind speed of at least 31 km/hr.

14
Table 3. Average wind speed (km/hr) for selected hours.
Table 4. Average number of days per year with gusts exceeding 63 km/hr and 96 km/hr for selected stations.
Table 5. Highest recorded gusts at selected Gisborne district stations, from all available data.
Location 0000 0300 0600 0900 1200 1500 1800 2100Hicks Bay AWS 23 23 22 24 27 27 25 23Gisborne AWS 9 9 9 12 15 16 13 9Motu EWS 11 11 11 13 16 17 15 12
LocationGusts
>63 km/hrGusts
>96 km/hrHicks Bay AWS 139 12Motu EWS 44 1Gisborne Aero 56 2Mahia AWS 72 3
Location Gust (km/hr) Direction DateHicks Bay AWS 134 S 23/11/2001
Motu EWS 118 NNE 2/08/2008
Gisborne AWS 111 NW 8/11/1994
Diurnal variation in wind speed is well-marked, with greatest wind speeds occurring in the early part of the afternoon. This is because at that time of day heating of the land surface is most intense and stronger winds aloft are brought down to ground level by turbulent mixing. Cooling at night generally restores a lighter wind regime. Table 3 gives average wind speeds at three-hourly intervals for selected stations.
Winds can be strong and gusty at times, especially in coastal areas. Hicks Bay has the highest number of gusts per year that are both greater than 63 km/hr and 96 km/hr (Table 4). In comparison, Motu and Gisborne are relatively sheltered.
Although gale force winds can occur in any month, they are most frequent in winter. The highest gust recorded from selected stations in the district was 134 km/hr at Hicks Bay on 23 November 2001. Maximum gusts recorded at different stations in the district are listed in Table 5.
Phot
o: ©
myc
hilly
bin.
co.n
z/M
ichi
Kra
uss

15
Rainfall
Spatial variability of rainfall
The pattern of rainfall distribution over the Gisborne district is shown in Figure 8. Because of the mountainous terrain, orographic influences on rainfall are marked. Coastal rainfalls vary from around 1300–1800 mm north of Gisborne to East Cape, to less than 1000 mm near Gisborne and further inland. In some parts of the Raukumara Range, annual rainfall exceeds 2200 mm. These rainfalls reflect the effect of the topography on the principal rain producing winds, the northerlies and the southeasterlies.
Seasonal influences on rainfall distribution are also quite well defined. Table 6 lists monthly rainfall normals and percentage of annual total for selected stations. This table shows a clearly defined winter rainfall maximum. This is typical of most North Island regions. The depressions which frequently move southeast across the North Island in winter cause this rainfall maximum and often bring a period of heavy rain to the Gisborne area. Monthly percentages of the annual rainfall total are fairly consistent across the Gisborne district, with around 30% of annual rainfall expected in the winter months from June to August, and around 20% of rain in the summer months from December to February.
Table 6. Monthly/annual rainfall normal (a; mm) and percentage of annual total for each month (b; %).
Location Jan Feb Mar Apr May Jun Jul Aug Sep Oct Nov Dec Ann
Mataraoaa 158 127 169 217 188 254 258 240 220 155 194 176 2355
b 7 5 7 9 8 11 11 10 9 7 8 7
Ruatoria 2a 83 155 165 162 160 167 187 187 164 95 118 105 1748b 5 9 9 9 9 10 11 11 9 5 7 6
Te Poraa 114 128 159 137 154 176 226 160 124 114 95 90 1675b 7 8 9 8 9 10 14 10 7 7 6 5
Motu Ewsa 131 127 128 145 192 246 216 208 199 207 174 185 2158b 6 6 6 7 9 11 10 10 9 10 8 9
Waipaoaa 98 116 130 130 127 156 186 123 98 93 66 73 1395b 7 8 9 9 9 11 13 9 7 7 5 5
Tolaga Bay,Mangatuna
a 178 117 143 129 145 174 151 198 156 174 157 145 1868b 10 6 8 7 8 9 8 11 8 9 8 8
Figure 8. Median annual total rainfall for Gisborne district, 1981–2010.

Mean
Lowest Monthly Total
90 Percentile Value
10 Percentile Value
Highest Monthly Total
16
Table 6 continued.
Location Jan Feb Mar Apr May Jun Jul Aug Sep Oct Nov Dec Ann
Otokoa 90 86 106 100 105 128 142 111 99 113 87 93 1259
b 7 7 8 8 8 10 11 9 8 9 7 7
Gisborne Awsa 59 68 93 97 96 105 131 78 72 70 63 57 987
b 6 7 9 10 10 11 13 8 7 7 6 6
Figure 9. Monthly variation in rainfall for selected Gisborne district stations.
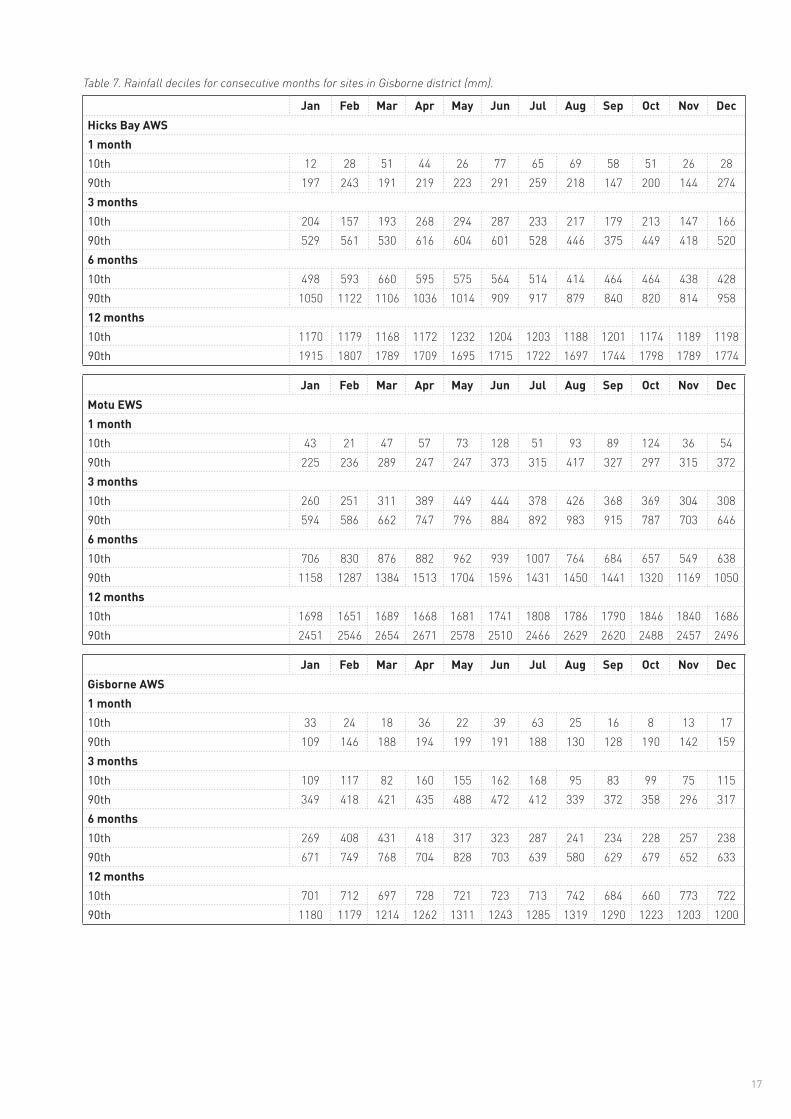
Rainfall variability over longer periods is indicated by rainfall deciles, as given in Table 7. The 10th percentile values show the accumulated rainfalls that will normally be exceeded in nine out of ten years, while the 90th percentile values indicate the accumulated falls that will normally be exceeded in only one year in ten. The table includes periods from one month to twelve months; each period over one month begins with the month stated. For example, using the table for Hicks Bay, it can be seen that in the three month period beginning in April, 268 mm or more of rainfall can be expected in nine years in ten, while a total of 616 mm or more should occur in only one year in ten.
The distribution of monthly rainfall is shown in Figure 9. The 10th percentile, 90th percentile, and mean rainfall values for each month are shown along with maximum and minimum recorded values for several stations.
Gisborne AWS
Rain
fall
(mm
)
Rain
fall
(mm
)
Rain
fall
(mm
)
Rain
fall
(mm
)
Rain
fall
(mm
)
020
040
060
0
Hicks Bay AWS
020
040
060
0
Motu EWS
020
040
060
0
Ruatoria 2
020
040
060
0
Tolaga Bay, Mangatuna
020
040
060
0
J F M A M J J A S O DN J F M A M J J A S O DN J F M A M J J A S O DN
J F M A M J J A S O DN J F M A M J J A S O DN
17
Table 7. Rainfall deciles for consecutive months for sites in Gisborne district (mm).
Jan Feb Mar Apr May Jun Jul Aug Sep Oct Nov DecHicks Bay AWS1 month10th 12 28 51 44 26 77 65 69 58 51 26 2890th 197 243 191 219 223 291 259 218 147 200 144 2743 months10th 204 157 193 268 294 287 233 217 179 213 147 16690th 529 561 530 616 604 601 528 446 375 449 418 5206 months10th 498 593 660 595 575 564 514 414 464 464 438 42890th 1050 1122 1106 1036 1014 909 917 879 840 820 814 95812 months10th 1170 1179 1168 1172 1232 1204 1203 1188 1201 1174 1189 119890th 1915 1807 1789 1709 1695 1715 1722 1697 1744 1798 1789 1774
Jan Feb Mar Apr May Jun Jul Aug Sep Oct Nov DecMotu EWS1 month10th 43 21 47 57 73 128 51 93 89 124 36 5490th 225 236 289 247 247 373 315 417 327 297 315 3723 months10th 260 251 311 389 449 444 378 426 368 369 304 30890th 594 586 662 747 796 884 892 983 915 787 703 6466 months10th 706 830 876 882 962 939 1007 764 684 657 549 63890th 1158 1287 1384 1513 1704 1596 1431 1450 1441 1320 1169 105012 months10th 1698 1651 1689 1668 1681 1741 1808 1786 1790 1846 1840 168690th 2451 2546 2654 2671 2578 2510 2466 2629 2620 2488 2457 2496
Jan Feb Mar Apr May Jun Jul Aug Sep Oct Nov DecGisborne AWS1 month10th 33 24 18 36 22 39 63 25 16 8 13 1790th 109 146 188 194 199 191 188 130 128 190 142 1593 months10th 109 117 82 160 155 162 168 95 83 99 75 11590th 349 418 421 435 488 472 412 339 372 358 296 3176 months10th 269 408 431 418 317 323 287 241 234 228 257 23890th 671 749 768 704 828 703 639 580 629 679 652 63312 months10th 701 712 697 728 721 723 713 742 684 660 773 72290th 1180 1179 1214 1262 1311 1243 1285 1319 1290 1223 1203 1200

18
Jan Feb Mar Apr May Jun Jul Aug Sep Oct Nov DecMahia AWS1 month10th 32 14 17 53 37 52 74 32 18 13 21 1490th 108 164 170 231 205 219 192 165 117 196 155 1423 months10th 110 121 117 198 221 221 172 99 80 76 93 10490th 405 463 518 485 497 544 425 364 390 393 340 3706 months10th 318 408 426 404 368 372 276 192 257 301 298 36290th 810 891 903 799 877 815 807 652 695 710 766 74412 months10th 723 716 716 768 756 804 881 891 963 917 800 69190th 1525 1489 1507 1570 1616 1547 1473 1494 1492 1466 1518 1487
Table 7 continued.
Table 8. Average monthly rain days and wet days for Gisborne district; a: 0.1 mm rain day, b: 1 mm wet day, from all available data.
Rainfall frequency and intensity
The average number of days each year on which 0.1 mm or more of rain is recorded varies from 132 days at Tolaga Bay to 203 days at Motu. Most areas record around 155 days per year where at least 0.1 mm of rain is recorded. The 0.1 mm rain days and 1 mm wet days show the same geographic variability. Table 8 lists the average number of days per month with 0.1 mm and 1 mm of rain for selected stations.
Location Jan Feb Mar Apr May Jun Jul Aug Sep Oct Nov Dec Ann
Hicks Bay AWSa 10 10 13 13 14 16 17 17 14 13 12 12 162
b 8 8 10 9 11 12 14 13 11 11 9 9 124
Mataraoaa 10 9 11 12 13 13 14 15 14 13 12 11 148b 9 8 10 10 12 12 13 14 12 12 11 10 131
Ruatoria 2a 10 10 12 13 13 15 16 17 15 13 11 12 156b 8 8 10 10 10 12 13 14 12 10 8 10 124
Te Poraa 11 11 12 13 13 14 16 17 14 13 11 11 156b 8 8 10 10 11 11 13 13 11 10 9 8 123
Motu Ewsa 14 14 15 15 19 19 20 20 18 18 15 15 203b 10 10 11 10 12 14 14 14 14 14 11 12 146
Waipaoaa 10 10 11 13 13 15 16 16 14 13 11 12 155b 9 8 9 10 11 12 13 14 12 11 9 10 130
Tolaga Bay Mangatunaa 8 9 11 11 11 12 14 14 11 11 9 9 132b 7 7 9 10 9 11 12 12 9 9 7 7 108
Otokoa 11 10 12 12 14 14 15 16 14 14 13 12 156b 9 8 9 9 11 11 12 13 11 11 10 10 126
Gisborne Awsa 10 10 13 13 14 14 17 15 12 12 11 11 152b 7 8 9 9 10 10 13 11 8 8 8 7 108
Mahia AWSa 11 11 14 15 17 17 19 17 13 13 12 11 169b 7 8 10 11 12 14 15 13 10 9 9 8 126
19
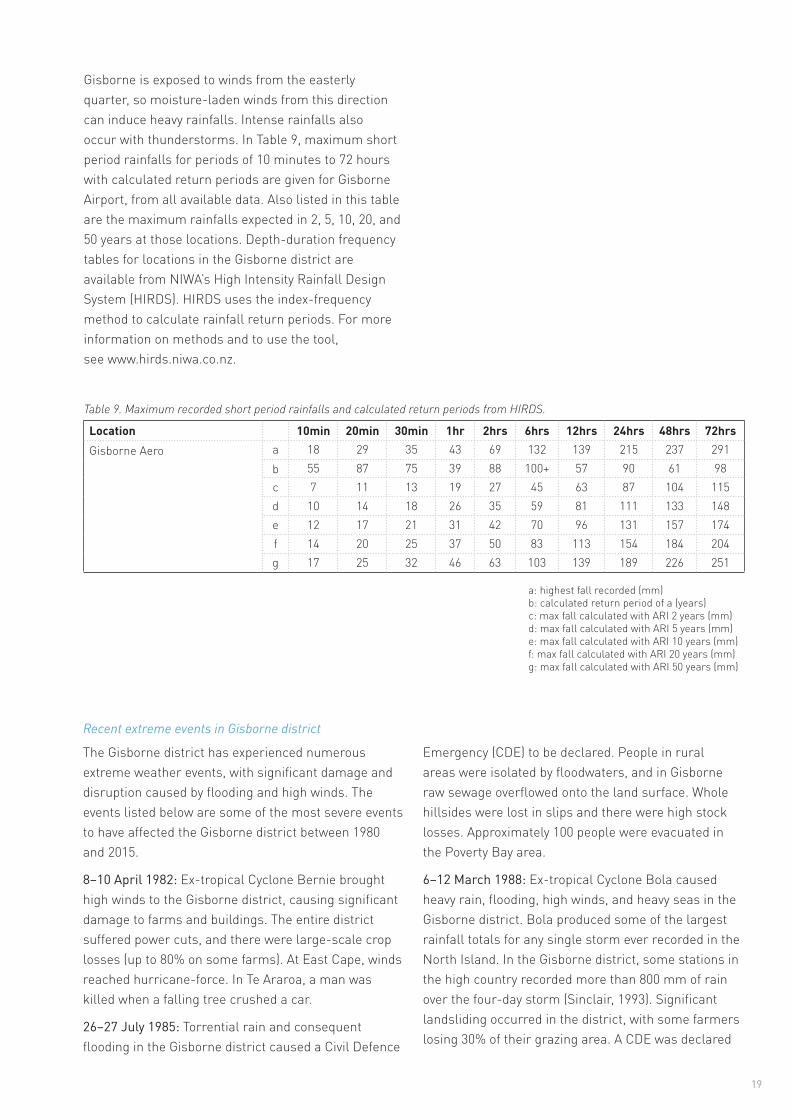
Gisborne is exposed to winds from the easterly quarter, so moisture-laden winds from this direction can induce heavy rainfalls. Intense rainfalls also occur with thunderstorms. In Table 9, maximum short period rainfalls for periods of 10 minutes to 72 hours with calculated return periods are given for Gisborne Airport, from all available data. Also listed in this table are the maximum rainfalls expected in 2, 5, 10, 20, and 50 years at those locations. Depth-duration frequency tables for locations in the Gisborne district are available from NIWA’s High Intensity Rainfall Design System (HIRDS). HIRDS uses the index-frequency method to calculate rainfall return periods. For more information on methods and to use the tool, see www.hirds.niwa.co.nz.
Table 9. Maximum recorded short period rainfalls and calculated return periods from HIRDS.
Location 10min 20min 30min 1hr 2hrs 6hrs 12hrs 24hrs 48hrs 72hrsGisborne Aero a 18 29 35 43 69 132 139 215 237 291
b 55 87 75 39 88 100+ 57 90 61 98c 7 11 13 19 27 45 63 87 104 115d 10 14 18 26 35 59 81 111 133 148e 12 17 21 31 42 70 96 131 157 174f 14 20 25 37 50 83 113 154 184 204g 17 25 32 46 63 103 139 189 226 251
a: highest fall recorded (mm)b: calculated return period of a (years)c: max fall calculated with ARI 2 years (mm)d: max fall calculated with ARI 5 years (mm)e: max fall calculated with ARI 10 years (mm)f: max fall calculated with ARI 20 years (mm)g: max fall calculated with ARI 50 years (mm)
Recent extreme events in Gisborne district
The Gisborne district has experienced numerous extreme weather events, with significant damage and disruption caused by flooding and high winds. The events listed below are some of the most severe events to have affected the Gisborne district between 1980 and 2015.
8–10 April 1982: Ex-tropical Cyclone Bernie brought high winds to the Gisborne district, causing significant damage to farms and buildings. The entire district suffered power cuts, and there were large-scale crop losses (up to 80% on some farms). At East Cape, winds reached hurricane-force. In Te Araroa, a man was killed when a falling tree crushed a car.
26–27 July 1985: Torrential rain and consequent flooding in the Gisborne district caused a Civil Defence
Emergency (CDE) to be declared. People in rural areas were isolated by floodwaters, and in Gisborne raw sewage overflowed onto the land surface. Whole hillsides were lost in slips and there were high stock losses. Approximately 100 people were evacuated in the Poverty Bay area.
6–12 March 1988: Ex-tropical Cyclone Bola caused heavy rain, flooding, high winds, and heavy seas in the Gisborne district. Bola produced some of the largest rainfall totals for any single storm ever recorded in the North Island. In the Gisborne district, some stations in the high country recorded more than 800 mm of rain over the four-day storm (Sinclair, 1993). Significant landsliding occurred in the district, with some farmers losing 30% of their grazing area. A CDE was declared

20
Figure 10. Damage caused by ex-Tropical Cyclone Bola.
for the district from 7–13 March, and was re-declared for parts of the district from the 22–25 March. By the third day of the storm, 17 helicopters were operating to rescue people throughout the district. In Gisborne city alone, 3000 people were evacuated. Three people drowned near Tolaga Bay, when they were trapped in a car that was swept away by floodwaters. Damage costs to the district totalled $189 million 2008 dollars (Figure 10). Assistance costs paid to farmers following the event were estimated at $35 million 2008 dollars, and the cost for repairing non-insurable on-farm storm damage (fences, farm tracks, etc.) was estimated at $29 million 2008 dollars. In the district, farm valuations reduced by an estimated $32.5 million 2008 dollars.
1–2 September 1988: High winds and heavy rain associated with a deep depression caused severe flooding and damage to the Gisborne district. More than 10% of some farmers’ lambs died during the storm, and bridge/roading damage was estimated at $3.7 million 2009 dollars. During the storm, the Waimata and Waipaoa Rivers deposited 3–4 m of silt in some places, and numerous slips occurred.
20–22 October 2005: A deep low caused heavy rain and strong winds in the Gisborne district. Three main highways into the district, as well as many other local roads, were closed by slips, fallen trees, and flooding. Power was cut to hundreds of homes, and phone communications were lost in some rural areas. Hundreds of hectares of crops were lost after stopbanks were breached during a critical part of the growing season. A number of people were evacuated from rural areas where floodwaters threatened their homes. The event was expected to cost the district more than $55 million 2008 dollars.
20 September 2015: A stalling low to the east of the North Island began to direct heavy rainfall to the Gisborne region causing widespread surface flooding. Fallen trees and many slips were widely reported, and the town of Te Karaka was isolated by flooding. Gisborne recorded 104 mm of rain, which at the time of publication is its highest 1-day rainfall for September since records began in 1937.
Periods of low rainfall
Periods of fifteen days or longer with less than 1 mm of rain on any day are referred to as ‘dry spells’. Dry spells are common in the Gisborne district during
the summer and early autumn. There is usually one, and frequently two, such periods each year between December and March. This frequency is similar to that recorded in other eastern parts of New Zealand. The average duration of a dry spell is about 18 days. The longest recent dry spell between three key sites in Gisborne district (Gisborne, Hicks Bay, and Motu) was 69 days recorded in Gisborne, from 3 November 1994 to 10 January 1995. During this dry spell, it did not rain for 27 consecutive days. Other long dry spells include 39 days at Hicks Bay from 11 January to 18 February 1998, of which 20 consecutive days were without any rain, and 28 days at Gisborne from 1–28 March 2007, of which 12 consecutive days were without any rain.
Phot
o. N
oel T
rust
rum
, GN
SPh
oto.
NOA
A

21
Figure 11. Mean monthly land (Gisborne AWS) and sea surface temperatures.
Temperature
Sea surface temperature
In the Gisborne district, average sea surface temperatures range from around 14°C in August up to 20°C during February (Figure 11, 12). Monthly mean sea surface temperatures off the coast of the Gisborne district are compared to mean air temperature for Gisborne AWS in Figure 11. There is a six to eight week lag between the minima of land and sea temperatures. Figure 12 shows the mean sea surface temperatures for the New Zealand region for February and August, which are the warmest and coolest months with respect to sea surface temperatures.
A) MEAN FEBRUARY SST (°C) B) MEAN AUGUST SST (°C)
Figure 12. Monthly mean sea surface temperatures (°C) for: a) February; b) August. Source: NIWA SST Archive, Uddstrom and Oien (1999).
0
5
10
15
20
25
Jan Feb Mar Apr May Jun Jul Aug Sep Oct Nov Dec
Tem
pera
ture
(°C)
Month
Gisborne mean temp SST

22
Air temperature
Because New Zealand has a relatively small land area and is surrounded by a vast area of ocean, seasonal and diurnal temperature variations are relatively small. This is especially apparent near the coast in the Gisborne district, where the sea exerts a modifying effect. Katabatic drainage of cold air contributes to lower minimum temperatures at Gisborne city, especially in winter. Variations in altitude are accompanied by variations in mean temperature, where mean temperature reduces with height. The eastern part of the district, under the influence of foehn winds, has recorded some of the highest North Island temperatures known. Average daily maximum temperatures over 20°C are recorded over most of the district during the months December to March (Figure 13a) and most places have recorded temperatures over 30°C on at least one occasion.
Inland areas in particular are subject to cold night-time temperatures during winter, especially when clear skies permit rapid radiational cooling. Air temperatures below 0°C are recorded in most parts of the district each winter, with mean daily minimum winter temperatures between 1°C and 5°C experienced for most inland parts of the district (Figure 13b). Figure 14 shows that median annual average temperature in the Gisborne district varies with elevation. Low-lying coastal areas have a mean annual temperature of around 14°C, whereas the higher-elevation Raukumara Range experiences a mean annual temperature of around 9°C. Figure 15 gives the monthly temperature regime (highest recorded, mean monthly maximum, mean daily maximum, mean, mean daily minimum, mean monthly minimum, and lowest recorded) for selected sites in Gisborne district.
Figure 13. a) Gisborne district median summer average daily maximum temperature; b) Gisborne district median winter average daily minimum temperature.

23
Figure 14. Gisborne district median annual average temperature, 1981–2010.
Highest Recorded
Mean
Mean Daily Maximum
Mean Daily Minimum
Mean Monthly Minimum
Mean Monthly Maximum
Lowest Recorded
Figure 15. Monthly variation in air temperatures for selected Gisborne stations.
The annual mean daily temperature range for Gisborne district is 8.1°C. Table 10 shows the average daily temperature range for each month for a number of sites in Gisborne district. Hicks Bay has the smallest temperature range and Ruatoria has the largest.
Tem
pera
ture
(o C)
−10
010
2030
40Te
mpe
ratu
re (o C
)−1
00
1020
3040
Tem
pera
ture
(o C)
−10
010
2030
40
Tem
pera
ture
(o C)
−10
010
2030
40
Tem
pera
ture
(o C)
−10
010
2030
40
Gisborne AWS Hicks Bay AWS
Motu EWS Ruatoria 2
Mahia AWS
J F M A M J J A S O DN J F M A M J J A S O DN J F M A M J J A S O DN
J F M A M J J A S O DNJ F M A M J J A S O DN

24
Table 11. Mean hourly temperatures at Blenheim Research EWS and Cape Campbell AWS for January and July.
Figure 16. Mean hourly temperatures at Gisborne AWS for January and July.
Table 10. Average daily temperature range (°C) for Gisborne sites.
Location Jan Feb Mar Apr May Jun Jul Aug Sep Oct Nov Dec AnnHicks Bay Aws 6.4 6.2 6.2 6.5 6.1 6.2 5.9 6.3 6.0 6.1 6.1 6.1 6.2Ruatoria 2 11.1 10.3 10.3 10.4 10.4 10.2 9.8 9.8 10.3 10.5 10.4 10.8 10.3Gisborne Aws 10.8 10.2 10.1 10.1 9.9 9.5 9.0 9.6 9.9 10.1 10.3 10.3 10.0
00 01 02 03 04 05 06 07 08 09 10 11
Gisborne
January 16.4 16.0 15.7 15.4 15.1 14.9 15.6 17.4 19.1 20.5 21.5 22.2July 8.1 8.1 8.0 7.8 7.7 7.6 7.4 7.5 7.7 9.1 10.7 11.9
12 13 14 15 16 17 18 19 20 21 22 23January 22.5 22.7 22.8 22.7 22.3 21.8 21.0 19.9 18.7 17.9 17.3 16.8July 12.6 13.2 13.4 13.1 12.7 11.6 10.3 9.6 9.2 8.8 8.6 8.4
The diurnal temperature range for Gisborne is moderate. Table 11 and Figure 16 show mean hourly temperatures for Gisborne AWS for January and July. From this, it can be seen that the average daily range for January is 7.9°C and for July it is 6.0°C.
The highest daily temperature recorded to date in the Gisborne district is 39.2°C, at Ruatoria on 7 February 1973. This is also the highest temperature recorded to date in the North Island. The lowest air temperature recorded in the Gisborne district to date is -7.8°C, at Motu on both 24th August 2000 and 22nd May 2009. These extreme temperatures compare to national extremes of 42.4°C and -25.6°C.
Earth temperatures
Earth (soil) temperatures are measured once daily at 9 am at several locations in the Gisborne district. Earth temperatures are measured at varying depths and are important, amongst other things, for determining the growth and development of plants. Different plants have different rooting depths and as such, earth temperatures are routinely monitored at 10, 20, 30, 50, and 100 cm depths. Table 12 lists mean monthly earth temperatures for a number of standard depths.
In the Gisborne district, earth temperatures, like air temperatures, vary spatially. Waerenga O Kuri is at an elevation of 314 m, and therefore exhibits cooler 9 am earth temperatures than the sites at lower elevations. Figure 17 shows how earth temperatures change throughout the year at Gisborne Airport, compared with air temperature at Gisborne AWS (at the same location as Gisborne Airport station). The temperature cycle for 100 cm depth is more damped and lagged than at shallower depths.
0
5
10
15
20
25
00 01 02 03 04 05 06 07 08 09 10 11 12 13 14 15 16 17 18 19 20 21 22 23
Tem
pera
ture
(°C)
Time
January July

25
Figure 17. Average monthly 9 am earth temperatures for different depths at Gisborne Airport and mean 9 am air temperature at Gisborne AWS (same location as Gisborne Aero).
Table 12. Mean 9 am earth temperatures at different Gisborne district locations, with station elevations, from all available data.
Location Jan Feb Mar Apr May Jun Jul Aug Sep Oct Nov Dec AnnRuatoria 2 (61m)10 cm 21 20 18 14 10 8 7 8 11 14 17 19 1420 cm 22 21 19 16 12 10 9 9 11 14 17 20 1530 cm 22 22 20 17 13 10 9 10 12 15 18 20 16Gisborne Aero (4m)10 cm 20 20 17 14 10 8 7 8 10 14 17 19 1420 cm 21 21 18 15 12 9 8 9 11 14 17 20 1530 cm 21 21 19 16 12 10 9 10 12 14 17 20 15100cm 19 20 19 17 15 12 11 11 12 14 16 18 15Waerenga O Kuri 2 (314m)10cm 18 18 16 13 10 7 6 7 9 12 15 17 1220cm 19 19 17 15 11 9 8 9 11 13 15 17 1430cm 19 19 18 15 12 10 9 9 11 13 15 18 14100cm 17 18 18 16 14 13 11 11 11 13 14 16 14
Frosts
Frost is a local phenomenon and its frequency of occurrence can vary widely over small areas. Areas most likely to be subjected to frost are flat areas, where air is not able to drain away on calm nights, and inland valleys, where cold air is likely to drift from higher areas. In general, frosts are infrequent close to the moderating effects of the sea.
There are two types of frost recorded. Air frosts occur when air temperature measured in a screen by a thermometer 1.3 m above the ground falls below 0°C. Ground frosts are recorded when the air temperature 2.5 cm above a clipped grass surface falls to -1.0°C or lower. Both types of frost are common in the Gisborne district in the cooler months. Table 13 lists for selected sites the mean daily grass minimum and extreme grass minimum temperatures and the average number of days each month with ground and air frosts. Manutuke is influenced by katabatic drainage resulting from its location at the base of the surrounding hills, and therefore records the greatest number of frosts in the district. Data on air temperatures (mean daily, monthly minima, and extreme minima) can be obtained from Figure 15.
0
5
10
15
20
25
Jan Feb Mar Apr May Jun Jul Aug Sep Oct Nov Dec
Tem
pera
ture
(°C)
Month
Air temp 10cm 20cm 30cm 100cm

26
Table 13. Occurrences of frosts and grass minimum temperatures in Gisborne district. Insufficient (<10 years) daily temperature data to obtain a record grass minimum temperature for Waerenga O Kuri.
Sunshine and solar radiation
Sunshine
Gisborne district is among New Zealand’s sunniest regions, with most parts of the district receiving at least 2200 bright sunshine hours per year. Gisborne city records an average of 2219 bright sunshine hours per year. There is a west to east gradient of sunshine hours in the district, with western areas receiving between 1800 and 2100 hours of bright sunshine per year, compared to eastern areas receiving at least 2200 hours (Figure 18). Figure 19 shows the monthly mean, maximum, and minimum recorded bright sunshine hours for selected sites in the Gisborne district.
Location Jan Feb Mar Apr May Jun Jul Aug Sep Oct Nov Dec AnnRuatoria 2 a 11.0 11.2 9.9 7.3 4.3 2.3 1.6 2.6 3.6 5.6 7.6 9.8 6.4
b 1.7 1.0 -0.6 -3.4 -5.9 -8.9 -8.6 -7.4 -5.7 -4.6 -1.8 -1.9c 0.0 0.0 0.0 0.7 4.0 8.2 10.0 7.3 3.9 1.0 0.2 0.0 35.2d 0.0 0.0 0.0 0.0 0.5 3.0 3.4 1.8 0.4 0.0 0.0 0.0 9.2
Gisborne Aero a 10.5 10.8 9.1 6.7 4.2 2.3 1.6 2.2 3.3 5.1 7.1 9.2 6.0b 1.5 1.0 -1.4 -2.2 -7.0 -6.9 -8.9 -6.4 -4.6 -2.7 -2.5 -0.9c 0.0 0.0 0.1 0.9 3.7 8.1 9.6 8.4 5.1 2.2 0.7 0.1 39.0d 0.0 0.0 0.0 0.0 0.3 2.0 2.3 1.2 0.2 0.1 0.0 0.0 6.1
Gisborne Manutuke a 10.2 10.4 9.0 6.2 3.4 1.4 0.8 1.8 3.1 4.9 6.8 9.0 5.6b 0.2 0.5 -2.1 -4.0 -8.2 -7.9 -7.1 -5.1 -5.1 -4.0 -2.2 -1.5c 0.0 0.0 0.2 1.3 5.7 10.7 11.7 9.4 4.7 1.7 0.5 0.1 46.0d 0.0 0.0 0.0 0.1 0.8 3.7 4.1 1.8 0.5 0.1 0.0 0.0 11.2
Waerenga O Kuri 2 a 9.3 9.7 8.0 5.9 3.6 1.5 0.9 1.7 2.7 4.5 6.1 8.0 5.2b - - - - - - - - - - - -c 0.1 0.0 0.3 1.0 3.9 8.3 9.8 8.1 4.8 1.9 0.9 0.3 39.3d 0.0 0.0 0.0 0.0 0.2 1.5 2.0 1.0 0.3 0.1 0.0 0.0 5.1
a: mean daily grass minimum (°C)b: lowest grass minimum recorded (°C)c: average number of ground frosts per monthd: average number of air frosts per month
Figure 18. Median annual sunshine hours for Gisborne district, 1981–2010.
27
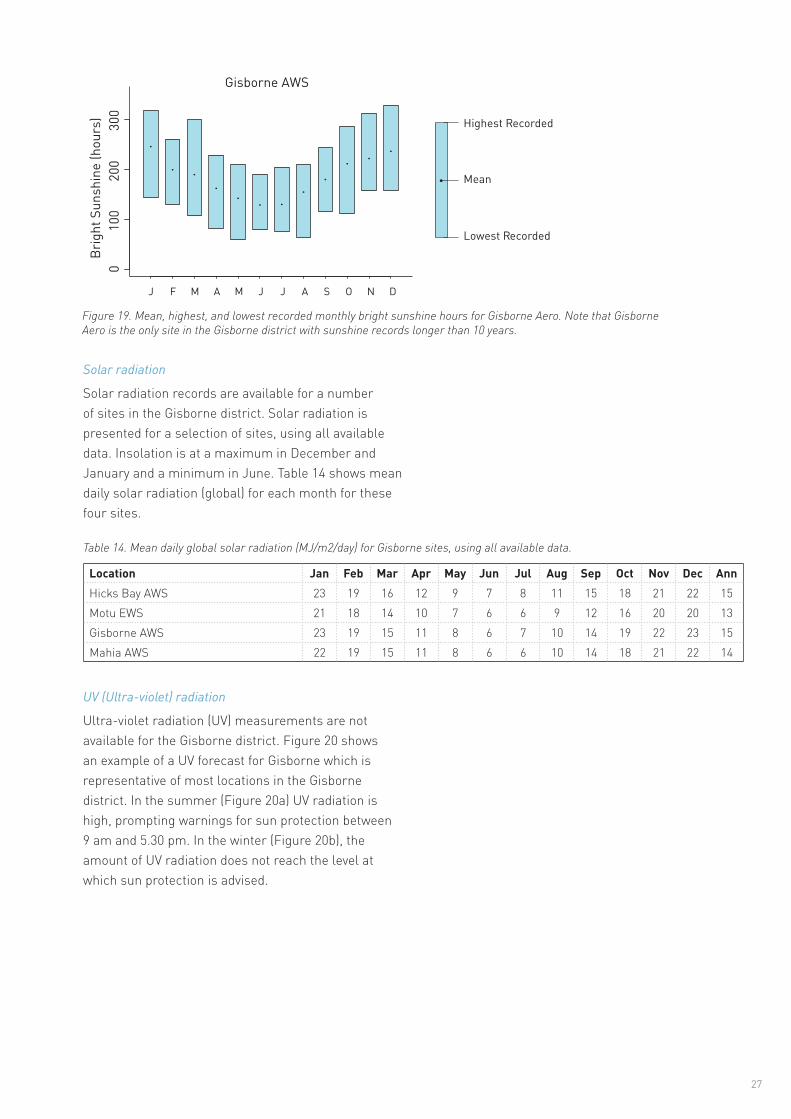
Figure 19. Mean, highest, and lowest recorded monthly bright sunshine hours for Gisborne Aero. Note that Gisborne Aero is the only site in the Gisborne district with sunshine records longer than 10 years.
Table 14. Mean daily global solar radiation (MJ/m2/day) for Gisborne sites, using all available data.
Highest Recorded
Mean
Lowest Recorded
Solar radiation
Solar radiation records are available for a number of sites in the Gisborne district. Solar radiation is presented for a selection of sites, using all available data. Insolation is at a maximum in December and January and a minimum in June. Table 14 shows mean daily solar radiation (global) for each month for these four sites.
Location Jan Feb Mar Apr May Jun Jul Aug Sep Oct Nov Dec AnnHicks Bay AWS 23 19 16 12 9 7 8 11 15 18 21 22 15Motu EWS 21 18 14 10 7 6 6 9 12 16 20 20 13Gisborne AWS 23 19 15 11 8 6 7 10 14 19 22 23 15Mahia AWS 22 19 15 11 8 6 6 10 14 18 21 22 14
UV (Ultra-violet) radiation
Ultra-violet radiation (UV) measurements are not available for the Gisborne district. Figure 20 shows an example of a UV forecast for Gisborne which is representative of most locations in the Gisborne district. In the summer (Figure 20a) UV radiation is high, prompting warnings for sun protection between 9 am and 5.30 pm. In the winter (Figure 20b), the amount of UV radiation does not reach the level at which sun protection is advised.
Gisborne AWSBr
ight
Sun
shin
e (h
ours
)0
100
200
300
J F M A M J J A S O DN

28
Table 16. Average number of days each year with thunder, fog, and hail, from all available data.
Figure 20. UV Index forecast for Gisborne, January (a) and July (b). Source: https://www.niwa.co.nz/our-services/online-services/uv-and-ozone.
Fog
The most common type of fog in the Gisborne district is radiation fog, formed when the air cools to its dew-point on clear nights, allowing the water vapour in the air to condense. Coastal areas occasionally experience sea fogs, and extensive low cloud, with very moist onshore flows. Another type of fog sometimes seen in the district is ‘steaming fog’. This forms predominantly on cold nights when the water vapour evaporating off lakes and rivers condenses as it rises into the cool air, giving the impression of steam rising off the water surface. Fogs also sometimes form when the humidity of the air near the ground has been raised by falling rain.
The frequency of fog in the Gisborne district varies considerably (Table 15). Gisborne Airport experiences many more fogs than other areas (36 per year on average, compared with 2 per year for other locations in Table 15). Although fog can occur at any time of the year it is recorded most frequently between March and August.
Fog Thunder HailEast Cape 5 2 0.5
Ruatoria 2 4 2 0.5
Gisborne Aero 8 36 3Gisborne Manutuke 6 2 0.5
29
Severe convective storms
Thunderstorms and hail
While thunderstorms and hail may occur in the Gisborne district in any month, thunderstorms are most frequent in the summer and hail is more likely in spring. Average annual frequencies of thunder and hail for selected stations are given in Table 15. Thunder is recorded most frequently in Gisborne (8 days per year) and least frequently in Ruatoria (4 days per year). Hail is also observed in Gisborne most often (3 days per year), whereas other sites record only one day every two years with hail, on average. At some of the stations, it is likely that not all thunderstorms and hail events are detected. The heavy rain, lightning, hail, wind squalls, and rare tornadoes which can occur with thunderstorms will sometimes cause severe local flooding, disruption of electrical and electronic equipment, and damage to trees, crops, and buildings.
Tornadoes
Tornadoes are rapidly rotating columns of air extending from the base of a cumulonimbus cloud, and have in New Zealand a damage path typically 10–20 m wide and 1–5 km long. The small size (compared to tornadoes in the USA), their short lifetimes, and the sparse population of much of New Zealand must result in an unknown number of tornadoes not being reported.
Tornadoes are rare in the Gisborne district, but the steep topography of the hill country can amplify air currents and localised tornadoes can occasionally form, but they are usually very short-lasting. Only one damage-causing tornado was reported in the Gisborne district between 1981 and 2012, on 13 September 2011. The tornado caused damage to a farm about 35 km inland from Gisborne, felling trees and ripping roofing iron off buildings.
Snow
Snow is rare in most parts of the Gisborne district and is unknown near the coast. Above an altitude of 600 m a few falls of snow may be expected in any winter and in some areas moderate or even heavy falls have occurred at times.
Sea swell and wavesThe area of the Pacific Ocean which is bounded by the Gisborne district is sheltered from the prevailing west to southwest swells of its latitude zone by the land
mass of the North Island. Consequently high waves are less frequent than in corresponding western areas. Similarly it is protected from the cool ocean currents induced by the prevailing westerly winds.
Sea and swell wave characteristics in the Gisborne district are determined by the area’s exposure to the prevailing winds and by the sheltering provided by the North Island. Thus waves from the southerly quarter are the most frequent (due to the district’s exposure to the south). The prevailing easterly flow over the Pacific Ocean to the north of New Zealand produces a persistent easterly swell in the latitude of northern New Zealand, especially during the summer and autumn when the belt of southeasterly trade winds tends to lie further south than in other seasons. Of all swells observed, the frequency of those from one to two metres is 65%, while for those greater than two metres is 20% (Gorman et al., 2003).
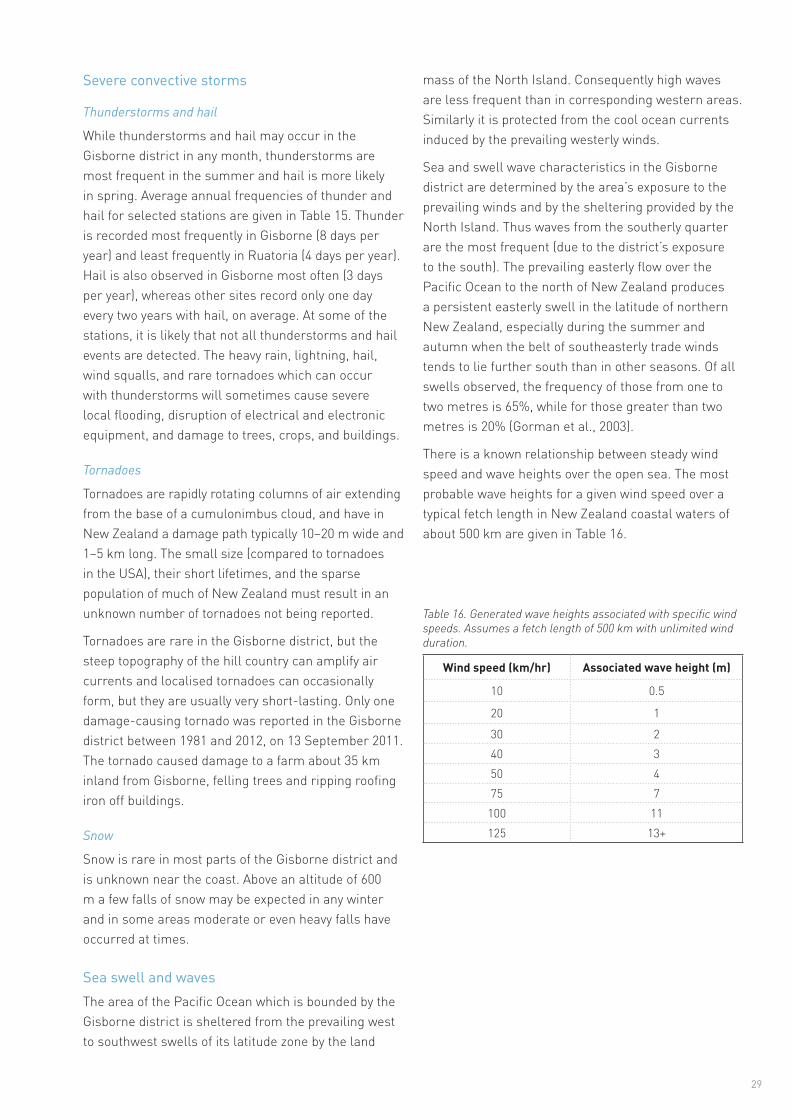
There is a known relationship between steady wind speed and wave heights over the open sea. The most probable wave heights for a given wind speed over a typical fetch length in New Zealand coastal waters of about 500 km are given in Table 16.
Wind speed (km/hr) Associated wave height (m)
10 0.5
20 1
30 240 350 475 7
100 11125 13+
Table 16. Generated wave heights associated with specific wind speeds. Assumes a fetch length of 500 km with unlimited wind duration.

30
Phot
o: ©
myc
hilly
bin.
co.n
z/M
ark
Ewin
gton

31
DERIVED CLIMATOLOGICAL PARAMETERSApart from elements such as temperature and rainfall which can be measured directly, it has been found that parameters computed from several elements have some important uses especially in industry. Parameters which define the overall suitability of the climate for agriculture, horticulture, architectural and structural designs, and contracting, etc., are vapour pressure, relative humidity, evapotranspiration (leading to soil water balance), degree-days (thermal time), and rainfall extremes. Some of these and their uses are discussed in the following paragraphs. Short-term high intensity rainfalls have been covered above.
Vapour pressure and relative humidityThe water vapour content of air can be expressed in several ways - the most commonly used being vapour pressure and relative humidity. Vapour pressure is the part of the total air pressure which results from the presence of water vapour. Relative humidity expresses the actual vapour pressure as a percentage of the saturation vapour pressure at the ambient temperature. Relative humidity is therefore normally highest in the morning at the time of the minimum temperature and lowest during the afternoon when temperatures are at their warmest.
Vapour pressure can be important in determining the physiological response of organisms to the environment (very dry air, especially if there is a pre-existing soil moisture deficit, can cause or increase wilting in plants). Average 9 am vapour pressures for several stations are given in Table 17.
Table 17. Mean monthly/annual 9 am vapour pressure (hPa) for selected Gisborne district sites, from all available data.
Location Jan Feb Mar Apr May Jun Jul Aug Sep Oct Nov Dec AnnHicks Bay AWS 16.7 17.4 16.0 14.5 13.0 11.0 10.6 10.6 11.7 12.5 13.4 15.8 13.6Ruatoria 2 16.5 16.9 15.8 14.1 11.5 10.3 9.6 10.3 11.1 12.3 13.3 15.0 13.1Gisborne Aero 15.6 16.3 15.4 13.5 11.5 9.8 9.4 9.9 10.8 11.7 12.7 14.4 12.6Mahia AWS 15.6 16.2 14.9 13.7 12.0 10.2 9.9 9.8 10.5 11.2 12.2 14.5 12.6
Relative humidity is variable throughout the year, but there is a peak in winter and a low point in spring, as shown in Table 18. Gisborne and Ruatoria record the highest average relative humidities in the district, but also some of the lowest.
Evapotranspiration and soil water balanceEvapotranspiration is the process where water held in the soil is gradually released to the atmosphere through a combination of direct evaporation and transpiration from plants. A water balance can be calculated by using daily rainfalls and by assuming that the soil can hold a fixed amount of water with actual evapotranspiration continuing at the maximum rate until total moisture depletion of the soil occurs. The calculation of water balance begins after a long dry spell when it is known that all available soil moisture is depleted or after a period of very heavy rainfall when the soil is completely saturated. Daily calculations are then made of moisture lost through evapotranspiration or replaced through precipitation. If the available soil water becomes insufficient to maintain evapotranspiration then a soil moisture deficit occurs and irrigation becomes necessary to maintain plant growth. Runoff occurs when the rainfall exceeds the soil moisture capacity (assumed to be 150 mm for most New Zealand soils). The Gisborne district is comparatively well served by frequent rainfalls in winter, but due to high evapotranspiration and a minimum of rainfall, soil moisture levels in summer are frequently such that irrigation or watering is necessary.
Mean monthly and annual water balance values are given in Table 19, for a number of sites in the Gisborne district. It can be seen from this table that coastal parts
Table 18. Mean monthly/annual 9 am relative humidity (%) for selected Gisborne district sites, from all available data.
Location Jan Feb Mar Apr May Jun Jul Aug Sep Oct Nov Dec AnnHicks Bay AWS 76 78 77 76 78 77 78 75 75 77 76 79 77Ruatoria 2 70 77 75 78 80 85 83 81 74 71 70 70 76Gisborne Aero 70 76 78 80 82 83 84 81 74 71 68 69 76Mahia AWS 75 79 79 80 80 79 81 78 74 74 74 76 77

32
Table 19. Mean monthly/annual water balance summary for a soil moisture capacity of 150 mm, from all available data.
Location Jan Feb Mar Apr May Jun Jul Aug Sep Oct Nov Dec AnnHicks Bay AWS DE 85 57 17 13 5 0 0 0 0 5 44 58 284
ND 16 12 4 5 3 0 0 0 0 1 10 12 64RO 4 14 25 23 64 112 112 71 21 19 2 11 478NR 0 1 1 1 4 8 9 7 3 2 0 0 36
Tolaga Bay Mangatu DE 81 50 24 7 1 0 0 0 1 14 60 78 317ND 16 12 7 3 1 0 0 0 0 4 13 15 71
RO 8 18 43 62 78 106 143 122 55 29 15 8 688NR 0 1 2 3 5 7 9 8 4 2 1 0 42
Motu Waiwhero DE 19 19 4 0 0 0 0 0 0 0 2 8 52ND 5 6 2 0 0 0 0 0 0 0 0 2 14RO 33 23 49 85 166 220 211 160 133 138 71 62 1352NR 1 1 2 5 11 13 14 12 8 8 4 3 83
Gisborne AWS DE 92 57 35 8 3 1 0 0 2 34 70 93 393ND 18 13 10 4 2 1 0 0 1 9 15 18 92RO 0 3 12 25 39 56 101 39 17 14 1 0 306NR 0 0 1 2 4 6 9 5 1 1 0 0 29
DE is the average amount of soil moisture deficit in mmND is the average number of days per month on which a soil moisture deficit occursRO is the average amount of runoff in mmNR is the average number of days per month on which runoff occurs
of the district have about 46 days between November and February when there is insufficient soil moisture to maintain plant growth without irrigation, but this is only 13 days in inland areas (Motu). There is adequate moisture available to maintain plant growth between June and September, except for at Gisborne where only July and August have no days of soil moisture deficit, on average. Figure 21 shows district-wide variability in days of soil moisture deficit per year.
Figure 21. Gisborne district median annual days of soil moisture deficit, 1981–2010.

33
Potential evapotranspiration (PET) has been calculated for Hicks Bay, Gisborne, and Mahia, using the Penman method (Penman, 1948). The monthly mean, minimum, and maximum PET values are listed in Table 20.
Gisborne experienced a severe drought in the summer and early autumn of 2012–2013. Between December 2012 and March 2013, only 35% of normal rainfall for that period was recorded in Gisborne (98 mm), and 50% of normal rainfall for December to March was recorded in Motu (287 mm). Motu experienced its driest summer on record (records began in 1990) of 245 mm of rain, which was 55% of normal summer rainfall. In Gisborne city, a sprinkler ban was in force, and there was a total fire ban throughout the district. Figure 22 shows the soil moisture deficits reached at Gisborne over the drought period, compared to normal
soil moisture deficit conditions for the same time of year (soil moisture deficit from August to May averaged from 1981–2010). Much of the district was suffering from extreme soil moisture deficits (more than 130 mm of deficit), which meant that pasture growth had ceased (Figure 23). The dry conditions meant that farmers had to dry off cattle early and sell off stock. The stock feed situation remained very low in drought-stricken areas, and the price of feed significantly increased. At the time of writing (June 2013), economic costs due to the 2012–13 drought across the North Island and Westland were estimated at a minimum of $1.6 billion.
Table 20. Penman calculated maximum, mean, and minimum monthly potential evapotranspiration (mm), as well as total mean annual PET, from all available data.
Location Jan Feb Mar Apr May Jun Jul Aug Sep Oct Nov Dec AnnHicks Bay AWS Max 190 149 126 91 75 52 61 74 101 137 155 166
Mean 159 129 114 78 56 44 50 64 85 115 133 143 1170Min 135 99 102 58 45 33 42 45 70 91 112 117
Gisborne Aero Max 189 147 130 80 54 36 40 61 92 152 164 184Mean 154 119 94 58 36 26 29 42 68 103 133 151 1011Min 110 99 79 43 26 16 20 27 55 80 102 112
Mahia AWS Max 184 154 125 74 60 45 48 63 95 147 166 183Mean 151 117 98 60 43 34 36 52 77 112 132 144 1056Min 91 87 61 47 31 24 23 40 63 96 85 101
Figure 22. Soil moisture deficit at Gisborne AWS during the 2012–2013 drought, compared with normal soil moisture deficit conditions for the same time of year at Gisborne AWS (1981–2010).
0
20
40
60
80
100
120
140
160
2012-13 Gisborne AWS SMD (mm) Average Gisborne AWS SMD (mm)

Figure 23. Soil moisture deficit as at 1 March 2013 (right hand map). Areas of extreme soil moisture deficit (more than 130 mm of soil moisture deficit) are shown in red, and areas of significant soil moisture deficit (more than 110 mm of soil moisture deficit) are shown in dark orange. Normal soil moisture deficit conditions for the time of year are given in the left hand figure, and the middle figure shows soil moisture deficit conditions as at 1 March 2012.
Degree-day totalsThe departure of mean daily temperature above a base temperature which has been found to be critical to the growth or development of a particular plant is a measure of the plant’s development on that day. The sum of these departures then relates to the maturity or harvestable state of the crop. Thus, as the plant grows, updated estimates of harvest time can be made. These estimates have been found to be very valuable for a variety of crops with different
base temperatures. Degree-day totals indicate the overall effects of temperature for a specified period, and can be applied to agricultural and horticultural production. Growing degree-days express the sum of daily temperatures above a selected base temperature that represent a threshold of plant growth. Table 21 lists the monthly totals of growing degree-day totals above base temperatures of 5°C and 10°C for sites in the Gisborne district.
Table 21. Average growing degree-day totals above base 5°C and 10°C for selected Gisborne district sites.
Location Jan Feb Mar Apr May Jun Jul Aug Sep Oct Nov Dec AnnHicks Bay AWS 5°C 419 401 400 331 282 208 197 198 228 272 302 375 3612
10°C 264 259 245 181 128 65 50 50 79 117 152 220 1811
Ruatoria 2 5°C 445 399 398 308 231 160 143 168 215 271 329 398 346410°C 290 257 243 158 79 37 22 34 71 118 179 243 1731
Gisborne AWS 5°C 441 403 386 299 239 162 152 165 211 278 316 404 345510°C 286 261 231 149 88 34 26 34 69 124 166 249 1717
Mahia AWS 5°C 408 379 371 298 250 174 160 167 205 256 289 365 332310°C 253 238 216 148 97 38 25 30 61 103 139 210 1559

35
Cooling and heating degree days are measurements that reflect the amount of energy that is required to cool or heat buildings to a comfortable base temperature, which in this case is 18°C. Table 22 shows that the number of cooling degree days reach a peak in summer in Gisborne district, where there is a higher demand for energy to cool building interiors
Table 22. Average cooling (CDD) and heating (HDD) degree-day totals with base 18°C for selected Bay of Plenty sites.
Location Jan Feb Mar Apr May Jun Jul Aug Sep Oct Nov Dec AnnHicks Bay AWS CDD 31 40 21 5 1 0 0 0 0 0 0 11 109
HDD 15 7 24 64 121 182 206 205 162 131 88 39 1246
Ruatoria 2 CDD 57 44 27 5 1 0 0 0 0 1 10 29 175HDD 15 13 33 87 173 230 260 236 175 132 71 35 1460
Gisborne AWS CDD 59 50 24 6 1 0 0 0 0 2 9 38 189HDD 21 15 40 97 165 228 252 238 179 128 83 37 1483
Mahia AWS CDD 33 31 14 3 0 0 0 0 0 1 3 16 101HDD 28 19 45 95 154 216 243 236 185 148 105 54 1527
Figure 24. Median annual heating degree days for Gisborne district, 1981–2010.
to 18°C. Conversely, heating degree days reach a peak in winter, where the demand for energy to heat buildings to 18°C is highest. Figure 24 shows district-wide variability in the number of heating degree days per year. The number of heating degree days tends to be lower in low elevation coastal areas, compared with areas further inland and at higher elevations.

36Phot
o: ©
myc
hilly
bin.
co.n
z/H
ugh
Davie
s
37

38
ACKNOWLEDGEMENTSThe following people from NIWA are acknowledged for their assistance in preparing this publication: Dr Andrew Tait, Dr Elizabeth Somervell, Dr Michael Uddstrom, Dr Richard Gorman, Hisako Shiona, and Erika Mackay.
REFERENCESNIWA databases used:
The National Climate Database cliflo.niwa.co.nz
HIRDS (High Intensity Rainfall Design System) hirds.niwa.co.nz
New Zealand Historic Weather Events Catalogue hwe.niwa.co.nz
NIWA Sea Surface Temperature Database
References:
DIAMOND, H. J., LORREY, A. M., KNAPP, K. R. & LEVINSON, D. 2012. Development of an enhanced tropical cyclone track database for the southwest Pacific from 1840–2010. International Journal of Climatology, 32, 2240–2250.
GORMAN, R. M., BRYAN, K. R. & LAING, A. K. 2003. Wave hindcast for the New Zealand region: Nearshore validation and coastal wave climate. New Zealand Journal of Marine and Freshwater Research, 37, 567–588.
PENMAN, H. L. 1948. Natural evaporation from open water, bare soil, and grass. Proceedings of the Royal Society of London A, 193, 120–145.
SINCLAIR, M. R. 1993. A diagnostic study of the extratropical precipitation resulting from Tropical Cyclone Bola. Monthly Weather Review, 121, 2690–2707.
UDDSTROM, M. J. & OIEN, N. A. 1999. On the use of high resolution satellite data to describe the spatial and temporal variability of sea surface temperatures in the New Zealand Region. Journal of Geophysical Research (Oceans), 104, 20729–20751.

