the clean energy manufacturing job market and its role in the
TRANSCRIPT

THE CLEAN ENERGY MANUFACTURING JOB MARKET AND ITS ROLE IN THE UNITED STATES ECONOMY
by
Audrey Plaskacz Bachelor of Science, Dalhousie University, 2007
PROJECT SUBMITTED IN PARTIAL FULFILLMENT OF THE REQUIREMENTS FOR THE DEGREE OF
MASTER OF BUSINESS ADMINISTRATION
In the Faculty
of Business Administration
© Audrey Plaskacz 2009
SIMON FRASER UNIVERSITY
Summer 2009
All rights reserved. However, in accordance with the Copyright Act of Canada, this work may be reproduced, without authorization, under the conditions for Fair Dealing. Therefore, limited
reproduction of this work for the purposes of private study, research, criticism, review and news reporting is likely to be in accordance with the law, particularly if cited appropriately.
ii
Approval
Name: Audrey Plaskacz
Degree: Master of Business Administration
Title of Project: The Clean Energy Manufacturing Job Market and its Role in the United States Economy
Supervisory Committee:
_______________________________________
Dr. Andrew von Nordenflycht Senior Supervisor Assistant Professor
Faculty of Business Administration
_______________________________________
Dr. Neil Abramson Second Reader Associate Professor
Faculty of Business Administration
Date Approved: _______________________________________

iii
Abstract
This paper provides an overview of green jobs in the United States, with a focus on
synthesizing various estimates of the current and future number of green jobs, and relating these
to estimates of the future number of clean energy manufacturing jobs. In doing so, it answers the
following two research questions: “can lost manufacturing jobs become clean energy jobs?” and
“can existing manufacturing jobs be saved from disappearing by transforming into clean energy
jobs?” By combining current federal policies and expected growth numbers for the wind and
solar energy industries, this paper presents a conservative estimate of approximately 235,000
clean energy manufacturing jobs generated in the United States by the year 2020. The most
promising option for America’s manufacturing workforce is a transition towards work in clean
energy industries by redefining existing jobs, a move that requires initiative from both the public
and private sector.
Keywords: Clean energy; manufacturing, renewable energy; employment
iv
Table of Contents
APPROVAL ....................................................................................................................................................................... II ABSTRACT.......................................................................................................................................................................III TABLE OF CONTENTS ................................................................................................................................................ IV LIST OF FIGURES .........................................................................................................................................................VI LIST OF TABLES ......................................................................................................................................................... VII LIST OF ACRONYMS ................................................................................................................................................VIII 1. INTRODUCTION.......................................................................................................................................................1 2. UNITED STATES ECONOMY................................................................................................................................4
2.1. LABOUR STATISTICS BY INDUSTRY.......................................................................................................................4 2.2. LABOUR FORCE......................................................................................................................................................4
2.2.1. Unemployment Rates ....................................................................................................................................4 2.2.2. Manufacturing Workforce ............................................................................................................................6
2.3. CONSUMPTION OF FOSSIL FUELS ..........................................................................................................................7 3. CLEAN ENERGY ECONOMY ............................................................................................................................ 10
3.1. DEFINITION ......................................................................................................................................................... 10 3.2. GOALS ................................................................................................................................................................. 12 3.3. CLEAN ENERGY GENERATION SECTORS............................................................................................................ 13
3.3.1. Wind ............................................................................................................................................................ 13 3.3.2. Solar............................................................................................................................................................ 14
3.4. SUMMARY ........................................................................................................................................................... 16 4. CLEAN ENERGY JOBS IN THE UNITED STATES ...................................................................................... 18
4.1. DEFINITION ......................................................................................................................................................... 20 4.2. GREEN JOB CREATION ........................................................................................................................................ 21 4.3. CURRENT CLEAN ENERGY JOB FIGURES ........................................................................................................... 23 4.4. FUTURE CLEAN ENERGY JOB FIGURES.............................................................................................................. 28 4.5. CLEAN ENERGY MANUFACTURING JOBS........................................................................................................... 30
4.5.1. Creating Clean Energy Manufacturing Jobs ........................................................................................... 31 4.5.2. Infinia Corp.: Transition towards Green-Collar Jobs ............................................................................ 31
4.6. CLEAN ENERGY GENERATION MANUFACTURING JOBS ..................................................................................... 32 4.6.1. Wind Energy Manufacturing Jobs ............................................................................................................ 33 4.6.2. Solar Energy Manufacturing Jobs ............................................................................................................ 38 4.6.3. Summary ..................................................................................................................................................... 41
4.7. CRITICISM OF CLEAN ENERGY JOBS .................................................................................................................. 42 4.7.1. High Cost.................................................................................................................................................... 42 4.7.1. Job Destruction .......................................................................................................................................... 44
5. CLEAN ENERGY INVESTMENT IN THE UNITED STATES..................................................................... 48 5.1. PUBLIC SECTOR................................................................................................................................................... 48
5.1.1. Green Jobs Act (2007) ............................................................................................................................... 49 5.1.2. American Recovery and Reinvestment Act (February 2009) .................................................................. 50

v
5.1.3. American Clean Energy and Security Act (June 2009) ........................................................................... 51 5.1.3.1. Cap-and-Trade Program ........................................................................................................................................52 5.1.3.2. Renewable Energy Electricity Standard...............................................................................................................53
5.2. PRIVATE SECTOR ................................................................................................................................................ 53 5.2.1. Venture Capital .......................................................................................................................................... 53
6. IMPLICATIONS FOR MANUFACTURING WORKFORCE AND CONCLUSIONS.............................. 56 7. RECOMMENDATIONS FOR KEY STAKEHOLDERS ................................................................................. 61
7.1. GOVERNMENT ..................................................................................................................................................... 61 7.2. BUSINESSES......................................................................................................................................................... 61
7.2.1. Take Advantage of Public Clean Energy Investments ............................................................................. 62 7.2.2. Partner with Educational Institutions ...................................................................................................... 63 7.2.3. Innovate Based on Workforce Needs ........................................................................................................ 63
8. SUMMARY ............................................................................................................................................................... 65 APPENDICES................................................................................................................................................................... 66
APPENDIX A ................................................................................................................................................................... 66 APPENDIX B.................................................................................................................................................................... 69
REFERENCES ................................................................................................................................................................. 71

vi
List of Figures
Figure 1: Unemployment Rates in the United States, 1976-2009 ................................................................... 5 Figure 2: Energy Consumption by Sector, 2008............................................................................................... 9 Figure 3: Industrial Sector Energy Consumption, 1970-2008 ......................................................................... 9 Figure 4: Solar Energy Capacity Additions and Annual Growth Rates ........................................................ 16 Figure 5: Illustration of Clean Energy Jobs Studies and Estimation of Clean Energy Manufacturing Jobs
................................................................................................................................................................... 20 Figure 6: Jobs in the Clean Energy Economy by Category, 2007................................................................. 26 Figure 7: Growth of Clean Energy Jobs by Category, 1998-2007 ................................................................ 26 Figure 8: Renewable Energy Jobs, 2007 ......................................................................................................... 34 Figure 9: Change in Renewable Energy Jobs, 1998-2007 ............................................................................. 34 Figure 10: Solar Electricity Capacity of Leading Countries Worldwide, 2008............................................ 39 Figure 11: PV Roadmap for Increased Solar Electricity Capacity, 2008-2050............................................ 41 Figure 12: Mining Employment in Selected Countries Compared with Average Fossil Fuel Consumption,
1996-2006 ................................................................................................................................................ 45 Figure 13: United States Oil and Gas Extraction Employment, 1999-2008 ................................................. 45 Figure 14: Areas of VC Investment Within the Clean Energy Economy, 2006-2008 ................................. 55 Figure 15: Estimated Impact of a 20% RES by 2020 on Manufacturing Jobs in the Wind and Solar Energy
Industries .................................................................................................................................................. 58 Figure 16: Electricity Mix of the United States’ Renewable Energy Supply, 2008 and 2020 .................... 59

vii
List of Tables
Table 1: Overview of the Five Clean Energy Economy Categories.............................................................. 12 Table 2: Employment Impacts of a 15 percent Renewable Portfolio Standard (RPS) by 2020 .................. 13 Table 3: Overview of Solar Technologies....................................................................................................... 15 Table 4: Employment Terminology to be used in the Current Paper ............................................................ 19 Table 5: Employment Impact of a Clean Energy Economy .......................................................................... 22 Table 6: Average Employment for Different Energy Technologies Normalized to the Amount of Energy
Produced................................................................................................................................................... 23 Table 7: Summary of Green Jobs Figures from Reviewed Studies, Based on Definition for Green Jobs .....
25 Table 8: Distribution of Direct and Indirect Jobs in the Clean Energy Economy, 2006.............................. 27 Table 9: Employment Impacts of Investing in the RE&EE Industry, 2030.................................................. 29 Table 10: Comparison of Estimated Job Creation through Different Energy Supply Mixes by 2020........ 35 Table 11: Top 20 States Benefiting from Wind Investment, with Job Loss Demographics........................ 37 Table 12: Anticipated Employment Effects of a PV Roadmap, 2015-2050 ................................................. 41 Table 13: Environmental Spending Through the ARRA ($Million)............................................................. 51
viii
List of Acronyms
ACESA American Clean Energy and Security Act
ARRA American Recovery and Reinvestment Act
ASES American Solar Energy Society
AWEA American Wind Energy Association
BLS Bureau of Labor Statistics
Btu British Thermal Unit
CCS Carbon Capture and Storage
CSP Concentrated Solar Power
DOE Department of Energy
DOL Department of Labor
EE Energy Efficiency
EIA Energy Information Administration
GreenMAP Green Manufacturing Action Plan
GWh Gigawatt Hour
ISS Infinia Solar System
kW Kilowatt
kWh Kilowatt Hour
MISI Management Information Systems, Inc.
MW Megawatt
ix
O&M Operations and Management
PERI Political Economy Research Institute
PV Photovoltaics
R&D Research and Development
RE Renewable Energy
RE&EE Renewable Energy and Energy Efficiency
REPP Renewable Energy Policy Project
RES Renewable Electricity Standard
RPS Renewable Portfolio Standard
SEIA Solar Energy Industries Association
UNEP United Nations Environment Programme
VC Venture Capital

1
1. Introduction
The United States’ labour force has historically been renowned for the strength of its
manufacturing sector, which over the years has produced record productivity rates (U.S. Bureau
of Labor Statistics: Major sector productivity and costs index, 2009). However, since
manufacturing employment peaked in June of 1979 at 19.5 million workers, job losses within
this sector have been on the rise. Thirty years after this peak, the manufacturing labour market is
the smallest it has been in nearly 70 years, with under 12 million registered workers. The
economic recession that hit in late 2007 has not helped this trend, resulting in a high
unemployment rate that currently sits at 9.5 percent and is accompanied by 6.5 million total job
losses across the country (Goodman, 2009). The U.S. Department of Labor suggests that the
largest declines have occurred in manufacturing, professional and business services, and
construction (U.S. Bureau of Labor Statistics: Employment situation summary, 2009).
As unemployment rates in the United States rise, concerns over the future of its natural
environment are also taking centre stage. Climate change is a pressing issue for consumers,
businesses and policy makers worldwide. The U.S. is facing a particularly large amount of
pressure to transition away from its pattern of heavy fossil fuel consumption, towards cleaner
sources of energy that still meet the needs of its energy-loving citizens. Facing the worst
economic crisis since the Great Depression and environmental degradation that threatens the
future of our planet, the United States is currently seeking solutions that address its labour issues,
environmental concerns and economic needs concurrently. One solution that has taken centre

2
stage with the Obama administration is investment in clean energy technologies and the green-
collar job market.
The American government hopes that the development of a clean energy economy will
increase employment rates and stimulate local economies. In recent years, it has committed a
significant amount of public money towards the development of clean energy technologies and
green job training, and is working towards introducing stricter renewable electricity standards
(RES). When rationalizing the investment in clean energy, the government points to the job
creation potential as one of its primary objectives. Under the clean energy economy, workers in
dying industry sectors such as manufacturing can be retrained in industries that have a smaller
environmental impact, thus transitioning from blue-collar jobs to green-collar jobs. Investing in a
clean energy economy not only provides direct job growth, but also stimulates the U.S. labour
force indirectly by offering businesses new and innovative energy supplies in a changing world
economy.
A number of technical reports and research papers examining the job-creation potential of
clean technologies, increased RES targets and investment in different areas of a clean energy
economy have been produced, primarily within the past five years. While very few of these
publications agree on the exact number of jobs that will be created from such a shift in public
policy and investment, most support the notion that clean energy jobs will secure long-term
employment for United States workers. An important consideration that has not been researched
extensively is how this shift will affect manufacturing workers in particular.
The current paper combines the most recent data on employment figures, domestic
energy consumption rates, clean energy jobs, renewable energy production capacity and clean
energy investments by both the public and private sectors to answer the following two research

3
questions: “can lost manufacturing jobs become clean energy jobs, and can existing
manufacturing jobs be saved from disappearing by transforming into clean energy jobs?” Based
on the answers to these questions, the current paper also provides recommendations on how
businesses in the private sector might take advantage of the growing clean energy labour market.

4
2. United States Economy
2.1. Labour Statistics by Industry
The United States Bureau of Labor Statistics (BLS) segments its industries based on
whether they are goods-producing or service-producing. The country’s Goods-Producing
Industries include the supersectors of Natural Resources and Mining, Construction and
Manufacturing, while its Service-Producing Industries include such supersectors as Financial
Activities, Real Estate, and Healthcare. In June 2009, Goods-Producing Industries employed
nearly 19 million workers, while Service-Producing Industries employed over 112 million
workers (U.S. Bureau of Labor Statistics: Employment by major industry sector, 2009).
Productivity is a defining characteristic of the American manufacturing workforce.
Workers within this sector have improved productivity, which is the amount of goods produced
within a given period of time, almost every year since the Bureau of Labor Statistics began
tracking this variable in 1987. Despite high productivity rates, wages remain below the national
average. In May 2008, the most recent period for labour statistics, employees working in
manufacturing earned a mean annual income of $32,320, while the entire American labour force
had a mean annual salary of $42,270 (U.S. Bureau of Labor Statistics: Employment by major
industry sector, 2009).
2.2. Labour Force
2.2.1. Unemployment Rates
In June 2009, approximately 9.5 percent of the United States labour force was
unemployed (U.S. Bureau of Labor Statistics: Employment situation summary, 2009). This
figure marks the highest unemployment rate seen in the U.S. since 1983 (see Figure 1:

5
Unemployment Rates in the United States, 1976-2009). More than 7.2 million Americans have
lost their jobs since the start of the recession in December 2007, bumping the unemployment rate
up by 4.6 percentage points within the same period (U.S. Bureau of Labor Statistics:
Employment situation summary, 2009).
Figure 1: Unemployment Rates in the United States, 1976-2009
0
2
4
6
8
10
12
Jun
-76
Jun
-77
Jun
-78
Jun
-79
Jun
-80
Jun
-81
Jun
-82
Jun
-83
Jun
-84
Jun
-85
Jun
-86
Jun
-87
Jun
-88
Jun
-89
Jun
-90
Jun
-91
Jun
-92
Jun
-93
Jun
-94
Jun
-95
Jun
-96
Jun
-97
Jun
-98
Jun
-99
Jun
-00
Jun
-01
Jun
-02
Jun
-03
Jun
-04
Jun
-05
Jun
-06
Jun
-07
Jun
-08
Jun
-09
Year
Un
emp
loy
men
t R
ate
(%)
Source: Bureau of Labor Statistics
Many of the country’s major industries account for the majority of job losses, with
particularly steep declines in the manufacturing sector (U.S. Bureau of Labor Statistics:
Employment situation summary, 2009). Since the onset of the recession, a total of 1.9 million
manufacturing jobs have been lost, placing the manufacturing labour force at an estimated 11.9
million workers, its lowest since 1941 (U.S. Bureau of Labor Statistics: Employment by major
industry sector, 2009). The rise in unemployment has been linked to the concurrent rise in labour
productivity, a trend that emerged during the Industrial Revolution of the late 18th century, when
businesses focused on minimizing labour costs and exploiting natural resources. Research from

6
2005 states that since 1990, five out of every six U.S. manufacturing job losses had been due to
productivity growth (Ward, 2006). Unfortunately, improvements in worker productivity have
resulted in fewer people in the workforce and an increase in the amount of roles outsourced to
overseas labour markets. The country’s manufacturing sector, for example, tripled its labour
productivity between 1950 and 2000, but also accounts for one of the highest job loss rates
nationwide (United Nations Environment Programme, 2008). In order to reverse rising
unemployment numbers, the United States needs to discover a way to use the high productivity
of its labour force to its advantage. Many believe that the best way to do this is by investing in
new industries that are labour-intensive, such as clean energy technologies.
2.2.2. Manufacturing Workforce
Manufacturing employment in the United States has been on the decline for years.
Between 1996 and 2006, jobs declined at an average rate of 1.9 percent annually, with an overall
decline of 18 percent. During this same period, the entire American workforce grew by an
average annual rate of 1.1 percent, with an overall 12 percent increase (U.S. Bureau of Labor
Statistics: Employment by major industry sector, 2009). A total of 4.6 million manufacturing
jobs have been lost in the United States since 1999, with many of them being sent overseas
(Apollo Alliance, 2009; Pew Charitable Trusts, 2009). To make matters worse, in December
2007, the United States entered an economic recession that left the country’s manufacturing
sector particularly hard hit. Approximately one million manufacturing jobs have been lost since
the onset of the recession, including 200,000 in January 2009 alone (Apollo Alliance, 2009). The
majority of damage to the country’s manufacturing sector has occurred within “dirty” industries
(in terms of carbon emissions) such as auto manufacturing. The state of Michigan, for example,

7
has reached a 12.6 percent unemployment rate since the onset of the recession, primarily due to
the faltering of its Detroit-based auto manufacturers (Pew Charitable Trusts, 2009).
Both the private and public sectors agree that America needs to invest in long-term
solutions in order to effectively emerge from the immediate fiscal crisis and avoid similar pitfalls
in the future. One such solution is investment in clean energy technologies that will ensure long-
term job creation in some of the country’s most vulnerable sectors, such as manufacturing (Pew
Charitable Trusts, 2009).
2.3. Consumption of Fossil Fuels
The United States’ energy consumption is a key independent variable to consider when
gauging whether former or existing manufacturing jobs can survive in a clean energy economy.
Unless the country’s energy-consuming sectors begin to adopt clean sources of energy, new jobs
will not be created in these industries. It is no secret that the United States has an affinity for
fossil fuel consumption. The country’s utilization of oil, natural gas and coal has been on the rise
for years, and in 2006, it was ranked as the top consumer of both petroleum and natural gas
worldwide, and ranked second for its coal consumption (EarthTrends, 2009; EIA: United States
energy profile, 2009).
In discussions about the United States’ energy usage, its oil utilization is perhaps the
most widely criticized. The country’s domestic production of oil peaked in 1970, at which point
net imports of foreign oil accounted for 21 percent of its total consumption (Global Insight,
2008). Nowadays, the country ranks as the top importer of crude oil (International Energy
Agency, 2006), and the Energy Information Administration (EIA) estimates that so far in 2009,
an average of 56.9 percent of the country’s total crude oil consumption is supplied by its net
imports (EIA: Petroleum trade, 2009). Global Insight, the world’s largest economics organization
8
providing economic and financial data, predicts that this figure will rise to 65 percent by 2030,
unless the United States government decides to take steps to increase its energy independence.
The country’s growing consumption rates, combined with its increased reliance on
foreign sources of oil, have several implications for its future. First, high usage rates of
environmentally degrading fossil fuels raises the question of whether the country will deplete its
environment beyond repair. Second, dependence on foreign oil raises the issue of national
security, since many of America’s largest suppliers are countries renowned for political unrest
and widespread violence. And third, the trade deficit resulting from the country’s excessive
importing of oil threatens its future economic stability.
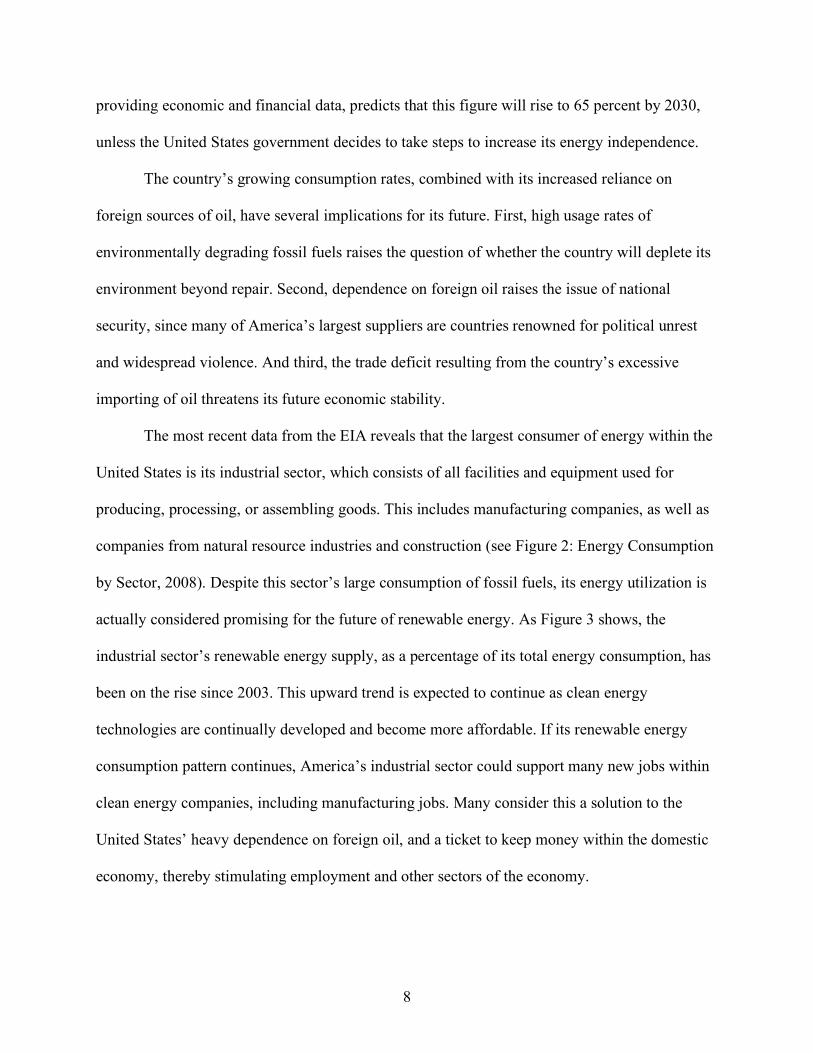
The most recent data from the EIA reveals that the largest consumer of energy within the
United States is its industrial sector, which consists of all facilities and equipment used for
producing, processing, or assembling goods. This includes manufacturing companies, as well as
companies from natural resource industries and construction (see Figure 2: Energy Consumption
by Sector, 2008). Despite this sector’s large consumption of fossil fuels, its energy utilization is
actually considered promising for the future of renewable energy. As Figure 3 shows, the
industrial sector’s renewable energy supply, as a percentage of its total energy consumption, has
been on the rise since 2003. This upward trend is expected to continue as clean energy
technologies are continually developed and become more affordable. If its renewable energy
consumption pattern continues, America’s industrial sector could support many new jobs within
clean energy companies, including manufacturing jobs. Many consider this a solution to the
United States’ heavy dependence on foreign oil, and a ticket to keep money within the domestic
economy, thereby stimulating employment and other sectors of the economy.

9
Figure 2: Energy Consumption by Sector, 2008
0
5
10
15
20
25
30
35
Res
iden
tial
Com
mer
cial
Indu
stria
l
Trans
porta
tion
Sector
Co
nsu
mp
tio
n
(Qu
adri
llio
n B
tu) Primary
Total
aThe EIA distinguishes between primary, secondary and tertiary forms of energy. When coal is converted to synthetic gas to produce electricity, for example, coal is primary energy, synthetic gas is secondary energy, and electricity is tertiary energy bBritish thermal units (Btu) describe the quantity of heat required to raise the temperature of 1 pound of liquid water by 1 degree Fahrenheit at the temperature at which water has its greatest density (approximately 39 degrees Fahrenheit). Source: EIA: Energy consumption by sector (2008)
Figure 3: Industrial Sector Energy Consumption, 1970-2008
0
5
10
15
20
25
1970
1973
1976
1979
1982
1985
1988
1991
1994
1997
2000
2003
2006
Co
nsu
mp
tio
n
(Qu
adri
llio
n B
tu)
0%
1%
2%
3%
4%
5%
6%
7%
8%
Fossil Fuels
Renewables as Percentage of TotalConsumption
Source: EIA: Energy consumption by sector (2008)
Con
sum
ptio
n (Q
uadr
illio
n B
tu)
10
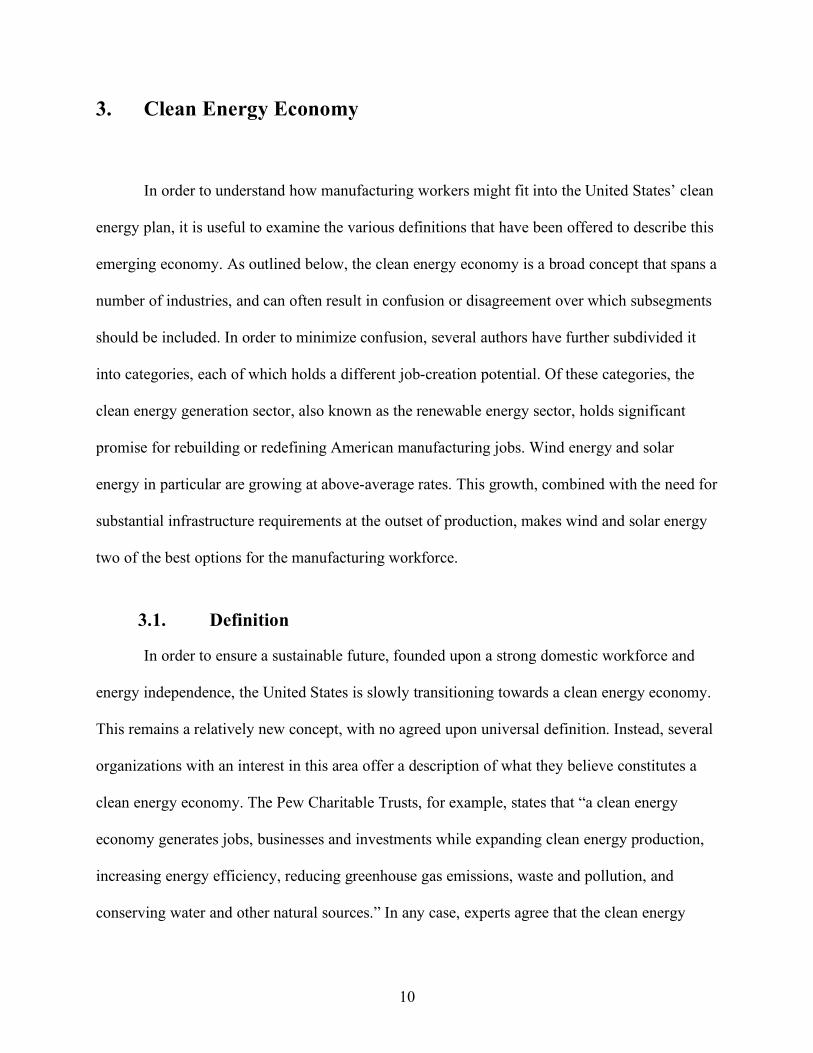
3. Clean Energy Economy
In order to understand how manufacturing workers might fit into the United States’ clean
energy plan, it is useful to examine the various definitions that have been offered to describe this
emerging economy. As outlined below, the clean energy economy is a broad concept that spans a
number of industries, and can often result in confusion or disagreement over which subsegments
should be included. In order to minimize confusion, several authors have further subdivided it
into categories, each of which holds a different job-creation potential. Of these categories, the
clean energy generation sector, also known as the renewable energy sector, holds significant
promise for rebuilding or redefining American manufacturing jobs. Wind energy and solar
energy in particular are growing at above-average rates. This growth, combined with the need for
substantial infrastructure requirements at the outset of production, makes wind and solar energy
two of the best options for the manufacturing workforce.
3.1. Definition
In order to ensure a sustainable future, founded upon a strong domestic workforce and
energy independence, the United States is slowly transitioning towards a clean energy economy.
This remains a relatively new concept, with no agreed upon universal definition. Instead, several
organizations with an interest in this area offer a description of what they believe constitutes a
clean energy economy. The Pew Charitable Trusts, for example, states that “a clean energy
economy generates jobs, businesses and investments while expanding clean energy production,
increasing energy efficiency, reducing greenhouse gas emissions, waste and pollution, and
conserving water and other natural sources.” In any case, experts agree that the clean energy

11
economy must have a positive net energy yield, reduce greenhouse gas emissions compared with
other sources of energy, and be produced and distributed in a sustainable and safe manner (Pew
Charitable Trusts, 2009).
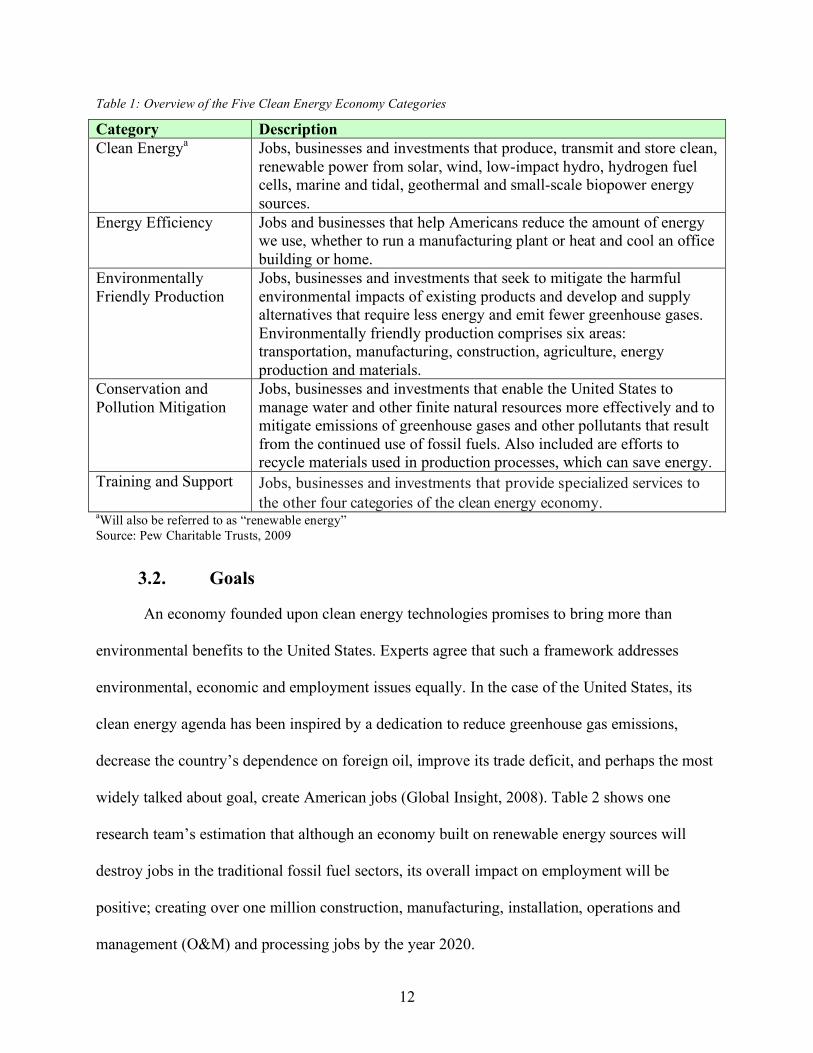
The Pew Charitable Trusts breaks the clean energy economy into five categories: (1)
Clean Energy; (2) Energy Efficiency; (3) Environmentally Friendly Production; (4) Conservation
and Pollution Mitigation; and (5) Training and Support (see Table 1: Overview of the Five Clean
Energy Economy Categories; for a more thorough overview of subsegments, refer to Appendix
A). This paper focuses on the potential for manufacturing job creation within the Clean Energy
category (which will also be referred to as “renewable energy”), which includes energy
generation, transmission and storage (Pew Charitable Trusts, 2009). Six out of 10 jobs in the
renewable energy category result from the generation of energy from clean sources, such as wind
and solar (Pew Charitable Trusts, 2009). From this number, it is clear that a clean energy
economy holds great potential for employment within the wind and solar energy industries. In
fact, the next section reveals that increasing employment through the generation of new jobs or
the transformation of existing jobs, is a primary objective of the American government’s clean
energy agenda. But just how many of these jobs are suitable for manufacturing workers requires
further investigation.
12
Table 1: Overview of the Five Clean Energy Economy Categories
Category Description Clean Energya Jobs, businesses and investments that produce, transmit and store clean,
renewable power from solar, wind, low-impact hydro, hydrogen fuel cells, marine and tidal, geothermal and small-scale biopower energy sources.
Energy Efficiency Jobs and businesses that help Americans reduce the amount of energy we use, whether to run a manufacturing plant or heat and cool an office building or home.
Environmentally Friendly Production
Jobs, businesses and investments that seek to mitigate the harmful environmental impacts of existing products and develop and supply alternatives that require less energy and emit fewer greenhouse gases. Environmentally friendly production comprises six areas: transportation, manufacturing, construction, agriculture, energy production and materials.
Conservation and Pollution Mitigation
Jobs, businesses and investments that enable the United States to manage water and other finite natural resources more effectively and to mitigate emissions of greenhouse gases and other pollutants that result from the continued use of fossil fuels. Also included are efforts to recycle materials used in production processes, which can save energy.
Training and Support Jobs, businesses and investments that provide specialized services to the other four categories of the clean energy economy.
aWill also be referred to as “renewable energy” Source: Pew Charitable Trusts, 2009
3.2. Goals
An economy founded upon clean energy technologies promises to bring more than
environmental benefits to the United States. Experts agree that such a framework addresses
environmental, economic and employment issues equally. In the case of the United States, its
clean energy agenda has been inspired by a dedication to reduce greenhouse gas emissions,
decrease the country’s dependence on foreign oil, improve its trade deficit, and perhaps the most
widely talked about goal, create American jobs (Global Insight, 2008). Table 2 shows one
research team’s estimation that although an economy built on renewable energy sources will
destroy jobs in the traditional fossil fuel sectors, its overall impact on employment will be
positive; creating over one million construction, manufacturing, installation, operations and
management (O&M) and processing jobs by the year 2020.

13
Table 2: Employment Impacts of a 15 percent Renewable Portfolio Standard (RPS) by 2020
Net Gain/Loss in Jobs by 2020 Overall for all sectors of the economy + 1,314,000 Coal mining – 23,900 Oil and gas mining – 61,400 Oil refining – 6,300 Electric Utilities – 35,100 Natural Gas Utilities – 26,200 Source: Kammen, Kapadia & Fripp, 2004
3.3. Clean Energy Generation Sectors
As noted earlier, wind energy and solar energy are two of the fastest growing sectors of
the American renewable energy industry. In addition to the growth in each segment’s energy
generating capacity,1 they have also recorded above-average growth in their respective number
of jobs. In order to better understand how this growth in employment might translate to increases
in manufacturing jobs, the following section provides an overview of wind and solar energy, and
specifically discusses how their components are manufactured.
3.3.1. Wind
Wind energy is a form of converted solar energy. As the sun radiates down, different
geographical landscapes absorb its rays at different rates, causing hot air to rise and cooler air to
replace it. The kinetic energy created from the movement of this air results in wind energy
(AWEA: Wind energy basics, 2009). In order to convert this power into a usable form of energy,
a wind turbine must be manufactured. Wind turbines are rotating pieces of machinery, made
predominately from steel and typically composed of 20 separate components (Sterzinger &
Svcek, 2004). Wind turbines vary in size and corresponding energy generating capacity. In 2008, 1 Energy generating capacity refers to the maximum output, commonly expressed in kilowatts (kW) or megawatts (MW = 1000 kW), that generating equipment can supply to system load, adjusted for ambient conditions. Energy generation -- the process of producing electric energy by transforming other forms of energy -- is the amount of electric energy produced, expressed in kilowatthours (kWh) (or megawatthours, MWh). 1 kWh = 3412 Btu. Source: EIA

14
some 25,369 MW of wind electricity generating capacity produced roughly 52 million MWh of
electricity in the United States; during this same period, the average American household
consumed roughly 1.5 billion MWh of electricity (AWEA: Wind power outlook 2009; EIA:
Annual consumption by sector, 2008). The majority of wind turbines manufactured today have
power ratings ranging from 250 watts to 5 MW (AWEA: Wind energy basics, 2009).2 Not
surprisingly, the amount of energy generated by these machines largely depends on the speed of
the wind within the area where the turbine is located. Generally, installing a single wind turbine
is not considered to be economically viable. Therefore, in order to maximize the efficiency of
wind electric turbines, they are installed in groups of large machines, named “wind power
plants” or “wind farms” (AWEA: Wind energy basics, 2009).
Wind power is quickly emerging as one of the United States’ leading new power
generation sources. In 2008, the country increased its installed wind energy capacity by 8,545
MW, corresponding to a 42 percent share of the nation’s total new generating capacity (AWEA:
Annual wind industry report, 2009). Between 2004 and 2008, wind power grew by an average
annual growth rate of 32 percent, propelling the United States ahead of Germany to claim the
position as world-leader in wind energy production and in cumulative wind energy power
generating capacity. Additionally, the U.S. also was the world’s largest market for new wind
turbine installations in 2008 (AWEA: Wind power outlook 2009).
3.3.2. Solar
Solar energy can be converted into a usable form of energy through one of three ways:
solar photovoltaics (PV); concentrated solar power (CSP); and solar thermal (see Table 3:
Overview of Solar Technologies). The majority of solar energy consumption in the United States 2 The American Wind Energy Association (AWEA) estimates that one MW of wind capacity can serve between 250 and 300 American homes.

15
comes from solar PV sources, in which semiconducting materials are used to convert sunlight
into electricity, and from solar thermal sources, in which energy from the sun is converted into
heat for such applications as water heating systems (EIA: Renewable and alternative fuels,
2009).
Table 3: Overview of Solar Technologies
Solar Technology Description Solar PV PV devices generate electricity directly from sunlight via an
electronic process that occurs naturally in certain types of material. Electrons in certain types of crystals are freed by solar energy and can be induced to travel through an electrical circuit, powering any type of electronic device.
Concentrated Solar Power CSP plants are utility-scale generators that produce electricity by using mirrors or lenses to efficiently concentrate the sun's energy. CSP technologies include parabolic trough systems, power towers, compact linear Fresnel, and dish systems, which concentrate the thermal energy of the sun to heat water to drive a conventional steam turbine.
Solar Thermal Solar power is harnessed to provide thermal (heat) energy, for example to heat water (in homes or pools) or rooms (solar space heating and cooling).
Source: Solar Energy Industries Association: Solar technology & products, 2009
The United States’ solar energy industry has managed to grow even amidst the country’s
financial crisis, with a 29 percent increase in new solar electric installations and a three percent
increase in new solar thermal installations in 2008 (see Figure 4: Solar Energy Capacity
Additions and Annual Growth Rates). In 2008, the total solar energy generating capacity in the
United States was estimated at 9,183 MW.3 Many analysts believe that the United States is
poised to become a world leader in solar energy production, largely due to its favorable climate
and existing innovative solar power technologies. The Southwestern United States is already one
of the largest destinations for CSP exploitation in the world, with abundant sunshine year-round
(Gereffi, Dubay, & Lowe, 2008). This is good news for a clean energy workforce, since the
3 The Solar Energy Industries Association estimates that one MW of solar electric capacity provides enough electricity to power between 150 and 250 American homes.

16
expansion of this industry will undoubtedly lead to jobs throughout the value chain, as new
plants are constructed, solar energy components are manufactured, and skilled workers are
required for the maintenance and operation of new plants.
Figure 4: Solar Energy Capacity Additions and Annual Growth Rates
0
200
400
600
800
1,000
1,200
2000
2001
2002
2003
2004
2005
2006
2007
2008
p
Year
M W
-40%
-20%
0%
20%
40%
60%
80%
100%
Electricity Installations
Thermal Installations
Annual Growth Rate ofElectricity Installations
Annual Growth Rate ofThermal Installations
Source: SEIA: U.S. solar industry year in review 2008.
3.4. Summary
This section outlined how the clean energy economy is a broad concept with no
universally agreed upon definition, resulting in occasional confusion or dispute over which
technologies and industrial sectors actually qualify as being “clean”. Despite this ambiguity, the
American government has made it clear that a primary objective of its clean energy agenda is to
provide a boost to employment. Not surprisingly, just how much of a boost is expected for the
U.S. workforce depends on the forecaster’s definition of a “clean energy job”. The ensuing
MW

17
section will clarify the terminology and various classifications used for this emerging section of
the labour market.

18
4. Clean Energy Jobs in the United States
A considerable amount of attention is being drawn to the intersection between
employment and environment. Reports outlining the potential for so-called “green jobs”, “clean
energy jobs” and “green-collar jobs” in the United States are pouring in everywhere from
international agencies to governments, and new organizations are being created specifically to
address the profound crisis in the country’s employment and environment sectors. The Blue
Green Alliance, for instance, was created as a national, strategic partnership between labour
unions and environmental organizations dedicated to expanding the number and quality of jobs in
the green economy (Blue Green Alliance, 2009). Unfortunately, the inconsistency in the
terminology used to describe the employment opportunities of a “green” or “clean energy”
economy often leads to confusion and substantial variation in future job projection numbers.
Table 4 outlines the terminology that will be used to discuss employment opportunities in the
context of this report, unless otherwise specified.

19
Table 4: Employment Terminology to be used in the Current Paper
Expression Description
Green Job
Clean Energy Job
Employment in (1) renewable energy, (2) energy efficiency, (3) conservation and pollution mitigation, (4) environmentally friendly protection, and (5) training and support of the first four categories
Green-Collar Job Traditional blue-collar jobs in (1)manufacturing, (2) construction, and (3) maintenance that exist within one of the five clean energy sectors listed above
Renewable Energy Job Employment within the renewable energy sectors, including wind energy solar energy
Clean Energy Manufacturing Job
Employment in the manufacturing of components used for the generation of renewable energy
Note: “Green jobs” and “clean energy jobs” will be used synonymously
Many suggest that the pursuit of green jobs will be a key economic driver in the 21st
century (United Nations Environment Programme, 2008). Environmental awareness is being
increasingly built into companies’ business models, as these organizations aim to honour their
social responsibilities and improve the environments in which they operate. As the economy
becomes greener, large-scale investments are made in new technologies, thus providing a major
stimulus to labour markets.
This section provides an overview of green jobs in the United States, with a focus on
synthesizing various estimates of the current and future number of green jobs, and relating these
to estimates of the future number of clean energy manufacturing jobs (see Figure 5: Illustration
of Clean Energy Jobs Studies and Estimation of Clean Energy Manufacturing Jobs). It begins by
examining how the term was coined, and how green jobs are created. It then provides a snapshot
of current clean energy job numbers in the United States, based on estimates from several
different organizations, each of which offers a separate definition of what constitutes a clean
energy job. In order to answer this paper’s two research questions, this section also broadly
examines the transferable manufacturing skills that can be applied in the clean energy economy

20
to revitalize this workforce. This section then looks at how these skills can be transferred to the
wind and solar energy industries in particular, due to the above-average growth rate of these
industries and their need for component manufacturing. After establishing how the growing
renewable energy sector can recreate disappeared manufacturing jobs and redefine existing
manufacturing jobs, data will be synthesized to gauge how many of these jobs will be created
between now and 2020. Finally, this section concludes by outlining research into the negative
aspects of clean energy jobs and evaluates the strength of the arguments presented by these
researchers.
Figure 5: Illustration of Clean Energy Jobs Studies and Estimation of Clean Energy Manufacturing Jobs
4.1. Definition
Much like the clean energy economy, the concept of green jobs remains in its infancy,
and thus lacks a universally accepted definition. The United Nations Environment Programme

21
(UNEP) defines green jobs as positions in agriculture, manufacturing, construction, installation,
and maintenance, as well as scientific and technical, administrative, and service-related
activities, that contribute substantially to preserving or restoring environmental quality (United
Nations Environment Programme, 2008). The Political and Economic Research Institute (PERI)
offers a much simpler definition, stating that a green job is one that is contributing to fighting
global warming and building a green economy (Pollin & Wicks-Lim, 2008). The American Solar
Energy Society (ASES), on the other hand, considers it more useful to examine green jobs across
a broader spectrum. According to this organization, green jobs can be found anywhere from
professions that have improved their level of environmental resource degradation or extraction,
to professions that have a clear positive impact on the environment (American Solar Energy
Society & Management Information Systems, Inc., 2008). Not surprisingly, the level of projected
new green jobs varies depending on which definition is being used for analysis.
4.2. Green Job Creation
Movement towards a clean energy economy affects employment in one of four ways:
new jobs are created; existing jobs are substituted; existing jobs are eliminated without direct
replacement; and existing jobs are transformed and redefined (see Table 5: Employment Impact
of a Clean Energy Economy). Although this paper discusses the potential for “new” clean energy
jobs, it should be noted that the majority of these are in fact existing jobs that are either
substituted or transformed and redefined. That is, these jobs do not require an entirely new and
unique set of skills that would require significant investments in employee training programs.
Instead, most clean energy jobs build on the existing skill sets of American workers, resulting in
an easy transition from “dirty” energy workers to clean energy workers.

22
Table 5: Employment Impact of a Clean Energy Economy
Employment Impact Example New jobs are created Workers are hired to manufacture new pollution control
equipment that meet new environmental standards Existing jobs are substituted Coal mining jobs are replaced with solar energy jobs Existing jobs are eliminated New environmental regulations ban the use of certain packaging
materials, eliminating jobs in the production of these materials Existing jobs are transformed and redefined
A construction worker who has always worked on projects for “dirty” industries is employed to build a solar energy plant
Source: United Nations Environment Programme, 2008
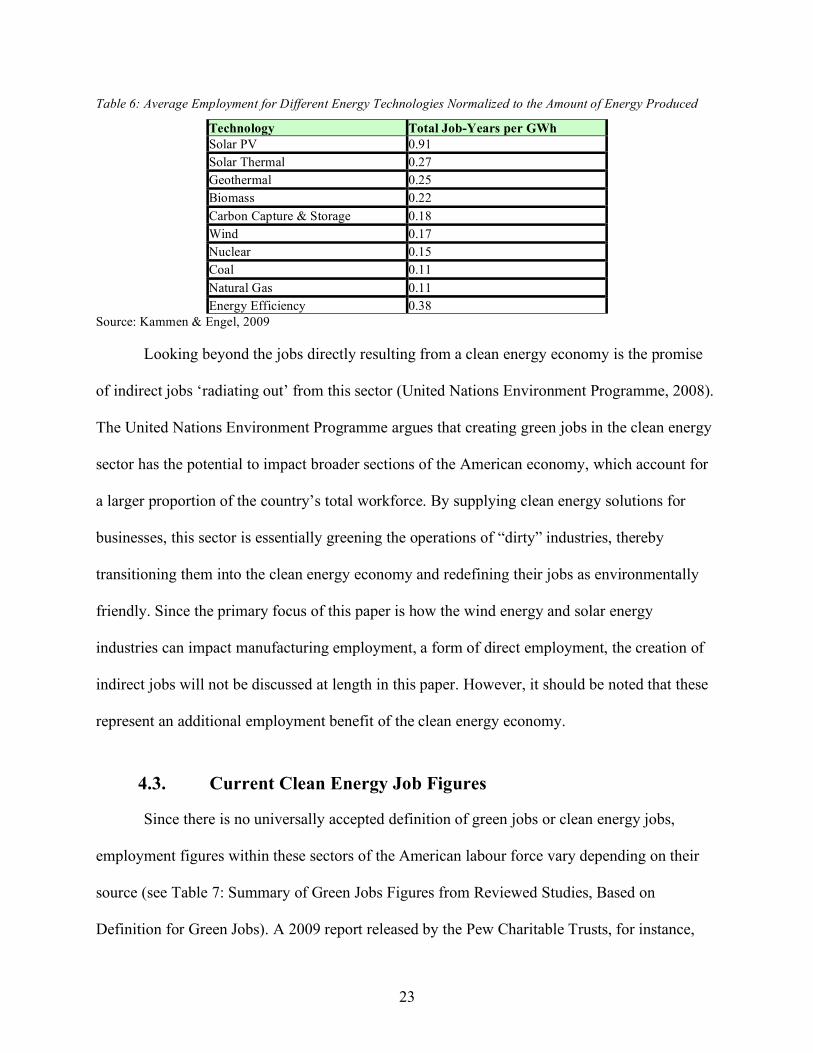
Several reports have examined the effects of substituting existing jobs in the fossil fuel
industry with new jobs in renewable energy industries. In all cases, findings indicate that the
renewable energy sector generates more jobs per unit of energy delivered (expressed in job-years
per Gigawatt hour) than the fossil fuel-based sector (see Table 6: Average Employment for
Different Energy Technologies Normalized to the Amount of Energy Produced). In addition to
generating more jobs per unit of energy, the renewable energy industry also creates more jobs
per dollar invested than the fossil fuel industry (Kammen, Kapadia & Fripp, 2004). Investments
made in solar and wind energy yield similar employment results, with 5.65 person-years4 and
5.70 person-years of employment per million dollar invested respectively (Kammen, Kapadia &
Fripp, 2004). Fossil fuels, on the other hand, generate only 3.96 person-years of employment for
every million dollars of investment.
4 A person-year refers to one whole year, or fraction thereof, worked by an employee, including contracted manpower.
23
Table 6: Average Employment for Different Energy Technologies Normalized to the Amount of Energy Produced
Technology Total Job-Years per GWh Solar PV 0.91 Solar Thermal 0.27 Geothermal 0.25 Biomass 0.22 Carbon Capture & Storage 0.18 Wind 0.17 Nuclear 0.15 Coal 0.11 Natural Gas 0.11 Energy Efficiency 0.38
Source: Kammen & Engel, 2009
Looking beyond the jobs directly resulting from a clean energy economy is the promise
of indirect jobs ‘radiating out’ from this sector (United Nations Environment Programme, 2008).
The United Nations Environment Programme argues that creating green jobs in the clean energy
sector has the potential to impact broader sections of the American economy, which account for
a larger proportion of the country’s total workforce. By supplying clean energy solutions for
businesses, this sector is essentially greening the operations of “dirty” industries, thereby
transitioning them into the clean energy economy and redefining their jobs as environmentally
friendly. Since the primary focus of this paper is how the wind energy and solar energy
industries can impact manufacturing employment, a form of direct employment, the creation of
indirect jobs will not be discussed at length in this paper. However, it should be noted that these
represent an additional employment benefit of the clean energy economy.
4.3. Current Clean Energy Job Figures
Since there is no universally accepted definition of green jobs or clean energy jobs,
employment figures within these sectors of the American labour force vary depending on their
source (see Table 7: Summary of Green Jobs Figures from Reviewed Studies, Based on
Definition for Green Jobs). A 2009 report released by the Pew Charitable Trusts, for instance,

24
conducted a conservative analysis of current and future jobs within the clean energy economy.
Researchers only examined those workers directly working towards developing clean, renewable
sources of energy, increasing energy efficiency, reducing greenhouse gas emissions and
conserving natural resources. Based on this framework, the report states that in 2007, a total of
68,203 businesses across all 50 states and the District of Columbia accounted for 770,385 jobs in
the clean energy economy (Pew Charitable Trusts, 2009). By contrast, a 2008 study released by
the American Solar Energy Society and Management Information Systems, Inc. (MISI) used a
more broadly defined clean energy workforce, and found that in 2006, the U.S. clean energy
industry employed over 9 million workers both directly and indirectly (American Solar Energy
Society & Management Information Systems, Inc., 2008). The conservative estimate put forth by
the Pew Charitable Trusts corresponds to only half a percent of the country’s total workforce,
while that presented by ASES and MISI corresponds to 6.8 percent of the American labour force.
Despite these discrepancies, most researchers agree that the growth of clean energy jobs
is currently outpacing growth in the rest of the U.S. labour force, and employment is expected to
continue to grow for the foreseeable future. The Pew Charitable Trusts outlines that between
1998 and 2007, clean energy jobs grew by 9.1 percent, while total jobs grew by only 3.7 percent
(Pew Charitable Trusts, 2009). This organization anticipates sustained employment growth
within the industry through sufficient public and private support. Similarly, ASES and MISI
project an approximate 300 percent increase in the number of clean energy jobs by 2030, through
aggressive policy implementation and investment (American Solar Energy Society &
Management Information Systems, Inc., 2008).

25
Table 7: Summary of Green Jobs Figures from Reviewed Studies, Based on Definition for Green Jobs
Authors Year Green Job Definition Number of Green Jobs (Year)
Projected Growth of Green Jobs (Year)
Kammen, Kapadia & Fripp
2004 Workers directly employed by the renewables sector, holding jobs in construction, manufacturing, installation, O&M and fuel processing
-- Up to 240,850 (2020)
Bezdek 2007 Jobs within the RE&EE industry, created both directly and indirectly, from hydroelectricity, biomass, geothermal, wind, PV, and solar thermal technologies and energy efficiency
(2006) Direct: 3,694,000 Indirect: 4,804,000 Total: 8,498,000
(2030) Base: 16,258,000 Moderate: 20,963,000 Advanced: 40,103,000
The ASES and MISI
2008 Jobs which, as a result of environmental pressures and concerns, have produced the development of numerous products, processes, and services, which specifically target the reduction of environmental impact. Environment-related jobs include those created both directly and indirectly by environmental protection expenditures
9,090,000 (2007)
(2030) Base: 16,258,000 Moderate: 19,504,000 Advanced: 37,206,000
Global Insight 2008 Workers employed in any activity that generates electricity using renewable or nuclear fuels, agriculture jobs supplying corn or soy for transportation fuel, manufacturing jobs producing goods used in renewable power generation, equipment dealers and wholesalers specializing in renewable energy or energy-efficiency products, construction and installation of energy and pollution management systems, government administration of environmental programs, and supporting jobs in the engineering, legal, research and consulting fields
751,051 (2006)
4,214,700 (2038)
UNEP 2008 Positions in agriculture, manufacturing, construction, installation, and maintenance, as well as scientific and technical, administrative, and service-related activities, that contribute substantially to preserving or restoring environmental quality
639,870 (2006)
--
Pew Charitable Trusts
2009 Workers employed in a clean energy economy generates jobs, businesses and investments while expanding clean energy production, increasing energy efficiency, reducing greenhouse gas emissions, waste and pollution, and conserving water and other natural resources
770,385 (2007)
--
Research shows that the majority of jobs in the clean energy economy exist within the
area of Conservation and Pollution Mitigation (see Figure 6: Jobs in the Clean Energy Economy
by Category, 2007). However, this is considered to be a relatively capital intensive section of the
industry, which leads experts to believe that future clean energy job creation will occur in more

26
labour-intensive categories that are already recording high growth rates, such as Clean Energy
(see Figure 7: Growth of Clean Energy Jobs by Category, 1998-2007).
Figure 6: Jobs in the Clean Energy Economy by Category, 2007
9.5%
11.6%
65.1%
6.8%7.0%
Energy Efficiency
Clean Energy
Conservation and Pollution Mitigation
Training and Support
Environmentally Friendly Production
Source: Pew Charitable Trusts, 2009
Figure 7: Growth of Clean Energy Jobs by Category, 1998-2007
-0.3%3.0%
18.0%23.0%
67.0%
-10%
0%
10%
20%
30%
40%
50%
60%
70%
80%
Tra
inin
g a
nd
Support
Conse
rvat
ion a
nd
Poll
uti
on
Mit
igat
ion
Ener
gy
Eff
icie
ncy
Cle
an E
ner
gy
Envir
onm
enta
lly
Fri
endly
Pro
duct
ion
Source: Pew Charitable Trusts, 2009

27
Research shows that the majority of existing renewable energy jobs are in fact indirect. A
2007 study by Bezdek, for instance, found that 56 percent of jobs within the renewable energy
and energy efficiency (RE&EE) industry came from indirect sources (Bezdek, 2007). Similarly,
a 2008 report released by UNEP also revealed that in 2006, 56 percent of both the wind energy
and solar energy industries’ workers held indirect jobs (see Table 8: Distribution of Direct and
Indirect Jobs in the Clean Energy Economy, 2006). While this means that clean energy
manufacturing workers, whose jobs are directly created through investment in renewable sources
of energy, currently represent a small portion of the renewable energy workforce, this
distribution is expected to change. Up to 80 percent of jobs created from new investments in
renewable energy sources are expected to be manufacturing jobs (Apollo Alliance, 2009;
Kammen, Kapadia & Fripp, 2004; Sterzinge & Svcek, 2004).
Table 8: Distribution of Direct and Indirect Jobs in the Clean Energy Economy, 2006
Industry Segment Direct Jobs Direct and Indirect Jobs Wind Power 16,000 36,800 Solar PV 6,800 15,700 Solar Thermal 800 1,900 Other Renewables 161,550 372,600 Total, Government 6,900 15,870 Trade and Professional Associations, NGOs 1,500 3,450 TOTAL 193,550 446,320
Source: United Nations Environment Programme, 2008
Evidently, there is no consensus on the absolute number of jobs that currently exist
within the clean energy economy. Relative growth figures, however, are much more consistent
between publications. Since a primary objective of developing the United States’ clean energy
economy is to ensure a sustainable, long-term future, it is more useful to examine the potential
for growth in clean energy employment.

28
4.4. Future Clean Energy Job Figures
Much like current clean energy jobs figures in the United States, projections for the
growth of green jobs vary according to the definition being used (see Table 7: Summary of
Green Jobs Figures from Reviewed Studies, Based on Definition for Green JobsError!
Reference source not found.). The Pew Charitable Trusts, for instance, states that in 2007, jobs
in the clean energy economy accounted for 0.49 percent of all jobs within the United States.
Although green jobs may appear to represent a relatively small segment of the American
workforce, this organization claims that their growth is outpacing overall growth amongst
American workers. Between the years 1998 and 2007, employment in the clean energy economy
grew by an average of 1 percent per year, while total employment in the United States grew by
an average of 0.4 percent per year (Pew Charitable Trusts, 2009). Although specific numbers
might vary between studies, the general trend from estimating future growth of green jobs is that
employment within this sector is expected to increase, particularly when coupled with aggressive
investment in clean energy technologies. Not surprisingly, larger investments yield higher
employment figures.
To illustrate this trend, the American Solar Energy Society released a report that aimed to
estimate growth in the renewable energy and energy efficiency industries to 2030, based on
differing investment scenarios (see Table 9: Employment Impacts of Investing in the RE&EE
Industry, 2030). In order to do so, the authors of the study developed three forecasting scenarios:
a base case, a moderate scenario, and an advanced scenario. Employment projections for the base
case scenario were based on those policies in existence at the time of writing. Under these
“business as usual” regulations, the authors believe that renewable energy is unlikely to
significantly increase its share of the United States energy market, and jobs within this sector

29
will suffer as a result, with only 1.3 million new jobs being created in 23 years. The moderate
case scenario assumes that moderate incremental policy changes will be introduced by federal
and state officials throughout a 20-year period, resulting in 3.1 million new jobs within the clean
energy sector. Finally, projections under the advanced scenario were based on the
implementation of forward-thinking and aggressive long-term federal and state policies that
might propel the United States into a world-leading position within clean energy industries.
Under such a scenario, the authors of the report believe that new direct and indirect clean energy
jobs could total nearly 8 million by the time 2030 rolls around.
Table 9: Employment Impacts of Investing in the RE&EE Industry, 2030
Total Jobs Created (Thousands)
Base Case Moderate Case Advanced Case
RE 1,305 3,138 7,918
EE 14,953 17,825 32,185
Total 16,258 20.963 40,103 Source: Bedzek, 2007
Looking beyond numbers, several researchers have also examined the quality of future
clean energy jobs. One of the most promising aspects of this economy is its ability to stimulate
job growth across a range of educational and professional backgrounds. Although there is a
strong need for high-level managers within the proposed clean energy economy, policymakers
are focusing a great deal of attention on its ability to stimulate blue-collar workers. Many
analysts see great potential for the generation of green-collar jobs in the manufacturing,
construction and maintenance of clean energy products. These are considered to be particularly
promising for the future of America’s workers because construction and maintenance green-

30
collar jobs are not easily outsourced, and therefore hold great potential to stimulate domestic
economies and workforces (United Nations Environment Programme, 2008). Clean energy
manufacturing jobs, however, are much more vulnerable to being outsourced to international
markets, since components may easily be shipped to their final destination. Despite this risk,
green-collar jobs in manufacturing are thought to be the most likely to repair the damaged U.S.
labour force. To better understand how the United States can avoid the outsourcing of clean
energy manufacturing jobs, the following section looks at how domestic clean energy
manufacturing jobs can be created, and paints a picture of the nature of these jobs in the wind
and solar energy industries in particular.
4.5. Clean Energy Manufacturing Jobs
Clean energy represents one of the most promising opportunities for American
manufacturing. Large numbers of jobs have been lost by workers who possess transferable skills.
If used properly, these skills could help accelerate America’s journey towards becoming a leader
of clean energy technologies. Experts argue that current or former blue-collar employees in
dying industries, such as auto manufacturing, are better off using their manufacturing expertise
in emerging industries, such as clean energy. The domestic market for clean energy components,
such as solar panels and wind turbines, is projected to grow to $325.1 billion within the next
decade (Makower, Pernick & Wilder, 2009). Experts believe that the demand for solar and wind
power will continue to expand over the next 20 years, and an anticipated 70 to 80 percent of the
new jobs created in those industries will be in the manufacturing sector (Apollo Alliance, 2009;
Kammen, Kapadia & Fripp, 2004). In order to capitalize on this opportunity, policies and

31
programs are required to help transition blue-collar manufacturing workers towards work in the
renewable energy job market.
4.5.1. Creating Clean Energy Manufacturing Jobs
Recognizing the inherent opportunity in investing in domestic clean energy
manufacturing, a national coalition of labour, business, community, and environmental leaders
formed the Apollo Alliance. This think-tank recently released its Green Manufacturing Action
Plan (“GreenMAP”), which paves the road for a transition towards a clean energy economy that
stimulates green-collar manufacturing jobs. In its report, the Apollo Alliance estimates that $50
billion of federal and private investment in industrial retooling and retraining programs would
create 250,000 direct manufacturing jobs in the United States, support an additional 725,000
indirect jobs, and generate as much as $120 billion in revenue (Apollo Alliance, 2009). This
organization stipulates that the states most likely to benefit from manufacturing jobs resulting
from investments in clean energy technologies are the twenty states that have experienced the
greatest manufacturing job losses (Apollo Alliance, 2009).
The Apollo Alliance hopes that laying out a clear roadmap will direct manufacturing
workers away from traditionally “dirty” industries and towards industries that use clean energy
technologies. Several American companies have demonstrated the viability of such a transition,
such as Infinia Corporation in the Pacific Northwest.
4.5.2. Infinia Corp.: Transition towards Green-Collar Jobs
Workers at Infinia Corp., an energy technology company based out of Washington State,
have demonstrated the viability of transitioning blue-collar auto manufacturers into green-collar
solar energy manufacturers. In early 2009, the company introduced its signature Infinia Solar

32
System (ISS) after recognizing that the growing number of out-of-work auto manufacturers were
rich in transferable work skills that could be successfully used in the manufacturing of clean
energy components. The ISS is an innovative dish that looks like a satellite television receiver,
but that converts the sun’s heat into electricity. The dish is powered by Infinia’s Stirling engine,
a mechanical device made largely from steel, that converts externally-applied temperature
differential into electricity (Infinia Corporation: Infinia Solar System product specification,
2009). This concentrated solar dish system was the first of its kind to be specifically designed for
mass manufacturing by American auto manufacturers (Gereffi, Dubay, & Lowe, 2008). This is a
perfect example of how the clean energy economy can transform and redesign existing jobs in
dirty industries. The ISS is manufactured by workers in existing auto production lines, which in
2008 were underutilized by approximately 21 percent (Gereffi, Dubay, & Lowe, 2008). By
diversifying and expanding the product mix for these workers, Infinia is helping to protect their
jobs against such variables as a decrease in the consumer demand for cars. The company
estimates that its Infinia Solar System has the potential to create as many as 500,000
manufacturing jobs. This is just one example of how the solar and wind energy industries can
help reinvent manufacturing jobs. The following section provides a more detailed overview of
the kind and number of manufacturing jobs within these renewable energy industries.
4.6. Clean Energy Generation Manufacturing Jobs
While several researchers have offered estimates of how many jobs can be created
through the development of these technologies, few have examined how employment
opportunities within the renewable energy industries will benefit the United States’
manufacturing workforce specifically, and none have examined how the present combination of
private and public investment might lead to wind and solar energy manufacturing jobs. This

33
section addresses this paper’s two research questions by synthesizing current and future
estimates of manufacturing jobs in the wind and solar energy industries. In order to understand
how current investments in wind and solar energy technologies in the U.S. might relate to these
findings, the following section will provide an overview of public and private investments, and
relate these to potential manufacturing employment figures.
4.6.1. Wind Energy Manufacturing Jobs
The United States recently passed Germany to claim the title of world-leader in wind
generation capacity (Makower, Pernick & Wilder, 2009). In spite of its growing wind energy
segment, the U.S. is not yet considered a leader of wind energy manufacturing. Currently, 80
percent of this activity takes place within the European Union and the majority of turbines and
blades used within the U.S. are imported from Europe (United Nations Environment Programme,
2008). However, experts agree that the United States is well positioned to build its wind power
manufacturing base, due to its strong scientific and industrial base (United Nations Environment
Programme, 2008). Evidently, the country’s labour force is not the biggest obstacle preventing it
from surging in this sector, but rather its federal support of domestic wind energy development.
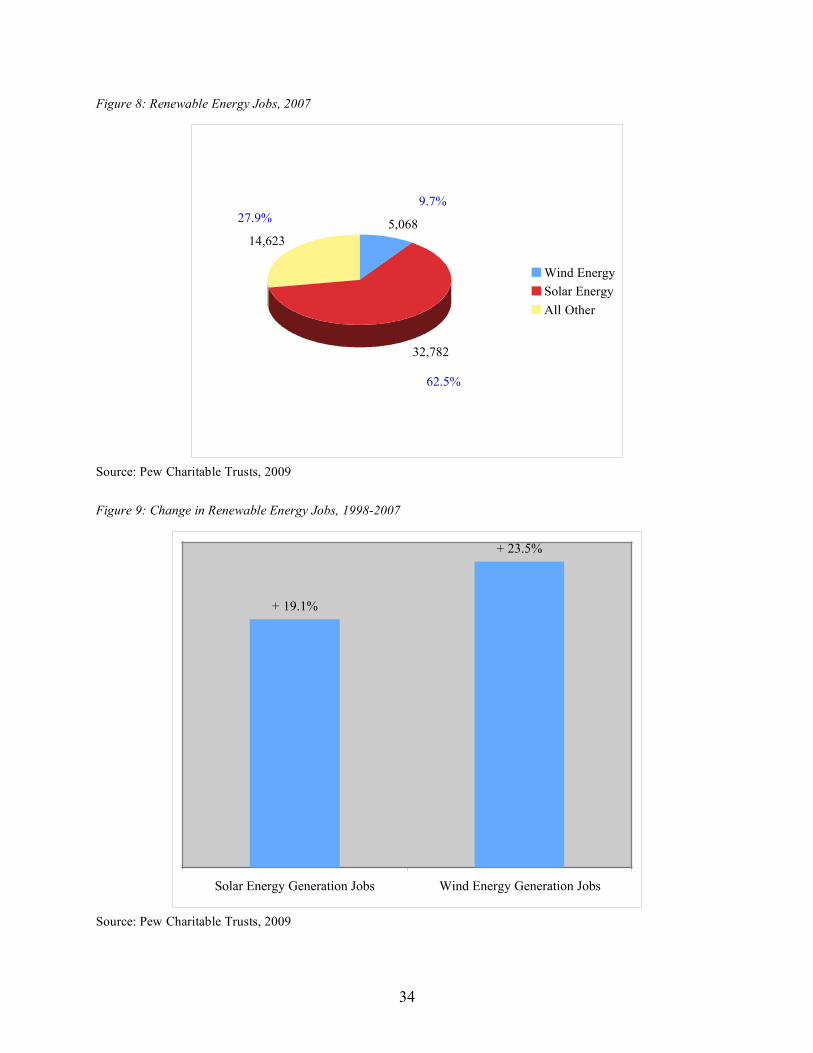
The Pew Charitable Trusts estimates that nearly 10 percent of workers within the
renewable energy sector of the clean energy economy are employed by the wind power industry,
which according to its own “clean energy” definition, corresponds to just over 5,000 workers
(see Figure 8: Renewable Energy Jobs, 2007). Although this number may seem somewhat small,
employment data also reveals exceptional growth within this job market, with a 23.5 percent
increase between 1998 and 2007. The next largest growth rate was seen in the solar power
industry, whose jobs grew by 19.1 percent within the same period (see Figure 9: Change in
Renewable Energy Jobs, 1998-2007).
34
Figure 8: Renewable Energy Jobs, 2007
5,068
32,782
14,623
Wind Energy
Solar Energy
All Other
9.7%
27.9%
62.5%
Source: Pew Charitable Trusts, 2009
Figure 9: Change in Renewable Energy Jobs, 1998-2007
+ 23.5%
+ 19.1%
Solar Energy Generation Jobs Wind Energy Generation Jobs
Source: Pew Charitable Trusts, 2009

35
Skilled manufacturers are particularly critical to the future of the wind energy industry, as
manufacturing jobs account for 70 percent of all new jobs resulting from wind energy
development. Every 1000 MW of energy supplied by wind requires a corresponding $1 billion
investment in its manufacturing components and an additional 3,000 jobs in manufacturing
(Sterzinger & Svrcek, 2004). A report released in 2004 reviewed job creation studies within the
renewable energy sector and outlined potential job creation for five separate scenarios, each with
a different mix of energy sources. Of these forecasts, scenario 3 had the largest proportion of
energy supplied by wind, and also had the highest corresponding manufacturing job potential
(see Table 10: Comparison of Estimated Job Creation through Different Energy Supply Mixes by
2020). These findings suggest that America’s dying manufacturing sector stands to benefit the
most from the development of wind energy technologies.
Table 10: Comparison of Estimated Job Creation through Different Energy Supply Mixes by 2020
Average employment associated with each scenario (jobs)
Scenarios Construction,
Manufacturing, Installation
O&M and Fuel Processing
Total Employment
Scenario 1: 20% Renewable Portfolio Standard (RPS) by 2020 (85% biomass, 14% wind energy, 1% solar PV) Scenario 2: 20% Renewable Portfolio Standard (RPS) by 2020 (60% biomass, 37% wind energy, 3% solar PV) Scenario 3: 20% Renewable Portfolio Standard (RPS) by 2020 (40% biomass, 55% wind energy, 5% solar PV) Scenario 4: Fossil Fuels as Usual to 2020 (50% coal and 50% natural gas) Scenario 5: 20% Gas Intensive by 2020 (100% natural gas)
52,533 85,008 111,879 22,711 22,023
188,317 91,436 76,139 63,657 61,964
240,850 176,444 188,018 86,369 83,987
Source: Kammen, Kapadia & Fripp, 2004
In 2004, the Renewable Energy Policy Project (REPP) released a report examining
employment in the manufacturing of wind energy components. These authors conducted a state-
by-state analysis of current players in the wind energy market, potential players within this

36
sector, as well as potential employment gains from a 50,000 – 77,000 MW increase in wind
energy generation. These numbers were developed from a report produced by the EIA, which
estimated that in order to reach RES targets of 10 percent and 20 percent by 2020, the United
States would need to up its wind energy capacity to 50,000 MW and 77,000 MW, respectively.
Findings from this research indicate that all fifty states stand to gain from increased investment
within the wind energy sector, with many of the states hardest hit by manufacturing
unemployment standing to gain the most (see Table 11: Top 20 States Benefiting from Wind
Investment, with Job Loss Demographics). In fact, the 20 states that stand to benefit the most
from wind energy manufacturing jobs, account for 76 percent of total manufacturing job losses
between the years of 2001 and 2004. On a national scale, these authors estimate that a $77 billion
investment in 77,000 MW of supplemental wind power would result in the creation of 231,000
manufacturing jobs (Sterzinger & Svrcek, 2004).

37
Table 11: Top 20 States Benefiting from Wind Investment, with Job Loss Demographics
State
Potential New Clean Energy Jobs
Average Investment ($Billions)
Manufacturing Jobs Lost, Jan 2001-May 2004 Rank in U.S.
California 12,717 4.24 318,000 1 Ohio 11,688 3.90 165,500 3 Texas 8,943 2.98 169,600 2 Michigan 8,549 2.85 129,300 8 Illinois 8,530 2.84 131,500 6 Indiana 8,317 2.77 63,500 13 Pennsylvania 7,622 2.54 155,200 5 Wisconsin 6,956 2.32 68,300 10 New York 6,549 2.18 130,500 7 South Carolina 4,964 1.65 56,800 17 North Carolina 4,661 1.55 156,600 4 Tennessee 4,233 1.41 59,700 15 Alabama 3,571 1.19 45,300 19 Georgia 3,532 1.18 65,700 11 Virginia 3,386 1.13 57,500 16 Florida 3,371 1.12 56,800 18 Missouri 3,234 1.08 36,700 23 Massachusetts 3,210 1.07 84,900 9 Minnesota 3,064 1.02 38,800 21 New Jersey 2,920 0.97 65,400 12 20 State Total 120,017 40 2,055,600 % U.S. Total 80% 80% 76%
Source: Sterzinger & Svrcek, 2004
Recognizing the inherent opportunity in this growing industry, the United States
Department of Energy (DOE) launched its Wind Powering America program in July 2008, which
aims to increase wind energy’s contribution to the country’s electrical supply to 20 percent by
2030 (U.S. Department of Energy, 2008). Within the next two decades, consumer demand is
expected to grow at an annual rate of 1.3 percent. At this rate, significant development is
required if supply is to meet demand, thereby resulting in great potential for increased
employment within this sector. Estimates presented in the DOE’s “20% Wind Energy by 2030”
report indicate a wind energy job generation potential of 260,000 jobs per year (U.S. Department
of Energy, 2008). This equates to more than 6 million new manufacturing jobs between the years

38
2007 and 2030, most of which are expected to be located in the areas hardest hit with
unemployment (Kammen & Engel, 2009).
4.6.2. Solar Energy Manufacturing Jobs
The solar power sector currently employs the majority of workers within the renewable
energy industry, accounting for 62.5 percent of all jobs in 2007 (see Figure 8: Renewable Energy
Jobs, 2007). Roughly 80 percent of jobs created from new investments in the solar energy
industry are expected to be in manufacturing, while the remaining jobs will primarily be in
construction and installation (Sterzinger & Svcek, 2005). In its Clean Energy Trends 2009 report,
Clean Edge predicts that markets for the manufacturing and installation of solar energy modules
and components will likely grow from $29.6 billion in 2008 to $80.6 billion by 2018 which,
according to the Apollo Alliance, would result in a corresponding 255,000 increase in the
number of solar energy manufacturing jobs (Apollo Alliance, 2009; Makower, Pernick &
Wilder, 2009). The United States currently sits behind Germany, Japan and Spain for the title of
the world’s largest market for PV electricity capacity (see Figure 10: Solar Electricity Capacity
of Leading Countries Worldwide, 2008). In 2005, it was also considered a leader of solar energy
component manufacturing, retaining an 8.5 percent share of global production (European
Photovoltaic Industry Association & Greenpeace, 2006).

39
Figure 10: Solar Electricity Capacity of Leading Countries Worldwide, 2008
0
1,000
2,000
3,000
4,000
5,000
6,000
Germany Spain Japan United
States
Italy France
Sola
r E
lect
rici
ty C
apac
ity (
MW
)New Capacity in 2008p
Total Cumulative Capacity
Source: SEIA: U.S. solar industry year in review 2008
The solar energy industry has received much more widespread support from federal, state
and local governments than the wind energy industry. The federal government, for example, has
been collaborating with private research firms for years, in an effort to expand the solar power
industry through increased research and development. In April 2008, the DOE announced a five-
year commitment worth $60 million to further the development of low-cost CSP technology
(Gereffi, Dubay, & Lowe, 2008). Many of these investments have helped stimulate both
economic and employment growth within this industry, with the largest improvements occurring
within the solar PV sector. In 2007, U.S. manufacturing of solar PV components increased
dramatically, with domestic manufacturers reporting a 74 percent increase in production over
2006 levels. Manufacturing continued to grow in 2008, with a reported 60 percent further
increase in production levels (SEIA: U.S. solar energy year in review 2008).

40
In 2005, the U.S. Solar Energy Industries Association (SEIA) and Renewable Energy
Policy Project laid out a “PV Roadmap”, which aims to increase the country’s solar electricity
capacity through the year 2050 (see Figure 11: PV Roadmap for Increased Solar Electricity
Capacity, 2008-2050). For their report, researchers conducted a thorough analysis of domestic
companies that have the potential to enter the solar PV manufacturing market and mapped out
the location of new jobs under the proposed plan. Projections were based on anticipated growth
figures of 30 percent per year over the next 20 years within the solar PV industry. The SEIA and
REPP predict that such a commitment would require an additional $34 billion investment by
2015 – of which $27 billion would be directed towards the manufacturing sector – and would
result in the creation of 42,000 new manufacturing jobs by the same year. By 2050, this roadmap
would result in a 280,000 increase in total solar PV manufacturing employment (see Table 12:
Anticipated Employment Effects of a PV Roadmap, 2015-2050). By contrast, failure to expand
the American solar industry through increased investment and higher renewable energy targets
would result in the creation of only 8,000 new jobs within this same period. Similar to the wind
industry, the REPP’s report shows that the solar industry holds the potential to revitalize the
country’s dying manufacturing workforce, since the 20 states that would receive the bulk of
investment funds account for 75 percent of recent manufacturing job losses (Sterzinger & Svcek,
2005).

41
Figure 11: PV Roadmap for Increased Solar Electricity Capacity, 2008-2050
0
100,000
200,000
300,000
400,000
500,000
600,000
700,000
800,000
2008 2015 2030 2050
So
lar
Ele
ctri
city
Cap
acit
y (
MW
)
Source: Sterzinger & Svcek, 2005
Table 12: Anticipated Employment Effects of a PV Roadmap, 2015-2050
Total Employment (Thousands) Manufacturing Employment (Thousands)
Year
Baseline Roadmap Baseline Roadmap
2015 28,000 62,000 22,400 49,600
2030 59,000 260,000 47,200 208,000
2050 95,000 350,000 76,000 280,000 Source: Sterzinger & Svcek, 2005
4.6.3. Summary
Publications examining future clean energy manufacturing jobs within the wind and solar
energy industries present a range of potential job creation estimates. The discrepancy results
from differences in the federal RES or RPS targets used for analysis, the timeline for reaching

42
such standards, as well as the relative mix of electricity supplied by either wind or solar energy.
By the year 2030, wind energy manufacturing employment is expected to see an increase of as
many as 6 million jobs, while solar PV manufacturing alone is expected to create up to 280,000
jobs by the year 2050. Although these projections sound encouraging for the future of America’s
manufacturing workforce, not everyone agrees with a clean energy agenda’s ability to positively
impact employment.
4.7. Criticism of Clean Energy Jobs
The promise of a clean energy workforce is not universally acknowledged. While many
policymakers, researchers and labour organizations support investment in the clean energy
economy in order to promote job growth, others remain skeptical of its ability to stimulate
employment. Critics primarily argue against clean energy jobs for two reasons. Firstly, they state
that creating new jobs or transforming existing jobs is a costly process, without enough benefits
to make this employment shift worthwhile. Secondly, they argue that the total jobs destroyed
through investment in clean energy jobs outnumber the total jobs created, resulting in a shrinking
workforce and higher unemployment rates.
4.7.1. High Cost
Critics argue that the transition towards a workforce of clean energy workers will involve
time-consuming and expensive employee training programs, thereby resulting in costs that
outweigh total benefits to society. One downside is that funding such programs will likely
increase federal debt, which ultimately costs taxpayers. Furthermore, some believe that
government spending on green jobs training results in indirect financial costs to both individuals
and businesses. Critics point out that spending on renewable electricity tends to raise the price of

43
power, since wind- and solar-power plants cost more to build and run than coal-fired ones.
Extensive government borrowing also makes it harder for businesses to raise money (“The grass
is always greener”, 2009).
A study by the American Solar Energy Society reveals that transitioning towards green
jobs is in fact a relatively low-key process involving minor changes to existing roles, and does
therefore not require extensive training, financed through government spending. The study states
that “the vast majority of the jobs created by RE&EE are standard jobs for accountants,
engineers, computer analysts, clerks, factory workers, truck drivers, mechanics, etc. In fact, most
of the workers employed in these jobs may not even realize that they owe their livelihood to
RE&EE.” (American Solar Energy Society & Management Information Systems, Inc., 2008).
This smooth transition is expected to hold true for the manufacturing workforce as well. As
stated earlier, the majority of clean energy manufacturing jobs will result from the transformation
and redefinition of existing jobs, thereby requiring minimal investment of time and money for
worker training programs.
In examining the financial cost of transitioning workers into the clean energy economy
labour market, many critics suggest that federal money in particular is better spent on a carbon
capture and storage (CCS) federal program. CCS describes the removal of carbon dioxide directly
from industrial or utility plants and subsequently storing it in secure reservoirs (Herzog & Golomb,
2004). However, this argument only considers the promotion of clean energy jobs as a means to
mitigate the negative effects of climate change. While a clean energy workforce improves the
physical environment, it also offers the larger benefit of reducing unemployment rates and
directing the United States labour market towards long-term sustainability. Federal investment in
CCS is considered less favourable from a job creation perspective, since research shows that this
type of program has a lower job multiplier compared to the average job multiplier for renewable

44
energy technologies (see Table 6: Average Employment for Different Energy Technologies
Normalized to the Amount of Energy Produced).
4.7.1. Job Destruction
Building a clean energy workforce threatens to eliminate existing jobs without direct
replacement. This is particularly true for workers within the traditional fossil fuel industries,
since an increase in the United States’ supply of clean energy will inevitably result in a
corresponding decrease in its supply of coal, natural gas and oil, which will negatively impact
employment. However, as a rule of thumb, extractive industries do not employ many workers. In
an effort to keep labour costs low, there has been increasing mechanization within global
extracting industries over the past several years, which has a corresponding negative effect on
employment figures. Global employment within mining extraction industries has decreased even
with considerable upward shifts in fossil fuel consumption, as Figure 12 illustrates through
examples of countries with substantial mining sectors. Although the United States has recently
experienced a slight increase in oil and gas extraction employment, this sector continues to
represent a minor portion of the country’s total employed labour force (see Figure 13: United
States Oil and Gas Extraction Employment, 1999-2008). Furthermore, employment within
mining and natural resource extraction is expected to decrease by two percent annually through
the year 2016, while total employment within the country is expected to grow by one percent
annually during the same period (U.S. Bureau of Labor Statistics,: Industries at a glance: Natural
resources and mining, 2009). A similar trend exists within the United States’ oil-refining
workforce, as over 40 percent of these jobs disappeared between 1980 and 1999 (Kammen,
Kapadia & Fripp, 2004).

45
Figure 12: Mining Employment in Selected Countries Compared with Average Fossil Fuel Consumption, 1996-2006
-100%
-50%
0%
50%
100%
150%
200%
Chi
na
Rom
ania
Ukr
aine
Slova
kia
South
Afric
a
Uni
ted
Kin
gdom
Mal
aysia
Change in Fossil Fuel
Consumption
Change in Employment
Note: Includes coal and metals mining and oil and gas extraction jobs. Source: United Nations Environment Programme, 2008
Figure 13: United States Oil and Gas Extraction Employment, 1999-2008
0
50,000
100,000
150,000
200,000
250,000
300,000
350,000
1999 2000 2001 2002 2003 2004 2005 2006 2007 2008
0.00%
0.05%
0.10%
0.15%
0.20%
0.25%
Oil and Gas Extraction
Employment
Oil and Gas Extraction as
Percentage of Total Labour
Force
Source: Bureau of Labor Statistics: Employment by major industry sector, 2009

46
To further support the notion that investment in clean energy jobs can do more harm than
good in an employment context, a group of Spanish researchers released a study in 2009 that
examined the effects on employment of government spending on renewable energy technologies.
This research was sparked by President Obama’s unveiling of the American Recovery and
Reinvestment Act (ARRA), which allocated a significant amount of federal funds to developing
its renewable energy sources, in an attempt to model commitments made by other “leading”
countries in this sector, such as Spain. The authors point out that in the interest of job creation,
the United States government should avoid similar policies to those of its Spanish counterparts,
as this country’s federal contributions to the renewables sector has actually destroyed 2.2 jobs for
every one that it has created in the clean energy economy (Alvarez, 2009). This conclusion is
based on the authors’ analysis of how the Spanish government’s contributions to green job
subsidies could have otherwise been spent in the economy, and the estimated employment
impacts of such alternative spending. Through two separate analyses, which compared federal
contributions to green job creation to the average stock of capital per worker and the annual
productivity of workers, these researchers deduced that such spending in fact has negative
employment effects. Although useful to compare federal policies amongst industrialized
countries, the argument presented in this report is weak for several reasons. First, it fails to
account for the indirect job creation potential that results from increased public investment in the
renewable energy sector. Second, it only considers how direct government spending might affect
the American workforce, rather than analyze how a wider scope of government aid – in the form
of tax incentives, for instance – might affect employment. And third, it does not take into
consideration the United States’ existing manufacturing workforce and infrastructure, which is
poised for higher productivity rates and lower upfront capital costs.

47
As shown in the previous section, the allocation of public funds is often at the centre of
debates over the promise of clean energy jobs. The following section examines why investments
by the federal government are so integral to such a shift in employment, and provides an
overview of how private sector investments might also impact this movement.

48
5. Clean Energy Investment in the United States
In the 1970s, the vast majority of capital inflows to clean energy technology companies
were in the form of government research and development (R&D) projects (Pernick & Wilder,
2008). Nowadays, public investment is no longer exclusively directed at stimulating product
innovation through R&D funding. Instead, the United States government is diversifying its
spending and federal policies to target other segments of the clean energy economy, such as
employment. This section shows how the federal government is trying to foster the growth of the
clean energy manufacturing job market in two ways: through direct public spending; and through
the implementation of federal policies that provide incentive for investment by the private sector.
New investments are good indicators of current or future growth within an industry, and
are almost always accompanied by increases in employment. It is therefore important to consider
how the flow of capital within renewable energy industries will impact future job creation.
Government policies are equally important to consider in estimating how the American
manufacturing workforce will benefit from a clean energy agenda. For example, the previous
section showed how influential RES and RPS targets are for stimulating employment in wind
and solar energies. Before evaluating whether disappeared manufacturing jobs can be recreated
or existing manufacturing jobs can be redefined by the wind and solar energy industries, current
federal policies will be discussed.
5.1. Public Sector
The United States government has long been criticized for its unwillingness to
acknowledge the realities of climate change and to diversify its energy sources. However, in the
wake of environmental and economic crises, the United States government appears to be

49
changing its position with respect to clean energy as a means towards a sustainable future.
Federal policymakers have taken considerable steps to reduce the country’s reliance on foreign
oil, to minimize its carbon footprint and to revamp the American workforce. Since 2007, the
government has committed itself to transition from an energy-intensive, dirty economy, to a
labour-intensive, clean economy through investments in green jobs training, the development of
renewable energy technologies, and the implementation of renewable electricity standards. Three
legislative pieces in particular, the Green Jobs Act of 2007, the American Recovery and
Reinvestment Act of 2009 and the American Clean Energy and Security Act (ACESA) of 2009,
are integral to the future of a United States built on clean energy and a strong workforce.
5.1.1. Green Jobs Act (2007)
The Green Jobs Act was introduced as a part of the 2007 Energy Bill, and was designed
to increase the number of American workers who are qualified to work in the clean energy
economy. This Act, currently in its trial stages, allocates federal money towards the gathering of
labour market statistics and the development of curriculum and job training in and for the
renewable energy and energy efficiency industries (Green for All, 2009; see Appendix B for a
more detailed overview). However, critics are quick to outline that the $125 million fund is
insufficient to adequately address workforce issues within clean energy industries. Many
organizations, such as Green For All and the Apollo Alliance, recommend at least doubling this
investment and creating a federal program to direct funds administered under the Act toward the
development of skill standards, training, and clear pathways for advancement for all current and
expected workers in the renewable energy equipment and component manufacturing industries
(Apollo Alliance, 2009).

50
5.1.2. American Recovery and Reinvestment Act (February 2009)
On February 17th, 2009, President Barack Obama signed into law the ARRA, a $787
billion stimulus package which aimed to, amongst other goals, enhance the United States’ energy
independence and stimulate its struggling labour force (Pollin, Heintz & Garrett-Peltier, 2009).
Mr. Obama was very clear in his belief that the ARRA holds the potential to solve his country’s
economic crisis by creating or protecting 3.5 million jobs over the next two years (Recovery.gov,
2009). The Act was intentionally designed to stimulate employment opportunities for domestic
workers by investing in industries based on America’s resources, ingenuity and workers, and by
making it difficult for beneficiaries to outsource these new jobs (Recovery.gov, 2009). The
ARRA provides a boost to American steelworkers, for example, by requiring the use of domestic
steel, iron and manufactured goods in public works.
Total environmental spending in the ARRA amounts to roughly $100 billion, which will
be allocated to nine sectors through five different types of funding: direct public spending,
grants, tax incentives, loan guarantees, and bonds. The largest investments are to be made in the
development of renewable energy technologies, with $25.3 billion committed to this sector.
Since only $27.6 billion of the total $100 billion of federal money will be allocated as direct
public spending, the government hopes that the remaining $72.4 billion will be enough incentive
to stimulate private-sector investments and investments by local and state governments (Pollin,
Heintz & Garrett-Peltier, 2009). Based on this incentive program, a report by PERI and the
Center for American Progress estimates that private-sector and state/local government
investments could total up to $180 billion over a five-year period (Table 13: Environmental
Spending Through the ARRA ($Million).
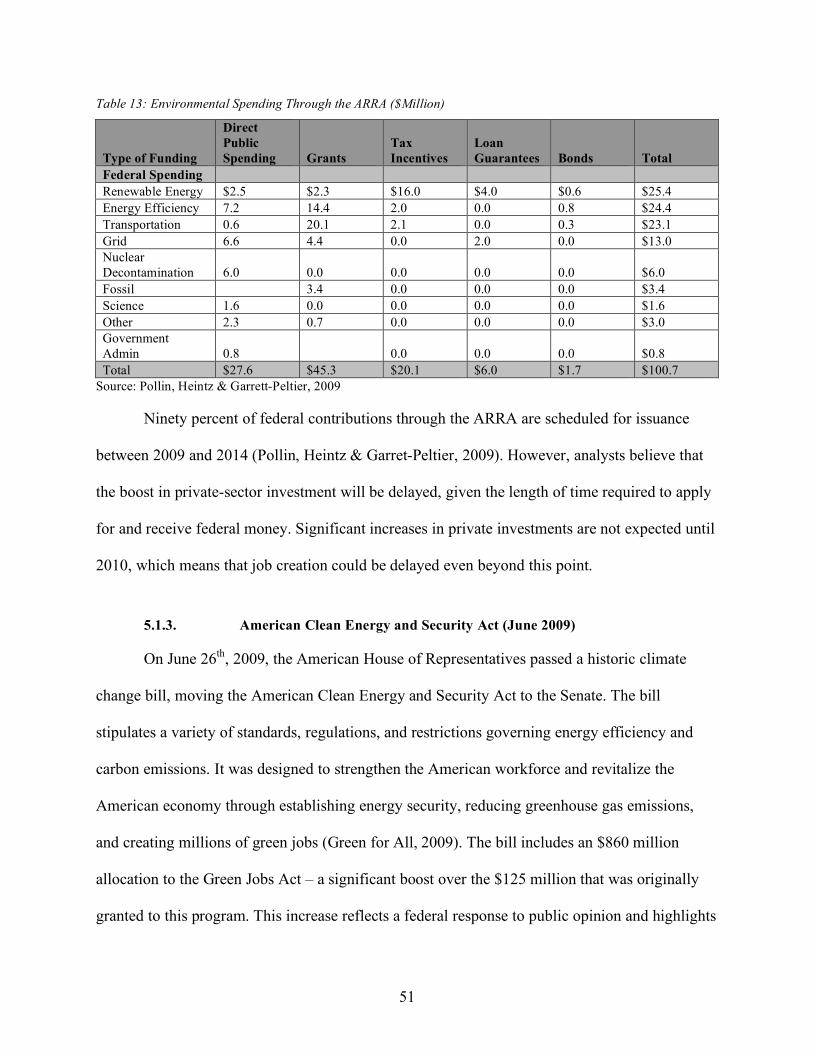
51
Table 13: Environmental Spending Through the ARRA ($Million)
Type of Funding
Direct Public Spending Grants
Tax Incentives
Loan Guarantees Bonds Total
Federal Spending Renewable Energy $2.5 $2.3 $16.0 $4.0 $0.6 $25.4 Energy Efficiency 7.2 14.4 2.0 0.0 0.8 $24.4 Transportation 0.6 20.1 2.1 0.0 0.3 $23.1 Grid 6.6 4.4 0.0 2.0 0.0 $13.0 Nuclear Decontamination 6.0 0.0 0.0 0.0 0.0 $6.0 Fossil 3.4 0.0 0.0 0.0 $3.4 Science 1.6 0.0 0.0 0.0 0.0 $1.6 Other 2.3 0.7 0.0 0.0 0.0 $3.0 Government Admin 0.8 0.0 0.0 0.0 $0.8 Total $27.6 $45.3 $20.1 $6.0 $1.7 $100.7
Source: Pollin, Heintz & Garrett-Peltier, 2009
Ninety percent of federal contributions through the ARRA are scheduled for issuance
between 2009 and 2014 (Pollin, Heintz & Garret-Peltier, 2009). However, analysts believe that
the boost in private-sector investment will be delayed, given the length of time required to apply
for and receive federal money. Significant increases in private investments are not expected until
2010, which means that job creation could be delayed even beyond this point.
5.1.3. American Clean Energy and Security Act (June 2009)
On June 26th, 2009, the American House of Representatives passed a historic climate
change bill, moving the American Clean Energy and Security Act to the Senate. The bill
stipulates a variety of standards, regulations, and restrictions governing energy efficiency and
carbon emissions. It was designed to strengthen the American workforce and revitalize the
American economy through establishing energy security, reducing greenhouse gas emissions,
and creating millions of green jobs (Green for All, 2009). The bill includes an $860 million
allocation to the Green Jobs Act – a significant boost over the $125 million that was originally
granted to this program. This increase reflects a federal response to public opinion and highlights

52
the influential role that the American public will have in the development of future clean energy
policies. Particular focus is being paid to salvaging the country’s manufacturing sector. The bill
promises significant investments in updating manufacturing plants and providing blue-collar
workers with new skills for clean energy manufacturing technologies (Broder, 2009; “House
passes landmark climate change bill”, 2009).
The ACESA is meant to act as a roadmap for the American government’s new clean
energy policies. At the foundation of the ACESA are two provisions that are believed to hold
significant job-creation potential. The first is a cap-and-trade program that aims to reduce carbon
emissions by explicitly limiting conventional fossil fuel production and consumption (Pollin,
Heintz & Garret-Peltier, 2009). The second is a renewable energy electricity standard that would
require electric utilities to meet 20 percent of their electricity demand through renewable energy
sources and energy efficiency by 2020 (“House passes landmark climate change bill”, 2009).
5.1.3.1. Cap-and-Trade Program
The ACESA’s carbon cap-and-trade system provides a schedule for reducing greenhouse
gas emissions through the year 2050. This program would impose costs on businesses that fail to
meet carbon emissions requirements by the specified deadlines, and would reward businesses
that successfully integrate clean energy solutions into their everyday operations. The program
has two implications for employment. First, it might destroy jobs within companies that fail to
meet these emissions standards, and thus face higher costs. However, the American government
hopes that this system will instead stimulate job growth by encouraging companies to subscribe
to renewable energy electricity, thus expanding these industries and creating employment
opportunities.

53
5.1.3.2. Renewable Energy Electricity Standard
Research by the Political Economy Research Institute suggests that in order to meet an
RES of 20 percent by 2020, the United States would have to see a $30 billion annual increase in
investment in clean energy (Pollin, Heintz & Garret-Peltier, 2009). Based on employment
estimates by the Apollo Alliance, presented above, this could result in up to 150,000 full-time
clean energy manufacturing jobs per year, resulting in the creation of 1.65 million clean energy
manufacturing jobs by the year 2020. A report out of Berkeley was recently released in response
to the new federal RES targets. These authors present similar numbers, estimating that this
federal policy will produce more than a million additional jobs than if all of the United States’
energy was supplied by fossil fuels (Kammen & Engel, 2009).
5.2. Private Sector
Private capital, whether in the form of corporate investments, venture capital (VC), debt
equity or the public stock markets, is considered critical to the growth of an emerging sector
(Pernick & Wilder, 2008). The majority of studies relating private sector investments to the
creation of green jobs specifically examine the role of VC money.
5.2.1. Venture Capital
When calculating job growth potential within industries, it is useful to examine the flow
of venture capital money. Generally speaking, inflows of venture capital investments are
reflective of innovation and growth within an industry, which implies job creation through
association. A 2004 report published by the Natural Resources Defense Council and
Environmental Entrepreneurs suggests that for every $100 million devoted to venture capital
investments within clean-tech, 2,700 jobs are created (Burtis, 2004).

54
Since 2006, venture capital investments in businesses that are integral to the clean energy
economy have jumped by an annual average of $1.6 billion (Pew Charitable Trusts, 2009). In
2008, clean venture capital investments accounted for 15 percent of all global venture capital
investments, up from just one percent in 2000 (Pernick & Wilder, 2008; Pew Charitable Trusts,
2009). Clean tech is now considered one of the largest VC investment sectors, and in 2006, was
projected to grow by 56 percent before 2009 (Pernick & Wilder, 2008). Although private
investment numbers were down in the clean-tech sector during the recessionary period of 2009,
it is expected that this sector fared better than the venture capital market as a whole, which saw a
61 percent decrease in investments during the first quarter of 2009 (Pew Charitable Trusts,
2009).
On a national level, U.S.-based VC investments were up 22 percent in 2008, and
American clean energy businesses received $5.9 billion in total investments; a 48 percent
increase over 2007 investment totals (Makower, Pernick & Wilder, 2009; Pew Charitable Trusts,
2009). Perhaps more encouraging is the fact that venture capital investments in the domestic
clean energy economy outnumbered international investments (Pew Charitable Trusts, 2009),
suggesting that the United States’ clean energy economy is outpacing that of other countries’ and
domestic jobs are likely to result.
Of the five categories within the clean energy economy, Clean Energy attracts the most
venture capital money, accounting for 69 percent of all clean venture capital investments
between 2006 and 2008 (see Figure 14: Areas of VC Investment Within the Clean Energy
Economy, 2006-2008). The generation of energy from renewable sources, such as wind and
solar, accounts for over half of clean venture capital investments, totaling 54 percent of all
private financing during this same time period. Combining manufacturing employment figures

55
presented in the previous section, with VC data outlined above, approximately 60,000 to 69,000
clean energy manufacturing jobs should have been created in the wind and solar energy
industries in 2008.
Figure 14: Areas of VC Investment Within the Clean Energy Economy, 2006-2008
8%
69%
14%
9%Energy Efficiency
Clean Energy
EnvironmentallyFriendly Production
Conservation andPollution Mitigation
Source: Pew Charitable Trusts, 2009
This section demonstrates how the creation of clean energy manufacturing jobs largely
depends on investments from the private sector. Without private contributions, the wind and
solar energy industries are unlikely to experience sustainable growth that will secure long-term
employment for the country’s manufacturing workers.
Now that investment numbers, renewable energy industry profiles, employment figures
and policy details have been laid out, the ensuing section will combine this information to
address this paper’s two research questions and draw conclusions for how American
manufacturing workers might transition into the wind and solar energy industries.

56
6. Implications for Manufacturing Workforce and Conclusions
As described in the previous five sections, the creation of manufacturing jobs within the
wind energy and solar energy industries depends on a number of factors: federal policies; direct
government spending; incentive programs that stimulate local and state governments as well as
the private sector; and investment in renewable energy industries from private sources. The
studies reviewed in these sections present an array of estimated future employment numbers for
green jobs in general, and more specifically for clean energy manufacturing jobs. In order to
better understand how these findings might combine with current government policies to
stimulate employment in the United States’ shrinking manufacturing sector, this section creates
an estimate of how many jobs will be created in the manufacturing of components in the wind
energy and solar PV energy industries. Calculations are based on two key assumptions: (1) a 20
percent RES by the year 2020, as stipulated in the ARRA; and (2) an increase in energy
generation capacity proportional to the projected increase in an industry’s revenues.
The estimates presented in Figure 15 are considered conservative, since the model used
does not consider a number of factors that might influence job creation, including:
o Direct spending through the ARRA. The current draft of the ARRA stipulates a
$25.3 billion commitment to renewable energy. However, wind and solar energy
are not the only renewable sources of energy that will benefit from this allocation
of federal funds. Since there is no way of knowing exactly how these funds will
be allocated by sector, it is not included in the current model.
57
o The private sector’s response to investment incentives provided by the
ARRA. Because these incentives reward investment in emerging technologies
and new programs, it is impossible to estimate how the private sector will
respond. Moreover, it is anticipated that the issuance of federal ARRA funds will
be delayed until at least 2015 (Pollin, Heintz & Garrett-Peltier, 2009).
o Manufacturing of components for solar thermal and CSP technologies. No
researchers have examined how manufacturing workers in particular will benefit
from increased investment in these areas. Instead, the presented estimate is based
on increased activity in the manufacturing of solar PV components.
o The United States’ evolving share of world wind energy and solar energy
markets. While many proponents of the United States’ clean energy agenda
believe that it will enable the country to increase its share of global wind and solar
markets, estimating this increase is beyond the scope of this paper. It is therefore
assumed that the U.S. will maintain a constant share of global solar and wind
energy markets.

58
Figure 15: Estimated Impact of a 20% RES by 2020 on Manufacturing Jobs in the Wind and Solar Energy Industries
A report by PERI and the Center for American Progress anticipates that the United
States’ renewable energy sector will need to increase its energy generation capacity by 104,000
MW in order to meet the ARRA’s 20 percent RES target by the year 2020 (Pollin, Heintz &
Garrett-Peltier, 2009). Based on this number, the expected increase in energy generation capacity
for the wind and solar PV energy industries, as outlined in Figure 15, would correspond to an
electricity mix made up of 52 percent wind energy and 18 percent solar PV energy (see Figure
16: Electricity Mix of the United States’ Renewable Energy Supply, 2008 and 2020). These
ratios are substantially higher than those from 2008, which is consistent with growth estimates
for these industries presented earlier in this paper.

59
Figure 16: Electricity Mix of the United States’ Renewable Energy Supply, 2008 and 2020
2008
7%1%
92%
2020
52%
18%
30%
Wind Energy
Solar Energy
Other
The model used in this section suggests that a conservative estimate for the creation of
clean energy manufacturing jobs is approximately 235,000 by the year 2020. This does not seem
like much, considering the United States’ saw over 200,000 manufacturing jobs disappear in
January 2009 alone (Apollo Alliance, 2009). While the development of wind and solar energy
technologies might not create as many new manufacturing jobs for former manufacturing
workers in the United States, there appears to be tremendous potential for transforming and
redefining existing manufacturing jobs. With a new federal commitment to merging the economy
and the environment, many of the country’s dirty manufacturing industries are likely to
experience decreases in production. However, this shift in production does not necessarily have
to be accompanied by a corresponding decrease in employment. As demonstrated by solar
manufacturers at Infinia Corp., there is great potential to capitalize on the underutilization of
both personnel and capital assets within these industries, and transition manufacturing employees
towards work in the clean energy economy.
The successful transition of blue-collar manufacturing workers towards work in green-
collar positions is somewhat influenced by federal training programs and manufacturing labour
unions, which sometimes have the ability to create green-collar employment opportunities for

60
their members. However, businesses competing in the solar and wind energy industries also need
to recognize the value of a manufacturing workforce known for exceptional productivity rates,
and an American economy that is increasingly moving away from dirty industries, and towards
cleaner ones.

61
7. Recommendations for Key Stakeholders
A long-term commitment to a clean energy economy that stimulates the domestic
manufacturing labour market requires action on behalf of several groups within the United
States. Government, businesses, educational institutions, workers and consumers are integral to
the country’s transition towards a sustainable future and the reinvention of its manufacturing
labour force.
7.1. Government
Perhaps the most essential player in developing the clean energy manufacturing labour
market is the United States government. Policies set at the federal level have the ability to
stimulate private sector investment, regulate emissions levels, promote forward-thinking policies
at the state and local levels and create domestic employment opportunities. Although this is an
important stakeholder to consider, discussing the amendment of existing federal policies and the
implementation of new federal policies is beyond the scope of this paper. Instead, the following
discussion will focus on the role of private sector businesses in supporting the clean energy
economy and developing the clean energy manufacturing labour market, either directly or
indirectly.
7.2. Businesses
As demonstrated in the previous section, the bulk of existing federal policies are designed
to provide incentives for clean energy investments by the private sector. These policies have
built a unique economic climate, in which businesses have an opportunity to gain competitive
advantage through investing in the environment and the country’s labour force. Listed below are
62
recommendations for private organizations to capitalize on government offerings and contribute
towards developing a long-term sustainable future for the American economy.
7.2.1. Take Advantage of Public Clean Energy Investments
Businesses can benefit from federal, state and local clean energy initiatives from financial
and personnel perspectives.
Qualifying for financing remains challenging in the current economic climate. Many
businesses may no longer rely on the strength of their historical financial performance to raise
funds or their high credit ratings to qualify for debt financing. Instead, companies should adjust
their business models to match current market trends receiving federal support, such as clean
energy technologies. Additionally, meeting eligibility criteria for federal financing makes an
organization more likely to stay aligned with the most current governmental standards, and
reduces its risk of facing significant future costs as these regulations tighten and become more
costly to businesses. The proposed cap-and-trade program also presents an opportunity for highly
efficient companies to make a profit off of their low emissions levels.
Businesses can provide a boost to the American workforce and improve upon their own
personnel by taking advantage of federal programs, designed specifically to ease the transition
towards employment in the clean energy economy. One such way is by performing workforce
recruitment within green jobs training programs. The federal government has agreed to spend
$500 million on projects that prepare workers for careers in the energy efficiency and renewable
energy sectors (U.S. Department of Labor, 2009). By recruiting these members of the labour
force, companies benefit from the addition of newly trained and often inspired employees, who
possess valuable skills sets that are designed to compete within the intersection between the
environment and the economy. The Green Industries and Occupations program might also be
63
advantageous to the private sector. Through this series of grants, the Department of Labor (DOL)
aims to help redirect the career pathways of target populations, such as auto manufacturing
workers who have been affected by significant automotive-related restructurings (U.S.
Department of Labor, 2009).
7.2.2. Partner with Educational Institutions
Recognizing the inherent opportunity in the clean energy economy, and the need to build
a platform of well-educated and well-qualified worker to ensure its long-term success, several
educational institutions have begun to introduce clean energy college and university programs.
The University of Texas at Austin, for instance, has a Clean Energy Technologies group within
its Mechanical Engineering Department. Part of this group’s mission statement is to “prepare
students for careers in clean energy technologies that will ensure continued economic growth in
the century ahead.” (The University of Texas at Austin, 2009). By partnering with institutions
that are investing in clean energy programs, through co-op initiatives for instance, businesses are
more likely to build an engaged workforce, with tremendous skill and knowledge of these
emerging technologies.
7.2.3. Innovate Based on Workforce Needs
In order to remain competitive in an increasingly global economy, United States
businesses will need to capitalize on domestic strengths, such as the productivity of its
workforce, to gain competitive advantage in international markets. By incorporating a highly
skilled and highly productive manufacturing workforce into the planning process for new
products, companies are more likely to reach economies of scale at a relatively early stage of
production. Infinia Corp. is a perfect example of how businesses can innovate to meet the skills

64
of its available labour force. Throughout the development of its ISS, the company consulted
members of the underutilized auto-manufacturing workforce to ensure that its product design
matched their production skills, and to maximize their feeling of connectedness to the end
product.

65
8. Summary
Successfully transitioning the United States’ shrinking manufacturing workforce towards
employment in the clean energy economy requires action from federal officials and private
businesses. While the wind and solar energy industries hold potential to transform and redefine
traditional blue-collar manufacturing jobs into green-collar jobs, these industries do not represent
a long-term solution to the numerous job losses that have taken place within the American
manufacturing workforce. In order to redefine existing manufacturing jobs, further support is
needed from both the public and private sectors. Continued federal investment in researching and
developing clean energy technologies and training clean energy workers is expected to continue
to drive the growth of the wind and solar energy industries, promote private sector investment
and stimulate domestic employment.
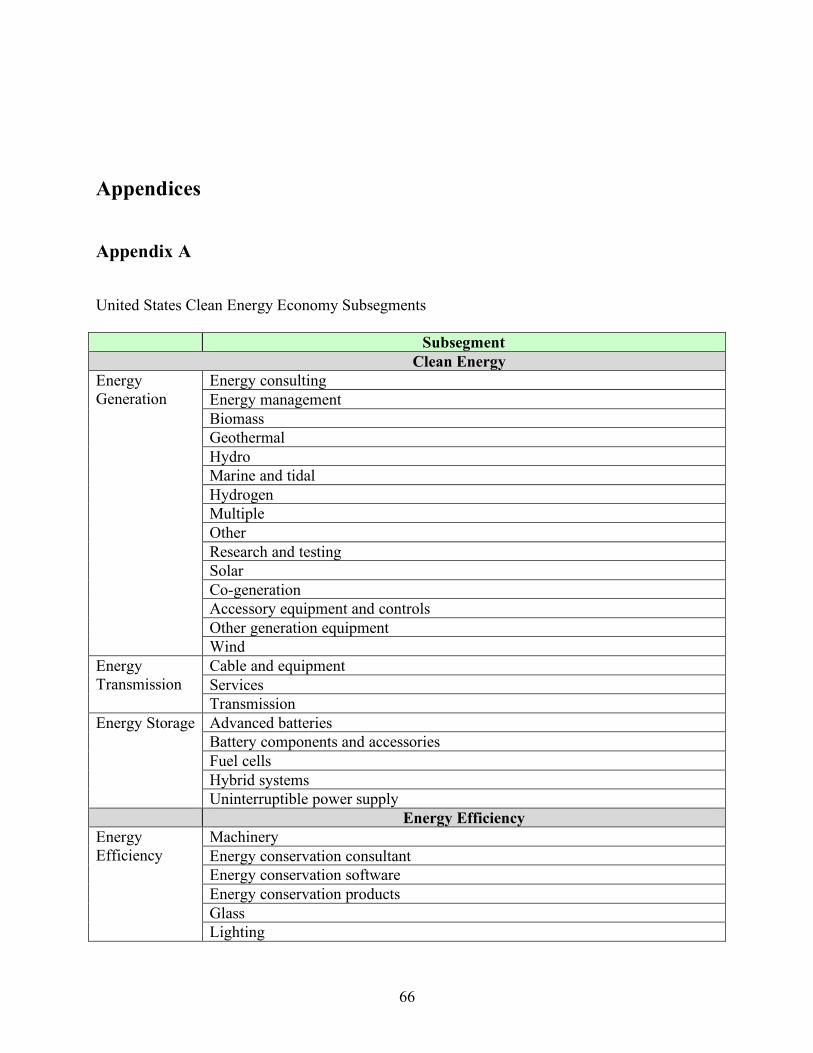
66
Appendices
Appendix A
United States Clean Energy Economy Subsegments
Subsegment Clean Energy
Energy consulting Energy management Biomass Geothermal Hydro Marine and tidal Hydrogen Multiple Other Research and testing Solar Co-generation Accessory equipment and controls Other generation equipment
Energy Generation
Wind Cable and equipment Services
Energy Transmission
Transmission Advanced batteries Battery components and accessories Fuel cells Hybrid systems
Energy Storage
Uninterruptible power supply Energy Efficiency
Machinery Energy conservation consultant Energy conservation software Energy conservation products Glass
Energy Efficiency
Lighting

67
Meters and measuring devices Energy research
Solar appliances and devices Environmentally Friendly Production
Alternative fuels Logistics
Transportation
Motor vehicles and equipment Advanced packaging Industrial surface cleaning Process management
Manufacturing/ Industrial
Monitoring and control Building materials Design and construction Site management
Construction
Real estate and development Aquaculture Land management Supplies and materials
Agriculture
Agribusiness consultant Biofuel Energy
Production Coal gasification and pyrolysis Bio Chemical Nano
Materials
Other Conservation and Pollution Mitigation
Emissions monitoring and control Environmental consulting Environmental remediation
Air and Environment
Cleanup/safety Consulting Recycling
Recycling and Waste
Waste treatment Consulting Pumps Research and testing Water conservation
Waste and Wastewater
Water and wastewater treatment Training and Support
Legal services Marketing/public relations Green firm business portal
Business Services
Staffing services Project financing Finance/
Investment Project insurance

68
Venture capital/private equity Emissions trading and offsets Alternative fuels Geothermal Public education, job training Solar Wind Energy generation Energy storage Green building
Research and Advocacy
Transportation

69
Appendix B
Green Jobs Act of 2007 Note: these are specifications from the original Act, which included $125 million of proposed federal spending. Detailed allocation of federal funds towards green jobs training programs under the new ACESA is not yet available. The GJA authorizes spending for 5 related green job programs, listed below.
1. National Research Program (10 percent of total appropriation; $12.5 million if fully funded)
The Department of Labor (DOL), acting through the Bureau of Labor Statistics, will collect and analyze the labor market data necessary to track workforce trends and identify the types of skills and green jobs we need to train people for. The DOL will use this information to provide technical assistance and capacity building to the training partnerships described below.
2. National Energy Training Partnership Grants (30 percent; $37.5 million if fully funded)
DOL will award competitive grants to non-profit partnerships to carry out training that leads to economic self-sufficiency and to develop an energy efficiency and renewable energy industries workforce. The partnerships must include the equal participation of industry and labor, and may include related stakeholders like local workforce investments boards, educational institutions, and community-based organizations.
3. State Labor Market Research, Information, and Labor Exchange Research Program (10 percent; $12.5 million if fully funded)
DOL will award competitive grants to states to administer labor market and labor exchange information programs, in coordination with the one-stop delivery system. Activities will also include the identification of job openings; the administration of skill and aptitude testing; and counseling, case management, and job referrals. These programs will be administered by the state agency that administers the employment service and unemployment insurance programs and services can only be delivered by state agency staff.
4. State Energy Training Partnership Program (30 percent; $37.5 million if fully funded)
DOL will award competitive grants to states to enable them to administer, via the state agency that administers their employment service and unemployment insurance programs, renewable energy and energy efficiency workforce development programs. It will award grants to partnerships that essentially mirror the national partnerships in their make-up. Priority will be

70
given to states that demonstrate that their activities meet state and national policies associated with energy efficiency, renewable energy and reduction of emissions.
5. Pathways Out Of Poverty Demonstration Program (20 percent; $25 million if fully funded)
DOL will award competitive grants to training partnerships that serve individuals under 200% of the federal poverty line or a locally defined self-sufficiency standard. The partnerships must include community-based organizations, educational institutions, industry, and labor; demonstrate experience implementing training programs and recruit and support participants to the successful completion of training; and coordinate activities with the WIA system. In awarding grants, priority will be given to partnerships that target low-income adults and youth and plan to implement various strategies that enable access to, and successful completion of, training, including ensuring that supportive services are delivered by organizations with direct access to and experience with targeted populations.

71
References
Alvarez, G.C. (March 2009) Study of the effects on employment of public aid to renewable
energy sources. Universidad Rey Juan Carlos. Retrieved July 15, 2009 from
http://www.juandemariana.org/pdf/090327-employment-public-aid-renewable.pdf
American Solar Energy Society & Management Information Systems, Inc. (December 2008)
Defining, estimating and forecasting the renewable energy and energy efficiency
industries in the U.S. and in Colorado. Retrieved July 16, 2009 from
http://www.colorado.gov/energy/in/uploaded_pdf/GreenJobsReportFull.pdf
American Wind Energy Association (2009) Annual wind industry report: Year ending 2008.
Retrieved July 10, 2009 from http://www.awea.org/
American Wind Energy Association (2009) Wind energy basics. Retrieved July 10, 2009 from
http://www.awea.org/faq/wwt_basics.html
American Wind Energy Association (2009) Wind power outlook 2009. Retrieved July 6, 2009
from http://www.awea.org/
Apollo Alliance (March 2009) Make it in America: The Apollo Green Manufacturing Action
Plan. Retrieved June 6, 2009 from http://apolloalliance.org/wp-
content/uploads/2009/03/greenmap_proposal031109.pdf

72
Apollo Alliance & Green For All (2008) Green-collar jobs in America’s cities: Building
pathways out of poverty and careers in the clean energy economy. Retrieved June 29,
2009 from http://www.apolloalliance.org/downloads/greencollarjobs.pdf
Bezdek, R. (2009) Green collar jobs in the U.S. and Colorado: Economic drivers for the 21st
century. Retrieved June 10, 2009 from
http://www.ases.org/images/stories/ASES/pdfs/CO_Jobs_Rpt_Jan2009_summary.pdf
Bezdek, R. (2007) Renewable energy and energy efficiency: Economic drivers for the 21st
century. Retrieved June 10, 2009 from http://www.greenforall.org/resources/renewable-
energy-and-energy-efficiency-economic
Blue Green Alliance (2009) Retrieved June 15, 2009 from http://www.bluegreenalliance.org/
Broder, J. (2009, June 27) House passes bill to address threat of climate change. The New York
Times. Retrieved from http://www.nytimes.com/
Burtis, P. (September 2004) Creating the California cleantech cluster: How innovation and
investment can promote job growth and a healthy environment. Natural Resources
Defense Council and Environmental Entrepreneurs Report. Retrieved July 17, 2009 from
http://www.nrdc.org/air/energy/cleantech/cleantech.pdf
EarthTrends: The Environmental Information Portal (2009) Energy and Resources. Retrieved
June 23, 2009 from http://earthtrends.wri.org/searchable_db/index.php?theme=6
Energy Information Administration (June 26, 2009) Annual energy review 2008. Retrieved July
2, 2009 from http://www.eia.doe.gov/emeu/aer/consump.html

73
Energy Information Administration (2008) Energy consumption by sector. Retrieved June 29,
2009 from http://www.eia.doe.gov/emeu/aer/consump.html
Energy Information Administration (May 15, 2009) United States energy profile. Retrieved May
20, 2009 from http://tonto.eia.doe.gov/country/country_energy_data.cfm?fips=US
Energy Information Administration (May 15, 2009) Petroleum trade. Retrieved May 29, 2009
from
http://www.eia.doe.gov/pub/oil_gas/petroleum/analysis_publications/oil_market_basics/t
rade_text.htm
Energy Information Administration (2009) Renewable & alternative fuel. Retrieved June 5, 2009
from http://www.eia.doe.gov/fuelrenewable.html
European Photovoltaic Industry Association & Greenpeace (September 2006) Solar generation:
Solar electricity for over one billion people and two million jobs by 2020. Retrieved June
13, 2009 from http://www.greenpeace.org/international/press/reports/solar-generation
Gereffi, G., Dubay, K. & Lowe, M. (November 2008) Manufacturing climate solutions: Carbon-
reducing technologies and U.S. jobs, Center on Globalization, Governance &
Competitiveness, Duke University. Retrieved July 9, 2009 from
http://www.cggc.duke.edu/environment/climatesolutions/greeneconomy_Fullreport.pdf
Global Insight (October 2008) Current and potential green jobs in the U.S. economy. Lexington,
MA. Retrieved July 7, 2009 from
http://www.usmayors.org/pressreleases/uploads/GreenJobsReport.pdf

74
Goodman, P. (2009, July 3) Joblessness hits 9.5%, deflating recovery hopes. The New York
Times. Retrieved from http://www.nytimes.com
Green for All (2009) Accessed May 24, 2009 at http://www.greenforall.org/
Herzog, H. & Golomb, D. (2004) Carbon capture and storage from fossil fuel use. Laboratory
for Energy and the Environment, Massachusetts Institute of Technology. Retrieved July
27, 2009 from http://sequestration.mit.edu/pdf/enclyclopedia_of_energy_article.pdf
House passes landmark climate change bill (2009, June 27). Thomson Reuters. Retrieved from
http://www.reuters.com/
Infinia Corporation (2009) Infinia Solar System: Product specification. Retrieved July 24, 2009
from http://www.infiniacorp.com/infinia-solar-system.html
International Energy Agency (2006) Key world energy statistics. Paris, France. Retrieved June 5,
2009 at http://www.iea.org/Textbase/nppdf/free/2006/Key2006.pdf
Kammen, D. & Engel, D. (2009) Green jobs and the clean energy economy. Prepared for the
Copenhagen Climate Council’s Thought Leadership Series. Retrieved July 18, 2009 from
http://rael.berkeley.edu/files/CopenhagenClimateConcill-GreenJobs-TLS-04.pdf
Kammen, D., Kapadia, K. & Fripp, M. (April 2004) Putting renewables to work: How many jobs
can the clean energy industry generate? RAEL Report, University of California,
Berkeley. Retrieved July 12, 200 from http://rael.berkeley.edu/old-
site/renewables.jobs.2006.pdf

75
Makower, J., Pernick, R. & Wilder, C. (March 2009) Clean energy trends 2009. Clean Edge
Report. Retrieved June 4, 2009 from
http://www.cleanedge.com/reports/pdf/Trends2009.pdf
Pernick, R. & Wilder, C. (2008) The clean tech revolution: Discover the top trends,
technologies, and companies to watch. New York: Harper Paperbacks.
Pew Charitable Trusts (June 2009) The clean energy economy: Repowering jobs, businesses and
investments across America. Washington, DC. Retrieved July 2, 2009 from
http://www.pewcenteronthestates.org/uploadedFiles/Clean_Economy_Report_Web.pdf
Pollin, R., Heintz, J. & Garrett-Peltier, H. (June 2009) The economic benefits of investing in
clean energy: How the economic stimulus program and new legislation can boost U.S.
economic growth and employment. Report for the Political Economy Research Institute
and Center for American Progress. Retrieved June 22, 2009 from
http://www.americanprogress.org/issues/2009/06/pdf/peri_report.pdf
Pollin, R. & Wicks-Lim, J. (June 2008) Job opportunities for the green economy: A state-by-
state picture of occupations that gain from green investments. Political Economy
Research Institute Report, University of Massachusetts, Amherst. Retrieved June 22,
2009 from http://www.americanprogress.org/issues/2008/06/pdf/green_jobs.pdf
Recovery.gov (2009) Accessed May 24, 2009 at http://www.recovery.gov/
Solar Energy Industries Association (2009) Solar technology & products. Retrieved June 29,
2009 from http://www.seia.org/cs/solar_technology_and_products

76
Solar Energy Industries Association (2009) U.S. solar industry year in review 2008. Retrieved
June 22, 2009 from
http://www.seia.org/cs/news_research_and_multimedia/news_research_and_multimedia
Sterzinger, G. & Svcek, M. (September 2004) Wind turbine development: Location of
manufacturing activity, Renewable Energy Policy Project Technical Report. Retrieved
July 3, 2009 from http://www.repp.org/articles/static/1/binaries/WindLocator.pdf
Sterzinger, G. & Svcek, M. (January 2005) Solar PV development: Location of economic
activity, Renewable Energy Policy Project Technical Report. Retrieved July 10, 2009
from http://www.repp.org/articles/static/1/binaries/SolarLocator.pdf
The grass is always greener (2009, April 2). The Economist: Economics Focus. Retrieved from
http://www.economist.com/
The University of Texas at Austin (June 2009) Clean Energy Technologies (cet) Group.
Retrieved on July 27, 2009 from http://www.me.utexas.edu/cet/index.php
United Nations Environment Programme (September 2008) Green Jobs: Towards work in a
sustainable, low-carbon world. Washington, DC. Retrieved May 29, 2009 from
http://www.ilo.org/wcmsp5/groups/public/---dgreports/---
dcomm/documents/publication/wcms_098503.pdf
U.S. Bureau of Labor Statistics (2009) Employment by major industry sector. Retrieved June 28,
2009 from http://www.bls.gov/emp/empmajorindustry.htm

77
U.S. Bureau of Labor Statistics (July 2, 2009) Employment situation summary. Retrieved July 6,
2009 from http://www.bls.gov/news.release/empsit.nr0.htm
U.S. Bureau of Labor Statistics (2009) Industries at a glance: Natural resources and mining.
Retrieved July 25, 2009 from http://www.bls.gov/iag/tgs/iag10.htm
U.S. Bureau of Labor Statistics (2009) Major sector productivity and costs index. Retrieved June
4, 2009 from http://www.bls.gov/lpc/#tables
U.S. Department of Energy (May 2008) 20% Wind energy by 2030: Increasing wind energy’s
contribution to U.S. electricity supply. Retrieved June 15, 2009 from
http://www.windpoweringamerica.gov/
U.S. Department of Labor (June 24, 2009) ARRA; Notice of availability of funds and solicitation
for grant applications for State Energy Sector Partnership (SESP) and training grant.
Retrieved July 27, 2009 from
http://www.dol.gov/federalregister/HtmlDisplay.aspx?DocId=22825&AgencyId=15&Do
cumentType=3
Ward, W.A. (2006) Manufacturing jobs. Economic Development Journal, p.7-15.