the clarification of algae from low cell-density culture 3
TRANSCRIPT

1
THE IMPACTS OF REPLACING AIR BUBBLES WITH MICROSPHERES FOR 1
THE CLARIFICATION OF ALGAE FROM LOW CELL-DENSITY CULTURE 2
3
FRANCESCO OMETTOi, CARLO POZZA
ii, RACHEL WHITTON
i, BEATRICE SMYTH
iii, 4
ANDREA GONZALEZ TORRESiv
, RITA K HENDERSONiv
, PETER JARVISi, BRUCE 5
JEFFERSONi and RAFFAELLA VILLA
i,* 6
i Cranfield University, Bedfordshire, UK; 7
ii University of Duisburg-Essen, Essen, DE; 8
iii Queen’s University, Belfast, UK; 9
iv The University of New South Wales, Sydney, AU; 10
* Corresponding author: [email protected] 11
12
Water Res. 2014 Apr 15;53:168-79. doi: 10.1016/j.watres.2014.01.012. 13
14
Abstract 15
Dissolved Air Flotation (DAF) is a well-known coagulation-flotation system applied at large 16
scale for microalgae harvesting. Compared to conventional harvesting technologies DAF 17
allows high cell recovery at lower energy demand. By replacing microbubbles with 18
microspheres, the innovative Ballasted Dissolved Air Flotation (BDAF) technique has been 19
reported to achieve the same algae cell removal efficiency, while saving up to 80% of the 20
energy required for the conventional DAF unit. Using three different algae cultures 21
(Scenedesmus obliquus, Chlorella vulgaris and Arthrospira maxima), the present work 22
investigated the practical, economic and environmental advantages of the BDAF system 23
compared to the DAF system. 99 % cells separation was achieved with both systems, 24
nevertheless, the BDAF technology allowed up to 95 % coagulant reduction depending on the 25

2
algae species and the pH conditions adopted. In terms of floc structure and strength, the 26
inclusion of microspheres in the algae floc generated a looser aggregate, showing a more 27
compact structure within single cell alga, than large and filamentous cells. Overall, BDAF 28
appeared to be a more reliable and sustainable harvesting system than DAF, as it allowed 29
equal cells recovery reducing energy inputs, coagulant demand and carbon emissions. 30
31
Key words: microalgae harvesting; dissolved air flotation; ballasted flotation; floc structure; 32
carbon footprint; 33
34
35

3
1 Introduction 36
Algae harvesting optimisation is a fundamental need for the feasibility of third generation 37
biofuels (biodiesel, bioethanol, biohydrogen and biogas from microalgae) (Lee, 2011). This is 38
most apparent in the cases where algae are grown in wastewater to provide a dual benefit of 39
nutrient removal and biofuel generation. A reduction of the energy and costs associated with 40
this process has the potential to make algae-biofuels more economically competitive in the 41
market (Molina Grima et al., 2003). Furthermore, as carbon emissions are becoming an 42
important factor in decision making in the water/energy sector (OFWAT, 2010), more 43
sustainable technologies are required to provide environmental benefits often measured in 44
terms of reduced carbon footprint. 45
Centrifuges, membrane filtration and flocculation-flotation units are the common harvesting 46
systems applied in large scale culture (Christenson and Sims, 2011). While the energy 47
demand for centrifuges or pressure and vacuum filters ranges between 1 and 8 kWh m-3
of 48
treated water, flocculation-flotation configurations require lower energy inputs (0.1 and 0.5 49
kWh m-3
) which has seen progressing increase in research related to flocculation-flotation 50
systems in recent years (Rawat et al., 2013; Molina Grima et al., 2003). In the Dissolved Air 51
Flotation (DAF) system, micro-bubbles attached to the pre-flocculated algal biomass, float the 52
algae floc to the surface allowing high cell recovery (Rawat et al., 2013; Edzwald, 1993) 53
(Figure 1A). The efficiency of this process, as in all flocculation-flotation treatments, relies on 54
floc formation which is affected by particle morphology, suspension characteristics and 55
coagulant properties (Pieterse and Cloot, 1997). In particular, the extracellular algogenic 56
organic matter (AOM) of the suspension plays a key role in coagulant demand and floc 57
structure and strength (Li et al., 2012; Henderson et al., 2010). AOM is composed 58
predominantly of carbohydrates (hydrophilic) and proteins (hydrophobic) and has a negative 59
charge (≤ -15 mV) depending on the algal strain and its growth phase (Henderson et al., 60

4
2008a). Optimal coagulant doses allow floc formation to be able to resist the shear rate 61
generated during saturated flow injection (450-600 kPa) and have been observed to occur at 62
zeta potential values close to +/- 0 mV where the coagulant is responsible for particle charge 63
neutralisation (Henderson et al., 2008a). 64
A modified DAF system, Ballasted Dissolved Air Flotation (BDAF), has been reported to 65
achieve the same removal efficiency while saving from 60 to 80% of the energy demand, and 66
related CO2 emissions, compared to conventional flotation units (Jarvis et al., 2009). Unlike 67
traditional ballasting techniques where high density granular additives (e.g. microsand) are 68
used to improve sedimentation efficiency (Desjardins et al., 2002), BDAF uses low-density 69
microspheres to support flotation (Figure 1B). Microspheres are added into the system during 70
the rapid mix stage in the same way as conventional ballasting agents, and then incorporated 71
into the floc matrix to drive the flotation process, replacing the use of microbubbles 72
(WO/2006/008474 and US Patent 6890431). Once the algae-bead floc has been harvested, the 73
microspheres can be separated from the algal biomass and recycled into the system. The effect 74
of low density glass microsphere addition on the pre-flocculation process was first 75
investigated by Jarvis et al. (2009), who identified an optimal glass beads concentration close 76
to 300 mg l-1
for harvesting an algae cells suspension of 106 cells ml
-1. Although the author 77
reported a floc size reduction due to the beads addition, the effect of the physical (cells size 78
and shape) and chemical (soluble content) algae characteristics on the strength and structure 79
of the ballasted algae floc was not investigated. In addition, as the beads’ presence allowed 80
less turbulent flotation mechanisms (no saturated flow injection) compared to DAF, there is 81
the potential to identify different optimal coagulation conditions that might generate 82
additional advantages on top of the energy saving. 83
The present work investigates the performance of the BDAF technology applied to three 84
different algae (Scenedesmus obliquus, Chlorella vulgaris and Arthrospira maxima) 85

5
compared to the conventional DAF. Optimal flocculation-flotation conditions were identified 86
in terms of pH and coagulant dose depending on the specific cell morphology and AOM 87
composition of each alga biomass. The impacts of microspheres inclusion into the algal 88
biomass were assessed to compare floc characteristic between the two technologies. In 89
addition, life cycle analysis (LCA) was applied to both DAF and BDAF harvesting option to 90
investigate practical, economic and environmental benefits while moving from one system to 91
the other. 92
93
2 Materials and Methods 94
Algal harvesting batch tests were performed at the stationary growth phase (maximum yield) 95
where the cell morphology is homogeneous and the AOM has the greatest effect on the 96
coagulation. First, the algae cultures were characterised for cell morphology and the AOM 97
composition. Secondly, optimal coagulation conditions were identified in terms of pH, 98
coagulant dose, residual cells, turbidity and zeta potential. Subsequently, the characteristics of 99
the optimal algae floc were investigated for size, strength and fractal dimension. 100
101
2.1 Algal culture 102
The two green algae, Scenedesmus obliquus (276/42) and Chlorella vulgaris (211/BK), and 103
the blue-green alga Arthrospira maxima (1475/9) commonly known as Spirulina, were 104
obtained from the Culture Collection for Algae and Protozoa (CCAP) (Oban, UK). All algae 105
were cultivated in glass tanks illuminated with two fluorescent light tubes, Sun-glo 20W and 106
Arcadia 18W. S. obliquus and C. vulgaris were grown at 18ºC in Jaworski media (50 litres) 107
under constant illumination and mixed using an aquarium pump. A.maxima was grown in 108
Zarrouk media (25 litres) at 28 ºC and 16/8 hours light/dark cycle, with daily mixing by hand. 109
110

6
2.2 Algae suspension and AOM characterisation 111
Cell counting was performed manually using a light microscope with a haemocytometer or a 112
Sedge-wick Rafter as appropriate. Algogenic organic matter (AOM) was characterised and 113
extracted at the stationary growth phase after centrifugation and filtration (1µm) according to 114
the methods described by Henderson et al. (2008a). Samples were characterised for protein 115
content, carbohydrate content and dissolved organic carbon (DOC). Bovine serum albumin 116
(BSA) and glucose were used for calibration of protein and carbohydrate content respectively 117
and read at 750 nm (BSA) and 480 nm (glucose) absorbance using a Jenway 6505 UV/Vis 118
spectrophotometer. A Shimadzu TOC-5000A (Malvern, UK) was used for DOC analysis. 119
Charge density of the algal suspension was measured through zeta potential analysis (Malvern 120
Zetasizer 2000HAS, Malvern, UK) by the addition of an increasing dose of PolyDADMAC 121
(Sigma Chemicals, UK) with a defined charge density value equal to 6.2 meq g-1
(Sharp et al., 122
2006). Total suspended solids (TSS) were measured according to standard methods (APHA). 123
124
2.3 Harvesting performance 125
Jar test experiments were carried out using an EC Engineering DBT6 DAF jar tester (Alberta, 126
CND). Separate experiments were carried out in duplicate at pH 5, 7 and 9, using aluminium 127
sulphate (Al2(SO4)3) as the coagulant. The DAF and BDAF tests were performed according to 128
Henderson et al. (2008b) and Jarvis et al. (2009), respectively. Briefly, 1 litre of algal 129
suspension was rapidly mixed for 2 to 3 minutes at 200 rpm, while varying coagulant doses 130
were added and the pH was adjusted using a 0.1 M HCl (5 M in the case of A. maxima) and 131
0.1 M NaOH solution. Slow mixing (30 rpm) was then maintained for 15 minutes 132
(flocculation period). Within the DAF system, air saturated deionised water buffered with 0.5 133
mM NaHCO3 and 1.8 mM NaCl was supplied at 450 kPa and an equivalent recycle ratio of 134
10%. In the BDAF system, 300 mg l-1
of low-density glass beads (100 kg m-3
) obtained from 135

7
Trelleborg Emerson and Cuming Inc. (Mansfield, USA) were added to the system prior to 136
coagulant addition. Algae flocs were then allowed to float for 10 minutes. Clarified samples 137
were taken from the vessel base and characterised for residual cells, turbidity and zeta 138
potential as previously described. Residual aluminium concentration was measured using a 139
Perkin Elmer AAnalyst800 atomic absorption spectrometer (Waltham, USA). 140
141
2.4 Floc size and breakage 142
Jar testing of both systems was completed under verified optimum conditions of pH and 143
coagulant dose. To create a growth and breakage floc profile, the algal particle size 144
distribution was measured every minute using a Malvern Mastersizer2000 (Malvern, UK). A 145
peristaltic pump was used to maintain a constant flow of 1.5 l h-1
from the jar, through the 146
laser diffraction unit and back into the jar. The suspension was rapidly mixed (200 rpm) for 2 147
minutes while the coagulant dose and pH were adjusted. Flocculation conditions were then 148
maintained at 30 rpm for 15 minutes. Subsequently, the mixing speed was adjusted to 30 rpm, 149
50 rpm, 75 rpm, 100 rpm, 150 rpm and 200 rpm, equivalent to mean velocity gradient (G) 150
values of 7.4 s-1
, 15.9 s-1
, 29.3 s-1
, 45.2 s-1
, 82.9 s-1
, 128 s-1, as determined using a conversion 151
equation provided by the Mastersizer supplier, for an additional 15 minutes. Fractal 152
dimension values (Df) were obtained from a log - log plot of scattering intensity versus wave 153
number considering the gradient of the straight line. Light energy intensity values were 154
converted to raw scattering intensity using the software provided by the Mastersizer supplier. 155
156
2.5 Life cycle assessment 157
Life cycle assessment (LCA) was carried out for hypothetical full scale DAF and BDAF 158
systems having a treatment capacity (Q) of 20000 m3
d-1
, to compare the energy demand, 159
carbon footprint and costs of the two systems. As the focus of this study is the comparison of 160

8
the two harvesting options (DAF and BDAF), the up- and downstream processes are excluded 161
from the analysis as they are assumed to be the same in both cases and therefore have no 162
effect on a comparative analysis. Calculations were performed for (1) operational carbon 163
emissions, based on the operational inputs (electricity, coagulant and glass beads) required to 164
harvest the algae biomasses, and (2) embodied carbon emissions, based on the two major 165
construction differences between the two systems: the saturator for DAF, and the 166
hydrocyclone for BDAF. Carbon emissions are calculated in terms of carbon dioxide 167
equivalent (CO2e), a measure of the total global warming potential of greenhouse gases, using 168
standard carbon coefficient conversion factors (Table 1) and kgCO2e d-1
as the functional unit. 169
The cost assessment was completed using available data on average market prices and 170
information from personal communication with different suppliers. 171
The saturator design was assessed according to the guidelines and parameters reported by 172
Edzwald and Haarhoff (2012) for a volumetric air requirement equal to 7 ml l-1
: packed 173
saturator operating at 500 kPa (saturation gauge pressure), 55 l m-2
s-1
(mass hydraulic 174
loading), 9.95% recycle ratio (Qr/Q), packing depth of 1400 mm and associated energy 175
consumption, out of any secondary losses, equal to 0.013 kWh m-3
of raw water flow (fresh 176
water). Equation 1 was used for the determination of the mass (M) of a cylindrical vessel with 177
hemispherical ends made of stainless steel A36 178
( )
(1) 179
where r is the saturator radius, w the packing depth, P the gauge pressure, the steel density 180
(7800 kg m-3
) and the steel ultimate tensile strength (400Mpa). Christy®
Pak polypropylene 181
pall rings (38 mm, 51 kg m-3
, 140 m2 m
-3) were considered as packing material. 182
Conventional hydrocyclones operate at a pressure value between 50 and 300 kPa (Jun et al., 183
2009) and have a total mass of stainless steel or cast iron, according to available commercial 184
(1)

9
information, between 8 and 45 kg for a design capacity between 10 and 25 m3
h-1
. For the 185
purpose of the LCA, a 150 kPa pressure drop (high efficient sand separator), 18 kg mass 186
(stainless steel) and a treatment capacity equal to 0.02 Q, were assumed. 187
The energy demand for pumping water into both saturator and hydrocyclone units were 188
estimated in terms of water-energy according to Equation 2 189
(2) 190
where Pw is the required daily power (kW), Q the water flow rate (m3 d
-1), the fluid density 191
(1000 kg m-3
), g gravity (9.81 m s-2
), h the pressure drop (m head) and the pump efficiency 192
(70%). 193
The coagulant (aluminium sulphate, Al2(SO4)3) dosage was calculated from the optimal doses 194
determined in the present work. For the glass bead demand, assuming a treatment capacity of 195
850 m3 hr
-1 and optimal bead concentration of 300 mg l
-1, 255 kg hr
-1 of beads were required. 196
However, when the system is in steady state 242 kg hr-1
of beads were recycled inside the 197
system (95% bead recycling efficiency), with 13 kg hr-1
of new beads needed as 13 kg hr-1
198
(1.5 g m-3
) of beads remain in the harvested biomass. 199
200
3 Results and Discussion 201
3.1 Algal suspension characteristic 202
Key differences between the three algae were observed in terms of their surface area, AOM 203
concentration and composition as well as charge density (Table 2). To illustrate, the surface 204
area of S. obliquus was approximately double that of C. vulgaris at 49.5 and 28.3 µm2
cell-1
, 205
respectively. Compared to these two single cells algae, the filamentous A. maxima presented a 206
significantly higher surface area with an average value close to 3720 µm2
cell-1
. In terms of 207
AOM, S. obliquus and C. vulgaris showed comparable DOC concentrations, while A. maxima 208
reported higher values. For instance, the carbohydrate content of the two green algae ranged 209

10
between 4 and 5 mg l-1
, as glucose, while it was seven to ten times higher in A. maxima (38.18 210
± 2.62 mg l-1
as glucose). In contrast, the proteins content was more consistent across the three 211
algae, with S. obliquus at 6.31 ± 1.40 mg l-1
, C. vulgaris at 1.80 ± 0.09 mg l-1
and A. maxima 212
at 5.24 ± 0.1 mg l-1
as BSA. At stationary growth phase the pH value of the algae suspensions 213
was close to 7.5, 7.8 and 9.7 for S. obliquus, C. vulgaris and A. maxima, respectively. The 214
related charge density measurement was equal to 1 ± 0.06, 4.6 ± 0.22 and 0.15 ± 0.02 peq µm-
215
2 for the same algae with zeta potential values equal to or more negative than -30 mV. As the 216
pH value was adjusted to the desire condition, the zeta potential, as well as the AOM 217
concentration, reported little adjustments while clear pH-dependence was observed with 218
charge density measurements. Growing in salt-free media, the charge density of green algae 219
increased with the pH (Wang et al., 2006), from 0.85 to 1.31 peq µm-2
, and from 2.76 to 5.52 220
peq µm-2
, at pH 5 and pH 9, for S. obliquus and C. vulgaris, respectively. In contrast, A. 221
maxima, cultivated in a strong base solution, showed higher charge density values at lower pH 222
(0.28 ± 0.02 peq µm-2
at pH and 70.31 ± 0.01 peq µm-2
at pH 5), congruent with polymeric 223
hydrolysis reducing the charge of the functional groups (Kam and Gragory, 1999). 224
Overall, the three algae showed clear physical and chemical differences, which, according to 225
previous investigations have the potential to impact on the specific harvesting performance 226
(Zhang et al., 2012; Henderson et al., 2010). To compare, in terms of proteins:carbohydrates 227
ratio, our results (Table 2) are in the same range as those reported by Henderson et al., (2010) 228
for equal or similar algae, like Chlorella vulgaris (0.4), Microcystis aeruginosa (0.6), 229
Asterionella formosa (0.2) and Melosira sp. (0.2). As reported by the authors, between close 230
algae strains, a higher proteins:carbohydrates ratio suggests a lower coagulant demand, having 231
higher hydrophobicity and consequent lower charge density. Similarly, larger cells required 232
higher coagulant doses as well as concentrated suspensions and growth media with a salinity 233
concentration higher than 5 g l-1
(Knuckey et al., 2006; Pieterse and Cloot, 1997). Hence, 234

11
from our analysis (Table 2), A. maxima is expected to require the highest coagulant dose 235
compared to S. obliquus and C. vulgaris, having the largest surface area, high charge density 236
and high salinity growth media. Between the two green algae, the higher 237
proteins:carbohydrates ratio and the lower charge density of S. obliquus, suggest this alga will 238
require less coagulant than C. vulgaris. However, the larger surface area and the higher 239
proteins content might have a detrimental effect on the flocculation process (Henderson et al., 240
2010) leaving C. vulgaris with the lowest coagulant demand. 241
242
3.2 Algal removal and coagulant demand 243
High algal cell recovery (≥99%) was achieved using both harvesting systems. However, 244
significant differences for optimal coagulant dose and zeta potential were observed in relation 245
to the algal strain and the pH value used (Figure 2). To illustrate, within the DAF system 246
(Figure 2 – left column), S. obliquus showed complete removal at increasing coagulant 247
demand for pH 5, pH 7 and pH 9 at zeta potential values lower than 15mV, 8mV and -10mV, 248
respectively. Similarly, C. vulgaris coagulant demand increased with the pH, but in all 249
experiments optimal removal occurred at neutral or negative zeta potential values. Despite the 250
same range of zeta potential observed with the green algae, A. maxima showed different 251
behaviour. In DAF conditions, algae separation predominately accrued by sedimentation 252
instead of a flotation mechanism evidenced through visual observation of the flocs being too 253
heavy to be lifted by the air bubbles injected at the tests air to solids ratio used. Hence, after 254
an initial flotation they started to settle, suggesting DAF to be inappropriate for high density 255
flocs (Jarvis et al., 2009). At the highest pH condition, the zeta potential value slightly 256
changed with increasing coagulant doses, remaining close to the initial value of -38 mV which 257
is congruent with dissociation models for coagulants demonstrating that aluminium is in its 258

12
precipitated hydroxide form at pH 9. At pH 7, complete clarification was obtained at -15mV, 259
while at pH 5 the optimal zeta potential value was close to 0 mV. 260
Separation trials performed under a BDAF set up achieved the same cell recovery observed 261
within the DAF experiment but at lower coagulant doses (Figure 2 – right column). For 262
instance, coagulant reductions of 40 %, 14 % and 22 % where observed in the case of S. 263
obliquus when operated at pH 5, 7 and 9 respectively. In contrast, no significant saving was 264
observed with C. vulgaris at pH 5, while 45 % and 75 % reduction was obtained at pH 7 and 265
pH 9, respectively. A. maxima showed removal efficiency below 80 % only at pH 9. At pH 7 266
and pH 5, complete removal was obtained at zeta potential values close to -32 mV and -26 267
mV, respectively. Coagulant savings reached 95 % at pH 5, while remaining between 25 % 268
and 30 % for the other two conditions. 269
Overall, DAF was effective only on S.obliquus and C. vulgaris separation, while BDAF 270
enables an efficient flotation for both green algae and the filamentous cyanobacteria. Both 271
systems reported poor separation (<80 %) at low coagulant doses (< optimal dose), however, 272
with ballasting agents the low efficiency was more due to uncompleted algae-beads floc 273
formation rather than floc breakage as observed during DAF separation consistent with the 274
lower levels of energy dissipation encountered in BDAF (Jarvis et al., 2011). In all 275
experimental conditions, optimum cell recovery occurred at pH 5 and the coagulant demand 276
increased with the pH in all algae suspensions. As organic particles, the optimal coagulation 277
condition of microalgae requires a low pH level (~pH 5-6) where charge neutralisation 278
mechanisms are dominant (Stumm and Morgan, 1962). Similar behaviour was reported in the 279
work of Henderson et al. (2010) where harvesting C. vulgaris at pH 7 required four times 280
more coagulant than at pH 5. In agreement with previous work, conventional flotation 281
achieved complete algal separation as the zeta potential approached neutral or positive values 282
(Henderson et al. 2008b); however, in the ballasted flotation experiments, the same removal 283

13
occurred at more negative zeta potential values as a consequence of the reduced coagulant 284
dosage. 285
Aluminium sulphate was an effective coagulant and residual aluminium concentration in all 286
clarified samples was always equal to or less than 1 mg l-1
. In terms of optimal coagulant 287
demand, the experimental results confirmed initial considerations (§ 3.1) based on cell 288
characteristics and AOM composition and showing values within the range of similar 289
freshwater microalgae (Henderson et al., 2010; Molina Grima et al., 2003; Edzwald, 1993). A. 290
maxima required the highest amount of coagulant (≥ 60 mg Al l-1
, at pH 5, DAF), followed by 291
S. obliquus (25 mg Al l-1
, at pH 5, DAF) and C. vulgaris (2 mg Al l-1
, at pH 5, DAF). Between 292
the two green algae, the larger surface area and the higher proteins contents responsible for 293
protein complexation with aluminium, justify the higher coagulant dosage observed in S. 294
obliquus compared to C. vulgaris despite the lower charge density (Henderson et al., 2010). 295
According to our observations, the BDAF has the potential to generate a more concentrated 296
final algae paste than DAF. After conventional flotation of S. obliquus the solid content of the 297
concentrated biomass was between 1 and 2% in term of TSS (biomass concentrated in the top 298
10 ml of the 1l jar) which is within expected values (Rawat et al., 2013). For the same final 299
volume, the TSS percentage obtained using BDAF was close to 5% due to the presence of the 300
glass beads. Assuming an efficient post flotation beads separation by using a hydrocyclone 301
with 20% (vol.) underflow (Jianghua et al., 2009), the estimated final TSS content would 302
range from 5 to 10%. 303
304
3.3 Floc growth and strength profiles 305
Floc comparison was made based on equivalent media volumetric diameter (d50). Comparing 306
the steady state floc size achieved during chemical (pre DAF) and ballasted flocculation, S. 307
obliquus did not show significant differences as the d50 remained close to 130.3 ± 11.2 µm. In 308

14
contrast, C. vulgaris reported floc size reduction, from 223.6 ± 14.5 µm to 113.8 ± 13.2 µm, 309
while A. maxima floc size grew from 103.3 ± 16.5 µm to 146.3 ± 14.6 µm. Floc size reduction 310
due to the addition of microspheres was first reported by Jarvis et al. (2009), who linked this 311
to a consequent reduction of the floc strength compared to conventional aggregates. However, 312
the peculiarity of A. maxima (filamentous algae) suggests that the physical property of the cell 313
has a key role in the algae-bead floc formation/structure, as observed in conventional algal 314
aggregation (Pieterse and Cloot, 1997). Despite the flocculation condition investigated, S. 315
obliquus and C. vulgaris achieved steady state floc size after 9 to 12 minutes, while A. 316
maxima required less than 4 minutes (Annex A). Accordingly, the C. vulgaris floc growth rate 317
ranged between 10 µm min-1
and 60 µm min-1
during the first 5 minutes and between 1 µm 318
min-1
and 10 µm min-1
afterwards until steady state was reached. No flocculation time-lag was 319
observed in any of the experiments, suggesting that an optimal coagulant dose was provided 320
(Clasen et al., 2000). During the first 2 minutes at a high shear rate (while coagulant was 321
added and the pH level adjusted), an instant floc formation was observed for S. obliquus and 322
A. maxima. Subsequently, the d50 value gradually decreased to a steady state floc size. 323
Using the steady state floc size as an indication of the floc strength (Jarvis et al., 2005), C. 324
vulgaris formed the strongest floc, followed by S. obliquus and A. maxima in the DAF 325
system. Conversely, in the ballasted system, the sequence was reversed with the strongest floc 326
associated to A. maxima, followed by S. obliquus and C. vulgaris. Extending the analysis to 327
the flocs behaviours when exposed to an increasing shear rate (Figure 3), the chemically 328
induced floc of the two green algae showed a clear resistance of up to 16 G (50 rpm). As the 329
shear rate increased, the degradation rates increased. The same correlation was observed using 330
microspheres, but no floc breakage resistance was detected at low shear rates confirming a 331
more fragile floc. 332

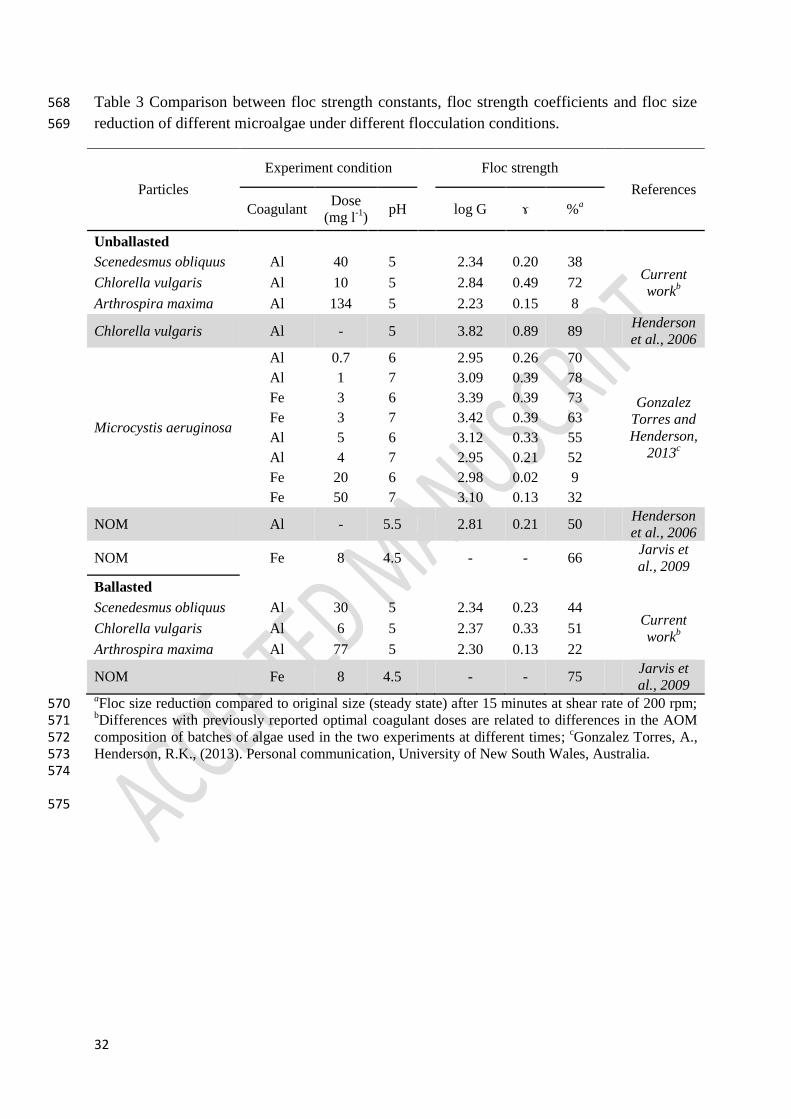
15
A more detailed analysis of the floc strength between the two systems was possible 333
comparing the floc strength coefficient (log C) and the floc strength constant (ɤ), as well as 334
the floc response to increased shear rate exposure. The floc strength coefficient and constant 335
were extrapolated from Figure 3 as described by Jarvis et al. (2005). The first, represented by 336
the y-axis intercept, gives an indication of the floc strength. The second, the gradient of the 337
slope, reveals information on floc breakage mechanisms: floc fragmentation for ɤ values close 338
to 0.5 and floc erosion for values between 1 and 2 (Li et al., 2006). Compared to the 339
conventional flotation system, the addition of glass beads did not change the strength 340
coefficient of S. obliquus (Table 3). However, it generated an 18% reduction with C. vulgaris 341
and 3% improvement with A. maxima. This confirmed previous observations based on steady 342
state floc size, as the beads addition affects the most C. vulgaris’ floc strength and reinforced 343
A. maxima. The calculated floc strength’s constant values indicated fragmentation as the main 344
floc breakage mechanism in both systems, which is consistent with other observations on 345
similar freshwater algae (Table 3). Furthermore, exposed to an increase shear rate, the d50 346
showed clear reduction from values higher than 100µm to lower sizes as a result of floc 347
fragmentation (Figure 4). However, as observed with similar algae (Henderson et al., 2006), 348
the two green algae showed some evidence of an erosion mechanism after 15 minutes of 349
exposure to an increased shear rate, with a small increment in the volume of particle sizes 350
between 4 and 6 µm (Figure 4 A and C). Furthermore, at ballasted conditions, C. vulgaris 351
reported a small increment of large particle sizes (450-650 µm) suggesting floc re-structuring 352
during the breakage (Figure 4 D). This reinforced the possibility that high post-separation 353
beads recovery can be achieved as the algae-beads floc break, enabling beads recycling and 354
algae concentrations at the same time. Efficient bead separation was observed at bench scale 355
at a high shear rate (200 rpm) for all three algae tested. However, the ratio between clearly 356
separated and algae-linked beads was not determined. 357

16
A microscopic analysis of the algae flocs confirmed that beads interact differently with 358
unicellular and filamentous algae (Figure 5). In the first case, the algae cells were distributed 359
around the bead’s surface (Figures 5, A2 and B2) creating a compact structure (Jarvis et al., 360
2009). In contrast, filamentous algae tend to create a more structured agglomeration where 361
microspheres are in a pivoted position (Figure 5, C2). These observations are confirmed by 362
fractal dimension (Df) analysis (Figure 6). When moving from the DAF to BDAF systems, the 363
Df increases from 2.18 ± 0.05 to 2.25 ± 0.03 and from 2.43 ± 0.02 to 2.55 ± 0.04 for S. 364
obliquus and C. vulgaris, respectively, suggesting a similar compact structure. In contrast Df 365
decreased from 2.45 ± 0.08 to 2.25 ± 0.04 in the case of A. maxima endorsing the change in 366
structure (from a compact aggregation to a more open one). Exposed to increasing shear rate, 367
S. obliquus showed Df reduction to 2 ± 0.01 and 2.04 ± 0.04 with and without beads, 368
respectively, from 100 rpm and afterwards (Figure 6). Similarly, the fractal dimension of A. 369
maxima decreased with the shear rate. However, resistance to shear rate of or less than 100 370
rpm was observed only without the presence of beads. In contrast, despite the flocculation 371
condition provided, C. vulgaris Df increased with the shear rate. Visual observations of 372
samples exposed to a high shear rate (200 rpm for 15 minutes) showed an algal re-suspension 373
associated with the presence of a clear glass bead layer on the surface. This supports the 374
algae-bead floc breakage and suggests that the re-structuring mechanism observed within C. 375
vulgaris might affect only the algae cells as microspheres float on the surface allowing 376
successful beads recovery. 377
378
3.4 Life cycle assessment 379
The results from the LCA show that, compared to the traditional DAF technology, the 380
adoption of BDAF allows up to 33 %, 58 % and 44 % carbon emission saving for S. obliquus, 381
C. vulgaris and A. maxima, respectively (Table 4). Most of the carbon savings come from the 382

17
lower coagulant demand associated with the system as the coagulant dosage was always the 383
main contributing factor to operational carbon emissions (Figure 7). In terms of embodied 384
carbon, the BDAF technology allows a saving close to 300 kg CO2e, corresponding to a 40% 385
reduction compared to the DAF system. The contributions of the saturator and the 386
hydrocyclone to the total embodied carbon were nearly equal. However, significant 387
differences were observed between the embodied carbon of the two associated pumps. As the 388
hydrocyclone works at lower pressure and treats 5 times less effluent than the saturator, the 389
BDAF unit required a smaller pump which generated a 66 % CO2e reduction; however, this 390
saving was partially outweighed by the glass beads addition with more than 200 kg of CO2e 391
(50 % of the total BDAF embodied carbon). 392
From the economical perspective, the high price of glass beads (70-80 £ kg-1
) limited the cost 393
reduction. For instance, on a 10 year bases, the conventional life time of a pump (Skongaard 394
and Nielsen, 2004), S. obliquus and A. maxima reported economic benefits equal to 1.2 and 395
18.4 million £, while C. vulgaris was more economically harvested using the DAF unit, 396
because of the lower coagulant demand required compared to the other algae. Overall, 397
compared the conventional DAF system, the BDAF technology was found to be more 398
sustainable in terms of carbon footprint and to offer significant economic savings depending 399
on the algae biomass used and the price of the flouting ballasting agent. 400
401
4 Conclusions 402
Ballasted Dissolved Air Flotation (BDAF) was demonstrated to be a more feasible and 403
sustainable microalgae harvesting option compared to the conventional flotation technology. 404
The adoption of floating microspheres as ballasting agents (1) allowed significant coagulant 405
saving, (2) showed a more reliable technology benefitting from a reduced level of energy 406
dissipation within the flotation chamber, and (3) lowered the overall carbon emissions and (4) 407

18
the process costs. The comparison between the conventional and the ballasted floc structure 408
and strength revealed that the algae-beads aggregation was more affected by the cell’s 409
morphology than the AOM. Single cell algae formed compact and strong algae-bead flocs, 410
while filamentous species resulted in a more expanded and inferior structure. However, the 411
AOM composition was confirmed to be a key parameter for the determination of optimal 412
flocculation conditions, as it affected the coagulant demand in both DAF and BDAF 413
technologies. Further research focused on the microspheres recovery process is required to 414
optimise hydrocyclone configuration in order to guarantee beads recovery and energy/costs 415
savings. 416
Acknowledgments 417
The authors would like to thank the EU Framework 7 project Advanced Technologies for 418
Water Resources and Management (ATWARM - Marie Curie Initial Training Network, No. 419
238273) as well as the Engineering and Physical Sciences Research Council (EPSRC), 420
Anglian Water, Severn Trent Water and Scottish Water for their financial and intellectual 421
support, and Northern Ireland Water where part of the carbon research was carried out. 422
423
References 424
Christenson, L., Sims, R., 2011. Production and harvesting of microalgae for wastewater 425
treatment, biofuels, and bioproducts. Biotechnol. Adv. 29 (6), 686-702. 426
Clasen, J., Mischke, U., Drikas, M., Chow, C., 2000. An improved method for detecting 427
electrophoretic mobility of algae during the destabilisation process of flocculation: 428
flocculant demand of different species and the impact of DOC. Journal of Water Supply: 429
Research and Technology - AQUA 49 (2), 89-101. 430
Desjardins, C., Koudjonou, B., Desjardinis, R., 2002. Laboratory study of ballasted 431
flocculation. Water Res. 36 (3), 744-754. 432

19
Edzwald, J.K., 1993. Algae, bubbles, coagulants, and dissolved air flotation. Water Sci. and 433
Technol.27 (10), 67-81. 434
Edzwald, J.K., Haarhoff, J., 2012. Air saturation. In: Dissolved Air Flotation For Water 435
Clarification, pp. 3.1-3.36. J. Am. Water Works Assoc. 436
Granados, M.R., Acien, F.G., Gomez, C., Fernandez-Sevilla, J.M., Molina Grima, E., 2012. 437
Evaluation of flocculants for the recovery of freshwater microalgae. Bioresourc. 438
Technol. 118, 102-110. 439
Henderson, R. K., Baker, A., Parsons, S. A., Jefferson, B., 2008a. Characterisation of 440
algogenic organic matter extracted from cyanobacteria, green algae and diatoms. Water 441
Res. 42 (13), 3435-3445. 442
Henderson, R. K., Parsons, S. A., Jefferson, B., 2008b. Successful removal of algae through 443
the control of zeta potential. Separ. Sci. Technol. 43 (7), 1653-1666. 444
Henderson, R., Parsons, S. A., Jefferson, B., 2010. The impact of differing cell and algogenic 445
organic matter (AOM) characteristics on the coagulation and flotation of algae. Water 446
Res. 44 (12), 3617–3624. 447
Henderson, R., Sharp, E., Jarvis, P, Parsons, S. A., Jefferson, B., 2006. Identifying the linkage 448
between particle characteristics and understanding coagulation performance. Water Sci. 449
Technol.: Water Supply 6 (1), 31-38. 450
Jarvis, P., Buckingham, P., Holden, B., Jefferson, B., 2009. Low energy ballasted flotation. 451
Water Res. 43 (14), 3427-3434. 452
Jarvis, P., Jefferson, B., Gregory, J., Parsons, S. A., 2005. A review of floc strength and 453
breakage. Water Res. 35 (14), 3121-3137. 454
Jarvis, P., Martin, J., Winspear, T. and Jefferson, B., 2011. Ballasted flotation with glass 455
microspheres for removal of natural organic matter. Separ. Sci. Technol. 46 (16), 2489-456
2495. 457

20
Jianghua, Y., Qitao, Y., Kim, Y., 2009. Performance analysis of a hydrodynamic separator for 458
treating particulate pollutants in highway rainfall runoff. Environ. Eng. Res. 14 (4), 262-459
269. 460
Jun, H., Lian-suo, A., Zhi-quan, W., 2009. Study on application and operation optimization of 461
hydrocyclone for solid-liquid separation in power plant. Proceeding of the World 462
Congress on Engineering and Computer Science (WCECS) San Francisco, USA, 1. 463
Kam, S., Gregory, J., 1999. Charge determination of synthetic cationic polyelectrolytes by 464
colloid titration. Colloids and Surf.159 (1), 165-179. 465
Knuckey, R. M., Brown, M. R., Robert, R., Frampton, D. M. F., 2006. Production of 466
microalgal concentrates by flocculation and their assessment as aquaculture feeds. 467
Aquacult. Eng.35 (3), 300-313. 468
Lee, D. H., 2011. Algal biodiesel economy and competition among bio-fuels. 469
Bioresourc.Technol.102 (1), 43-49. 470
Li, T., Zhu, Z., Wang, D., Yao, C., Tang, H., 2006. Characterization of floc size, strength and 471
structure under various coagulation mechanisms. Powder Technol. 168 (2), 104-110. 472
Li, L., Gao, N., Deng, Y., Yao, J., Zhang, K., 2012. Characterization of intracellular and 473
extracellular algae organic matters (AOM) of Microcystic aeruginosa and formation of 474
AOM-associated disinfection byproducts and odor and taste compounds. Water Res.46 475
(4), 1233-1240. 476
Molina Grima, E., Berlarbi, E. H., Acién Fernández, F. G., Robles Medina, A., Chisti, Y., 477
2003. Recovery of microalgae biomass and metabolites: process options and economics. 478
Biotechnol. Adv. 20 (7-8), 491-515. 479
Pieterse, A. J., Cloot, A., 1997. Algal cells and coagulation, flocculation and sedimentation 480
processes. Water Sci. and Technol. 36 (4), 111-118. 481

21
Pivokonsky, M., Kloucek, O., Pivokonska. L., 2006. Evaluation of the production, 482
composition and aluminium and iron complexation of algogenic organic matter. Water 483
Res. 40 (2), 3045-3052. 484
Rawat, I., Kumar, R.R., Mutanda, T., Bux, F., 2013. Biodiesel from microalgae: a critical 485
evaluation from laboratory to large scale production. Appl. Energy 103, 444-467. 486
Sharp, E.L., Jarvis, P., Parsons, S.A., Jefferson, B., 2006. Impact of fractional character on the 487
coagulation of NOM. Colloids Surface A. 286 (1-3), 104–111. 488
Stumm, W., Morgan, J. J., 1962. Chemical aspects of coagulation. J. Amer. Water Works 489
Assoc. 54 (8), 971-994. Wang, Y., Hubbe, M.A., Sezaki, T., Wang, X., Rojas, O. J., 490
Argyropoulos, D. S., 2006. The role of polyampholyte charge density on its interactions 491
with cellulose, Nordic Pulp and Paper Research Journal 21 (5), 158-165. 492
Zhang, X, Amendola, P., Hewson, J. C., Sommerfeld, M. and Hu, Q., 2012. Influence of 493
growth phase on harvesting of Chlorella zofingienis by dissolved air flotation, 494
Bioresourc. Technol. 116, 477-484. 495
496
DEFRA and DECC, 2013. Greenhouse gas conversion factor repository. Department for 497
Environment, Food and Rural Affairs and Department of Energy and Climate Change. 498
http://www.ukconversionfactorscarbonsmart.co.uk/ (accessed 17 June 2013). 499
Hammond, G., Jones, C., 2011. Inventory of carbon and energy, version 2.0. Sustainable 500
Energy Research Team (SERT), University of Bath. http://www.bath.ac.uk/mech-501
eng/sert/embodied/ (accessed 25 July 2011). 502
OFWAT, 2010. Playing our part: how can we cut greenhouse gas emissions in the water and 503
sewerage sectors? The Water Services Regulation Authority. 504
http://www.ofwat.gov.uk/sustainability/climatechange/prs_web_1007emissions 505
(accessed 19 July 2012). 506

22
Skongaard, A., Nielsen, C.B., 2004. Pump handbook. Grundfos Managmnent 507
http://net.grundfos.com/doc/webnet/mining/_downloads/pump-handbook.pdf (accessed 508
30 September 2013). 509
UM, 2011. CCaLC© manual, version 2.0, carbon calculations over the life cycle of industrial 510
activities. The University of Manchester. http://www.ccalc.org.uk/ (accessed 17 August 511
2011). 512
513
514
515
516

23
Effluent
water
Coagulant
Saturator
Separated
algae
Effluent
water
Separated
algae
Influent
algae
Coagulant
New beads
addition
Flotation tank
(algae-bubbles flocs)
Rapid mix
tank
Flotation tank
(algae-beads flocs)
Rapid mix
tank
Hydrocyclone
B
Flocculation
tank
Flocculation
tank
Recycle beads flow
Saturated air flow
A
Influent
algae
517
Figure 1 Schematic representation of Dissolved Air Flotation (A) and Ballasted Dissolved Air 518 Flotation (B) systems. 519 520
521

24
522
Figure 2 Dose response curve and corresponding zeta potential values for S. obliquus, C. 523 vulgaris and A. maxima, for DAF (right column) and BDAF (left column) system at pH 5 (A), 524
pH 7 (B) and pH 9 (C). 525
526

25
527
Figure 3 Log log plot of steady state floc size vs increasing shear rate plotted as G, with and 528
without microspheres addition. 529
530
531
30
300
3 30 300
Flo
c si
ze, d
50
(µm
)
Mean velocity gradient, G (s-1)
Scenedemsus DAF Scenedesmus BDAF Chlorella DAF Chlorella BDAF Arthrospira DAF Arthrospira BDAF

26
532
Figure 4 Floc breakage profile for DAF (left column) and BDAF (right column) system, of S. 533
obliquus (A and B), C. vulgaris (C and D) and A. maxima (E and F), before and after 534
exposure to a shear rate of 200 rpm. 535
536
537

27
538 Figure 5 Algae floc images ESEM Fei XL30 for S. obliquus (A), C. vulgaris (B) and A. 539 maxima (C) in conventional flocculation condition (1) and in ballasted condition (2). 540 541
542
543

28
544
Figure 6 Fractal breakage profile for DAF (light grey) and BDAF (dark grey) system, of S. 545
obliquus, C. vulgaris and A. maxima exposed for 15 minutes at increasing shear rates. 546
547
548
1
2
3
30 50 75 100 150 200
Frac
tal d
ime
nti
on
(D
f)
Shear rate (rpm)
Scenedesmus DAF Scenedesmus BDAF Chlorella DAF Chlorella BDAF Arthrospira DAF Arthrospira BDAF

29
549
Figure 7 Operational carbon footprint comparisons between DAF and BDAF for the three 550
algae S. obliquus, C. vulgaris and A. maxima. 551
552
553
0
1
2
3
4
5
6
7
8
9
10
DAF BDAF DAF BDAF DAF BDAF
S. obliquus C. vulgaris A. maxima
t C
O2e
d-1
EnergyBeadsCoagulant

30
Table 1 Carbon factors 554
Carbon factors Units Value References
Stainless steel kgCO2e kg-1
3.23
UM, 2011 Cast iron
a kgCO2e kg
-1 1.520
a
Polypropyleneb kgCO2e kg
-1 2.334
b
Aluminium sulphatec kgCO2e kg
-1 0.493
c
Glass beadsd kgCO2e kg
-1 0.900
d Hammond and Jones, 2011
Electricitye kgCO2e kWh
-1 0.484
e DEFRA/DECC, 2013
aThe emission factor for cast iron is for the product at the factory gate;
bThe emission factor is for polypropylene 555
fibres; cThe emission factor for aluminium sulphate is for the product in powder form at the factory gate;
dThe 556
emissions factor is for UK primary glass (cradle-to-gate). Emissions from beads loss were excluded from the 557 analysis as they had no significant impact on the overall balance;
eThe emissions factor is for UK electricity and 558
accounts for emissions from generation as well as for losses in transmission and distribution. 559
560
561

31
Table 2 Characterisation of microlgal suspention used in jar tests. Algae samples were taken 562
at the stationary growth phase and diluted with deionised water, buffered with 0.5 mM 563
NaHCO3 and 1.8 mM NaCl, to reach the reported concentration. 564
Parameter S. obliquus C. vulgaris A. maxima
Alg
ae
susp
ensi
on
Concentration (cells ml-1
) 2x10⁶ ± 1x10
5 2x10
6 ± 1x10
5 2x10
4 ± 1x10
3
Particle shape spindle spherical filament
Particle sizea (µm) 6 w; 10.5 l 4.5 Ø 4.5 Ø; 300 l
Surface areaa ( µm
2 cell
-1) 49.5 28.3 3719.9
Solids (mg TSS l-1
) 174 ± 14 112 ± 14 117 ± 19
Turbidity (NTUb) 124 ± 5 40 ± 8 105 ± 10
pH 7.5 ± 0.2 7.8 ± 0.1 9.7 ± 0.2
Zeta Potential (mV) -34.6 ± 6.0 -30.5 ± 1.2 -44.2 ± 7.8
Charge density (peq cell-1
) 0.050 ± 0.003 0.130 ± 0.006 0.564 ± 0.061
AO
M DOC (mg l
-1) 3.81 ± 1.81 4.77 ± 0.59 100.5 ± 0.70
Proteins:DOC ratio 1.91 ± 0.76 0.40 ± 0.33 0.39 ± 0.04
Carbohydrates:DOC ratio 1.69 ± 0.77 0.92 ± 0.25 0.05 ± 0.01
Poteins:Carbohydrates ratio 1.24 ± 0.06 0.43 ± 0.16 0.13 ± 0.01 aaverage value;
bNephelometric Turbidity Unit. 565
566
567
32
Table 3 Comparison between floc strength constants, floc strength coefficients and floc size 568
reduction of different microalgae under different flocculation conditions. 569
Particles
Experiment condition Floc strength
References
Coagulant Dose
(mg l-1
) pH log G ɤ %
a
Unballasted
Scenedesmus obliquus Al 40 5
2.34 0.20 38 Current
workb
Chlorella vulgaris Al 10 5
2.84 0.49 72
Arthrospira maxima Al 134 5
2.23 0.15 8
Chlorella vulgaris Al - 5
3.82 0.89 89
Henderson
et al., 2006
Microcystis aeruginosa
Al 0.7 6
2.95 0.26 70
Gonzalez
Torres and
Henderson,
2013c
Al 1 7
3.09 0.39 78
Fe 3 6
3.39 0.39 73
Fe 3 7
3.42 0.39 63
Al 5 6
3.12 0.33 55
Al 4 7
2.95 0.21 52
Fe 20 6
2.98 0.02 9
Fe 50 7
3.10 0.13 32
NOM Al - 5.5
2.81 0.21 50
Henderson
et al., 2006
NOM Fe 8 4.5
- - 66
Jarvis et
al., 2009
Ballasted
Scenedesmus obliquus Al 30 5
2.34 0.23 44 Current
workb
Chlorella vulgaris Al 6 5
2.37 0.33 51
Arthrospira maxima Al 77 5
2.30 0.13 22
NOM Fe 8 4.5 - - 75 Jarvis et
al., 2009 aFloc size reduction compared to original size (steady state) after 15 minutes at shear rate of 200 rpm; 570
bDifferences with previously reported optimal coagulant doses are related to differences in the AOM 571
composition of batches of algae used in the two experiments at different times; cGonzalez Torres, A., 572
Henderson, R.K., (2013). Personal communication, University of New South Wales, Australia. 573 574
575

33
Table 4 Carbon footprint and cost analysis of the DAF and BDAF systems. 576
Inputs Materials Carbon emissions
a Costs
DAF BDAF DAF BDAF
Embodied kg CO2 e £capital costs
Saturator Stainless steelb 48 - 15000
c -
Packing material Polypropylened 119 - 800
e
Hydrocyclone Stainless steelf - 58 - 3000
c
Beads Glassg - 230 - 15300
h
Pumpi Cast iron 623 208 7500 1500
Subtotal 790 496 23300 19800
Saving 295 3500
Operational kg CO2e d-1
£ d-1
Energyj Electricity 317 12 92 3
Coagulant (S. obliquus) Aluminium
sulphatek
2485 1864 4032 3024
Coagulant (C. vulgaris) 621 373
1008 605
Coagulant (A. maxima) 8324 4783 13507 7762
Beads Glassg - 12 - 780
h
Saving (10 year life time) t CO2e millions £
S. obliquus 3340 1.2
C. vulgaris
1979
-1.1
A. maxima 13996 18.4 acalculated applying the carbon factors reported in table 1;
b15 kg of stainless steel calculated from 577
equation 1; caverage market price for full operating unit (online search);
d51 kg polypropylene 578
according to the information provided by Christy®Catalytics for Christy Pak 1 Polypropylene Pall 579 Rings;
epersonal communication from supplier Christy®Catalytics;
f18 kg as reported in the material 580
and methods (§ 2.5); gcalculations based on the information reported in the material and method (§ 581
2.5); hpersonal communication from supplier Trelleborg Offshore, Boston;
icarbon emissions based on 582
410 kg and 137 kg of cast iron DAF and BDAF respectively according to commercial information 583 provided by Grundfos CAPS (costs were also provided);
jelectricity costs of 0.14 £ kWh
-1 (average UK 584
value); kcarbon emissions based on data reported in table 3, while costs are based on average market 585
prices (Granados et al., 2012). 586 587
588

34
589
Figure A.1 Floc growth and breakage profile for DAF (left column) and BDAF (right column) 590
system, of S. obliquus (A and B), C. vulgaris (C and D) and A. maxima (E and F) at 591
increasing shear rate (on support of paragrph 3.1) 592
593
594