the city of plantation, fl
TRANSCRIPT

THE CITY OF PLANTATION,
FL
POPULAR ANNUAL FINANCIAL REPORT
FOR FISCAL YEAR ENDED SEPTEMBER 30, 2020
FY 2020 Popular Annual Financial Report
A MESSAGE FROM THE FINANCE DIRECTOR
Dear City of Plantation Residents,
We are pleased to present the City of Plantation’s Popular Annual Financial Report (PAFR) for thefiscal year 2020. This report is intended to present a condensed overview of the City’s financialposition, financial practices and details outlining how City revenues were generated and spent.
Financial information in this report is derived from the independently audited financial statementsthat are a part of the City of Plantation’s Comprehensive Annual Financial Report for the year endedSeptember 30, 2020. We are proud to report that the City has been awarded a Certificate ofAchievement for Excellence in Financial Reporting by the Government Finance Officers Association foreight consecutive years.
Unlike the Comprehensive Annual Financial Report , the PAFR is not an audited document and doesnot include details by fund or other disclosures required by GAAP (Governmentally AcceptedAccounting Principles). Therefore, the PAFR is not intended to present a complete financial picture ofthe City in accordance with GAAP. This report is a reflection of our effort to keep you informed abouthow your tax dollars are being spent in a simple, non-technical format. For more in-depthinformation, the Comprehensive Annual Financial Report is available online at www.plantation.org.
A special thank you to the dedicated Finance Team whose hard work and diligence made thisdocument possible.
As you review this Popular Annual Financial Report, please feel free to share any questions, concernsor recommendations you may have by contacting us at [email protected].
Respectfully,
Anna C. Otiniano
Finance Director, CGFO

Table of Contents
FY 2020 Popular Annual Financial Report
Prepared by: Financial Services Department
INTRODUCTION
City Awards and Certifications 1
Governmental Structure 2
City Mission, Vision, Values and Goals 3
Social Media 4
History and Locality 5
Information and Demographics 6
CITY FINANCIALS
Cash and Investments 7
Property Taxes City Wide 8 General Fund 9 Special Districts 10
Government-wide Balance sheet 11
Government-wide Statement of Changes In Net Position 12
Governmental funds – Revenues 13
Governmental funds – Expenditures 14
General fund – Revenues 15
General fund – Expenses 16
Utility Services 17
MISCELLANEOUS
Making a Difference 18

City Awards and Certifications
FY 2020 Popular Annual Financial Report
Page 1
PAFR Award
The City of Plantation received the prestigious PopularAnnual Financial Report (PAFR) Award for fiscal year2019. This is the City’s second award and we are veryproud of this achievement. The PAFR Award is a nationalaward recognizing conformance with the higheststandards for preparation of state and local governmentspopular reports.
COA Award The City also received the
Certificate of Achievement for Excellence in Financialreporting award for fiscal year 2019. This is the eightconsecutive year to receive this honor. In order toreceive this award recipients must publish an easilyreadable and efficiently organized comprehensiveannual financial report.
DistinguishedBudget Award
The City of Plantation received the Distinguished BudgetAward for its FY2020 Budget. It is the seventhconsecutive year to receive this award. In order toreceive this award recipients must produce budgetdocuments of the highest quality that reflect theguidelines of the National Advisory Board of State andLocal Governments and GFOA’s best practices.
City of Plantation is a Green Local Government
The City continues to be a Green Local Government with its endeavors to lessen the impact on the environment, and reduce, reuse or recycle many of the items we rely upon everyday.
The Plantation Police Departmentreceived its seventh reaccreditationaward from the Commission for FloridaLaw Enforcement Accreditation (CFA).
The Plantation Police Department alsoreceived its seventh reaccreditationaward from the Commission onAccreditation for Law EnforcementAgencies (CALEA), the International goldstandard for public safety agencies.
The Plantation Fire Department hasbeen classified by the Insurance ServiceOffice (ISO) as a Class 2 Department.The City is one of only 35 Class 2departments in the State of Florida.
Plantation's Parks & Recreationdepartment was awarded the"Excellence in Sport TourismAward" by the Greater FortLauderdale Convention & VisitorsBureau. The parks, facilities,tournaments, events and athleticprograms help support our localbusinesses.
The City of Plantation’s Parks & Recreation Departmentjoins the ranks of Elite Park and Recreation Agenciesacross the country be earning accreditation through theCommission Accreditation of Parks and RecreationAgencies (CAPRA) and the National Recreation and ParksAssociation (NPRA). CAPRA accreditation is the onlynational accreditation for parks and recreation agenciesand is a measure of an agency’s overall quality ofoperation, management and service to the community.
This mark of distinctionindicates that an agencyhas met rigorousstandards related to themanagement andadministration of lands,facilities, resources,programs, safety andservices.

Governmental Structure
FY 2020 Popular Annual Financial Report
Page 2
CITIZENS OF PLANTATION
MayorLynn Stoner
Denise Horland
Erik Anderson Jennifer Andreu
Timothy J. FadgenNick Sortal
CITY ADMINISTRATION
Jason NunemakerChief Administrative Officer
Anna C. Otiniano, CGFOFinancial Services Director
Susan SlatteryCity Clerk
Howard HarrisonPolice Chief
William GaleBuilding Director
Steve RodgersPublic Works Director
Phillip GoodrichParks & Recreation Director
John MontefuscoInformation Technology
Director
Donald ToddFire Chief
Denese EdsallHuman Resources Director
Samira ShalanCity Engineer
Daniel HolmesPlanning & Zoning Director
Charles SpencerInterim Procurement Director
Monika KnappLibrary Director
Steven UrichUtilities Director
City Council

To deliver customer services that meet customer expectations and
foster a dynamic work environment that encourages creative and
innovative thinking and responsible and ethical behaviors.
To continually improve citizens’ quality of life through the provision of value-
driven, quality public services and facilities that the reflect the expectations of Plantation residents and the business
community.
To develop joint relationships with the community to protect
and preserve the welfare, health and safety of the
community.
To encourage maintainable and thoughtful development, social
consciousness and environmental planning aimed at
quality of life
To maximize opportunities for social and economic
development while retaining an attractive, sustainable and secure environment for the enjoyment
of residents and visitors.
Through responsible and professional leadership and in partnership with its residents,
the City will continually strive to improve the quality of life for all residents living and working in
this community.
The City’s goals, objectives, and programs are strategically planned to help achieve
the City’s mission..
FY 2020 Popular Annual Financial Report
Page 3

Social Media
Listed below are the many communication tools you can use to stay connected and “be in the know”
FY 2020 Popular Annual Financial Report
Follow the Parks & Recreation department on Instagram atPlantationparks or Follow @PlantationFLA
Follow us on Facebook:
Follow the City, the Parks & Recreation department, the Fire department, the Police department, and the Helen B. Hoffman Plantation Library on: Twitter @plantationFLA, @plantationparks, @helenbhoffman, @plantationfire, and @plantationpd.
City of PlantationPlantation Parks & RecreationPlantation Aquatics ComplexVeltri Tennis CenterPlantation Fire DepartmentPlantation Utilities & Public Works
The City’s website, Plantation.orgVisit Plantation.org for information on City departments, notices, permits, programs, events and much more.
[email protected] answers to most City-related questions, or concerns, please use our official City email address, [email protected].
EverbridgeOur newest citizen notification tool! Receive emergency notifications that affectour community via phone, email, Facebook, Twitter, or text to subscribe. Downloadthe free app from Google Play (Android) or the App Store (iOS).
Plantation’s e-newsletter, Plantation Now! To receive the next issue, send your name and email address to [email protected].
Plantation Adult Athletics : For registration, schedules, game results, league standings and more visit www.plantationadultathletics.com
Page 4
Stay Connected to the City!

History and Locality
Plantation, Florida is geographically centered inBroward County in South East Florida, bordered onthe north by Palm Beach County and to the south,Miami-Dade County. In 1931, Frederick Petersmoved his family to South Florida to escape theharsh winters of the Midwest. Mr. Peters bought10,000 acres along State Road 7/441, which hadbeen built to connect Miami-Dade to Palm Beachcounty. No other development existed this farwest. The idea of this development was to enticepeople to buy ‘long acres’, which were one-acrelots with 2/3 of the land dedicated to gardens andfruit trees. This was an effort to create a co-opfarmer's market.
With a budget of $1,288 and less than 500residents, the City incorporated on April 30, 1953.A Police Department was not organized until 1955shortly followed by the Plantation Volunteer FireDepartment in 1957. The City logo contains theLatin phrase “E VASITATE, HAEC URBS” whichtranslates to “Out of the Wilderness, this City”.
FY 2020 Popular Annual Financial Report
Today, the City of Plantation is rich in amenities, acompetitive business environment and beautifullylandscaped parks and streets. It can be consideredan urban environment intermixed with a‘hometown’ lifestyle encompassing nearly 23 squaremiles and boasting a population of approximately95,141. The City provides a full range of servicesincluding general government: planning, zoning, andadministrative services; public safety: police, fire,fire/rescue services, building; water and wastewaterservices, public/street improvements, and cultureand recreation.
The City is easily accessible from major roadwaysconnecting the North and South (I95 and Florida'sTurnpike), East and West (I75 and 595). It is only 15minutes from the Fort Lauderdale InternationalAirport and deep-water seaport, Port Everglades.
Page 5
The City of Plantation offers its residents the best of both worlds, with its close proximity to Fort
Lauderdale it is able to maintain its suburban charm and character, from its palm-tree-lined avenues, lush, green landscaping and beautiful architecture. Stop by
the City of Plantation, where the grass is greener.

FY 2020 Popular Annual Financial Report
Information and Demographics
City Demographics Principle Employers
Public Safety
Educational Facilities
Public Schools:Elementary 6Middle 2High School 2
Private Schools: (Primary & Secondary) 7Charter Schools 3Colleges/Universities 1
Page 6
Police Protection:Sworn Police Officers 178K-9’s 3Fire Protection:Rescue Personnel 77Volunteer Firefighters’ 170Fire Stations 6
Principle Property Tax Payers
Taxable assessed value (in millions)Broward Mall, LLC $136,296TR Royal Palm Corp 121,619Solero 136 LLC 109,041Florida Power & Light, Co. 98,957ST Tropez Property Owner, LLC 90,633Magic Leap Inc 82,601Camden Summit Partnership, LP 82,531DDR Southeast Fountains, LLC 78,536PR/Stiles Plantation Apartments 71,464TRPF Laurels at Jacaranda, LLC 71,343
For additional information visit our website at www.plantation.org
# of employeesMotorola 2,000Castle Group 1,443Broward County 1,432DHL 1,400National Beverage 1,300Magic Leap 1,200Columbia Hospital 900City of Plantation 800University of Miami 600Plantation General Hospital 600
Entertainment & Recreation
Unemployment Rate Trend
FY 2020 5.8%FY 2019 2.4%FY 2018 2.5%FY 2017 2.8%FY 2016 4.0%
Parks and Playgrounds 42Golf courses 6Libraries 2
Population, as provided in the Comprehensive Annual Financial Report:2020 95,1412015 91,4542010 84,955Resident Statistics:Median Ag (yrs) 40.2Median Household Income $69,531Median House Value $386,306Percentage of Family Households* 67.6%Percentage of Non-family Households* 32.4%*Source: American Fact Finder-Census

FY 2020 Popular Annual Financial Report
The primary objective of the investment managementpolicy of the City is for the safety of the principle,maintenance of liquidity and maximization of returnson investments. This policy is designed to safeguardthe City’s funds, ensure the availability of operatingand capital funds when needed, and provide for aninvestment return competitive with comparable fundsand financial market guides.
The City of Plantation is authorized to invest in U.Sgovernment securities; savings and loan associations;deposits in state-certified qualified public depositories;investment-grade obligations of state, provincial, andlocal governments and public authorities; money-market mutual funds regulated by the Securities andExchange Commission and whose portfolios consistonly of domestic securities; Local Government SurplusFunds Trust Fund or any intergovernmental investmentpool authorized through the Florida InterlocalCooperation Act; and repurchase agreements forovernight investments authorized through bankagreements.
Pooled cash and pooled investments are an investmenttool employed by the City that maximizes earningpotential by investing large amounts of idle cash forshort periods of time. The City maintains pooledaccounts in each of its funds except for pension trustfunds, some debt service funds and any Bond projectfunds that have funding from bond proceeds. Eachfunds’ equity in the City’s pooled accounts isconsidered to be a cash equivalent since the funds candeposit or effectively withdraw cash at any timewithout prior notice or penalty. Income earned fromthe pooling of investments is allocated to therespective funds quarterly.
Cash and Investments
Page 7
$-
$1,000,000
$2,000,000
$3,000,000
$4,000,000
$5,000,000
$6,000,000
$7,000,000
$8,000,000
$9,000,000
2016 2017 2018 2019 2020
INVESTMENT INCOME FY 2016 - 2020

FY 2020 Popular Annual Financial Report
Ad Valorem Taxes are authorized by Florida Constitution and are capped at 10 mills for local governments.Ad valorem is a tax levied on the assessed value of real and personal property located within the City. PerFlorida Statutes, ad valorem revenues are budgeted at the millage rate multiplied by the taxable value,less 4% discount for early payment and adjustments to assessed values determined by the ValueAdjustment Board.
The Ad Valorem Tax Rate (also known as the millage rate) is adopted on an annual basis and is equivalentto one dollar of taxes per $1,000 of estimated taxable assessed value determined by the Broward CountyProperty Appraiser Officer. A tax rate of one mill produces one dollar of ad valorem revenue for every$1,000 of taxable property value. The adopted millage rate for the fiscal year 2020 was 5.8000 mills.
Page 8
Property Tax
0.00001.00002.00003.00004.00005.00006.00007.00008.0000
2016 2017 2018 2019 2020
PROPERTY TAX MILLAGE RATES
City County Schools N Hospital District Childrens Services SF Wtr Mgmt FL Inland Navigation
2016 2017 2018 2019 2020
46,301,014 48,363,045
54,156,633 57,477,973
59,906,499
$-
$10,000,000
$20,000,000
$30,000,000
$40,000,000
$50,000,000
$60,000,000
$70,000,000
mill
ions
PROPERTY TAX REVENUE FY 2016-2020

FY 2020 Popular Annual Financial Report
Page 9
General Fund Property Tax
Ad valorem revenue is the largest revenue source for the General Fund. In FY 2020, ad valoremrevenue was $53,976,869 representing approximately 40% of the total general fund revenues.

FY 2020 Popular Annual Financial Report
Page 10
Special Districts Property Tax
Special Districts are authorized by State statute to levy Ad Valorem Taxes and adopt an annual millage rate.Plantation Gateway Development District, which was established in 1990, and the Plantation MidtownDevelopment District, which was established in 2002, are Plantation’s two special districts. Continued growthand increases in property values have aided in these districts showing favorable increases in revenues over thepast years.
2016 2017 2018 2019 2020
416,959 448,390 450,951 472,076 503,460
1,255,387 1,273,170 1,258,415 1,312,886 1,364,678
Special Districts Property Tax RevenuesFY 2016-2020
Plantation Gateway Plantation Midtown
The charts on this page show the revenues, comparatively, of each district, and millage rates for the last five years.

FY 2020 Popular Annual Financial Report
Plantation’s Balance Sheet presents information on all assets and liabilities, with the differencereported as net position. Increases or decreases in net position over time may serve as a usefulindicator of whether the financial position is improving or deteriorating. In FY2020, the City had anoverall increase in net position. The Total Net Position of $342,870,010 is an increase over fiscal year2019 by $25,942,921 and is comprised of three categories:
Net Investment in Capital Assets: Capital assets are those assets whose value is greater than$1,000 and whose life is greater than one year. These assets are reported net of accumulateddepreciation and outstanding debt (if any) used to purchase these assets. Net investment inCapital Assets increased by $9,154,372 when compared to FY2019.
Restricted Net Position: These are assets having an external restriction placed on them.Unspent bond proceeds, gas tax, and impact fees are just a few. Restricted Net positionamounts to $34,429,933, which is a slight increase from FY22019 by $3,184,325.
Unrestricted Net Position: Unrestricted net position reflects the City’s net worth and theresources available to finance on-going operations. In FY2020 the City’s unrestricted netposition increased by $13,604,224.
Government-wide Balance Sheet
Governmental activities are those primarilysupported by tax dollars and for FY 20 netposition increased $12,041,720 from theprior year.
Net Investment in Capital Assetsincreased $6,498,949.
Restricted Net Position increased$3,065,256.
Unrestricted Net Position deficitdecreased by $2,477,515.
Business-type activities provide goods andservices for a fee (Utilities, Stormwater,etc.) and are intended to be self-supportingthrough the fees for those goods andservices. These activities increased in netposition from last year by $13,901,201.
Net Investment in Capital Assetsdecreased by $2,555,423.
Restricted Net Position decreased by$119,069.
Unrestricted Net Position increased by$11,126,709.
Page 11

FY 2020 Popular Annual Financial Report
Government-wide Statement of Changes in Net Position
Page 12
The following Government-wde Statement of Changes in Net Position and related graphs provide a picture of the City’s assets,liabilities and deferred inflows/outflows of resources. Over time increases or decreases in net position may serve as a usefulindicator that the City’s financial position is improving or deteriorating. For fiscal year 2020, the City’s net position increased by$25,942,921 indicating a solid financial position.
-20,000,000.00
0.00
20,000,000.00
40,000,000.00
60,000,000.00
80,000,000.00
100,000,000.00
120,000,000.00
140,000,000.00
160,000,000.00
TotalRevenues
TotalExpenses
Transfers Increase innet position
2020 2019
-
20,000,000
40,000,000
60,000,000
80,000,000
100,000,000
120,000,000
140,000,000
160,000,000
TotalRevenues
TotalExpenses
Transfers Increase innet position
Change in Net Position –Governmental Activities
(in millions)
2020 2019
Change in Net Position –Business Activities
(in millions)
Revenues 2020 2019 2020 2019 2020 2019 Program revenues 32,604,292$ 41,231,871$ 45,563,796$ 48,374,949$ 78,168,088$ 89,606,820$
General revenues 98,937,523 99,303,535 2,568,047 2,868,442 101,505,570 102,171,977
Total Revenues 131,541,815 140,535,406 48,131,843 51,243,391 179,673,658 191,778,797 Expenses General government 19,214,720 19,009,881 - - 19,214,720 19,009,881
Public safety 70,438,404 56,573,745 - - 70,438,404 56,573,745
Physical environment & transportation 15,848,323 15,265,300 - - 15,848,323 15,265,300
Economic environment 1,594,138 1,288,852 - - 1,594,138 1,288,852
Culture and recreation 13,004,135 13,642,537 - - 13,004,135 13,642,537
Interest on long-term deb 2,328,027 2,462,162 - - 2,328,027 2,462,162
Water and Wastewaater - - 26,505,114 25,409,629 26,505,114 25,409,629
Golf course - - 3,573,655 3,826,275 3,573,655 3,826,275
Stormwater - - 1,224,221 1,232,178 1,224,221 1,232,178
Total Expenses 122,427,747 108,242,477 31,302,990 30,468,082 153,730,737 138,710,559
Changes in Net Position, before transfers 9,114,068 32,292,929 16,828,853 20,775,309 25,942,921 53,068,238
Transfers 2,927,652 2,788,240 (2,927,652) (2,788,240) - -
Increase in net position 12,041,720 35,081,169 13,901,201 17,987,069 25,942,921 53,068,238 Beginning Net Position, as restated* 131,270,403 96,189,234 185,656,686 167,669,617 316,927,089 263,858,851
Ending Net Position 143,312,123$ 131,270,403$ 199,557,887$ 185,656,686$ 342,870,010$ 316,927,089$
City of Plantation's Change in Net Position
Governmental Activities Business-Type Activities Total

FY 2020 Popular Annual Financial Report
Governmental Funds - RevenuesFiscal year 2020
The information below describesthe City of Plantation’sgovernmental revenues for fiscalyear 2020. Total revenues receivedwere $135.2 million.
Property taxes (44.3%):Taxes collected from property owners based uponassessed taxable values and millage rate. This revenuesource is used to fund the City’s operations.
Intergovernmental (17.7%):The combined resources received from State & LocalGovernments in the form of grants, contributions,state shared revenues, and sales tax.
Charges for services (11.6%):The combined resources of various departments forfees paid by the public for services such as: Parks &Recreation, Financial Services, Police and Fire SpecialDetail
Licenses and permits (7.8%):Fees collected for the issuance of licenses and permitsby the City.
Franchise fees (6.4%):Fees charged by the City to businesses wishing tocarry out specific commercial activities within Citylimits.
Utility taxes (5.8%):Taxes on the purchase of various utility services,including electric, water, gas andtelecommunications.
Miscellaneous (3.0%):One-time revenues from sources not classifiedelsewhere.
Investment income (2.8%):Income derived from capital gains, dividends,and other activities related to the City’sinvestment portfolios
Fines and forfeitures (0.6%):Revenues derived from fines and penaltiesimposed for statutory offenses, and violations oflawful administrative rules and regulations.
Page 13
Governmental funds are used to account for essentially the same functions reported as governmental activities in the government-wide financial statements. Most of the City’s basic services are reported in governmental funds (general, special revenue, debt service, and the capital projects funds.)
FY 2019 Popular Annual Financial Report
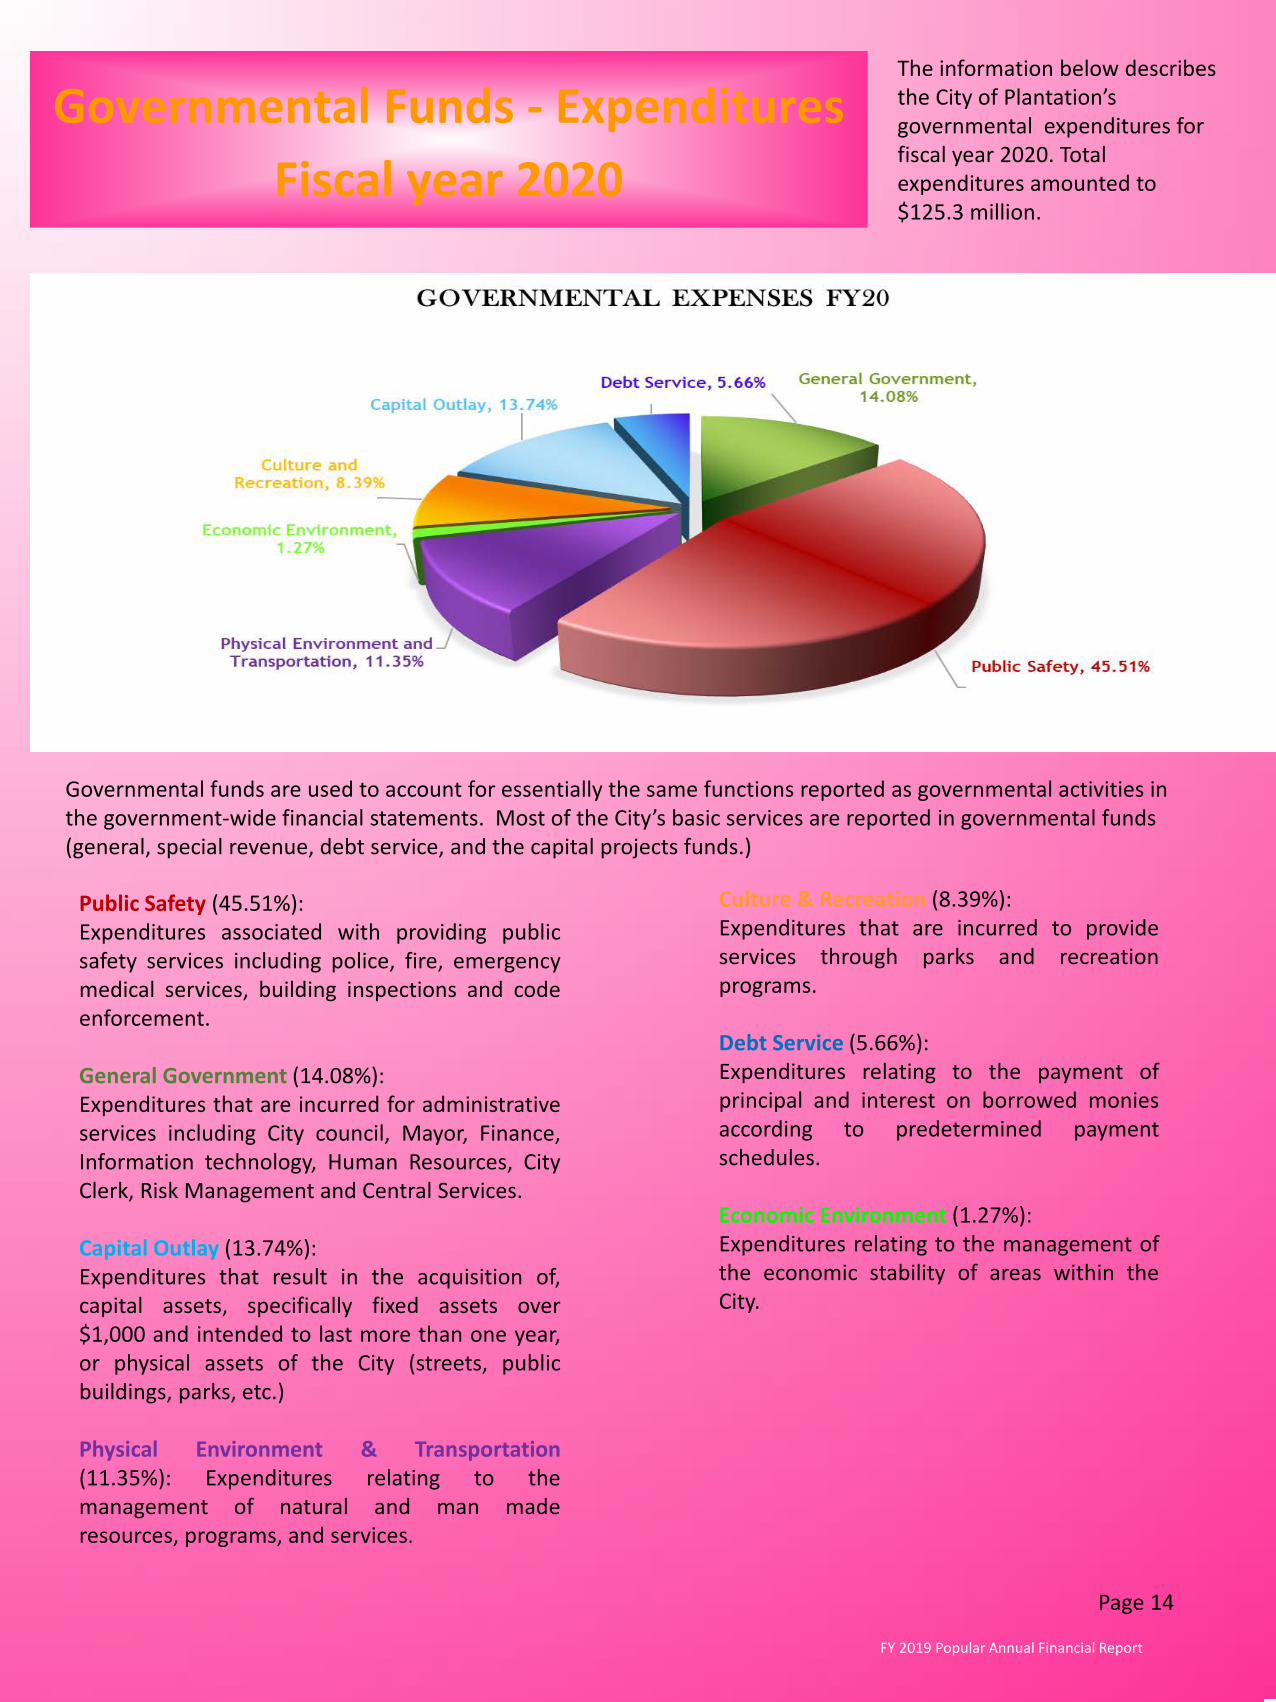
Governmental Funds - ExpendituresFiscal year 2020
The information below describes the City of Plantation’s governmental expenditures for fiscal year 2020. Total expenditures amounted to $125.3 million.
Public Safety (45.51%):Expenditures associated with providing publicsafety services including police, fire, emergencymedical services, building inspections and codeenforcement.
General Government (14.08%):Expenditures that are incurred for administrativeservices including City council, Mayor, Finance,Information technology, Human Resources, CityClerk, Risk Management and Central Services.
Capital Outlay (13.74%):Expenditures that result in the acquisition of,capital assets, specifically fixed assets over$1,000 and intended to last more than one year,or physical assets of the City (streets, publicbuildings, parks, etc.)
Physical Environment & Transportation(11.35%): Expenditures relating to themanagement of natural and man maderesources, programs, and services.
Culture & Recreation (8.39%):Expenditures that are incurred to provideservices through parks and recreationprograms.
Debt Service (5.66%):Expenditures relating to the payment ofprincipal and interest on borrowed moniesaccording to predetermined paymentschedules.
Economic Environment (1.27%):Expenditures relating to the management ofthe economic stability of areas within theCity.
Page 14
Governmental funds are used to account for essentially the same functions reported as governmental activities in the government-wide financial statements. Most of the City’s basic services are reported in governmental funds (general, special revenue, debt service, and the capital projects funds.)

FY 2020 Popular Annual Financial Report
The General Fund is the primary operating fund of the City. It is used to account for all financial resources exceptthose required to be accounted for in another fund. These activities are funded principally by property taxes
Page 15
General FundActual Revenues
117.6 MWhere the Money Comes From
Major Variances
Revenues 2020 2019Property taxes 53,976,869 51,584,754 Ut ility taxes 7,787,954 7,825,115 Franchise taxes 8,614,431 8,761,460 Licenses and permits 10,581,775 13,172,669 Intergovernmental 15,905,383 24,431,758 Fines and forfeitures 759,263 1,036,079 Charges for services 13,926,135 14,297,017 Investment income 2,546,530 2,717,814 Misc 3,576,467 3,685,866
117,674,807 127,512,532
Property Taxes:Increased by $2.3 millionPrimarily due to property values which increased 5.21% in FY 2020.
Licenses and permits:Decreased $2.5 million due to the impact of COVID-19 halting construction projects and affecting permit revenue.
Intergovernmental:With the impact of COVID-19 on Statewide closures, State and Local revenue sharing revenues decreased $8.5 million.

FY 2020 Popular Annual Financial Report
The General Fund accounts for the typical recurring activities of the City’s operations. The General Fund is used to fund police, fire, and fire/rescue services, among other essential functions of the City.
Page 16
General FundActual Expenditures
101.2MWhere the Money Goes
Major VariancesCulture & Recreation:Decreased $1.5 million from the scaled down operations in Parks & Recreation from the COVID-19 Pandemic.
Public Safety:Increased expenditures by $725 thousand in payroll and related expenses from the COVID-19 Pandemic
Physical Environment and Transportation:Showed a slight decrease of $200 thousand
Expenditures 2020 2019General Government 17,597,803 17,414,314 Public Safety 56,637,261 55,911,749 Physical Env ironment and Transportation 11,992,992 12,194,197 Economic Envnironment - - Culture and Recreation 10,483,869 12,002,086 Capital Outlay 3,387,532 3,283,909 Debt Serv ice 1,146,937 1,171,782
101,246,394 101,978,037

Water Supplied
FY 2020 Popular Annual Financial Report
The City of Plantation manages a water,wastewater and stormwater utility system. TheCity’s utilities are grouped as Enterprise fundsand account for their transactions in a similarway to private businesses.
The relationship cycle to the right depicts thebasic structure of the water/wastewatersystem.
Residents and businesses alike pay for waterand wastewater on a monthly basis. Othercharges appear on the monthly bill forrecycling, and solid waste.
Payments can be: Mailed to P.O. Box listed
on payment stub
Paid on-line using a credit
card or e-check
Placed in a drop box in front of City Hall,Central Park, Jim Ward CC, or Volunteer Park
Paid in person at City Hall
Paid by automatic debit from your bankaccount via our Automated Funds Transfer(AFT) program
Utility Services
For additional information contact the UtilityBilling Department via email at:[email protected].
Page 17
Wastewater Treated Meter Read for usage
Residents & BusinessesBilled to Residents & Businesses
Total revenues Total expenses
40,161,130
26,505,114
41,141,079
25,409,629
2020 Water and Wastewater Services2019 Water and Wastewater Services
Water and WasteWater FundRevenues and Expenses
From the ‘Utilities’ page, Water Conservation will be listed on the left side.
To learn more about water conservation, visit our website: www.plantation.org.
From the homepage, click on the icon:

FY 2020 Popular Annual Financial Report
Page 18
Making a Difference
On March 9, 2020, Governor DeSantis issued Executive Order 20-52 declaring a State of Emergency for the entire State of Florida. Shortly after, on March 19, Mayor Stoner issued COVID-19 protocols for the City of
Plantation, changing life as we knew it. While the burden and loss from this pandemic has been unimaginable for some, the City’s determination to work together with residents to make a difference in our
communities provided several memorable moments:
Fire Chief Donald Todd, Jr. elected to deploy a single rescue vehicle dedicated to only handling Covid related references, with
eight volunteer members who came to be know as the “Covid Eight”. (pictured left) This reduced the risks of exposure and
infection while preserving precious PPE equipment and keeping the health and safety of the rest of the Fire Department intact.
On April 24, 2020, in partnership with the Feeding South Florida organization, the City hosted their first (of many) ‘drive-thru’ food distributions. The event
was able to provide groceries for 850 families in and around Plantation.
Drive-thru Activities
Graduation drive-by
Movies in the Park
City of Plantation Fire and Police Department surprising healthcare
workers at Westside Regional
Plantation Police DepartmentParticipating in drive-by
Birthday celebration.
Plantation Police Department partnering with M.A.H.T Broward to assist those
experiencing homelessness.
Parks and Recreation implemented creative activities to keep the community engaged during the Pandemic protocols set forth.