the chemistry of oh and ho2 radicals in the boundary layer over
TRANSCRIPT

Atmos. Chem. Phys., 10, 1555–1576, 2010www.atmos-chem-phys.net/10/1555/2010/© Author(s) 2010. This work is distributed underthe Creative Commons Attribution 3.0 License.
AtmosphericChemistry
and Physics
The chemistry of OH and HO2 radicals in the boundary layerover the tropical Atlantic Ocean
L. K. Whalley 1,5, K. L. Furneaux1,†, A. Goddard1, J. D. Lee2,6, A. Mahajan1, H. Oetjen1, K. A. Read2,6, N. Kaaden3,L. J. Carpenter2, A. C. Lewis2,6, J. M. C. Plane1, E. S. Saltzman4, A. Wiedensohler3, and D. E. Heard1,5
1School of Chemistry, University of Leeds, Woodhouse Lane, Leeds, LS2 9JT, UK2Chemistry Department, University of York, Heslington, YO10 5DD, UK3Physics Department, Leibniz Institute for Tropospheric Research, Leipzig, Germany4Department of Earth System Science, University of California, Irvine, CA, USA5National Centre for Atmospheric Sciences, University of Leeds, Leeds, LS2 9JT, UK6National Centre for Atmospheric Sciences, University of York, Heslington, YO10 5DD, UK†Sadly passed away 28 July 2009
Received: 9 July 2009 – Published in Atmos. Chem. Phys. Discuss.: 28 July 2009Revised: 5 January 2010 – Accepted: 19 January 2010 – Published: 15 February 2010
Abstract. Fluorescence Assay by Gas Expansion (FAGE)has been used to detect ambient levels of OH and HO2 rad-icals at the Cape Verde Atmospheric Observatory, locatedin the tropical Atlantic marine boundary layer, during Mayand June 2007. Midday radical concentrations were high,with maximum concentrations of 9×10⁶ molecule cm−3 and6×108 molecule cm−3 observed for OH and HO2, respec-tively. A box model incorporating the detailed Master Chem-ical Mechanism, extended to include halogen chemistry, het-erogeneous loss processes and constrained by all availablemeasurements including halogen and nitrogen oxides, hasbeen used to assess the chemical and physical parameterscontrolling the radical chemistry. The model was able toreproduce the daytime radical concentrations to within the1 σ measurement uncertainty of 20% during the latter halfof the measurement period but significantly under-predicted[HO2] by 39% during the first half of the project. Sensi-tivity analyses demonstrate that elevated [HCHO] (∼2 ppbv)on specific days during the early part of the project, whichwere much greater than the mean [HCHO] (328 pptv) usedto constrain the model, could account for a large portion ofthe discrepancy between modelled and measured [HO2] atthis time. IO and BrO, although present only at a few pptv,constituted∼19% of the instantaneous sinks for HO2, whilstaerosol uptake and surface deposition to the ocean accounted
Correspondence to:L. K. Whalley([email protected])
for a further 23% of the HO2 loss at noon. Photolysis of HOIand HOBr accounted for∼13% of the instantaneous OH for-mation. Taking into account that halogen oxides increase theoxidation of NOx (NO→ NO2), and in turn reduce the rateof formation of OH from the reaction of HO2 with NO, OHconcentrations were estimated to be 9% higher overall dueto the presence of halogens. The increase in modelled OHfrom halogen chemistry gives an estimated 9% shorter life-time for methane in this region, and the inclusion of halogenchemistry is necessary to model the observed daily cycle ofO3 destruction that is observed at the surface. Due to surfacelosses, we hypothesise that HO2 concentrations increase withheight and therefore contribute a larger fraction of the O3 de-struction than at the surface.
1 Introduction
The OH radical is one of the most dominant oxidants in thetroposphere. It is most prevalent in tropical regions wherehigh levels of humidity and solar irradiance lead to high ratesof OH production:
O3 + hv(λ < 340 nm)→ O2 + O(1D) (R1)
O(1D) + H2O→ 2 OH (R2)
Published by Copernicus Publications on behalf of the European Geosciences Union.
1556 L. K. Whalley et al.: Chemistry of OH and HO2 radicals over the tropical Atlantic Ocean
OH HO2RO2
HOX
Loss
Loss
Peroxides
O3
O3
NO
XO
hv, H2O
CO, O2
hv
RH, O2
HO2/RO2
NO, O2 Heterogeneous
processes
Ae
ros
ol
OH HO2RO2
HOX
Loss
Loss
Peroxides
O3
O3
NO
XO
hv, H2O
CO, O2
hv
RH, O2
HO2/RO2
NO, O2 Heterogeneous
processes
Ae
ros
ol
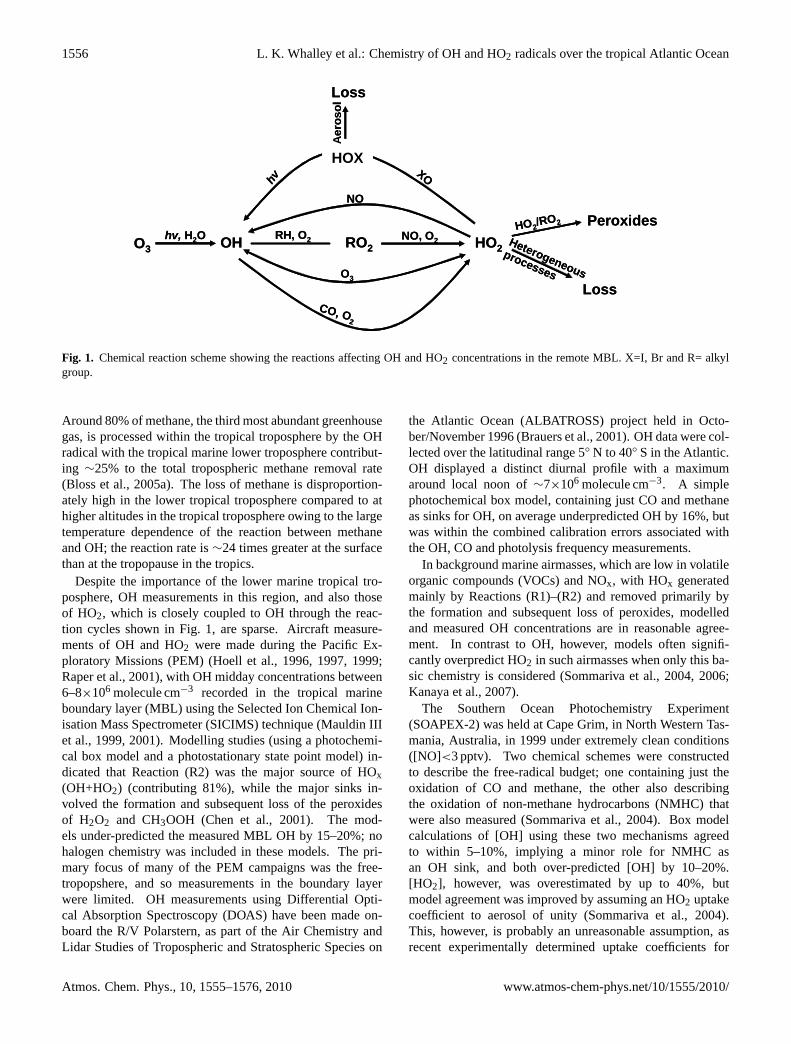
Fig. 1. Chemical reaction scheme showing the reactions affecting OH and HO2 concentrations in the remote MBL. X=I, Br and R= alkylgroup.
Around 80% of methane, the third most abundant greenhousegas, is processed within the tropical troposphere by the OHradical with the tropical marine lower troposphere contribut-ing ∼25% to the total tropospheric methane removal rate(Bloss et al., 2005a). The loss of methane is disproportion-ately high in the lower tropical troposphere compared to athigher altitudes in the tropical troposphere owing to the largetemperature dependence of the reaction between methaneand OH; the reaction rate is∼24 times greater at the surfacethan at the tropopause in the tropics.
Despite the importance of the lower marine tropical tro-posphere, OH measurements in this region, and also thoseof HO2, which is closely coupled to OH through the reac-tion cycles shown in Fig. 1, are sparse. Aircraft measure-ments of OH and HO2 were made during the Pacific Ex-ploratory Missions (PEM) (Hoell et al., 1996, 1997, 1999;Raper et al., 2001), with OH midday concentrations between6–8×10⁶ molecule cm−3 recorded in the tropical marineboundary layer (MBL) using the Selected Ion Chemical Ion-isation Mass Spectrometer (SICIMS) technique (Mauldin IIIet al., 1999, 2001). Modelling studies (using a photochemi-cal box model and a photostationary state point model) in-dicated that Reaction (R2) was the major source of HOx(OH+HO2) (contributing 81%), while the major sinks in-volved the formation and subsequent loss of the peroxidesof H2O2 and CH3OOH (Chen et al., 2001). The mod-els under-predicted the measured MBL OH by 15–20%; nohalogen chemistry was included in these models. The pri-mary focus of many of the PEM campaigns was the free-tropopshere, and so measurements in the boundary layerwere limited. OH measurements using Differential Opti-cal Absorption Spectroscopy (DOAS) have been made on-board the R/V Polarstern, as part of the Air Chemistry andLidar Studies of Tropospheric and Stratospheric Species on
the Atlantic Ocean (ALBATROSS) project held in Octo-ber/November 1996 (Brauers et al., 2001). OH data were col-lected over the latitudinal range 5◦ N to 40◦ S in the Atlantic.OH displayed a distinct diurnal profile with a maximumaround local noon of∼7×10⁶ molecule cm−3. A simplephotochemical box model, containing just CO and methaneas sinks for OH, on average underpredicted OH by 16%, butwas within the combined calibration errors associated withthe OH, CO and photolysis frequency measurements.
In background marine airmasses, which are low in volatileorganic compounds (VOCs) and NOx, with HOx generatedmainly by Reactions (R1)–(R2) and removed primarily bythe formation and subsequent loss of peroxides, modelledand measured OH concentrations are in reasonable agree-ment. In contrast to OH, however, models often signifi-cantly overpredict HO2 in such airmasses when only this ba-sic chemistry is considered (Sommariva et al., 2004, 2006;Kanaya et al., 2007).
The Southern Ocean Photochemistry Experiment(SOAPEX-2) was held at Cape Grim, in North Western Tas-mania, Australia, in 1999 under extremely clean conditions([NO]<3 pptv). Two chemical schemes were constructedto describe the free-radical budget; one containing just theoxidation of CO and methane, the other also describingthe oxidation of non-methane hydrocarbons (NMHC) thatwere also measured (Sommariva et al., 2004). Box modelcalculations of [OH] using these two mechanisms agreedto within 5–10%, implying a minor role for NMHC asan OH sink, and both over-predicted [OH] by 10–20%.[HO2], however, was overestimated by up to 40%, butmodel agreement was improved by assuming an HO2 uptakecoefficient to aerosol of unity (Sommariva et al., 2004).This, however, is probably an unreasonable assumption, asrecent experimentally determined uptake coefficients for
Atmos. Chem. Phys., 10, 1555–1576, 2010 www.atmos-chem-phys.net/10/1555/2010/

L. K. Whalley et al.: Chemistry of OH and HO2 radicals over the tropical Atlantic Ocean 1557
HO2 on realistic aerosol surfaces range only from 0.01–0.1(Thornton et al., 2008; Taketani et al., 2008, 2009). Duringthe summer 2002 NAMBLEX project, which took placeat Mace Head on the West coast of Ireland, the role ofhalogen oxides, specifically IO and BrO, in the chemistryof the MBL was confirmed (Bloss et al., 2005b; Som-mariva et al., 2006; Smith et al., 2006). IO and BrO reactquickly with HO2, with rate coefficients at 25◦ C of 8.6 and2.1×10−11 molecule−1 cm3 s−1 for IO and BrO, respectively(IUPAC, 2006). The HOI and HOBr formed may then eitherundergo photolysis to yield OH (and a halogen atom) orbe taken up onto an aerosol surface. Reaction of HOI andHOBr with halide ions in acidified aerosol can form volatileinter-halogen species (Vogt et al., 1996; Pechtl et al., 2007)which photolyse in the gas phase allowing gaseous halogenchemistry to continue. The inclusion of a halogen schemehas been shown to improve the HO2 modelled to measuredagreement at a number of marine sites (Bloss et al., 2005b;Smith et al., 2006; Sommariva et al., 2006; Kanaya et al.,2007), and could account for the model discrepancy reportedduring the SOAPEX-2 experiment if realistic HO2 uptakecoefficients were instead used (Haggerstone et al., 2005).
At coastal locations such as Mace Head, the primarysource of IO is the photolysis of molecular iodine (Saiz-Lopez and Plane, 2004) and, to a smaller extent, iodocarbons(Chameides and Davis, 1980; Carpenter et al., 1999), whichare released by macro-algae exposed at low tide. The iodineatoms generated react rapidly with O3 to generate the IO rad-ical. At coastal sites where macro-algae are exposed, IO fol-lows a distinct diurnal profile, with concentrations peakingwith low tide during the daytime (Alicke et al., 1999; Whal-ley et al., 2007). The impact of halogens on troposphericoxidants in regions without tidally exposed macro-algae, forexample the open ocean, which covers∼70% of Earth’s sur-face, was until recently, unconfirmed. A number of theoreti-cal and observational studies had inferred indirectly the pos-sible global impact of halogens (Dickerson et al., 1999; Vogtet al., 1999; Galbally et al., 2000; von Glasow et al., 2002;von Glasow et al., 2004), but observations in the remoteMBL were limited (Allan et al., 2000; Leser et al., 2003).In 2006/2007 an 8 month measurement series of IO and BrOat the Cape Verde Atmospheric Observatory (CVAO) was re-ported (Read et al., 2008), exhibiting broad diurnal profilesfollowing light intensity; with typical peak concentrations of∼1.4 and 2.5 pptv, respectively. CVAO is thought to be rep-resentative of the open ocean tropical MBL; ship and aircraftmeasurements confirm that the measurements at the site arerepresentative of the surrounding area (Read et al., 2008; Leeet al., 2009a) and hence these observations suggest a poten-tially global presence of halogen oxides. Although IO andBrO are present at much lower concentrations than observedat coastal sites, for example Mace Head ([BrO]max=6.5 pptv;Saiz-Lopez et al., 2004, and [IO]max∼30 pptv; Commane,2009) and Roscoff, France ( [IO]max∼28 pptv; Furneaux etal., 2009), the inclusion of bromine and iodine chemistry was
necessary to model adequately the daily O3 destruction thatis observed at Cape Verde (Read et al., 2008).
For [NO]<∼20 pptv, O3, an important greenhouse gas inthe troposphere, is photochemically destroyed (Penkett et al.,1997; Lee et al., 2009b) (e.g. via Reactions (R1)–(R4) and asshown in Fig. 1).
O3 + OH→ HO2 + O2 (R3)
O3 + HO2→ OH+ 2O2 (R4)
When halogen oxides are present, further O3 destruction mayoccur via the reaction of a halogen atom (X) with O3 andsubsequent reaction of XO with HO2, NO, or XO:
X + O3→ XO + O2 (R5)
XO + HO2→ HOX + O2 (R6a)
HOX + hv→ OH+X (R6b)
XO + NO→ X + NO2 (R7)
XO + IO→ X + OIO (R8)
XO + XO→ 2X + O2 (R9)
Surface deposition of O3 may also contribute to its destruc-tion in the BL. At higher levels of NO the regime switches toa net O3 production via the following reactions:
HO2 + NO→ OH+ NO2 (R10)
RO2 + NO→ RO+ NO2 (R11)
NO2 + hv(λ < 420 nm)→ NO+ O (R12)
O+ O2 + M→ O3 + M (R13)
Read et al. (2008) reported a consistent daytime O3 destruc-tion cycle at the CVAO with an annually averaged loss of3.3±2.6 ppbv d−1. In this paper, we present OH and HO2measurements made at the observatory as part of the ReactiveHalogen in the Marine Boundary Layer (RHaMBLe) project(Lee et al., 2009a). The contribution towards the overall O3destruction from the reactions of OH and HO2 radicals withO3 is determined directly. A detailed model is used to in-vestigate the impact of the reactions of HO2 with BrO andIO, and the subsequent recycling to OH via the photolysisof HOBr and HOI. Of interest is the contribution of halo-gen chemistry to the rate of photochemical destruction of O3and the budgets of OH and HO2 radicals. The significanceof halogen chemistry for the global oxidising capacity andhence the removal rate of methane is also examined.
www.atmos-chem-phys.net/10/1555/2010/ Atmos. Chem. Phys., 10, 1555–1576, 2010

1558 L. K. Whalley et al.: Chemistry of OH and HO2 radicals over the tropical Atlantic Ocean
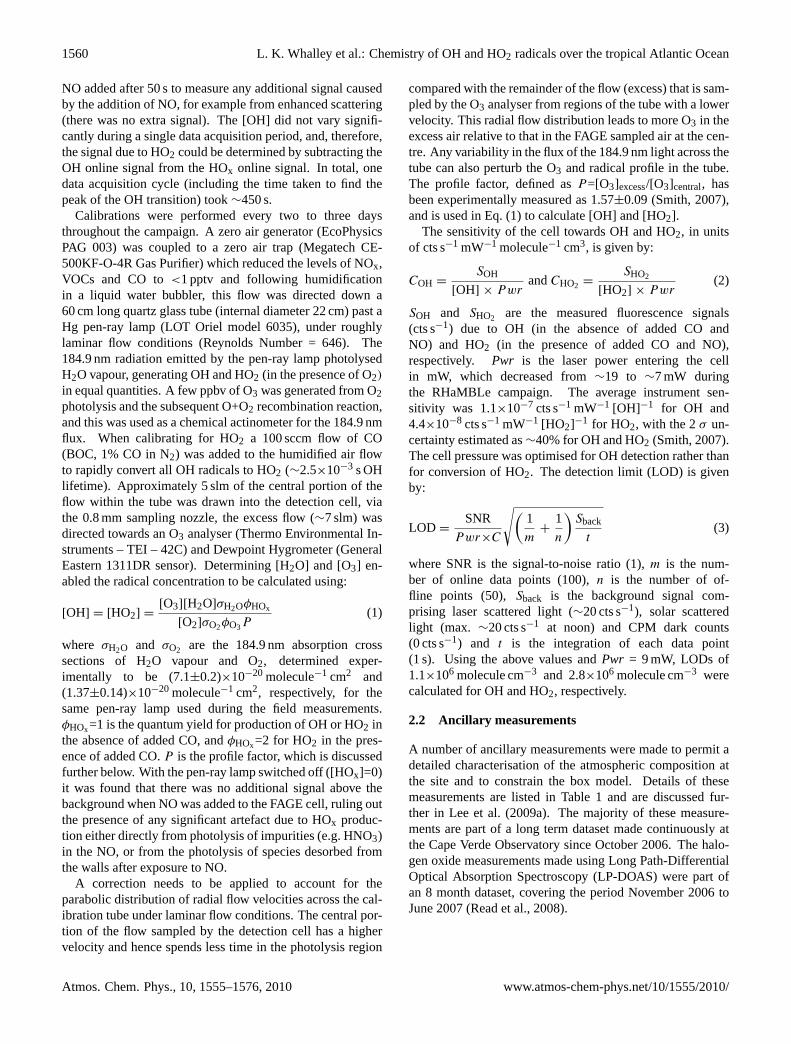
Fig. 2. Schematic of the FAGE laboratory set-up during RHaMBLe (see text for details).
2 Experimental
2.1 Measurement of OH and HO2 radicals
Fluorescence Assay by Gas Expansion (FAGE) provides apowerful method for the detection of tropospheric OH andHO2 radicals (Heard and Pilling, 2003). The techniqueutilises the strong A26+ (v′=0)←X25i(v′′=0) Q1(2) tran-sition at 308 nm for OH laser excitation. HO2 can also bedetected by this method following initial chemical conver-sion to OH by adding NO and subsequent detection. Laser-induced fluorescence experiments of this type are conductedat low pressures (∼133 Pa) to extend the fluorescence life-time of the OH radical sufficiently to allow the fluorescenceto be discriminated from the more intense laser radiation.This is achieved by temporal gating of the detector; a chan-nel photo multiplier (CPM) (Perkin Elmer C943P) is used.Switching the CPM off during the laser pulse also helps toprevent detector saturation (Smith et al., 2006). OH fluores-cence and scattered light (laser and solar) are recorded by agated photon counter (SRS SR400) during a 500 ns integra-tion period (Gate A), commencing approximately 50 ns afterthe end of the laser pulse (FWHM∼35 ns). A small fractionof the total laser scattered light, along with solar scatteredlight and detector dark counts constitute a background signalto the OH fluorescence in gate A. The contribution of the so-lar scattered light and dark counts can be determined using asecond photon counting gate (Gate B), delayed by 50 µs fromthe first, at a time when the fluorescence and laser pulse have
subsided. Tuning the laser away from resonance with theOH transition (online), to a wavelength where OH does notabsorb (offline), allows the signal contribution of the laserscatter to be determined.
Ambient OH and HO2 measurements have been made us-ing the University of Leeds ground-based FAGE instrumentsince 1996 (Heard and Pilling, 2003). Details of the instru-ment have previously been reported (Smith et al., 2006), andare only considered briefly here. The operating conditionsencountered at the CVAO were challenging and a modifiedoperating procedure was necessary. The instrument is housedin an instrumented 20 ft sea container (Fig. 2), and comprisesa laser system, an OH reference cell for calibration of thelaser wavelength, fluorescence cells which are housed on theroof of the sea container at a height of 3.5 m, and data acqui-sition and calibration systems.
During the RHaMBLe project, the instrument was locatedat the CVAO (16.85◦N, 24.87◦W), at Calhau on a northeastfacing rocky foreshore on the island of Sao Vicente withinthe Cape Verde archipelago. The island shores shelve steeplyand very little tidal variability is apparent near to the site.A detailed map of Cape Verde and the layout of the sitecan be found in Lee et al. (2009a). The site is adjacent tothe ocean, the University of Leeds ground-based FAGE in-strument was approximately 50 m from the water’s edge andthe inlet was positioned approximately 3.5 m above sea level(a.s.l.). A wavelength tuneable Nd:YAG pumped Ti:Sapphirelaser (Photonics Industries DS 20-532) was used to gener-ate UV light at 308 nm. The Nd:YAG produces∼9 W of
Atmos. Chem. Phys., 10, 1555–1576, 2010 www.atmos-chem-phys.net/10/1555/2010/

L. K. Whalley et al.: Chemistry of OH and HO2 radicals over the tropical Atlantic Ocean 1559
532 nm radiation at a pulse repetition rate of 5 kHz, andis used to pump a Ti:Sapphire laser which generates up to1.6 W of broadband near-IR radiation. Selecting a wave-length close to 924 nm, by changing the incident angle ofan intra-cavity diffraction grating, and frequency tripling, bypassing the light through two non-linear harmonic genera-tion stages, generates the required radiation close to 308 nmfor OH excitation. The time taken for the Ti:Sapphire laser tobuild up sufficient gain for laser output was found to changesignificantly in this campaign. When optimally aligned, thedelay between the 532 nm pump pulse and the Ti:Sapphirelaser output can be as short as 200 ns, but as laser opticsbecome damaged or alignment shifts (possibly due to tem-perature changes) this delay can increase. The time betweenthe Ti:Sapphire laser pulse,t308, and the time when the fluo-rescence photons are counted (beginning of gate A) is criti-cal, and must be maintained constant to ensure that the in-strument sensitivity and background laser scatter does notchange. A counter timer (Agilent Technologies, 225 MHzuniversal counter) triggered at the same time (t0), as the laser,and coupled to a photodiode (Hamamatsu, S6468 series),which monitors the onset of the pulse of frequency tripled308 nm light (t308), was implemented during this project tomeasure the delayt308− t0 . This system allowed any drift int308−t0 to be directly monitored in real time and a correctionadded to or subtracted from the time of the trigger control-ling the start of the fluorescence photon counting gate A. Thecorrection was applied prior to the beginning of each data ac-quisition cycle, which lasted∼450 s.
During this campaign a number of the optical coatingswithin the laser became damaged as a result of the high in-tensity laser beam hitting dust or sea-salt particles that haddeposited on the optics. Although this problem occurs, to acertain extent, in all environments, the effect was particularlyexacerbated at the CVAO, which is exposed to the elementsbeing close to the water’s edge and subject to wind-speedsregularly in excess of 10 ms−1. The resultant optical damageled to a reduction in laser power at 308 nm from∼40 mWto <20 mW as the project progressed. The stability of thedelay timet308− t0 was significantly worse than had beenobserved previously (or since). In addition, tuning the laserwavelength by 0.006 nm (the interval between the online andoffline positions) significantly changedt308− t0 and hencethe position of gate A relative to the laser. As a result, thelaser power and hence the laser scattered light changed sig-nificantly between the online and offline positions. The tim-ing drift precluded OH measurements during the first halfof the project, and the HO2 measurements were subject toa larger uncertainty during this period. The timing problemwas eventually ameliorated by reducing the interval betweenthe online and offline wavelengths to 0.004 nm, for which thechange int308− t0 was much reduced.
Upon exiting the laser, the light was split by a dielec-trically coated beam-splitter (CVI Optics Ltd). 80% wasdirected to a fluorescence cell via a fibre launcher (Elliot
GoldTM series), fibre optic (Elliot Scientific) and collimationassembly (Oz Optics), and 19% to an OH reference cell, de-signed to aid the precise tuning of the laser wavelength tothe peak of the Q1(2) OH transition. A large concentrationof OH is generated by the pyrolysis of H2O vapour, using aflow of humidified air over a heated filament. Light exitingthe reference cell was directed on a UV sensitive photodiode(New Focus 2032) to determine the laser power for subse-quent normalisation of the ambient LIF signal; a cut-off filterwas placed in front of the photodiode to prevent visible lightreaching it. The remaining UV light (1%) was directed onto afast photodiode (Hamamatsu, S6468 series), which was usedas input to the counter-timer to correct for any drift in thelaser timing.
The laser light entered the detection cell on the roof ofthe container via a baffled side arm and intersected the am-bient air stream, drawn through a 0.8 mm diameter nozzlesat on a 25 mm turret, on an axis perpendicular to the fluo-rescence detection axis containing the CPM. The laser lightthen exited the cell via a second baffled side arm and was re-flected onto a second UV sensitive filtered photodiode (NewFocus 2032), the output of which was monitored to checkgood laser alignment was being maintained through the cell.Ambient temperature fluctuations can cause the voltage out-put from photodiodes to drift, this precludes the use of thedetection cell photodiode (located on the roof) to normalisethe LIF signal to laser power. High solar intensities wereexperienced at the Cape Verde site (the solar zenith angle atsolar noon in June at the site was∼5◦) leading to a largeamount of solar scattered light detected within the cell bythe CPM. A solar shade, consisting of a sheet of black alu-minium (10 cm×10 cm) was placed 15 cm above the nozzle,which reduced the solar counts that reached the detector byan order of magnitude. Without the shade, solar counts atsolar noon could reach>200 counts s−1, the random fluctu-ations of which are larger than the typical signal from OH,making measurements extremely difficult. The windspeed atthe site was∼10 ms−1 (and rarely dropped below 5 ms−1),thus the average time an air parcel spent under the shade was∼0.01 s, much shorter than the lifetime of either OH or HO2radicals, and should not perturb their concentrations.
Normally, the University of Leeds ground-based FAGE in-strument utilises two fluorescence cells for simultaneous OHand HO2 measurements (Smith et al., 2006). Due to low laserpower, coupled with a CPM failure in the OH cell, however,only one cell was operable during the project and was usedinstead to make alternating sequential measurements of thetwo radicals. This set-up has been successfully utilised ona number of previous field projects, for example during therecent CHABLIS project (Bloss et al., 2007). Signals fromthe photon counter were integrated for 1 s periods. Onlinedata were acquired for 200 s and consisted of 100 s of fluores-cence from OH, followed by 100 s of fluorescence from bothOH and converted HO2 (NO added to the cell). The offlinesignal was then collected for a further period of 100 s, with
www.atmos-chem-phys.net/10/1555/2010/ Atmos. Chem. Phys., 10, 1555–1576, 2010
1560 L. K. Whalley et al.: Chemistry of OH and HO2 radicals over the tropical Atlantic Ocean
NO added after 50 s to measure any additional signal causedby the addition of NO, for example from enhanced scattering(there was no extra signal). The [OH] did not vary signifi-cantly during a single data acquisition period, and, therefore,the signal due to HO2 could be determined by subtracting theOH online signal from the HOx online signal. In total, onedata acquisition cycle (including the time taken to find thepeak of the OH transition) took∼450 s.
Calibrations were performed every two to three daysthroughout the campaign. A zero air generator (EcoPhysicsPAG 003) was coupled to a zero air trap (Megatech CE-500KF-O-4R Gas Purifier) which reduced the levels of NOx,VOCs and CO to<1 pptv and following humidificationin a liquid water bubbler, this flow was directed down a60 cm long quartz glass tube (internal diameter 22 cm) past aHg pen-ray lamp (LOT Oriel model 6035), under roughlylaminar flow conditions (Reynolds Number = 646). The184.9 nm radiation emitted by the pen-ray lamp photolysedH2O vapour, generating OH and HO2 (in the presence of O2)in equal quantities. A few ppbv of O3 was generated from O2photolysis and the subsequent O+O2 recombination reaction,and this was used as a chemical actinometer for the 184.9 nmflux. When calibrating for HO2 a 100 sccm flow of CO(BOC, 1% CO in N2) was added to the humidified air flowto rapidly convert all OH radicals to HO2 (∼2.5×10⁻³ s OHlifetime). Approximately 5 slm of the central portion of theflow within the tube was drawn into the detection cell, viathe 0.8 mm sampling nozzle, the excess flow (∼7 slm) wasdirected towards an O3 analyser (Thermo Environmental In-struments – TEI – 42C) and Dewpoint Hygrometer (GeneralEastern 1311DR sensor). Determining [H2O] and [O3] en-abled the radical concentration to be calculated using:
[OH] = [HO2] =[O3][H2O]σH2OφHOx
[O2]σO2φO3P(1)
where σH2O and σO2 are the 184.9 nm absorption crosssections of H2O vapour and O2, determined exper-imentally to be (7.1±0.2)×10−20 molecule−1 cm2 and(1.37±0.14)×10−20 molecule−1 cm2, respectively, for thesame pen-ray lamp used during the field measurements.φHOx=1 is the quantum yield for production of OH or HO2 inthe absence of added CO, andφHOx=2 for HO2 in the pres-ence of added CO.P is the profile factor, which is discussedfurther below. With the pen-ray lamp switched off ([HOx]=0)it was found that there was no additional signal above thebackground when NO was added to the FAGE cell, ruling outthe presence of any significant artefact due to HOx produc-tion either directly from photolysis of impurities (e.g. HNO3)in the NO, or from the photolysis of species desorbed fromthe walls after exposure to NO.
A correction needs to be applied to account for theparabolic distribution of radial flow velocities across the cal-ibration tube under laminar flow conditions. The central por-tion of the flow sampled by the detection cell has a highervelocity and hence spends less time in the photolysis region
compared with the remainder of the flow (excess) that is sam-pled by the O3 analyser from regions of the tube with a lowervelocity. This radial flow distribution leads to more O3 in theexcess air relative to that in the FAGE sampled air at the cen-tre. Any variability in the flux of the 184.9 nm light across thetube can also perturb the O3 and radical profile in the tube.The profile factor, defined asP=[O3]excess/[O3]central, hasbeen experimentally measured as 1.57±0.09 (Smith, 2007),and is used in Eq. (1) to calculate [OH] and [HO2].
The sensitivity of the cell towards OH and HO2, in unitsof cts s−1 mW−1 molecule−1 cm3, is given by:
COH =SOH
[OH] × PwrandCHO2 =
SHO2
[HO2] × Pwr(2)
SOH and SHO2 are the measured fluorescence signals(cts s−1) due to OH (in the absence of added CO andNO) and HO2 (in the presence of added CO and NO),respectively. Pwr is the laser power entering the cellin mW, which decreased from∼19 to ∼7 mW duringthe RHaMBLe campaign. The average instrument sen-sitivity was 1.1×10⁻⁷ cts s−1 mW−1 [OH]−1 for OH and4.4×10−8 cts s−1 mW−1 [HO2]−1 for HO2, with the 2σ un-certainty estimated as∼40% for OH and HO2 (Smith, 2007).The cell pressure was optimised for OH detection rather thanfor conversion of HO2. The detection limit (LOD) is givenby:
LOD =SNR
Pwr×C
√(1
m+
1
n
)Sback
t(3)
where SNR is the signal-to-noise ratio (1),m is the num-ber of online data points (100),n is the number of of-fline points (50), Sback is the background signal com-prising laser scattered light (∼20 cts s−1), solar scatteredlight (max. ∼20 cts s−1 at noon) and CPM dark counts(0 cts s−1) and t is the integration of each data point(1 s). Using the above values andPwr = 9 mW, LODs of1.1×106 molecule cm−3 and 2.8×10⁶ molecule cm−3 werecalculated for OH and HO2, respectively.
2.2 Ancillary measurements
A number of ancillary measurements were made to permit adetailed characterisation of the atmospheric composition atthe site and to constrain the box model. Details of thesemeasurements are listed in Table 1 and are discussed fur-ther in Lee et al. (2009a). The majority of these measure-ments are part of a long term dataset made continuously atthe Cape Verde Observatory since October 2006. The halo-gen oxide measurements made using Long Path-DifferentialOptical Absorption Spectroscopy (LP-DOAS) were part ofan 8 month dataset, covering the period November 2006 toJune 2007 (Read et al., 2008).
Atmos. Chem. Phys., 10, 1555–1576, 2010 www.atmos-chem-phys.net/10/1555/2010/
L. K. Whalley et al.: Chemistry of OH and HO2 radicals over the tropical Atlantic Ocean 1561
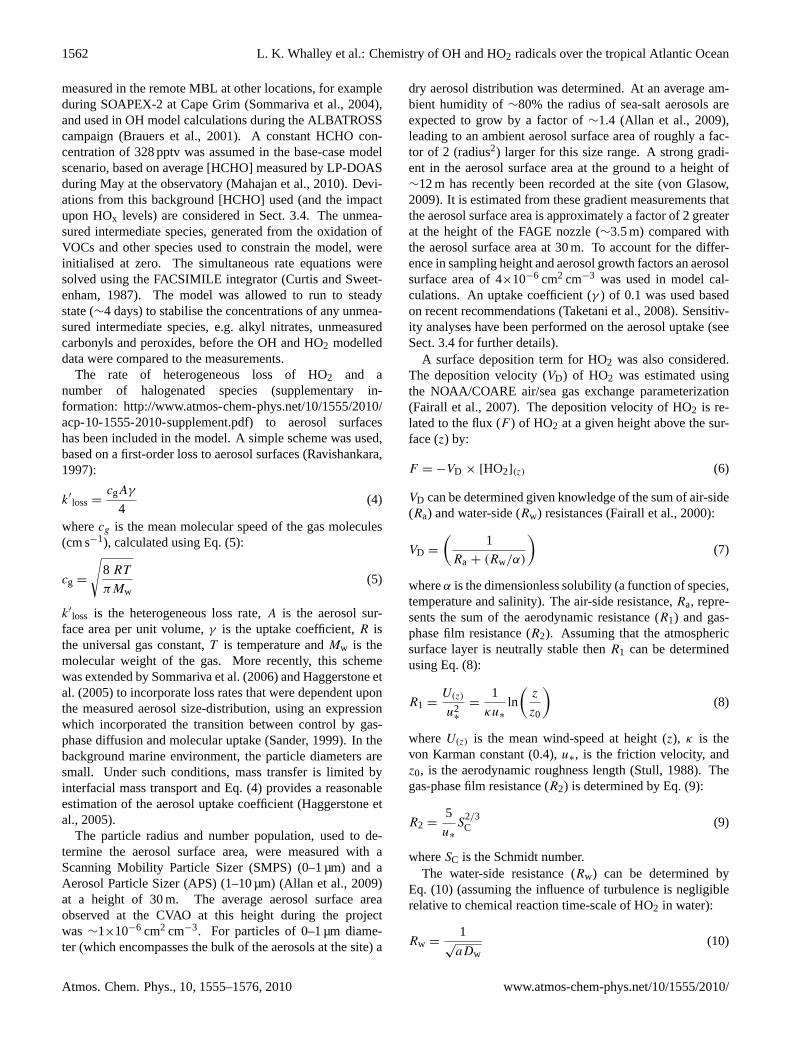
Table 1. Listing of the concurrent measurements made during the RHaMBLe project and used to constrain the box model.
Measurements Instrument Typical noon Averaging LOD Referencevalue Time (2σ )
O3 TEI 42c, UV absorption 35 ppbv 1 min 1 ppbv (Lee et al., 2009a)CO Aerolaser, VUV resonance fluorescence 104 ppbv 1 min – (Lee et al., 2009a)CH4 Flask Samples, Gas Chromatography analysis 1821 ppbv – – (Lee et al., 2009a)NO Chemiluminesence detector 2.3 pptv 1 h 1.5 pptv (Lee et al., 2009b)NO2 Chemiluminesence detector 11 pptv 1 h 4.1 pptv (Lee et al., 2009b)Ethane Gas Chromatography- Flame Ionisation Detection 845±26 pptv 1 h 2.5 pptv (Read et al., 2009)
(GC-FID)Propane GC-FID 50±1.7 pptv 1 h 2.5 pptv (Read et al., 2009)Iso-butane GC-FID 2.2±0.2 pptv 1 h 2.5 pptv (Read et al., 2009)n-butane GC-FID 3.9±0.3 pptv 1 h 2.5 pptv (Read et al., 2009)Acetylene GC-FID 119±3.3 pptv 1 h 2.5 pptv (Read et al., 2009)Ethene GC-FID 21±1.4 pptv 1 h 2.5 pptv (Read et al., 2009)Propene GC-FID 22±0.9 pptv 1 h 2.5 pptv (Read et al., 2009)Isoprene GC-FID 10±1.0 pptv 1 h 1.0 pptv (Read et al., 2009)Acetaldehyde GC-FID 826±137 pptv 1 h 18 pptv (Read et al., 2009)Methanol GC-FID 749±115 pptv 1 h 7 pptv (Read et al., 2009)Acetone GC-FID 487±45 pptv 1 h 3 pptv (Read et al., 2009)IO LP-DOAS 1.3 pptv 20–30 min 0.3–0.5 pptv (Read et al., 2008)BrO LP-DOAS 2.9 pptv 20–30 min 0.5–1 pptv (Read et al., 2008)HCHO LP-DOAS 328 pptv 20–30 min 200 pptv (Mahajan et al.,
2010)J(O1D) Filter Radiometer 3.4×10⁻⁵ s−1a 1 min – (Lee et al., 2009a)Aerosol Scanning Mobility Particle Sizer (SMPS) & 1×10⁻⁶ cm2 cm−3 30 min – (Allan et al., 2009)
Aerosol Particle Sizer (APS)Relative Campbell Met Station 76% 1 min – (Lee et al., 2009a)HumidityTemperature Campbell Met Station 296 K 1 min – (Lee et al., 2009a)Pressure Campbell Met Station 1016 hPa 1 min – (Lee et al., 2009a)
2.3 Box model using the master chemical mechanism
A box model was used to calculate OH and HO2 con-centrations, and contained a near explicit chemical schemefor the oxidative degradation of C1–C5 hydrocarbons, ex-tracted from the Master Chemical Mechanism (MCM)version 3.1 (Saunders et al., 2003). The entire MCMtreats the degradation of 135 VOCs and considers oxi-dation by OH, O3 and NO3. The degradation contin-ues until CO2 and H2O vapour form as the final oxida-tion products. Complete details of the kinetic and photo-chemical data used in the mechanism are available at theMCM website (MCM,http://mcm.leeds.ac.uk/MCM/home).A halogen chemical scheme (listed in supplementary in-formation: http://www.atmos-chem-phys.net/10/1555/2010/acp-10-1555-2010-supplement.pdf) was added to the MCMto assess the effect of IO, BrO and related species on thebudgets of OH, HO2 and O3 concentrations. The mechanismcontains photolysis of O3, NO2, HOI, HOBr, IO, aldehydes,ketones, H2O2 and organic hydroperoxides (RO2H), but onlymeasurements ofj (O1D) were used to constrain the model.The other photolysis rates were calculated based on a two-
stream scattering model (Hough, 1988) and assuming clear-sky conditions. Under cloudy conditions calculatedJ val-ues were scaled to the ratio of observedj (O1D) to clear skyj (O1D). Dry deposition terms for H2O2 (1 cm s−1) (Junker-mann and Stockwell, 1999), RO2H (0.9 cm s−1) (Junker-mann and Stockwell, 1999), HNO3 (0.8 cm s−1) (Ganzeveldand Lelieveld, 1995), CH3OH (0.09 cm s−1) (Carpenter etal., 2004) and HCHO and aldehydes (0.33 cm s−1) (Brasseuret al., 1998) were included in the model. The model was con-strained to hourly measurements of a number of VOCs (listedexplicitly in Table 1), NOx, O3, CO, CH4, j (O1D) and me-teorological parameters. The midday concentrations/valuesof these model constraints are given in Table 1 for informa-tion; there were, however, some deviations from these typicalmidday values in the hourly measurements that were used asmodel inputs. The halogen scheme was constrained usingmeasurements of the diurnal cycle of [IO] and [BrO] aver-aged for May 2007. It was necessary to use an average be-cause of incomplete data coverage primarily arising from IOand BrO being detected by DOAS in different wavelengthregions and, therefore, not being measured simultaneously.A H2 concentration of 500 ppbv was used, similar to that
www.atmos-chem-phys.net/10/1555/2010/ Atmos. Chem. Phys., 10, 1555–1576, 2010
1562 L. K. Whalley et al.: Chemistry of OH and HO2 radicals over the tropical Atlantic Ocean
measured in the remote MBL at other locations, for exampleduring SOAPEX-2 at Cape Grim (Sommariva et al., 2004),and used in OH model calculations during the ALBATROSScampaign (Brauers et al., 2001). A constant HCHO con-centration of 328 pptv was assumed in the base-case modelscenario, based on average [HCHO] measured by LP-DOASduring May at the observatory (Mahajan et al., 2010). Devi-ations from this background [HCHO] used (and the impactupon HOx levels) are considered in Sect. 3.4. The unmea-sured intermediate species, generated from the oxidation ofVOCs and other species used to constrain the model, wereinitialised at zero. The simultaneous rate equations weresolved using the FACSIMILE integrator (Curtis and Sweet-enham, 1987). The model was allowed to run to steadystate (∼4 days) to stabilise the concentrations of any unmea-sured intermediate species, e.g. alkyl nitrates, unmeasuredcarbonyls and peroxides, before the OH and HO2 modelleddata were compared to the measurements.
The rate of heterogeneous loss of HO2 and anumber of halogenated species (supplementary in-formation: http://www.atmos-chem-phys.net/10/1555/2010/acp-10-1555-2010-supplement.pdf) to aerosol surfaceshas been included in the model. A simple scheme was used,based on a first-order loss to aerosol surfaces (Ravishankara,1997):
k′loss=cgAγ
4(4)
wherecg is the mean molecular speed of the gas molecules(cm s−1), calculated using Eq. (5):
cg =
√8 RT
πMw(5)
k′loss is the heterogeneous loss rate,A is the aerosol sur-face area per unit volume,γ is the uptake coefficient,R isthe universal gas constant,T is temperature andMw is themolecular weight of the gas. More recently, this schemewas extended by Sommariva et al. (2006) and Haggerstone etal. (2005) to incorporate loss rates that were dependent uponthe measured aerosol size-distribution, using an expressionwhich incorporated the transition between control by gas-phase diffusion and molecular uptake (Sander, 1999). In thebackground marine environment, the particle diameters aresmall. Under such conditions, mass transfer is limited byinterfacial mass transport and Eq. (4) provides a reasonableestimation of the aerosol uptake coefficient (Haggerstone etal., 2005).
The particle radius and number population, used to de-termine the aerosol surface area, were measured with aScanning Mobility Particle Sizer (SMPS) (0–1 µm) and aAerosol Particle Sizer (APS) (1–10 µm) (Allan et al., 2009)at a height of 30 m. The average aerosol surface areaobserved at the CVAO at this height during the projectwas∼1×10⁻⁶ cm2 cm−3. For particles of 0–1 µm diame-ter (which encompasses the bulk of the aerosols at the site) a
dry aerosol distribution was determined. At an average am-bient humidity of∼80% the radius of sea-salt aerosols areexpected to grow by a factor of∼1.4 (Allan et al., 2009),leading to an ambient aerosol surface area of roughly a fac-tor of 2 (radius2) larger for this size range. A strong gradi-ent in the aerosol surface area at the ground to a height of∼12 m has recently been recorded at the site (von Glasow,2009). It is estimated from these gradient measurements thatthe aerosol surface area is approximately a factor of 2 greaterat the height of the FAGE nozzle (∼3.5 m) compared withthe aerosol surface area at 30 m. To account for the differ-ence in sampling height and aerosol growth factors an aerosolsurface area of 4×10⁻⁶ cm2 cm−3 was used in model cal-culations. An uptake coefficient (γ ) of 0.1 was used basedon recent recommendations (Taketani et al., 2008). Sensitiv-ity analyses have been performed on the aerosol uptake (seeSect. 3.4 for further details).
A surface deposition term for HO2 was also considered.The deposition velocity (VD) of HO2 was estimated usingthe NOAA/COARE air/sea gas exchange parameterization(Fairall et al., 2007). The deposition velocity of HO2 is re-lated to the flux (F ) of HO2 at a given height above the sur-face (z) by:
F = −VD × [HO2](z) (6)
VD can be determined given knowledge of the sum of air-side(Ra) and water-side (Rw) resistances (Fairall et al., 2000):
VD =
(1
Ra+ (Rw/α)
)(7)
whereα is the dimensionless solubility (a function of species,temperature and salinity). The air-side resistance,Ra, repre-sents the sum of the aerodynamic resistance (R1) and gas-phase film resistance (R2). Assuming that the atmosphericsurface layer is neutrally stable thenR1 can be determinedusing Eq. (8):
R1 =U(z)
u2∗
=1
κu∗ln
(z
z0
)(8)
whereU(z) is the mean wind-speed at height (z), κ is thevon Karman constant (0.4),u∗, is the friction velocity, andz0, is the aerodynamic roughness length (Stull, 1988). Thegas-phase film resistance (R2) is determined by Eq. (9):
R2 =5
u∗S
2/3C (9)
whereSC is the Schmidt number.The water-side resistance (Rw) can be determined by
Eq. (10) (assuming the influence of turbulence is negligiblerelative to chemical reaction time-scale of HO2 in water):
Rw =1
√aDw
(10)
Atmos. Chem. Phys., 10, 1555–1576, 2010 www.atmos-chem-phys.net/10/1555/2010/
L. K. Whalley et al.: Chemistry of OH and HO2 radicals over the tropical Atlantic Ocean 1563
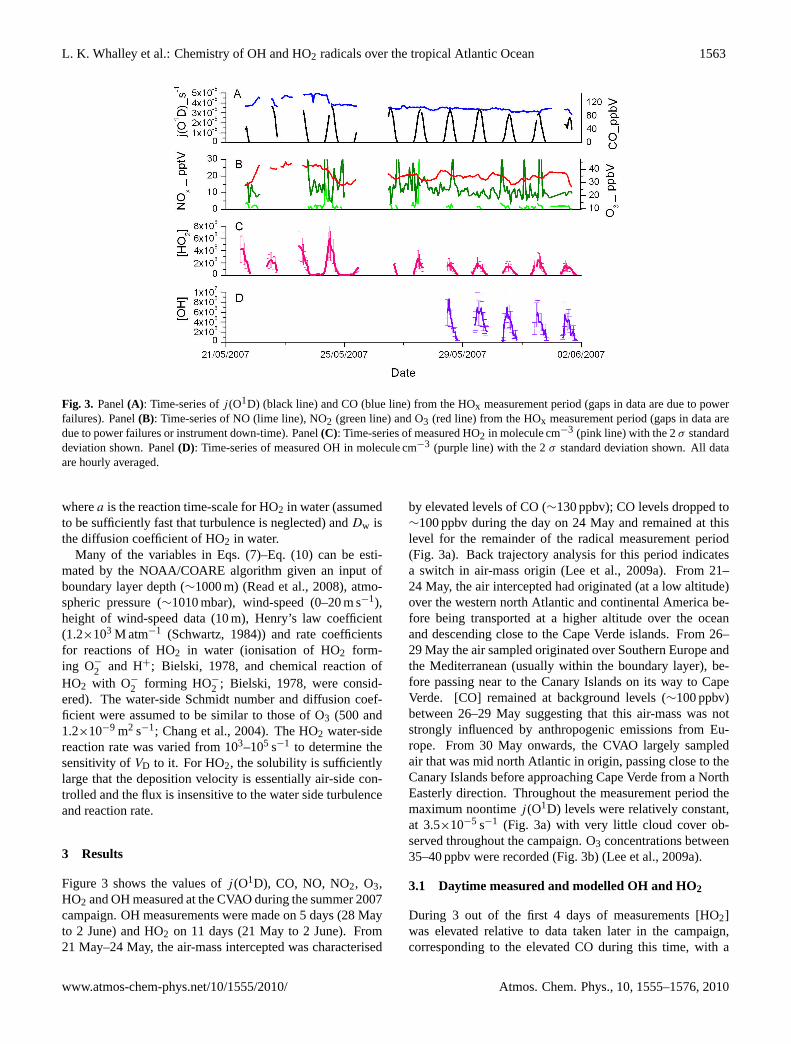
Fig. 3. Panel(A): Time-series ofj (O1D) (black line) and CO (blue line) from the HOx measurement period (gaps in data are due to powerfailures). Panel(B): Time-series of NO (lime line), NO2 (green line) and O3 (red line) from the HOx measurement period (gaps in data aredue to power failures or instrument down-time). Panel(C): Time-series of measured HO2 in molecule cm−3 (pink line) with the 2σ standarddeviation shown. Panel(D): Time-series of measured OH in molecule cm−3 (purple line) with the 2σ standard deviation shown. All dataare hourly averaged.
wherea is the reaction time-scale for HO2 in water (assumedto be sufficiently fast that turbulence is neglected) andDw isthe diffusion coefficient of HO2 in water.
Many of the variables in Eqs. (7)–Eq. (10) can be esti-mated by the NOAA/COARE algorithm given an input ofboundary layer depth (∼1000 m) (Read et al., 2008), atmo-spheric pressure (∼1010 mbar), wind-speed (0–20 m s−1),height of wind-speed data (10 m), Henry’s law coefficient(1.2×10³ M atm−1 (Schwartz, 1984)) and rate coefficientsfor reactions of HO2 in water (ionisation of HO2 form-ing O−2 and H+; Bielski, 1978, and chemical reaction ofHO2 with O−2 forming HO−2 ; Bielski, 1978, were consid-ered). The water-side Schmidt number and diffusion coef-ficient were assumed to be similar to those of O3 (500 and1.2×10−9 m2 s−1; Chang et al., 2004). The HO2 water-sidereaction rate was varied from 103–105 s−1 to determine thesensitivity ofVD to it. For HO2, the solubility is sufficientlylarge that the deposition velocity is essentially air-side con-trolled and the flux is insensitive to the water side turbulenceand reaction rate.
3 Results
Figure 3 shows the values ofj (O1D), CO, NO, NO2, O3,HO2 and OH measured at the CVAO during the summer 2007campaign. OH measurements were made on 5 days (28 Mayto 2 June) and HO2 on 11 days (21 May to 2 June). From21 May–24 May, the air-mass intercepted was characterised
by elevated levels of CO (∼130 ppbv); CO levels dropped to∼100 ppbv during the day on 24 May and remained at thislevel for the remainder of the radical measurement period(Fig. 3a). Back trajectory analysis for this period indicatesa switch in air-mass origin (Lee et al., 2009a). From 21–24 May, the air intercepted had originated (at a low altitude)over the western north Atlantic and continental America be-fore being transported at a higher altitude over the oceanand descending close to the Cape Verde islands. From 26–29 May the air sampled originated over Southern Europe andthe Mediterranean (usually within the boundary layer), be-fore passing near to the Canary Islands on its way to CapeVerde. [CO] remained at background levels (∼100 ppbv)between 26–29 May suggesting that this air-mass was notstrongly influenced by anthropogenic emissions from Eu-rope. From 30 May onwards, the CVAO largely sampledair that was mid north Atlantic in origin, passing close to theCanary Islands before approaching Cape Verde from a NorthEasterly direction. Throughout the measurement period themaximum noontimej (O1D) levels were relatively constant,at 3.5×10⁻⁵ s−1 (Fig. 3a) with very little cloud cover ob-served throughout the campaign. O3 concentrations between35–40 ppbv were recorded (Fig. 3b) (Lee et al., 2009a).
3.1 Daytime measured and modelled OH and HO2
During 3 out of the first 4 days of measurements [HO2]was elevated relative to data taken later in the campaign,corresponding to the elevated CO during this time, with a
www.atmos-chem-phys.net/10/1555/2010/ Atmos. Chem. Phys., 10, 1555–1576, 2010

1564 L. K. Whalley et al.: Chemistry of OH and HO2 radicals over the tropical Atlantic Ocean
Fig. 4. Panel(A): Time-series of measured HO2 in molecule cm−3 (pink line) with the 2σ standard deviation shown and MCM calculated[HO2] (base-case scenario, see text for details) (black line). Panel(B): Time-series of measured OH in molecule cm−3 (purple line) withthe 2σ standard deviation shown, and MCM [OH] calculated (base-case scenario, see text for details) (black line). All data represent a 1 haverage.
maximum of∼6×10⁸ molecule cm−3 (∼24.5 pptv) recordedon 24 May (Fig. 3c); [NOx] were elevated on this day andmay indicate a local pollution source. MCM model es-timates of [HO2] over this period are also elevated rela-tive to model estimates for later in the campaign (Fig. 4a),although peak MCM modelled [HO2] from this period isonly ∼3×10⁸ molecule cm−3, suggesting either a missingsource of HO2, or an over-estimation of the HO2 sinks inthe model; the modelled [HO2] estimates are∼39% lowerthan those measured during this phase (falling outside the1 σ measurement uncertainty). The daily variability ob-served in [HO2] during this period is also not captured by themodel; on 22 May, measured [HO2] was significantly lowerat ∼3×10⁸ molecule cm−3, but this drop in [HO2] was notreflected in the model. The lack of variability in the modelledHO2 may be due, in part, to the use of a constant average di-urnal cycle for IO and BrO, constant heterogeneous lossesand/or constant [HCHO]. Sensitivity analyses of [HO2] toeach of these modelled parameters have been performed andare presented in Sect. 3.4.
After 26 May the peak measured [HO2] were lower∼2–4×10⁸ molecule cm−3, and are mirrored by the model. Themodel is in much better agreement with [HO2] measurementsduring this phase, overestimating [HO2] by 16% on average;this is within the 1σ measurement uncertainty of 20%.
OH measurements were also made during the sec-ond measurement period (Fig. 3c). Peak concentrationsof 6–9×10⁶ molecule cm−3 were recorded; the midday[OH] gradually decreasing over the 5 days. The model
under-predicted [OH] on average by 18%, although againthis is within the 1σ measurement uncertainty.
3.2 Nighttime measured and modelled HO2
Low concentrations (∼0.6 pptv) of HO2 were measured ontwo nights (24 and 25 May); due to the instrumental diffi-culties, outlined in Sect. 2.1 no nightime OH measurementswere made. Model estimates of nighttime HO2 significantlyunder-predict the observations, however (Fig. 5). As reportedby Read et al. (2008) a daily O3 destruction cycle is observ-able at the CVAO, with the majority of this loss due to pho-tolysis of O3 and subsequent reaction of O(1D) with H2Ovapour and via catalytic cycles involving IO and BrO. TheO3 concentration is replenished during the night by entrain-ment of air from the free tropopshere that is richer in O3,followed by advection to the site (Read et al., 2008). TheHO2 concentration was observed to decrease to a minimumat∼21:30 and then slowly increase throughout the remainderof the night, analogous to the observed nighttime O3 profile,suggesting that the entrained air during the night is providinga source of radicals.
The nighttime generation of OH and HO2 in the MCMbox model is from reactions of O3 with alkenes, specifi-cally propene (∼72%) and isoprene and its oxidation prod-ucts (∼25%). The reaction of NO3 with alkenes is not a sig-nificant source of HO2, unlike Mace Head (Salisbury et al.,2001). The OH generated from O3 + alkene reactions reactswith acetaldehyde and methane, leading to the formation of
Atmos. Chem. Phys., 10, 1555–1576, 2010 www.atmos-chem-phys.net/10/1555/2010/

L. K. Whalley et al.: Chemistry of OH and HO2 radicals over the tropical Atlantic Ocean 1565
Fig. 5. Time-series of nightime [HO2] measured on two consecutive nights. The red line represents the measured HO2, with the 2σ standarddeviation shown. The grey and black lines represent modelled [HO2] when the model is left unconstrained to PAN and when [PAN] is heldat 100 pptv respectively.
peroxy radicals, which in turn, through self reaction or reac-tion with NO generate HO2. Alternatively, OH reacts withCO, generating HO2 directly. The OH and HO2 radicals arestrongly coupled at night with∼37% of OH formed fromthe O3+HO2 reaction. The model underestimation of HO2 atnight may derive from an unmeasured alkene, possibly onethat is biogenic in origin. Phytoplankton in oceans are knownto produce a large suite of VOCs (Moore et al., 1994; Shawet al., 2003). It is likely, however, that this source would alsobe present in the daytime, and so would have to be includedas an OH sink.
The entrainment of peroxyacetyl nitrate (PAN) may alsoact as a nighttime (as well as daytime) source of radicals. Inthe modelling presented thus far, PAN is unconstrained in themodel, and the modelled concentration peaks at∼100 pptvat∼15:00, corresponding to the peak in NO2 and then de-creases to∼10 pptv during the night. The thermal decom-position lifetime of PAN is just 20 min at 300 K (Bridier etal., 1991), and entrainment of air from the cooler free tropo-sphere (where the PAN lifetime will be much longer) couldlead to the rapid decomposition of the molecule, leading toan additional source of radicals. To test this hypothesis, thePAN concentration was constrained in the model to a con-stant 100 pptv (during both the day and night). Runningthe model with constrained PAN improves the modelled tomeasured HO2 throughout the day and night (Fig. 5). Ja-cobi et al. (1999) have reported PAN concentrations mea-sured during a cruise of the R/V Polarstern from Cape Town(South Africa) to Bremerhaven (Gemany) in May/June 1998.
Whilst cruising a maximum of 500 km west of the Africancoast, corresponding to 20◦W–15◦ E, (CVAO is ∼500 kmwest of the coast) PAN concentrations north of 10◦N (CVAOis at 16◦ 51′49) only dropped below 100 pptv on two days.In contrast to these findings, Gallagher et al. (1990) foundthat between 7◦ N–64◦N and 20◦W–50◦W in late summerthat PAN concentrations in the north Atlantic ranged from<1 pptv–40 pptv. Similarly, Muller and Rudolph (1992) didnot measure PAN above the LOD of 10 pptv in the tropics(30◦N–30◦ S) when crusising at 30◦W. The proximity of themeasurement sites to the African coast seems to strongly in-fluence the PAN content of the sampled air-masses (Jacobiet al., 1999). Trajectory analysis from the RHaMBLe cam-paign indicated that for 21–25 May (during which time thenighttime measurements of HO2 were made) the air-massesintercepted at the CVAO were influenced by the US conti-nent. In such air-masses the PAN content may have beenenhanced, and, therefore, could act as an important radicalsource. Measurements of PAN at the site are necessary toconfirm this hypothesis.
3.3 Rate of production and destruction analysis
Figure 6 shows the instantaneous rates of production (ROPA)and rates of destruction analyses (RODA) for OH and HO2 atsolar noon (averaged for the period 12:00–13:00 LT – localtime) as determined by the MCM. The ROPA and RODAare averaged over all days for which there are respectivemeasurements of OH and HO2. Figure 7 shows the diurnal
www.atmos-chem-phys.net/10/1555/2010/ Atmos. Chem. Phys., 10, 1555–1576, 2010

1566 L. K. Whalley et al.: Chemistry of OH and HO2 radicals over the tropical Atlantic Ocean
Fig. 6. Pie-charts showing the MCM (base-case scenario, see text for details) average diurnal modelled OH and HO2 sources and sinksbetween 12:00–13:00.
variation of the MCM calculated rates of production anddestuction of OH and HO2 for different chemical processes,again averaged over the days when there are radical measure-ments. It should be noted that several of the pathways serveto inter-convert OH to HO2, or vice versa, and so, overall, donot lead to an increase or decrease in the total HOx.
The photolysis of O3 and subsequent reaction with H2Ovapour represents the dominant OH source, accounting for∼76% of its production at solar noon. The photolysis ofH2O2 and CH3OOH are much smaller OH sources (∼3%combined); at steady state these peroxides reach levels of∼500 pptv and∼1 ppbv respectively in the model, similar inmagnitude to observations of peroxides at Cape Grim (Ayerset al., 1996; Monks et al., 1998) and also in the Cape Verderegion during the ALBATROSS cruise (Weller et al., 2000).The recycling of HO2 to OH, via reaction with NO and O3,also act as small additional OH sources. The hypohalousacids, HOI and HOBr, which are generated by the reaction ofHO2 with IO and BrO respectively (Fig. 1), may be photol-ysed to OH or taken up on aerosol surfaces. An uptake coef-ficient for HOI and HOBr loss onto aerosols ofγHOX=0.061was assumed, consistent with experimental data (Mossingerand Cox, 2001). Under this scenario, the photolysis of HOIand HOBr contributes∼13% to the instantaneous OH forma-tion. There is some uncertainty in theγHOX assumed, withsome studies speculating that it may be an order of mag-nitude higher in the MBL (Abbatt and Waschewsky, 1998;Wachsmuth et al., 2002). The sensitivity of the modelled[OH] to this parameter is investigated in Sect. 3.4.2.
The reactions of OH with CO and acetaldehyde are the ma-jor OH losses (∼28% and∼25% respectively). The sourceof acetaldehyde at remote marine locations, such as CapeVerde, has not been determined conclusively and remainssubject to debate. Acetaldehyde is formed by the oxidationof primary hydrocarbons, it may derive from direct terres-trial emissions or from the photochemical degradation of or-ganic matter in the oceans (Singh et al., 2001 and referencestherein). Singh et al. (2003) have inferred from aircraft mea-surements of acetaldehyde that the surface waters of the Pa-cific are greatly supersaturated with acetaldehyde and mayact as a large oceanic source. Read et al. (2010) suggest thatan oceanic flux of acetaldehyde is a likely source of the ob-served acetaldehyde concentrations in the Cape Verde regionalso. In contrast to acetaldehyde, the other oxygenated VOCsthat were measured (acetone and methanol) play only a mi-nor role as an OH sink (contained within “other” in Fig. 6).Other sinks include reaction with methane, H2, O3, HO2,HCHO and peroxides. Reaction of OH with NO2, C2–C5hydrocarbons (NMHC) and MCM calculated chemical inter-mediates from OH oxidation of NMHC (oxygenated VOCsand organo-nitrates) all account for a small fraction of theOH loss, and are contained within the “other” segment also.
HO2 sources are dominated by the reaction of OHwith CO (∼41%) and, to a smaller extent, CH3O withO2 (∼16%); the source of CH3O is the reaction ofCH3O2 with NO. The presence of a small quantity ofNO (∼1.5 pptv) at the site serves to slightly enhance HO2levels overall, because although HO2+NO removes HO2
Atmos. Chem. Phys., 10, 1555–1576, 2010 www.atmos-chem-phys.net/10/1555/2010/
L. K. Whalley et al.: Chemistry of OH and HO2 radicals over the tropical Atlantic Ocean 1567
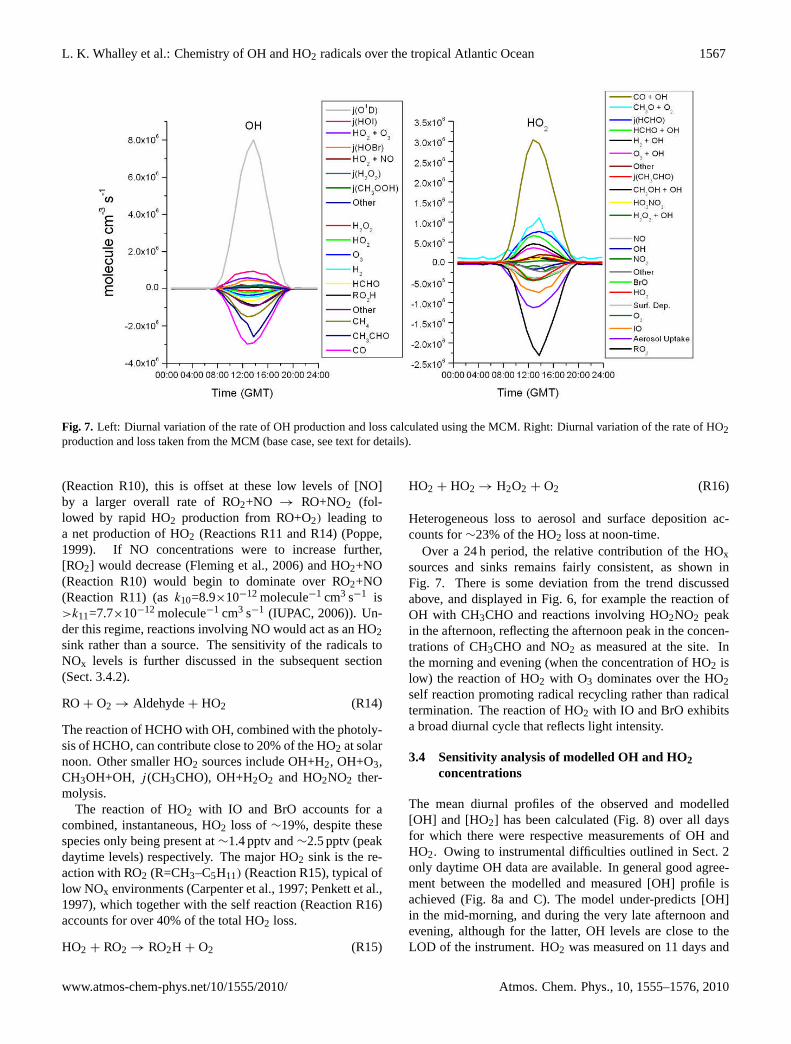
Fig. 7. Left: Diurnal variation of the rate of OH production and loss calculated using the MCM. Right: Diurnal variation of the rate of HO2production and loss taken from the MCM (base case, see text for details).
(Reaction R10), this is offset at these low levels of [NO]by a larger overall rate of RO2+NO → RO+NO2 (fol-lowed by rapid HO2 production from RO+O2) leading toa net production of HO2 (Reactions R11 and R14) (Poppe,1999). If NO concentrations were to increase further,[RO2] would decrease (Fleming et al., 2006) and HO2+NO(Reaction R10) would begin to dominate over RO2+NO(Reaction R11) (ask10=8.9×10⁻¹² molecule−1 cm3 s−1 is>k11=7.7×10⁻¹² molecule−1 cm3 s−1 (IUPAC, 2006)). Un-der this regime, reactions involving NO would act as an HO2sink rather than a source. The sensitivity of the radicals toNOx levels is further discussed in the subsequent section(Sect. 3.4.2).
RO+ O2→ Aldehyde+ HO2 (R14)
The reaction of HCHO with OH, combined with the photoly-sis of HCHO, can contribute close to 20% of the HO2 at solarnoon. Other smaller HO2 sources include OH+H2, OH+O3,CH3OH+OH, j (CH3CHO), OH+H2O2 and HO2NO2 ther-molysis.
The reaction of HO2 with IO and BrO accounts for acombined, instantaneous, HO2 loss of∼19%, despite thesespecies only being present at∼1.4 pptv and∼2.5 pptv (peakdaytime levels) respectively. The major HO2 sink is the re-action with RO2 (R=CH3–C5H11) (Reaction R15), typical oflow NOx environments (Carpenter et al., 1997; Penkett et al.,1997), which together with the self reaction (Reaction R16)accounts for over 40% of the total HO2 loss.
HO2 + RO2→ RO2H + O2 (R15)
HO2 + HO2→ H2O2 + O2 (R16)
Heterogeneous loss to aerosol and surface deposition ac-counts for∼23% of the HO2 loss at noon-time.
Over a 24 h period, the relative contribution of the HOxsources and sinks remains fairly consistent, as shown inFig. 7. There is some deviation from the trend discussedabove, and displayed in Fig. 6, for example the reaction ofOH with CH3CHO and reactions involving HO2NO2 peakin the afternoon, reflecting the afternoon peak in the concen-trations of CH3CHO and NO2 as measured at the site. Inthe morning and evening (when the concentration of HO2 islow) the reaction of HO2 with O3 dominates over the HO2self reaction promoting radical recycling rather than radicaltermination. The reaction of HO2 with IO and BrO exhibitsa broad diurnal cycle that reflects light intensity.
3.4 Sensitivity analysis of modelled OH and HO2concentrations
The mean diurnal profiles of the observed and modelled[OH] and [HO2] has been calculated (Fig. 8) over all daysfor which there were respective measurements of OH andHO2. Owing to instrumental difficulties outlined in Sect. 2only daytime OH data are available. In general good agree-ment between the modelled and measured [OH] profile isachieved (Fig. 8a and C). The model under-predicts [OH]in the mid-morning, and during the very late afternoon andevening, although for the latter, OH levels are close to theLOD of the instrument. HO2 was measured on 11 days and
www.atmos-chem-phys.net/10/1555/2010/ Atmos. Chem. Phys., 10, 1555–1576, 2010

1568 L. K. Whalley et al.: Chemistry of OH and HO2 radicals over the tropical Atlantic Ocean
Fig. 8. Panel(A): Average diurnal [OH] calculated for the 5 days of measurements (data on an hourly time-scale); the error bars representthe standard deviation of the data that were averaged (purple points and line). The modelled average diurnal (averaged over the 5 days of OHmeasurements) is also shown (MCM= grey line). Panel(B): Average diurnal [HO2] calculated for the 11 days of measurements (data on anhourly time-scale); the error bars represent the standard deviation of the data that was averaged (pink points and line). The modelled averagediurnal (averaged over the 11 days of HO2 measurements) is also shown (MCM= black line). Panel(C): Solid line, with black squaresrepresents the (OH MCM modelled)/(OH measured) ratio averaged for 1 h over 24 h. Panel(D): Solid line represents the (HO2 MCMmodelled)/(HO2 measured ratio) averaged for 1 h, for a 24 h period. Red line in panels C and D represents modelled : measured ratio of 1.
2 nights, enabling a complete 24 h average diurnal profile tobe built up. Excellent agreement between observed and mod-elled [HO2] is achieved (Fig. 8b and d) during the daytime;during the nightime the [HO2] is replicated when the modelis constrained to a constant [PAN] of 100 pptv (Sect. 3.2).As highlighted in Figs. 3 and 4 (and discussed in Sect. 3.1),significant variability was observed in the measured dailypeak [HO2], certainly when different air-masses were inter-cepted; this variability was not replicated in model simula-tions to the same extent and so the agreement between themodelled and measured [HO2] in Fig. 8 may be slightly for-tuitous. It should be noted, however, that owing to the moreextensive data coverage during the latter half of the measure-ment period, when the agreement between the daily mod-elled and observed [HO2] was at its best (Fig. 4), the di-urnal profiles will be more heavily weighted to this phase.Several key modelled parameters that control the productionand loss of HO2 have been identified in Sect. 3.3, a num-ber of which were either held at constant values ([HCHO]and heterogeneous chemistry) or used a constant diurnal pro-file ([XO]) within the model. A number of model scenar-ios in which these parameters are varied have been run to
determine the impact of these on the modelled [HO2] (and[OH]) and to assess whether varying these parameters couldaccount for the daily variability in the observations. Table 2lists the changes made and their impact on modelled [HO2],and Fig. 9 shows the impact on the diurnal variation of themodelled-to-measured ratio of [HO2]. The uptake coeffi-cient of the hypohalous acids has also been varied, in accordwith reported literature values, to determine the sensitivity of[OH] (and [HO2]) to this:
3.4.1 HCHO
As discussed in Sect. 3.3, the reaction of OH with HCHOand HCHO photolysis are sources of HO2. The model thusfar has been constrained to a constant HCHO concentrationof 328 pptv, which is the mean HCHO concentration ob-served during May 2007, as measured using the LP-DOASduring its 8 month deployment at the observatory. It shouldbe noted, however, that throughout the 8 months [HCHO]were variable, dropping below the LOD of the LP-DOAS(∼200 pptv) at times and elevated in polluted air-masses.Recent analysis of the HCHO data during the RHaMBLemeasurement intensive has highlighted that [HCHO] were
Atmos. Chem. Phys., 10, 1555–1576, 2010 www.atmos-chem-phys.net/10/1555/2010/

L. K. Whalley et al.: Chemistry of OH and HO2 radicals over the tropical Atlantic Ocean 1569
Table 2. List of parameters that have been varied to optimise the HO2 modelled to measured agreement. The daytime % change was averagedfrom 08:44–19:44; the nighttime % change was averaged from 19:44–08:44.
Model Parameter Parameter Change Av. % Change Av. % Change Av. % Changein HO 2 (day) in HO2 (night) in OH (day)
HCHO 328 pptv→ 100 pptv −8 0 +2HCHO 328 pptv→2000 pptv +60 +1 −9Halogen chemistry XO chemistry switched off +12 +2 −12Halogen chemistry (modified XO chemistry switched off +18 0 −9[NOx] & [NOx] → doubledHypohalous acid chemistry γHOX=0.061→ 0.61 −2 0 −4Aerosol uptake Included→ Not included +29 +59 +7Surface deposition Included→ Not included +9 +16 +2
Heterogeneous losses No heterogeneous loss, +52 +104 −3& halogen chemistry no IO chemistry, [BrO]×1.4
Fig. 9. (HO2 MCM modelled)/(HO2 measured) ratio for a number of different model scenarios. Black line = base case scenario (with[PAN]= 100 pptv) , all other scenarios are based on this model with the specified (see legend) parameters adjusted. Red line represents an(HO2 MCM modelled)/(HO2 measured) of 1. See text and Table 2 for further details.
extremely elevated (∼2 ppbv) on the 23 and 24 May (andalso on the 27 and 28 May, although HO2 data is limitedduring this second period due to power cuts). These largeexcursions from the more typical [HCHO] used in the modelcould account for the model’s failure to replicate the elevated[HO2] observed at the beginning of the measurement period(Fig. 4).
Two model runs whereby [HCHO] was reduced to100 pptv (Fig. 9, grey line) and increased to 2 ppbv (Fig. 9,pink line) have been performed. Reducing the HCHOconcentration from 328 pptv to 100 pptv decreases [HO2]by ∼8% during the daytime, but does not effect the night-time levels of HO2 (Table 2); at [HCHO] of 2 ppbv, [HO2]
increases by∼60% on average from the base-case scenario.Approximately a 140% increase in the base-case model isrequired to match the elevated [HO2] observed at the begin-ning of the measurement period. This remaining discrep-ancy may indicate that the model is missing other additionalHO2 sources at this time or potentially that the HO2 sinksare over-estimated by the model at this time (see Sect. 3.4.2and 3.4.3). During the ALBATROSS cruise, up to 1 ppbv ofHCHO was observed in the tropical mid-Atlantic (Brauerset al., 2001) and∼750 pptv was recorded in the Cape Verderegion (Weller et al., 2000). At Cape Grim, Tasmania duringthe SOAPEX-2 campaign, during clean conditions, [HCHO]was measured around noon from 217–352 pptv (with 50%
www.atmos-chem-phys.net/10/1555/2010/ Atmos. Chem. Phys., 10, 1555–1576, 2010

1570 L. K. Whalley et al.: Chemistry of OH and HO2 radicals over the tropical Atlantic Ocean
error) (Sommariva et al., 2004). The source of the high[HCHO] observed during RHaMBLe may be caused by long-range transport of polluted air from America; this will befurther investigated in future publications (Mahajan et al.,2010).
3.4.2 Halogen chemistry
The inclusion of a halogen scheme has been shown to im-prove the HO2 modelled to measured agreement at a num-ber of marine locations (Bloss et al., 2005b; Smith et al.,2006; Sommariva et al., 2006; Kanaya et al., 2007). Som-mariva et al. (2006) report that combined, IO and BrO ac-counted for∼30% of the HO2 loss term during the NAM-BLEX campaign at [IO]=4 pptv and [BrO]=6.5 pptv. Switch-ing the halogen chemistry off in the Cape Verde model servesto increase [HO2] by ∼12% during the daytime and∼2%during the night. [OH] decreases by∼12%. Sommariva etal. (2006) found that the modelled to measured HO2 agree-ment could be improved further during the NAMBLEX cam-paign by making the assumption that the source of IO was notevenly distributed over the DOAS light-path, rather it wasconcentrated by the shore close to the HO2 FAGE measure-ments, and as a consequence [IO] was∼10 times higher bythe FAGE inlet. There are no macro-algae beds around theCape Verde islands unlike Mace Head that could be acting asa source of IO and so it is unlikely that there is a hotspot ofIO production by the CVAO; this is supported by the goodmodelled to measured HO2 agreement that exists when it isassumed that the [IO] is evenly distributed throughout theDOAS lightpath, representative of an oceanic source. If therewere some variability in the oceanic emissions from day today this could account for some of the variability observedin the HO2 concentrations.
As discussed in Sect. 3.3, the overall impact of halo-gen chemistry on the OH concentration will be dependentupon the uptake coefficient assumed for the hypohalous acidspecies. To investigate the sensitivity of [OH] and [HO2] tothis parameter, a model run was performed in whichγHOXwas increased 10 fold from the base-case run (see Table 2).The [OH] was found to decrease by 4% during the day and sounder this scenario the impact of halogen oxides upon [OH]and on the oxidising capacity is reduced, although the pho-tolysis of HOI and HOBr is still acting as a significant OHsource. The [HO2] during the daytime is also reduced by 2%under this scenario as a consequence of the reduction in therate of reaction of OH with CO.
The presence of halogen oxides not only serves to modifythe HOx chemistry, but also the NOx chemistry by accelerat-ing NOx oxidation through Reactions (R7) and (R17). Thusfar, the impact of IO and BrO on NOx chemistry has not beenconsidered, yet any change in the NO:NO2 ratio can perturbthe OH:HO2 ratio by changing the rate of Reactions (R10)and (R11).
XO + NO2 + M→ XONO2 + M (R17)
Keene et al. (2009) report a reduction in [OH] in a modellingstudy when halogen oxide chemistry was included as a con-sequence in the reduction in the secondary formation of OHvia Reaction R10 (Keene et al., 2009). Modelling studiesindicate that NOx levels could approximately double in theabsence of halogen oxides in environments similar to CapeVerde (Keene et al., 2009). To simulate the overall impactof halogen oxides, taking into account that NOx levels maybe significantly perturbed due to the presence of halogens,a model run, initialised with no halogens and a factor oftwo increase in the NOx concentration, has been performed.In contrast to Keene et al. (2009), OH concentrations werefound to be 9% larger in the presence of halogen oxides com-pared to in the absence of halogen oxides (but with double[NOx]) (Table 2); the perturbation of the NOx chemistry byhalogen oxides offsets the instantaneous OH formation viaHOI and HOBr photolysis by∼3%. Keene et al. (2009) con-sider the impact of BrO and ClO only; no IO measurementswere made. The rate coefficient for reaction of ClO withHO2 (5×10⁻¹² molecule−1 cm3 s−1; IUPAC, 2006) is a fac-tor of two times smaller than the rate coefficient for reactionof ClO with NO (1.7×10⁻¹¹ molecule−1 cm3 s−1; IUPAC,2006). Depending on [HO2] and [NO], the presence of ClOcan effectively lead to a reduction in [OH], as presented byKeene et al. (2009). Conversely, the rate coefficient for reac-tion of IO with HO2 (8.4×10⁻¹¹ molecule−1 cm3 s−1; IU-PAC, 2006) is larger than the rate coefficient for reactionof IO with NO (1.96×10⁻¹¹ molecule−1 cm3 s−1; IUPAC,2006) and so the presence of IO, in low NOx environments,serves to increase [OH]. The absence of IO chemistry in themodel used by Keene et al. (2009) could account for the dif-ferences in the modelled impacts of halogens on [OH]. Thedifference between the two model scenerios in which halo-gen chemistry is switched off and NOx chemistry is (a) con-strained to observations and (b) is doubled, allows the im-pact of variable [NOx] upon [OH] and [HO2] to be assessed.On average, modelled [OH] and [HO2] increased by a fur-ther 3% and 6% respectively via increases in Reactions (R10)and (R11) when [NOx] was set to twice the observations. Asdiscussed above, halogen oxides can perturb this chemistryand need to be condsidered alongside NOx to predict howpotential changes in [NOx] may impact [HOx] in this envi-ronment.
3.4.3 Heterogeneous losses of HO2
Heterogeneous loss of HO2 acts as a large HO2 sink(Sect. 3.3). If the uptake onto aerosol surfaces is assumednegligible, modelled [HO2] increases by 29% during thedaytime and by 59% at night, leading to a large modelledHO2 over-prediction. A change in the aerosol surface areaand/or composition could account for some of the daily vari-ability observed in HO2. Thornton et al. (2008) report thatthe uptake coefficient for HO2 may vary considerably withchanges in aerosol composition. Certainly, if heterogenous
Atmos. Chem. Phys., 10, 1555–1576, 2010 www.atmos-chem-phys.net/10/1555/2010/
L. K. Whalley et al.: Chemistry of OH and HO2 radicals over the tropical Atlantic Ocean 1571
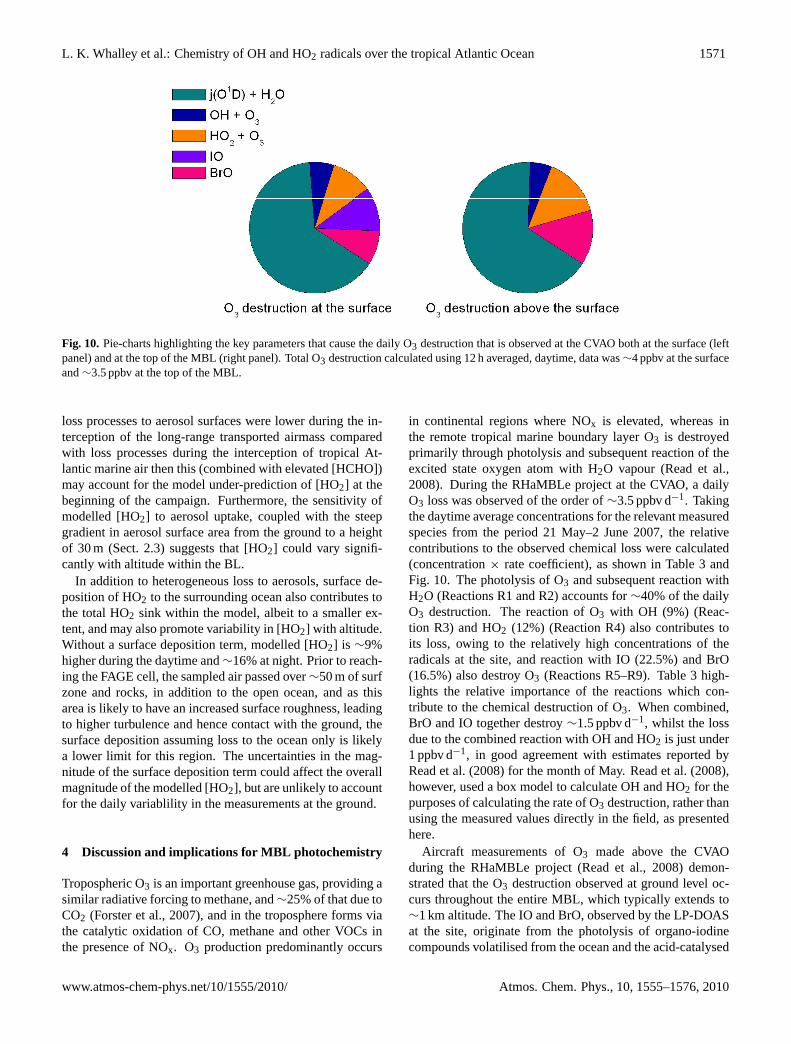
Fig. 10. Pie-charts highlighting the key parameters that cause the daily O3 destruction that is observed at the CVAO both at the surface (leftpanel) and at the top of the MBL (right panel). Total O3 destruction calculated using 12 h averaged, daytime, data was∼4 ppbv at the surfaceand∼3.5 ppbv at the top of the MBL.
loss processes to aerosol surfaces were lower during the in-terception of the long-range transported airmass comparedwith loss processes during the interception of tropical At-lantic marine air then this (combined with elevated [HCHO])may account for the model under-prediction of [HO2] at thebeginning of the campaign. Furthermore, the sensitivity ofmodelled [HO2] to aerosol uptake, coupled with the steepgradient in aerosol surface area from the ground to a heightof 30 m (Sect. 2.3) suggests that [HO2] could vary signifi-cantly with altitude within the BL.
In addition to heterogeneous loss to aerosols, surface de-position of HO2 to the surrounding ocean also contributes tothe total HO2 sink within the model, albeit to a smaller ex-tent, and may also promote variability in [HO2] with altitude.Without a surface deposition term, modelled [HO2] is ∼9%higher during the daytime and∼16% at night. Prior to reach-ing the FAGE cell, the sampled air passed over∼50 m of surfzone and rocks, in addition to the open ocean, and as thisarea is likely to have an increased surface roughness, leadingto higher turbulence and hence contact with the ground, thesurface deposition assuming loss to the ocean only is likelya lower limit for this region. The uncertainties in the mag-nitude of the surface deposition term could affect the overallmagnitude of the modelled [HO2], but are unlikely to accountfor the daily variablility in the measurements at the ground.
4 Discussion and implications for MBL photochemistry
Tropospheric O3 is an important greenhouse gas, providing asimilar radiative forcing to methane, and∼25% of that due toCO2 (Forster et al., 2007), and in the troposphere forms viathe catalytic oxidation of CO, methane and other VOCs inthe presence of NOx. O3 production predominantly occurs
in continental regions where NOx is elevated, whereas inthe remote tropical marine boundary layer O3 is destroyedprimarily through photolysis and subsequent reaction of theexcited state oxygen atom with H2O vapour (Read et al.,2008). During the RHaMBLe project at the CVAO, a dailyO3 loss was observed of the order of∼3.5 ppbv d−1. Takingthe daytime average concentrations for the relevant measuredspecies from the period 21 May–2 June 2007, the relativecontributions to the observed chemical loss were calculated(concentration× rate coefficient), as shown in Table 3 andFig. 10. The photolysis of O3 and subsequent reaction withH2O (Reactions R1 and R2) accounts for∼40% of the dailyO3 destruction. The reaction of O3 with OH (9%) (Reac-tion R3) and HO2 (12%) (Reaction R4) also contributes toits loss, owing to the relatively high concentrations of theradicals at the site, and reaction with IO (22.5%) and BrO(16.5%) also destroy O3 (Reactions R5–R9). Table 3 high-lights the relative importance of the reactions which con-tribute to the chemical destruction of O3. When combined,BrO and IO together destroy∼1.5 ppbv d−1, whilst the lossdue to the combined reaction with OH and HO2 is just under1 ppbv d−1, in good agreement with estimates reported byRead et al. (2008) for the month of May. Read et al. (2008),however, used a box model to calculate OH and HO2 for thepurposes of calculating the rate of O3 destruction, rather thanusing the measured values directly in the field, as presentedhere.
Aircraft measurements of O3 made above the CVAOduring the RHaMBLe project (Read et al., 2008) demon-strated that the O3 destruction observed at ground level oc-curs throughout the entire MBL, which typically extends to∼1 km altitude. The IO and BrO, observed by the LP-DOASat the site, originate from the photolysis of organo-iodinecompounds volatilised from the ocean and the acid-catalysed
www.atmos-chem-phys.net/10/1555/2010/ Atmos. Chem. Phys., 10, 1555–1576, 2010

1572 L. K. Whalley et al.: Chemistry of OH and HO2 radicals over the tropical Atlantic Ocean
Table 3. The rates of the rate-limiting O3 destruction steps and their percentage contribution towards O3 destruction both in the surface layerand at the top of the MBL (1 km), see text for details.
O3 destruction Contribution to O3 destruction Contribution to O3rate determining at the surface destruction at the top of thestep (molecule cm−3 s−1) BL (molecule cm−3 s−1)
O1D+H2O 9×10⁵ (40%) 9×10⁵ (45%)OH+O3 2.1×10⁵ (9%) 2×10⁵ (9%)HO2+O3 2.6×10⁵ (12%) 3.8×10⁵ (18%)IO+IO 7.2×10⁴ (3%) 0%IO+HO2 3.6×10⁵ (16%) 0%IO+NO 2.7×10⁴ (1%) 0%IO+BrO 1.1×10⁵ (5%) 0%BrO+BrO 1.4×10⁴ (1%) 2.7×10⁴ (1%)BrO+HO2 2.1×10⁵ (10%) 4.5×10⁵ (22%)BrO+NO 6.7×10⁴ (3%) 9.4×10⁴ (5%)Total 2.2×10⁶ (3.91 ppbv d−1) 2.0×10⁶ (3.59 ppbv d−1)
activation of bromine from sea-salt aerosols, respectively(Read et al., 2008). There is some evidence to suggestthat [BrO] may increase with altitude in the MBL (vonGlasow et al., 2002) owing to an increase in the acidity ofsea salt aerosols with altitude which enables acid catalysedbromine activation to occur more efficiently (von Glasowand Sander, 2001). It is uncertain, given the surface sourceof organo-iodine compounds and the short atmospheric life-time of IO (∼50 s), whether this molecule also prevailsthroughout the MBL. The rate of heterogeneous loss of HO2by uptake to aerosol surfaces and by surface deposition tothe ocean (and/or rocky foreshore) will be at a maximumat ground level. The HO2 measurements were made just3.5 m a.s.l. and, as discussed above, heterogeneous lossescould reduce [HO2] at the ground by∼38% during the day-time. As a consequence of this, the HO2 concentration couldincrease with altitude in the boundary layer, and hence therate of destruction of O3 by the HO2+O3 reaction will alsoincrease with altitude. Further increases in [HO2] with heightmay be expected as a consequence of a reduction in the [IO]with height.
A model scenario in which [IO], and heterogenous lossesare set to zero and [BrO] is increased by a factor of 1.4to simulate chemistry at the top of the MBL predicts that[HO2] could be 52% higher than at the surface during thedaytime (Table 2). Table 3 and Fig. 10, right panel, high-light the impact these changing parameters may have uponO3 destruction. A reduction in temperature (∼5◦C) is alsoconsidered as this has a small effect on the rate coefficientsused. An O3 loss rate of∼3.91 ppbv d−1 is predicted at thesurface and an O3 loss rate of∼3.59 ppbv d−1 at the topof the MBL (∼1 km). Although these analyses only con-sider the chemical processes that lead to a loss in O3 andneglect physical processes, such as surface deposition and
entrainment of O3, which can modify the overall O3 destruc-tion, this work demonstrates the increase in HO2 and BrOconcentrations is sufficient to compensate for the loss of IOat the higher altitudes. Aircraft measurements of HO2 madeover the Pacific during the Transport and Chemical Evolu-tion over the Pacific (TRACE-P) campaign (Cantrell et al.,2003) provides some evidence that HO2 concentrations in-crease over the first couple of kilometres. However, it isdifficult to draw strong conclusions from the dataset due tothe limited number of boundary layer observations that weremade. Leser et al. (2003) have reported MAX-DOAS mea-surements of BrO taken onboard the R/V Polarstern north ofthe Canary Islands. Significant boundary layer BrO was ob-served, of the order of 1 pptv, although the vertical distribu-tion within the boundary layer cannot be determined. Future,simultaneous observations of O3, HO2 and halogen oxidesfrom 0–1 km from an aircraft platform, therefore, would beextremely beneficial.
Methane is removed from the atmosphere through oxida-tion by OH (Levy, 1971) with∼25% of this removal oc-curring in the tropical MBL (Bloss et al., 2005a). In thiswork the important parameters which control the OH con-centration in this region have been quantified, a number ofwhich, until recently, have been overlooked, for examplechemical processes involving halogen species. Although thevertical extent in the MBL of the impact of halogen oxideson the HOx and O3 budgets, particularly for IO, remainsuncertain, these species constitute a significant source ofOH. Photolysis of HOBr and HOI lead to an increase in theOH concentration of∼12%, although this increase is off-set slightly (∼3%) by the perturbation of the NOx chem-istry (lowering [NO]) by halogen oxides as discussed inSect. 3.4.2 Overall, this work suggests that the methane life-time is reduced by∼9%, due to the presence of halogen
Atmos. Chem. Phys., 10, 1555–1576, 2010 www.atmos-chem-phys.net/10/1555/2010/

L. K. Whalley et al.: Chemistry of OH and HO2 radicals over the tropical Atlantic Ocean 1573
oxides leading to an increase in [OH]. In the current atmo-sphere, one added methane molecule absorbs infra-red ra-diation∼25 times more efficiently than one additional CO2molecule (Lelieveld et al., 1993) as CO2 is approximately200 times more abundant in the atmosphere and, as a conse-quence, many of its absorption bands are saturated. Currentestimates suggest that methane contributes a radiative forc-ing of +0.48 (±0.05) Wm−2 (Forster et al., 2007), which is∼33% of that due to CO2. Radiative forcing from methaneincreases approximately as the square root of its concentra-tion (Forster et al., 2007), and it is estimated that withouthalogen oxides, the lower [OH] would lead to an increase inthe radiative forcing by methane by∼3.5×10⁻³ Wm−2. Akey remaining question is the range of altitudes over whichhalogen oxides, particularly IO, extend. To fully determinethe global impact of the halogen oxides on the oxidising ca-pacity of the tropical BL, manifested through their effect on[OH], the vertical profile of these species in this region isrequired.
5 Summary
Measurements of OH and HO2 radicals, together with a suiteof supporting measurements, were made at the Cape VerdeAtmospheric Observatory on the island of Sao Vicente dur-ing May and June 2007.
A model using the Master Chemical Mechanism, and con-strained to the supporting measurements, was used to pre-dict OH and HO2 concentrations and to probe the chemistrycontrolling the radicals at the observatory. The halogen ox-ides, despite their low concentrations, were found to act asa significant HO2 sink (19%), with the subsequent photol-ysis of the hypohalous acids increasing the modelled [OH].The model was able to capture daytime radical concentrationreasonably well, with the model falling within the 1σ mea-surement uncertainty of 20%. During the night, the modelsignificantly under-predicts [HO2], we suggest that the ther-molysis of 100 pptv of PAN, entrained from the cooler airaloft could account for the model-measurement discrepancyat this time.
Active halogen chemistry over the tropical oceans, wherephotochemical oxidation is most prevalent, can significantlyimpact the global oxidising capacity via its effect on [OH].From this work, the calculated methane lifetime could be asmuch as 9% shorter in this region if halogen chemistry is in-cluded in the calculation of [OH]. Currently, halogen chem-istry is not routinely included in chemistry-transport modelsused to predict, for example, global distributions of tropop-sheric methane and O3.
Further measurements of OH and HO2 coupled with con-current measurements of halogen oxides, VOCs, HCHO,HONO, NOx, NOy and aerosol number and size distribu-tions are needed to describe the chemistry of this region morefully and further test the hypotheses raised here. Vertical
profiles of the concentrations of IO, BrO, OH, HO2 and O3are needed to discover if halogen chemistry has an impacton the budgets of OH, HO2 and O3 throughout the boundarylayer.
Acknowledgements.The authors would like to thank P. Halford-Maw and staff of the mechanical and electronic workshops withinthe School of Chemistry at the University of Leeds for their techni-cal assistance in maintaining and developing the FAGE instrument.Thanks also to G. McFiggans for leading the RHaMBLe project andL. Mendes and B. Faria for campaign and logistical organisationand to C. Seal for assistance with pack-up. The NERC SOLASproject is acknowledged for the funding of the CVAO and NCASfor the long-term support of the FGAM FAGE instrument. Thiswork was supported by NERC under grant number NE/D006589/1.
Edited by: R. von Glasow
References
Abbatt, J. P. D. and Waschewsky, G. C. G.: Heterogeneous inter-actions of HOBr, HNO3, O3, and NO2 with deliquescent NaClaerosols at room temperature, J. Phys. Chem. A, 102, 3719–3725, 1998.
Alicke, B., Hebestreit, K., Stutz, J., and Platt, U.: Iodine oxide inthe marine boundary layer, Nature, 397, 572–573, 1999.
Allan, B. J., McFiggans, G., Plane, J. M. C., and Coe, H.: Observa-tions of iodine monoxide in the remote marine boundary layer, J.Geophys. Res.- Atmos., 105, 14363–14369, 2000.
Allan, J. D., Topping, D. O., Good, N., Irwin, M., Flynn, M.,Williams, P. I., Coe, H., Baker, A. R., Martino, M., Niedermeier,N., Wiedensohler, A., Lehmann, S., Muller, K., Herrmann, H.,and McFiggans, G.: Composition and properties of atmosphericparticles in the eastern Atlantic and impacts on gas phase uptakerates, Atmos. Chem. Phys., 9, 9299–9314, 2009,http://www.atmos-chem-phys.net/9/9299/2009/.
Ayers, G. P., Penkett, S. A., Gillett, R. W., Bandy, B., Galbally, I. E.,Meyer, C. P., Elsworth, C. M., Bentley, S. T., and Forgan, B. W.:The annual cycle of peroxides and ozone in marine air at CapeGrim, Tasmania, J. Atmos. Chem., 23, 221-252, 1996.
Bielski, B. H. J.: Re-Evaluation of Spectral and Kinetic-Propertiesof HO2 and O−2 Free-Radicals, Photochem. Photobiol., 28, 645–649, 1978.
Bloss, W. J., Evans, M. J., Lee, J. D., Sommariva, R., Heard, D.E., and Pilling, M. J.: The oxidative capacity of the troposphere:Coupling of field measurements of OH and a global chemistrytransport model, Faraday Discuss., 130, 425–436, 2005a.
Bloss, W. J., Lee, J. D., Johnson, G. P., Sommariva, R., Heard, D. E.,Saiz-Lopez, A., Plane, J. M. C., McFiggans, G., Coe, H., Flynn,M., Williams, P., Rickard, A. R., and Fleming, Z. L.: Impact ofhalogen monoxide chemistry upon boundary layer OH and HO2concentrations at a coastal site, Geophys. Res. Lett., 32, L06814,doi:10.1029/2004GL022084, 2005b.
Bloss, W. J., Lee, J. D., Heard, D. E., Salmon, R. A., Bauguitte,S. J.-B., Roscoe, H. K., and Jones, A. E.: Observations of OHand HO2 radicals in coastal Antarctica, Atmos. Chem. Phys., 7,4171–4185, 2007,http://www.atmos-chem-phys.net/7/4171/2007/.
www.atmos-chem-phys.net/10/1555/2010/ Atmos. Chem. Phys., 10, 1555–1576, 2010
1574 L. K. Whalley et al.: Chemistry of OH and HO2 radicals over the tropical Atlantic Ocean
Brasseur, G. P., Hauglustaine, D. A., Walters, S., Rasch, P. J.,Muller, J. F., Granier, C., and Tie, X. X.: MOZART, a globalchemical transport model for ozone and related chemical trac-ers, 1. Model description, J. Geophys. Res.-Atmos., 103, 28265–28289, 1998.
Brauers, T., Hausmann, M., Bister, A., Kraus, A., and Dorn, H. P.:OH radicals in the boundary layer of the Atlantic Ocean, 1. Mea-surements by long-path laser absorption spectroscopy, J. Geo-phys. Res.-Atmos., 106, 7399–7414, 2001.
Bridier, I., Caralp, F., Loirat, H., Lesclaux, R.,Veyret, B., Becker, K. H., Reimer, A., and Zabel,F.: Kinetic and theoretical studies of the reactionsCH3C(O)O2+NO2+M←→CH3C(O)O2NO2+M between248 and 393 K and between 30–760 torr, J. Phys. Chem., 95,3594–3600, 1991.
Cantrell, C. A., Edwards, G. D., Stephens, S., Mauldin, R. L.,Zondlo, M. A., Kosciuch, E., Eisele, F. L., Shetter, R. E., Lefer,B. L., Hall, S., Flocke, F., Weinheimer, A., Fried, A., Apel, E.,Kondo, Y., Blake, D. R., Blake, N. J., Simpson, I. J., Bandy, A.R., Thornton, D. C., Heikes, B. G., Singh, H. B., Brune, W. H.,Harder, H., Martinez, M., Jacob, D. J., Avery, M. A., Barrick,J. D., Sachse, G. W., Olson, J. R., Crawford, J. H., and Clarke,A. D.: Peroxy radical behavior during the Transport and Chem-ical Evolution over the Pacific (TRACE-P) campaign as mea-sured aboard the NASA P-3B aircraft, J. Geophys. Res.-Atmos.,108(D20), 8797, doi:10.1029/2003JD003674, 2003.
Carpenter, L. J., Monks, P. S., Bandy, B. J., Penkett, S. A., Gal-bally, I. E., and Meyer, C. P.: A study of peroxy radicals andozone photochemistry at coastal sites in the northern and south-ern hemispheres, J. Geophys. Res.-Atmos., 102, 25417–25427,1997.
Carpenter, L. J., Sturges, W. T., Penkett, S. A., Liss, P. S., Alicke,B., Hebestreit, K., and Platt, U.: Short-lived alkyl iodides andbromides at Mace Head, Ireland: Links to biogenic sources andhalogen oxide production, J. Geophys. Res.-Atmos., 104, 1679–1689, 1999.
Carpenter, L. J., Lewis, A. C., Hopkins, J. R., Read, K. A., Lon-gley, I. D., and Gallagher, M. W.: Uptake of methanol to theNorth Atlantic Ocean surface, Global Biogeochem. Cy., 18, 4,doi:10.1029/2004GB002294, 2004.
Chameides, W. L. and Davis, D.: Iodine – its possible role in tro-pospheric photochemistry, J. Geophys. Res.-Atmos., 85, 7383–7398, 1980.
Chang, W., Heikes, B., and Lee, M.: Ozone deposition to the seasurface: chemical enhancement and wind speed dependence, At-mos. Environ., 38, 1053–1059, 2004.
Chen, G., Davis, D., Crawford, J., Heikes, B., O’Sullivan, D., Lee,M., Eisele, F., Mauldin, L., Tanner, D., Collins, J., Barrick, J.,Anderson, B., Blake, D., Bradshaw, J., Sandholm, S., Carroll,M., Albercook, G., and Clarke, A.: An assessment of HOx chem-istry in the Tropical Pacific Boundary Layer: Comparison ofmodel simulations with observations recorded during PEM Trop-ics A, J. Atmos. Chem., 38, 317–344, 2001.
Commane, R.: Understanding radical chemistry throughout the tro-posphere using laser-induced fluorescence spectroscopy, Univer-sity of Leeds, 2009.
Curtis, A. R. and Sweetenham, W. P.: FACSIMILE/CHEKMATusers manual, in: Her majesty’s stn. off, edited by:AERER12805, Norwich, England, 1987.
Dickerson, R. R., Rhoads, K. P., Carsey, T. P., Oltmans, S. J., Bur-rows, P. J., and Crutzen, P. J.: Ozone in the remote marine bound-ary layer: A possible role for halogens, J. Geophys. Res.-Atmos.,104, 21385–21395, 1999.
Fairall, C. W., Hare, J. E., Edson, J. B., and McGillis, W.: Param-eterization and micrometeorological measurement of air-sea gastransfer, Bound.-Lay. Meteorol., 96, 63–105, 2000.
Fairall, C. W., Helmig, D., Ganzeveld, L., and Hare, J.: Water-side turbulence enhancement of ozone deposition to the ocean,Atmos. Chem. Phys., 7, 443–451, 2007,http://www.atmos-chem-phys.net/7/443/2007/.
Fleming, Z. L., Monks, P. S., Rickard, A. R., Heard, D. E., Bloss,W. J., Seakins, P. W., Still, T. J., Sommariva, R., Pilling, M. J.,Morgan, R., Green, T. J., Brough, N., Mills, G. P., Penkett, S.A., Lewis, A. C., Lee, J. D., Saiz-Lopez, A., and Plane, J. M. C.:Peroxy radical chemistry and the control of ozone photochem-istry at Mace Head, Ireland during the summer of 2002, Atmos.Chem. Phys., 6, 2193–2214, 2006,http://www.atmos-chem-phys.net/6/2193/2006/.
Furneaux, K. L., Whalley, L. K., Heard, D. E., Atkinson, H. M.,Bloss, W. J., Flynn, M. J., Gallagher, M. W., Ingham, T., Kramer,L., Lee, J. D., Leigh, R., McFiggans, G. B., Mahajan, A. S.,Monks, P. S., Oetjen, H., Plane, J. M. C., and Whitehead, J. D.:Measurements of iodine monoxide at a semi polluted coastal lo-cation, Atmos. Chem. Phys. Discuss., 9, 25737–25797, 2009,http://www.atmos-chem-phys-discuss.net/9/25737/2009/.
Galbally, I. E., Bentley, S. T., and Meyer, C. P.: Mid-latitude marineboundary layer ozone destruction at visible sunrise observed atCape Grim, Tasmania, 41 degrees S, Geophys. Res. Lett., 27,3841, doi:10.1029/1999GL010943, 2000.
Gallagher, M. S., Carsey, T. P., and Farmer, M. L.: Peroxyacetylnitrate in the north Atlantic marine boundary layer, Global Bio-geochem. Cy., 4, 297–308, 1990.
Ganzeveld, L. and Lelieveld, J.: Dry Deposition Parameterization ina Chemistry General-Circulation Model and Its Influence on theDistribution of Reactive Trace Gases, J. Geophys. Res.-Atmos.,100, 20999–21012, 1995.
Haggerstone, A.-L., Carpenter, L. J., Carslaw, N., and McFig-gans, G.: Improved model predictions of HO2 with gas toparticle mass transfer rates calculated using aerosol numbersize distribution, J. Geophys. Res.-Atmos., 110(D4), D04304,doi:10.1029/2004JD005282, 2005.
Heard, D. E. and Pilling, M. J.: Measurement of OH and HO2 inthe Tropopshere, Chem. Rev., 103, 5163–5198, 2003.
Hoell, J. M., Davis, D., Liu, S., Newell, R. E., Shipman, M., Aki-moto, H., McNeal, R. J., Bendura, R. J., and Drewry, J. W.:Pacific Exploratory Mission-West A (PEM-West A) September–October 1991, J. Geophys. Res.-Atmos., 101, 1641–1653, 1996.
Hoell, J. M., Davis, D., Liu, S., Newell, R. E., Akimoto, H., Mc-Neal, R. J., and Bendura, R. J.: The Pacific Exploratory Mission-West Phase B: February–March 1994, J. Geophys. Res.-Atmos.,102, 28223–28239, 1997.
Hoell, J. M., Davis, D., Jacob, D. J., Rodgers, M. O., Newell, R.E., Fuelberg, H. E., McNeal, R. J., Raper, J. L., and Bendura,R. J.: Pacific Exploratory Mission in the tropical Pacific: PEM-Tropics A, August–September 1996, J. Geophys. Res.-Atmos.,104, 5567–5583, 1999.
Atmos. Chem. Phys., 10, 1555–1576, 2010 www.atmos-chem-phys.net/10/1555/2010/

L. K. Whalley et al.: Chemistry of OH and HO2 radicals over the tropical Atlantic Ocean 1575
Hough, A. M.: The calculation of photolysis rates for use inglobal tropospheric modelling studies, AERE rep., Her Majesty’sStn. Off., Norwich, 1988.
IUPAC: http://www.iupac-kinetic.ch.cam.ac.uk/, last access:8 July 2009, 2006.
Jacobi, H.-W., Weller, R., Bluszcz, T., and Schrems, O.: Latitudi-nal distribution of peroxyacetyl nitrate (PAN) over the Atlanticocean, J. Geophys. Res.-Atmos., 104, 26901–26912, 1999.
Junkermann, W. and Stockwell, W. R.: On the budget of photooxi-dants in the marine boundary layer of the tropical South Atlantic,J. Geophys. Res.-Atmos., 104, 8039–8046, 1999.
Kanaya, Y., Cao, R., Kato, S., Miyakawa, Y., Kajii, Y., Tanimoto,H., Yokouchi, Y., Mochida, M., Kawamura, K., and Akimoto, H.:Chemistry of OH and HO2 radicals observed at Rishiri Island,Japan, in September 2003: Missing daytime sink of HO2 andpositive nighttime correlations with monoterpenes, J. Geophys.Res.-Atmos., 112, D11308, doi:10.1029/2006JD007987, 2007.
Keene, W. C., Long, M. S., Pszenny, A. A. P., Sander, R., Maben,J. R., Wall, A. J., O’Halloran, T. L., Kerkweg, A., Fischer, E. V.,and Schrems, O.: Latitudinal variation in the multiphase chemi-cal processing of inorganic halogens and related species over theeastern North and South Atlantic Oceans, Atmos. Chem. Phys.,9, 7361–7385, 2009,http://www.atmos-chem-phys.net/9/7361/2009/.
Lee, J. D., McFiggans, G., Allan, J. D., Baker, A. R., Ball, S. M.,Benton, A. K., Carpenter, L. J., Commane, R., Finley, B. D.,Evans, M., Fuentes, E., Furneaux, K., Goddard, A., Good, N.,Hamilton, J. F., Heard, D. E., Herrmann, H., Hollingsworth, A.,Hopkins, J. R., Ingham, T., Irwin, M., Jones, C. E., Jones, R. L.,Keene, W. C., Lawler, M. J., Lehmann, S., Lewis, A. C., Long,M. S., Mahajan, A., Methven, J., Moller, S. J., Muller, K., Muller,T., Niedermeier, N., O’Doherty, S., Oetjen, H., Plane, J. M. C.,Pszenny, A. A. P., Read, K. A., Saiz-Lopez, A., Saltzman, E. S.,Sander, R., von Glasow, R., Whalley, L., Wiedensohler, A., andYoung, D.: Reactive Halogens in the Marine Boundary Layer(RHaMBLe): the tropical North Atlantic experiments, Atmos.Chem. Phys., 10, 1031–1055, 2010,http://www.atmos-chem-phys.net/10/1031/2010/.
Lee, J. D., Moller, S. J., Read, K. A., Lewis, A. C., Mendes, L., andCarpenter, L. J.: Year round measurements of nitrogen oxidesand ozone in the tropical North Atlantic marine boundary layer,J. Geophys. Res., 114, D21, doi:10.1029/2009JD011878, 2009.
Lelieveld, J., Crutzen, P. J., and Bruhl, C.: Climate effects of atmo-spheric methane, Chemosphere, 26, 739–768, 1993.
Leser, H., Honninger, G., and Platt, U.: MAX-DOAS measure-ments of BrO and NO2 in the marine boundary layer, Geophys.Res. Lett., 30, 1537, doi:10.1029/2002GL015811, 2003.
Levy, H.: Normal atmosphere: Large radical and formaldehydeconcentrations predicted, Science, 173, 141–143, 1971.
Mahajan, A. S., Plane, J. M. C., Oetjen, H., Whalley, L., Furneaux,K., Ingham, T., Heard, D., and Saiz-Lopez, A.: Long term DOASobservations of formaldehyde over the tropical Atlantic Ocean inpreparation, in preparation, 2010.
Mauldin III, R. L., Tanner, D., and Eisele, F.: Measurements of OHduring PEM-Tropics A, J. Geophys. Res.-Atmos., 104, 5817–5827, 1999.
Mauldin III, R. L., Eisele, F., Cantrall, C., Kosciuch, E., Ridley, B.A., Lefer, B., Tanner, D., Nowak, J. B., Chen, G., Wang, L., andDavis, D.: Measurements of OH aboard the NASA P-3 duringPEM-Tropics B, J. Geophys. Res.-Atmos., 106, 32657–32666,2001.
MCM: Master Chemical Mechanism, Version 3.1,http://mcm.leeds.ac.uk/MCM/home, last access: 08 July 2009.
Monks, P. S., Carpenter, L. J., Penkett, S. A., Ayers, G. P.,Gillett, R. W., Galbally, I. E., and Meyer, C. P.: Fundamen-tal ozone photochemistry in the remote marine boundary layer:The SOAPEX experiment, measurement and theory, Atmos. En-viron., 32, 3647–3664, 1998.
Moore, R., Oram, D., and Penkett, S. A.: Production of isoprene bymarine phytoplankton cultures, Geophys. Res. Lett., 21, 2507–2510, 1994.
Mossinger, J. C. and Cox, R. A.: Heterogeneous reaction of HOIwith sodium halide salts, J. Phys. Chem. A, 105, 5165–5177,2001.
Muller, K. P. and Rudolph, J.: Measurements of peroxyacetylnitratein the marine boundary layer over the Atlantic, J. Atmos. Chem.,15, 3–4, 1992.
Pechtl, S., Schmitz, G., and von Glasow, R.: Modelling iodide -iodate speciation in atmospheric aerosol: Contributions of in-organic and organic iodine chemistry, Atmos. Chem. Phys., 7,1381–1393, 2007,http://www.atmos-chem-phys.net/7/1381/2007/.
Penkett, S. A., Monks, P. S., Carpenter, L. J., Clemitshaw, K. C.,Ayers, G. P., Gillett, R. W., Galbally, I. E., and Meyer, C. P.:Relationship between ozone photolysis rates and peroxy radicalconcentrations in clean marine air over the Southern Ocean, J.Geophys. Res.-Atmos., 102, 12805–12817, 1997.
Plane, J. M. C. and Saiz-Lopez, A.: UV-Visible Differential OpticalAbsorption Spectroscopy (DOAS), in: Analytical Techniques forAtmospheric Measurements, edited by: Heard, D. E., BlackwellPublishing, 147–180 pp., 2006.
Plane, J. M. C.: Personal Communication, 2009.Poppe, D.: Time constant analysis of tropospheric gas-phase chem-
istry, Phys. Chem. Chem. Phys., 1, 5417–5422, 1999.Raper, J. L., Kleb, M. M., Jacob, D. J., Davis, D., Newell, R. E.,
Fuelberg, H. E., Bendura, R. J., Hoell, J. M., and McNeal, R.J.: Pacific Exploratory Mission in the Tropical Pacific: PEM-Tropics B, March–April 1999, J. Geophys. Res.-Atmos., 106,32401–32425, 2001.
Ravishankara, A. R.: Heterogeneous and multiphase chemistry inthe troposphere, Science, 276, 1058–1065, 1997.
Read, K. A., Mahajan, A. S., Carpenter, L. J., Evans, M. J., Faria,B. V. E., Heard, D. E., Hopkins, J. R., Lee, J. D., Moller, S.J., Lewis, A. C., Mendes, L., McQuaid, J. B., Oetjen, H., Saiz-Lopez, A., Pilling, M. J., and Plane, J. M. C.: Extensive halogen-mediated ozone destruction over the tropical Atlantic Ocean, Na-ture, 453, 1232–1235, 2008.
Read, K. A., Lee, J. D., Lewis, A. C., Moller, S. J., Neves, L.M., and Carpenter, L. J.: Intra-annual cycles of NMVOC inthe tropical marine boundary layer and their use for interpret-ing seasonal variability in CO, J. Geophys. Res., 114, D21,doi:10.1029/2009JD011879, 2009.
www.atmos-chem-phys.net/10/1555/2010/ Atmos. Chem. Phys., 10, 1555–1576, 2010

1576 L. K. Whalley et al.: Chemistry of OH and HO2 radicals over the tropical Atlantic Ocean
Read, K. A., Lewis, A. C., Mendes, L., Whalley, L. K., and Carpen-ter, L. J.: VOCs in the tropical remote marine boundary layer:Trends, ocean influence and atmospheric impacts, in preparation,2010.
Saiz-Lopez, A. and Plane, J. M. C.: Novel iodine chemistryin the marine boundary layer, Geophys. Res. Lett., 31, 4,doi:10.1029/2003GL09215, 2004a.
Saiz-Lopez, A., Plane, J. M. C., and Shillito, J.: Bromine oxidein the mid-latitude marine boundary layer, Geophys. Res. Lett.,31(3), L03111, doi:10.1029/2003GL018956, 2004b.
Salisbury, G., Rickard, A. R., Monks, P. S., Allan, B. J., Baugui-tte, S., Penkett, S. A., Carslaw, N., Lewis, A. C., Creasey, D. J.,Heard, D. E., Jacobs, P. J., and Lee, J. D.: Production of per-oxy radicals at night via reactions of ozone and the nitrate radi-cal in the marine boundary layer, J. Geophys. Res.-Atmos., 106,12669–12687, 2001.
Sander, R.: Modeling atmospheric chemistry: interactions betweengas-phase species and liquid cloud/aerosols particles, Surv. Geo-phys., 20, 1–31, 1999.
Saunders, S. M., Jenkin, M. E., Derwent, R. G., and Pilling, M.J.: Protocol for the development of the Master Chemical Mech-anism, MCM v3 (Part A): tropospheric degradation of non-aromatic volatile organic compounds, Atmos. Chem. Phys., 3,161–180, 2003,http://www.atmos-chem-phys.net/3/161/2003/.
Schwartz, S. E.: Gas-Phase and Aqueous-Phase Chemistry of HO2in Liquid Water Clouds, J. Geophys. Res.-Atmos., 89, 1589–1598, 1984.
Shaw, S. L., Chisholm, S. W., and Prinn, R. G.: Isoprene productionby Prochlorococcus, a marine cyanobacterium and other phyto-plankton, Mar. Chem., 80, 227–245, 2003.
Singh, H. B., Chen, Y., Staudt, A., Jacob, D., Blake, D., Heikes,B., and Snow, J.: Evidence from the Pacific troposphere for largeglobal sources of oxygenated organic commpounds, Nature, 410,1078–1081, 2001.
Singh, H. B., Tabazadeh, A., Evans, M. J., Field, B. D., Jacob,D. J., Sachse, G., Crawford, J. H., Shetter, R., and Brune, W.H.: Oxygenated volatile organic chemicals in the oceans: Infer-ences and implications based on atmospheric observations andair-sea exchange models, Geophys. Res. Lett., 30(16), 1862,doi:10.1029/2003GL017933, 2003.
Smith, S. C., Lee, J. D., Bloss, W. J., Johnson, G. P., Ingham, T.,and Heard, D. E.: Concentrations of OH and HO2 radicals dur-ing NAMBLEX: measurements and steady state analysis, Atmos.Chem. Phys., 6, 1435–1453, 2006,http://www.atmos-chem-phys.net/6/1435/2006/.
Smith, S. C. Atmospheric measurements of OH and HO2 usingthe FAGE technique: Instrument development and data analysis,University of Leeds, 2007.
Sommariva, R., Haggerstone, A.-L., Carpenter, L. J., Carslaw, N.,Creasey, D. J., Heard, D. E., Lee, J. D., Lewis, A. C., Pilling,M. J., and Zador, J.: OH and HO2 chemistry in clean marine airduring SOAPEX-2, Atmos. Chem. Phys., 4, 839–856, 2004,http://www.atmos-chem-phys.net/4/839/2004/.
Sommariva, R., Bloss, W. J., Brough, N., Carslaw, N., Flynn, M.,Haggerstone, A.-L., Heard, D. E., Hopkins, J. R., Lee, J. D.,Lewis, A. C., McFiggans, G., Monks, P. S., Penkett, S. A.,Pilling, M. J., Plane, J. M. C., Read, K. A., Saiz-Lopez, A.,Rickard, A. R., and Williams, P. I.: OH and HO2 chemistry dur-ing NAMBLEX: roles of oxygenates, halogen oxides and hetero-geneous uptake, Atmos. Chem. Phys., 6, 1135–1153, 2006,http://www.atmos-chem-phys.net/6/1135/2006/.
Stull, R. B.: Introduction to Boundary Layer Meteorology, Publish-ers, K. A., Dordrecht, 1988.
Taketani, F., Kanaya, Y., and Akimoto, H.: Kinetcis of heteroge-neous reactions of HO2 radical at ambient concentration levelswith (NH4)2SO4 and NaCl aerosol particles, J. Phys. Chem. A,112, 2370–2377, 2008.
Taketani, F., Kanaya, Y., and Akimoto, H.: Heterogeneous loss ofHO2 by KCl, synthetic sea salt, and natural seawater aerosol par-ticles, Atmos. Environ., 43, 1660–1665, 2009.
Thornton, J. A., Jaegle, L., and McNeill, V. F.: Assessing knownpathways for HO2 loss in aqueous atmospheric aerosols: Re-gional and global impacts on tropospheric oxidants, J. Geophys.Res.-Atmos., 113, D05303, doi:10.1029/2007JD009236, 2008.
Vogt, R., Crutzen, P. J., and Sander, R.: A mechanism for halo-gen release from sea-salt aerosol in the remote marine boundarylayer, Nature, 383, 327–330, 1996.
Vogt, R., Sander, R., von Glasow, R., and Crutzen, P. J.: Iodinechemistry and its role in halogen activation and ozone loss in themarine boundary layer: A model study, J. Atmos. Chem., 32,375, doi:10.1023/A:1006179901037, 1999.
von Glasow, R. and Sander, R.: Variation of sea salt aerosol pH withrelative humidity, Geophys. Res. Lett., 28, 247–250, 2001.
von Glasow, R., Sander, R., Bott, A., and Crutzen, P. J.:Modelling halogen chemistry in the marine boundary layer– 1. Cloud-free MBL, J. Geophys. Res.-Atmos., 107, 4341,doi:10.1029/2001JD000942, 2002.
von Glasow, R., von Kuhlmann, R., Lawrence, M. G., Platt, U.,and Crutzen, P. J.: Impact of reactive bromine chemistry in thetroposphere, Atmos. Chem. Phys., 4, 2481–2497, 2004,http://www.atmos-chem-phys.net/4/2481/2004/.
von Glasow, R.: Personal Communication, 2009.Wachsmuth, M., Gaggeler, H. W., von Glasow, R., and Am-
mann, M.: Accommodation coefficient of HOBr on deliquescentsodium bromide aerosol particles, Atmos. Chem. Phys., 2, 121–131, 2002,http://www.atmos-chem-phys.net/2/121/2002/.
Weller, R., Schrems, O., Boddenberg, A., Gab, S., and Gautrois, M.:Meridional distribution of hydroperoxides and formaldehyde inthe marine boundary layer of the Atlantic (48◦ N–35◦ S) mea-sured during the Albatross campaign, J. Geophys. Res.-Atmos.,105, 14401–14412, 2000.
Whalley, L. K., Furneaux, K. L., Gravestock, T., Atkinson, H. M.,Bale, C. S. E., Ingham, T., Bloss, W. J., and Heard, D. E.: De-tection of iodine monoxide radicals in the marine boundary layerusing laser induced fluorescence spectroscopy, J. Atmos. Chem.,58, 19–39, 2007.
Atmos. Chem. Phys., 10, 1555–1576, 2010 www.atmos-chem-phys.net/10/1555/2010/