the charlotte region: alive and well charlotte commercial market forecast march 27, 2012
TRANSCRIPT

The Charlotte Region: Alive and WellCharlotte Commercial Market Forecast
March 27, 2012

A Promise of Value. lincolnharris.com
The most common characteristic of the Charlotte region:
CHANGE
3 types of people:Those who fear change
Those who watch changeThose who embrace & enact change

A Promise of Value. lincolnharris.com
Non-residential construction permits trend upwards
Jan-
09
Apr-0
9
Jul-0
9
Oct-0
9
Jan-
10
Apr-1
0
Jul-1
0
Oct-1
0
Jan-
11
Apr-1
1
Jul-1
1
Oct-1
1
Jan-
12$0
$50,000,000
$100,000,000
$150,000,000
$200,000,000
$250,000,000
Monthly non-residential construction permit value
2009-2010 avg: $60 million/month
2011-YTD 2012 avg: $107.7 million/month
Source: Charlotte Chamber of Commerce March 2012 Economic Indicators – Charlotte/Mecklenburg Building Standards Department
January 2012 spiked to $226 million due to construction at Ballantyne and corporate relocation build outs

A Promise of Value. lincolnharris.com
Charlotte’s office market is returning to health
Source: Lincoln Harris Research Department
47.1% of net move in activity in 2011 was from companies new to the Charlotte area
20002001
20022003
20042005
20062007
20082009
20102011
-500,000
0
500,000
1,000,000
1,500,000
2,000,000
2,500,000
3,000,000
0.00%
4.00%
8.00%
12.00%
16.00%
20.00%
24.00%
Net absorption New development Overall vacancy
Ch
arl
ott
e o
ffice
net
ab
sorp
tion
Ch
arl
ott
e o
ffice
vaca
ncy

A Promise of Value. lincolnharris.com
Major players that grew or expanded into Charlotte in 2011
Compass Group Connextions Extended Stay SnapAV Wake Forest
University Akima Lash Group MNES Capgemini FBI FNB United
Bradley Arant HireRight Certus Bnak Chelsea Therapeutics Northeastern
University Heels.com Deb Group CNL Crosland QuikTrip Lockton Ravin Partners
Source: Lincoln Harris Research Department
This is just a sampling of the diverse firms that grew organically or relocated to Charlotte recently
A Promise of Value. lincolnharris.com
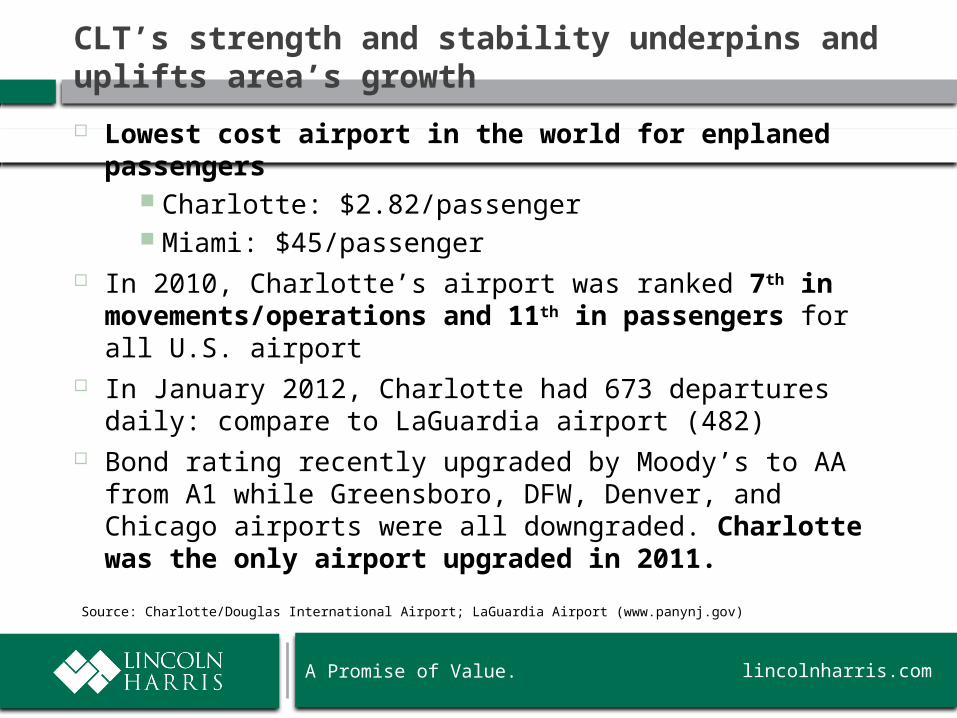
CLT’s strength and stability underpins and uplifts area’s growth
Lowest cost airport in the world for enplaned passengers
Charlotte: $2.82/passenger Miami: $45/passenger
In 2010, Charlotte’s airport was ranked 7th in movements/operations and 11th in passengers for all U.S. airport
In January 2012, Charlotte had 673 departures daily: compare to LaGuardia airport (482)
Bond rating recently upgraded by Moody’s to AA from A1 while Greensboro, DFW, Denver, and Chicago airports were all downgraded. Charlotte was the only airport upgraded in 2011.
Source: Charlotte/Douglas International Airport; LaGuardia Airport (www.panynj.gov)

A Promise of Value. lincolnharris.com
Charlotte’s airport growth continues, outpacing national trends
2,000,000.0
2,200,000.0
2,400,000.0
2,600,000.0
2,800,000.0
3,000,000.0
3,200,000.0
3,400,000.0
3,600,000.0
3,800,000.0
CLT total monthly passenger traf-fic
CLT total passenger traffic (enplanements & de-planements)
Year
Total annual
passenger traffic
% Change
from previous year
2011
39,043,708 2.06%
2010
38,254,207 10.76%
2009
34,536,666 -0.58%
2008
34,739,020 4.74%
2007
33,165,688 11.69%
2006
29,693,949 N/A
Source: Charlotte/Douglas International Airport Aviation Activity for January 2012
After enjoying nearly 11% growth in 2010, CLT again boosted its passenger traffic by 2% in 2011

A Promise of Value. lincolnharris.com
CLT is a key component of Charlotte’s burgeoning logistics hub
Jan-
09
Apr-0
9
Jul-0
9
Oct-0
9
Jan-
10
Apr-1
0
Jul-1
0
Oct-1
0
Jan-
11
Apr-1
1
Jul-1
1
Oct-1
1
Jan-
120.0
2,000.0
4,000.0
6,000.0
8,000.0
10,000.0
12,000.0
14,000.0
CLT cargo enplaned/deplaned (tons)
CLT cargo enplaned/deplaned (tons)
Year
Total annual cargo
enplaned/ deplaned
% Change
from previous year
2011 137,943 2.68%
2010 134,342 12.37%
2009 119,551 -9.44%
2008 132,009 -7.57%
2007 142,819 -15.82%
2006 169,649 -7.33%
2005 183,072 0.05%
2004 182,978 18.47%
2003 154,448 -12.46%
2002 176,436 -9.92%
2001 195,870 -11.11%
2000 134,342 N/A
After years of declining cargo tonnage, cargo routed through Charlotte has expanded in 2010 and 2011
Source: Charlotte/Douglas International Airport Aviation Activity for January 2012
A Promise of Value. lincolnharris.com
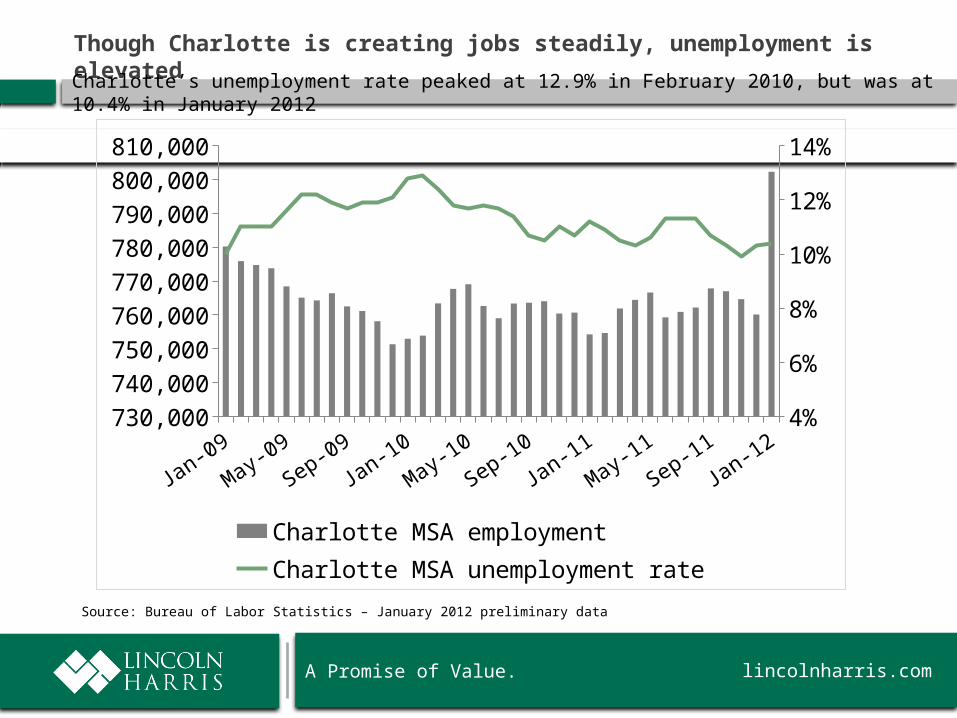
Though Charlotte is creating jobs steadily, unemployment is elevated
Source: Bureau of Labor Statistics – January 2012 preliminary data
Charlotte’s unemployment rate peaked at 12.9% in February 2010, but was at 10.4% in January 2012
Jan-09
May-09
Sep-09Jan-10
May-10
Sep-10Jan-11
May-11
Sep-11Jan-12
730,000
740,000
750,000
760,000
770,000
780,000
790,000
800,000
810,000
4%
6%
8%
10%
12%
14%
Charlotte MSA employmentCharlotte MSA unemployment rate

A Promise of Value. lincolnharris.com
Since January 2010, Charlotte has enjoyed widespread private sector hiring
Series1
-4,000
-2,000
0
2,000
4,000
6,000
8,000
10,000
12,000
14,000
16,000
Mining, Logging, & Construction
Manufacturing
Trade, Transportation, & Utilities
Information
Financial Activities
Professional & Business Services
Education & Health Services
Leisure & Hospitality
Other Services
Government
Trade-related positions increased 8,400, while professional and business jobs jumped 14,900 during that time
Source: Bureau of Labor Statistics – Not seasonally adjusted data by industry from January 2010 to January 2012
A Promise of Value. lincolnharris.com
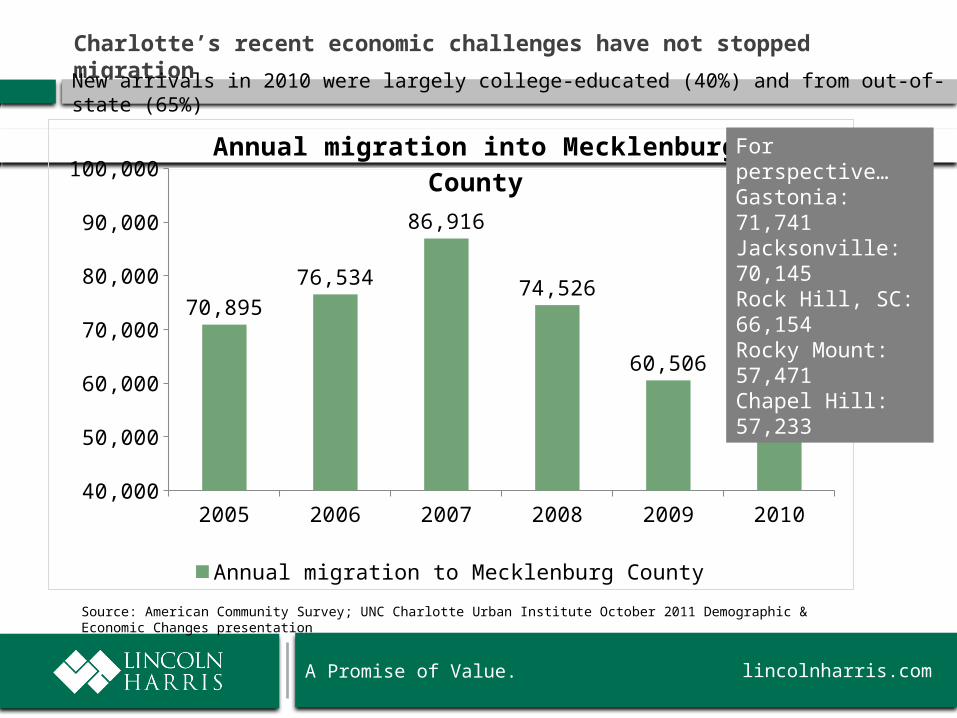
Charlotte’s recent economic challenges have not stopped migration
2005 2006 2007 2008 2009 201040,000
50,000
60,000
70,000
80,000
90,000
100,000
70,89576,534
86,916
74,526
60,506
66,376
Annual migration into Mecklenburg County
Annual migration to Mecklenburg County
Source: American Community Survey; UNC Charlotte Urban Institute October 2011 Demographic & Economic Changes presentation
New arrivals in 2010 were largely college-educated (40%) and from out-of-state (65%)
For perspective…Gastonia: 71,741Jacksonville: 70,145Rock Hill, SC: 66,154Rocky Mount: 57,471Chapel Hill: 57,233
A Promise of Value. lincolnharris.com
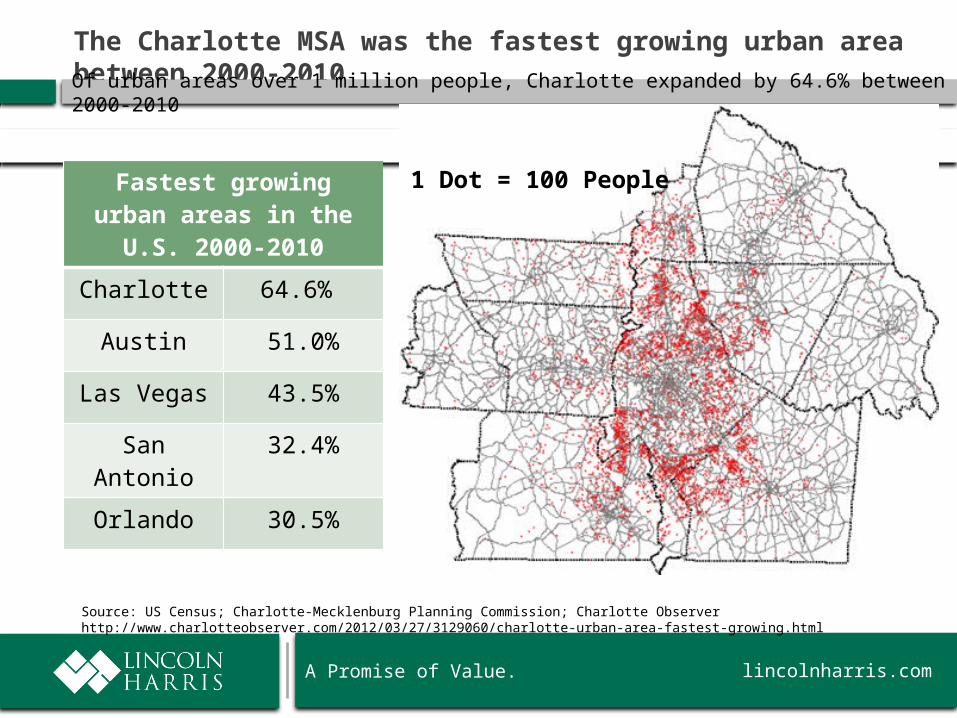
The Charlotte MSA was the fastest growing urban area between 2000-2010Of urban areas over 1 million people, Charlotte expanded by 64.6% between 2000-2010
Fastest growing urban areas in the
U.S. 2000-2010
Charlotte 64.6%
Austin 51.0%
Las Vegas 43.5%
San Antonio
32.4%
Orlando 30.5%
Source: US Census; Charlotte-Mecklenburg Planning Commission; Charlotte Observer http://www.charlotteobserver.com/2012/03/27/3129060/charlotte-urban-area-fastest-growing.html
1 Dot = 100 People

A Promise of Value. lincolnharris.com
Population growth and a shift towards more dense development is a significant challenge – and opportunity Community resources and a strong future-oriented plan for Charlottes needs to develop in-line with growth
Source: U.S. Census 2010; Charlotte-Mecklenburg Planning Commission
With this scale of growth, responsible, growth-oriented planning is an absolute necessity for strategic success

A Promise of Value. lincolnharris.com
Biggest issues facing Charlotte in the near- and mid-term?
Most prevalent concerns that people voice about Charlotte
Concentrated banking community Educational system Airport that is highly reliant on one major airline Leadership
However, none of these issues should be truly frightening or regarded as insurmountable as the economy improves. There are many reasons to believe in Charlotte’s bright future.