the changing wealth of nations measuring sustainable development in the new millennium kirk hamilton...
TRANSCRIPT
The Changing Wealth of The Changing Wealth of NationsNations
Measuring Sustainable DevelopmentMeasuring Sustainable Developmentin the New Millenniumin the New Millennium
Kirk HamiltonDevelopment Research Group
The World Bank

OutlineOutline
The wealth of nations in 2005What changed? 1995-2005Saving for the futureSpecial topics: Intangible wealth
and CO2
Policy messages

The Wealth of Nations in 2005

Where is the wealth of Ghana?Where is the wealth of Ghana?
0%
10%
20%
30%
40%
50%
60%
70%
80%
90%
100%
Intangible
Natural
Produced
78%
21%
1%0%
Agricultural land
Forests
Protected area
Subsoil assets
Shares of total wealth, 2005
Shares of natural wealth, 2005
Total wealth / capita:$9,500
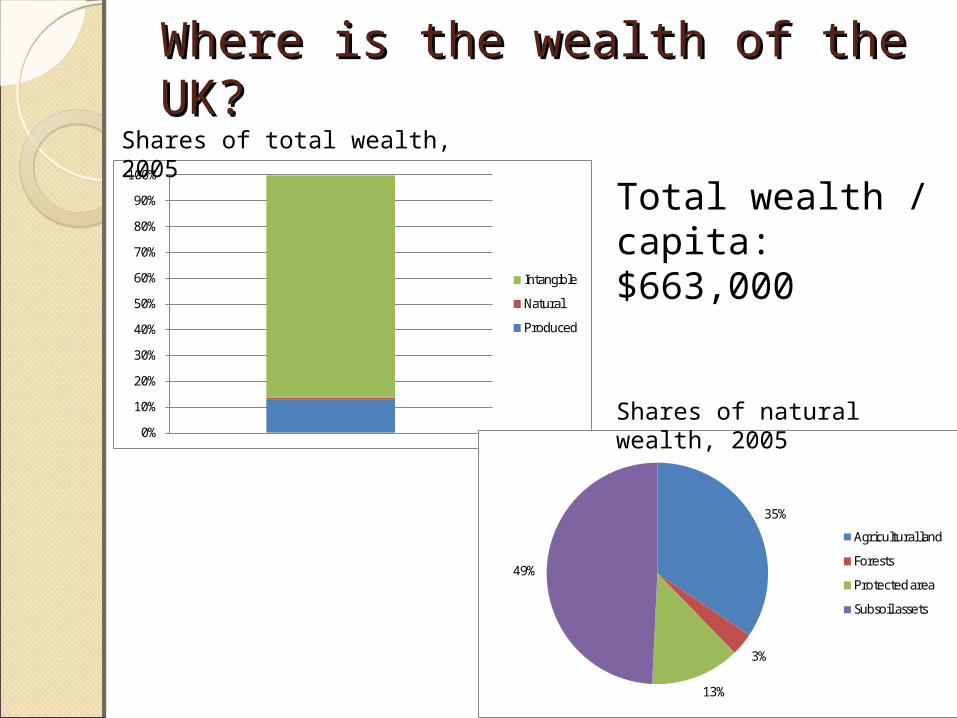
Where is the wealth of the UK?Where is the wealth of the UK?
0%
10%
20%
30%
40%
50%
60%
70%
80%
90%
100%
Intangible
Natural
Produced
35%
3%
13%
49%
Agricultural land
Forests
Protected area
Subsoil assets
Shares of total wealth, 2005
Shares of natural wealth, 2005
Total wealth / capita:$663,000

Composition of total wealth Composition of total wealth
Natural capital is most important in low income countries—more than twice as large as produced capital
In middle income countries natural capital and produced capital are roughly equal
Intangible wealth dominates in all countries, especially in high income countries
Shares of comprehensive wealth, by income class, 2005
50%
14%
36%Low IncomeCountries
59%20%
21%
Middle IncomeCountries
80%
17%3%
High IncomeCountries
Intangible Capital Produced Capital Natural Capital

Composition of natural wealthComposition of natural wealth
Crop Land
Pasture Land
Forest and Protected Areas
Subsoil Assets
East Asia-Pacific 55 6 16 23
E. Europe-Central Asia 14 11 13 62
Latin America-Carib 33 10 27 30
Middle East-N. Africa 20 8 2 69
South Asia 49 25 13 13
Sub-Saharan Africa 35 13 17 36
Percentage shares of natural wealth, by developing region, 2005

What changed? 1995-2005
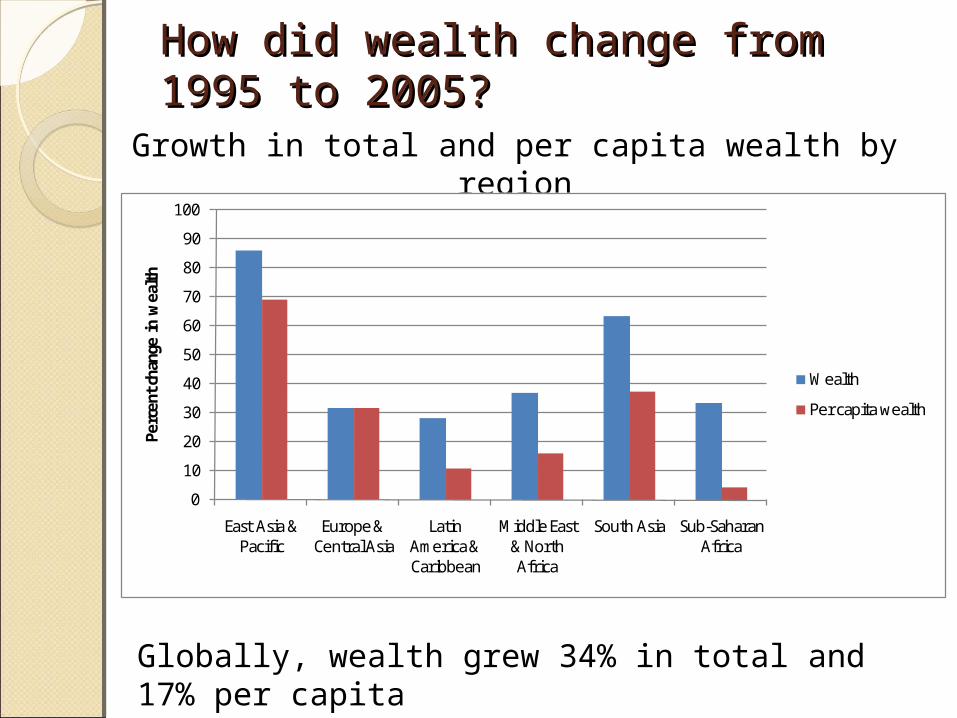
How did wealth change from 1995 How did wealth change from 1995 to 2005?to 2005?
Growth in total and per capita wealth by region
0
10
20
30
40
50
60
70
80
90
100
East Asia & Pacific
Europe & Central Asia
Latin America & Caribbean
Middle East & North Africa
South Asia Sub-Saharan Africa
Perc
ent c
hang
e in
wea
lth
Wealth
Per capita wealth
Globally, wealth grew 34% in total and 17% per capita

Development & changing composition of Development & changing composition of wealthwealthLower-middle income countries: shares of total wealth 1995-2005
0%
10%
20%
30%
40%
50%
60%
1995 2000 2005
Perc
ent o
f tot
al w
ealt
h
Produced Capital
Natural Capital
Intangible Capital

Change in total wealth by type of Change in total wealth by type of assetasset $ billion, 1995-2005 $ billion, 1995-2005
-2,000
0
2,000
4,000
6,000
8,000
10,000
12,000
14,000
16,000
18,000
East Asia & Pacific Europe & Central Asia
Latin America & Caribbean
Middle East & North Africa
South Asia Sub-Saharan Africa
Intangible Capital Produced Capital Natural Capital

Saving for the future
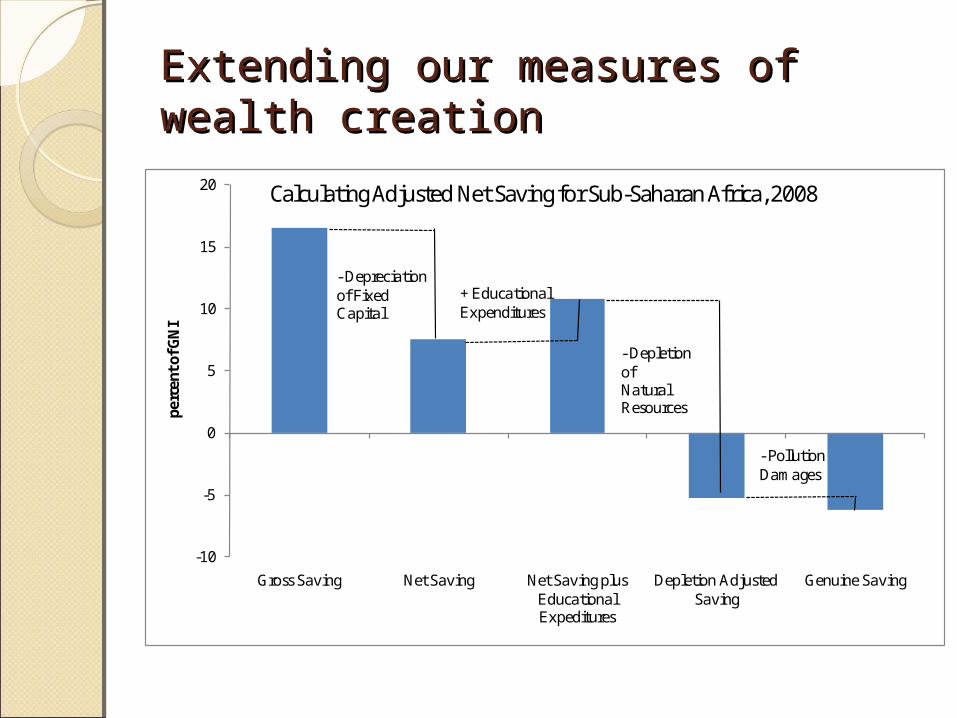
Extending our measures of wealth Extending our measures of wealth creationcreation
-10
-5
0
5
10
15
20
Gross Saving Net Saving Net Saving plus Educational Expeditures
Depletion Adjusted Saving
Genuine Saving
perc
ent o
f GN
ICalculating Adjusted Net Saving for Sub-Saharan Africa, 2008
- Depreciation of Fixed Capital
+ Educational Expenditures
- Depletion of Natural Resources
- Pollution Damages

Long-run trends in genuine Long-run trends in genuine savingsaving
0
5
10
15
20
25
30
3519
75
1978
1981
1984
1987
1990
1993
1996
1999
2002
2005
2008
perc
ent o
f GN
IGenuine Saving Rates in EAP, ECA and SAR
East Asia & Pacific
Europe & Central Asia
South Asia
-20
-15
-10
-5
0
5
10
15
1975
1978
1981
1984
1987
1990
1993
1996
1999
2002
2005
2008
perc
ent o
f GN
I
Genuine Saving Rates in LCR, MNA and SSA
Latin America & Caribbean
Sub-Saharan Africa
Middle East & North Africa

Many resource-rich countries are Many resource-rich countries are consuming their wealthconsuming their wealth
Angola
BotswanaChina
Congo, Rep.
Equatorial Guinea
Uzbekistan
-60
-40
-20
02
04
0a
djus
ted
net
sa
vin
g as
% o
f GN
I
0 20 40 60 80 100energy and mineral rents as % GNI
Adjusted Net Saving in Resource-Rich Countries, 2008

How rich would countries be in 2005 How rich would countries be in 2005 if they had invested rents from if they had invested rents from resource extraction?resource extraction?
20,021 12,793
18,885
1,369 3,741
66,359
45,246
67,994
5,349
16,088
-
10,000
20,000
30,000
40,000
50,000
60,000
70,000
80,000
Trinidad and Tobago
Venezuela, RB
Gabon Nigeria Congo, Rep.
2005
US$
per
capi
ta
Actual Produced Capital Hypothetical Produced Capital (Hartwick Rule)

Above 2% population growth, net Above 2% population growth, net saving per capita was largely saving per capita was largely negative in 2005negative in 2005
Cape VerdeMaldives
Angola
ArmeniaBelarus
Belize
Botswana
Burundi
Chad
China
Congo, Dem. Rep.
Congo, Rep.
DjiboutiGeorgia
Mauritania
MoldovaMorocco
Nigeria
Sri Lanka
Syrian Arab RepublicUganda
Ukraine
-100
-50
05
0P
opu
latio
n-a
dju
ste
d A
NS
, % o
f GN
I pe
r ca
pita
-1 0 1 2 3 4Population growth rate (%)
Developing countries

Special topics:Intangible wealth and CO2

Intangible capital consists of more Intangible capital consists of more than human capitalthan human capital
All countries All countries Developingcountries
OECDcountries
Produced capital
0.398 0.320 0.313 n/s
Natural capital n/s 0.068 0.072 n/s
Human capital index
n/s
Intangible capital
0.176 0.169 0.502
Elasticities of output with respect to production factors
n/s – not statistically significant
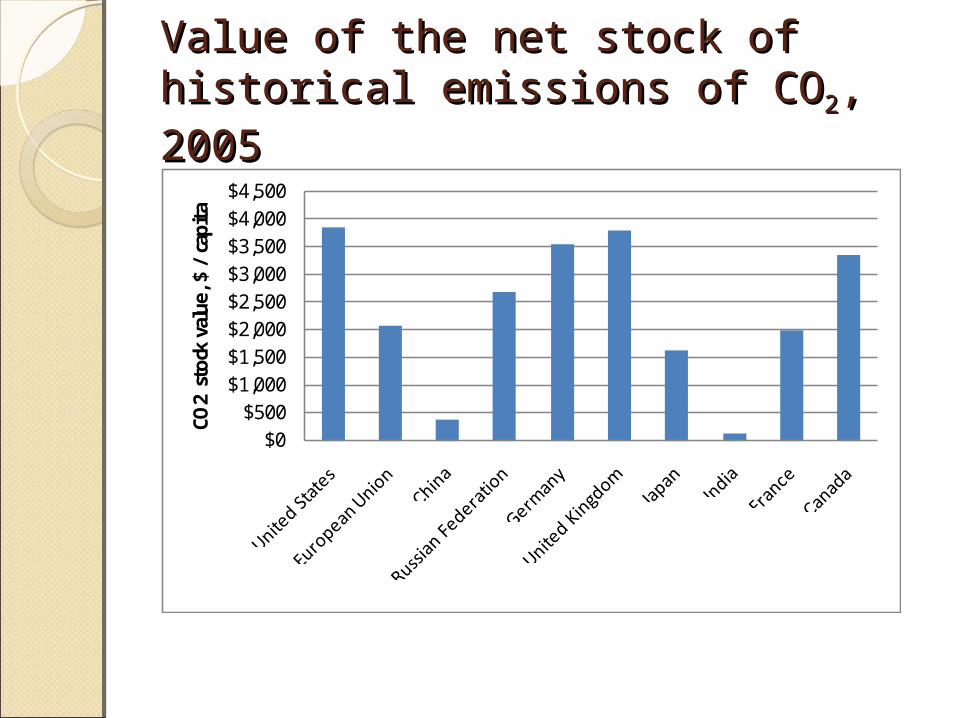
Value of the net stock of historical Value of the net stock of historical emissions of COemissions of CO22, 2005, 2005
$0$500
$1,000$1,500$2,000$2,500$3,000$3,500$4,000$4,500
CO2
sto
ck v
alue
, $ /
cap
ita

COCO22 efficiency is low in efficiency is low in developing countries – scope developing countries – scope for green growth?for green growth?
0%
10%
20%
30%
40%
50%
60%
CO2
sto
ck v
alue
%G
NI
Value of net historical stock of CO2 as %of GNI, 2005

“How we measure developmentwill drive how we do development”

Policy implicationsPolicy implications
Strengthen natural resource management
Invest resource rents in other assets
Lower carbon footprints – ‘green growth’
Invest in peopleBuild institutions

Thank you!
http://data.worldbank.org