the central place system in the northwest
DESCRIPTION
The Central Place System in the Northwest. Atlas - p. 127-139: Maps & text Consumer-oriented services & industry locally oriented manufacturing construction transportation/communications/utilities retail & wholesale trade finance, insurance, & real estate personal services - PowerPoint PPT PresentationTRANSCRIPT

The Central Place System in the Northwest
• Atlas - p. 127-139: Maps & text
• Consumer-oriented services & industry– locally oriented manufacturing– construction– transportation/communications/utilities– retail & wholesale trade– finance, insurance, & real estate– personal services– local government

Distribution of Central Place Functions
Retail - p. 137 atlas
Eating & Drinking - p. 137 atlas
Hotels & Lodging, p. 137 atlas
Health Services, p. 137 atlas (map)
Wholesale Trade, p. 137-8 atlas (map)
(Producer Services) p. 137 atlas
Other services (consumer, government)

Logic of Central Place System: Its Linkage with Basic Industry
• Basic Industry = Export Tied Industry
• Nonbasic = locally tied industry
• What is basic at one level of the central place system is often nonbasic at Higher levels
• Backward linkages play a role in the relationship between the level of export/basic jobs and nonbasic/local jobs

Early Settlement
•
•
• •
• Basic jobs
•••
•
•
•
• •
Direct Jobs•Indirect jobs•
••
•
•
• •
••
• ••Water
Coastal
AgriculturalInterior

Early Settlement - First Hierarchy
•
•
• •
• Basic jobs
•••
•
•
•
• •
Direct Jobs•Indirect jobs•
••
•
•
• •
••
• ••Water
Coastal
AgriculturalInterior
• •• •• •

Settlement - The Hierarchy in Modern Times
•
•
• ••
• Basic jobs
•••
•
•
•
• •
Direct Jobs•Indirect jobs•
••
•
•
• •
• ••
• ••Water
Coastal
AgriculturalInterior
• •• •• • •
• •• • •
•• • • • •
•
• •

Settlement - The Hierarchy in Coming Years?
•
•
• ••
• Basic jobs
•••
•
•
•
• •
Direct Jobs•Indirect jobs•
••
•
•
• •
• ••
• ••Water
Coastal
AgriculturalInterior
• •• •• • •
• •• • •
•• • • • •
•
• •
New Economy•
• • •
• •
• •
• • • •


Source: Preston, The Structure of Central Place Systems

Market Areas Perceived ByRural County Commissioners

Source, Preston,

Source: Preston, The Structure of Central Place Systems


From Vision 2040,the currentPuget SoundRegional Councilregionaldevelopmentplan
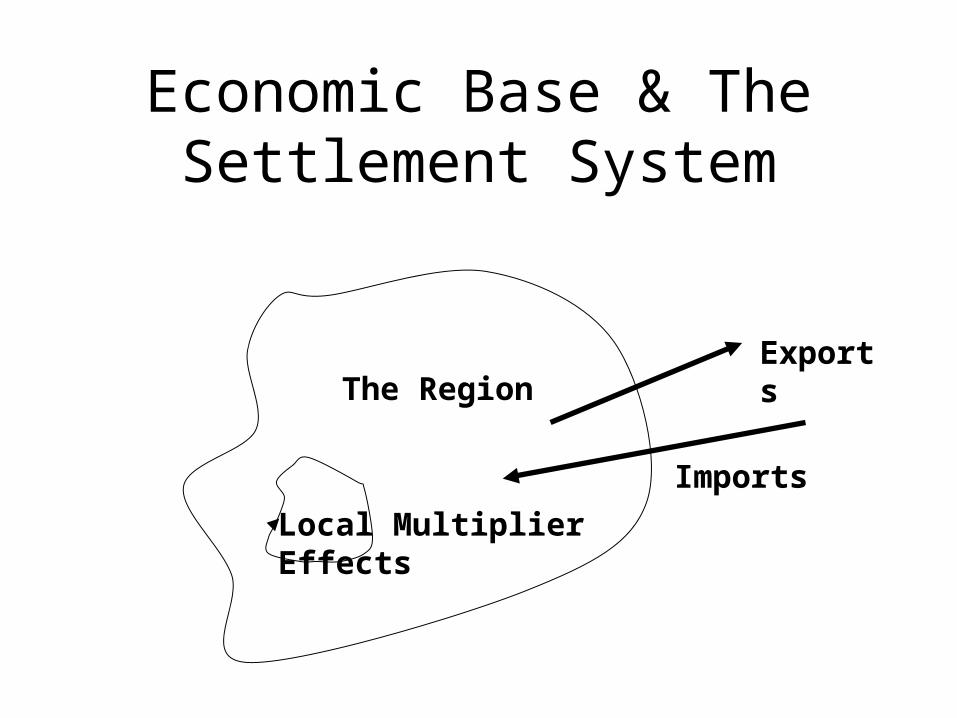
Economic Base & The Settlement System
The RegionExports
Imports
Local MultiplierEffects

Washington Input-Output Table ($ billions)Net industrial exports are roughly offset by imports to industries and
categories of final demand (households, investment, state & local govt.)
Natural Resources
Manufacturing & Construction Services Subtotal Consumption
Investment & S&L Govt.
Fed. Govt. & Exports Total Sales
Natural Resources 0.6 2.7 0.4 3.8 0.6 0.6 8.1 13.1Manufacturing & Construction 1.6 22.3 21.7 45.6 10.6 42.5 127.9 226.6Services 2.0 35.1 70.0 107.1 131.8 14.4 110.7 364.0Subtotal 4.2 60.2 92.1 156.4 143.0 57.5 246.7 603.7Labor Income 3.9 40.1 128.5 172.5 0.0 23.2 11.3 207.1Other Value Added 2.7 16.6 61.5 80.8 30.8 5.1 1.2 117.9Imports 2.3 109.6 82.0 193.9 50.2 16.3 1.8 277.6Total Purchases 13.1 226.6 364.0 603.7 224.0 117.6 261.0 1206.3
Industrial Imports
Industrial ExportsNet Industrial Exports:246.7 – 193.9 = 52.8
Imports to Consumption,Investment, Government 68.2

Generalized Model of Trade
Dividing up the columns in this model, we have:
Basic Non-BasicBasic 0 0Non-Basic .5 .75Import .5 .25
From/To Basic Non-Basic Export TotalBasic 0 0 33 33Non-Basic 16.5 50 0 67Imports 16.5 16.5 X (33)Total 33 67 (33) 100

Consequences of A Change in Export Levels Through the
Multiplier System
Round 1 B-NB .5(1) = .5Round 2 NB-NB .75*.5 .375Round 3 NB-NB .75*.375 .28Round 4 NB-NB .75*.28 .21Round 5 NB-NB .75*.21 .16And so on… Convergence of
the sumTotal 2.0

Shifts in the Structure of This System of Multipliers over Time
• Local purchases expand as thresholds are crossed
• Continued specialization offsets threshold effects
Upshot: relative stability
• Shift to a larger service economy
• Spatial shifts due to lowered transport and interaction costs

Export Markets – Washington State
Source: Washington State Input-Output Tables

Composition of Washington Exports
Source: Washington State Input-Output Tables

Old Slide after this one
• Left in PowerPoint file for those interested in history

Washington I/O Table ($ billions)Net industrial exports are roughly offset by imports to industries and categories
of final demand (households, investment, and state and local governments)
Industrial Exports
Industrial Imports
Net Industrial Exports:155.9-110.9 = 45.0
Imports to Consumption & Other F.D. 49.1
Natural Resources
Manufacturing & Construction Services Subtotal Consumption Exports Other F.D.
Total Sales
Natural Resources 0.6 1.9 0.3 2.8 0.7 4.8 0.2 8.5Manufacturing & Construction 0.8 8.5 9.5 18.8 4.8 77.4 27.3 128.3Services 2.3 15.3 53.2 70.8 97.4 73.7 12.6 254.5Subtotal 3.7 28.4 63.1 95.1 102.9 155.9 37.5 391.3Labor Income 2.4 30.7 94.2 127.3 0.0 7.1 18.1 152.5Other Value Added 1.6 5.0 51.5 58.1 20.2 0.7 1.5 80.5Imports 0.9 64.2 45.8 110.9 40.7 0.0 8.4 160.0Total Purchases 8.5 128.3 254.5 391.3 163.8 163.6 65.5 784.3