the cbal reading assessment: anapproach for … cbal reading assessment: an approach for balancing...
TRANSCRIPT

The CBAL Reading Assessment: An Approach for Balancing Measurement and Learning Goals
Kathleen M. Sheehan
Tenaha O’Reilly
May 2011
Research Report ETS RR–11-21

The CBAL Reading Assessment: An Approach for Balancing Measurement and
Learning Goals
Kathleen M. Sheehan and Tenaha O’Reilly
ETS, Princeton, New Jersey
May 2011

Technical Review Editor: James Carlson
Technical Reviewers: Paul Deane, John Sabatini
Copyright © 2011 by Educational Testing Service. All rights reserved.
ETS, the ETS logo, and LISTENING. LEARNING. LEADING. are registered trademarks of Educational Testing Service (ETS).
As part of its nonprofit mission, ETS conducts and disseminates the results of research to advance
quality and equity in education and assessment for the benefit of ETS’s constituents and the field.
To obtain a PDF or a print copy of a report, please visit:
http://www.ets.org/research/contact.html

i
Abstract
No Child Left Behind has highlighted the need for new types of assessments that not only
provide high-quality evidence about what students know and can do, but also help to
move learning forward. This paper describes a linked set of formative and summative
reading assessments designed to address the tradeoffs inherent in these two goals.
Targeted skills include the full range of competencies underlying proficient reading at the
middle-school level, including both lower-order skills such as oral reading fluency and
decoding, and higher-order skills such as the ability to integrate and synthesize
information from multiple texts. Data collected in pilot administrations of two prototype
test forms are presented. Analyses suggest that this new approach yields acceptable
measurement properties while simultaneously addressing crucial learning outcomes. This
paper was presented June 23, 2009 at the National Conference on Student Assessment,
Los Angeles, CA.
Key words: NCLB, scenario-based assessments, reading comprehension, 21st century
skills

i
Table of Contents
The CBAL Reading Framework ..........................................................................................2
The CBAL Reading Competency Model .............................................................................2
Learning Progressions ..........................................................................................................5
Task Design Principles ........................................................................................................6
A Prototype Assessment Design Targeted at Seventh and Eighth Grade Readers ..........................8
The Spoken Response Section .............................................................................................9
The Extended Comprehension Section ................................................................................9
Sample Tasks .....................................................................................................................10
Method ...........................................................................................................................................13
Procedure ...........................................................................................................................13
Analysis..............................................................................................................................14
Score Variation Across and Within PAAs .........................................................................15
Nomothetic Span ................................................................................................................16
Construct Representation ...................................................................................................16
Discussion ......................................................................................................................................20
References ......................................................................................................................................22
Notes ..............................................................................................................................................26

i
List of Figures
Figure 1. The CBAL Reading Competency Model. ......................................................................3
Figure 2. Two hypothesized learning progressions. ......................................................................6
Figure 3. A two-part item designed to provide mastery evidence relative to the first two
building blocks in the “Understand Text Structure” LP. .............................................11
Figure 4. Items designed to provide mastery evidence relative to the first two building
blocks in the “Understand Plot Structure” LP. ............................................................12
ii
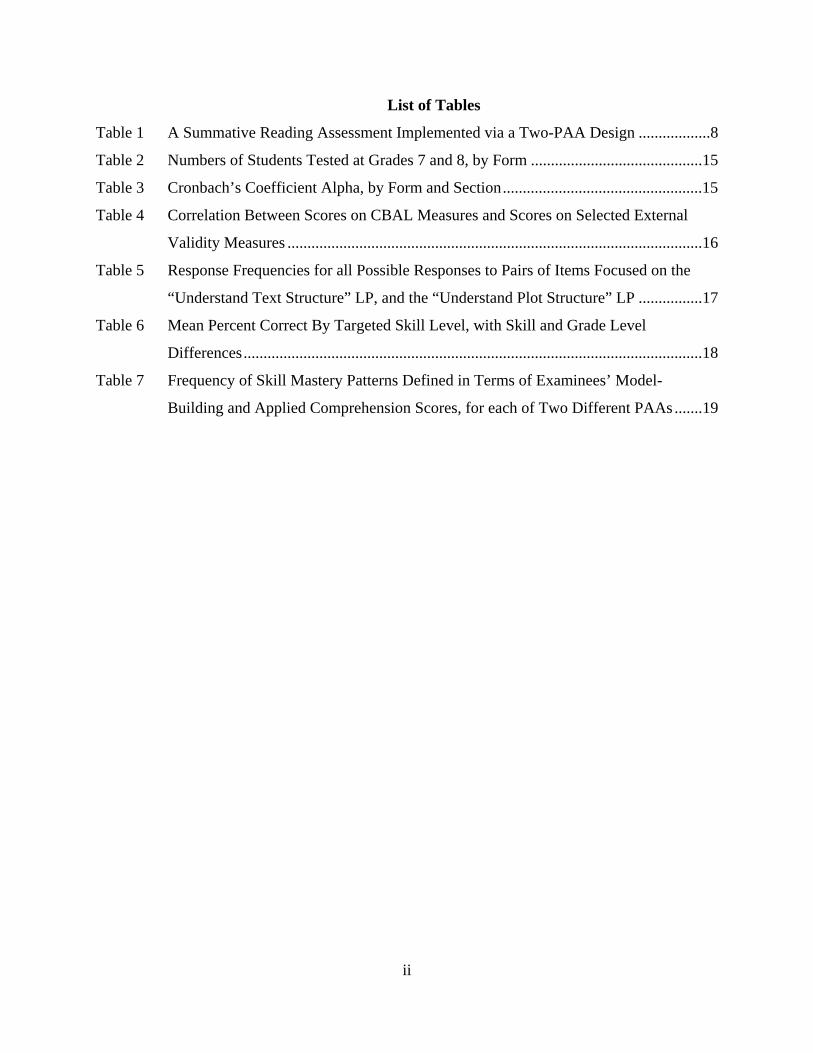
List of Tables
Table 1 A Summative Reading Assessment Implemented via a Two-PAA Design ..................8
Table 2 Numbers of Students Tested at Grades 7 and 8, by Form ...........................................15
Table 3 Cronbach’s Coefficient Alpha, by Form and Section ..................................................15
Table 4 Correlation Between Scores on CBAL Measures and Scores on Selected External
Validity Measures ........................................................................................................16
Table 5 Response Frequencies for all Possible Responses to Pairs of Items Focused on the
“Understand Text Structure” LP, and the “Understand Plot Structure” LP ................17
Table 6 Mean Percent Correct By Targeted Skill Level, with Skill and Grade Level
Differences ...................................................................................................................18
Table 7 Frequency of Skill Mastery Patterns Defined in Terms of Examinees’ Model-
Building and Applied Comprehension Scores, for each of Two Different PAAs .......19

1
No Child Left Behind has highlighted the need for new types of assessments that not
only provide high-quality evidence about what students know and can do, but also help to
move learning forward. This paper presents a framework for developing reading
comprehension assessments focused on these goals. The framework was developed as part of
a research and development initiative titled “Cognitively Based Assessment of, for, and as Learning”
(CBAL; Bennett & Gitomer, 2009). The CBAL initiative is intended to provide a balanced
system of assessments that (a) documents what students have achieved (“assessment of
learning”), (b) helps identify how to plan and adjust instruction (“assessment for learning”),
and (c) engages students in worthwhile educational experiences as part of the assessment
process (“assessment as learning”).
CBAL assessments seek to achieve these goals by incorporating the following
innovations: (a) Linked summative and formative assessments are based on a theory of
domain competency that specifies both what students should be learning and how that
learning is likely to develop over time; (b) assessments include innovative scenario-based
tasks designed to model expert teaching practice and to encourage the use of classroom
activities that have been shown to support learning; (c) assessments are administered at
multiple time points spaced throughout the school year so that information about student
achievement can be shared with teachers while there is still time to take needed instructional
action; and (d) state-of-the-art automated scoring technologies are used to broaden the array
of skills assessed, and to ensure that score reports are provided in a timely manner.
Although the CBAL Initiative includes summative, formative, and professional
support components, this paper addresses the summative and formative components only. In
particular, we report research focused on the development and evaluation of linked
summative and formative reading assessments designed to provide high quality evidence for
state accountability purposes while simultaneously addressing key learning goals. .
The remainder of this paper is structured as follows. First, we describe the framework
developed to guide the assessment design; second, we describe a set of prototype reading
assessments targeted at readers in Grades 7 and 8; and finally, we present pilot data collected
in a large northeastern school district.

2
The CBAL Reading Framework
Existing accountability assessments have been characterized as representing a view of
proficiency that is “a mile wide and an inch deep” (Schmidt, McKnight, & Raizen, 1997). CBAL
assessments, by contrast, are designed to collect deeper evidence about a more modest number of
instructionally-relevant competencies. The framework developed to guide this process includes
three structures: a competency model, a set of hypothesized learning progressions (LPs), and a
set of task design principles. These structures are described below.
The CBAL Reading Competency Model
The CBAL Reading Competency Model provides a detailed description of the
knowledge, processes, and skills that characterize proficient reading at the elementary, middle
and secondary school levels. The model synthesizes information derived from three sources: a
review of the reading literature (O’Reilly & Sheehan, 2009), a review of state reading standards,
and a review of the reading skills specified in the Partnership for 21st Century Skills (2004;
2008). This body of literature suggests that today’s educators have adopted a new definition of
what constitutes proficient reading at the K–12 level. For example, in addition to traditional
reading skills such as comprehending syntactically complex sentences, understanding difficult
vocabulary, and generating accurate text-based inferences, today’s students are also expected to
master the higher-level thinking skills needed to complete 21st Century reading tasks such as
assessing the quality of information, identifying questionable assumptions, distinguishing fact
from opinion, and integrating and synthesizing information from multiple texts. Both researchers
and business leaders have argued that the ability to complete such tasks is essential to success in
today’s knowledge-based economy (National Center on Education and the Economy, 2006;
Kirsch, Braun, Yamamoto, & Sum, 2007; Committee on Prospering in the Global Economy of
the 21st Century, 2007).
A competency model designed to reflect this extended view of reading proficiency is
shown in Figure 1. Three important sources of individual differences are highlighted:
component skills, reading strategies, and knowledge of text conventions and characteristics.
These three dimensions are described below.

3
Figure 1. The CBAL Reading Competency Model.
The Skills Dimension. The skills dimension highlights three broad categories of skills:
prerequisite reading skills, model-building skills, and applied comprehension skills. These three
groups of skills are roughly similar to Chall’s (1967) notion of the skill sets involved in learning-
to-read, reading-to-learn, and reading-to-do.
The first set of skills, called prerequisite skills, includes all of the skills needed to
understand print, including oral reading fluency, word recognition, and decoding. Although some
of these skills (e.g., decoding) are not typically addressed on high-stakes assessments, recent
research has confirmed that providing feedback about students’ mastery of prerequisite skills can
help to move learning forward since deficiencies in critical prerequisite skills can compromise a

4
reader’s ability to efficiently apply needed higher-order skills (Perfetti, 1985; Vellutino, Tunmer,
& Jaccard, 2007).
The second skill set is called model building skills to emphasize its role in helping readers
develop coherent mental representations of the information presented in stimulus materials. This
second group includes all of the skills needed to form a coherent mental representation of a text,
that is, its gist, including: (a) comprehending the literal meaning of individual sentences,(b)
inferring the meaning of unfamiliar words, (c) using text-based inferences to infer cross-sentence
links, (d) generating global inferences when required information is, or is not, highly activated in
the text, and (d) using a text’s network of hierarchical and logical relationships (i.e., its structure)
to develop a more complete mental model of text content (Kintsch, 1998).
In some cases, comprehension of the gist of a text is all that is needed to completely
satisfy a reader’s goals. In other cases, however, readers must also generate additional
knowledge-based inferences. In the CBAL framework, the skills involved in implementing this
third level of processing are called Applied Comprehension skills. They include the additional
skills needed to integrate, critique, and apply what has been read to enhance understanding and
solve problems. These additional abilities involve going beyond the literal and inferential
interpretation of text in order to use the text to achieve a particular goal such as creating a
presentation, writing a report, or making a decision.
The Strategies Dimension. While increases in skill mastery have been shown to be
consistently correlated with increases in reading proficiency, researchers have also argued that
skilled readers differ from less skilled readers in terms of their ability to deploy effective reading
strategies when needed1. There are two bases for this claim. First, several studies have shown
that skilled readers tend to employ empirically validated reading strategies more frequently than
do less skilled readers (Bereiter & Bird, 1985; Chi, Bassok, Lewis, Reimann, & Glaser, 1989;
Paris & Jacobs, 1984; Pressley & Afflerbach, 1995). Second, studies have also demonstrated that
direct training in reading strategy selection and use can lead to significant improvements in
comprehension (Chi et al., 1994; McNamara, 2004; Palinscar & Brown, 1984; Paris et al., 1984;
Pressley et al., 1992).
As is shown in Figure 1, the proposed competency model highlights three types of
reading strategies. The first category, called Preparing to Read, includes strategies such as
setting a goal and generating hypotheses about text content from a scan of titles and headers. The

5
second category, called Model-Building Strategies, includes strategies such as chunking words,
generating bridging inferences, and using knowledge of text structure to enhance comprehension.
The third category, called Going Beyond the Text, includes additional strategies such as role
playing, and consulting outside resources such as dictionaries and thesauruses. This three-way
organization is designed to help educators develop more effective instructional units by
highlighting the link between the skill categories targeted by the assessment, and the types of
reading strategies that have been shown to be of use in helping students master those skills.
The Text Dimension. As is shown in Figure 1, the competency model also characterizes
readers in terms of their knowledge of the conventions and characteristics of text that may
enhance comprehension. For example, an understanding of literary concepts such as plot, setting,
and theme can facilitate comprehension of literary texts, while an awareness of organizational
structures such as problem/solution and cause/effect can facilitate comprehension of expository
text. This characterization reflects a large body of literature documenting significant differences
in the processes engaged when reading informational, persuasive, and literary texts (Graesser,
McNamara, and Louwerse, 2003).
Learning Progressions
Although the ultimate goal of a standards-based accountability assessment is to help
teachers close the gap between students’ current achievement levels, and the targets specified in
state content standards, most accountability assessments are not designed to facilitate the
detection of learning gaps. The CBAL reading framework addresses this need through a set of
hypothesized learning progressions (LPs). Each LP specifies “the sequenced set of subskills and
bodies of enabling knowledge that, it is believed, students must master en route to mastering a
more remote curricular aim” (Popham, 2008. p. 24). Resulting progressions are designed to
achieve two aims: (a) to help teachers conceptualize the pathways along which students are
expected to progress so that pedagogical actions designed to move learning forward can be taken
when needed (Heritage, 2008); and (b) to help item writers develop clusters of items that provide
initial information about possible learning gaps.
Figure 2 presents an illustrative set of LPs developed during the course of our
collaborative work with teachers in Maine, New Jersey, and Pennsylvania. Each progression
includes two key components: (a) a targeted curricular goal (shown in the rectangle at the top of

6
each progression); and (b) a sequenced set of subskills and bodies of enabling knowledge (shown
in the ovals presented in the middle of each progression.) Although the knowledge, strategies,
and skills specified in lower-level ovals are hypothesized to be prerequisite to the knowledge,
strategies and skills specified in higher-level ovals, such sequencing is not expected to hold for
all students. Rather, the hypothesized sequence is offered as a description of the learning
trajectory expected for a significant subset of students.
Target Curricular Aim:
Use an Understanding of Text Structure to Enhance Comprehension of
Informational Text
Level 3:
Summarize text in terms of categories
& details
Level 3:
Summarize text in terms of categories
& details
Level 1:
Group details into appropriate categories
Level 1:
Group details into appropriate categories
Level 2:
Infer appropriate categories from
details
Level 2:
Infer appropriate categories from
details
Starting Point:
Mastery of Critical Prerequisite Skills
Target Curricular Aim:
Use an Understanding of Plot Structure to Enhance Comprehension of
Literary Text
Level 3:
Understand how events advance the author’s
goals
Level 3:
Understand how events advance the author’s
goals
Level 1:
Determine the basic idea of the plot
Level 1:
Determine the basic idea of the plot
Level 2:
Identify key plot elements (e.g., climax
& resolution)
Level 2:
Identify key plot elements (e.g., climax
& resolution)
Starting Point:
Mastery of Critical Prerequisite Skills
Figure 2. Two hypothesized learning progressions.
Task Design Principles
In addition to providing high-quality information about where students are in their
mastery of critical competencies, CBAL assessments are also designed to support teaching and
learning by modeling expert teaching practice, and by encouraging the use of classroom
activities that have been shown to support learning. Approaches for achieving these goals are
based on three types of findings from the cognitive literature: (a) findings that suggest the
conditions under which texts are most likely to be remembered; (b) findings that suggest the
conditions under which learning is most likely to take place; and (c) findings that suggest the

7
conditions under which learning is most likely to be transferred. These findings are briefly
summarized below.
Memory for text and the comparative utility of alternative organizational approaches
have been examined in a number of recent studies (Daneman & Merilee, 1996; Pellegrino,
Chudowsky & Glaser, 2001; Vitale & Romance, 2007; Wyman & Randal, 1998). Results
suggest that the manner in which knowledge is organized can significantly impact a reader’s
ability to understand and remember what’s been read. CBAL incorporates these findings by
employing item formats designed to facilitate the organization and chunking of information, and
to encourage readers to consider multiple ways of representing text, for example, timelines, flow
charts, and generalized graphic organizers.
The importance of providing a purpose for reading has also been frequently noted in the
literature (Alderson, 2000; Bransford, Brown, & Cocking, 1999; Pellegrino, Chudowsky, &
Glaser, 2001; Pressley, 2000). CBAL incorporates this finding by providing extended, scenario-
based tasks designed to simulate the types of reading activities engaged in by expert readers at
the targeted grade level. Each extended task set begins with an introductory scenario selected to
give students an authentic purpose for reading a collection of related texts. Scenarios present
realistic project goals designed to help readers determine the specific pieces of information that
are and are not relevant to the stated purpose.
Researchers have also considered the characteristics of tasks that contribute to task
complexity (Sheehan & Ginther, 2001; Sheehan, Kostin, & Persky, 2006; Sheehan & Mislevy,
1990). CBAL incorporates this research in two ways. First, in some cases, more complex tasks
are broken down into shorter, more manageable subtasks, and subtasks are ordered so that later
subtasks build on the results obtained in earlier subtasks. In order to induce independence across
tasks, however, correct responses to earlier subtasks are provided before students are asked to
complete subsequent, related subtasks. Second, information about examinees’ mastery of critical
component skills is also collected via innovative task formats that require examinees to evaluate,
correct, and complete simulated student projects constructed to illustrate common errors and
omissions.
Finally, because transfer depends on the development of an explicit understanding of when to
apply what has been learned, CBAL task sets are also designed to highlight structural similarities in
the contexts that call for the application of particular combinations of skills. Task formats designed

8
to facilitate this goal include: (a) tasks that involve multiple texts (Catrambone & Holyoak, 1989);
(b) tasks that highlight multiple ways of representing text (Gick & Holyoak, 1980); (c) tasks that
require students to consider multiple perspectives simultaneously; and (d) tasks that involve the use
of multiple modalities (e.g., text and video, Moreneo & Mayer, 1999, 2000).
A Prototype Assessment Design Targeted at Seventh and Eighth Grade Readers
Information that arrives at the end of the year cannot help teachers adjust instruction in
the middle of the year. CBAL addresses the need for more timely information about student
achievement by specifying a multiform, multipurpose design that includes linked summative and
formative components administered at multiple time points spaced throughout the school year.
Individual summative components are called Periodic Accountability Assessments or PAAs.
Results from successive PAA administrations are accumulated so that a rich characterization of
examinee proficiency is available at the end of the year.
Although the total number of summative assessments administered in any one school
district during any one school year is subject to a variety of economic and policy constraints,
designs involving four or fewer summative assessments per year are most likely. For this study,
we elected to investigate a design which called for addressing relevant state standards via a
sequence of two PAAs. Individual PAAs were structured as shown in Table 1. This type of
multiform design offers three benefits: (a) tasks can be more complex and integrative since more
time is available for assessment in the aggregate; (b) intermediate results can be provided to
teachers while there is still time to take appropriate instructional action; and (c) since no one
assessment or occasion is determinative, a firmer evidentiary base is available to support high-
stakes decisions about students, teachers and institutions at the end of the year.
Table 1
A Summative Reading Assessment Implemented via a Two-PAA Design
Testing occasion
Prerequisite skills
Reading strategies
Literary skills & knowledge
Informational/ persuasive skills
& knowledge 1
2

9
Two prototype PAAs have been developed for use in investigating this design. Each
individual prototype included two sections: a Spoken Response section (10 minutes) and a
scenario-based Extended Comprehension section (55 minutes). Brief descriptions of each section
are presented below.
The Spoken Response Section2
This section is designed to provide evidence of examinees’ mastery status relative to key
prerequisite reading skills such as recognizing familiar words, decoding unfamiliar words, and
reading fluently. It consists of three read-aloud passages that are automatically scored by
SpeechRaterSM, an automated scoring technology developed to score spoken responses (Zechner,
Sabatini, & Chen, 2009). Sheehan & O’Reilly (2008) demonstrated that examinee-level data
derived from this section, combined with examinee-level data derived from the other sections
described below, was sufficient to distinguish two types of struggling readers: (a) word callers,
that is, examinees who are fluent readers yet have trouble comprehending what they’ve read, and
(b) gap fillers, that is, examinees who must struggle to maintain a sufficient reading speed, yet
are still managing to grasp the literal meaning of text, possibly because they have learned to
compensate for deficiencies in required prerequisite skills. (Also see Paris, Carpenter, Paris, &
Hamilton, 2005.) Since word callers would likely benefit from additional training in
comprehension strategies, while gap fillers would likely benefit from additional training in
fluency and decoding strategies, these results suggest that CBAL test scores may help teachers
develop instructional strategies appropriate for struggling readers with differing patterns of
strengths and weaknesses.
The Extended Comprehension Section
This section begins with an introductory scenario designed to give students a realistic
purpose for reading a collection of related texts. The scenario in the Informational PAA was
specified as follows: You have to write a report about the Scientific Method for your science
class. Since you enjoy reading about American History, you decide to focus your report on Ben
Franklin’s use of the Scientific Method. Read the following passages to learn more about the
Scientific Method and about Ben Franklin’s scientific experiments.
Subsequent exercises focused on four related texts: an article about the scientific method
taken from an encyclopedia, a passage about Ben Franklin’s scientific experiments adapted from a

10
Social Studies textbook, a newspaper article about three recent winners of the Intel Science
Competition, and a diagram from a student lab report. The texts were presented with 23 associated
exercises. Some of the exercises were designed to assess comprehension of individual texts in
isolation; others were designed to assess the ability to integrate and synthesize information from
multiple texts. For example, one exercise required examinees to classify individual sentences from
the Ben Franklin passage in terms of the particular steps of the scientific method. Since the Ben
Franklin passage was not written to illustrate the steps of the scientific method, a correct response
required both cross-document thinking and transfer, that is, students had to apply a classification
framework developed from reading one text (the encyclopedia article) to a specific reading-to-do
problem framed in terms of a second text (the Ben Franklin passage.)
Sample Tasks
CBAL tasks are designed to provide evidence of examinee standing relative to the
subskills specified in sets of hypothesized LPs. Figure 3 shows a two-part item designed to
collect evidence of examinee standing relative to the first two building blocks in the “Understand
Text Structure” LP which was previously shown in Figure 2. In this first part of the item, the
examinee is presented with a text and a partially completed summary of the text displayed as a
graphic organizer. The corresponding item stem asks examinees to “fill in the best phrases in the
second row of the chart.” This part of the item is designed to provide initial evidence of
examinees’ mastery status relative to the second building block in the targeted LP, that is, the
ability to generate an appropriate set of organizing categories for a text. Resulting responses are
scored using c-rater™, an automated scoring module developed at ETS to score short-answer
constructed responses (Leacock & Chodorow, 2003).
The second part of the item is shown in the bottom half of Figure 3. Here, a more
complete graphic organizer is provided, and the examinee is asked to complete the chart by
classifying additional details extracted from the text. This portion of the item employs a selected-
response format, and is designed to provide evidence of examinee proficiency relative to the first
building block in the hypothesized LP.
Figure 4 presents two additional sample items. These additional items are designed to
collect initial mastery evidence relative to the first two building blocks in the “Understand Plot
Structure” LP which was previously shown in Figure 2. Both items refer to the same short story.
The first item focuses on the first building block in the hypothesized sequence, that is,

11
demonstrating an understanding of the basic idea of the plot. The second item focuses on the
second building block in the sequence, that is, specifying how the plot is resolved.
The items in Figures 3 and 4 also illustrate key design principles. For example, three of
the four items illustrate the principle of using graphical formats to facilitate the organization and
chunking of information, and the sequence in Figure 3 illustrates the principle of inducing
independence by providing correct answers to earlier subtasks before presenting subsequent,
related subtasks.
Part A
Part B
Figure 3. A two-part item designed to provide mastery evidence relative to the first two
building blocks in the “Understand Text Structure” LP.

12
Figure 4. Items designed to provide mastery evidence relative to the first two building
blocks in the “Understand Plot Structure” LP.

13
Method
This section describes the procedures employed during the collection and analysis of data
from two pilot administrations.
Materials
Both prototype assessments were developed in collaboration with a team of middle
school Language Arts teachers. The first prototype (called PAA #1) was administered in the
Fall of 2007. The second prototype (called PAA #2) was administered in the Spring of 2008.
Participants
Participating students were enrolled in English Language Arts or Social Studies classes
taught by four different teachers from three different schools in a large northeastern school
district. Approximately 200 students were tested at each administration. A total of 171 students
were tested at both administrations.
Procedure
PAAs were administered via students’ individual Macintosh laptops during regular
classroom sessions. Two concurrent validity measures were also administered as part of the
study: the Test of Word Reading Efficiency (TOWRE, Torgesen, Wagner, & Rashotte, 1999) and
the Gates-MacGinitie Reading Test (MacGinitie, MacGinitie, Maria, & Dreyer, 2000). The
TOWRE is a standardized measure of word recognition and decoding skill. It consists of a series
of word lists that students must read aloud. The Gates-MacGinitie Reading Test is a standardized
measure of Model-Building skill (Ozuru, et al., 2008). It consists of a series of short passages
followed by sets of multiple choice items. Unlike many of the items included on the CBAL
Extended Comprehension Section, each Gates item is designed to assess comprehension of a
single passage. Gates scores are only available for students tested in Spring 2007.
Due to differences in class periods across the three participating schools, students were
either tested during a single 110-minute period (in both the Fall administration and the Spring
administration), or during two separate 55-minute periods. When separate 55-minute periods
were used, no more than one day elapsed between testing sessions. Under each configuration,
students were allowed 10 minutes to complete the CBAL Spoken Section, 55 minutes to
14
complete the CBAL Extended Comprehension Section, 10 minutes to complete the TOWRE, and
35 minutes to complete the Gates Assessment.
Analysis
Psychometric analyses focused on two key properties: reliability and validity. Two
approaches for assessing score reliability were implemented. First, we examined the correlation
between scores earned on the first and second PAAs. Although each PAA was designed to focus
on a somewhat different constellation of skills (see Table 1), a significant correlation between
the two sets of scores was expected nonetheless. Additional information about score reliability
was developed by considering internal consistency estimates calculated via Cronbach’s
Coefficient Alpha.
Two aspects of validity were also examined: nomothetic span and construct
representation (Embretson, 1983). Nomothetic span concerns the relationship of a test to other
measures of individual differences. Construct representation concerns the processes, strategies,
and knowledge structures that are involved in responding to test items.
Nomothetic span was evaluated by considering the degree of correlation between the two
CBAL sections (i.e., the Spoken Response Section and the Extended Comprehension Section)
and the two concurrent validity measures (i.e., the TOWRE, a measure of prerequisite skills, and
the Gates Comprehension Assessment, a measure of model-building skills). Since the CBAL
Spoken Response Section is designed to measure prerequisite skills and the CBAL Extended
Comprehension Section is designed to measure model-building and applied comprehension
skills, we hypothesized that (a) scores on the CBAL Spoken Section would be more highly
correlated with TOWRE scores than with Gates scores, and (b) scores on the CBAL Extended
Comprehension Section would be more highly correlated with Gates scores than with TOWRE
scores. These hypotheses were tested using an approach that employs the Fisher z'
transformation to account for the fact that the sampling distribution of r is likely to be
asymmetrical (see Snedecor & Cochran, 1973, p. 183).
Construct representation was evaluated by considering the degree of consistency between
examinees’ observed item response patterns and a set of ideal item response patterns defined in
accordance with the requisite relationships specified in the hypothesized competency model, and
in a set of hypothesized learning progressions. When a significant proportion of the observed
item response patterns are consistent with the hypothesized ideal item response patterns, we have

15
evidence that the hypothesized competencies are, in fact, involved in item solving (Tatsuoka,
1983, 1990).
Table 2 shows the number of students tested at each administration.
Table 2
Numbers of Students Tested at Grades 7 and 8, by Form
Form Time Grade 7 Grade 8 Total PAA #1 Fall 2007 160 56 216 PAA #2 Spring 2008 108 72 180
Note. A total of 171 students were tested on both occasions.
Score Variation Across and Within PAAs Score variation across PAAs was examined by looking at the correlation between total
scores earned on the first PAA (administered in Fall 2007), and on the second PAA
(administered in Spring 2008.) Since a total of 171 examinees were tested on both occasions, a
total of 171 score pairs were available for consideration in the analysis. These data yielded a
correlation of 0.76. This degree of correlation is within the range expected, considering that
several months elapsed between administrations, and that the two PAAs targeted somewhat
different subsets of skills.
Internal consistency estimates calculated using Cronbach’s Coefficient Alpha were also
examined. These estimates are shown in Table 3. Although local dependencies among items may
have resulted in some degree of inflation, in general, for each PAA, reported levels are within the
range considered acceptable for making judgments about individuals.
Table 3
Cronbach’s Coefficient Alpha, by Form and Section
Form/Section Total Items Coefficient Alpha PAA # 1 Spoken Section 43 0.91 Extended Comprehension Section 23 0.87 PAA # 2 Spoken Section 43 0.92 Extended Comprehension Section 29 0.88

16
Nomothetic Span
Table 4 summarizes the results obtained in the analysis of nomothetic span. Correlations
between scores on the two CBAL PAAs and the available concurrent validity measures are
presented. One-tailed test statistics (z') are also presented. These assumed the following
alternative hypotheses,
H1: (CBAL Spoken, TOWRE) > (CBAL Spoken, Gates), and
H1: (CBAL Comprehension, Gates) > (CBAL Comp., TOWRE).
Resulting estimates suggest that, as expected, scores on the CBAL Spoken Section are
more highly correlated with TOWRE scores (r = 0.78) than with Gates scores (r = 0.63), and
scores on the CBAL Extended Comprehension Section are more highly correlated with Gates
scores (r = 0.79) than with TOWRE scores (r = 0.46). These results support our assertion that the
CBAL Spoken Section measures prerequisite skills, while the CBAL Extended Comprehension
Section measures additional skills over and above the prerequisite skills.
Table 4
Correlation Between Scores on CBAL Measures and Scores on Selected External Validity Measures
External measures of Pre-requisite skilla Comprehension skillb z′
PAA #1 Spoken Section 0.78 (182) 0.63 (143) 2.69 ** Ext. Comp. Section 0.46 (182) 0.79 (152) 5.18 *** PAA #2 Spoken Section 0.76 (180) 0.58 (171) 3.10 ** Ext. Comp. Section 0.41 (159) NA NA
Note. Ext. Comp. = Extended Comprehension. Values in parentheses show the number of valid score pairs entering into the calculation of each correlation coefficient. Some examinees were unable to complete testing for one or more of the external measures. aThe Test of Word Reading (TOWRE) was administered at both time periods. bThe Gates MacGinitie Assessment was only administered at time period #1 (fall 2007). *** p < .001. ** p < .01. One-tailed test.
Construct Representation
Several approaches for examining the construct representation of the Extended
Comprehension section were implemented. In the first approach, responses to the items in
Figures 3 and 4 were used to evaluate the extent to which examinees’ observed item response

17
patterns reflected the prerequisite relationships specified in the “Understand Text Structure” LP
and in the “Understand Plot Structure” LP. Relevant data are summarized in Table 5.
The top half of the table shows response frequencies for items designed to provide
initial mastery evidence for the first two building blocks in the “Understand Text Structure”
LP. Because only two items are involved, only four response patterns are possible: 00, 10,
11, and 01, where 1 indicates a correct response and 0 indicates an incorrect response. Note
that only three of the four possible patterns are consistent with the hypothesized progression.
The single inconsistent pattern is Pattern TS-4. This pattern is not consistent because it pairs
an incorrect response to an item classified as requiring a relatively low level skill, with a
correct response to an item classified as requiring a relatively high level skill. Note that only
6% of examinees responded with that pattern.
Responses to the “Understand Plot Structure” items are shown in the bottom half of
the table. Note that a similar result is obtained. That is, only 4% of examinees responded in
a way that was inconsistent with the hypothesized progression. These results suggest that the
hypothesized LPs are consistent with the learning patterns typical of examinees in the
studied population. Of course, since each observed pattern is based on just two item
responses, resulting classifications are most properly viewed as initial hypotheses to be
validated via subsequent classroom-based formative assessments.
Table 5
Response Frequencies for all Possible Responses to Pairs of Items Focused on the “Understand Text Structure” LP, and the “Understand Plot Structure” LP
Pattern ID
Observed patterna
Consistent with hypothesized progression?
Number of examinees
Percent of examinees
Progression = Understand Text Structure TS-1 00 Yes 47 26 TS-2 10 Yes 55 30 TS-3 11 Yes 70 38 TS-4 01 No 11 6 Total 183 100
Progression = Understand Plot Structure PL-1 00 Yes 19 10 PL-2 10 Yes 42 23 PL-3 11 Yes 112 62 PL-4 01 No 8 4 Total 181 99
Note. Percentages may not sum to 100 due to rounding errors. a 0 = incorrect response, 1 = correct response.

18
The above analysis also illustrates an approach for selecting instructional adjustments
designed to support learning. For example, if the classifications in Table 5 were, in fact.
supported by additional classroom-based observations, differentiated instruction might be offered
as follows: (a) for students classified into the first level of the “Text Structure” LP, provide
additional instruction in classifying details into given categories; (b) for students classified into
the second level of the “Text Structure” LP, provide additional instruction in inferring
appropriate organizing categories; (c) for students classified into the first level of the “Plot
Structure” LP, offer additional instruction in determining the basic idea of the plot; and (d) for
students classified into the second level of the “Plot Structure” LP, offer additional instruction in
distinguishing critical elements of the plot such as the climax and resolution.
Section-level analyses of construct representation were also implemented. These
considered prerequisite relationships among items classified as requiring Model-Building or
Applied Comprehension skill. Table 6 shows the numbers of items classified into each of these
two categories on each of the two PAAs.
Table 6
Mean Percent Correct By Targeted Skill Level, with Skill and Grade Level Differences
PAA/ Targeted Skill Level
Items
Grade 7
Grade 8
Grade level
difference PAA #1 Model-Building Skill 7 0.62 0.68 .06 Applied Comprehension 23 0.42 0.50 .08 Skill Level Difference 0.20 0.18 PAA #2 Model-Building Skill 16 0.64 0.74 .10 (.51) Applied Comprehension 13 0.39 0.47 .08 (.40) Skill Level Difference 0.27
(1.25) 0.28
(1.47)
Note. Effect sizes calculated using Cohen’s D are given in parentheses.
Table 6 also shows the mean percent correct, by skill category, for each PAA. Note that,
on both PAAs, and at both grade levels, examinees consistently performed better on Model-
Building items compared to Applied Comprehension items. This result is consistent with the
hypothesized model since Model Building Skill is defined as the ability to develop an accurate

19
mental representation of the information presented in a single text, and Applied Comprehension
skill is defined as the ability to use such representations, when necessary, to solve applied
problems such as reconciling information from different texts.
Prerequisite relationships among Model-Building and Applied Comprehension items
were also evaluated. This analysis considered a mastery cut-off score of 50%. That is, examinees
with percent correct scores of at least 50% in a particular skill category (i.e., either Model
Building or Applied Comprehension) were classified as scoring at the “High” level for that skill
category, and examinees with scores below 50% were classified as scoring at the “Low” level for
that skill category. Table 7 summarizes the resulting mastery patterns. Because the hypothesized
cognitive model specifies that Model Building Skills are prerequisite to Applied Comprehension
Skills, three of the specified patterns are consistent with the hypothesized model and one is not.
The single inconsistent pattern is Pattern 4, the only pattern that pairs a low Model Building
score with a High Applied Comprehension Score. The table shows that Pattern 4 was extremely
rare for both forms. In particular, Pattern 4 was only observed once for PAA #1, and it wasn’t
observed at all for PAA #2. These results contribute to construct representation by supporting the
hypothesized prerequisite relationship between Model Building Skills and Applied
Comprehension Skills.
Table 7
Frequency of Skill Mastery Patterns Defined in Terms of Examinees’ Model-Building and
Applied Comprehension Scores, for each of Two Different PAAs
PAA #1 PAA #2
Pattern MB AP No. Percent No. Percent
1 Low Low 58 27 39 22
2 High Low 78 36 74 41
3 High High 79 37 67 37
4 Low High 1 0 0 0
Total 216 100 180 100
Note. MB = Model Building Proficiency Classification, AP = Applied Comprehension Proficiency Classification. Test = Pearson chi-square with Yates continuity correction. For PAA #1, the analysis yielded a chi-square value of 41.42, p < .001. For PAA #2, the analysis yielded a chi-square value of 27.58, p < .001.

20
Discussion
This paper describes a scenario-based assessment of reading competency designed to
provide high-quality evidence for state accountability purposes while simultaneously offering
information about examinees’ skill mastery profiles that might be used to support both teaching
and learning. Targeted skills include the full range of competencies underlying proficient reading
at the middle-school level, including both lower-order skills such as oral reading fluency and
decoding, and higher-order skills such as the ability to integrate and synthesize information from
multiple texts.
Two prototype test forms were analyzed. Each prototype included two sections: a Spoken
Response Section and a scenario-based Extended Comprehension Section. Individual prototypes
were designed to collect information about examinee achievement relative to distinct, yet
overlapping subsets of skills. Psychometric analyses focused on two key properties: reliability
and validity.
Two approaches for evaluating score reliability were implemented. First, we looked at the
degree of correlation between total test scores obtained on the two prototypes. The observed
correlation of 0.76 was within the range expected for assessments designed to focus on
somewhat different subsets of skills.
Second, we considered variation in internal consistency. Since each prototype included
two very different sections (i.e., a Spoken Response Section and a scenario-based Extended
Comprehension Section) internal consistency estimates were calculated separately for each
section. Results suggested acceptable levels of internal consistency for scores on both the Spoken
Section, and the Extended Comprehension Section.
Two approaches for investigating construct validity were also implemented. Nomothetic
span was investigated by examining correlations with existing measures of individual differences
(i.e., the TOWRE, a measure of prerequisite skills, and the Gates MacGinitie Reading
Assessment, a measure of model-building skills). These analyses suggested that key design goals
have been met. In particular, CBAL Spoken Scores were observed to be more highly correlated
with TOWRE scores than with Gates scores, and CBAL Comprehension Scores were observed
to be more highly correlated with Gates scores than with TOWRE scores.
Construct representation was also examined. Results suggested that items coded as
requiring Applied Comprehension skills require additional abilities over and above the abilities

21
called for by items classified as requiring model-building skills. The analysis also suggested that,
for the most part, students’ response patterns were consistent with the relationships specified in a
set of hypothesized learning progressions. These results contribute to construct representation by
explicating the processes involved in responding to test items.
Certain limitations of the analyses should be emphasized. First, available student samples
were relatively small, consisting of just 216 students at the administration of the first PAA, and
180 students at the administration of the second PAA. Second, the participating schools were not
selected to be representative of all middle schools nationwide, or even of all middle schools in
the Northeast. Third, motivation might have been an issue for some students as the pilot results
were not considered when assigning student grades. Fourth, although we hypothesized that our
learning progressions and associated task models would encourage teachers to adopt more
effective instructional strategies, the study was not designed to quantify changes in classroom
practice. Despite these limitations, however, the analysis results suggest that scenario-based
reading assessments constitute a promising approach for achieving both measurement and
learning goals. Future planned research will enable us to build on these findings while also
addressing the important issue of how best to measure effects on classroom practice.

22
References
Bennett, R. E., & Gitomer, D. H. (2009). Transforming K-12 assessment. In C. Wyatt-Smith & J.
Cumming (Eds.), Educational assessment in the 21st century. New York, NY: Springer.
Bransford, J., Brown, A., & Cocking, R. (Eds.). (1999). How people learn: Brain, mind,
experience, and school. Washington, DC: National Academies Press.
Chall, Jeanne, S. (1967). Stages of reading development. New York, NY: McGraw-Hill.
Committee on Prospering in the Global Economy of the 21st Century. (2007). Rising above the
gathering storm: Energizing and employing America for a brighter economic future.
Washington, DC: National Academies Press.
Embretson, S. E. (1983). Construct validity: Construct representation versus nomothetic span.
Psychological Bulletin, 93, 179–197.
Embretson, S. E., & Wetzel, C. D. (1987). Component latent trait models for paragraph
comprehension tests. Applied Psychological Measurement, 11, 175–193.
Goldman, S. R. (2004). Cognitive aspects of constructing meaning through and across multiple
texts. In N. Shuart-Ferris & D.M. Bloome (Eds.), Uses of intertextuality in classroom and
educational research. (pp. 317–351).Greenwich, CT: Information Age Publishing.
Gorin, J. S., & Embretson, S. E. (2006). Item difficulty modeling of paragraph comprehension
items. Applied Psychological Measurement, 30(5), 394–411.
Graesser, A. C., Wiley, J., Goldman, S., O’Reilly, T., Jeon, M., & McDaniel, B. (2007). SEEK
web tutor: fostering a critical stance while exploring the causes of volcanic eruption.
Metacognition and Learning, 2, 89–105.
Haertel, E. H., & Herman, J. L. (2005). A historical perspective on validity arguments for
accountability testing. In J. L. Herman & E. H. Haertel (Eds.), Uses and misuses of data
for educational accountability and improvement. The 104th yearbook of the National
Society for the Study of Education (Part 2, pp. 1–34). Malden, MA: Blackwell.
Kintsch, W. (1998). Comprehension: A paradigm for cognition. Cambridge, UK: Cambridge
University Press.
Kirsch, I., Braun, H., Yamamoto, K., & Sum, A. (2007). America’s perfect storm: Three forces
changing our nation’s future. Princeton, NJ: ETS.
Leacock, C., & Chodorow, M. (2003). C-rater: Automated scoring of short-answer questions,
Computers and the Humanities 37(4).

23
MacGinitie, W. H., MacGinitie, R. K., Maria, K., & Dreyer, L. G. (2000). Gates-MacGinitie
Reading Tests, 4th Edition, Forms S and T. Itasca, IL: Riverside Publishing Company.
McNamara, D. S. (2004). SERT: Self explanation reading training. Discourse Processes, 38, 1–
30.
McNamara, D. S., O’Reilly, T., Best, R., & Ozuru, Y. (2006). Improving adolescent students’
reading comprehension with iSTART. Journal of Educational Computing Research. 34,
147–171.
McNamara, D. S., Ozuru, Y., Best, R., & O’Reilly, T. (2007). A reading strategies framework. In
D. S. McNamara (Ed.), pp 465–496. Reading comprehension strategies: theory,
interventions, and technologies. Mahwah, NJ: Erlbaum
National Center on Education and the Economy. (2006). Tough times, tough choices: The report
of the New Commission on the Skills of the American Workforce. Washington, DC:
Government Printing Office.
O’Reilly, T. & Sheehan, K. M. (2008, July). Cognitively based assessment of, for, and as
learning: a 21st century approach for assessing reading competency. Proceedings of the
30th Annual Meeting of the Cognitive Science Society, Washington, DC.
Ozuru, Y., Rowe, M., O'Reilly, T., & McNamara, D. S. (2008). Where's the difficulty in
standardized reading tests: The passage or the question? Behavior Research Methods, 40,
1001–1015.
Paris, S. G., Carpenter, R. D., Paris, A. H., & Hamilton, E. E. (2005). In S. G. Paris & S. A. Stahl
(Eds.), Children’s reading comprehension and assessment. Mahwah, NJ: Lawrence
Erlbaum Associates.
Partnership for 21st Century Skills, (2004). Learning for the 21st century: a report and mile
guide for 21st century skills. Washington: Author. Retrieved from
http://www.21stcenturyskills.org/images/stories/ otherdocs/p21up_Report.pdf
Pashler, H., Bain, P., Bottge, B., Graesser, A., Koedinger, K., McDaniel, M., & Metcalfe, J.
(2007). Organizing instruction and study to improve student learning (NCER 2007-
2004). Washington, DC: National Center for Education Research, Institute of Education
Sciences, U.S. Department of Education. Retrieved from http://ncer.ed.gov.

24
Pellegrino, J.,Chudowsky, J. N., & Glaser, R. (Eds.) (2001). Knowing what students know. The
science and design of educational assessment. Washington, DC: National Academy
Press.
Perfetti, C. A. (1985). Reading Ability. New York, NY: Oxford University Press.
Popham, W. J. (2008). Transformative assessment. Alexandria, VA: Association for Supervision
and Curriculum Development.
Sabatini, J., Sheehan, K., O’Reilly, T., Bruce, K. (2007, June). Developing reading
comprehension assessments targeting struggling readers: An overview and some findings
so far. Poster presented at the Institute of Education Sciences 2007 Research Conference,
Washington, DC.
Schmidt, W. H., McKnight, C. C., & Raizen, S.A. (1997). A spirited vision: An investigation of
U.S. science and mathematics education. Dordrecht, the Netherlands: Kluwer.
Sheehan, K. M. (1997). A tree-based approach to proficiency scaling and diagnostic assessment.
Journal of Educational Measurement, 34, 333-352.
Sheehan, K. M., & Ginther, A. (2001). Understanding performance on the current TOEFL
reading section. Paper presented at the National Reading Conference, Orlando, FL.
Sheehan, K. M., Kostin, I & Futagi, Y., (2008a, July). Reading level assessment for high-stakes
testing applications: A second look at variation due to differences in text genre. Paper
presented at the Annual Meeting of the Society for Text and Discourse, Memphis, TN.
Sheehan, K.M., Kostin, I., & Futagi, Y. (2008b, July). When do standard approaches for
measuring vocabulary difficulty, syntactic complexity and referential cohesion yield
biased estimates of text difficulty? Poster presented at the 30th Annual Meeting of the
Cognitive Science Society, Washington, DC.
Sheehan, K. M., Kostin, I., & Persky, H. (2006, April). Predicting item difficulty as a function of
inferential processing requirements: An examination of the reading skills underlying
performance on the NAEP Grade 8 reading assessment. Paper presented at the Annual
Meeting of the National Council on Measurement in Education, San Francisco, CA.
Sheehan, K. M., & Mislevy, R. J. (1990). Integrating cognitive and psychometric models to
measure document literacy. Journal of Educational Measurement, 27, 1–18.

25
Sheehan, K. M. & O’Reilly, T. (2008, March). A cognitively based assessment system for
reading comprehension competency. Paper presented at the American Educational
Research Association Annual Meetings, New York, NY.
Snedecor, G. W., & Cochran, W. G. (1973). Statistical methods. Ames, IA: The Iowa State
University Press.
Snow, C. (2002). Reading for understanding: Toward an R&D program in reading
comprehension. Santa Monica, CA: RAND.
Tatsuoka, K. K. (1990). Toward an integration of item-response theory and cognitive error
diagnosis. In N. Fredericksen, R. Glaser, A. Lesgold, & Shafto, M. G. (Eds.), Diagnostic
monitoring of skill and knowledge acquisition. Hillsdale, NJ: Erlbaum.
Tatsuoka, K. K. (1983). Rule space: An approach for dealing with misconceptions based on item
response theory. Journal of Educational Measurement, 20, 345–354.
Tatsuoka, K. K., Birenbaum, M., Lewis, C., & Sheehan, K. (1993). Proficiency scaling based on
conditional probability functions for attributes (ETS Research Report No. RR-93-50-
ONR). Princeton, NJ: ETS.
Torgesen, J. K., Wagner, R. K., & Rashotte, C. A. (1999). Tests of word reading efficiency
(TOWRE). Austin, TX: Pro-Ed.
Vellutino, F., Tunmer, W., & Jaccard, J.(2007). Components of reading ability: Multivariate
evidence for a convergent skills model of reading development. ; Scientific Studies of
Reading, 11(1), 3–32.
Zechner, K., Sabatini, J., & Chen, L. (2009, June). Automatic scoring of children's read-aloud
text passages and word lists. Proceedings of the Fourth International Workshop on Using
Natural Language Processing Technologies for Building Educational Applications,
Conference of the North American Chapter of the Association for Computational
Linguistics and Human Language Technologies (HLT-NAACL-2009), Boulder, CO.

26
Notes
1 Strategies are deliberate, conscious, effortful actions that successful readers implement
to repair breaks in comprehension and to move understanding from a shallow level to
a deeper level.
2 Technological or policy considerations may warrant moving this section to the
formative system for some school districts.