the cassini cosmic dust analyzer - |lasp|cu...
TRANSCRIPT

THE CASSINI COSMIC DUST ANALYZER
R. SRAMA1,!, T. J. AHRENS3, N. ALTOBELLI1, S. AUER4, J. G. BRADLEY2,M. BURTON2, V. V. DIKAREV1,21, T. ECONOMOU5, H. FECHTIG1, M. GORLICH11,
M. GRANDE6, A. GRAPS1, E. GRUN1,20, O. HAVNES7, S. HELFERT19, M.HORANYI17, E. IGENBERGS8, E. K. JESSBERGER9, T. V. JOHNSON2, S. KEMPF1,
A.V. KRIVOV18, H. KRUGER1, A. MOCKER-AHLREEP1, G.MORAGAS-KLOSTERMEYER1, P. LAMY10, M. LANDGRAF22, D. LINKERT1,G. LINKERT1, F. LURA11, J. A. M. MCDONNELL12, D. MOHLMANN11, G. E.
MORFILL13, M. MULLER12, M. ROY2, G. SCHAFER1, G. SCHLOTZHAUER11,G. H. SCHWEHM14, F. SPAHN18, M. STUBIG1, J. SVESTKA15,
V. TSCHERNJAWSKI11, A. J. TUZZOLINO5, R. WASCH11 and H. A. ZOOK16
1Max-Planck-Institut fur Kernphysik, Postf. 103980, 69029 Heidelberg, Germany2Jet Propulsion Laboratory, 4800 Oak Grove Drive, Pasadena, CA 91103, U.S.A.
3Seismological Laboratory, CALTECH, Pasadena, CA, U.S.A.4Post Office Box 421, Basye, VA 22810, U.S.A.
5Enrico Fermi Institute, University of Chicago, Chicago, IL 60637-1433, U.S.A.6Rutherford Appleton Laboratory, Chilton, Didcot, Oxon, OX11 0QX, U.K.
7Auroral Observatory, University of Tromso, 9000 Tromso, Norway8Fachgebiet Raumfahrttechnik, TU Munchen, Boltzmannstrasse 15, 85748 Garching, Germany
9University Munster, Schloßplatz 2, 48149 Munster, Germany10Laboratoire d’Astronomie Spatiale, B.P. 8, 13376 Marseille Cedex 12, France
11DLR Berlin, Rutherfordstrasse 2, 12489 Berlin, Germany12Planetary and Space Science Research Institut, Open University, Walton Hall, Milton Keynes
MK7 6AA, U.K.13Max-Planck-Institut fur Physik und Astronomie, Postf. 1603, 85740 Garching, Germany14ESA-ESTEC, Planetary and Space Science Division, P.O. Box 299, 2200 AG Noordwijk,
The Netherlands15Prague Observatory, Petrin 205, 11846 Prague 1, C.R.
16NASA Johnson Space Center, SN3, Houston, TX 77058, U.S.A.17Laboratory for Atmospheric and Space Physics, 1234 Innovation Drive, Boulder, CO
80303-7814, U.S.A.18AG nonlinear dynamics, University of Potsdam, Am neuen Palais 19, 14469 Potsdam, Germany
19Lehrstuhl Praktische Informatik, University of Mannheim, A5, 68131 Mannheim, Germany20HIGP, University of Hawaii, 1680 East West Road, Honolulu, HI 96822, U.S.A.
21Astronomy Institute of St. Petersburg State University, Russia22ESA/ESOC, Robert-Bosch-Straße 5, 64293 Darmstadt, Germany
(!Author for correspondence: E-mail address: [email protected])
(Received 12 March 1998; Accepted in final form 7 January 2002)
Abstract. The Cassini-Huygens Cosmic Dust Analyzer (CDA) is intended to provide direct observa-tions of dust grains with masses between 10"19 and 10"9 kg in interplanetary space and in the jovianand saturnian systems, to investigate their physical, chemical and dynamical properties as functionsof the distances to the Sun, to Jupiter and to Saturn and its satellites and rings, to study their interactionwith the saturnian rings, satellites and magnetosphere. Chemical composition of interplanetarymeteoroids will be compared with asteroidal and cometary dust, as well as with Saturn dust, ejecta
Space Science Reviews 114: 465–518, 2004.C# 2004 Kluwer Academic Publishers. Printed in the Netherlands.

466 R. SRAMA ET AL.
from rings and satellites. Ring and satellites phenomena which might be effects of meteoroid impactswill be compared with the interplanetary dust environment. Electrical charges of particulate matterin the magnetosphere and its consequences will be studied, e.g. the effects of the ambient plasmaand the magnetic field on the trajectories of dust particles as well as fragmentation of particles due toelectrostatic disruption.
The investigation will be performed with an instrument that measures the mass, composition,electric charge, speed, and flight direction of individual dust particles. It is a highly reliable andversatile instrument with a mass sensitivity 106 times higher than that of the Pioneer 10 and 11 dustdetectors which measured dust in the saturnian system. The Cosmic Dust Analyzer has significantinheritance from former space instrumentation developed for the VEGA, Giotto, Galileo, and Ulyssesmissions. It will reliably measure impacts from as low as 1 impact per month up to 104 impactsper second. The instrument weighs 17 kg and consumes 12 W, the integrated time-of-flight massspectrometer has a mass resolution of up to 50. The nominal data transmission rate is 524 bits/s andvaries between 50 and 4192 bps.
Keywords: CDA, Cassini, dust sensor, E-ring, interplanetary dust
1. Introduction
The Cassini-Huygens mission provides the opportunity for a thorough investiga-tion of the interplanetary dust complex and the saturnian dust environment. Thescientific objectives were stated in our proposal dated 1989: “The overall objec-tive of the proposed investigation is the exploration of the physical, chemical anddynamical properties of small dust particles in interplanetary space and in the satur-nian environment. The parameters to be studied include mass, composition, electriccharge, speed and flight direction of individual particles. The impact rate, mass dis-tribution, average composition, angular distribution, and charge will be determinedwith respect to heliocentric and saturnian distances, to the distance from rings andsatellites and to magnetospheric coordinates.”
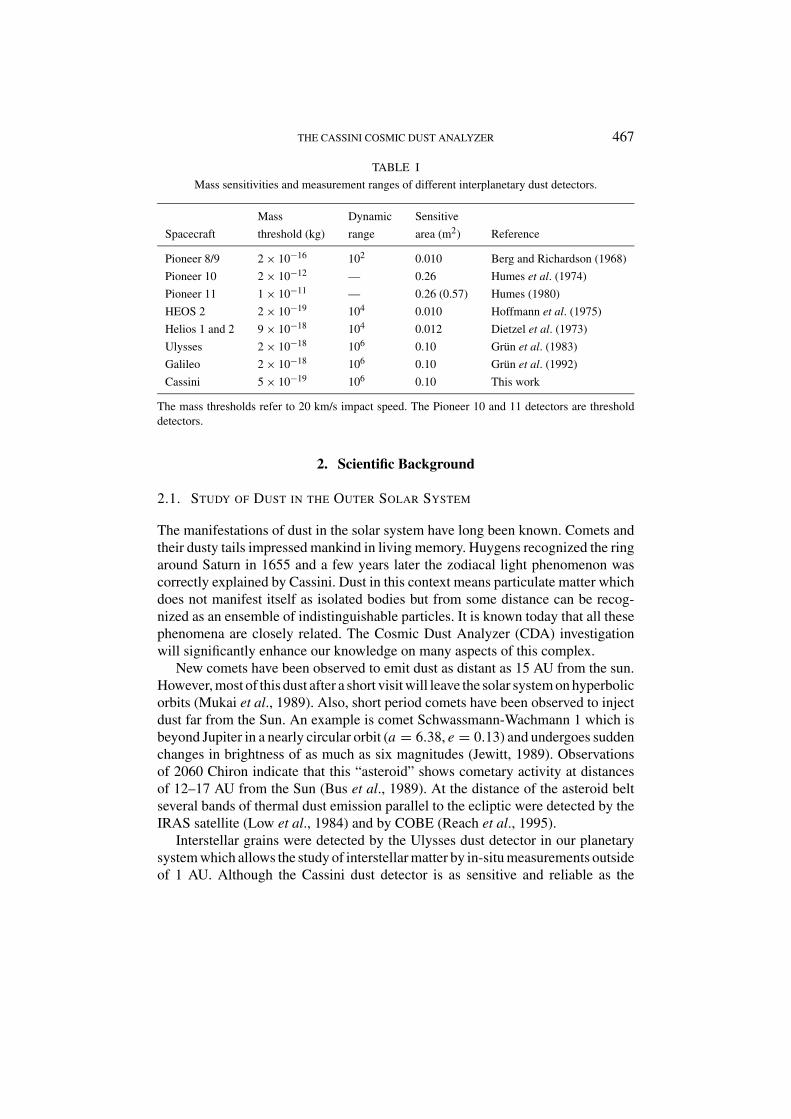
Cassini-Huygens is the first spacecraft which will orbit Saturn. The current ex-perimental results are based on former Voyager and Pioneer flyby measurementsand give only snapshots of the complex dust environment of Saturn. Current simula-tions of dusty rings in the saturnian system are still based on the result of the formerVoyager missions. Now, the dust experiment on Cassini-Huygens promises muchbetter results in quantity and quality. The long measurement time of over 3 yearsaround Saturn will allow extensive studies of the ring details. Especially the resultsof the Galileo dust detector in the jovian system lead to ideas and predictions ofdusty phenomena such as dust atmospheres around small moons (e.g. Kruger et al.,2000; Thiessenhusen et al., 2000), dust streams (Horanyi, 2000) and halo orbits(Howard and Horanyi, 2001) in the saturnian system. Table I shows a summary ofthe former dust detectors on interplanetary spacecrafts and Table II summarizes thescientific goals.
THE CASSINI COSMIC DUST ANALYZER 467
TABLE IMass sensitivities and measurement ranges of different interplanetary dust detectors.
Mass Dynamic Sensitive
Spacecraft threshold (kg) range area (m2) Reference
Pioneer 8/9 2 $ 10"16 102 0.010 Berg and Richardson (1968)Pioneer 10 2 $ 10"12 — 0.26 Humes et al. (1974)
Pioneer 11 1 $ 10"11 — 0.26 (0.57) Humes (1980)HEOS 2 2 $ 10"19 104 0.010 Hoffmann et al. (1975)
Helios 1 and 2 9 $ 10"18 104 0.012 Dietzel et al. (1973)Ulysses 2 $ 10"18 106 0.10 Grun et al. (1983)
Galileo 2 $ 10"18 106 0.10 Grun et al. (1992)Cassini 5 $ 10"19 106 0.10 This work
The mass thresholds refer to 20 km/s impact speed. The Pioneer 10 and 11 detectors are thresholddetectors.
2. Scientific Background
2.1. STUDY OF DUST IN THE OUTER SOLAR SYSTEM
The manifestations of dust in the solar system have long been known. Comets andtheir dusty tails impressed mankind in living memory. Huygens recognized the ringaround Saturn in 1655 and a few years later the zodiacal light phenomenon wascorrectly explained by Cassini. Dust in this context means particulate matter whichdoes not manifest itself as isolated bodies but from some distance can be recog-nized as an ensemble of indistinguishable particles. It is known today that all thesephenomena are closely related. The Cosmic Dust Analyzer (CDA) investigationwill significantly enhance our knowledge on many aspects of this complex.
New comets have been observed to emit dust as distant as 15 AU from the sun.However, most of this dust after a short visit will leave the solar system on hyperbolicorbits (Mukai et al., 1989). Also, short period comets have been observed to injectdust far from the Sun. An example is comet Schwassmann-Wachmann 1 which isbeyond Jupiter in a nearly circular orbit (a = 6.38, e = 0.13) and undergoes suddenchanges in brightness of as much as six magnitudes (Jewitt, 1989). Observationsof 2060 Chiron indicate that this “asteroid” shows cometary activity at distancesof 12–17 AU from the Sun (Bus et al., 1989). At the distance of the asteroid beltseveral bands of thermal dust emission parallel to the ecliptic were detected by theIRAS satellite (Low et al., 1984) and by COBE (Reach et al., 1995).
Interstellar grains were detected by the Ulysses dust detector in our planetarysystem which allows the study of interstellar matter by in-situ measurements outsideof 1 AU. Although the Cassini dust detector is as sensitive and reliable as the

468 R. SRAMA ET AL.
TABLE IIScientific objectives of the cosmic dust analyzer.
Cruise scienceExtend studies of interplanetary dust to the orbit of Saturn.Sample the chemical composition of dust in interplanetary space and across the asteroid belt.Determine the flux of interstellar particles during solar maximum conditions.Search for dust streams originating from Saturn.
Jupiter flybyInvestigate the dynamics of the Io dust streams as discovered by Ulysses and Galileo. Charac-
terize their direction, size-mass-distribution and correlation with the jovian and interplanetarymagnetic field.
Investigate the dust stream fluxes caused by the jovian system with respect to the Jupiter distance.Analyze dust stream particles at a different epoch from Galileo.Characterize the elemental composition of dust stream particles.
RingsMap size distribution of ring material, search for ring particles beyond the known E-ring.Analyze the chemical composition of ring particles.Study dynamical processes (erosional and electromagnetic) responsible for the E-ring structure,
study interactions between the E-ring and Saturn’s magnetosphere, search for electromagneticresonances.
Determine dust and meteoroid distribution both in the vicinity of the rings and in interplanetaryspace.
Icy satellitesDefine the role of meteoroid impacts as mechanism of surface modifications.Obtain information on the chemical composition of satellites from the analysis of gravitationally
bound ejecta particles in the vicinity of the satellites (within Hill spheres).Investigate interactions with the ring system and determine the importance of the various satel-
lites as a source for ring particles.
Magnetosphere of SaturnDetermine the role that dust plays as source and sink of charged particles in the magnetosphere.Search for electromagnetically dominated dust (small particles) and for dust streams.
Ulysses and Galileo detector, the Cassini trajectory does not allow the monitoringof interstellar dust for many years (the interstellar grains are shielded by the Sun,Landgraf et al., 1999). Just in 1999 and in the late tour (after 2007) the measurementof interstellar grains is possible in order to support the recent results (Landgrafet al., 2000; Grun and Landgraf, 2000). Recently, Altobelli et al. (2003) presentedthe discovery of ISD.
In-situ observations of dust out to nearly 20 AU were provided by the “beer can”detectors on board the Pioneer 10 and 11 spacecraft (Humes et al., 1974; Humes,1980; Dikarev and Grun, 2002). These highly reliable but relatively insensitiveimpact detectors recorded impacts of a total of 182 dust particles during their

THE CASSINI COSMIC DUST ANALYZER 469
voyages outside the Earth’s orbit. Fifteen and four of these impacts were recordedin the vicinity of Jupiter and Saturn, respectively. While the dust concentrationdetected between Jupiter and Saturn is mainly due to the cometary components, thedust outside Saturn’s orbit is dominated by grains originating from the Edgeworth-Kuiper belt (Landgraf et al., 2002). Surprisingly, the plasma wave experiment onboard the Voyager 2 spacecraft picked up charge signals from expanding plasmaclouds generated by dust impacts onto the spacecraft during its passage throughSaturn’s ring plane (Gurnett et al., 1983).
Until recently most of our knowledge about Saturn’s ring system was obtainedthrough Earth based astronomical observations. Images taken by Voyagers’ TVcameras showed that the rings are far more complex than one had ever imaginedbefore. However, a detailed look at this complexity by the Cassini-Huygens missionmay provide the key to a realistic view of planetary ring physics. In order to studySaturn’s rings one has to understand the environment in which they are embedded.An important aspect of this environment is the interplanetary and interstellar dust.Gurnett et al. (1997) used the Voyager PWS experiment to detect particles in theinterplanetary space even beyond Saturn.
2.2. INTERPLANETARY DUST
A great deal already is known about the interplanetary meteoritic complex fromlaboratory and ground based studies on stratospheric dust collections (e.g., Brown-lee, 1985; Jessberger et al., 2001), on photographic meteors, and on radar detectedmeteors (Baggeley, 1999), as well as results from zodiacal light measurements(Leinert and Grun, 1990). A great deal more has been learned from measurementstaken from in-situ experiments flown on spacecraft (McDonnell, 1978). From thesemeasurements it has been shown (Whipple, 1967; Grun et al., 1985) that the mete-oritic complex in the inner solar system is self destructive with a time scale of theorder of 105 years. Therefore most dust grains in this complex have been derived,relatively recently, from larger bodies. The Cosmic Dust Analyzer will have theexcellent capability to provide fundamentally new information as well as to solvea number of enigmas that have arisen as the result of previous space meteoroidinvestigations.
The dust experiments on the solar orbiting Pioneer 8 and 9 spacecraft measureda relatively large flux of micron to sub-micron sized dust grains that were deducedby Berg and Grun (1973) to be in hyperbolic orbits, that are leaving the solar sys-tem to become interstellar grains. Zook and Berg (1975) called these particles betameteoroids and deduced that they were probably primarily produced as debris re-sulting from mutual collisions between larger meteoroids that were sunward fromthe Pioneer 8 and 9 sensors. Whipple (1975) found that most beta meteoroids, be-cause of their directional characteristics, must have derived from outside of 0.5 AU.Further analyses (Zook, 1975) showed that the flux of beta meteoroids appeared tobe increasing with increasing heliocentric distance near, and just outside of, 1 AU.

470 R. SRAMA ET AL.
Almost simultaneously, however, McDonnell et al. (1975) were able to explainthe same data by assuming that the production rate of beta meteoroids varied in-stead with heliocentric longitude. But uncertainty remains. First, zodiacal light datashow that the heliocentric radial variation of meteoritic particles (or, more precisely,their cross-sectional area per unit volume) varies as r"! (r = heliocentric distance)where ! = "1.3 inside of 1 AU (Leinert et al., 1981) and ! = "1.5, or even morenegative, outside of 1 AU (Hanner et al., 1976). Why should the radial distributionof zodiacal particles change character right at, or near, 1 AU? Second, to add tothe mystery, Jackson and Zook (1989) found, through numerical modelling, thatmany dust grains ejected from asteroids in the main belt would be expected to betrapped into heliocentric orbital period resonances with the Earth, and would beconcentrated around and external to 1 AU. The Cosmic Dust Analyzer, with itslarge area (10 times that of the Pioneer 8 and 9 sensors), its high sensitivity, andwith the ability to vary its pointing direction, is well suited to solve the mystery.
Meteoroid penetrations through the 25 µm thick stainless steel meteoroid pene-tration sensor on the Pioneer 10 spacecraft gave a spatial density of meteoroids thatdecreased from 1 to about 1.8 AU from the Sun, and then remained constant, oreven increased with increasing heliocentric distance, out to nearly 20 AU (Humeset al., 1974; Humes, 1980). This was a very enigmatic result for two reasons: first,the zodiacal light sensor on the same spacecraft gave a spatial density of mete-oroids that decreased from 1 to 3.3 AU, except for an approximate 30% additionalasteroid belt contribution between 2.3 and 3.3 AU, and with a zero spatial densityafter 3.3 AU. More insight into this puzzle was obtained when sensors on the IRASsatellite detected bands of thermal infra-red emission parallel to the ecliptic (Lowet al., 1984). Sykes and Greenberg (1986) interpreted these asteroidal bands as dueto collisions within the Eos, Koronis, and Themis families in the main asteroid belt.This leads one to ask whether main belt asteroid collisions could be giving riseto mostly coarse grained material that is providing most of the scattering cross-section observed by zodiacal light sensors, while comets are contributing most ofthe small particles detected by the penetration sensors. The CDA instrument is ableto sense both large and small grains, as well as to observe any enhanced productionof beta meteoroids in the asteroid belt. Its directionality measurements will permitdiscrimination between cometary and asteroidal sources.
The second reason that the Pioneer 10 penetration data present an enigma, is dueto the lack of spatial density fall-off with increasing heliocentric distance beyond2 AU. Poynting-Robertson drag (e.g., see Burns et al., 1979) would be expectedto set up a meteoroid spatial density population that increases with decreasingheliocentric distance inside the source region of meteoroids, with a zero spatialdensity outside that region. This marked contradiction of theoretical expectationscompared to the actual penetration data led Zook (1980) to suggest that meteoroidsmade of water ice were penetrating the Pioneer 10 sensor at far distances from theSun, but were evaporating at close distances from the sun, with few, or none, inside2 AU. Humes (1980) found that the meteoroid penetration data obtained between

THE CASSINI COSMIC DUST ANALYZER 471
3.5 and 5 AU from the 50 µm thick penetration sensors on the Pioneer 11 satellitecould not be explained as due to penetrations by meteoroids in largely progradeheliocentric orbits. The model that gave him the best fit to that data was a modelthat assumed that meteoroids were in highly eccentric orbits and that they wereapproximately randomly inclined to the ecliptic plane. Both asteroids and shortperiod comets are nearly all in prograde orbits about the Sun. So the puzzle is,what could be the source of meteoroids that are in such highly inclined and highlyeccentric orbits? Are they related to long period comets? The CDA sensor canprovide more information about the true orbital and compositional characteristicsof this family of particles, and lead us to their source.
2.3. THE JOVIAN SYSTEM
In 1973 when the Pioneer 10 spacecraft flew by Jupiter micron sized dust particleswere detected within the jovian system for the first time (Humes et al., 1974).Almost 20 years later the jovian system was recognized as a source of intermittentstreams of sub-micron sized dust particles when the Ulysses spacecraft flew by theplanet (Grun et al., 1993). Similar streams were later detected within 2 AU fromJupiter during Galileo’s approach to the planet (Grun et al., 1996).
It was immediately recognized (Horanyi et al., 1993; Hamilton and Burns, 1993)that Jupiter’s magnetosphere would eject sub-micron sized dust particles if theyexisted in the magnetosphere. At two places small dust in abundance had beenobserved by Voyager’s cameras: (1) the jovian ring at 1.8RJ (Jupiter radius, RJ =71,492 km) and its weak extension out to 3RJ (Showalter et al., 1995), and (2)Io’s volcanic plumes, that reach heights of about 300 km above Io’s surface. Bothphenomena have been suggested as the source of the dust streams.
Electromagnetic interaction of the particles making up the dust streams wasevident both in the Ulysses and Galileo data when both spacecraft were outside thejovian magnetosphere: the arrival direction showed significant correlations with theambient interplanetary magnetic field (Grun et al., 1993, 1996). Zook et al. (1996)demonstrated that only particles in the 10 nm size range can couple strongly enoughto the interplanetary magnetic field to show the effects observed by Ulysses. Thecorresponding impact speeds were deduced to be in excess of 200 km/s.
Within the jovian magnetosphere Galileo has detected streams of submicrometersized dust particles which must originate in the inner jovian system within several RJ
from Jupiter (Grun et al., 1996, 1997). These streams show highly variable impactrates correlated with Jupiter’s rotation period, implying that the particles stronglyinteract with the planet’s magnetic field (Graps et al., 2000; Horanyi, 2000). Inaddition to these sub-micron sized dust stream particles Galileo has identified twomore types of dust: a concentration of small dust impacts at the times of Ganymedeand Europa closest approach, and big micron sized dust particles concentratedin the inner jovian system between the Galilean satellites (Kruger et al., 2000;Thiessenhusen et al., 2000; Krivov et al., 2002).

472 R. SRAMA ET AL.
Cassinis closest approach to Jupiter was on December 30, 2000 at a distance of137RJ, whereas at this time Galileo was 10 times closer to the planet. This oppor-tunity allowed a combined measurement of the jovian dust streams simultaneouslywith two spacecraft. Dust trajectories exist which intersect both the Galileo andthe Cassini-Huygens orbit. The idea of this unique measurement was to identifypeaks in the dust fluxes of both instruments which provides a direct measure todetermine the time-of-flight of the grains between about 14 and 137RJ. The currentanalysis shows that the dust magnetosphere interaction is more complex than origi-nally thought and further modelling is necessary. The record of impact mass spectraof dust stream particles were achieved by CDA and the data are still in analysis.However, such tiny projectiles show only weak signatures in the mass spectra suchthat the spectra are dominated by peaks of the target material.
2.4. CHEMICAL COMPOSITION OF COSMIC DUST AND ITS PARENTS
Previous in-situ sampling and remote chemical analyses of solar system objectshas been, to date, limited to the moon, Venus, Mars, comet Halley and, to a verylimited degree, Phobos. Sampling and analysis of ejecta during close fly-bys ofsaturnian satellites and rings will make a whole new class of objects available toin-situ chemical analysis. Comparison of these icy objects with other solar systembodies will shed light on their mutual interrelation.
It is common to compare the isotopic, chemical and molecular compositionof solar system bodies with the composition of meteorites, since these are theonly extraterrestrial objects which can be studied in great detail in the laboratory(Anders and Grevesse, 1989). Such studies have resulted in a wealth of information.The genetic links between different classes of meteorites and their constituents setstringent boundary conditions on early solar system materials and processes.
The other extraterrestrial objects, which can be studied in the laboratory – albeitless completely than meteorites – are interplanetary dust particles (IDPs). SomeIDPs closely resemble chondritic meteorites in their chemical composition. Othersdiffer from any known meteorite class (Brownlee, 1985; Bradley, 1988; Jessbergeret al., 1992). Since their sources and the interrelations of individual IDPs are un-known, the interpretation of this observation is difficult (Sutton and Flynn, 1988;Arndt et al., 1996).
A third and even less direct, but nevertheless extremely exciting source of infor-mation derives from in-situ measurements near comets such as the Halley experi-ments (Kissel et al., 1986; Jessberger, 1999).
Overall, the presence of three major classes of material is to be expected(Jessberger et al., 1988): Ice, CHON, and silicates. The higher the variability is fromgrain to grain of the relative proportions of ice, CHON, and silicate components, themore probable will be the identification of the constituents. Or, likewise, the smallerthe grains are, the higher are the chances to encounter mono-component grainswhich may ease identification. Therefore chemical composition will be optimized

THE CASSINI COSMIC DUST ANALYZER 473
for the smallest particles. The chemical composition of dust grains does not onlycharacterize its own identity but also carries memories of its parents. Everywherein the solar system dust is a short lived phenomenon which requires permanent re-plenishment. Dynamic effects dissipate dust away from its sources until it is sweptup by larger bodies or lost to interstellar space. Cassini on its path to Saturn willcross several source regions of interplanetary dust.
Dust grains that are ascertained to be asteroidal in origin will be composition-ally compared with ground-based spectral studies of asteroids. Both asteroid albedoand compositional type are found to vary with distance and this effect will simplifycomparison of Cassini results with ground-based data. Compositions of clearlyidentifiable cometary grains may be obtained, especially beyond the asteroid belt.In some cases individual grains will be related to unique comets; grain compo-sitions will then be compared with ground-based studies of those comets. Thefuture NASA and ESA missions to comets which may even bring back samples andthe dust-dedicated STARDUST mission will significantly contribute to solve thisquestion.
2.5. SATURN’S RINGS
The diversity of Saturn’s ring structure, from the diffuse and voluminous E-ring tothe extremely fine structure of the main rings, the complex variability in many rings,examplified by the F-ring with its kinks, braids and multiple strands, is one of themost challenging problems of planetary physics today. We expect Cassini-Huygensto lead to answers to most of the fundamental questions related to the formation,structure, dynamics, evolution and lifetime of rings. The observations provided bythe Cosmic Dust Analyzer, will surely be one of the cornerstones on which to builda complete understanding of ring systems. Measurements by the CDA will providethe spatial distribution of dust and dust properties such as mass, composition,charge and trajectory in the parts of the ring system through which the CassiniOrbiter will pass. The Cassini-Huygens investigation of dust, charged particles andfields, together with photometer, spectrometer and camera data, will surely providea wealth of information on dusty plasma properties which will be invaluable in oureffort to understand such diverse subjects as planetary ring systems, cosmogony,the physics of colloidal plasmas and dynamics of single dust particles.
In-situ measurements of dust in the saturnian system will be done repeatedlythroughout the whole E-ring and beyond. During Saturn Orbit Insertion (SOI) therewill be a one-time passage, when the spacecraft will move above the main rings at aheight of 10,000 to 30,000 km and reach a periapsis distance of 1.3Rs from Saturn.Dust which would have been detected above the rings during SOI would havegiven testimony of impacts onto the main rings. Correlation with simultaneousspoke observations (Grun et al., 1983) would allow us to test the hypothesis thatspokes are triggered by impacts of large meteoroids onto the B-ring (Goertz andMorfill, 1983). The meteoroid flux is influential for planetary ring structure and

474 R. SRAMA ET AL.
evolution both because of its erosional effect on ring material and since it adds asubstantial amount of mass to the rings. It is possible that the rings are impactedby their own mass of meteoritic material over the age of the solar system. It is alsolikely that this bombardment and associated ballistic and electromagnetic transportof the impact ejecta can substantially redistribute angular momentum within rings(Goertz and Morfill, 1988) and affects the compositon (Cuzzi and Estrada, 1998).However, the spacecraft pointing and operational constraints did not allow CDAperform measurements driving SOI.
The most complete measurements of dust will be in the E-ring region and furtherout. Little or nothing is known about the dust outside the E-ring and Cassini willreveal if additional faint rings are present there. The mapping of the incident dustflux and size distribution will be an important task here. Questions which will beanswered by the CDA and Cassini are how far inside Enceladus the ring materialextends and also a determination of its outer boundary position and sharpness.
It is most often assumed that Enceladus is the major source of E-ring materialsince the ring brightness has a profound maximum around, or near to, its orbit(Haff et al., 1983). The true role of this and other moons as sources or sinks for ringmaterial will be deduced from a mapping of dust chemical composition, size andmass distributions throughout the ring. Passages closer than 1000 km to Enceladus(Spahn et al., 1999) and Dione, with the possibility that the CDA will detect newlyinjected dust, and their mass and velocity distribution, should lead to a much betterunderstanding of dust injection processes (Krivov et al., 2001).
An answer to whether the dust in the E-ring is a source for neutral gas andplasma (Morfill et al., 1990) or whether dust condenses out of neutral gas injectedby the moons (Johnson et al., 1989) will emerge from a comparison of the radialdependence of dust size and composition with neutral gas and plasma conditions.
The evolution of the E-ring is thought to consist mainly of an outward drift of dustwhich is being sputtered. The proposed drift mechanisms are gyrophase drift (e.g.,Burns and Schaffer, 1989) and plasma drag (Morfill et al., 1990). The magnitudeand relative importance of these two effects is poorly known. However, plasmadrag tends to circularize particle orbits (Dikarev, 1999), whereas the gyrophasedrift often leads to elliptic orbits with high eccentricity. Mapping of individualdust particle trajectories as a function of position, dust size and charge, comparedwith plasma density, composition and energy distribution will tell us what role thedifferent transport effects play.
The large thickness of the E-ring, possibly in excess of 10,000 km (Hamilton,1994) is also a major puzzle. The expected evolution of a ring dominated by grav-itational effects where collisions occur is a collapse towards the ring plane. Is thelarge thickness of the E-ring possible because its dust particles have short life-times and are constantly replenished? Can the great thickness be related to thedust injection process, the initial dust orbit inclination being conserved as the dustparticles drift radialy outwards, or are there other processes acting to increase thering thickness beyond this injection spread? Other questions, regarding physical

THE CASSINI COSMIC DUST ANALYZER 475
processes will be answered by the Cassini experiment: How important is the elec-trostatic support of the E-ring and other rings (Havnes and Morfill, 1984). Thiseffect is crucially dependent on the dust mass and charge together with the plasmacondition. The CDA and plasma experiments should give the parameters necessaryto determine the role of this mechanism. Can electromagnetic resonance effectson single dust particles (Schaffer and Burns, 1987) also be important for Saturn’sE-ring? A possibility is that oscillations in an electrostatically supported dust ringcan be in resonance with corotating magnetospheric sector features (Melandso andHavnes, 1991) and that this can lead to increases in the ring thickness. Intriguingmajor resonances are within the E-ring and at the exact location of the G-ring. Thisopens up the possibility for vertical oscillations in the E and G-ring with periodsof the order of a day.
We expect that important checks on the dust optical properties will result fromthe combined results of Cassini photometers, spectrometers, cameras and the dustanalyzer. Remote sensing by measurements of light scattering at dust is an impor-tant tool, however, it suffers from inherent uncertainties related to size, structure(refractive index) and shape of dust. A comparison of scattering properties within-situ measurements by the CDA will likely lead to more confidence in the resultsfrom other parts of the ring system which will not be made directly accessible tothe Cassini orbiter.
2.6. CHARGES ON INTERPLANETARY AND SATURNIAN DUST PARTICLES
There exist a variety of mechanisms by which cosmic dust particles can be electri-cally charged: the capture of ambient electrons and ions, secondary electron emis-sion by energetic electron and ion impacts, photoemission due to short-wavelengthelectromagnetic radiation, field emission of electrons, triboelectric effects, and fieldevaporation of ions. Interplanetary and interstellar dust particles acquire a positivecharge in the solar wind and can be strongly influenced by the Lorentz force asthey pass through planetary magnetospheres. There, the charge on the particleschanges rapidly when they pass through different plasma environments (Colwellet al., 1998).
In the case of interplanetary dust particles outside the earth’s orbit the onlyrelevant charging processes are interactions with solar wind electrons and ions andphotoemission by solar UV radiation. Depending upon conditions in the solar wind(low and high speed) the proton number density varies from 12 to 4 cm"3 at 1 AU,the bulk speed of the wind varies from 330 to 700 km/s, and the mean thermalenergy increases from 3 to 20 eV for protons and decreases from 11 to 9 eV forelectrons (Morfill et al., 1986). The flux of photoelectrons from a metal surfaceat 1 AU was estimated by Wyatt (1969) to be equal to 2.5 $ 1010 cm"2 s"1. Thephotoelectron flux from silicate and graphite surfaces can be up to one order ofmagnitude lower; the same is expected for the flux from icy surfaces. From thesenumbers it follows that charging of interplanetary dust particles is dominated by
476 R. SRAMA ET AL.
photoemission, which leads generally to positively charged particles with surfacepotentials of several volts. The value of the potential depends on the photoemissionyield of the particle material, e.g. silicate particles attain potentials of 2.5–5 Vwhich are practically constant in the size interval 0.1–10 µm (Lamy et al., 1985).Potentials of particles from conducting materials will be a few volts higher. In caseof very small particles with dimensions small compared to the wavelength of light,the photoemission yield can be enhanced by a factor of 2–3 which results in highersurface potentials.
The potential of dust particles is practically independent of distance from theSun because both solar UV flux and fluxes of solar wind particles decrease withthe second power of distance from the sun (Tiersch and Notni, 1989). Non-zeroelectric charge of dust particles influences their dynamics in the interplanetarymedium, see e.g. review of Morfill et al. (1986) and references therein. In caseof saturnian particles the equilibrium charge will be determined again by theirinteraction with the ambient plasma and UV radiation. Parameters of plasma inthe Saturnian environment cover a very broad range: densities from 10"2 cm"3 toseveral 100 cm"3 and energies of electrons from %1 eV to more than 1 keV, seee.g. Grun et al. (1984) and Horanyi. In regions where the plasma flux is low (e.g.above Saturn’s A- and B-rings) the situation will be similar to interplanetary spaceand the potential of particles will be positive and equal to several volts.
In dense plasma regions where the electron flux is dominant, the sign and valueof the potential will be determined by the energy of the electrons. At electronenergies above about 10 eV secondary electron emission becomes important, whichresults in a reduction of the negative potential. At energies above a few hundred eVthe secondary electron emission yield becomes >1 which causes a change of thepotential from negative to positive. Generally, the yield reaches a maximum value"m at energies Em between 300 and 2000 eV. At higher energies the secondary yieldbecomes again <1. Furthermore, the yield is material dependent. The maximumyield for metals and semiconductors is of the order of unity and for insulators itis equal to 2–30. According to measurements of Hashimov and Tarakanov (1982)with water ice at temperatures of 90–95 K, the yield attains a maximum value ofabout 2 at an energy of the primary electrons of 900 eV. The yield is <1 for energiesbelow 60 eV.
As a consequence of nonlinear charging equations two identical dust particlesin the same environment but with different histories can have charges of oppositesign. In addition, small changes in the environmental conditions can cause largeand rapid changes of the charge state of dust particles.
The process of secondary electron emission is very sensitive to the particle sizeand the physical properties of the dust particles. At electron energies >1 keV therange of electrons in a “compact” dust particle is >0.1 µm and, therefore, elec-trons can penetrate through small particles and moreover cause secondary electronemission from the exit side. One must also take into account the fact that the yieldincreases with increasing angle of incidence of primary electrons by up to an order

THE CASSINI COSMIC DUST ANALYZER 477
of magnitude compared to plane surfaces (Draine and Salpeter, 1979). On the otherhand, if the particle is in form of an aggregate with a rough surface, the yield willbe lower.
If a small particle is hit by electrons with high energies, the electrons are pene-trating through the particle, and the negative potential is low or may become evenpositive due to secondary electron emission from the exit side.
The total electric charge of dust grains is limited by either field evaporation, orfield emission. These processes become dominant at field strengths >3!1010 V/m(positive charge) and >109 V/m (negative charge), respectively. Electrostatic repul-sive forces can destroy particles (electrostatic fragmentation) at much lower fieldstrength if they become higher than the maximum tensile strength of the material.The latter process is particularly important in case of fluffy particles which mighthave tensile strengths of about 103 Pa. For such a fluffy particle with a radius of1 µm electrostatic fragmentation can occur already at surface potentials of as lowas 10 V.
Electric charges on Saturnian dust particles strongly influence their dynamics,see e.g. reviews of Grun et al. (1984) and Mendis et al. (1984). If distances amongdust particles are smaller than the Debye length in the ambient plasma, their mutualinteractions become important which results in lowering the charges of individualparticles, see e.g. Havnes (1987) and references therein.
Morfill et al. (1990) estimated the surface potential of dust grains for plasmaconditions in the Saturnian magnetosphere. The results predict surface potentialsin a range of "1200 to +1.5 V for Saturn distances from 4 to 9Rs (1 keV electronsand !m from 0 to 1).
2.7. INTERPLANETARY CUMULATIVE DUST FLUXES
2.7.1. The Staubach ModelInterplanetary dust fluxes were estimated (Table 3) on the basis of the Grun et al.(1985) fluxes at masses m = 10"12, 10"9, and 10"6 g. These fluxes were doubledin an effort to match what was observed with Pioneer 10 (Humes, 1980) due to thespacecraft motion. The 1/R fall-off with R (for R > 3 AU) for m = 10"15 g, andthe 1/R falls off with R(R > 1 AU) for m = 10"12 g, are pure assumptions withlittle or no data to support them. The m = 10"9 g flux follows that of the Pioneer10 flux (i.e. it is constant beyond 2 AU). The 1/R2 flux fall off for m = 10"6 gwas assumed to try to approximately match zodiacal light data. At Saturn a twofoldincrease of the interplanetary meteoroid flux was assumed due to gravitationalenhancement.
The following fluxes and their variation with radial distance went into the cre-ation of Table 3:
1. At m = 10"15 g, flux = 1.1 ! 10"3 m"2 s"1 at 1 AU and is constant to 3AU, then falls off as 3/R for R > 3 AU.

478 R. SRAMA ET AL.
TABLE IIIInterplanetary dust flux and fluence.
dr dt Fluence, Fluence, Fluence, Fluence,
(AU) (d) Flux m = 10"15 g Flux m = 10"12 g Flux m = 10"9 g Flux m = 10"6 g
0.9–2 611 95 58,000 4.0 2460 0.40 240 0.006 42–3 423 95 40,000 2.4 1020 0.26 109 0.001 13–4 146 81 12,000 1.7 250 0.26 38 0.0007 04–5 224 63 14,000 1.3 300 0.26 58 —5–6 208 52 11,000 1.1 230 0.26 54 —6–7 229 44 10,000 0.93 210 0.26 59 —7–8 261 38 9900 0.80 210 0.26 68 —8–9.1 327 34 11,000 0.70 230 0.26 85 —9.1 1490 68 100,000 1.4 2100 0.52 770 —
Total 2429 265,900 7010 1481 5
The columns are heliocentric distance intervals in AU, time in days spent in the corresponding distanceinterval, fluxes onto a flat plate sensor which is mounted to a spinning platform in number/(m2 day)and fluences in number/m2 per distance interval.
2. At m = 10"12 g, flux = 7 $ 10"5 m"2 s"1 at 1 AU and falls off as 1/R forR > 1 AU.
3. At m = 10"9 g, flux = 6 $ 10"6 m"2 s"1 at 1 AU and falls to 3 $ 10"6 m"2
s"1 at 2 AU and is then constant for R > 2 AU.4. At m = 10"6 g, flux = 1 $ 10"7 m"2 s"1 at 1 AU and falls off as 1/R2 for
R > 1 AU.
The CDA instrument consists of two subsystems, the dust analyzer (DA) and thehigh rate detector (HRD). Therefore the numbers above have to be multiplied bythe sensitive area F of the different sensors (FDA = 0.1 m2, FHRD = 0.006 m2) andby a factor #/$ which takes into account the effective solid angle of the respectivesensor (#DA = 0.6 sr, #HRD = 3.0 sr). About 100 particles of 10"12 g or larger andseveral thousand smaller particles are expected to be recorded by the dust analyzerand the high rate detector.
2.8. SATURNIAN DUST FLUXES
The Saturnian dust fluxes (Table 4) have been calculated from the physical modelsprovided. The maximum cumulative (mass greater or equal to m) flux in the ringplane during one ring plane crossing have been calculated.
The three models have been constructed in order to get a conservative esti-mate of the spacecraft hazard due to Saturnian dust particles. This is certainlytrue for model 3 for which it is assumed that all the mass is in particles of a

THE CASSINI COSMIC DUST ANALYZER 479
TABLE IVSaturnian dust fluxes: maximum flux in the ring plane (in number/m2 s)during one ring plane crossing for m = 10"12 g (model A), m = 10"9 g(model B) and m = 10"6 g (model C).
Model 1, Model 2, Model 3,
m = 10"12 g (A), m = 10"9 g (B), m = 10"6 g (C),
R flux (1/m2s) flux (1/m2s) flux (1/m2s)
2.9 1.8 $ 103 2.7 0.45
4.0 8.3 $ 102 1.2 0.216.0 22 3.2 $ 10"2 5.4 $ 10"4
9.0 4.9 $ 10"4 7.3 $ 10"7 1.2 $ 10"7
single mass (in our case 10"6 g). The values given for 10"6 g are upper limits.Model B relies mostly on energetic particle data from Pioneer 11 and both Voyagerspacecraft. Therefore this model describes best the intermediate sized particles(approximately 10"9 g) for which energetic particle effects are effective. ModelA is only based on ground based and Voyager optical data of the E-ring. Thismodel describes best the micron sized particles which are most effective lightscatterers. No evidence has been acquired so far for sub-micron sized particles.However, there are good reasons to believe that sub-micron sized particles exist inabundance.
Contrary to the interplanetary dust flux the Saturnian dust flux is expected to behighly anisotropic. Therefore, depending on whether this flux is within the field-of-view of the sensor, dust particles are recorded or not. The highest fluxes areexpected during ring plane crossings in the inner Saturnian system. The value of1.8 $ 103 m"2 s"1 given for m = 10"12 g is considered a low value for the flux ofthe smallest detectable particles and therefore the instrument will be able to recordfluxes temporarily up to two orders of magnitude higher.
3. Instrument Description
3.1. EXPERIMENTAL APPROACH
The stated objectives of this investigation require a versatile instrument consist-ing of several components which are optimized individually for different tasks.Therefore the detection of dust particle impacts is accomplished by two differentmethods: (1) a high rate detector subsystem, using two separate polyvinylidene flu-oride (PVDF) sensors, for the determination of high impact rates during Saturnianring plane crossings and (2) a Dust Analyzer (DA) using impact ionization. TheDA measures the electric charge carried by dust particles, the impact direction, theimpact speed, mass and chemical composition, whereas the high rate detector is

480 R. SRAMA ET AL.
TABLE VThe Cassini-Huygens Cosmic Dust Analyzer team in 2001.
Principal investigator Ralf SramaInvestigation senior scientist Eberhard GrunScience planning lead/OTL Sascha KempfDeputy operations technical lead Georg Moragas-KlostermeyerCo-investigators Thomas J. Ahrens
Siegfried AuerHugo FechtigManuel GrandeOve HavnesMihaly HoranyiEduard IgenbergsTorrence V. JohnsonElmar K. JessbergerSascha KempfHarald KrugerPhilippe LamyFranz LuraJ. Anthony M. McDonnellDietrich MohlmannErnst PernickaGerhard H. SchwehmFrank SpahnJiri SvestkaAnthony J. TuzzolinoRichard WaschHerbert A. Zook
Electronics chief engineer Dietmar LinkertSoftware engineer Stefan HelfertLaboratory technician Gerhard Schafer
capable of determining particle mass for particles with a known speed. The DAitself consists of three subsystems, the charge detector (entrance grids, EG), theimpact ionization detector (IID) and the chemical analyzer (CA) (Bradley et al.,1996; Srama, 1997). The Chemical Analyzer was developed by the University ofKent, Canterbury, U.K., under the leadership of J.A.M. McDonnell (now at OpenUniversity). Table 5 shows the Cosmic Dust Analyzer team in 2001 and Figure 1shows the flight model of the Cosmic Dust Analyzer. Figure 2 shows a cut throughthe instrument with the subsystems labeled.

THE CASSINI COSMIC DUST ANALYZER 481
Figure 1. The Cosmic Dust Analyzer.
3.2. ANGULAR SENSITIVITY, SENSOR POINTING AND FIELD-OF-VIEWS
The general purpose of this instrument is to cover the whole hemisphere with itsfield-of-view. On Galileo, this was achieved with the wide aperture of ±70& and amounting of the instrument by 55& with respect to the Galileo spin axis. Originallythe Cassini-Huygens design included a continuously rotating pointing platform forthe fields and particles instruments which was canceled during a descoping process

482 R. SRAMA ET AL.
Figure 2. Technical drawing of the Cosmic Dust Analyzer. CAT, Chemical Analyzer Target; EG,Entrance Grids; EMB, Electronics Main Box; HRD, High Rate Detector; IG, Ion Grids; IIT, ImpactIonization Target; MP, Multiplier.
in order to lower the spacecraft costs. Although the CDA instrument was mountednearly perpendicular to the Cassini spin axis, wide coverage cannot be obtained witha mainly three-axis stabilized spacecraft. Furthermore, the rotation rate of Cassiniis restricted to the maximum value of 0.26 &/s and, during high activity periods,other instruments determine the orientation of the spacecraft. All these constraintslead to a redesign of the instrument and a turntable was added at the interface tothe spacecraft.
The mounting vector of the turntable points 15& below the spacecraft x–y plane(Figure 3). Furthermore, this vector points 30& away from the +y-axis towards -x.The coordinates of the articulation axis with respect to the spacecraft x–y–z coordi-nate system are ("0.483; 0.837; 0.259). The Dust Analyzer detectors (IID, CAT andHRD) are mounted at 45& with respect to the articulation axis. The boresight vectorof the field-of-view has the coordinates ("0.250; 0.433; 0.866) in the launch posi-tion (0& position, downwards to +z). The turntable enables the instrument to rotate

THE CASSINI COSMIC DUST ANALYZER 483
Figure 3. Mounting geometry of the CDA onboard Cassini. The CDA articulation axis is mounted30& away from the +y-axis and points 15& downwards towards +z. CDA (DA and HRD) is mountedby 45& with respect to the articulation axis. The CDA boresight is shown for its 0 & position (lowerleft). CDA can articulate by 270 & (lower right).
by 270&. The cable wrap drum inside the turntable does not allow a full revolution.The “lower right” quarter of the full circle cannot be reached by the instrument.The spacecraft coordinate system is such that the x–y plane is perpendicular to thespacecraft spin axis z. The +z direction points to the main engine, whereas the Huy-gens probe points towards "x. Besides the high gain antenna (which points towards"z), Cassini-Huygens has two low gain antennas (LGA). LGA 1 points towards the"z direction whereas LGA 2 points towards the Huygens probe ("x-axis). Duringthe inner cruise, the three-axis stabilized spacecraft has an orientation such that thehigh gain antenna points towards the Sun and the selected low gain antenna pointstowards the earth as precisely as possible. Figure 4 shows the field-of-view of theCAT for a variety of articulation angles in the spacecraft coordinate system.
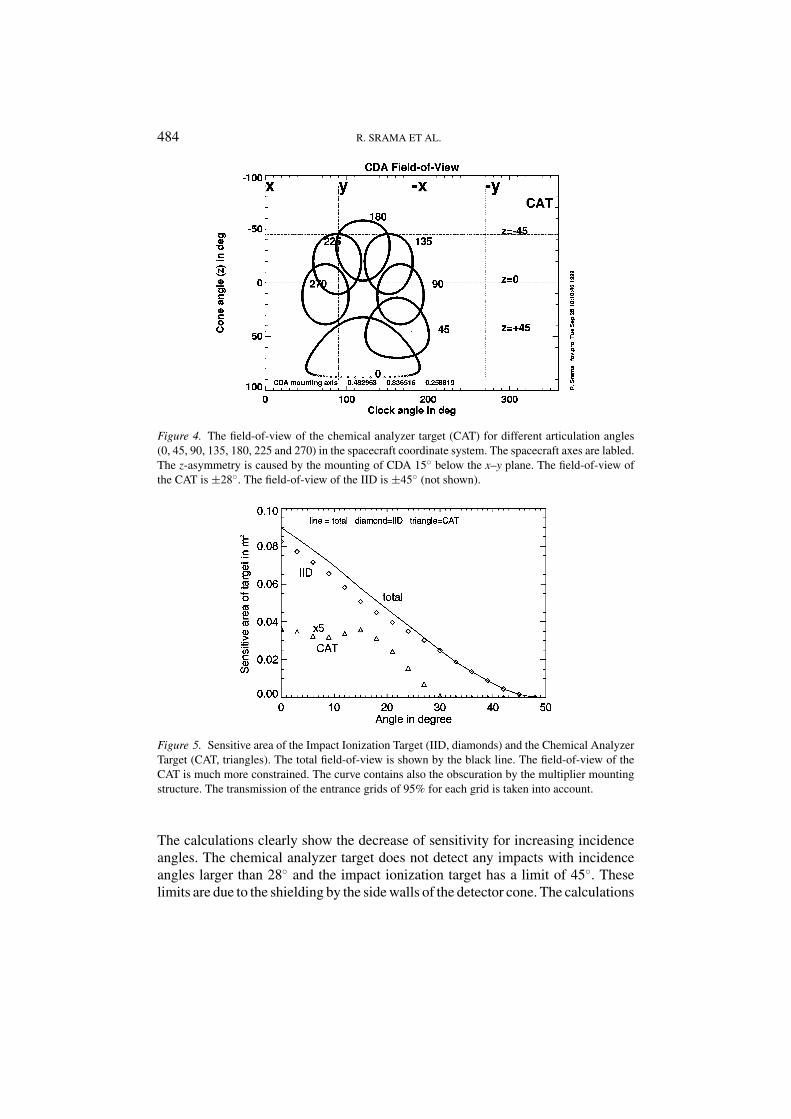
A computer simulation program was used to calculate the geometric detectionprobability of the sensors. Under the condition of an isotropic flux of particleswith an incidence angle % the sensitive area of the Impact Ionization Target andthe Chemical Analyzer Target were calculated. The result is shown in Figure 5.
484 R. SRAMA ET AL.
Figure 4. The field-of-view of the chemical analyzer target (CAT) for different articulation angles(0, 45, 90, 135, 180, 225 and 270) in the spacecraft coordinate system. The spacecraft axes are labled.The z-asymmetry is caused by the mounting of CDA 15& below the x–y plane. The field-of-view ofthe CAT is ±28&. The field-of-view of the IID is ±45& (not shown).
Figure 5. Sensitive area of the Impact Ionization Target (IID, diamonds) and the Chemical AnalyzerTarget (CAT, triangles). The total field-of-view is shown by the black line. The field-of-view of theCAT is much more constrained. The curve contains also the obscuration by the multiplier mountingstructure. The transmission of the entrance grids of 95% for each grid is taken into account.
The calculations clearly show the decrease of sensitivity for increasing incidenceangles. The chemical analyzer target does not detect any impacts with incidenceangles larger than 28& and the impact ionization target has a limit of 45&. Theselimits are due to the shielding by the side walls of the detector cone. The calculations

THE CASSINI COSMIC DUST ANALYZER 485
TABLE VIOverview of the apertures of the CDA subsystem in comparison with the Galileodust detector subsystem.
Subsystem Aperture in ±degree Solid angle in sr
Impact Ionization Detector 45 0.59Chemical Analyzer Target 28 0.47High Rate Detector 88 ca. 3Galileo dust detector subsystem 70 1.45
The aperture of the CDA cone is smaller than the aperture of the former Galileodetector because of a longer cylindrical housing.
have taken the obscuration of the multiplier into account. Therefore, the sensitivityof the Chemical Analyzer Target is not maximal for normal incidence (% = 0 &). TheIID curve is based on a cos4 function, whereas the CAT sensitivity can be describedby a cos3 function for angles larger than 15 &. Caused by the axial symmetry, thesolid angle interval is d# = 2$ sin % d% . The relative sensitivity I(% ) is thereforegiven by
I (q) dW = 2p sin q dq A(q)/A (q = 0)
An integration of this function leads to the effective solid angle interval coveredby the detector which is 0.473 sr for the chemical analyzer and 0.591 sr for theimpact ionization detector (Table VI).
3.3. THE DUST ANALYZER (DA)
3.3.1. General DescriptionFigure 2 shows a cut through the CDA. The instrument consists of the sensor housingwith its entrance grids, impact targets, the high rate detector, the electronics boxand the turntable. The interior of the sensor housing was purged with dry nitrogenuntil launch in order to avoid any contamination of the sensitive multiplier and therhodium target of the Chemical Analyzer. The cover avoids contaminations of thesensor targets until 3 weeks after launch. A redundant pyro device moves a leverwhich unlatches the cover, and preforced springs jettison the cover to a normaldirection. All major parts were made of milled aluminum while a honeycombstructure provided the required stiffness for the cover and the cylindrical sensorhousing. The pre-amplifier box is located directly above the main electronics andoccupies a separate housing to keep the input cables as short as possible and tominimize any interference with the main electronics.
The turntable of the instrument allows a rotation of 270 &. The turn limit isgiven by the capability of the integrated cable wrap drum and the mechanical endstops. A design with two layers of plastic balls (PEEK) and a bearing diameter of

486 R. SRAMA ET AL.
TABLE VIIMeasured temperatures of CDA during day 311in 2001 (HRD switched on).
Pyro subsystem "34 &CDust analyzer multiplier "34 &CElectronics main box "7.5 &CHigh rate detector "17 &CSpacecraft interface +7 &CChemical analyzer target "52 &CImpact ionization target "46 &C
The operating temperatures are "15 to +40 &C(CDA main electronics) and "25 to +40 &C(HRD), respectively. The targets, the multiplierand the pyro can operate at lower temperatures.
240 mm was selected and qualified. The torque necessary for the turn is providedby a Phytron ZSS32 stepper motor and a gear with a total gear ratio of approxi-mately 1000:1. Special electronics were developed by Phytron to achieve very lowpower consumption and a maximum torque. The motor has a compensating poleconfiguration and a Mu-metal shielding to keep the stray magnetic fields as low aspossible. The motor can be operated by four different motor currents between 150and 300 mA and consumes between 2 and 5 W. The turn speed of the platform canbe set and is normally in the range of 10 &/min.
The instrument thermal design incorporates a number of techniques for control-ling the temperatures. The acceptable operating temperature ranges of the subsys-tems are listed in Table VII. The instrument is thermally isolated from the S/C by itsmount and by multilayer thermal blankets covering the turntable, electronics boxes,the HRD and the cylindrical housing. The normal operating power of the instrumentproduces an acceptable overall temperature without supplementary heaters. Whenthe instrument is switched off, the temperature is maintained by the S/C-controlledreplacement heater attached on the top of the main electronics box. The instrumentmonitors five temperature locations internally when it is turned on, and the S/C pro-vides monitoring of seven locations at all times. A special instrument-controlledheater is provided for periodic decontamination of the Chemical Analyzer Targetthrough heating to about 90 &C (for at least 10 h). Because of the high depth todiameter ratio, the cylindrical housing aperture is a very effective radiator, andthe interior required a special prepared gold coating to ensure a stable and lowemissivity for this long duration mission.
3.3.2. Technical Description and Measurement PrincipleThe grid system (EG) at the front end allows measurement of the dust charge andvelocity (Auer et al., 2001). This configuration is based on a method first described

THE CASSINI COSMIC DUST ANALYZER 487
Figure 6. Hypervelocity impact signals of dust grains onto the big Impact Ionization Target (left) andonto the Chemical Analyzer Target (right). The chemical analyzer is a time-of-flight mass spectrometerand provides the elemental composition of the impacting dust grain.
in Auer (1975). The grids are made of stainless steel and each of them has atransmission of 95%. The innermost and outermost of the four grids are grounded,the other two grids are connected to a charge sensitive amplifier. A charged dustparticle entering the sensor will induce a charge which corresponds directly to thecharge of the particle. When the dust particle is far away from the sensor walls, allfield lines are ending on the grids and the error in charge measurement is small.The output voltage of the amplifier will rise until the particle passes the second grid(Figures 6 and 7). As long as the particle is located between the second and thirdgrid the output voltage remains more or less constant. As soon as the dust particlehas passed the third grid, the voltage begins to fall until the fourth grid is passed.The distance of the fourth grid from the first grid, divided by the duration of thecharge signal is equal to the particle’s velocity component normal to these grids.Due to the inclination of 9 ! for the inner two grids, the path length between the gridsdepends on the angle of incidence, and allows a determination of the directionalityof the incident particle in one plane. The choice of 9 ! is a compromise betweenangular resolution and tube length of the detector. The larger the angle the betterthe angular resolution, but the bigger and heavier the instrument. The detection ofparticle charges as low as 10"15 C has been achieved although the grid capacitanceis high (approximately 200 pF) (Kempf 2004). The speed obtained by the entrancegrid system (EG) is used to verify and calibrate the indirect determination of particlespeed based on the rise times of the impact ionization signals.

488 R. SRAMA ET AL.
Figure 7. Unprocessed raw data of an 25 km/s particle impact on the Chemical Analyzer Target. Theiron particle size was 150 nm. The peaks in the spectrum of the bottom diagram correspond to theions of H, C, O, Fe and Rh. The data were recorded with the CDA flight spare unit at the Heidelbergdust accelerator facility.

THE CASSINI COSMIC DUST ANALYZER 489
A particle can impact either on the big gold plated Impact Ionization Target or thesmall rhodium Chemical Analyzer Target (CAT). In both cases the impact physics isthe same. The impact produces particle and target fragments (ejecta), neutral atoms,ions and electrons (impact plasma). An electric field separates electrons (collectedby the targets) and ions (collected by the ion grid). Charge sensitive amplifierscollect the charges at the various targets and grids. Amplifiers are connected at theChemical Analyzer Target (QC), the Chemical Analyzer Grid (QA), the ImpactIonization Target (QT), the Ion Grid (QI), the Entrance Grids (QP), the multiplieranode (QMA) and the multiplier dynodes (DLA) (Figure 8). In order to increase thedynamic range, the amplifiers for QC, QT and QI are working with two measurementranges.
The signals at the output of the electron multiplier must cover an exceptionallylarge dynamic range for two reasons. A wide dynamic range is required for measure-ment of a large range of ion abundances for any one impact, but, more importantly,a wide dynamic range is needed to make compositional measurements over thedesired six orders of magnitude in range of particle masses impacting the system.Because of the random nature of the impact events and the short ion time-of-flight,it is clearly impossible to make real time gain changes for each event. Ordinary log-arithmic amplifiers are not fast enough and do not have sufficient dynamic rangefor the time-of-flight measurements. An innovative solution to this problem hasbeen created through the development of the dynode logarithmic amplifier. Thissystem sums the linear signals from six different dynodes of the Johnston MM-1 multiplier in such a way that for large impacts the amplifiers for highest gaindynodes produce fixed (saturated) outputs that sum with an unsaturated low gaindynode signal. Thus it is a fast, low-noise, piece-wise linear approximation to truelogarithmic performance. This special electronics was developed by the RutherfordAppleton Laboratory, U.K. (RAL). The main electronics was developed at MPIKwhereas the mechanical design was done by G. Pahl (Munich). The mechanicswas manufactured and the environmental tests for space qualification of CDA werecarried out by DLR Berlin. The chemical analyzer is under the responsibility ofOpen University, U.K. (J.A.M. McDonnell).
All the outputs of the amplifiers are continuously compared with a channel-specific reference value (threshold), and if it is exceeded an event trigger is released.What happens now is that the sampling frequencies for the QC, QT, QI channels andthe DLA are increased and the signals are digitized and stored in memory. The dataprocessing by the 6 MHz MA31750 microprocessor system includes the calculationof signal rise times, amplitudes and integrals. A wavelet algorithm allows signalsmoothing and a lossy compression. A lossless RICE compression algorithm canreduce the raw data by a factor of three. Approximately 1500 bytes are necessaryfor the lossless storage of one data frame. The data processing time limits the deadtime of the instrument to 1 s. The calculated signal parameters are used for onboarddata classification. Each event increases one of the 20 counter values. About halfof the instrument memory is needed for the execution of the onboard software. The

490 R. SRAMA ET AL.
Figu
re8.
Func
tiona
lblo
ckdi
agra
mof
the
cosm
icdu
stan
alyz
er.

THE CASSINI COSMIC DUST ANALYZER 491
remaining memory is used to store event data. The classification and priorizationof detected events is a very complex procedure and is still under development.The onboard program was written in ADA using a TARTAN development system(KCS GmbH and University of Mannheim). Onboard data processing algorithmswere developed by V. Tschernjawski (DLR Berlin, QP signal detection) and G.Schlotzhauer (DLR Berlin, wavelet compression).
3.3.3. Instrument DataAn electrically charged particle flying through the two inclined entrance grids atthe front of the DA will induce charge signals on the grids (Figure 6). This inducedcharge is directly proportional to the charge of the particle and allows thereforea direct determination of its electric charge. The duration of the charge signal isequal to the particle’s time-of-flight through EG and allows a determination of itsspeed. The inclined grid geometry leads to asymmetric signal shapes allowing themeasurement of the particle direction in one plane. The particle can impact eitheron the outer big gold plated impact ionization detector IID (QT signal) or on thesmall inner chemical analyzer target, CAT (signal QC), which has a diameter of 16cm. The gold target has a diameter of 41 cm.
The impact generates charged and uncharged fractures (ejecta), atoms, ions andelectrons. The electrons of this plasma are collected by the target, and the ions areaccelerated towards the inner grids (ion grids, signal QI) by an applied field of"350 V. Some of the ions fly through the grids producing a multiplier signal (MP).
The integrated chemical analyzer consists of the chemical analyzer target, thechemical analyzer grid (68% transmission) and the multiplier. The chemical ana-lyzer grid is located 3 mm in front of the target and electrically grounded whereasthe target is on a potential of +1000 V. The strong electric field between target andgrid separates the impact charges very quickly and accelerates the ions towards themultiplier. The curved shape of the target and grid provides a better focusing ofthe ions onto the multiplier. This time-of-flight mass spectrometer has a flight pathlength of 230 mm and gives information about the elemental composition of themicrometeoroids (Ratcliff et al., 1996). The chemical analyzer is a development ofthe University of Kent, Canterbury, U.K.
A complete overview of the signals measured and their measurement ranges aregiven in Table 8. The signals of the channels QP, QC, QT, QI and MP are digitizedwith 8-bit resolution and are stored in a raw data frame. Typical impact signals areshown in Figure 7. The sampling frequency is different for the various channels andthe sampling frequency alters even within one channel. The channels QC, QT and QIare digitized continuously with 0.375 MHz until an event is detected by exceedingthe specified thresholds. After this trigger the sampling frequencies are increased to6 MHz (QC and QI) and 3 MHz (QT), respectively (Figure 8). The last 16 samplespreceding the trigger are stored together with the following sampling points. Thispreserves the signal shape before the impact is detected by the electronics andallows a later reconstruction of the entire slope. Signals with slow rise times benefit

492 R. SRAMA ET AL.
TAB
LE
VII
ISi
gnal
sof
the
Dus
tAna
lyze
rmon
itore
dby
the
elec
tron
ics.
Dat
aSi
gnal
Mea
sure
men
tran
geaq
uisi
tion
ampl
itude
ofch
arge
and
Mea
sure
men
tcha
nnel
Mea
sure
dqu
antit
yfr
eque
ncy
(MH
z)re
solu
tion
(bit)
rise
time
Part
icle
para
met
er
QP
Ent
ranc
egr
ids
(EG
)In
duce
dch
arge
Posi
tive
Neg
ativ
e6
810
"15
to6
$10
"13
C10
"15
to6
$10
"13
CR
ise
time
=0.
25–8
0µ
s
Spee
d:2–
40km
/sTr
ajec
tory
inon
epl
ane
Ele
ctri
cch
arge
:2
$10
"15
to5
$10
"13
C
QT
(IID
)Im
pact
ioni
zatio
nde
tect
orE
lect
rons
(neg
ativ
ech
arge
)ge
nera
ted
upon
impa
ct3
82
$10
"14
to10
"8
CR
ise
time
=0.
5–15
0µ
sM
ass:
1$
10"
15to
1$
10"
9g
Spee
d:2–
40km
/sQ
C(C
AT
)Che
mic
alan
alyz
erta
rget
'6
81
$10
"14
to10
"8
CR
ise
time
=0.
2–10
µs
'
QA
Che
mic
alan
alyz
ergr
idIo
ns(p
ositi
vech
arge
)ge
nera
ted
upon
impa
ct—
—(J
ustt
rigg
er/c
oinc
iden
ce)
—N
otdi
gitiz
edQ
IIon
grid
Ions
(pos
itive
char
ge)
gene
rate
dup
onim
pact
68
1$
10"
14to
10"
8C
Ris
etim
e=
0.2–
90µ
sM
ass
Spee
d
MP
Mul
tiplie
rdyn
ode
sign
alIo
ns(p
ositi
vech
arge
)ge
nera
ted
upon
impa
ct10
08
4$
10"
14to
4$
10"
8C
(out
puto
fmul
tiplie
r)R
ise
time
=10
ns
Che
mic
alco
mpo
sitio
nm
/&m
=20
–50
QM
AM
ultip
liera
node
sign
alIo
ns(p
ositi
vech
arge
)ge
nera
ted
upon
impa
ct—
——
(Jus
tas
trig
ger)
—N
otdi
gitiz
ed
The
mea
sure
men
tran
ges
ofpa
rtic
lepr
oper
ties
are
indi
cate
d.T
hech
anne
lsQ
P,Q
T,Q
C,Q
Iand
MP
are
digi
tized
ford
ata
anal
ysis
.
THE CASSINI COSMIC DUST ANALYZER 493
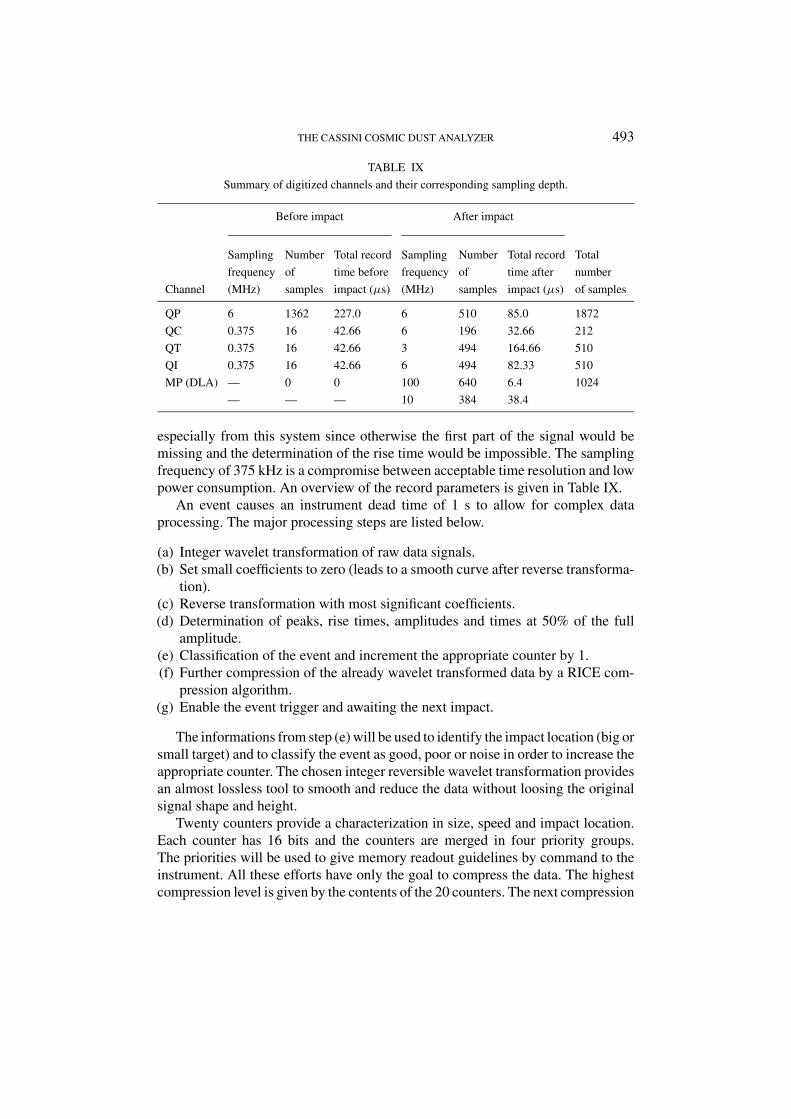
TABLE IXSummary of digitized channels and their corresponding sampling depth.
Before impact After impact
Sampling Number Total record Sampling Number Total record Totalfrequency of time before frequency of time after number
Channel (MHz) samples impact (µs) (MHz) samples impact (µs) of samples
QP 6 1362 227.0 6 510 85.0 1872QC 0.375 16 42.66 6 196 32.66 212QT 0.375 16 42.66 3 494 164.66 510QI 0.375 16 42.66 6 494 82.33 510MP (DLA) — 0 0 100 640 6.4 1024
— — — 10 384 38.4
especially from this system since otherwise the first part of the signal would bemissing and the determination of the rise time would be impossible. The samplingfrequency of 375 kHz is a compromise between acceptable time resolution and lowpower consumption. An overview of the record parameters is given in Table IX.
An event causes an instrument dead time of 1 s to allow for complex dataprocessing. The major processing steps are listed below.
(a) Integer wavelet transformation of raw data signals.(b) Set small coefficients to zero (leads to a smooth curve after reverse transforma-
tion).(c) Reverse transformation with most significant coefficients.(d) Determination of peaks, rise times, amplitudes and times at 50% of the full
amplitude.(e) Classification of the event and increment the appropriate counter by 1.(f) Further compression of the already wavelet transformed data by a RICE com-
pression algorithm.(g) Enable the event trigger and awaiting the next impact.
The informations from step (e) will be used to identify the impact location (big orsmall target) and to classify the event as good, poor or noise in order to increase theappropriate counter. The chosen integer reversible wavelet transformation providesan almost lossless tool to smooth and reduce the data without loosing the originalsignal shape and height.
Twenty counters provide a characterization in size, speed and impact location.Each counter has 16 bits and the counters are merged in four priority groups.The priorities will be used to give memory readout guidelines by command to theinstrument. All these efforts have only the goal to compress the data. The highestcompression level is given by the contents of the 20 counters. The next compression

494 R. SRAMA ET AL.
level are the extracted data of rise times and amplitudes. The lowest compressionlevel are the wavelet treated sampling curves of an event. In order to adjust thememory readout data rate to the spacecraft storage capabilities and telemetry modes,a special data frame was developed which allows a readout of selected information.Therefore it will be possible to readout, e.g. only counter-data together with themultiplier raw data. It is clear that ancillary data such as impact time and spacecraftboresight information belong to each data frame. Further capabilities are to putscience data in housekeeping data frames and vice versa. This will give the CDAinstrument further flexibilities for spacecraft downlink capabilities of 40 bps andlower as they occured between launch and summer 2000.
3.3.4. Calibration of the Dust AnalyzerThere are two components to the science calibration. The primary component isthe measurement of particle impact characteristics on the flight and flight sparemodel instruments in ground based laboratory accelerators. The second part is themeasurement of impact characteristics in the well-understood environment of spaceat 1 AU. The dust environment at 1 AU is very well characterized in flux and sizedistribution by orbiting instruments such as LDEF. Measurements in this environ-ment allow the possibility of measuring many impacts at a relatively high rate thatwill provide a strong cross correlation to all earlier and future measurements.
The calibration principle of the impact signals is similar to the former Galileoand Ulysses experiments (Grun et al., 1992). The yield of charge of the impactplasma is a function of the dust mass for a constant dust speed and the signal risetimes are dependent on the impact speed. A good overview of the calibration ofthe Galileo dust detector is given in (Goller and Grun, 1989). Although this workprovides the basis for the DA calibration much further work has to be done in orderto understand the interference of the newly implemented small chemical analyzertarget and the big impact ionization target. Furthermore the time-of-flight massspectrometer is a completely new subsystem which has to be understood.
The particle parameters affecting the signals are the mass, speed, density, impactlocation on the target and the impact angle. Most of these parameters such as speed,mass and impact location can be varied easily at the dust accelerator facility inHeidelberg. However, based on the accelerator properties, there are some limitationswith respect to the mass and density (material) of the selected dust particles (Stubiget al., 2001). In order to extend the calibration range some tests have been performedat the University of Canterbury, the University of Munich, and at Caltech. TheUniversity of Canterbury (recently this group moved to Open University, U.K.)focuses on the investigations of mass spectra and their calibration (Goldsworthyet al., 2002), whereas the University of Munich and Caltech are using differentaccelerator types enabling them to use bigger particles and to select almost anymaterial as a dust source. In addition, a short pulse UV laser was used at CALTECHin order to achieve mass spectra of a variety of materials (Jyoti et al., 1999). Anoverview of the particles used so far for calibration work at MPI-K is given in

THE CASSINI COSMIC DUST ANALYZER 495
Figure 9. Mass and speed ranges of particles used for calibration and functional testing. The filledsymbols represent measurements at the dust accelerator at the University of Munich.
Figure 9. For each single impact, signals of all channels (QP, QT, QC, QI andMP) of DA were recorded and analyzed in terms of their rise times, amplitudesand their relative timing. The experimental determined detection threshold T for animpacting particle (mass threshold) of DA can be described by T (kg) = 3.04 $10"13 $ v"3.75 with the particle speed v in km/s. All particles with a speed of 10km/s and masses above 5.9 $ 10"17 kg should be detected by DA.
Before applying a function to calculate speed and mass of a dust particle, theimpact location (CA or IID) have to determined. This will be mainly achieved byevaluating the ratio between the amplitude of the target signals QT and QC. Then,the particle speed is calculated by the rise time of the target and ion grid signals.Finally, the amplitude of these signals determine the mass of the dust particle.Note, however, that whenever a dust charge is detected, the particle speed can bederived directly from the duration of the charge signal. This feature allows one tocalibrate the speed measurement that is based on signal rise times and to improvethe accuracy of the particle mass.
In order to eliminate noise events, it is not sufficient to evaluate the signalamplitudes. The time differences between channels is relevant, too. Impacts onthe IID show a time difference of 70 µs between the target and ion grid signalsin the particle speed range between 5 and 11 km/s (the QI signal is later). Thiskind of information helps to separate real impacts from noise events. The detailedcalibration results are reported elsewhere.
The time-of-flight mass spectrometer can be characterized by its mass resolutionwhich is defined as mass of a peak (amu) divided by its mass equivalent of the peakhalf width (amu). The analysis of mass spectra obtained at different velocitiesand using a variety of particle materials has shown resolutions between 10 and 50.Furthermore, the peaks show non-symmetric shapes caused by the simple design ofthis spectrometer. The ions of the impact plasma have a broad direction and energydistribution which leads to different flight times from the target to the multiplier.The consequences are broad and asymmetric peaks, but an ion energy focusing

496 R. SRAMA ET AL.
design as for the dust instrument on Giotto or Stardust was not possible due to thegeometric constraints inside the sensor.
An engineering calibration of the amplifier chain is performed by commandinga selected pulse size and shape to be applied to each of the inputs of the analogsignal chains. The pulse output then triggers an event process and the output isrecorded in exactly the same manner as a dust impact. By comparing the test pulseresults over the duration of the mission, any changes in amplifier gain, noise orspeed can be detected and corrected on the ground.
The Galileo instrument determines the impact speed with an accuracy withina factor of 1.6. Since the calculation of the particle mass is dependent on thespeed, the mass determination was not better than within a factor of six. Thesenumbers seem quite high but they are caused by the complex physics behindthe impact process. Local impact pressures and plasma temperatures are depen-dent on the target and dust material, density, surface geometry, impact angle,particle speed and so on, but they determine the number of electrons and ionsproduced which will be detected by the amplifiers. Therefore it is expected thatthe CDA instrument cannot achieve much better accuracies than the Galileo andUlysses dust experiments and the onboard improvements in electronics and soft-ware will not help too much in this aspect. But they will be useful in termsof evaluating the quality and probability of an impact, which means that noiseevents are eliminated more easily and the evaluated dust fluxes have very lowuncertainties.
3.4. THE HIGH RATE DETECTOR (HRD)
The overall objective of the HRD is to carry out quantitative measurements ofparticle flux and mass distribution throughout the Saturn ring system. The particleimpact rate and particle mass distribution will be determined with respect to Sat-urnian distances, distance from the rings, and to magnetospheric coordinates. Theparticle mass range covered by the HRD (assuming a particle impact velocity of15 km/s) ranges from 8 $ 10"13 to 8 $ 10"8 g for differential and cumulative fluxmeasurements, and >8 $ 10"8 g for cumulative flux measurements.
3.4.1. General DescriptionThe HRD was designed, built and tested at the University of Chicago and mea-sures differential and cumulative particle fluxes. The HRD has a high counting ratecapability (up to 104 random impacts s"1 with <5% corrections) which will beparticularly important during Saturn ring plane crossings, where fluxes are largeenough to saturate the counting rate of DA (1 s"1).
The HRD has significant inheritance from the University of Chicago DustCounter and Mass Analyzer instrument (DUCMA) flown earlier on the Vega-1 andVega-2 spacecraft to Comet Halley (Perkins et al., 1985). The instrument employs

THE CASSINI COSMIC DUST ANALYZER 497
55.7 mm
10 mm
PVDF #2
10 mm
PVDF #2
PVDF #1
140 mm
100 mmAcousticSuppression Pads
SensorHousing
HRD Sensors
TestConnector
PVDF #1100 mm
110 mm
HRD Instrument
HRD Characteristics
Sensors: #1-50 cm2, 28µm thick PVDF detector; #2-10 cm2, 6 µm thick PVDF detector;Particle velocity: >1 km/s; Thresholds: each sensor has four mass thresholds.Particle mass (at 15 Km/s): differential and integral flux!8 x 10-13g to integral flux > 8x10⁻⁸g; integral flux > 8x 10⁻⁸g.Discrete events: recording of impact time (1 second accuracy) and threshold firings for each impact.Counting rates: up to 104 s-1 no corrections; 104 to 105 s-1, known corrections.Data Storage: microprocessor system with 60 k bytes data storage memory.Flight modes: a) Normal (Cruise): continuous recording of impact time, threshold firings and integral counts. b) Fast: integral counts recorded and stored each "t seconds during ring-plane crossings. "t selectable at 0.1, 0.2,...,0.9, 1.0 seconds. c) Calibrate: periodic calibration with in flight-calibrator.
Figure 10. Schematic of the HRD instrument and PVDF dust sensors.
the dust particle detection technique described by Simpson and Tuzzolino (1985)and consists of two polyvinylidene fluoride sensors with associated electronics(Figure 10). The sensors are mounted on the front of the HRD electronics box andthe HRD detects individual particles impacting the PVDF sensors and providescontinuous measurements of cumulative particle fluxes for particle masses greaterthan four mass thresholds for each of the two sensors (see Table 2).
The HRD is an independent instrument containing its own memory andprocessor. The only interface to the DA is via the power and data cables shown inFigure 11. HRD power is supplied by the DA main electronics and data transferresponds by latching the appropriate data into the HRD data output register. Thelatching of the data generates an interrupt to DA indicating that the data is readyto be read by DA and stored into DA memory. The HRD is rigidly mounted to theDA so that as the CDA turntable is rotated, the HRD scans different particle arrivaldirections. HRD properties can be described as follows.
Sensors: #1—50 cm2, 28 µm thick PVDF detector; #2—10 cm2, 6 µm thick PVDFdetector
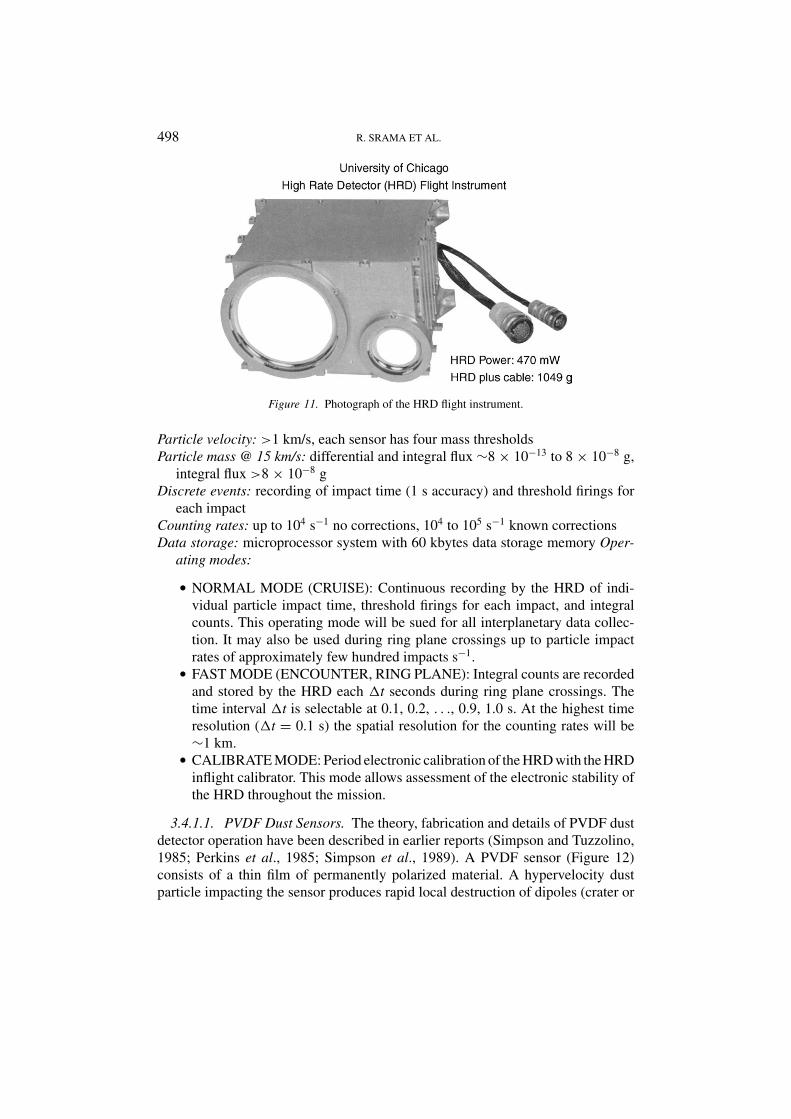
498 R. SRAMA ET AL.
Figure 11. Photograph of the HRD flight instrument.
Particle velocity: >1 km/s, each sensor has four mass thresholdsParticle mass @ 15 km/s: differential and integral flux %8 $ 10"13 to 8 $ 10"8 g,
integral flux >8 $ 10"8 gDiscrete events: recording of impact time (1 s accuracy) and threshold firings for
each impactCounting rates: up to 104 s"1 no corrections, 104 to 105 s"1 known correctionsData storage: microprocessor system with 60 kbytes data storage memory Oper-
ating modes:! NORMAL MODE (CRUISE): Continuous recording by the HRD of indi-vidual particle impact time, threshold firings for each impact, and integralcounts. This operating mode will be sued for all interplanetary data collec-tion. It may also be used during ring plane crossings up to particle impactrates of approximately few hundred impacts s"1.! FAST MODE (ENCOUNTER, RING PLANE): Integral counts are recordedand stored by the HRD each &t seconds during ring plane crossings. Thetime interval &t is selectable at 0.1, 0.2, . . ., 0.9, 1.0 s. At the highest timeresolution (&t = 0.1 s) the spatial resolution for the counting rates will be%1 km.! CALIBRATE MODE: Period electronic calibration of the HRD with the HRDinflight calibrator. This mode allows assessment of the electronic stability ofthe HRD throughout the mission.
3.4.1.1. PVDF Dust Sensors. The theory, fabrication and details of PVDF dustdetector operation have been described in earlier reports (Simpson and Tuzzolino,1985; Perkins et al., 1985; Simpson et al., 1989). A PVDF sensor (Figure 12)consists of a thin film of permanently polarized material. A hypervelocity dustparticle impacting the sensor produces rapid local destruction of dipoles (crater or

THE CASSINI COSMIC DUST ANALYZER 499
0 LPVDF Film
X
DepolarizationCore
VolumePolarization
P
Electrode
Fragments
V=0(No External Bias)
DustParticle
mV
I
Figure 12. Schematic drawing of a polarized PVDF sample with conducting contact electrodes. Anincident dust particle penetrates the sample resulting in complete depolarization along its track. Theimpact generates a fast current pulse I. The total charge carried by the current pulse is a function ofparticle mass and velocity.
penetration hole) which results in a large and fast current pulse at the input to theelectronics (ns range). The output pulse (Figures 13–15) is sharp in time, with amaximum amplitude depending on impacting particle mass and velocity.
Since the depolarization induced current pulse is fast, the output pulse shapeis determined by the choice of electronic time constants for the pre-amplifiers andshapers. Electronic time constants (amplifier shaping time constants, discriminatorwidth) in the few microsecond range permit a high counting rate capability for theHRD sensor-electronics combination (104 random impacts s"1 with <5% correc-tions), as illustrated in Figure 16. The high counting rate capability of the HRD isof particular importance for Saturn ring plane crossings, where high dust particlefluxes are encountered.
3.4.1.2. Acoustic Signal Suppression. PVDF detectors have a secondary butminor mode of response due to their piezoelectric properties. Therefore, back-ground acoustic disturbances of sufficient intensity could trigger the HRD PVDFdetector thresholds, and these threshold firings could be mistakenly recorded asdust particle impacts. During the Cassini-Huygens mission, possible sources ofacoustic disturbances include spacecraft gas jets, moving platforms, and largeparticle impacts on structures near the mounting positions of the HRD PVDFsensors.
To minimize the effects of the possible acoustic backgrounds, the HRD PVDFsensors are mounted in sound absorbing pads (Figures 10 and 17). This designwas highly effective in suppressing the acoustic response from mechanical shocks(Perkins et al., 1985).

500 R. SRAMA ET AL.
Glass Particle
3.4 x 10⁸ e
v=10.6 km/sD=16µmm=5.4 x 10-9 g
Glass Particle
5.7 x 10⁹ e
v=11.4 km/sm=1.8 x 10-7 gD=52µm
Time (7.8 µs/div.)
Fe Particle1.1 x 106 ev=4.76 km/sm=3.5 x 10-11 gD=2.0µm
Sen
sor
Sig
nal
Sen
sor
Sig
nal
Time (6.25 µs/div.)
Glass Particle
1.1 x 10¹⁰ e
v=5.0 km/sm=6.7 x 10-7 gD=82µm
Time (7.8 µs/div.) Time (7.8 µs/div.)
Figure 13. Examples of output signals from 28 µm thick PVDF dust sensors. Listed are particlevelocity, mass and diameter. Output signal amplitudes are expressed in units of number of electroncharges (e).
Fe Particles
v=8.07 km/sm=2.0 x 10-12 gD=0.78 µm
1.2 x 10⁶ e
v=8.09 km/sm=3.2 x 10-12 gD=0.92 µm
2.8 x 10⁶ e
Sen
sor
Sig
nal
Time (19.8 µm/div.)
Figure 14. Output signals from 6 µm thick PVDF dust sensors. Listed are iron particle velocity, massand diameter. Output signal amplitudes are expressed in units of number of electron charges.

THE CASSINI COSMIC DUST ANALYZER 501
Glass Particles
v=8.04 km/sm=6.0 x 10-8 gD=36 µm
2.0 x 10⁹ e
Sen
sor
Sig
nal
Time (7.8 µs/div.) Time (6.5 µs/div.)
5.2 x 10⁹ e
1.2 x 10⁹ e
v=7.3 km/sm=5.0 x 10-7 gD=72 µm
v=15.9 km/sm=9.5 x 10-9 gD=19 µm
Figure 15. Output signals from 6 µm thick PVDF dust sensors. Listed are glass particle velocity,mass and diameter. Output signal amplitudes are expressed in units of number of electron charges.
0.4
0.6
0.8
1.0
Mea
sure
d C
ount
ing
Rat
e/R
ando
m P
ulse
r R
ate
Random Pulser Rate (s-1)103 104 105
Figure 16. Illustration of counting rate capability of PVDF sensor/electronics system. Data takenrandom electronic pulser to simulate a random particle impact rate. Up to impact rates of 104 s"1,counting losses are <5%.
3.4.2. Thermal Aspects3.4.2.1. Thermal Control. Although our studies have shown that PVDF sensors
may be operated at temperatures up to %80 &C for long periods of time (weeks)with small (<5%) degradation in dust particle response, our HRD sensor mountingtechnique, discussed above, acoustically and thermally insulates the sensor fromits surroundings. Under these conditions, the effective sensor emissivity ' andabsorbtivity ! are such that exposure of a PVDF sensor in space to direct solarillumination for a short period of time (%1 min) would result in sensor temperatureshigh enough to destroy the sensor.
Since there have been the possibility of direct exposure of the HRD sensors tosolar illumination at a radial distance of 0.68 AU from the Sun during the Cassini-Huygens mission (Jaffe and Herrell, 1997), we studied different sensor coating

502 R. SRAMA ET AL.
Figure 17. (a) Photograph of the HRD PVDF sensor covers containing sound absorbing pads attachedto the inner portions of the covers. (b) Photograph of the front face of the HRD flight instrument withthe flight sensors removed. Sound absorbing pads are attached to the inner portions of the sensormounts. For each sensor, the central portion of the sensor mount is coated with a thick coating(%45 µm) of Chemglaze Z-306.
techniques which would restrict the sensor temperature to (80&C during solarexposure at 0.68 AU.
The basis for our studies is illustrated in Figure 18. Assuming the deposition ofa coating material having emissivity '2 on both the back surface of the sensor andon the front of the HRD electronics box (Figure 17), sensor temperatures T, as afunction of R, and HRD electronics box temperature may be calculated. Figure 18shows calculated results for '2 = 0.84, where it is seen that the sensor temperatureremains <80 &C at all radial distances )0.61 AU for all HRD electronics boxtemperatures (20 &C. The normal HRD operating temperature at distances >4 AUis between "20 and "10 &C.
One technique which leads to a value '2 = 0.84 consists of applying a (spraybrush) Chemglaze Z-306 coating to one of the sensor surfaces and measured valuesof '2 versus Z-306 thickness are plotted in Figure 19. For HRD sensors, a Z-306thickness of %40 µm has been used, with a value '2 = 0.84. Figure 20 shows thefront and back surfaces of the HRD flight sensors.
PVDF sensors coated with Z-306 have been thermal cycled over the temperaturerange "200 to 115 &C and the coatings have shown excellent adherence to the PVDFsurface and complete mechanical stability. Coated sensors have also successfullypassed launch environments (random vibration up to 55 grms, shock accelerationwith peak acceleration of 1750 g).
3.4.2.2. Temperature dependence of sensor dust particle output signal. Duringthe Cassini-Huygens mission, the extreme temperature limits for the HRD sensors

THE CASSINI COSMIC DUST ANALYZER 503
R (AU)
Sun
Z-306 (#2) on Sensor
Sensor atTemperature T
Z-306 (#2) on Front ofHRD Electronics Box
HRD ElectronicsBox at To
PVDF Film
$%=0.1
#=0.025Aluminum
(600-800 A)o
-20
0
20
40
60
80
100
120
140
HR
D S
enso
r Tem
pera
ture
(o C
)
Radial Distance from Sun (AU)
0.5 1.0 1.5 2.0 2.5 3.0
To=20o C
To=-20o C
To=0o C
Figure 18. (a) Model assumed for HRD solar exposure at a radial distance R (AU) from the Sun.The sensor surface facing the Sun (front surface) has absorptivity ! = 0.1, and emissivity ' = 0.025.The back surface of the sensor is coated with Z-306, having emissivity '2 and is close (few mm) to aZ-306 coating having '2 which has been applied to the front of the HRD electronics box. The sensoris at temperature T and the HRD box is maintained at temperature T0.
are predicted to range from "50 to +80 &C. For dust particles of fixed massand velocity impacting a HRD sensor, two temperature dependent parametersdetermine the variation of output signals from the sensor-linear electronicscombination as the temperature of the HRD changes:
! the variation in sensor capacitance with temperature, and;! the variation of the dust particle depolarization induced charge signal with tem-perature.
These two contributions are discussed later.

504 R. SRAMA ET AL.
1.0
0.8
0.6
0.4
0 10 20 30 40 50Chemglaze Z-306 Thickness (µm)
Thick Z-306
Mea
sure
d E
mis
sivi
ty #
2Emissivity vs. Z-306 Thicknessfor PVDF Sensor Surface Coatedwith Chemglaze Z-306
Figure 19. Measured emissivity '2 vs. Z-306 thickness for a PVDF sensor surface coated withChemglaze Z-306.
Figure 20. Upper panels: photograph of the front and back surfaces of HRD flight sensor #1 (50 cm2,28 µm thick). The back surface is coated with Z-306 (%40 µm thick). Lower panels: Photograph offront and back surfaces of HRD flight sensor #2 (100 cm2, 6 µm thick). The back surface is coatedwith Z-306 (%40 µm thick).

THE CASSINI COSMIC DUST ANALYZER 505
0.2
0.4
0.6
0.8
1.0
1.2
1.4
Cap
acita
nce
(T)
/ Cap
acita
nce
(20o C
)
1107030-10-50-90-130-170-210
PVDF Sensor Temperature T (oC)
Figure 21. Measured PVDF sensor capacitance vs. sensor temperature. Capacitance values are nor-malized to the value at room temperature.
3.4.3. Detector Capacitance and Amplifier DesignThe two HRD sensors have capacitances of 18 nF (50 cm2, 28 µm thick) and 12 nF(10 cm2, 6 µm thick) at room temperature. Figure 21 shows the measured depen-dence of PVDF sensor capacitance on temperature. Over the expected temperaturerange for the HRD sensors during the Cassini-Huygens mission (!50 to +80 "C),Figure 21 establishes the range of sensor capacitance which the pre-amplifier mustaccommodate. The final design of the HRD sensor pre-amplifier was such thatover the temperature range !50 to +80 "C, variations in pre-amplifier pulse height(generated by an electronic pulser) were less than 2% resulting from variations insensor capacitance.
The large HRD sensor capacitance also had to be considered in the design ofthe linear electronics with respect to the counting rate requirements for the Cassini-Huygens mission. The final design of the sensor linear electronics is using 2 µs timeconstants for the post amplifier pulse shaping and a discriminator width of 4 µs.
To determine an optimum choice for the HRD sensor’s lowest mass threshold,the electronic noise (FWHM) for the combination HRD sensor, pre-amplifier (CSA)and shaping amplifier must be considered. If the lowest mass threshold is set toolow, electronic noise counts will contribute to the total measured counts. If it is settoo high, low-mass particles are lost.
The measured electronic noise (FWHM) for the HRD linear electronics versuscapacitance at the CSA input is shown in Figure 22. For each HRD sensor (18 and12 nF), the electronic noise is #3.5 $ 105 e (FWHM) or #1.5 $ 105 e (rms). Bysetting the lowest electronic threshold for each HRD sensor at a value #2.0 $ 106
e (e.g., a factor 13.3 above the rms noise), electronic noise counts are completelyexcluded.

506 R. SRAMA ET AL.
0 50 100 150 200 250Capacitance (nF)
3.50E+06
3.00E+06
2.50E+06
2.00E+06
1.50E+06
1.00E+06
5.00E+05
0.00E+00
FW
HM
(e)
Varying Capacitors
Different Sensors
Figure 22. Measured electronic noise (FWHM) expressed in units of number of electrons (e) at theinput to the HRD sensor charge sensitive pre-amplifier (CSA) vs. sensor capacitance. For the HRDsensors, the measured electronic noise is %3.5 $ 105 e (FWHM).
3.4.4. Detector Charge SignalOf the several PVDF material parameters which determine the magnitude of thePVDF detector depolarization charge signal resulting from an impacting dust par-ticle (Simpson and Tuzzolino, 1985), the volume polarization magnitude, P, andits temperature dependence are the most important for determining the tempera-ture dependence of the signal amplitude. Our laboratory measurements have shownthat over the temperature range "50 to +80 &C, the charge signal amplitude willvary by less than 6% from the values measured at room temperature. Thus, weexpected an overall possible variation in output signal amplitude resulting fromboth detector capacitance and depolarization charge signal temperature effects ofless than 10% over the expected temperature range for the detector. This max-imum 10% effect will contribute a negligible uncertainty for the particle massthresholds.
3.4.5. HRD Electronics, Digital Data and CommandsFigure 23 shows a block diagram of the principal electronic functions of the HRDinstrument and its interface to the CDA main electronics, and Figure 24 shows adiagram of the data flow from HRD to the CDA main electronics.
3.4.5.1. Linear (Analog) Electronics. The HRD linear electronics consists ofcharge sensitive pre-amplifiers (CSA), shaping amplifiers (SHAPER) and thresholddiscriminators. Each SHAPER in Figure 23 provides single integration – singledifferentiation RC shaping with a shaping time constant of 2 µs.
A particle impact on either sensor #1 or sensor #2 will result in output signalsfrom the shapers (Figures 13–15) which may trigger the M1, M2, M3, M4 thresholds

THE CASSINI COSMIC DUST ANALYZER 507
Sensor 1
Sensor 2
CSA Shaper
CSA Shaper
Shaper
Shaper
AnalogSwitch
PulseAnalog Voltage
Dis
crim
.D
iscr
im.
IFC
m1
m4m3m2
m1
m4m3m2
DataInterface
HRD HandshakeCommands / DataHRD TemperaturesHRD Low Voltages
CDA MainElectronics
HR
D M
icro
proc
esso
r S
yste
m
Sensor MassThreshold
Switch
Figure 23. Block diagram of the principal electronic functions of the HRD and its interface to theCDA main electronics.
Ana
log
Ele
ctro
nics
D1 D2
1HzClock
ProgramCounter
8085Microprocessor
M1-M4, m1-m4
M1
M2
M3
M4
m1
m2
m3
m4
8-BitDiscreteEventLatch
Dual16 Bit
Counter
Dual16 Bit
Counter
Dual16 Bit
Counter
Dual16 Bit
Counter
Counter32 Bit
Real TimeClock
Accumulator
Data In
Data Out
Data In
Data Out
4K ByteProgram Memory
8-Bit CommandRegister to HRD
8-Bit DataRegister to HRD
8-Bit DataRegister to DA
64K Byte DataStorage
DA
Inst
rum
ent
Sensors
HRD - DA Data Flow Diagram
Figure 24. Diagram of the HRD-DA data flow.
for sensor #1, or the m1, m2, m3, m4 thresholds for sensor #2. As a contingency, theM1–M4, and/or m1–m4 electronic thresholds may be increased by a fixed factor(%10) by ground command, which activates a sensor mass threshold switch foreither or both sensors (Figure 23).

508 R. SRAMA ET AL.
3.4.5.2. Digital Electronics and Data. Figure 24 shows a block diagram of theimportant elements of the HRD digital electronics and illustrates the HRD-DAdata flow. If the lowest threshold of either sensor is fired, the threshold firings willincrement the corresponding 16-bit counters, and the following items (discrete eventdata) are stored in HRD memory when HRD is in NORMAL MODE (CRUISE):
(a) particle impact time (21 low-order bits from the HRD 32-bit clock, with 1 sresolution);
(b) CDA pointing (sector) information from DA (3 bits), and;(c) the threshold firings for each sensor – M1, M2, M3, M4, m1, m2, m3, m4
(8 bits).
After storage of 256 discrete events in HRD memory, the next discrete eventwill also store in HRD memory HEADER data, which includes the contents of theeight 16-bit counters, as illustrated in Figure 25. The HEADER data also includesthe HRD STATUS (8 bits), which indicates the operating mode of the HRD, and thestatus of the two sensor mass threshold relays, as well as the temperature (8 bits)of the interior of the HRD electronics box (TEMP #1).
HRD Normal (Cruise) FormatHRD Data Frame 1
HRD Status (8 (Bits)
SB) HRD Clock (32 Bits) (LS
(MSB) Spacecraft Clock from DA (32 Bits) (LSB)
Sector / Position (MSB)(8 Bits)
Sector / Position (LSB)(8 Bits)
Temp #1 (8 Bits) Spare (8 Bits)
M1 (16 Bits) M2 (16 Bits)
M3 (16 Bits) M4 (16 Bits)
m1 (16 Bits) m2 (16 Bits)
m3 (16 Bits) m4 (16 Bits)
Sector(3 Bits)
Sector(3 Bits)
Sector(3 Bits)
Sector(3 Bits)
Discrete #1 Clock (21 Low Order Bits)
Discrete #4 Clock (21 Low Order Bits)
Discrete #3 Clock (21 Low Order Bits)
Discrete #2 Clock (21 Low Order Bits)
M1
M1
M1
M1
M2
M2
M2
M2
M3
M3
M4
M4
M4
M4
M3
M3
m1
m1
m1
m1
m2
m2
m2
m2
m3
m3 m4
m4
m4
m4
m3
m3
Discrete Data 5 to 254
Discrete #256 Clock (21 Low Order Bits)
Discrete #255 Clock (21 Low Order Bits)
Sector(3 Bits)
Sector(3 Bits) M1
M1
M2
M2
M4
M4
M3
M3
m1
m1
m2
m2
m4
m4
m3
m3
HRD Data Frame 2
HRD Sync (24 Bits)
HRD Sync (24 Bits) HRD Status (8 Bits)
Header256Bits
DiscreteData32 Bits/ Event
Figure 25. HRD data format for NORMAL MODE (CRUISE).

THE CASSINI COSMIC DUST ANALYZER 509
M1 (16 Bits) M2 (16 Bits)
M3 (16 Bits) M4 (16 Bits)
m1 (16 Bits) m2 (16 Bits)
m3 (16 Bits) m4 (16 Bits)
HRD Status (8 (Bits)HRD Sync (24 Bits)
HRD Clock (27 Bits)Sector(5 LS Bits)
HRD "Encounter" Format
Figure 26. HRD data format for ENCOUNTER MODE (ring plane crossings).
When the HRD is in FAST (ENCOUNTER) MODE, the HRD will record andstore in HRD memory each &t seconds the integral counts for the eight 16-bitcounters, as shown in Figure 26, as well as HRD status, pointing and HRD clockinformation.
3.4.5.3. HRD Commands. When the CDA main electronics supplies power tothe HRD, the HRD turn on in NORMAL (CRUISE) MODE (Figure 25), witha sensor mass threshold relays in the “LOW MASS” positions. HRD commandsinclude:
(a) ENCOUNTER MODE: Selects &t at one value in the range &t = 0.1, 0.2, . . .,0.9, 1.0 s and runs the HRD in ENCOUNTER MODE (Figure 26).
(b) SET RELAY: Selects the threshold relay switches for each sensor to LOWMASS RANGE or HIGH MASS RANGE (see Table 2).
(c) IN-FLIGHT CALIBRATE (IFC): Initiates a sequence of electronic pulses ofvarying amplitude within the HRD electronics (Figure 23) which permits as-sessment of the stability of the HRD electronics.
3.4.6. PVDF Sensor CalibrationsParticle calibrations of HRD-type PVDF sensors (28 and 6 µm thick) were carriedout at the Heidelberg and Munich dust accelerator facilities, as summarized inTable 10 (Tuzzolino, 1996). Our results are summarized in Figures 27 and 28 for 6µm thick PVDF sensors and in Figures 29 and 30 for 28 µm thick PVDF sensors,where N(e) is the output signal amplitude from the shapers expressed in units ofnumber of electron charges at the input to the electronics, and m (g) and v (km/s)are the mass and impact velocity of the dust particle. The calibration data show thatthe signal amplitude N may be fit by a power-law dependence on particle mass andvelocity of the form mavb, with values for the mass index a and velocity index b,as given in the expressions included.
Form these data, and an assumed ring plane crossing particle impact velocity of15 km/s the electronic thresholds set for the HRD flight unit will result in the particlemass thresholds given in Table 11. The upper half of Table 11 lists the electronicand particle mass thresholds for the case where the sensor mass threshold switches

510 R. SRAMA ET AL.
TAB
LE
XSu
mm
ary
ofPV
DF
dust
sens
orca
libra
tions
atH
eide
lber
g(A
ugus
t198
3,Ju
ne19
84,J
anua
ry19
94)a
ndM
unic
h(O
ctob
er19
87,
Apr
il19
89,J
anua
ry19
94).
Faci
lity
Prop
erty
6µ
mth
ick
PVD
F28
µm
thic
kPV
DF
MPI
-KH
eide
lber
g(F
epa
rtic
les)
Vel
ocity
(km
/s)
1.0–
12.0
1.7–
11.4
Mas
s(g
)3.
8$
10"
13to
1.7
$10
"10
2.8
$10
"13
to1.
9$
10"
10
Dia
met
er(µ
m)
0.45
–3.3
0.4–
3.4
Mun
ich/
Gar
chin
g(g
lass
part
icle
s)V
eloc
ity(k
m/s
)1.
8–15
.92.
0–11
.4
Mas
s(g
)2.
4$
10"
9to
2.0
$10
"6
5.4
$10
"9
to3.
0$
10"
6
Dia
met
er(µ
m)
12–1
1516
–130
Ran
geof
mea
sure
dse
nsor
sign
alam
plitu
des
Smal
lest
8.3
$10
4(F
e)2.
7$
104
(Fe)
(num
bero
fele
ctro
nch
arge
se)
Lar
gest
8.5
$10
9(g
lass
)4.
2$
1010
(gla
ss)

THE CASSINI COSMIC DUST ANALYZER 511
1.00E-13 1.00E-091.00E-101.00E-111.00E-121.00E+01
1.00E+02
1.00E+03
1.00E+04
1.00E+05
m(g)
N(e
)/[v
(km
/s)]
3.0
6µm Thick PVDF SensorsNFe(6µm)=3.6x10¹⁸m1.3v3.0 Electrons
Figure 27. Calibration data for the 6 µm thick PVDF sensor (Heidelberg, Fe particles).
1.00E-09 1.00E-051.00E-061.00E-071.00E-081.00E+06
1.00E+07
1.00E+08
1.00E+09
1.00E+10
1.00E+11
N(e
)/[v
(km
/s)]
1.05
6µm Thick PVDF Sensors
NGlass(6µm)=1.36x10¹³m0.7v1.3 Electrons
m(g)
Figure 28. Calibration data for the 6 µm thick PVDF sensor (Munich, glass particles).
are set for “LOW MASS,” and the lower half of Table 11 for the case where theswitches are set for “HIGH MASS” (by ground command).
3.5. CDA MEASUREMENT RANGES AND PAYLOAD PARAMETERS
The impact rate will be measured from 3 $ 10"7 to 1 s"1 (IID) and up to 104
s"1 (HRD) in order to cover both the impact rates expected in interplanetary spaceand during high activities such as ring plane crossings at Saturn. The measurable

512 R. SRAMA ET AL.
1.00E-13 1.00E-091.00E-101.00E-111.00E-121.00E+01
1.00E+02
1.00E+03
1.00E+04
1.00E+05
N(e
)/[v
(km
/s)]
3.0
28µm Thick PVDF Sensors
NFe(28µm)=3.8x10¹⁷m1.3v3.0 Electrons
m(g)
Figure 29. Calibration data for the 28 µm thick PVDF sensor (Heidelberg, Fe particles).
1.00E-09 1.00E-051.00E-061.00E-071.00E-081.00E+06
1.00E+07
1.00E+08
1.00E+09
1.00E+10
N(e
)/[v
(km
/s)]
1.05
28µm Thick PVDF Sensors
NGlass(28µm)=6.94x10¹⁴m0.9v1.05 Electrons
m(g)
Figure 30. Calibration data for the 28 µm thick PVDF sensor (Munich, glass particles).
particle mass ranges from 5 $ 10"19 to 10"13 kg (40 km s"1 impact speed) andfrom 10"16 to 10"10 kg (5 km s"1 impact speed). The detectable impact speedis greater than 1 km s"1. There is no upper speed limit for the detection of par-ticles, but the speed determination will be difficult beyond 80 km s"1. The par-ticle charges are measured from 10"15 to 5 $ 10"13 C for both, negative and

THE CASSINI COSMIC DUST ANALYZER 513
TABLE XIHRD PVDF sensors – electronic thresholds and corresponding particle mass thresholds for 15 km/simpact speed (upper half: “Low Mass,” lower half: “High Mass”).
Electronic Particle Particlethreshold mass diametera Electronic Particle mass Particle(e) thresholds (g) (µm) threshold (e) threshold (g) diameter (µm)
#1 PVDF Sensor #1; area = 50 cm2; PVDF Sensor #2; area = 10 cm2;thickness = 28 µm thickness = 6 µm
LM1 = 2.1 ! 106 4.0 ! 10"12 1.5 m1 = 2.0 ! 106 7.5 ! 10"13 1.5LM2 = 1.9 ! 107 2.2 ! 10"11 2.6 m2 = 1.9 ! 107 4.0 ! 10"12 1.5
LM3 = 4.1 ! 108 5.1 ! 10"9 15.7 m3 = 4.1 ! 108 2.3 ! 10"9 12.1LM4 = 5.2 ! 109 8.3 ! 10"8 40 m4 = 5.2 ! 109 8.5 ! 10"8 40.2
HM1 = 1.8 ! 107 2.1 ! 10"11 2.5 m1 = 2.1 ! 107 4.4 ! 10"12 0.8HM2 = 1.6 ! 108 1.7 ! 10"9 10.9 m2 = 2.0 ! 108 9.0 ! 10"10 8.8
HM3 = 3.5 ! 109 5.5 ! 10"8 35 m3 = 4.3 ! 109 6.5 ! 10"8 36.7HM4 = 4.4 ! 1010 9.3 ! 10"7 89 m4 = 5.4 ! 1010 2.5 ! 10"6 124
aAssuming impacting particles with density 2.5 g/cm3.
positive charges. The trajectory of charged particles (above 10"14 C) can be mea-sured with an accuracy of 5# in one plane. The mass resolution of the time-of-flight mass spectrometer lies between 10 (lower masses) and 50 (higher masses)which is certainly sufficient to distinguish between water ice, organic or silicateparticles.
The maximum angle of incidence for particles with respect to the sensor bore-sight is 45 # (IIT), 28 # (CAT) and 88 # for the HRD. Table 12 gives an overview ofthe CDA properties.
3.6. INSTRUMENT OPERATIONS AND DATA PRODUCTS.
Following the launch of Cassini-Huygens on October 15, 1997, the CDA instru-ment was switched on for the first time on October 31, 1997. On that day theplatform was unlatched and the instrument articulated to its 270# position. OnNovember 13, 1997, the cover was successfully jettisoned by firing the two redun-dant pyro devices. Since then the aperture of the instrument was open. The firstdecontamination of the chemical analyzer target occurred one day later. Duringthis procedure the target was heated up to 90 #C in order to eliminate possible con-tamination by hydrocarbons. This target must be kept clean to obtain undisturbedmass spectra. In order to maintain the mechanics of the articulation mechanism, theinstrument participated in a periodic instrument maintenance every 3 months in thefirst 2 years of the mission. During this process the instrument performed a 225 #

514 R. SRAMA ET AL.
TABLE XIIProperties of the CDA instrument.
Parameter Value Unit
Mass total 17.151 kgMass Dust Analyzer 4.642 kgMass Main Electronics 6.801 kgMass Amplifier Box 3.753 kgHigh Rate Detector 1.049 kgThermal blankets 0.905 kgPower sleep 10.15 WPower with HRD on 11.70 WPower during articulation 13–17.3 WReplacement heater 11.25 W@30 VDecontamination 8.85 W@30 VSupply voltage 30 (+1.5/"2.5) VOperating temperature
Main Electronics Box "15 to +40 &CHigh Rate Detector "25 to +40 &C
Radiation hardness 100 kradData bus S/C interface 1553 BusData rate 19 bps HK; 524 bps ScienceArticulation about 1 axis 0–270 degreeDimensions
Impact Ionization Target * 0.41 mChemical Analyzer Target * 0.16 m
turn. This total activity took approximately 2 h. The CDA instrument check-outwas in December 1998 and took approximately 3 weeks. During the first part of thecheckout, the instrument health was checked and the high voltages were steppedup to their normal values. This time was also used to verify the execution of somecommands. Then a 5-day period followed during which the trigger thresholds ofall channels were adjusted. The goal was to find an instrument state which candetect small particle impacts by using low thresholds but which was not too dis-turbed by noise events. In the following weeks the first dust impacts were awaitedon all subsystems: the IID, the CAT and the HRD. Since the sensitive area of theCAT is rather small, many weeks are necessary to ensure the detection of a massspectrum.
The planned data products are manifold. The final result is a data base contain-ing the most significant particle parameters such as impact speed, mass, charge,direction, composition, and impact time. The software for analysis and archivingis still in development and their description will be given elsewhere.

THE CASSINI COSMIC DUST ANALYZER 515
Acknowledgements
The development, construction, implementation and testing of this instrument andits data processing system was only achieved by the efforts of a great number ofindividuals from various departments of the Max-Planck-Institut fur Kernphysikand from outside institutions and companies. The authors are especially indebted tomany coworkers who supported the team at MPI-K, DLR-Berlin, UK Canterbury,ESTEC and RAL. We are grateful to G. Pahl who designed the instrument and toA. Kaiser and S. Helfert who developed significant parts of the onboard software.This project is supported by the Max-Planck-Institut fur Kernphysik and by theDLR under the grant 50OH91019.
References
Anders, E. and Grevesse, E.: 1989, Cosmochim. Acta 53, 197–214.Arndt, P., Bohsung, J., Maetz, M., and Jessberger, E. K.: 1996, Meteoritics Planet. Sci. 31, 817–833.Auer, S.: 1975, Rev. Sci. Instrum. 46(2), 127–235.Auer, S., Grun, E., Srama, R., Kempf, S., and Auer, R.: Plan. Space Sci. 50(7/8), 773–779.Baggaley, W. J. and Galligan, D. P.: 1997, Plan. Space Sci. 45(7), 865–868.Bradley, J. G., Grun, E., and Srama, R.: 1996, The Cosmic Dust Analyzer for Cassini, Vol. 2803, 5–6
August, Proceedings of SPIE, Denver.Berg, O. E. and Richardson, F. F.: 1968, Rev. Sci. Instrum. 40, 1333.Bradley, J. P.: 1988, Cosmochim. Acta 52, 889–900.Brownlee, D. E.: 1985, Ann. Rev. Earth Planet. Sci. 13, 147–173.Burns, J. A., Lamy, Ph. L., and Soter S.: 1979, Icarus 40, 1–48.Bus, S. J., Bowell, E., Harris, A. W., and Hewitt, A. V.: 1989, Icarus 77, 223–238.Colwell, J. E., Horanyi, M., and Grun, E.: 1998, Am. Inst. Phys. Conf. Proc. 446, 299–306.Cuzzi, J. N. and Estrada, P. R.: 1998, Icarus 132, 1–35.Dietzel, H., Eichhorn, G., Fechtig, H., Grun, E., Hoffman, H.-J., and Kissel, J.: 1973, J. Phys. (E) Sci.
Instrum. 6, 209–217.Dikarev, V. V.: 1999, Astron. Astrophys. 346, 1011–1019.Dikarev, V. and Grun, E.: 2002, Astron. Astrophys. 383(1), 302–308.Dikarev, V. V. and Krivov, A. V.: 1998, Solar Syst. Res. 32(2), 128–143.Goertz, C. K. and Morfill, G.: 1983, Icarus 53, 219–229.Goertz, C. K. and Morfill, G. E.: 1988, Icarus 74, 3815.Goldsworthy, B. J., Burchell, M. J., Cole, M. J., Green, S. F., Leese, M. R., McBride, N., McDonnell,
J. A. M., Muller, M., Grun, E., Srama, R., Armes, S. P., and Khan, M. A.: 2002, Adv. Space Res.29(8), 1139–1144.
Goller, J. R. and Grun, E.: 1989, Planet. Space Sci. 37(10), 1197–1206.Graps, A. L., Grun, E., Svedhem, H., Kruger, H., Horanyi, M., Heck, A., and Lammers, S.: 2000,
Nature 405, 48–50.Grun, E., Baguhl, M., Divine, N., Fechtig, H., Hamilton, D. P., Hanner, M. S., Kissel, J., Lindblad,
B.-A., Linkert, D., Linkert, G., Mann, I., McDonnell, J. A. M., Morfill, G. E., Polanskey, C.,Riemann, R., Schwehm, G., Siddique, N., Staubach, P., and Zook, H. A.: 1995, Planet. Space Sci.43(8), 971–999.
Grun, E., Baguhl, M., Hamilton, D. P., Riemann, R., Zook, H. A., Dermott, S., Fechtig, H., Gustafson,B. A., Hanner, M. S., Horanyi, M., Khurana, K. K., Kissel, J., Kivelson, M., Lindblad, B.-A.,

516 R. SRAMA ET AL.
Linkert, D., Linkert, G., Mann, I., McDonnell, J. A. M., Morfill, G. E., Polanskey, C., Schwehm,G., and Srama, R.: 1996, Nature 381, 395–398.
Grun, E., Fechtig, H., Giese, R. H., Kissel, J., Linkert, D., Maas, D., McDonnell, J. A. M., Morfill,G. E., Schwehm, G., and Zook, H. A.: 1992, Astron. Astrophys. Suppl. Ser. 92, 411–423.
Grun, E., Fechtig, H., Giese, R. H., Kissel, J., Linkert, D., McDonnell, J. A. M., Morfill, G. E.,Schwehm, G., and Zook, H. A.: 1983, in: Wenzel, K. P., Marsdon, R. G., and Battrick, B. (eds.),The ISPM Dust Experiment in The International Solar Polar Mission – Its Scientific Investigations,ESA SP-1050, pp. 227–241.
Grun, E., Fechtig, H., Hanner, M. S., Kissel, J., Lindblad, B.-A., Linkert, D., Linkert, G., Morfill, G.E., and Zook, H.: 1992, Space Sci. Rev. 60, 317–340.
Grun, E., Hamilton, D. P., Riemann, R., Dermott, S., Fechtig, H., Gustafson, B. A., Hanner, M. S.,Heck, A., Horanyi, M., Kissel, J., Kruger, H., Lindblad, B.-A., Linkert, D., Linkert, G., Mann, I.,McDonnell, J. A. M., Morfill, G. E., Polanskey, C., Schwehm, G., Srama, R., and Zook, H. A.:1996, Science 274, 399–401.
Grun, E., Kruger, H., Dermott, S., Fechtig, H., Graps, A., Gustafson, B. A., Hamilton, D. P., Hanner,M. S., Heck, A., Horanyi, M., Kissel, J., Lindblad, B.-A., Linkert, D., Linkert, G., Mann, I.,McDonnell, J. A. M., Morfill, G. E., Polanskey, C., Schwehm, G., Srama, R., and Zook, H. A.:1997, 24, 2171–2174.
Grun, E., Kruger, H., Graps, A., Hamilton, D. P., Heck, A., Linkert, G., Zook, H. A., Dermott, S.,Fechtig, H., Gustafson, B. A., Hanner, M. S., Horanyi, M., Kissel, J., Lindblad, B.-A., Linkert,D., Mann, I., McDonnell, J. A. M., Morfill, G. E., Polanskey, C., Schwehm, G., and Srama, R.:1998, J. Geophys. Res.-Planets. 103(E9), 20011–20022.
Grun, E. and Landgraf, M.: 2000, J. Geophys. Res. 105(A5), 10291–10297.Grun, E., Morfill, G. E., and Mendis, D. A.: 1984, in: Greenberg, R., and Brahic, A. (eds.), Dust-
Magnetospere Interactions in “Planetary Rings”, University of Arizona Press, Tuscon, pp. 275–332.
Grun, E., Morfill, G., Terrile, R. J., Johnson, T. V., and Schwehm, G.: 1983, Icarus 54, 227–252.Grun, E., Zook, H. A., Baguhl, M., Balogh, A., Bame, S. J., Fechtig, H., Forsyth, R., Hanner, M. S.,
Horanyi, M., Kissel, J., Lindblad, B.-A., Linkert, D., Linkert, G., Mann, I., McDonnell, J. A. M.,Morfill, G. E., Phillips, J. L., Polanskey, C., Schwehm, G., Siddique, N., Staubach, P., Svestka,J., and Taylor, A.: 1993, Nature 362, 428–430.
Grun, E., Zook, H. A., Fechtig, H., and Giese, R. H.: 1985, Icarus 62, 244–272.Gurnett, D. A., Ansher, J. A., Kurth, W. S., and Granroth, L. J.: 1997, Geophys. Res. Lett. 24, 3125ff.Gurnett, D. A., Grun, E., Gallagher, D., Kurth, W. S., and Scarf, F. L.: 1983, Icarus 53, 236–254.Haff, P. K., Eviatar, A., and Siscoe, G. L.: 1983, Icarus 56, 426.Hamilton, D. P. and Burns, J. A.: 1993, Nature 364, 695–699.Hamilton, D. P. and Burns, J. A.: 1994, Science 264, 550–553.Hanner, M. S., Sparrow, J. G., Weinberg, J. L., and Beeson, D. E.: 1976, Pioneer 10 observations of
zodiacal light brightness near the ecliptic: Changes with heliocentric distance, in: Elsasser, H.,and Fechtig, H. (eds.), Interplanetary Dust and Zodiacal Light, Lecture Notes in Physics, Vol.48, Springer-Verlag, New York, pp. 29–35.
Hashimov, N. M. and Tarakanov, V. L.: 1982, Komety i Meteory 32, 3–9 (in Russian).Havnes, O.: 1984, Adv. Space Res. 4(9), 75–83.Havnes, O., Goertz, C. K., Morfill, G. E., Grun, E., and Ip, W.: 1987, J. Geophys. Res. 92, 2281.Havnes, O. and Morfill, G. E.: 1984, Adv. Space Res. 4, 85.Hoffmann, H.-J., Fechtig, H., Grun, E., and Kissel, J.: 1975, Plant. Space Sci. 23, 985–991.Horanyi, M.: 2000, Phys. Plasmas 7, 3847–3850.Horanyi, M., Morfill, G. E., and Grun, E.: 1993, Nature 363, 144–146.Horanyi, M., Morfill, G. E., and Grun, E.: 1993, The dusty ballerina skirt of jupitor. Jour. Geophys.
Res. 98, 21245–21251.

THE CASSINI COSMIC DUST ANALYZER 517
Howard, J. and Horanyi, M.: 2001, Geophys. Res. Lett. 28, 1907–1911.Humes, D. H.: 1980, J. Geophys. Res. 85, 5841–5852.Humes, D. H., Alvarez, J. M., O’Neal, R. L., Kinard, and W. H.: 1974, J. Geophys. Res. 79(25),
3677–3684.Jackson, A. A. and Zook, H. A.: 1989, Nature 337, 629–631.Jaffe, L. D. and Herrell, L. M.: 1997, J. Spacecraft Rockets 34(4), 509.Jessberger, E. K.: 1999, On the elemental, isotopic and mineralogical ingredients of ROCKY cometary
particulates, in: Altwegg, K., Ehrenfreund, P., Geiss, J., and Huebner, W. (eds.), Proceedings of theOrigin and Composition of Cometary Materials, Space Science Series of ISSI, Kluwer AcademicPublishers, pp. 91–97.
Jessberger, E. K., Bohsung, J., Chakaveh, S., and Traxel, K.: 1992, Earth Planet. Sci. Lett. 112, 91–99.Jessberger, E. K., Christoforidis, A., and Kissel, J.: 1988, Nature 332, 691–695.Jessberger, E. K., Stephan, T., Rost, D., Arndt, P., Maetz, M., Stadermann, F. J., Brownlee, D. E.,
Bradley, J., and Kurat, G.: 2001, Properties of interplanetary dust: Information from collectedsamples, in: Dermott, S. F., Fechtig, H., Grun, E., and Gustafson, B. A. S. (eds.), InterplanetaryDust, Springer, Heidelberg, pp. 253–294.
Jessberger, E. K. and Wallenwein, R.: 1986, Adv. Space Res. 6, 5–8.Johnson, R. E., Pospieszalska, M. K., Sittler, E. C., Jr., Cheng, A. F., Lanzerotti, L. J., and Sievka, E.
M.: 1989, Icarus 77, 311.Jyoti, G., Gupta, S. C., Ahrens, T. J., Kossakovski, D., and Beauchamp, J. L.: 1999, in: Furnish, M. D.
(ed.), Mass Spectrometer Calibration of Cosmic Dust Analyzer, Shock Compression of CondensedMatter.
Jyoti, G., Gupta, S. C., Ahrens, T. J., Kossakovski, D., and Beauchamp, J. L.: 1999, Int. J. ImpactEng. 23, 401–408.
Kissel, J., Fechtig, H., Grun, E., Igenbergs, E. B., Jessberger, E. K., McDonnell, J. A. M., Morfill, G.E., Schwehm, G. H., and Zook, H. A.: 1986, Nature 321, 336–338.
Krivov, A. V. and Banaszkiewicz, M.: 2001, Plan. Space Sci. 49(13), 1265–1279.Krivov, A. V., Dikarev, V. V., Sremcevic, M., and Kholshevnikov, K. V.: 2001, Dust Clouds of Saturnian
Outer Satellites: Guidelines for Cassini Dust Instrument, white paper.Kruger, H., Krivov, A. V., and Grun, E.: 2000, Plant. Space Sci. 48(15), 1457–1471.Krivov, A. V., Kruger, H., and Grun, E.: 2002, J. Geophys. Res. 107(E1), 2-1–13.Lamy, P. L., Lefevre, J., Millet, J., and Lafon, J. P.: 1985, Electrostatic charge of interplanetary
dust grains: New results, in: Giese, R. H., and Lamy, P. (eds.), Properties and Interactions ofInterplanetary Dust, D. Reidel Publishing Co., Dordrecht, pp. 335–339.
Landgraf, M., Augustsson, K., Grun, E., and Gustafson, B. A. S.: 1999, Science 286, 5448, 2319–2322.
Landgraf, M., Baggeley, W. J., Grun, E., Kruger, H., and Linkert, G.: 2000, J. Geophys. Res. 105(A5),10343–10352.
Landgraf, M., Liou, J.-C., Zook, H. A., and Grun, E.: 2002, Astron. J. 123 (5), 2857–2861.Leinert, C. and Grun, E.: 1990, in: Schwenn, R., and Marsch, E. (eds.), Interplanetary Dust in Physics
and Chemistry in Space, Springer, Heidelberg, pp. 207–275.Leinert, C., Richter, I., Pitz, E., and Planck, B.: 1981, Astron. Astrophys. 103, 177–188.Low, F. J., Beintema, D. A., Gautier, T. N., Gillette, F. C., Beichman, C. A., Neugebauer, G., Young,
E., Aumann, H. H., Boggess, N., Emerson, J. P., Habing, H. J., Hauser, M. G., Houck, J. R.,Rowan-Robinson, M., Soifer, B. T., Walker, R. G., and Wesselius, P. R.: 1984, Astrophys. J. 278,L19–L22.
McDonnell, J. A. M.: 1978, Microparticle studies for space instrumentation, in: McDonnell, J. A. M.(ed.), Cosmic Dust, Wiley and Sons, New York, p. 337.
McDonnell, J. A. M., Berg, O. E., and Richardson, F. F.: 1975, Planet. Space Sci. 23, 205–214.Melandso, F. and Havnes, O.: 1991, J. Geophys. Res. 96(A4), 5837–5845.

518 R. SRAMA ET AL.
Mendis, D. A., Hill, I. R., Houpis, H. L. F., and Whipple, E. C., 1981, Astrophys. J. 249, 787–797.Mendis, D. A., Hill, I. R., Ip, W.-H., Goertz, C. K., and Grun, E.: 1984, Electrodynamic processes
in the ring system of saturn, in: Gehrels, T., and Matthews, M. S. (eds.), Saturn, University ofArizona Press, Tuscon, p. 546.
Morfill, G. E., Grun, E., and Leinert, C.: 1986, The interaction of solid particles with the interplanetarymedium, in: Marsden, R. G. (ed.), The Sun and the Heliosphere in Three Dimensions, D. ReidelPublishing Co., Dordrecht, pp. 455–474.
Morfill, G. E., Havnes, O., and Goertz, C. K.: 1990(in preparation), Origin and maintenance of theoxygen torus in Saturn’s magnetosphere.
Mukai, T., Fechtig, H., Grun, E., and Giese, R. H.: 1989, Icarus 80, 254–266.Perkins, M. A., Simpson, J. A., and Tuzzolino, A. J.: 1985, Nucl. Instrum. Method A239, 310.Ratcliff, P., Gogu, F., Grun, E., and Srama, R.: 1996, Adv. Space Res. 17(12), 111–115.Reach, W. T., Franz, B. A., Weiland, J. L., Hauser, M. G., Kelsall, T. N., Wright, E. L., Rawley, G.,
Stemwedel, S. W., and Spiesmann, W. J.: 1995, Nature 374, 521–523.Schaffer, L. and Burns, J. A.: 1987, J. Geophys. Res. 92, 2264.Showalter, M. R., Burns, J. A., Cuzzi, J. N., and Pollack, J. B.: 1985, Nature 316, 526–528.Simpson, J. A., Rabinowitz, D., and Tuzzolino, A. J.: 1989, Nucl. Instrum. Methods A279, 611.Simpson, J. A. and Tuzzolino, A. J.: 1985, Nucl. Instrum. Methods A236, 187.Simpson, J. A. and Tuzzolino, A. J.: 1989, Nucl. Instrum. Methods A279, 625.Spahn, F., Thiessenhusen, K.-U., Colwel, J. E., and Srama, R.: 1999, J. Geophys. Res. 104, 24111–
24120.Srama, R. and Grun, E.: 1997, Adv. Space Res. 20(8), 1467–1470.Stubig, M., Schafer, G., Ho, T. M., Srama, R., and Grun, E.: 2001, Planet. Space Sci. 49(8), 853–858.Sutton, S. R. and Flynn, G. J.: 1988, ‘Stratospheric particles: Synchrotron X-ray fluorescence de-
termination of trace element contents’, in: Proceedings of the XVIII Lunar Planetary ScienceConference, Cambridge University Press, Cambridge, pp. 607–613.
Sykes, M. V. and Greenberg, R.: 1986, Icarus 65, 51–69.Thiessenhusen, K. U., Kruger, H., Spahn, F., and Grun, E.: 2000, Icarus 144(1), 89–91.Tiersch, H. and Notni, P.: 1989, Astron. Nachrich. 310(1), 67–78.Tuzzolino, A. J.: 1996, Adv. Space Res. 17(12), 123–132.Whipple, F. L.: 1967, ‘On maintaining the meteoritic complex’, in: Weinberg, J. L. (ed.), NASA
SP-150: The Zodiacal Light and the Interplanetary Medium, U.S. Government Printing Office,Washington, DC, pp. 409–426.
Whipple, F. L.: 1975, ‘Sources of interplanetary dust’, in: Elsasser, H., and Fechtig, H. (eds.), In-terplanetary Dust and Zodiacal Light, Lecture Notes in Physics, Vol. 48, Springer-Verlag, NewYork, pp. 403–415.
Wyatt, S. P.: 1969, Planet. Space Sci. 17, 155–171.Zook, H. A.: 1975, Planet. Space Sci. 23, 1391–1397.Zook, H.: 1980, ‘Evidence for ice meteoroids beyond 2 AU’, in: Halliday, I., and McIntosh, B. A.
(eds.), Solid Particles in the Solar System, D. Reidel, Dordrecht, Holland, pp. 375–380.Zook, H. A. and Berg, O. E.: 1975, Planet. Space Sci. 23, 183–203.Zook, H. A., Grun, E., Baguhl, M., Hamilton, D. P., Linkert, G., Liou, J.-C., Forsyth, R., and Phillips,
J. L.: 1996, Science 274, 1501–1503.