the case for consumer engagement in the funding of...
TRANSCRIPT

IAAHS 2007IAA Health Section Colloquium
13th – 16th May 2007CTICC
www.iaahs2007.com
The case for consumer engagement in the funding of healthcare
Adrian Gore, CEO Discovery

Agenda
1. Context
2. Discovery’s approach to healthcare funding
3. Does consumer engagement work? A data analysis

1. Context

South Africa has a large population, with disparate access to healthcare resources
Insured Uninsured Private sector Public sector
Healthcare spendingPopulation
40.5m 6.9m R75bn R59bn

VariableVariableVariable South Africa High Income Population*South Africa High South Africa High
Income Population*Income Population* United StatesUnited States
Household Income (USD at PPP)Household Income (USD at PPP) $44,977$44,977 $41,994$41,994
Possession of college / university degreePossession of college / university degree 66.7%66.7% 32.7%32.7%
Access to the internetAccess to the internet39.5%39.5% 59.6%59.6%
Own / rent a cellular telephoneOwn / rent a cellular telephone 94.6%94.6% 42.5%42.5%
Households with two or more motor vehiclesHouseholds with two or more motor vehicles
Access to digital satellite / digital cable TV at homeAccess to digital satellite / digital cable TV at home
60.2%60.2%
23.1%23.1%
55.5%55.5%
33.7%33.7%
Note: *High income population refers to the top 20% of earners; Most data points are estimates based on the most recently available informationSource: AMPS 2000; U.S. Census Bureau; Statistics SA
South Africa’s high-income population displays similar tendencies to US population

Healthcare funding models – who makes the choices?
Supply-sidecontrol
HospitalsPhysiciansMedical services
ContractsManaged careProtocolsNetworksDisease management
Demand-sidecontrol Patients
InformationEmpowering choices & doctor-patient relationships

The Medical Schemes Act legislates community-rating for premium determination
29(n) The terms and conditions applicable to the admission of a person as a member and his or her dependants, which terms and conditions shall
provide for the determination of contributions on the basis of income or the number of dependants or both the income and the number of dependants,
and shall not provide for any other grounds, including age, sex, past or present state of health, of the applicant or one or more of the applicant's dependants, the frequency of rendering of relevant health services to an applicant or one or more of the applicant's dependants other than for the
provisions as prescribed.
CHAPTER 5: RULES OF MEDICAL SCHEME
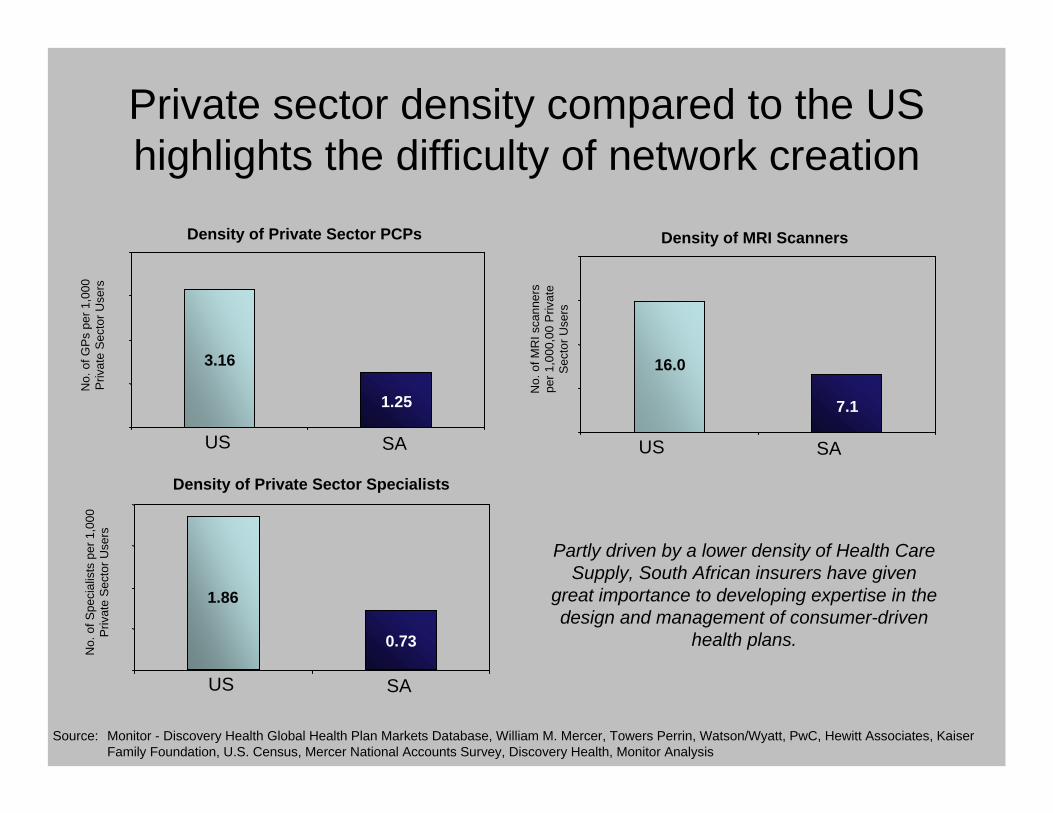
Source: Monitor - Discovery Health Global Health Plan Markets Database, William M. Mercer, Towers Perrin, Watson/Wyatt, PwC, Hewitt Associates, Kaiser Family Foundation, U.S. Census, Mercer National Accounts Survey, Discovery Health, Monitor Analysis
Density of Private Sector PCPs
No.
of G
Ps
per 1
,000
P
rivat
e S
ecto
r Use
rs
1.25
3.16
US SA
No.
of S
peci
alis
ts p
er 1
,000
Priv
ate
Sec
tor U
sers
Density of Private Sector Specialists
0.73
1.86
US SA
Density of MRI Scanners
No.
of M
RI s
cann
ers
per 1
,000
,00
Priv
ate
Sec
tor U
sers
7.1
16.0
US SA
Partly driven by a lower density of Health Care Supply, South African insurers have given
great importance to developing expertise in the design and management of consumer-driven
health plans.
Private sector density compared to the US highlights the difficulty of network creation

2.Discovery’s approach to healthcare funding – engaging the consumer in health and wellness

UncontrollableUncontrollable
ControllableControllable
Prevention and fitnessPrevention and fitness
CDH as a model solution
Triangle of healthcare utilization
Cost
Frequency
Health SavingsAccount
Health SavingsAccount
VitalityVitality
InsuredbenefitsInsuredbenefits
Discovery’s consumer-engaged model

Discovery currently covers over 2m lives on consumer-directed plans
0
500,000
1,000,000
1,500,000
2,000,000
1992 1993 1994 1995 1996 1997 1998 1999 2000 2001 2002 2003 2004 2005 2006
Covered lives as at 31 December

Manufacturing
ReligiousMiningGovernment Medical
AgricultureLeisure
EducationEntertainmentTransportation
Professionals
Engineering
Retail
Other
ServicesFinancial
Technology
1 to 10
11 to 50
51 to 100
101 to 500
501 to 1,000
Above 1,000
Member distribution by Industry
Member distribution by Group Size
Sample List of Discovery Clients
Diversity of Discovery’s membership

HSA limits consumer choice to areas where rational decisions can be made
Health SavingsAccount
Health SavingsAccount
InsuredbenefitsInsuredbenefits

Structure of the Vitality Wellness program

3. Does consumer engagement work?- A data analysis

Robust actuarial data set on which to conduct the analysis
Annual lapse rate
0.0%
1.0%
2.0%
3.0%
4.0%
2003 2004 2005 200660
70
80
90
100
110
120
2003 2004 2005 2006
Life months (millions)

Discovery’s membership base is typical of the overall insured population
Risk Equalisation Fund Impact
Source: Centre for Actuarial Research
0
5
10
15
20
25
30
35
40
<-50
%
-45%
-40%
-35%
-30%
-25%
-20%
-15%
-10% -5% 0% 5% 10%
15%
20%
25%
30%
35%
40%
45%
50%
>50%
REF Impact on Contributions
Num
ber o
f Sch
emes
(n=1
41)
Members pay moreMembers pay less
Discovery
-

Key questions
1. The effect of Health Savings Accounts
2. The effect of consumer-induced preventative care

The effect of Health Savings Accounts
1. Are HSA’s good for the healthy and sick?
2. Do people change their behaviour?
3. Is there an adverse effect on health?
4. Is there a point where HSA’s result in systemic changes to the health system?

Are HSA’s good for the healthy and sick?

Day-to-day expenditure analysis
Consumer driven plan Traditional plan
1 2 3 4 5 6 7 8 9 10 11 12 13 14 15 16 17 18 19 20Claims incurred (R’000s)
60%
70%
80%
90%
100%
110%
120%
130%
benefits/claims
1 2 3 4 5 6 7 8 9 10 11 12 13 14 15 16 17 18 19 20Claims incurred (R’000s)
60%
70%
80%
90%
100%
110%
120%
130%
benefits/claims
60%
70%
80%
90%
100%
110%
120%
130%
benefits/claims Members are
better off because of the use it or keep it model
Members are better off because benefits are largely unlimited
Cov
erag
e %
Level of sickness

Day-to-day expenditure analysis
Consumer driven planConsumer driven plan Traditional planTraditional plan
1 2 3 4 5 6 7 8 9 10 11 12 13 14 15 16 17 18 19 20Claims incurred (R’000s)
60%
70%
80%
90%
100%
110%
120%
130%
benefits/claims
1 2 3 4 5 6 7 8 9 10 11 12 13 14 15 16 17 18 19 20Claims incurred (R’000s)
60%
70%
80%
90%
100%
110%
120%
130%
benefits/claims
60%
70%
80%
90%
100%
110%
120%
130%
benefits/claims
Healthy ? Sick
Cov
erag
e %
Level of sickness

Impact on transient group
Longitudinal study of transient behaviour
Healthy Transient Sick
42% 22% 36%
Year
1
2
3
8%
37% 29%
3%
29% 40%
87% of initial transient group shift, meaning that the transient members are ultimately better off

Do people change their behaviour?

HSA limits consumer choice to areas where rational decisions can be made
Health SavingsAccount
Health SavingsAccount
InsuredbenefitsInsuredbenefits

Longitudinal study – Is the medical trend of services covered mainly by MSA’s under control?
Indexed Real PCP spend pmpm(Comprehensive Plans Only)
0.00
0.20
0.40
0.60
0.80
1.00
1.20
Total Exposure Considered: ±38.5m member months over 5.5 years* Real rate calculated by adjusting for CPI inflation as per Statistics SA
Yr 1 Yr 5.5

Indexed Real Pathology spend pmpm(Comprehensive Plans Only)
0.00
0.50
1.00
1.50
2.00
2.50
3.00
2000
01
2000
04
2000
07
2000
10
2001
01
2001
04
2001
07
2001
10
2002
01
2002
04
2002
07
2002
10
2003
01
2003
04
2003
07
2003
10
2004
01
2004
04
2004
07
2004
10
2005
01
2005
04
In-Hospital Out-of-Hospital
Indexed Real Physical Therapy spend pmpm(Comprehensive Plans Only)
0.00
0.50
1.00
1.50
2.00
2.50
3.00
3.50
4.00
2000
01
2000
04
2000
07
2000
10
2001
01
2001
04
2001
07
2001
10
2002
01
2002
04
2002
07
2002
10
2003
01
2003
04
2003
07
2003
10
2004
01
2004
04
2004
07
2004
10
2005
01
2005
04
Total Exposure Considered: ±38.5m member months over 5.5 years* Real rate calculated by adjusting for CPI inflation as per Statistics SA
Longitudinal study – Long-term medical trend of pathology and physical therapy services
In-Hospital Out-of-Hospital
Yr 1 Yr 5.5 Yr 1 Yr 5.5

0%
10%
20%
30%
40%
50%
60%
70%
80%
90%
100%
Dermatologists Dieticians Homeopaths Physical Therapists
Insured benefit
Funded from MSA
Rel
ativ
e co
sts
per m
embe
r per
mon
th
21% reduction
30% reduction
24% reduction
40% reduction
21% to 40% increase in medical practitioner spend when funded from the insured benefit

Case study 1: Impact on Hormone Replacement Therapy Spend
0
0.1
0.2
0.3
0.4
0.5
0.6
0.7
0.8Ja
n-99
Mar
-99
May
-99
Jul-9
9
Sep-
99
Nov
-99
Jan-
00
Mar
-00
May
-00
Jul-0
0
Sep-
00
Nov
-00
Am
ount
pai
d pe
r mem
ber
per m
onth
(Ran
ds)
Covered from Savings Account
Covered from Insured Chronic Benefit

Case study 2: Impact on Attention Deficit Disorder Spend
Ritalin - average claims
0
50
100
150
200
250
Jan-
99
Mar
-99
May
-99
Jul-9
9
Sep-
99
Nov
-99
Jan-
00
Mar
-00
May
-00
Jul-0
0
Sep-
00
Nov
-00
Act
ual s
pend
Paid from Insured chronic benefitPaid from Savings Account

MRI - In Hospital Relative Utilisations
0.00
0.25
0.50
0.75
1.00
1.25
1.50
Q1-
2000
Q2-
2000
Q3-
2000
Q4-
2000
Q1-
2001
Q2-
2001
Q3-
2001
Q4-
2001
Q1-
2002
Q2-
2002
Q3-
2002
Q4-
2002
Q1-
2003
Q2-
2003
Q3-
2003
Q4-
2003
Q1-
2004
Q2-
2004
Q3-
2004
Q4-
2004
Q1-
2005
Q2-
2005
Co-
paym
ent r
emov
ed
Case study: Impact of consumer-driven healthcare in curbing in-hospital MRI utilisation

Is there an adverse effect on health?

Longitudinal study – Does the hospital admit rate increase with duration on the CDHC Plan?
0
20
40
60
80
100
120
2002 2003 2004 2005 2006
Yr of joining 2nd calendar year 3rd calendar year 4th calendar year 5th calendar year > 5 calendar years
Relative Hospital Events per 1000 members per month (Comprehensive Plans, 2nd Year Claims = 100)
No evidence of negative longer-term health implications

Longitudinal study – Hospital admit rates for chronic and non-chronic members
Admit Rate for Comprehensive plansby Duration - Chronic
0
20
40
60
80
100
120
2002 2003 2004 2005 2006 2002 2003 2004 2005 20060
20
40
60
80
100
120
Yr of joining 2nd calendar year 3rd calendar year 4th calendar year 5th calendar year > 5 calendar years
Admit Rate for Comprehensive plansby Duration – Non-chronic

Longitudinal study – Hospital admit rates for diabetic members
Admit Rate For Diabetic Members
50
60
70
80
90
100
110
120
2002 2003 2004 2005 2006
Yr of joining 2nd calendar year 3rd calendar year 4th calendar year 5th calendar year > 5 calendar years

Is there a point where HSA’s result in systemic changes to the health system?

Penetration of plans with HSA’s
*Estimated using HSA premiums as % of Total as per the Council of Medical Schemes Reports
Estimated market share of plans with HSAs *
0%
10%
20%
30%
40%
50%
60%
70%
80%
1998 1999 2000 2001 2002 2003 2004

Growth in medicine prices – consumers are able to influence price
OH Medicine - AcuteIH Drugs
Trend in Real Medicine Price Over Time
60
70
80
90
100
110
120
Feb-
01
May
-01
Aug
-01
Nov
-01
Feb-
02
May
-02
Aug
-02
Nov
-02
Feb-
03
May
-03
Aug
-03
Nov
-03
Feb-
04
May
-04
Aug
-04
Nov
-04
Feb-
05
May
-05
Medicine Pricing
Regulations

The effect of Health Savings Accounts
1. Are HSA’s good for the healthy and sick?
2. Do people change their behaviour?
3. Is there an adverse effect on health?
4. Is there a point where HSA’s result in systemic changes to the health system?

The effect of consumer-induced preventative care
1. Do people respond to incentives in preventative care?
2. Does a properly structured preventative care program impact on healthcare costs?
3. Is selection more important than behaviour?

Structure of the Vitality Wellness program

Do people respond to incentives in preventative care?

Vitality membership exceeds 1.2m members
0
500,000
1,000,000
1,500,000
2,000,000
2,500,000
1999 2000 2001 2002 2003 2004 2005 2006
Vitality lives Covered lives

Vitality has materially impacted the quantum of preventative care sought
0%
20%
40%
60%
80%
100%
120%
140%
160%
180%
Prostatescreening
Cholesterolscreening (male)
Cholesterolscreening(female)
Mammograms Pap smears
Non-Vitality

Does a properly structured preventative care program impact on healthcare costs?

Do members at higher statuses have lower claims? Correlation between Vitality Status and
hospital admissions
50
60
70
80
90
100
Blue Bronze Silver GoldNon-Vitality
Non-Vitality

How Big are the Savings?
0%
50%
100%
150%
200%
GP consultations
Specialist consultations
Prescribed medication scripts
Hospital admissions
Tota
l cla
ims:
Blu
e Vi
talit
y m
embe
rs a
s a
% o
f br
onze
and
abo
ve m
embe
rs
Engaged Vitality member benchmark – Bronze and above
members

How Big are the Savings?
84%
86%
88%
90%
92%
94%
96%
98%
100%
Increase in engagement
10%
3.5%
20%
7%
30%
11%Percentage of current spend
on GP and specialist
consultations, medication
and hospitals
Current spend levels on GP and specialist
consultations, medication and hospitals

Is selection more important than behaviour?

Higher Vitality engagement amongst members with chronic illness
0%
10%
20%
30%
40%
50%
60%
<30 30-44 45-59 60+
Bronze and above Vitality participants All members
Chronic condition rate – family size of 3
Chr
onic
dis
ease
pre
vale
nce

Is the effect of moving through the statuses that results in lower claims? Longitudinal comparison of
common group who subsequently diverged
1998 1999 2000 2001 2002 2003
Members who upgraded one or more statuses
Control group: Members who remained on Blue
Common base period of inactivity (Blue status)
3m life months
208,431 entrants in 1998
5.7m life months
664,595 life months

Is the effect of moving through the statuses that results in lower claims? Longitudinal comparison of
common group who subsequently diverged
* Those on Blue 1998-2001 who subsequently changed status relative to those who remained on Blue
1998 1999 2000 2001 2002 20030.80
0.85
0.90
0.95
1.00
1.05
1.10
Chr
onic
PLP
M re
lativ
e to
con
trol
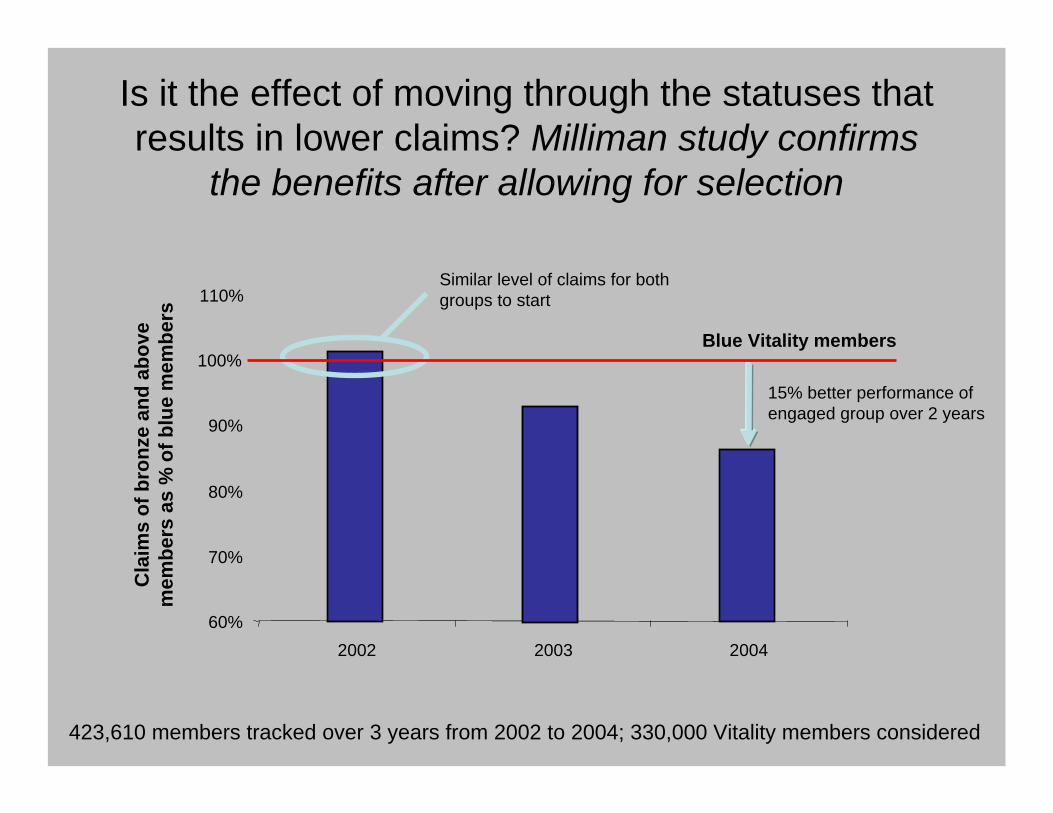
Is it the effect of moving through the statuses that results in lower claims? Milliman study confirms
the benefits after allowing for selection
60%
70%
80%
90%
100%
110%
20032002 2004
Cla
ims
of b
ronz
e an
d ab
ove
mem
bers
as
% o
f blu
e m
embe
rs
Blue Vitality members
15% better performance of engaged group over 2 years
Similar level of claims for both groups to start
423,610 members tracked over 3 years from 2002 to 2004; 330,000 Vitality members considered

The effect of consumer-induced preventative care
1. Do people respond to incentives in preventative care?
2. Does a properly structured preventative care program impact on healthcare costs?
3. Is selection more important than behaviour?

Key questions
The effect of Health Savings Accounts:1. Are HSA’s good for the healthy and sick?2. Do people change their behaviour?3. Is there an adverse effect on health?4. Is there a point where HSA’s result in systemic changes to the health
system?
The effect of preventative care:1. Do people respond to incentives in preventative care?2. Does a properly structured preventative care program impact on
healthcare costs?3. Is selection more important than behaviour?

Questions?

IAAHS 2007IAA Health Section Colloquium
13th – 16th May 2007CTICC
www.iaahs2007.com
The case for consumer engagement in the funding of healthcare
Adrian Gore, CEO Discovery