the capacity of sensory hyperalgesia, hypersensitivity and
TRANSCRIPT

THE CAPACITY OF SENSORY
HYPERALGESIA, HYPERSENSITIVITY
AND HYPOAESTHESIA TO
DISCRIMINATE CHRONIC WHIPLASH
ASSOCIATED DISORDERS II FROM
HEALTHY INDIVIDUALS
by
Kennedy O. Edeni
A Thesis submitted to The University of Birmingham
For the degree of Master of Philosophy
School of Health and Population Sciences The University of Birmingham 16th December, 2011

University of Birmingham Research Archive
e-theses repository This unpublished thesis/dissertation is copyright of the author and/or third parties. The intellectual property rights of the author or third parties in respect of this work are as defined by The Copyright Designs and Patents Act 1988 or as modified by any successor legislation. Any use made of information contained in this thesis/dissertation must be in accordance with that legislation and must be properly acknowledged. Further distribution or reproduction in any format is prohibited without the permission of the copyright holder.

ABSTRACT
Background
The increasing incidence of chronic whiplash associated disorders II [CWAD II] has been
attributed to poor understanding of its predominant mechanisms. Documented impairments
of sensory hypersensitivity and hypoaesthesia reflect a disordered nervous system acting as
triggers for symptoms. Some impairments are discriminative of CWAD II, although gender
bias, non-inclusion of a widely-used sensory test [upper limb neurodynamic test (ULNT)],
and conflicting findings necessitated further study.
Methods
Review of the literature identified 11 sensory tests used to discriminate CWAD II from
healthy individuals. The measurement properties of the tests supported preliminary reliability
studies of dynamic ultrasound imaging to inform the construct validity of the ULNT, prior to
its inclusion in a cross-sectional discriminative study comparing CWAD II (n=22) and
healthy participants (n=36).
Data analysis
Factor analysis (Eigen value ≥1) and logistic regression
Results
The CWAD II participants reported mild pain, disability, psychological stress, and no
neuropathic pain. Three factors of hyperalgesia, hypoaesthesia and hypersensitivity were
generated. Logistic regression using the factors did not discriminate between the groups
(p>0.05).
Conclusion
Sensory impairments exist in CWAD II, but were unable to discriminate a low severity
population using 4 sensory tests. The findings support further investigation using additional
tests as they emerge from the literature.

DEDICATION
The thesis is dedicated to my wife, Mrs Helen Edeni and our children for their physical,
spiritual, financial and moral support, all of which contributed to the successful completion
of this work.
ACKNOWLEDGMENTS
My first and utmost gratitude goes to the Almighty God for inspiring and guarding me
through the challenges of this research journey. The relentless prayers and advice and moral
support provided by my parents, Mr and Mrs E.I Edeni, Mr and Mrs Onwudiwe, Mr and Mrs
Geovani Edeni, and all my siblings is worth mentioning and appreciating. Also, the immense
support received from Mr and Mrs Fidelis Idumebor and the entire Idumebor clan is
priceless.
I would like to acknowledge the financial support received in the form of a research
studentship from Nursing and Physiotherapy department, School of Health and Population
Sciences, College of Medicine and Dentistry, University of Birmingham. The invaluable
contributions of my supervision team, Dr. Alison Rushton, Mrs Christine Wright have
without doubt, transformed a dream into a visible, tangible reality. Special recognition and
appreciation goes to Dr. Martin Lakie for his numerous and timely suggestions as well as
granting access to the DUI scanner that was used throughout the duration of the research. Dr
Jane Greening and Dr Andrew Dilley are appreciated for their expert advice with regards to
the DUI image analysis program that was used throughout the lifespan of the research study.
Other academic and administrative staff within and outside the university community, too
numerous to mention, equally deserve my appreciation. In particular, Dr. Andy Soundy,
Christina Anderson, Dr Susan Kelly, Dr Caroline Roskell, Nichola Henegan, Prof. Collette,
and Michelle Arnold have made valuable contributions at different time points during the
research adventure that has helped to complete this thesis. I also would like to appreciate
colleagues who contributed to equipment set-up, participant recruitment, and data collection.

They include Nazim Farouk, Riyaz Mohammed, Harald Ringdal, Stefanos Keranasios,
Sandra Agyapong-Badu, Harry Mobberley, Krishna and Kerstin. Without their contribution,
the research journey would have halted.
The contributions of members of Deeper Life Bible Church, including Dr and Mrs Adedeji,
Dr and Mrs Ademosu, Dr and Mrs Areje, Mr and Mrs Oladele, Mr and Mrs Olawepo, Mr
and Mrs Oluwi, Mr and Mrs Rotibi, Mr and Mrs Akinwale is greatly appreciated. Members
of Deeper Life Campus Fellowship, Birmingham and the West Midlands equally deserve my
heartfelt appreciation.
Thank you all for contributing to this research work. May the Almighty God bless you
richly, Amen.

Table of Contents
Chapter 1: Introduction ........................................................................................................1
1.1 Background to WAD....................................................................................................1
1.2 Incidence and coat associated with WAD......................................................................4
1.3 Classification of WAD ..................................................................................................5
1.4 QTF classification of WAD..........................................................................................7
1.5 Mechanism based classification of CWAD..................................................................8
1.6 Sensory impairments in CWAD.................................................................................10
1.7 Aim of study ......................................................................................................12
1.8 Importance of study ...........................................................................................12
1.9 Structure of the thesis .........................................................................................12
1.10 Chapter Conclusions .................................................................................................13

Chapter 2: Literature review.....................................................................................................15
2.1 Introduction ........................................................................................................................15
2.2 Background to CWAD.......................................................................................................17
2.2.1 Defifintition of CWAD....................................................................................................17
2.2.2 Prevalence and economic costs of WAD........................................................................18
2.2.3 Classification of WAD ...................................................................................................19
2.2.3 A Classification based on severity of symptoms and signs ...........................................20
2.2.3 B Classisfication based on duration of of WAD ............................................................20
2.2.3 C Classification based on mechanisms in CWAD .........................................................22
2.2.4 Sensory impairments in CWAD .....................................................................................24
2.2.4A Hypersensitivity in CWAD .........................................................................................25
2.2.4B Hypoaesthesia in CWAD .............................................................................................26
2.2.5 Physiological changes that underlie sensory impairments in CWAD............................27
2.2.6 Methods for evaluating sensory impaiments in CWAD ................................................29
2.3 Review of the CWAD literature to identify sensory impairments ...................................32
2.3.1 Purpose of the literature review ......................................................................................32
2.3.2 Search strategy . ..............................................................................................................32
2.3.3 Search sources .................................................................................................................32
2.3.4 Search terms ....................................................................................................................33
2.3.5 Eligibility criteria ............................................................................................................36
2.3.6 Articles generated from the literature search strategy ....................................................37
2.3.7 Evalaution of the quality of eligible articles using GRADE appraisal tool ...................38

2.4 Level of evidence for impairments in CWAD II ..............................................................41
2.4.1 Sensory impirments in CWAD II ...................................................................................42
2.4.1 A Widespread lowered PPT …………….......................................................................49
2.4.1.A (i) Measurement properties of tools to evaluate PPT .................................................51
2.4.1.B Widespread lowered CPT ………...............................................................................52
2.4.1.B (i) Measurement properties of tools to evaluate CPT ................................................54
2.4.1.C Widespread elevated VDT ……….............................................................................55
2.4.1.C (i) Measuremement properties of tools to evaluate VDT ..........................................56
2.4.1.D Increased sensory response to passive mechanical stretch ........................................56
2.4.1.D (i) Measurement properties of ULNT ............................... ........................................58
Dynamic ultrasound imaging ..................................................................................................60
2.5 Conclusions from the literature review .............................................................................66
2.6 Chapter summary ...............................................................................................................68

Chapter 3: Inter-rater reliability of the measurement of nerve movement in CWAD II using
dynamic ultrasound imaging (DUI) ………………………………………..………………70
3.1 Background ........................................................................................................................70
Reliability of DUI measurements ............................................................................................71
3.2 Aims and objectives ...........................................................................................................72
3.2.1 Aim of study ...................................................................................................................72
3.2.2 Objectives of study..........................................................................................................72
3.3 Method ...............................................................................................................................73
3.3.1 Design .................................................................... ...................................... ..................73
3.3.2 Participants .......................................................................... .......................................... 73
3.3.3 Eligibility criteria ............................................................................................................74
3.3.4 Ethical considerations .....................................................................................................75
3.3.5 Raters ………..................................................................................................................75
3.3.6 Recruitment strategy .......................................................................................................76
3.3.7 Data collection ................................................................................................................76
A. Health questionnaire and neurological examination ..........................................................76
B. Nerve image capture equipment ........................................................................................76
C. DUI transducer position ......................................................................................................77
D. Participant position .............................................................................................................77
E. Image Capture by raters…...................................................................................................79
F. Image analysis by raters…...................................................................................................79
(i) Analysis of LM images .......................................................................................................79

(ii) Analysis of TM images .....................................................................................................82
3.4 Statistical analysis ..............................................................................................................84
3.4.1 Intra-class correlation coefficient ...................................................................................84
3.4.2 The 95% Confidence interval .........................................................................................85
3.4.3 Standard error of measurement ......................................................................................86
3.4.4 Minimum detectable change ...........................................................................................86
3.4.5 Coefficient of variation ...................................................................................................87
3.5 Results ................................................................................................................................87
3.5.1 Median and ulnar nerve TM ...........................................................................................88
3.5.2 Median and ulnar nerve LM ..........................................................................................90
3.6 Discussion ..........................................................................................................................91
3.6.1 Median and ulnar nerve TM ...........................................................................................92
A. Issues associated with DUI image capture ........................................................................93
B. Issues associated with DUI image analysis .......................................................................94
3.6.2 Median and ulnar nerve LM ...........................................................................................95
A. Issues associated with DUI image capture ........................................................................96
B. Issues associated with DUI image analysis........................................................................98
3.7 Chapter conclusions .........................................................................................................100

Chapter 4 : A re-analysis of nerve images to investigate sources of error within DUI image
capture and image analysis using inter-image capture and inter-image analysis methods...102
4.1 Background ......................................................................................................................102
4.2 Aim ...................................................................................................................................103
4.3 Method .............................................................................................................................103
4.3.1 Design ...........................................................................................................................103
4.3.2 Physiotherapists involved in the re-analysis of nerve images ….................................104
4.3.3Image analysis program .................................................................................................103
4.4 Statistical analysis ............................................................................................................104
4.5 Results ..............................................................................................................................104
4.5.1 DUI image capture ........................................................................................................105
A. Median and ulnar nerve TM .............................................................................................105
B. Median nerve and ulnar nerve LM ...................................................................................107
4.5.2 DUI image analysis .......................................................................................................108
A. Median and ulnar nerve TM .............................................................................................108
B. Median and ulnar nerve LM .............................................................................................110
4.6 Discussion ........................................................................................................................112
4.6.1 DUI image capture ........................................................................................................112
A. Median and ulnar nerve TM..............................................................................................112
B. Median and ulnar nerve LM .............................................................................................113
C. Measurement issues associated with image capture ........................................................113
4.6.2 DUI image analysis ......................................................................................................114

A. Median and ulnar nerve TM .............................................................................................114
B. Median and ulnar nerve LM .............................................................................................115
C. Measurement issues associated with image analysis
........................................................116
4.7 Chapter conclusions .........................................................................................................118

Chapter 5: An evaluation of inter-rater reliability and construct validity of superficial fascia
and bone movement as representative of DUI transducer motion ……………….…..........120
5.1 Background ......................................................................................................................120
5.2 Aim ...................................................................................................................................121
5.3 Method .............................................................................................................................122
5.3.1 Design ...........................................................................................................................122
5.3.2 Physiotherapists involved in the re-analysis of nerve images ….................................123
5.3.3 Image analysis program and protocol ..........................................................................123
5.4 Statistical analysis ............................................................................................................123
5.5 Results ..............................................................................................................................123
5.5.1 Inter-rater reliability of nerve estimates comparing bone and superficial fascia .........123
5.5.2 Construct validity comparing estimates from bone and superficial fascia to a fixed DUI
transducer ........................................................................................................................... ...125
5.6 Discussion.........................................................................................................................126
5.6.1 Inter-rater reliability of nerve estimates comparing bone and superficial fascia .........126
5.6.2 Construct validity comparing estimates from bone and superficial fascia to a fixed DUI
transducer ...............................................................................................................................128
5.7 Chapter conclusions .........................................................................................................128
Chapter 6: Intra-rater reliability of DUI method of computing median nerve longitudinal
movement in CWAD II …….................................................................................................130
6.1Background .......................................................................................................................130
6.2 Aim ........... .......................................................................................................................132
6.3 Methodology ....................................................................................................................132
6.3.1Design ............................................................................................................................132
6.3.2 Participants ...................................................................................................................133
6.3.3 Inclusion and exclusion criteria ....................................................................................103
6.3.4 Ethical considerations ...................................................................................................133
6.3.5 Recruitment strategy .....................................................................................................133
6.3.6 Rater ...................... .......................................................................................................133
6.4 Data collection .................................................................................................................134
6.4.1 Health questionnaire and neurological examination ....................................................134
6.4.2 Participant position for nerve movement ....................................................................134
6.4.3 Image analysis ...............................................................................................................134
6.5 Statistical analysis ............................................................................................................135
6.6 Results ..............................................................................................................................135
6.7 Discussion ........................................................................................................................136
6.8 Chapter conclusions .........................................................................................................137

Chapter 7: Construct validity of ULNT 1 using median nerve longitudinal movement, elbow
extension ROM, pain response, and Brachialis muscle activity in CWAD II ……..139
7.1Background .......................................................................................................................139
7.2 Aim of study …................................................................................................................141
7.3 Methodology ....................................................................................................................141
7.3.1Design ............................................................................................................................141
7.3.2 Participants ...................................................................................................................141
7.3.3 Inclusion and exclusion criteria ....................................................................................142
7.3.4 Ethical considerations ...................................................................................................142
7.3.5 Recruitment strategy .....................................................................................................142
7.3.6 Rater ...................... .......................................................................................................142
7.3.7 Testing protocol ..... ......................................................................................................143
7.3.8 Data collection ..............................................................................................................143
7.4 Data analysis ....................................................................................................................145
7.5 Statistical analysis ............................................................................................................147
7.6 Results ..............................................................................................................................147
7.7 Discussion ........................................................................................................................148
7.8 Chaper conclusions ..........................................................................................................151

Chapter 8: Sensory Hyperalgesia, Hypersensitivity and Hypoaesthesia to Discriminate
CWAD II from Healthy individuals……………………………………………………….153
8.1Background .......................................................................................................................153
8.1.1 Psychological impairments in CWAD II .....................................................................155
I. Imapct of event scale...........................................................................................................156
8.1.2 Pain and diasbility associated with sensory impairments in CWAD II .......................157
A. Neck Disability index .......................................................................................................158
B. Whiplash Disability Questionnaire....................................................................................158
C. Self-report version of the Leeds Assessment of Neuropathic Symptoms and Pain Scale
………………………………………………………………………………………….....158
8.2 Aim ........... .......................................................................................................................160
8.3 Methodology ....................................................................................................................160
8.3.1Design ........................................................................................................................... 160
8.3.2 Participants ...................................................................................................................160
8.3.3 Inclusion and exclusion criteria ....................................................................................161
8.3.4 Ethical considerations ...................................................................................................161
8.3.5 Recruitment strategy .....................................................................................................161
8.3.6 Researchers involved in data collection ……...............................................................161
8.3.7 Testing protocol ..... ......................................................................................................161
A. Health questionnaire and neurological examination ........................................................161
B. Participant position, testing sites and equipments ............................................................162
8.4 Data analysis ....................................................................................................................169

8.4.1 Descriptive statistics.............. ................ ...................................................................169
8.4.2 Factor analysis .............................................................................................................169
8.4.3 Logistic regression .......................................................................................................170
8.5 Results ..............................................................................................................................171
8.5.1 Description of physical characteristics of CWAD II and healthy individuals ………171
8.5.2 Pain, disability and psychological characteristics of CWAD II participants................172
8.5.3 Factor analysis and logistic regression results..............................................................173
8.6 Discussion ........................................................................................................................177
8.7 Chapter conclusions .........................................................................................................180
Chapter 9: Discussion ............................................................................................................181
9.1 Background (Chapters 1 and 2)...................................................................................184
9.2 Chapter 3 ..........................................................................................................................186
9.3 Chapter 4 ..........................................................................................................................187
9.4 Chapter 5 ..........................................................................................................................188
9.5 Chapter 6 ..........................................................................................................................189
9.6 Chapter 7 ..........................................................................................................................190
9.7 Chapter 8 ..........................................................................................................................193
9.8 Limitation of study ...........................................................................................................196
9.9 Recommendations for future studies ...............................................................................197

Chapter 10 Thesis conclusions ..............................................................................................198
Appendices ………………………………………………………….…………………….199

LIST OF ILLUSTRATIONS
Figure 1.1 Biopsychosocial model of health and illness............................................................9
Figure 1.2 ICF classification of health and functioning.............................................................9
Figure 1.1 Biopsychosocial model of health and illness............................................................9
Figure 2.1 Descriptive statistics of bar chart depicting UK motor insurance claims in
2007………………………………………………………………………………………...19
Figure 2.2 Timescale used to classify WAD ……...................................................................21
Figure 2.3 ICF classification of health and functioning …………….....................................24
Figure 2.4 Schematic representation of impairments in CWAD II using ICF domains ........30
Figure 2.5 Schematic description of pathway for peripheral and central sensitisation ..........31
Figure 2.6 Articles generated from the search strategy ..........................................................38
Figure 2.7 Schematic representation of GRADE appraisal tool .............................................41
Figure 2.8 Theorised components underlying ULNT ……….................................................59
Figure 2.9 Schematic representation of studies undertaken in the thesis …...........................69
Figure 3.1(A) Arm starting position for median and ulnar nerve…........................................78
Figure 3.1(B) Nerve movement image capture using DUI during passive contralateral neck
side flexion …………………………………………………………………………………78
Figure 3.2 (A) Four boxes are placed within the nerve ….......................................................80
Figure 3.1(B) Two boxes are placed over bone used as reference to compare the nerve
movement against …………………………………………………………………….……80

Figure 3.3 The image analysis template developed to improve consistency of box sizes and
position used during offline analysis of LM …………………….......................................... 81
Figure 3.4 (A) Positions of markers used to generate movement coordinates for TM during
image analysis ……………………………………………………..…................................. 83
Figure 3.4 (B) Excel WhipTrans program used to compare changes in the coordinates of
markers between pre and post CNSF TM images …………………..…............................... 83
Figure 3.5 (A - C) Descriptive illustration of reliability across three raters, mean of three
repeat computations of median and ulnar TM of n=18 CWAD ii participants ..................... 89
Figure 3.6 (A - B) Descriptive illustration of reliability across three raters mean of three
repeat computations of median and ulnar TM of n=18 CWAD ii participants ..................... 91
Figure 4.1 (A - C) Scatter plot depicting inter-rater image capture reliability for each of 3
physiotherapists acquired n=18 median and ulnar nerve TM images .......………………...106
Figure 4.2 (A - B) Scatter plot depicting inter-rater image capture reliability for each of 3
physiotherapists analysis of n=18 median and ulnar nerve LM images …….......................103
Figure 4.3 (A - B) Scatter plot depicting inter-rater image analysis reliability for 3
physiotherapists analysis of n=18 median and ulnar nerve TM images …...........................110
Figure 4.4 (A - B) Scatter plot depicting inter-rater image analysis reliability for 3
physiotherapists analysis of n=18 median and ulnar nerve LM images …...........................111
Figure 5.1 (A) Description of reliability across median nerve LM computed from each of 3
physiotherapists acquired n=18 DUI images using superficial fascia as background tissue
…………………………………………………………………………………………….124

Figure 5.1 (B) Description of reliability across median nerve LM estimates computed from
each of 3 physiotherapists acquired n=18 DUI images using bone as background tissue ...124
Figure 5.2 Descriptive representation of frame by frame estimates of mean cummulative
movement of median nerve, bone and superficial in 22 nerve movement images …….….125
Figure 5.2 Descriptive representation of frame by frame estimates of mean cummulative
movement of median nerve, bone and superficial in 22 nerve movement images …….….125
Figure 6.1 Descriptive presentation of median nerve LM computed from 2 set of n=22 DUI
images ……………………………………………………………………………….........135
Figure 7.1 (A) DUI scanner and transducer …......................................................................146
Figure 7.1 (B) EMG equipment set up ……..........................................................................146
Figure 7.1 (C) ULNT arm starting position with transducer and EMG electrode at the mid-
forearm and distal third of arm respectively……………......................................................146
Figure 7.1 (D) ULNT 1 arm ending position with transducer, EMG electrode and goniometry
measurement ……………………………….........................................................................146
Figure 8.1 Diagram illustrating relationship of pain, psychological imapirment and disability
…………………………………………………………………………………………….157
Figure 8.2 Equipment setup for sensory discrimination study……....…………………….164
Figure 8.3 CPT testing using the thermotest's thermode over 3 sites ……….…………….165
Figure 8.4 PPT testing using the algometer over 3 sites ………………….……………….166
Figure 8.5 VDT testing using the tuning fork over 3 sites …………………………..…….167
Figure 8.6 ULNT 1 testing …………….………………………………………………….168

Figure 8.7 Scree plot of Eigen values for factors generated from the factor analysis on 11
sensory outcome measures ………………………………………………………….…….168

LIST OF TABLES
Table 1.1 The QTF classification of WAD ...............................................................................7
Table 2.1 Search terms used within each POS components ……….......................................34
Table 2.2 Study characteristics of 30 articles from 23 cohorts indicating presence of sensory
impairments in CWAD II population ………..........................................................................43
Table 2.3 Conflicting estimates of median nerve TM ……………........................................62
Table 2.4 Conflicting estimates of median nerve LM …........................................................62
Table 2.5 DUI reliability studies of median nerve LM ….......................................................65
Table 3.1 Reliability between each rater 3 repeated analysis of n=18 CWAD II median and
ulnar nerve images using the image analysis template ...........................................................82
Table 3.2 Inter-rater reliability across three raters mean of three repeat computation of
median and ulnar TM of n=18 CWAD II participants ……....................................................88
Table 3.3 Inter-rater reliability across three raters mean of three repeat computation of
median and ulnar LM of n=18 CWAD II participants …………...........................................90
Table 4.1 Inter-rater image capture reliability for each of 3 physiotherapists acquired n=18
median and ulnar TM images ................................................................................................105
Table 4.2 Inter-rater image capture reliability for each of 3 physiotherapists acquired n=18
median and ulnar LM images ................................................................................................107
Table 4.3 Inter-rater image analysis reliability for 3 physiotherapists analysis of n=18 median
and ulnar TM images .............................................................................................................109

Table 4.4 Inter-rater image analysis reliability for 3 physiotherapists analysis of n=18 median
and ulnar LM images .............................................................................................................111
Table 5.1 Inter-rater reliability of median nerve LM estimates computed by 1 physiotherapist
analysis of each of three physiotherapists acquired n=18 images using bone and superficial
fascia as background tissue ………………………………………………………………124
Table 6.1 Intra-rater reliability of median nerve LM during elbow extension in n=22 CWAD
II participants …….……………………………………………………………………….135
Table 7.1 Mean, standard deviation and Pearson r for the ULNT 1 test components studied
…………………………………………………………………..………………………...148
Table 8.1 Characteristics of study participants (n=54), by Group ………............................172
Table 8.2 Symptom profile of CWAD II participants (n=22) …….…….............................173
Table 8.3 Sensory outcome variables, by Group …………………..…................................174
Table 8.4 Factor analysis on 11 sensory outcome measures (n=54): un-rotated and rotated
loadings …………………………………………………………….…..............................176
Table 8.5 Interpreting the three main components: loadings against each sensory outcome in
the rotated 3-factor model (n=54) ………………………………….…...............................176
Table 8.6 Results from the logistic regression of group (CWAD II, Healthy) on the three
sensory factors (Hyperalgesia, hypoaesthesia and hypersensitivity) …................................177
Table 8.7 Classification of cases (CWAD II and healthy particpants) using the best fit
logistic regression model …………………………………………………………….........177

LIST OF ABBREVIATIONS
CTS - Carpal Tunnel Syndrome
CNS - Central nervous system
CRD - Centre for reviews and dissemination
CSP - Chatered Society of Physiotherapist
CWAD - Chronic whiplash associated disorder
CPT - Cold pain threshold
CV - Coefficient of variation
CNSF - Contralateral neck side flexion
DUI - Dynamic ultrasound imaging
EDT - Electrical detection threshold
EMG - Electromyography
EFA - Exploaratory factor analysis
GHQ - General health questionnaire
GRADE - Grading of recommendations, assessment, development and evaluation
HPT - Heat pain threshold
ICF - International Classification of Health and Functioning
ICC - Intraclass correlation coefficient
IES - Impact of event scale
INP - Idiopathic neck pain
LANSS - Leeds assessment of neuropathic symptoms and signs

LM - Longitudinal movement of nerve
MeSH - Medical subject headings
MDC - Minimum detectable change
MSK - Musculoskeletal
NSF - National service frame work for long-term neurological conditions
NHS - National Health Service
NDI - Neck disability index
NSAP - Non-specific arm pain
PICOS - Participant, Intervention, Comparator, Outcomes, Study design
PIS - Participant information sheet
PNS - Peripheral nervous system
PEDro - Physiotherapy evidence-base database
PTSD - Post trasumatic stress disorder
PRISMA - Preferred reporting items for systematic reviews and meta-analyses
PPT - Pressure pain thresholds
QST - Quantitative sensory testing
QTF - Quebec Task Force
RCT - Randomised controlled trial
ROM - Range of motion
SEM - Standard error of measurement
SF 36 - Short form 36
SIGN - Scottish intercollegiate guidelines network

SLANNS - Self reported version of Leeds assessment of neuropathic symptoms and signs
TSK - Tampa scale of kinesiophobia
TPT - Thermal pain threshold
TM - Transverse movement of nerve
UK - United Kingdom
ULNT - Upper limb neurodynamic test
VDT - Vibration detection thresholds
WAD - Whiplash associated disorder
WDQ - Whiplash disability questionnaire
WSD - Within-subject standard deviation
WHO - World Health Organisation
C H A P T E R O N E
INTRODUCTION
1.1 Background to Chronic Whiplash Associated Disorders
Chronic whiplash associated disorders (CWAD) describes the group of signs and symptoms
that are present 6 months after a whiplash injury. The incidence of CWAD has progressively
increased over the last 30 years, despite a fall in road traffic accidents, substantial CWAD
research and evidence-guided physiotherapy treatment intervention (Cote et al., 2001, 2005;
Ottoson, 2005). The increased incidence might reflect limitations of present understanding of
underlying mechanisms for the range of symptoms and impairments reported in CWAD (Jull
et al., 2007), with the implication that the rationale to inform use of tests to evaluate
underlying mechanisms in a clinical setting is limited. Further research is therefore merited
to develop understanding of CWAD impairments to guide clinical assessment decisions,
particularly, as some impairment are reported to discriminate CWAD from idiopathic neck
pain (Scott et al., 2005; Elliot et al., 2008; Chien and Sterling, 2010).
Symptoms post whiplash injury has been proposed to involve mechanisms of nociception,
motor dysfunction, psychological factors, peripheral and central sensory sensitisation
(Sterling 2009). However, treatment interventions targeting these mechanisms in the acute
phase have not yielded positive outcomes, particularly in those presenting with sensory
impairments. This claim is informed by preliminary findings within a CWAD trial (n=71)
which showed that a subgroup with widespread hyperalgesia (to cold and pressure) reported

2
marginal reduction to their pain and disability post multimodal physiotherapy [16%] (n=9;
neck pain index (SD) = 7.0 (15.8) / 42.3(14.4)) when compared to self-management (advice
and exercise) [17%] (n=10; neck pain index (SD) = 7.3 (8.1) / 42.5 (11.7)) over a 10 week
period (Jull et al., 2007). Though the subgroup sample was small, the findings potentially
suggest that sensory mechanisms are important to understand symptoms persistence in
CWAD, particularly, after the time that tissue repair is expected to have concluded.
Radiological investigation and nerve conduction studies further support this as they appear
normal in a significant proportion of whiplash patients (Greening et al., 2001). Consequently,
research focused to impairments in CWAD has been developed to understand sensory
mechanisms (Sterling, 2009). Current conclusions from research is however limited and
inconclusive due to methodological issues and discrepancies across findings. In particular,
the evidence for impairments reported to discriminate CWAD that plausibly interpret
predominant mechanisms in the condition, merit further investigation.
Evidence indicates that both local and widespread sensory hypersensitivity and
hypoaesthesia to a range of stimuli exists in CWAD, but is absent in patients who recover or
report mild to moderate symptoms (Sterling 2010). This suggests that sensory mechanisms
might trigger and promote impairments as well as symptoms that persist in CWAD. It is
proposed that the impairments are indicative of underlying dysfunctional pain-processing
mechanisms, maintained by a hyperexcitable peripheral and central nervous systems
(Curatolo et al., 2001; Sterling et al., 2003). Interestingly, reports of moderate association
between sensory impairments [pressure and cold hypersensitivity at some limb sites] and
psychological factors [post traumatic stress disorders (PTSD), psychological factors and pain
catastrophisation] in CWAD, suggests psychological factors may also contribute to a

3
hyperexcitable neural system in the condition (Sterling 2010). However, recent findings that
psychological factors did not significantly affect spinal cord hyperexcitability; a lack of
supportive evidence showing the association for all sensory stimuli and body sites tested; as
well as pain and disability mediation of association between PTSD and sensory impairments;
together suggests that psychological factors are not triggers for the spinal cord
hyperexcitability demonstrated in CWAD (Sterling et al., 2008, 2010). As a result, sensory
impairments are therefore increasingly gaining attention in CWAD research as they might
assist further understanding of the condition.
Emerging research (Scott et al., 2005; Elliot et al., 2008; Chien and Sterling 2010) indicates
that sensory hypersensitivity to cold and pressure as well as hypoaesthesia to vibration
describes impairments that discriminate CWAD from non-traumatic neck. These findings
reflect potential predominant mechanisms in CWAD that future assessment methods should
target. Such assessment followed by appropriate management strategies promise positive
outcomes in CWAD that could lead to reduced incidence and impact of CWAD. However,
discrepancies relating to which sensory impairments and limb sites are discriminative of
CWAD exists (Williams et al., 2007). Apart from the limitation of the number of sensory
discrimination studies (n=3), the evidence they provide is incomplete and limited due to
issues of study bias to the female gender (Elliot et al., 2008), exclusion of important sensory
outcomes e.g. upper limb neurodynamic test (ULNT), conflicting study findings (Scott et al.,
2005; Elliot et al., 2008; Chien and Sterling, 2010), and unsupported study conclusions
(Chien and Sterling, 2010). For example, there is evidence to suggest that men and women
differ in their perception and experience of pain plausibly due to biological and
psychological factors (Bernades et al., 2008; Hurley and Adams, 2008). Gender differences

4
for sensory characteristics have also been reported (Edwards et al., 2004; Sullivan et al.,
2005; Rolke et al., 2006) although evidence suggesting the contrary also exist (Lin et al.,
2005). The non inclusion of ULNT, a simple and costless sensory test that physiotherapists
perform during assessment of CWAD to interpret changes to peripheral and central neural
functioning (Elvey, 1997; Nee and Buttler, 2006) in all 3 discrimination studies, negate
present emphasis for simple and affordable sensory tools as a result of cost savings in the
National Health Service [NHS], as well as increasing delivery of patient care within
community settings (Brocklehurst et al., 2011). As a result, direct translation of previous
research finding to clinical practice will be limited by cost of the sensory equipments. In
addition, the measurement properties of reliability and validity required for consistent and
interpretable measurements have not been established for some of the reported sensory tests
(e.g. electrical detection thresholds), and the suitability, applicability and safety of some of
the tests (e.g. electrical detection) for use on patients is in doubt. These limitations of existing
discriminative studies reflect incomplete, limited and inconclusive evidence for sensory
impairments that discriminate CWAD, as well as lack of clarity for predominant mechanisms
in the condition. Further evaluation of sensory impairments that are discriminative of CWAD
is therefore warranted.
1.2 Incidence and cost associated with WAD
WAD is characterised by a variety of clinical symptoms occurring as a result of bony or soft
tissue injury caused by injury to the neck during a motor vehicle collision or sporting
accident (Spitzer et al., 1995). Research statistics report an annual incidence of 300,000
WAD cases in the UK, approximately 500 cases per 100,000 of the sample (Mercer 2007).
The incidence of WAD per 100,000 of sample is 106 in Australia (Harder et al., 1998), 70 in

5
Quebec (Spitzer et al., 1995), 94-188 in the Netherlands (Wismans and Huijkens, 1994) and
400 in the United States of America. The incidence of WAD is reported to be higher in the
United Kingdom when compared to other developed countries (Mercer, 2007). Although
reasons were not provided to justify the incidence data in Mercer, (2007), the recentness of
the data as well as existing compensation systems may have contributed to their data.
Caution should be applied when interpreting the incidence of WAD because a significant
proportion of the reported data is outdated and potentially underestimate its impact on
society as well as the distribution of the condition.
WAD is associated with substantial economic costs arising from lost productive hours,
health care, legal services and other disability-related expenses (Sterling, 2011), with
reported annual estimates of $3.9 billion in the USA (Eck et al., 2001), €10 billion in Europe
(Lovell et al., 2002) and £3 billion in the UK (Crouch, 2006). Cost data from other
developed countries to assist interpretation of the impact of WAD is lacking, particularly
from countries that have reported incidence of the condition. Overall, the reported incidence
and costs data warrant further evaluation of predominant mechanisms in WAD, to inform
assessment and in turn treatment strategies that help to reduce the impact of the condition.
1.3 Classification of WAD
WAD has been described as a heterogeneous condition presenting with varied symptoms that
warrant a classification system to guide both research investigation and treatment decisions
(Sterling, 2004). A sub-classification of the condition is also hypothesised will help identify
homogenous subgroups, so that clinical assessment can be tailored to subgroup specific
impairments (So¨derlund et al., 2000; Peolsson and Gerdle, 2004). Considering its

6
usefulness, a classification system was proposed by the Quebec task force (Spitzer et al.,
1995) to address subgroup impairments in WAD, and has recently been adapted by the Neck
Pain Task Force (Guzman et al., 2008) to cover all mechanical neck pain syndromes,
irrespective of the cause of pain (e.g. traffic collisions, sports, non trauma). Similar sub-
classifications have been developed for mechanical low back pain (Dankaerts et al., 2009;
Fairbank et al., 2011). The chartered society of physiotherapy [CSP] published guideline for
WAD equally advocates consideration of subgroups during assessment and treatment of
patients presenting with the condition (Mercer et al., 2007). However, findings in a recent
trial (n = 804) that showed patients with self-reported whiplash (n = 133) were not different
from other non traumatic neck pain conditions (n = 671) in regards of pain, function or
prognosis, query the usefulness of a classification system for WAD (Verhagen et al., 2011).
This study was however focused to treatment outcomes, and as a result, its conclusions
cannot be generalised to negate usefulness of a sub-classification for WAD patients. Overall,
arguments in support of a subclassification of WAD necessitated the focus of this research to
the subgroup that predominantly presents, for example, to physiotherapists in a clinical
setting. This will enable translation of research findings to clinical practice.
Impairments post whiplash injury has been classified using different criteria (Spitzer et al.,
1995; Radanov et al., 1992; Sterling et al., 2004; Soderlund and Denison 2006). The most
widely used for research trials and clinical studies was developed by the QTF (Spitzer et al.,
1995). The QTF WAD classification is hypothesised to assist clinicians make key decisions
about assessment and treatment post whiplash injury (Spitzer et al., 1995). In support, a
review commissioned by the CSP found high level of supportive evidence for clinical
usefulness of the QTF classification, and therefore recommended its routine use for clinical

7
and research purposes (Hartling et al., 2001; Mercer et al., 2007). The QTF classification has
however been criticised because of the limited clinical information it provides and its focus
to signs and symptoms, that contrasts with recent evidence indicating presence of sensory
impairments and psychological factors (Tenenbaum et al., 2002; Soderlund and Denison,
2006; Sterling et al., 2006). However, the QTF still provides a useful, widely accepted,
WAD specific resource that other classification models can complement. The QTF
classification was therefore used to identify the WAD subgroup of interest for this study.
1.4 QTF classification of WAD
WAD has been classified by the QTF into 5 sub-groups based on a combination of signs and
symptoms at clinical presentation [Table 1.1]. Out of the 5 QTF WAD subgroups, Sterling et
al., (2004) found that the sub-group II was the most predominant (93.4%). Although this has
not been validated in WAD samples drawn from other geographical regions, their findings
may have informed the recent focus on the WAD II subgroup. The limited range of
impairments [neck complaint and musculoskeletal signs, including decreased range of
motion and point tenderness] captured in the QTF classification for WAD II informed use of
additional models to reflect other impairments [sensory hyperalgesia, hypersensitivity,
hypoaesthesia] (Kasch et al., 2005; Scott et al., 2005; Elliot et al., 2008; Chien and Sterling,
2010) as well as psychological factors (Tenenbaum et al., 2002; Soderlund and Denison,
2006; Sterling et al., 2006) that have been reported in this subgroup.

8
Table 1.1: The QTF classification of WAD (Spitzer et al., 1995)
Grade Clinical presentation
0 No complaint about the neck No physical signs
I Neck complaint of pain, stiffness or tenderness only No physical signs
II Neck complaint and musculoskeletal signs Musculoskeletal signs including decreased range of motion and point tenderness
III Neck complaint and neurological signs
Neurological signs include decreased or absent deep tendon reflexes, weakness and sensory deficits
IV Neck complaint and fracture or dislocation
1.5 Mechanism based classification of CWAD
CWAD is a multi-component condition demonstrating association between injury, pain
experience, impairments, as well as environmental and socio-economic influences
(Nachemson, 1992; Millard, 1995). These components can be used to identify key
impairments in a health condition e.g. CWAD (World Health Organisation, 2001; Jull et al.,
2007; Sterling 2009; Bossmann et al., 2011). Different health models (used to reflect the
different mechanisms that underpin impairments) have been proposed to explain
mechanisms that underlie health conditions (Engel, 1977; Zimmerman and Tansella, 1996;
Schultz et al., 2000; Nederhand et al., 2003; Daykin and Richardson., 2004; Anderson 2006).
A previously accepted model, “biomedical” used to describe a causal link between severity
of reported symptoms and tissue damage (Schultz et al., 2000; Daykin and Richardson,
2004) has become outdated by recent findings that suggests that tissue injury is not the only
mechanism responsible for symptoms reported in CWAD, particularly as radiological
9
investigations in a significant proportion of the patients are normal (Arana et al., 2006;
Daffner, 2010; Sterling, 2011). The limitation of the biomedical model informed
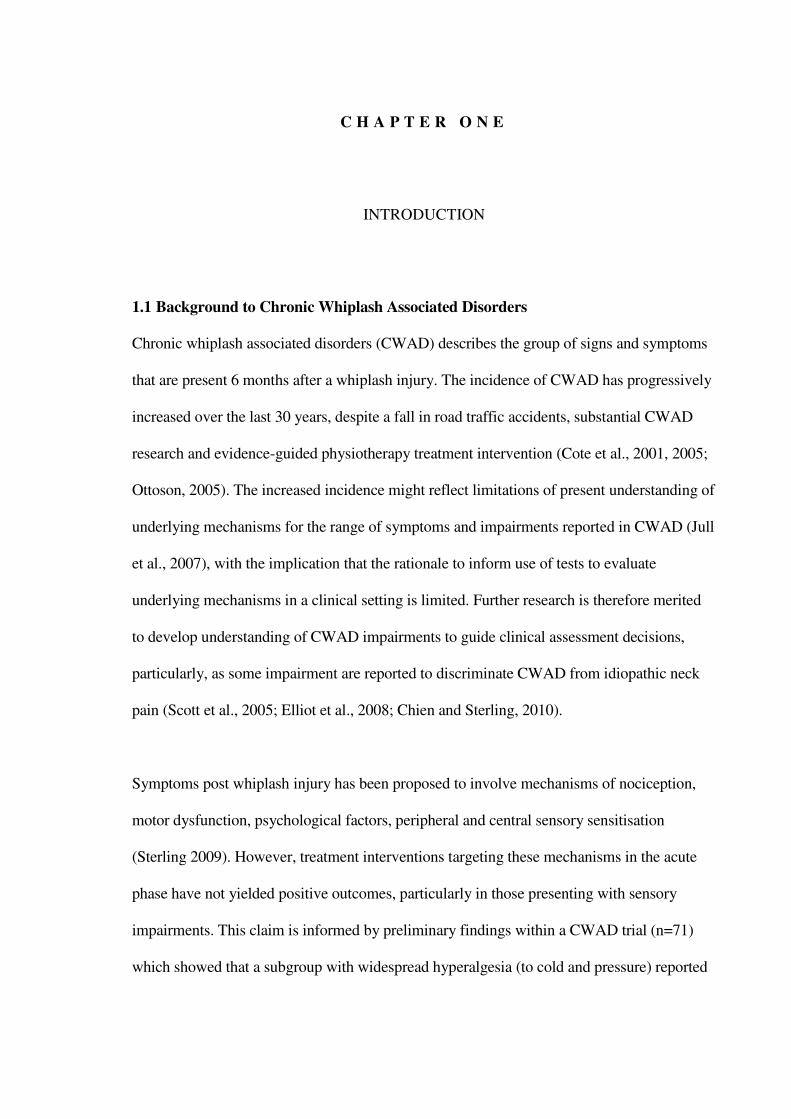
consideration of an alternative model “biopsychosocial” [Fig. 1.2]. This model recognises
that whiplash injury can involve soft tissue damage that may lead to impairments of physical,
psychological and social functioning [disabilities and participation restriction at work and
other settings] (Scholten-Peeters et al., 2002). This model recognises and integrates a bio
[physical], psychological, and social dimensions to CWAD, is widely accepted amongst
clinicians, and underpins the WHO framework for classification of functioning, disability
and health [ICF] (Fig 1.3).
Fig 1.1: Biopsychosocial model of health and illness
Physical Psychological
Social

10
Fig. 1.2: ICF classification of health and functioning (WHO, 2008)
The ICF is used by health care professionals globally to measure the impact of a disease
(WHO, 2001; Nederhand et al., 2003; Anderson 2006; Holm 2007). It uses domains of
"body structures and functions" and "activities and participation", and potential outcome
modifiers of “personal factors” (e.g. behaviour changes, coping, lifestyle) and
“environmental factors” (e.g. medical care, rehabilitation, physical environment),
comparable to components of the biopsychosocial model, to reflect impairments in health or
illness (WHO, 2001). The body structure and function (WHO, 2001) in CWAD reflect
changes to anatomical and physiological functioning, that is comparable to physical
components described in the biopsychosocial model (Scholten-Peeters et al., 2002), and
signs and symptoms described in the QTF classification (Spitzer et al., 1995). However, the
psychosocial impact of CWAD is not captured in the classification proposed by Spitzer et al.,
(1995), a limitation that necessitated use of the ICF as an addition to the QTF classification.

11
1.6 Sensory impairments in CWAD
Impairments in CWAD II affect the physical, psychological and social functioning (Sterling
et al., 2009). The impairments are reflective of mechanisms contributing to symptom profile
of the condition (Smart and Doody 2007; Petty and Moore 2011). A range of mechanisms
have been proposed to underpin CWAD and sensory impairments that are indicative of
dysfunctional peripheral and central pain processing functioning, are proposed to be triggers
of pain in the condition (Chien et al., 2009; Sterling et al., 2009). Sensory impairments can
be evaluated by quantitative sensory testing [QST], a method that applies different stimuli
(thermal, mechanical, electrical, and chemical) over body tissue (skin, muscles, and viscera)
in order to elicit responses that reflect changes to nervous system pain processing.
Impairments of local and widespread hypersensitivity, hyperalgesia and hypoesthesia to
mechanical, thermal and electrical stimuli have been demonstrated in CWAD by the QST
method (Koelbaek-Koelbaek-Johansen et al., 1999; Curattolo et al., 2002; Moog et al., 2002;
Sterling et al., 2002b, 2002c, 2003a, 2004, 2005, 2006, 2007, 2008, 2009; Banic et al., 2004;
Greening et al., 2005; Kasch et al., 2005; Scott et al., 2005; Jull et al., 2007; Chien et al.,
2009). Some of the impairments, including thermal (cold and heat), mechanical (pressure)
hyperalgesia and hypersensitivity, and vibration and electrical hypoaesthesia are reported to
discriminate CWAD from other non-traumatic chronic neck pain conditions (Scott et al.,
2005; Elliott et al., 2008; Chien and Sterling, 2010). A key limitation of the existing
discriminative evidence relates to the cost and safety of QST equipments used to evaluate the
impairments. Present cost saving initiatives within the NHS, and clinical governance issues
focused to patient safety warrant use of cheap, safe equipments that provide useful and
interpretable results during patient assessment (Brocklehurst et al., 2011). Evidence to
support clinical usefulness and safety of electrical detection threshold for CWAD patients

12
that demonstrate sensory hypersensitivity is lacking in the literature. Also, supportive
evidence regarding their measurement properties is sparse. The range of nerve fibre
subsamples [C-, Aδ-, Aβ] assessed using electrical stimulus can be evaluated by cheap, safe
and routinely used alternatives such as ULNT (Nee and Butler, 2006), pressure algometry
and tuning fork (Hansson et al., 2007) and therefore questions usefulness of electrical
thresholds to discriminate CWAD. Equipment used for cold testing is expensive when
compared to routine tests of ULNT and vibration testing, but the consistent supportive
evidence demonstrating its clinical usefulness (e.g. to discriminate CWAD) and safety,
outweigh cost considerations. In contrast, cost implication as well as limited, inconclusive
evidence for heat discrimination of CWAD negates its further evaluation in this sample.
Overall, there is a merit for further evaluation of sensory discrimination of CWAD using
cold, pressure, vibration and ULNT to provide further clarity of impairments and
mechanisms in CWAD, and to guide future clinical assessment and treatment strategies.
This will in turn contribute to improve clinical outcomes in the short term, as well as reduce
incidence and impact of CWAD in the long term. These benefits as well as limitations of
previous sensory discrimination studies informed design of the present study.
1.7 Aim of study
The aim was to evaluate the ability of ULNT and QST to discriminate CWAD II from
healthy individuals
1.8 Importance of study
The findings of the study will:
a) Provide evidence of sensory impairments that discriminate CWAD II

13
b) Provide clarity of important sensory impairments in CWAD II
c) Provide evidence to support physiotherapists’ use of ULNT and QST during assessment of
CWAD II
d) Guide design of future trials in CWAD II
e) Stimulate further research in CWAD II
1.9 Structure of the thesis
The aim and design of the thesis informed a literature review to identify high quality
consistent evidence to justify selection of sensory impairments and tests that were included
into the discrimination study. Responsiveness to findings of the literature review informed
preliminary studies of inter- and intra- rater reliability and construct validity for some of the
identified tests in order to provide supportive evidence for their use in the discrimination
study. Overall, the thesis is reported in ten Chapters that are detailed below:
Chapters
1: Introduction
2: Literature review to identify high quality evidence to justify sensory impairments and tests
included into the discrimination study
3: Inter-rater reliability of dynamic ultrasound imaging [DUI] estimates of median and ulnar
nerve movement
4: Further analysis of nerve images focused to measurement error within DUI image capture
and image analysis components
5: Further analysis of nerve images focused to measurement error within DUI image analysis
6: Intra-rater reliability of DUI estimates of median nerve movement

14
7: Construct validity of upper limb neurodynamic test
8: ULNT and QST discrimination of CWAD II from healthy individuals
9: Discussion
10. Conclusion
1.10 Chapter conclusions
The aim of the study was to evaluate the ability of ULNT and QST to discriminate CWAD II
participants from healthy individuals. A review of the CWAD literature was conducted to
guide selection of sensory impairments as well as identify clinically applicable tests with
established measurement properties to evaluate them. High quality consistent evidence
informed the selected impairments. The measurement properties and clinical applicability of
sensory tests for evaluating selected impairments were explored to support translation of
study findings to a clinical setting. The literature review is reported as Chapter 2 of the thesis
and its conclusions informed the design of other studies reported within the thesis.

15
CHAPTER 2
LITERATURE REVIEW
2.1 Introduction
Research data indicates that a significant proportion of people (50-60%) continue to
experience persistent localised and widespread pain and sensory impairments 6 months post
whiplash injury [Chronic Whiplash Associated Disorders (CWAD)] (Barnsley et al., 1994;
Stovner, 1996; Freeman et al., 1998; Carroll et al., 2008; Kamper et al., 2008). The economic
burden of CWAD with regards to cost of treatment, insurance claims and lost productive
hours at work or school is enormous (Elliott et al., 2009). The impact in relation to restriction
of an individual’s activities as well as their social participation is also significant (Carroll et
al., 2008). Over the years, research and clinical efforts have been focused towards addressing
impairments in CWAD in order to reduce the incidence, burden and impact of CWAD.
Despite efforts, CWAD remains an unresolved health challenge, due to a lack of clarity on
predominant mechanisms that clinical assessment and treatment strategies should address
(Jull et al., 2007; Schmitt et al., 2008; Sterling, 2009). Also, the rationale underpinning a
range of tests used to evaluate CWAD is weak. As a result, further evaluation to identify
impairments and mechanisms that explain symptom-persistence in CWAD is warranted,
particularly, those that discriminate the condition from other neck pain disorders.
CWAD studies have consistently demonstrated the presence of a range of local and
widespread sensory impairments in people who fail to recover after a whiplash injury
(Curatolo et al., 2001; Moog et al., 2001; Sterling et al., 2003a, 2004, 2006, 2008; Chien et

16
al., 2009). The findings have contributed to wide acceptance that sensory mechanisms play a
significantly role in the onset and sustenance of symptoms in CWAD (Sterling et al., 2008,
2010; Chien et al., 2009). In particular, hyperalgesia, hypersensitivity, and hypoaesthesia to a
range of sensory stimuli were found to be features that discriminated CWAD II from
idiopathic neck pain [INP] (Scott et al., 2005; Elliot et al., 2008; Chien and Sterling, 2010).
In addition, Sterling et al., (2008) have suggested that pain in a significant proportion of
CWAD patients was predominantly of a neuropathic nature. Although the CWAD
discriminative studies present important preliminary data, further evaluation and replication
of their findings is warranted due to methodological limitations, conflicting results, and some
unsupported conclusions. For example, supportive evidence for sensory discriminators of
CWAD is weakened by the focus to the female gender in Elliot et al., (2010). This is
important as the effect of gender on QST is well reported [lower for women than men]
(Edwards et al., 2004; Sullivan et al., 2005; Rolke et al., 2006). Findings by Scott et al.,
(2005) indicating increased cold and decreased heat pain thresholds discriminated their study
groups [(n=29 CWAD) vs. (20 INP)] (p<0.03), conflicts with reports in Elliot et al., (2008)
and Chien and Sterling, (2010) that support decreased cold pain thresholds [(n=79 CWAD)
vs. (n=23 INP)] (p<0.001) and [(n=50 CWAD) vs. (n=28 INP)] (p<0.03) respectively. As a
result, supportive evidence for thermal pain discrimination of CWAD is inconclusive.
Further, Scott et al., (2005) found that local and remote pressure pain discriminated between
CWAD and INP (P < 0.05), contrasting with findings from Chien and Sterling, (2010) who
reported that only remote pressure pain discriminated both groups (p = 0.02). As a
consequence, supportive evidence for pressure pain discrimination of CWAD is
inconclusive. Again, Chien and Sterling, (2010) concluded that elevated vibration (p < 0.04),
heat (p < 0.02) and electrical detection thresholds (p < 0.04) over local and remote sites

17
discriminated between CWAD and INP. However, this conclusion is unsupported because
their INP group did not demonstrate features of sensory hypoaesthesia (p > 0.12). The
implication is that evidence for thermal and pressure pain discrimination of CWAD is
inconclusive. Current sensory discriminative evidence is also incomplete because ULNT, a
sensory test physiotherapists routinely use during assessment of CWAD (Elvey, 1997; Nee
and Buttler, 2006) has not been investigated. The advantage of the ULNT is that it is cost
less and simple, and can interpret changes to both peripheral and central nervous system
functioning (Nee and Buttler, 2006). There is potential benefit for ULNT to complement
QST assessment of CWAD in a clinical setting. A further limitation of existing sensory
discrimination studies is that clinical applicability, safety, as well the measurement properties
(e.g. reliability and validity) of some sensory tests e.g. electrical detection, has not been
established. As a result, only a limited number of discriminating sensory tests are applicable
to clinical practice. Overall, existing supportive evidence for sensory discrimination of
CWAD is limited, inconclusive and incomplete. Further evaluation of sensory tests that are
simple, cheap, reliable, valid and applicable in a clinical setting, to discriminate CWAD is
required.
2.2 Background to CWAD
2.2.1 Definition of CWAD
WAD describes the clinical manifestations that results from a whiplash injury, defined as
bony and soft tissue injuries of the neck due to acceleration immediately followed by
deceleration of the neck and head (Spitzer et al., 1995). The persistence of the clinical
manifestation beyond the timeline proposed for tissue recovery to occur has been described
as CWAD (Spitzer et al., 1995).
18
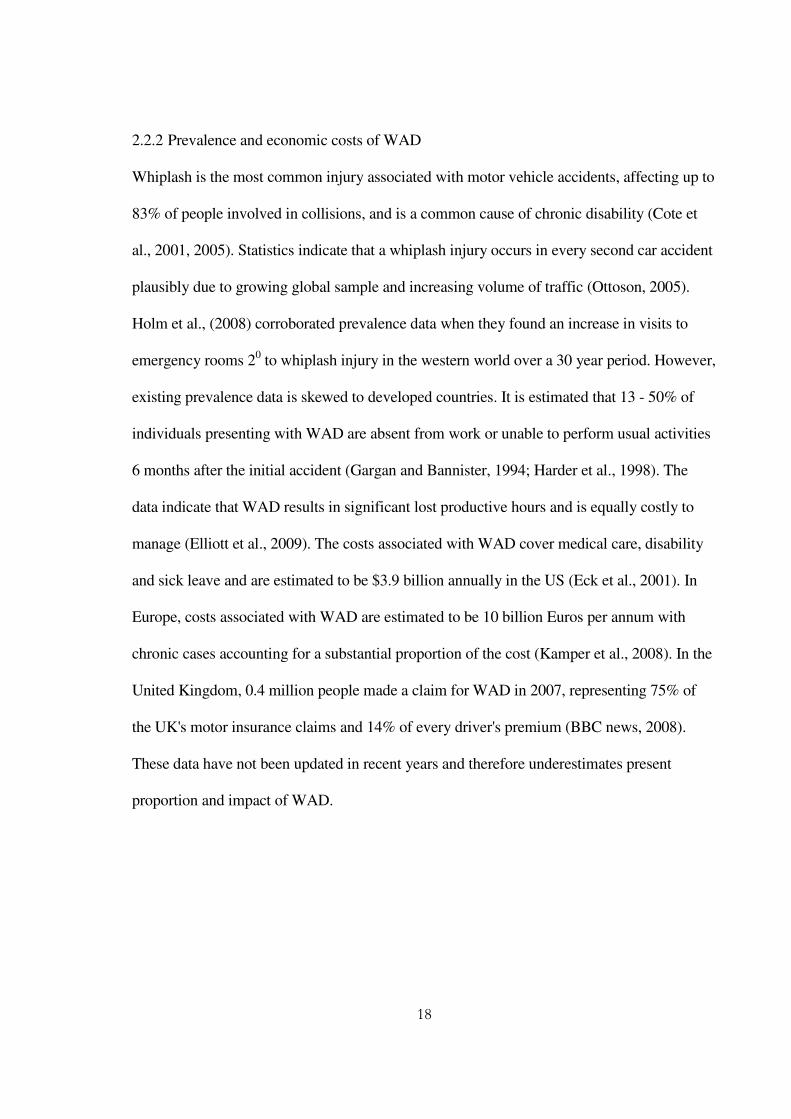
2.2.2 Prevalence and economic costs of WAD
Whiplash is the most common injury associated with motor vehicle accidents, affecting up to
83% of people involved in collisions, and is a common cause of chronic disability (Cote et
al., 2001, 2005). Statistics indicate that a whiplash injury occurs in every second car accident
plausibly due to growing global sample and increasing volume of traffic (Ottoson, 2005).
Holm et al., (2008) corroborated prevalence data when they found an increase in visits to
emergency rooms 20 to whiplash injury in the western world over a 30 year period. However,
existing prevalence data is skewed to developed countries. It is estimated that 13 - 50% of
individuals presenting with WAD are absent from work or unable to perform usual activities
6 months after the initial accident (Gargan and Bannister, 1994; Harder et al., 1998). The
data indicate that WAD results in significant lost productive hours and is equally costly to
manage (Elliott et al., 2009). The costs associated with WAD cover medical care, disability
and sick leave and are estimated to be $3.9 billion annually in the US (Eck et al., 2001). In
Europe, costs associated with WAD are estimated to be 10 billion Euros per annum with
chronic cases accounting for a substantial proportion of the cost (Kamper et al., 2008). In the
United Kingdom, 0.4 million people made a claim for WAD in 2007, representing 75% of
the UK's motor insurance claims and 14% of every driver's premium (BBC news, 2008).
These data have not been updated in recent years and therefore underestimates present
proportion and impact of WAD.

19
0%
20%
40%
60%
80%
100%
120%
UK motor
insurance claims
WAD related claims
Non WAD related claims
Drivers premium used for nonWAD claims
Drivers premuim used forWAD claims
Figure 2.1: Descriptive statistics of bar chart depicting UK motor insurance claims in 2007 (Source: Data extracted from BBC news, 2008) 2.2.3 Classification of WAD
A. Classification based on severity of symptoms and signs
WAD has been classified into 5 sub-groups based on a combination of symptoms and signs
at clinical presentation [Table 1.1] in order to assist clinicians’ decisions post whiplash injury
(Spitzer et al., 1995). The classification supports existence of sub-groups within WAD that
assessment and treatment intervention should target (Klapow et al., 1993; Turk and Rudy,
1990). It also facilitates comparison of findings across WAD studies (Spitzer et al., 1995).
Despite its simplicity and ease of application, there are conflicting arguments regarding
usefulness of the QTF classification of WAD. Some authors have argued against using the
QTF classification because of its narrowness and focus to somatic disturbances in spite of
evidence demonstrating a variety of non-musculoskeletal signs and symptoms post whiplash
injury (Tenenbaum et al., 2002; Soderlund and Denison, 2006). Freeman et al., (1998)
further queried the validity of the classification because selected criteria involving

20
combinations of signs and symptoms for each subgroup were arbitrary. The criticism lends
support for a modification of the QTF classification that led to a further sub-classification of
WAD II (Sterling et al., 2004); as well as development of additional classification tables
(Radanov et al., 1992; Soderlund and Denison, 2006). However, reliability and validity of
the new proposed classifications have not been established and they are sparsely used in
clinical or research settings. There is in contrast, advocacy for use of the QTF classification
because it was found to be predictive of CWAD (n= 380) when compared with diagnosis
made by physicians (Hartling et al., 2001). A recent systematic review commissioned by the
Chartered Society of Physiotherapy [CSP] found a high level of evidence supporting its
clinical value in WAD and therefore recommended continued use of QTF classification for
both clinical and research purposes (Mercer et al., 2007).
B. Classification based on duration of WAD
WAD has been classified based on the duration of the injury. Acute WAD is defined as
presence of pain, restriction of motion or other symptom that is sufficient to hinder return to
normal activities at ≤ 3 months post whiplash injury (Spitzer et al., 1995). Different
timescales have however been used to describe CWAD. The QTF defined CWAD as the
presence of pain, restriction of motion or other symptoms at ≥ 6 months after whiplash injury
(Spitzer et al., 1995). There is no scientific justification for ≥ 6 months over ≥ 3 months
duration. There is equally no evidence against use of this timescale to define CWAD.
However, a significant proportion of research have continued to use 6 months to define their
CWAD population, plausibly because the QTF classification is specific to WAD, and there is
presently, no clinically useful alternative to it. Interestingly, WAD research groups that
previously used ≥ 3 months to define their CWAD participants have recently adopted the

21
QTF’s 6 month timescale (Sterling 2004, 2009). The change could have happened to allow
comparison of their findings to other WAD studies. In contrast, CSP guidelines for managing
WAD has recommended a classification of WAD into acute (0 - 2 weeks); sub-acute (>2 - <
4 weeks) and chronic (>12 weeks) (Hartling et al., 2001; Mercer et al., 2007). The CSP
classification agrees with timescale used for other chronic musculoskeletal conditions. Both
QTF and CSP classifications highlight a gap in timescales used to describe acute and chronic
WAD [Fig 2.2].
Week 0 ≤ 2 ≤ 4 ≥12 ≥ 24
QTF Acute Chronic
CSP Acute Sub-acute Chronic
Figure 2.2: Timescale used to classify WAD [Developed from Spitzer et al., 1995; Hartling
et al., 2001; Mercer et al., 2007]
Overall, the QTF provides a useful and widely accepted classification and timescale to define
CWAD, despite the limited criteria adopted. The presence of other manifestations in CWAD
that the QTF classification did not account for, necessitated the development of additional
classification models that reflects current understanding regarding the multi-dimensions of
health and illness.
C. Classification based on mechanisms in C WAD
A mechanism based approach is underpinned by the hypothesis that different clinical signs
and symptoms reflect a variety of underlying patho-physiological mechanisms (Greenspan,

22
2001; Hansson, 2002; Jensen and Baron, 2003). Extensive animal studies suggest that a
variety of mechanisms can operate alone or together to determine a flora of signs and
symptoms that are specific to a health condition (Woolf and Salter, 2000). Therefore CWAD
will be better understood by using a mechanism based approach (Petty and Moore, 2011).
Different models of health and illness have been advanced to describe mechanisms
underpinning CWAD (Engel, 1977; Zimmerman and Tansella, 1996; Schultz et al., 2000;
Nederhand et al., 2003; Daykin and Richardson., 2004; Anderson, 2006). However, the
biopsychosocial model is widely accepted and used because it addresses limitations of
previous health models (Bossman et al., 2010). The model recognises that injury such as
following a whiplash can cause minor tissue damage that can lead to impairments of physical
and psychological functioning as well as disabilities and participation problems in work and
other activities (Scholten-Peeters et al., 2002). The biopsychosocial model have been
proposed to assist further understanding of the development of CWAD (Malt and Sundet,
2002; Richter et al., 2004).
The biopsychosocial model underpins the World Health Organisation [WHO] framework for
classification of functioning, disability and health (ICF) [Fig 2.5]. CWAD reflects a
complex, multifaceted health problem that involves different mechanisms (Sterling, 2009).
The ICF provides a suitable model to capture all plausible impairments and mechanisms
associated with the condition (Schmitt et al., 2008; Sterling, 2009), and this support using the
ICF to complement the QTF WAD classification. In CWAD, the ICF recognises a physical
dysfunction [motor and sensory] that results in limitations of an individual’s function
[activity and social participation], mediated by contextual factors [personal (psychological)

23
and environmental]. Existing evidence suggest that not all of the dimensions contribute to
persistence of symptoms in CWAD (Sheather and Cohen, 1998; Koelbaek-Koelbaek-
Johansen et al., 1999; Stucky et al., 2001; Curatolo et al., 2001; Ide et al., 2001; Sterner et al.,
2001; Sterling et al., 2002b, 2002c, 2003a, 2004, 2005, 2006, 2007, 2008; Banic et al., 2004;
Greening et al., 2005; Kasch et al., 2005; Scott et al., 2005; Jull et al., 2007; Chien et al.,
2008). There is supportive evidence to suggest that physical impairments in CWAD, involve
both motor and sensory systems (Sterling et al., 2006). There is however no substantive
supportive evidence to suggest that mechanisms that underlie motor impairments contribute
to CWAD symptoms (Jull et al., 2007). Also, motor impairments are not distinctive features
that individuals who fail to recover after a whiplash injury demonstrate (Jull et al., 2004;
Sterling et al., 2006; Field et al., 2008). Furthermore, motor impairments do not discriminate
CWAD from idiopathic neck pain (Sterling et al., 2008). In contrast, there is emerging
consistent evidence that sensory impairments are distinctive features that persist in CWAD
(Scott et al., 2005; Elliot et al., 2008; Chien and Sterling 2010). As a result, sensory
impairments are proposed to be important triggers and mediators for pain in CWAD
(Sterling, 2010). This informed the focus of this study to sensory impairments.

24
Figure 2.3: ICF classification of health and functioning (adapted from Bossman et al., 2011)
2.2.4 Sensory impairments in CWAD
Emerging research has found the presence of impairments in the sensory and motor systems,
including psychological factors post whiplash injury. However, in CWAD, patients present
with a more complex clinical picture characterised by the presence of local and widespread
sensory hyperalgesia, hypersensitivity and hypoesthesia to a range of stimuli [thermal,
mechanical and electrical] (Scholten-Peeters et al., 2003; Banic et al., 2004; Greening et al.,
2005; Kasch et al., 2005; Scott et al., 2005; Sterling et al., 2003, 2004, 2005, 2008; Chien et
al., 2008; Sterling, 2009; Elliot et al., 2010). The main features of hypersensitivity are
hyperalgesia (increased pain response to noxious stimuli) and allodynia (pain produced by
Restrictions of participation [Social]
- Recreation, conference, worship
Health Condition - CWAD II
Limitations of activity [Functional]
- Dressing, personal care, reading, sleeping
Altered body function and
structure [Physical] -Motor impairment
-Sensory impairment
Environmental Factors - Family, physical geography,
Medicare
Personal Factors [Psychological] - Behaviour, coping, anxiety, depression,
PTSD

25
non-painful stimuli) while hypoaesthesia describes a reduced sense of touch or sensation, or
a partial loss of sensitivity to sensory stimuli (Chien and Sterling, 2010).
A. Hypersensitivity in CWAD
Features of hypersensitivity found soon after a whiplash injury have been attributed to
peripheral nociceptive input arising from injured tissue. However, it is unclear why
hypersensitivity persists in CWAD, particularly as tissue damage is not evident in this phase
of the illness (Sterling, 2010). Based on emerging animal and human research,
hypersensitivity of the central nervous system has been proposed as the mechanism
maintaining this feature in CWAD. It is proposed that the hypersensitivity is maintained by a
disordered central pain processing mechanism as a result of neural changes occurring from
repeated barrage of peripheral nociceptive input. Sterling (2010) supported this proposed
mechanism when they reported decreased nociceptive flexion reflex threshold (p=0.04), that
is reflective of spinal cord hyperexcitability, in CWAD patients (n=20) presenting with
generalized sensory hypersensitivity (p<0.05). The decreased thresholds was found over
areas remote to the injury site indicating widespread spinal cord hyperexcitability,
implicating a disordered descending pain modulation mechanism (Sterling, 2010). It has
been suggested that central hyperexcitability following tissue injury and ensuing peripheral
nociceptive input normalise after elimination of the peripheral input (Gracely et al., 1992). In
support, Sterling (2010) found decreased central hyperexcitability (p=0.04) in CWAD
participants who recovered [n=25] or reported mild to moderate pain and disability levels
[n=17; Mean NDI (SD) = 16.5 (9.9)] when compared to those who continued to report
persistent moderate to severe symptoms [n=20; Mean NDI (SD) = 39.3(17.5)]. In the
participants that recovered or reported mild to moderate symptoms, sensory hypersensitivity

26
were comparable to those of healthy individuals. Findings of hypersensitivity in CWAD
participants who failed to recover are interpretive of important underlying mechanisms
contributing to symptoms persistence that clinical assessment should target. Overall, Sterling
(2010) provides preliminary supportive evidence to indicate the presence, importance and
plausible predominance of hypersensitivity in CWAD. However, the evidence merits further
consideration in future studies in order to replicate its findings and enable generalisabilty of
its conclusions. Hypersensitivity to cold stimuli has also been shown to provide prognostic
data for acute WAD patients at risk of progressing to the chronic phase of the illness
(Scholten-Peeters et al., 2003; Williams et al., 2007), a finding that suggest the importance of
hypersensitivity for improving clarity of CWAD.
There is some evidence to indicate that hypersensitivity to pressure and cold stimuli can
discriminate CWAD from INP (Scott et al., 2005; Elliot et al., 2008; Chien and Sterling,
2010). However, the discrimination of CWAD using mechanical stretch [ULNT] has not
been investigated. This is important because both pressure and tension are routinely used
during physiotherapy neurological examination of CWAD. The implication is that existing
evidence for hypersensitivity discrimination of CWAD is incomplete (see Chapter 1, Section
1.6 of the thesis) and merit further investigation.
B. Hypoaesthesia in CWAD
Features of sensory hypoesthesia that are interpretive of central inhibitory processes related
to nociceptive input have been reported in CWAD (Chien et al., 2008b). Whereas
hypersensitivity has been suggested to occur from sensitisation of central neurons by
prolonged nociceptive inputs, hypoaesthesia is suggested to be caused by nociceptive inputs

27
producing inhibitory effects that dampen the central nervous system perception and
interpretation of sensory inputs (Apkarian et al., 1994). These suggestions support the
presence of different mechanisms in CWAD and consequently highlight their importance for
gaining an improved understanding of the condition, as well as guiding the key features
clinicians should look out for when assessing patients. Chien and Sterling (2010) reported
that CWAD participants (n=50) demonstrated elevated vibration (p < 0.04), heat (p < 0.02)
and electrical (p < 0.04) detection thresholds over areas of the upper limb when compared to
a healthy group (n= 31). The findings were attributed to underlying mechanisms of central
inhibition of nociceptive input (Apkarian et al., 1994; Chien et al., 2009), central
sensitisation (Voerman et al., 2000) and cortical reorganisation (Pleger et al., 2006) as
described previously.
Chien and Sterling (2010) demonstrated that hypoaesthesia discriminated patients with
CWAD from INP (n=28) (p<0.04). Their conclusions are however weak due to absence of
features of hypoaesthesia in their INP group, findings that limit comparison of the two neck
pain conditions. The authors therefore recommended further investigation. Findings from
Chien and Sterling (2010) provide preliminary evidence to suggest presence and importance
of sensory hypoaesthesia that is indicative of other key mechanisms in CWAD. Further
evaluation of hypoaesthesia discrimination of CWAD is required.
2.2.5 Physiological changes that underlie sensory impairments in CWAD
There is discrepancy within the recent CWAD literature suggesting the presence of sensory
impairments in CWAD that are indicative of a sensitised nervous system (Bove et al., 2003;
Scholten-Peeters et al., 2003; Sterling et al., 2003, 2004, 2005, 2008, 2009, 2010; Banic et
28
al., 2004; Greening et al., 2005; Kasch et al., 2005; Scott et al., 2005; Chien et al., 2008a,b;
Chien and Sterling, 2010). The proposed physiological explanation is that the nervous
system becomes sensitised from continuous activation of nociceptors [pain receptors] by
released inflammatory mediators and neuropeptides after the injury (Eriksen and Ursin,
2004; Carpenter and Dickenson, 2002). The peripheral neural system becomes sensitised
when events around pain receptors combine to lower the threshold or intensity a stimulus
requires to evoke a response [action potential] in the nerve (Holdcroft and Jaggar, 2005). The
anomaly is proposed as being responsible for ongoing localised pain over the site of injury
beyond the time that the tissue inflammatory response is expected to subside. The central
nervous system can equally become sensitised and generate pain over areas that are remote
to the site of injury (Coderre et al., 1993; Li et al., 1999; Kidd and Urban., 2001; Graven-
Nielsen and Arendt-Nielsen, 2002; Staud and Smitherman, 2002; Carpenter and Dickenson,
2002). The phenomenon occurs because action potentials generated by pain receptors that
are transmitted through primary afferents [unmyelinated C and thinly myelinated Aδ] into
dorsal horn neurons of the spinal cord become inhibited or further amplified [augmented]
before reaching the higher brain centres (Holdcroft and Jaggar, 2005). Further stimulation of
pain receptors will then result in an increased response of dorsal horn neurons (Baranauskas
and Nistri 1998). The proposed physiological mechanisms that promote central sensitisation
include (a) wind-up or temporal summation caused by repetitive noxious stimuli producing
increased electrical discharges in the dorsal horn, (b) dysregulated descending inhibitory
pathways as a result of abnormalities within the CNS and (c) upregulated facilitatory
modulation due to certain behavioural and cognitive factors (Coderre et al., 1993; Li et al.,
1999; Kidd and Urban, 2001; Graven-Nielsen and Arendt-Nielsen, 2002; Staud and
Smitherman, 2002).

29
2.2.6 Methods for evaluating sensory impairments in CWAD
Abnormal sensory responses over areas local or remote to an injury can be evaluated through
a neurological examination that involves quantitative sensory testing (QST), reflex and
manual muscle testing (Ropper and Brown, 2005). An advantage of QST is its ability to
detect changes to small nerve fibre unlike the latter two methods (Rolke et al., 2006). QST
utilises a range of stimuli such as temperature [cold and hot], mechanical [pressure,
vibration] and electrical to interpret afferent or efferent nerve dysfunction (Lee et al., 2004;
Rolke et al., 2006). The dysfunction may be present without evidence of nerve tissue damage
such as small fiber neuropathy and neural inflammation (Lacomis 2002; Hoitsma et al.,
2004). This is important for CWAD because in a significant proportion of patients, the
profile of sensory impairments does not correlate with radiological investigations and nerve
conduction studies [gold standard] (Greening et al., 2001), supporting the benefit of QST for
this patient sample. In addition to QST, physiotherapists utilise a simple, costless, easy to
administer sensory test, the ULNT, to interpret changes to the mechanical properties of the
peripheral and central nervous system (Elvey 1997; Butler 2000; Greening et al., 1998, 2001,
2005; Coppieters et al., 2006, 2009; Shacklock et al., 2006). The test enjoys wide use within
physiotherapy practice in a clinical setting. An abnormal response to both QST and ULNT
interprets a dysfunction of the sensory nervous system (Banic et al., 2004). The use of both
methods in clinical practice is complementary because together, they provide a broad range
of stimuli to cover different nerve fibre sub-samples as well as various manifestations of
neural dysfunction. Both methods therefore show a potential to benefit existing methods of
evaluating CWAD in clinical practice. To date, sensory discriminative studies have not
included the ULNT amongst the range of tests investigated. This informed consideration of
both QST and ULNT for the present study.
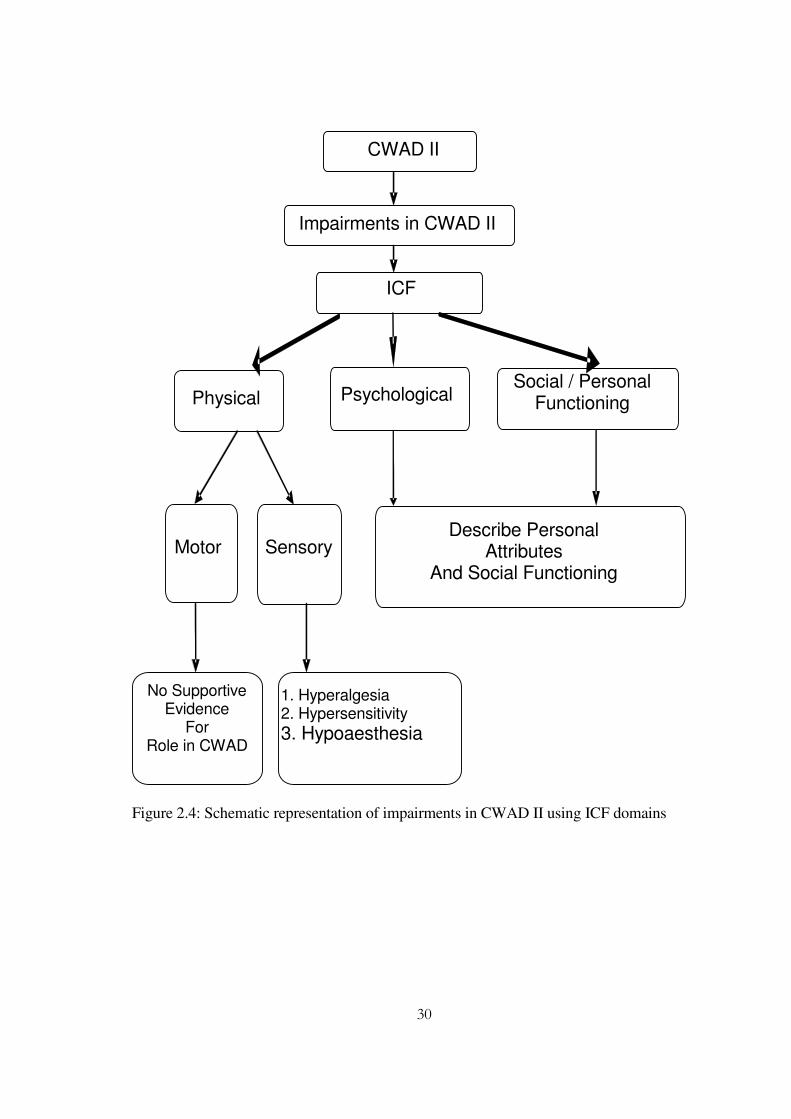
30
Figure 2.4: Schematic representation of impairments in CWAD II using ICF domains
CWAD II
Impairments in CWAD II
ICF
Psychological
Social / Personal
Functioning
Motor
Sensory
Physical
Describe Personal Attributes
And Social Functioning
No Supportive Evidence
For Role in CWAD
1. Hyperalgesia 2. Hypersensitivity
3. Hypoaesthesia

31
Figure 2.5: Schematic description of pathway for peripheral and central sensitisation
Areas modulating peripheral
sensitisation
Are
as m
odula
ting c
entr
al S
ensiti
sation
Nociceptive input
Injury

32
2.3 Review of the CWAD literature to identify sensory impairments
2.3.1 Purpose of the literature review
This review searched and appraised the literature for high quality evidence to justify range of
sensory impairments included into the CWAD II discrimination study. Measurement
properties and clinical applicability of tests for evaluating the sensory impairments were also
considered, to ensure that findings from the study are interpretable and can be translated to a
clinical setting.
2.3.2 Search strategy
The search strategy was informed by published guidelines for conducting systematic reviews
such as preferred reporting items for systematic reviews and meta-analyses [PRISMA 2009]
(Liberati et al., 2009); the Cochrane handbook for systematic reviews of interventions
version 5.0.0 (Higgins and Altman, 2009) and the Centre for Reviews and Dissemination
guidance for undertaking reviews in health care (CRD systematic reviews 2009). The search
strategy was used to eliminate issues relating to selection bias, so that all potential studies
were considered (Easterbrook et al., 1991).
2.3.3 Search sources
Potentials articles were identified by searching electronic databases and hand searching key
journals and reference lists of identified papers, bibliographies and citations to obtain
additional articles (Liberati et al., 2009; Higgins and Altman, 2009). Electronic databases of
PubMed, Medline [Ovid], Cinahl [Ebsco], Cochrane Database of Systematic reviews library
[Wiley], PEDro [Physiotherapy evidence-base database], Science citation index [ISI],
EMBASE classic [Ovid], and PsycINFO [Ovid] were searched from their inception to 2011,

33
similar to CWAD systematic reviews (Williams et al., 2007; Kamper et al., 2008; Rushton et
al., 2011). Databases were searched using search terms generated from Medline Medical
subject headings [MeSH] and previous CWAD articles. Inclusion and exclusion criteria were
established to focus the search terms to sensory impairments of interest. Duplicates of
articles were removed. Hand searching of references of articles returned in the literature
search was undertaken to identify additional articles that are relevant to the focus of the
review.
2.3.4 Search terms
Search terms were grouped under PICOS [participants, interventions, comparators,
outcomes, study design] as reported in previous CWAD systematic reviews (Williams et al.,
2007; Kamper et al., 2008; Rushton et al., 2011). A modification of PICOS to POS
[participants, outcomes, study design] was adopted because the sensory discrimination study
was focused to assessment, rather than treatment, and therefore informed exclusion of
components of “intervention”, and “comparator”. Search terms were combined using “OR”
within each POS component, and “AND” across the components to generate a list of
published and unpublished abstracts, reports, articles, conference presentations and
proceedings [Table 2.1]. This method is supported by previous CWAD reviews (Williams et
al., 2007; Kamper et al., 2008; Rushton et al., 2011).

34
Table 2.1: Search terms used within each POS components
Study Characteristics Search terms
Participant
Whiplash or whiplash injur$ or whiplash associated
disorder$ or WAD or whiplash syndrome or neck pain
or cervical spine or neck or cervical pain or neck sprain
or cervical sprain or neck strain or cervical strain or neck
injur$ or CWAD or CWAD symptoms or chronic neck
pain or chronic cervical pain or late whiplash syndrome
Outcome
(Sensory)
Sensory testing or sensory profile or sensory
hypersensitivity or hypersensitivity or central
hyperexcitability or generali$ hypersensitivity or
impairment$ or dysfunction$ or hypoaesthesia or
hypoesthesia or hyperaesthesia or hyperesthesia or
hyperalgesia or hypoalgesia or allodynia or quantitative
sensory testing or QST or neurogenic pain or
neuropathic pain or neuropathy or peripheral
neuropathic pain or pressure or pressure threshold$ or
pain threshold$ or algometry or temperature or
temperature rating$ or thermal or thermal pain or
thermal pain threshold$ or cold or cold pain threshold$
or cold sensation or heat or heat sensation or heat pain
threshold$ or vibratometry or vibration or vibration
sensation or vibration threshold$ or vibration detection

35
threshold$ or vibration sensory testing or electrical or
electrical sensation or electrical detection threshold$
neurodynamics or neurodynamic testing or neural
tension test$ or neurodynamic tension test or neural
tissue provocation test or upper limb neurodynamic test
or upper limb tension test or brachial plexus or brachial
plexus tension test or brachial plexus provocation test or
mechanosensitivity or mechanical stress or peripheral
nerve or nerve movement or nerve mobility or neural
mobilisation or biomechanic$ or nerve biomechanic$ or
neurobiomechanics or nerve sliding or nerve excursion
or longitudinal sliding or transverse sliding or LM or
TM or median nerve or median neuropathy or ulnar
nerve or radial nerve or ultrasound or ultrasound
imaging or diagnostic ultrasound or ultrasonography or
speckle tracking or cross-correlation or frame by frame
cross-correlation
Outcome
(Psychological / Pain
and Disability)
Psychological factors or psychological factors or anxiety
or depression or post traumatic stress reaction or post
traumatic stress disorder or PTSD or fear avoidance or
self efficacy or impact of event scale or IES or general
health questionnaire or GHQ or tampa scale of

36
kinesiophobia or TSK or short form 36 or SF-36 or short
form 12 or SF-12 or catastrophi$ or pain catastrophising
scale or hospital and anxiety depression scale or pain or
pain rating$ or visual analogue scale or disability or
disability rating$ or neck disability or neck disability
index or whiplash disability or whiplash disability
questionnaire
Study design
Systematic review$ or randomi$ control$ trial or
randomi$ clinical trial or RCT or experimental or
prospective or retrospective or longitudinal or time
series or follow-up or cross-section$ or observation$ or
cohort
2.3.5 Eligibility criteria
Articles identified from the literature search were subjected to the following criteria in
other to be to be included in the review.
Criteria of study characteristics: (Liberati et al., 2009)
A. CWAD participants ≥ 6 months post injury (Spitzer et al., 1995)
B. WAD II (Cote et al.,, 2001; Kamper et al.,, 2008)
C. Aged above 18 years (Soderlund and Denison, 2006; Williams et al., 2007)
D. Study reported at least one impairment using an outcome measure (Williams et al.,
2007)

37
E. Systematic review, randomised controlled trial [RCT], or cohort study as they provide
the highest level of evidence (Sackett et al., 1996, 1997; NICE 2001)
Criteria of report characteristics: (Liberati et al., 2009)
A. Abstracts, full reported articles, reports, conference proceedings (Liberati et al.,, 2009)
B. Any language (Higgins and Altman 2009; Liberati et al., 2009). Potential articles
published in other languages will be translated into English.
C. Publications and unpublished materials (CRD systematic reviews 2009; Higgins and
Altman 2009; Liberati et al., 2009).
2.3.6 Articles generated from the literature search strategy
The search generated 985 potential articles. Following review of the title, abstract, or full
text, 868 articles were found to be irrelevant; 54 articles were duplicates; and 32 articles
failed to fulfil all inclusion criteria. 30 articles representing 23 studies fulfilled all review
criteria and were therefore included. The search result is presented as Figure 2.10.

38
Figure 2.6: Articles generated from the search strategy
2.3.7 Evaluation of the quality of eligible articles using the GRADE appraisal tool
The quality of evidence component of the Grading of Recommendations Assessment,
Development and Evaluation [GRADE] appraisal tool was used to evaluate the quality of all
30 eligible articles (Atkins et al., 2004; Guyatt et al., 2008; Brozek et al., 2009). GRADE
utilises two components (a) rating the quality of evidence and (b) grading the strength of
recommendations in systematic reviews, health technology assessments, and clinical practice
guidelines in other to inform alternative management options (Brozek et al., 2009; Guyatt et

39
al., 2011). The tool enjoys a benefit over other widely used appraisal tools including:
PRISMA, Cochrane, CRD, Scottish Intercollegiate Guidelines Network (SIGN), and
National Service Framework for long-term neurological conditions critical appraisal tool
(NSF)] in that it allows appraisal of quality of evidence across different study designs using
explicit and comprehensive criteria to downgrade and upgrade the quality of the source of
the evidence (Guyatt et al., 2008; Brozek et al., 2009). For example, within the hierarchy of
research designs, randomised controlled trials, considered as the highest level of evidence,
are placed at the top. Controlled observational studies are placed in the middle, while
uncontrolled studies and opinion are placed at the bottom of the hierarchy (Sackett et al.,
1996).
GRADE recognises that quality can be compromised by imprecision, inconsistency,
indirectness of study results and publication bias, irrespective of the study design (Guyatt et
al., 2011). The presence or absence of a limitation warrants a downgrade or upgrade
(depending on design) of the quality of evidence to reflect the level of confidence in study
conclusions (Guyatt et al., 2011). GRADE therefore provides a useful, unbiased approach to
evaluate quality of evidence in CWAD, because different study designs have been used to
report the presence of sensory impairments in the condition, and methodological limitations
may exist (Guyatt et al., 2008). Despite the benefits of GRADE, its primary focus to
treatment interventions limits its use for this review (Guyatt et al., 2011). However, because
characteristics within one (level of evidence) out of the two components of the tool are
generic to intervention and non-intervention studies, the use of this component for the
evaluation of quality is supported. The GRADE tool was therefore adapted so that only the
level of evidence component ([A] in figure 2.11) was utilised for appraising the quality of the
40
30 eligible articles in the review. Another component that was focused to the level of clinical
importance (critical, important, low importance) of the sensory impairments in CWAD was
used as a part of the appraisal process [Figure 2.11 (A)] (Guyatt et al., 2011). The level of
clinical importance was informed by previous research conclusions on their role in CWAD
(Guyatt et al., 2011). Both components of quality of evidence and clinical importance were
used to inform the level of evidence provided for the sensory impairments [Figure 2.11 (A)]
(Guyatt et al., 2011).
GRADE provides a transparent stepwise process that helps to link level of evidence to
recommendations for the consumption of patients, clinicians and policy makers (Guyatt et
al., 2008, 2011; Brozek et al., 2009). Baker et al (2011) compared grading and appraisal
tools of GRADE, SIGN, and NSF in relation to important factors (methodological strengths
and weaknesses, applicability and ease of use) that specialist groups considered to be
important when selecting an evidence grading system. The study used n=12 assessors to
grade papers (n=20) over a 3 month time frame. The results, independently assessed for
emerging themes, showed that all 3 systems had strengths and weaknesses depending on the
type of evidence being evaluated. GRADE was reported as the most complex but rigorous
system. SIGN and NSF were reported to be more user-friendly, but less methodologically
rigorous. In grading the evidence, 10% of assessors used GRADE incorrectly, 33% used
SIGN incorrectly and 75% used NSF incorrectly. Despite this findings, Kavanagh (2009)
criticised GRADE for its poor inter-rater reliability [kappa value, k=0.27] and lack of data to
support its validity. In contrast, Ansari et al (2009) argued that GRADE should be recognised
and utilised as a framework rather than a health tool that would require measurement
properties of reliability and validity. They further argued that GRADE should be used

41
primarily to uncover implicit subjectivity and provide a systematic, transparent and explicit
approach to capturing evidence. GRADE has been reported as the best available approach to
deal with inherent subjectivity when assessing or rating evidence (Ansari et al., 2009). These
arguments outweigh the limitations of GRADE, and support its use to appraise the level of
evidence for the 30 eligible CWAD II studies.
Figure 2.7: Schematic representation of GRADE appraisal tool, developed from Guyatt et
al., (2008).
2.4 Level of evidence for impairments in CWAD II
Thirty articles were included, representing 23 cohorts. Using GRADE, 17 articles (44%) [10
cohorts] were rated high quality; 7 articles (30%) [7 cohorts] were rated moderate quality; 4
articles (17%) [4 cohorts] were rated low quality; 2 articles (9%) [1 cohort; 1 systematic
review] were rated very low quality. Table 2.2 presents the GRADE summary of findings
GRADE
Level of evidence Strength of recommendation
Clinical Importance of
Outcomes
Level of Evidence
Quality of Evidence Effect size of
Intervention
A B
42
table. A range of impairments [motor, sensory, psychological and limitations of function]
were identified from the articles. Although evidence for all the impairments were appraised,
the focus of the discrimination study informed the consideration of only impariments of
sensory function. The other impairments were used to describe participants in the sensory
discrimination study and is described in Chapter 8 of the thesis.
2.4.1 Sensory impairments in CWAD II
Thirteen of the 30 eligible articles [10 cohorts] reported on sensory impairments in CWAD
(Koelbaek-Johansen et al., 1999; Sterling et al., 2002, 2003, 2006; Banic et al., 2004;
Greening et al., 2005; Kasch et al., 2005; Raak and Wallin, 2006; Elliot et al., 2008, 2009;
Gerdle et al., 2008; Wallin and Raak, 2008; Chien et al., 2009). 8 articles [6 cohorts] were
rated high quality (Sterling et al., 2003, 2006; Kasch et al., 2005; Gerdle et al., 2008; Wallin
and Raak, 2008; Chien et al., 2009; Elliot et al., 2009); and 5 articles [4 cohorts] were rated
moderate quality (Koelbaek-Johansen et al., 1999; Sterling et al., 2002; Banic et al., 2004;
Greening et al., 2005; Raak and Wallin, 2006) [Table 2.2]. In terms of clinical importance,
sensory impairments were rated as critical [underpins a very important and relevant outcome
variable] based on evidence within the whiplash literature (Kasch et al., 2005; Sterling et al.,
2003, 2006; Wallin and Raak 2008) [Table 2.2]. The level of evidence for sensory
impairments in CWAD is considered to be high owing to the moderate to high quality
studies and the critical clinical importance of sensory impairments.
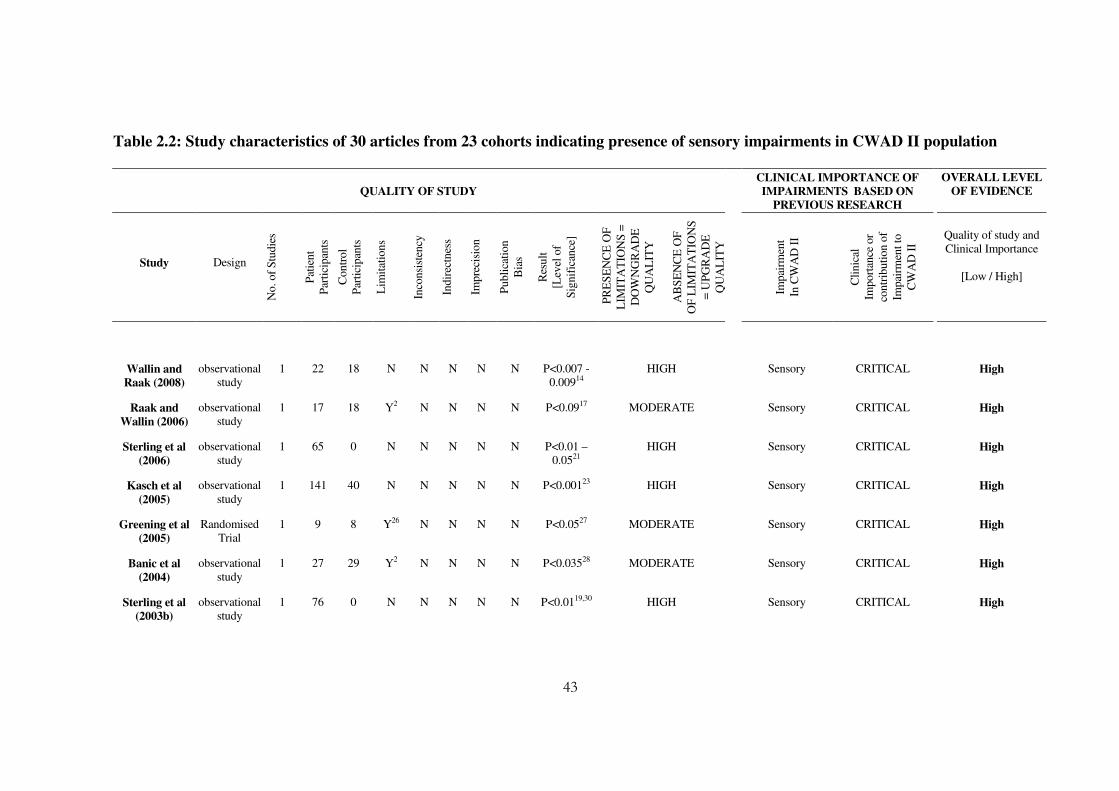
43
Table 2.2: Study characteristics of 30 articles from 23 cohorts indicating presence of sensory impairments in CWAD II population
QUALITY OF STUDY
CLINICAL IMPORTANCE OF
IMPAIRMENTS BASED ON
PREVIOUS RESEARCH
OVERALL LEVEL
OF EVIDENCE
Study
Design N
o. of
Stu
die
s
Pat
ient
P
arti
cipan
ts
Contr
ol
Par
tici
pan
ts
Lim
itat
ions
Inco
nsi
sten
cy
Indir
ectn
ess
Impre
cisi
on
Publi
cati
on
Bia
s
Res
ult
[L
evel
of
Sig
nif
ican
ce]
PR
ES
EN
CE
OF
LIM
ITA
TIO
NS
=
DO
WN
GR
AD
E
QU
AL
ITY
A
BS
EN
CE
OF
OF
LIM
ITA
TIO
NS
=
UP
GR
AD
E
QU
AL
ITY
Impai
rmen
t
In C
WA
D I
I
Cli
nic
al
Import
ance
or
contr
ibuti
on o
f
Impai
rmen
t to
CW
AD
II
Quality of study and Clinical Importance
[Low / High]
Wallin and
Raak (2008)
observational study
1 22 18 N N N N N P<0.007 - 0.00914
HIGH Sensory CRITICAL High
Raak and
Wallin (2006)
observational study
1 17 18 Y2 N N N N P<0.0917 MODERATE Sensory CRITICAL High
Sterling et al
(2006)
observational study
1 65 0 N N N N N P<0.01 – 0.0521
HIGH Sensory
CRITICAL High
Kasch et al
(2005)
observational study
1 141 40 N N N N N P<0.00123 HIGH Sensory CRITICAL High
Greening et al
(2005)
Randomised Trial
1 9 8 Y26 N N N N P<0.0527 MODERATE Sensory CRITICAL High
Banic et al
(2004)
observational study
1 27 29 Y2 N N N N P<0.03528 MODERATE Sensory CRITICAL High
Sterling et al
(2003b)
observational study
1 76 0 N N N N N P<0.0119,30 HIGH Sensory CRITICAL High

44
Sterling et al
(2002)
observational study
1 156 95 Y2 N N N N P<0.0131 MODERATE Sensory CRITICAL High
Elliot et al.,
2010
observational study
1 78 31 N N N N N p<0.00011 HIGH Motor IMPORTANT High
Woodhouse et
al (2010)
observational study
1 35 48 Y3 N N N N p<0.00011 VERY LOW Motor IMPORTANT Low
Elliot et al
(2009)
observational study
1 79 0 N N N N N P<0.015 HIGH Motor
IMPORTANT High
Elliot et al
(2008a)
observational study
1 79 34 N N N N N P<0.00011 HIGH Motor IMPORTANT High
Elliot et al
(2008b)
observational study
1 79 23 N N N N N P<0.0019 HIGH Motor IMPORTANT High
Gerdle et al
(2008)
observational study
1 21 20 N N N N N P<0.00110 HIGH Motor IMPORTANT High
Woodhouse and
Vasseljen (2008)
observational study
1 59 57 Y3 N N N N P<0.0113 LOW Motor IMPORTANT Low
Descarreaux et
al (2007)
observational study
1 17 14 Y N N N N P<0.0515 LOW Motor IMPORTANT Low
Elliot et al
(2006)
observational study
1 73 34 N N N N N P<0.00011 HIGH Motor IMPORTANT High
Armstrong et al
(2005)
Randomised trial
1 23 23 N N N N N P<0.0522 HIGH Motor IMPORTANT High

45
Koelbaek-
Johansen et al
(1999)
observational study
1 11 11 Y2 N N N N P<0.0133 MODERATE Motor IMPORTANT High
Sterling et al
(2003c)
observational study
1 66 20 N N N N N P<0.0130 HIGH Motor IMPORTANT High
Buitenhuis et al
(2006)
observational study
1 240 0 N N N N N P<0.0318,19 HIGH Psychological CRITICAL High
Carroll et al
(2006)
observational study
1 5211 0 N N N N N 17.8% - 42.3%20
HIGH Psychological CRITICAL High
Williamson et al
(2008)
Systematic Review
17 0 0 Y12 N N N N - VERY LOW Psychological CRITICAL Low
Sterling et al
(2006)
observational study
1 65 0 N N N N N P<0.01 – 0.0521
HIGH Psychological CRITICAL High
Sterling et al
(2003a)
observational study
1 76 0 N N N N N P<0.0129 HIGH Psychological CRITICAL High
Wenzel et al
(2002)
observational study
1 61110 0 N N N N N 15.0% - 24.2%32
HIGH Psychological CRITICAL High
Wenzel et al
(2009)
observational study
1 1095 52208 N N N N N OR=6.87-9.586
OR=2.3-2.136
MODERATE Functioning IMPORTANT High
Holm et al
(2007)
observational study
1 266 0 Y N N N N OR16 LOW Functioning IMPORTANT High
Bunketorp et al
(2005)
observational study
1 108 931 Y24 N N N N P<0.00125 LOW Functioning IMPORTANT High
KEY: Level of significance achieved for impairments evaluated

46
1 p<0.0001 for measures evaluated 2 demographic, medico-legal, social and treatment issues
3 Examiner was not blinded to participants grouping but claimed commands were standardized. 4 P<0.01 for pain catastrophising; P<0.001 for chronic pain self efficacy 5 P<0.01 presence of association between fatty infiltrate in cervical muscle and sensory, physical and psychological measures 6 Odds ratio [OR] of 6.87 - 9.58 for reported widespread pain and stiffness; 2.3 -2.13 for depression and anxiety 7 [P<0.05 for lowered pressure pain at all test sites]; [P<0.05 for vibration detection at all sites]; [P<0.01 for cold pain at all sites]; [P>0.1 for heat pain at all sites]; [P<0.01 for heat detection at all sites]; [P<0.05 for cold detection at 5th metacarpal]; [P<0.01, 0.01, 0.05 for electrical detection - 2000Hz, 250 Hz and 5Hz respectively at upper limb sites; P>0.83 at tibialis anterior]; [P=0.05 for SVR and QI]; [P=0.05 for pain and brachial plexus provocation test]; [P<0.05 for psychological factors] 8 P<0.05 for cold and mechanical pain 9 P<0.001 for altered cold pain thresholds and fatty infiltrate distinguish whiplash from insidious-onset neck pain 10 P<0.001 for pressure pain over trapezius and tibialis anterior muscle; P=0.008 for elevated levels of interleukin-6; P<0.05 for elevated levels of interstitial pyruvate; P=0.05 for elevated levels of serotonin 11 methodological issues include: participants recruitment; different methods used at baseline and end point for measuring smooth pursuit eye movements; data collecting and analysis; confounding variables such as medication / treatment prior to testing was uncontrolled for; 12 systematic reviews inclusion criteria for language of publication [English] 13 P<0.01 for decreased conjoint motion in whiplash group 14 P<0.007 for cold pain and P<0.009 for heat pain between WAD and control; lowered score on the HRQoL questionnaire [SF-36] 15 P<0.05 for lowered maximal voluntary contractions in flexion and extension in WAD; P=0.038 for lowered time to peak force in WAD; No significant difference in EMG recordings 16 21% developed widespread pain; odds for developing WP was> in those with depressive symptom (OR 3.2); VAS pain 55-100 (OR 3.2); pain>3 months (OR 1.9); localised pain (OR 2.6) 17 P<0.01 for warmth threshold; P=0.038 for heat apin; P=0.03 for cold pain when comparing thenar emminence and trapezius muscle sites within the whiplash group. P=0.048 for warmth threshold over the thenar eminence; P=0.09 for heat pain; P=0.07 for cold pain over the trapezius muscle; P=0.03 for pain catastrophising between whiplash and control 18 P<0.03 for presence of PTSD at 6 and 12 months and this was related to severe con-current post-whiplash complaints 19 Age, gender, back pain intensity, use of medication and diagnosis of PTSD 20 42.3% [95% CI 40.9-43.6] of cohort developed depressive symptoms within 6 weeks post injury; subsequent onset in 17.8% [95% CI 16.5-19.2]; recurrent or persistent in 37.6% of those presenting early post injury onset. 21 P<0.01 for neck ROM and EMG for neck muscle activity; P<0.01 for sensory measures of pressure, heat and cold pain, brachia plexus provocation test response; P<0.01 for psychological measures of general health, PTSD and fear avoidance at 6 months and 2-3 years post injury 22 P<0.05 for active cervical ROM; P>0.05 for neck position sense 23 whiplash group showed higher pain scores at 6 months follow-up and non recovery compared to the ankle pain controls; P<0.001 for increase in pain area at 12 months post whiplash injury 24 methodological flaws in control participants sampling 25 P<0.001 for higher NDI and neck pain intensity 26 sample size and inadequate power 27 P<0.05 for median nerve longitudinal and TM in whiplash compared to control 28 P<0.035 for reflex thresholds after repeated and P<0.024 after single stimulation in whiplash

47
compared to controls 29 P<0.01 for GHQ and IES psychological measures at 6 months 30 Significant difference P<0.01 between entry and exit data for outcome measures studied in this whiplash cohort 31 P<0.001 for reduced elbow ROM and pain response during the brachial plexus provocation test in CWAD compared to controls 32 24.2% and 15.0% showed elevated levels of anxiety and depression in the whiplash cohort studied 33 P<0.01 for measures of pressure pain and generalised pain distribution

48
The identified sensory impairments included local and widespread hypersensitivity,
hyperalgesia and hypoesthesia to stimuli [thermal, mechanical and electrical stimuli],
allodynia, and sympathetic nervous system dysfunction [See Table 2.2]. There was a high
level of evidence for local and widespread lowered pressure pain threshold [PPT] (Koelbaek-
Johansen et al., 1999; Sterling et., 2003, 2006; Greening et al., 2005; Gerdle et al., 2008;
Chien et al., 2009; Elliot et al., 2009); elevated vibration detection threshold [VDT] (Chien et
al., 2009); and lowered cold pain threshold [CPT] (Sterling et al., 2003, 2006; Kasch et al.,
2005; Raak and Wallin, 2006; Elliot et al., 2008, 2009; Wallin and Raak, 2008; Chien et al.,
2009). In addition, there was a moderate to high level of evidence for increased response to a
neurodyanmic test [brachial plexus tension test – BPPT, now referred to as ULNT in the
literature] (Sterling et al., 2002, 2003; Greening et al., 2005; Chien et al., 2009). In contrast,
there was a moderate to high evidence for lowered heat pain threshold [HPT] (Sterling et al.,
2003, 2006; Raak and Wallin, 2006, 2008; Chien et al., 2009); and local and widespread
elevated electrical detection threshold [EDT] (Banic et al., 2004; Chien et al., 2009). The
sensory impairments that demonstrated moderate to high level of evidence were taken
forwards to the discrimination study, but the measurement properties of tests to evaluate
them were explored prior to their use in the study. However, EDT and HPT were dropped
due to limitations already discussed in Chapter 1, Section 1.6. Overall, there was moderate to
high level of evidence for presence of altered pressure, cold, and vibration thresholds, and
altered response to mechanical stretch in CWAD II. Measurement properties of sensory tests
to evaluate the impairments relating to pressure, cold, vibration and mechanical stretch were
however not critiqued in detail as this was beyond the focus and scope of this thesis.

49
A. Widespread lowered PPT
Seven studies (Koelbaek-Johansen et al., 1999; Sterling et., 2003, 2006; Greening et al.,
2005; Gerdle et al., 2008; Chien et al., 2009; Elliot et al., 2009) demonstrated high level of
evidence for local and widespread lowered PPT.
Koelbaek-Johansen et al (1999) examined sensibility in CWAD II participants using pressure
stimulation, pin-prick stimulation, and cotton swap. They found pressure pain thresholds to
be lowered in the WAD group (p<0.01) compared to a gender and age matched healthy
group. Although Johansen et al (1999) provides evidence for lowered PPT in CWAD II, their
low sample size and restricted age range [28 – 69 years] warrant caution when interpreting or
implementing their findings.
Sterling et al (2003, 2006) showed evidence of lowered PPT over the C2/3, C5/6 articular
pillars, median, radial and ulnar nerve trunk at the elbow, and at a remote site [tibialis
anterior] in 76 CWAD II-III in comparison to 20 healthy individuals (p<0.01). They
concluded that their findings demonstrated that presence of central hypersensitivity to
pressure contributed to CWAD pain. However, it is not clear whether one or both WAD
subgroups [II or III] contributed to the reported lowered PPT.
Greening et al (2005) reported signs of local mechanical allodynia [pain response to non-
innocuous stimuli] following moderate digital pressure over the trunk of the median nerve
and chords of the brachial plexus in 9 CWAD II participants. They concluded that local
mechanosensitivity may contribute to pain in CWAD, although the study was underpowered
and the digital pressure utilised was not calibrated. This is in contrast to the pressure
50
algometry that was used in other CWAD studies (Koelbaek-Johansen et al., 1999; Sterling et
al., 2003, 2006; Elliot et al., 2009; Gerdle et al., 2008; Chien et al., 2009). However, the
results from Greening et al (2005) agree with findings reported within other pressure
algometry studies (Koelbaek-Johansen et al., 1999; Sterling et al., 2003, 2006; Elliot et al.,
2008, 2009; Gerdle et al., 2008; Chien et al., 2009).
Gerdle et al (2008) reported signs of generalised hypersensitivity to pressure over the
trapezius and tibialis anterior muscles in 22 female CWAD II participants compared to 20
healthy females (p<0.001). They concluded that CWAD II is characterised by local and
widespread sensory hypersensitivity that reflects an underlying disordered peripheral and
central nervous system. Their conclusions are not generalisable due to the study focus to the
female gender.
Elliot et al (2009) reproduced findings from Gerdle et al (2008) when they reported local and
remote lowered PPT over C2/3, C5/6 articular pillars and tibialis anterior muscle in 79
CWAD II females in comparison to 23 healthy female individuals with INP (p<0.001). Their
cohort was restricted to female participants owing to a higher incidence of persistent pain
post whiplash documented in women (Larsen and Holm, 2000). Although data for the 2
study groups were collected at different time points, their findings agree with other CWAD
PPT studies (Koelbaek-Johansen et al., 1999; Sterling et al., 2003, 2006; Gerdle et al., 2008;
Chien et al., 2009).
Chien et al (2009) found lowered PPT over the articular pillars of C5/6, trunk of median
nerve at the elbow and belly of tibialis anterior in 31 CWAD II participants, compared to 31

51
healthy individuals (p<0.05). Their findings are in agreement with previous CWAD II
studies (Koelbaek-Johansen et al., 1999; Sterling et al., 2003, 2006; Elliot et al., 2008;
Gerdle et al., 2008).
Overall, there is consistent evidence for lowered pressure pain threshold over the C2, C5/6
articular pillars, median nerve trunk and tibialis anterior muscles in CWAD II. Measurement
properties of tools used to evaluate PPT were explored as discussed in Section 2.3.1 of this
Chapter. Measurement properties were however focused to reliability and validity as both
properties are reported in the scientific literature to be important requirements that tests used
for research and clinical purposes must fulfil (Sherman et al., 2011). This is important
because decisions regarding the appropriateness of a test for a particular purpose, sample,
and setting are informed by evidence of a test’s reliability and validity (Sherman et al.,
2011).
(i) Measurement properties of tools to evaluate PPT
PPT occurs at the transition point when applied pressure is sensed as pain (Fischer, 1988).
PPT can be used to demonstrate sensory hypersensitivity (Kosek et al., 1993). Pain response
to an unusually low pressure is suggested to reflect an underlying sensory mechanism (Rolke
et al., 2006). Algometry describes the method, while the algometer is the instrument used to
evaluate PPT (Rolke et al., 2006). The algometer evaluates the maximum amount of pressure
an individual can cope with before the pressure sensation becomes sensed as pain (Fischer,
1987). Pressure pain sensory testing target both C and Aδ fibres peripherally and the
spinothalamic tract centrally (Hanson et al., 2007). PPT has been previously evaluated in
WAD using the algometer [Somedic AB, Farsta, Sweden] (Scott et al., 2005; Sterling et al.,

52
2002b, 2008; Chien et al., 2008). The intra-rater reliability (Fischer, 1987; Nussbaum and
Downes, 1998; Rolke et al., 2006; Ylinen et al., 2007) and criterion validity (Kinser et al.,
2009) of pressure algometry has been established within the literature.
B. Widespread lowered CPT
Eight studies (Sterling et al., 2003, 2006; Kasch et al., 2005; Raak and Wallin, 2006; Elliot et
al., 2008, 2009; Wallin and Raak, 2008; Chien et al., 2009) demonstrated high level of
evidence for local and widespread lowered CPT.
Sterling et al (2003, 2006) showed evidence of lowered CPT over the C2/3, C5/6 articular
pillars, median, radial and ulnar nerve trunk at the elbow, and at a remote site [tibialis
anterior] in 76 CWAD II-III when compared to 20 healthy individuals (p<0.01). Their
finding provides evidence for the presence of central hypersensitivity to cold in CWAD II.
They also found CPT to be a significant predictor of poor outcome at long term follow up
(OR = 1.1 – 1.13). However, the contribution of one or both WAD subgroups [II or III] to
the lowered CPT remains unknown. The implication is that their conclusions cannot be
generalised to a CWAD subgroup. Also, comparison of their findings to studies that are
focused to a CWAD subgroup is difficult.
Kasch et al (2005) evaluated CPT over the hand in 141 CWAD participants [subgroups I-III]
and 40 chronic ankle-injured. They found lowered CPT in the CWAD group when compared
to the ankle-injury group (p<0.01). In addition, they reported larger areas of pain in their
non-recovered CWAD group (p<0.001). However, the contribution of one WAD subgroup
[I, II or III] to the lowered CPT remains unknown. Also, their conclusions cannot be

53
generalised to a CWAD subgroup as features and characteristics are reported to differ across
the subgroups (Spitzer et al., 1995). Also, comparison of their findings to studies that are
focused to a CWAD subgroup is difficult.
Raak and Wallin (2006) found significant differences in CPT over the trapezius muscle
(p<0.007) and thenar eminence of the hand (p<0.048) in 17 CWAD participants when
compared with 18 healthy individuals. They concluded that treatment strategies directed at
cold sensory impairment were important when considering management of patients
presenting with CWAD. However, their sample’s CWAD subgroup was not declared, so the
contribution of one of the subgroups [0-IV] to the lowered CPT remains unknown. This is
important because CWAD subgroups have been described as heterogeneous (Spitzer et al.,
1995), and when investigated as a homogenous group, can lead to misleading conclusions
and in addition, limit generalisability to a subgroup.
Wallin and Raak (2008) found significant difference in CPT over the trapezius muscle in 26
CWAD participants when compared to 18 healthy individuals (p<0.007). However, their
CWAD subgroup was not declared, so the contribution of individual subgroups [0-IV] to the
reported lowered CPT was not clear. Same implication for authors’ previous study is
applicable.
Elliot el al (2008, 2009) reported local and remote lowered CPT over C2/3, C5/6 articular
pillars and tibialis anterior muscle in 79 females presenting with CWAD II when compared
with 23 females presenting with INP (p<0.001). Although data from the groups were
collected at different time points, a contrast with methods used in other CWAD research,

54
they report findings that are in agreement with the CWAD studies (Sterling et al., 2003,
2006; Kasch et al., 2005; Raak and Wallin, 2006; Wallin and Raak, 2008; Chien et al.,
2009). However, their findings are not comparable to previous CWAD research, due to its
focus to the female gender.
Chien et al (2009) found lowered CPT over the articular pillars of C5/6, trunk of median
nerve at the elbow and belly of tibialis anterior in 31 CWAD II participants when compared
to 31 healthy individuals (p<0.01). Their findings are in agreement with previous CWAD
studies (Sterling et al., 2003, 2006; Kasch et al., 2005; Raak and Wallin, 2006; Wallin and
Raak, 2008). It however addressed issues of subgroups that was a key limitation of previous
CWAD studies. Their findings therefore provide evidence to suggest the presence of lowered
CPT in CWAD II patients.
Overall, there is consistent evidence for lowered CPT over the C2, C5/6 articular pillars,
median nerve trunk and tibialis anterior muscles in CWAD II. Measurement properties of
tools to evaluate CPT were explored, and the rationale for this doing has already been
discussed.
(i) Measurement properties of tools to evaluate CPT
CPT occurs at a transition point when cold becomes sensed as pain (Hansson et al., 2007),
and is used to demonstrate sensory hypersensitivity (Kosek et al., 1993). CPT can be
evaluated through a thermotest equipment [Somedic AB, Sweden], that measures the amount
of cold that an individual can cope with before the stimulus becomes sensed as pain (Rolke
et al., 2006). CPT is used to assess the integrity of small fibre and spinothalamic tract

55
function (Hanson et al., 2007). Evidence regarding measurement properties (reliability and
validity) of CPT is sparse despite the increasing use of the test for research and clinical trials.
However, the intra-rater (Krassioukov et al., 1999; Park et al., 2001) and inter-rater
reliability (Felix and Widerström-Noga, 2009) of CPT have been established in the literature.
The validity of CPT measurements has been established in the literature (Hansson et al.,
2007) although the type of validity that was investigated is unclear.
C. Widespread elevated VDT
There was high level of evidence for elevated vibration threshold (Chien et al., 2009). The
authors found elevated VDT over the dorsal surface of the 2nd and 5th metacarpal and palmar
surface of the 1st and 2nd metacarpal in 31 CWAD II participants when compared to 31
healthy individuals (p<0.05). This is the first study within the literature that has evaluated
VDT in CWAD II participants. However, there was no VDT investigation over areas (sites)
of the neck and Tibialis anterior muscle, when compared to other CWAD II sensory studies
(Koelbaek-Johansen et al., 1999; Sterling et al., 2002, 2003, 2006; Banic et al., 2004;
Greening et al., 2005; Kasch et al., 2005; Raak and Wallin, 2006; Elliot et al., 2008, 2009;
Gerdle et al., 2008; Wallin and Raak, 2008; Chien et al., 2009) that have used those sites to
investigate local and remote sensory changes (Greening et al., 2005; Sterling et al., 2006). As
a consequence, their conclusions are limited and further studies are required to replicate their
findings over sites that were not investigated, to assist interpretation and comparison of
findings to previous CWAD studies. Measurement properties of reliability and validity for
tools used to evaluate VDT were explored, and the rationale underpinning this decision has
already been discussed.

56
(i) Measurement properties of tools to evaluate VDT
VDT evaluates Aβ fibres peripherally and the lemniscal tract centrally (Hanson et al., 2007)
through a tuning fork [64, 128, 256Hz], Vibrametre [Somedic AB, Sweden with a tissue
displacement range of 0.1+-400 mm and a constant frequency of 120 Hz]; or a Vibratimer
(O’Conaire et al., 2011). VDT is agreed to be useful for early detection of peripheral
pathologies (Goldberg and Lindblom, 1979). The intra- and inter-rater reliability for the
Vibrameter (Peters et al., 2003); inter-rater reliability for the Vibratimer and the tuning fork
as well as the concurrent validity for the Vibratimer (O’Conaire et al., 2011) have been
established in the scientific literature.
D. Increased sensory response to passive mechanical stretch
There was moderate to high level of evidence for increased response to a neurodyanmic test
[brachial plexus tension test – BPPT, now referred to as ULNT in the sensory literature]
(Sterling et al., 2002, 2003; Greening et al., 2005; Chien et al., 2009). The ULNT is used to
move and exert mechanical longitudinal stress on peripheral nerve trunks, their proximal
nerve roots and the cervico-brachial plexus (Jaberzadeh et al., 2005). The test increases
tension on peripheral nerves as they stretch or slide in response to multi-joint (combinations
of joint) motion, and results in sensory and motor responses that are interpreted and used to
inform clinical decisions (Jaberzadeh et al., 2005). Restrictions along the course of the nerve
and or inflammation around the nerve surrounding are proposed as responsible for a positive
response during the test (Hall et al., 1993; Balster & Jull, 1997; Elvey, 1997; Butler, 2000;
Greening et al., 1998, 2001, 2005; Shacklock et al., 2005). However, this claim is largely
informed by animal and cadaver studies, but has not been verified in humans’ in-vivo.

57
Sterling et al (2002) reported a decrease in elbow extension range of movement and higher
pain scores using a visual analogue scale [VAS] following the ULNT 1 in 156 CWAD II-III
participants in comparison to 95 healthy individuals (p<0.001). However, it is not clear
whether one or both WAD subgroups [II or III] accounted for their results. As a
consequence, comparison of their findings to other ULNT studies is limited, and
generalisation of their conclusions to one of the subgroups is difficult.
Sterling et al (2003) showed evidence of reduced elbow extension range of movement and
higher pain scores [using a visual analogue scale] when performing the ULNT 1 in 76
CWAD II participants in comparison to 20 healthy individuals (p<0.01). The size of their
healthy group was disproportional to their WAD group and could have skewed their
statistical analysis. Their findings however identified and support test components that are
used in a clinical setting to demonstrate a positive ULNT 1 (Nee and Butler, 2006).
Greening et al (2005) reported signs of local hypersensitivity to mechanical stretch when
performing the ULNT 1 in 9 CWAD II participants, concluding that mechanisms promoting
local hypersensitivity to mechanical stretch may contribute to symptoms in CWAD. They
also found that nerve movement in a longitudinal plane was reduced in the CWAD II
participants when compared to 8 healthy individuals (p<0.05). A key limitation of their study
is the small sample size. However, its findings provide preliminary data to suggest that
altered movement of peripheral nerves is an important construct of the ULNT that underpin
responses observed during the test. Further studies are required to replicate their findings in a
larger sample.

58
Chien et al (2009) reported decreased elbow extension range of movement [ROM] and
higher pain VAS scores when performing ULNT 1 in 31 CWAD II participants when
compared to 31 healthy individuals (p=0.05). Their findings agree and support one of the
proposed criteria used to interpret a positive ULNT 1 response, i.e. increased pain response
linked to decreased elbow extension ROM (Nee and Butler 2006). However, their evidence
does not capture other criteria e.g. nerve movement, flexor muscle resistance that are used to
interpret a positive ULNT 1. Further evaluation of the four constructs is required in CWAD
to support the hypothesis that is currently relied upon when interpreting the test.
Overall, there was moderate to high level of evidence for increased response to ULNT. It is
important to explore the measurement properties of ULNT prior to including the test in the
sensory discrimination study. The rationale underlying this decision has been discussed
already.
(i) Measurement properties of ULNT
The intra-rater reliability of ULNT has been reported within the scientific literature
(Selvaratnam et al., 1994; Coppieters et al., 2002; Oliver et al., 2010). However, the
construct validity of the test has been informed by cadaver [in-vitro] studies (Kleinrensink et
al., 1994, 1995, 2000; Shaclock 1996; Wright et al., 1996; Lewis et al., 1998; Coppieters et
al., 2001; Coppieters and Butler 2008). Available cadaver-based ULNT studies provide
preliminary validity evidence, but have been criticised as being limited in their conclusions
and applicability to humans because (a) nerves and surrounding tissues in cadavers do not
demonstrate same physiologic characteristics as those of living humans (b) procedures used
to embalm cadavers further adds to alter tissue characteristics and (c) pain response, an

59
important outcome of ULNT cannot be evaluated in cadavers (Coppieters et al., 2009).
There is no clarity about the type of validity investigated in the cadaver studies. Also, there is
a lack of supportive evidence for the four constructs or criteria used to interpret a positive
ULNT test. This is important because of ongoing debate challenging the usefulness and
rationale underlying the test. Firstly, there is discrepancy about the usefulness of ULNT for
patients e.g. CWAD who demonstrate signs of mechanical hypersensitivity (Dilley et al.,
2008; Nee and Butler 2006). Those in favour argued that the test is useful as it is able to
demonstrate sensory changes in neural structures (Nee and Butler 2006), while those against
it believe the test will further provoke and worsen patients’ sensitised nerves (Dilley et al.,
2008). Secondly, opinions are divided whether restriction of nerve movement, is actually
responsible for the increased pain, decreased elbow ROM and muscle resistance
demonstrated during the test [Figure 2.12]. The debate illustrates limitation in present
understanding of mechanism and effect of ULNT in-vivo. However, advancement in
biomedical technology is providing tools that are increasingly overcoming limitations of
previous research, thereby enabling further evaluation of components underpinning tests
such as ULNT in-vivo. Dynamic ultrasound imaging [DUI] is one such tool.

60
Figure 2.8: Theorised components underlying ULNT
Dynamic Ultrasound Imaging
With the emergence of DUI, it is now possible to evaluate nerve movement (Walker 2004) in
order to validate the ULNT in-vivo (Greening et al., 2005). Coppieters et al (2009) used DUI
in 10 healthy individuals to validate the theorised assumptions that neurodynamic positions
that promote nerve sliding were associated with more nerve movement than those that
promote tensioning. They found that more nerve movement occurred during neurodynamic
sliding (p<0.0001) when compared to the tensioning positions. However, a limitation of their
study is that the reported neurodynamic positions involved modifications to the ULNT limb
positions, and as a consequence, their evidence cannot be used to inform validity of the test.
Their findings are however important as it provided preliminary data that show potential of
DUI to be used to investigate nerve movement in-vivo, amongst the constructs used, to
interpret the ULNT. This construct have not been investigated in existing validity studies for
ULNT, and is therefore required to complete the evidence, particularly in a patient
Decreased elbow range of motion
Increased Flexor muscle activity
Increased pain response
ULNT
Multi-joint motion
Reduced nerve movement

61
population e.g. CWAD. However, prior to conducting the ULNT validity study, it was
important to first consider the measurement properties of DUI. This is important because
conflicting nerve movement estimates within same or similar pain conditions exists within
the DUI literature.
DUI evaluation of nerve movement is well reported within the literature (Heinemeyer and
Reimers 1998; Hough et al., 2000; Dilley et al., 2001; Greening et at 2001; Dilley et al.,
2003; Erel et al., 2003; Greening et al., 2005; Dilley et al., 2007; Ellis et al., 2008;
Coppieters et al., 2009; 2007). However, previous DUI studies have reported conflicting
nerve movement estimates that have raised concerns about the reliability of the method,
especially in a patient sample.
Greening et al (2001) compared median nerve movement in the transverse plane (referred to
hereafter as transverse movement [TM]) in non specific arm pain [NSAP] (n=12) against a
healthy group (n=16) and reported a 75% reduction in median nerve TM between the two
groups [Table 2.3]. However, in CWAD II participants (n=9), a pain condition suggested to
be similar to NSAP (Greening et al., 2005), same authors found increased median nerve TM
when compared to healthy individuals (Greening et al., 2005) [Table 2.3]. These findings
were unexpected, difficult for the authors to explain, and contrast with their previous reports,
considering that both groups are comparable. Their findings raise questions regarding
consistency of TM measurements and in turn, reliability of DUI technique for TM. The small
sample size of both studies could equally have affected their results and conclusions.
However, further investigation of TM, particularly, its reliability is warranted.

62
Greening et al., (2005) compared median nerve movement in the longitudinal plane (referred
to hereafter as longitudinal nerve movement [LM]) in NSAP (n=8) and healthy individuals
(n=8). They reported a 68% reduction in median nerve LM when compared to the healthy
group [Table 2.4]. However, same authors in a later study found no difference in median
nerve LM between NSAP (n=18) and healthy individuals (n=39) [Table 2.4]. These findings
are inconsistent, considering that both cohorts were sampled from the same pain sample. The
findings therefore raise questions regarding consistency of TM measurements and in turn,
reliability of DUI technique for LM. Further investigation of LM, particularly its reliability is
warranted.
Table 2.3: Conflicting estimates of median nerve TM
Study Sample Findings (mm)
Greening et
al (2005)
Greening et
al (2001)
9 CWAD
12 NSAP
8 Healthy
16 Healthy
7 times more median nerve TM in
CWAD (2.57 ±
0.80) Vs Healthy (0.39 ± 0.52)
75% reduction in median nerve TM in
NSAP (1.2) Vs healthy (4.8)
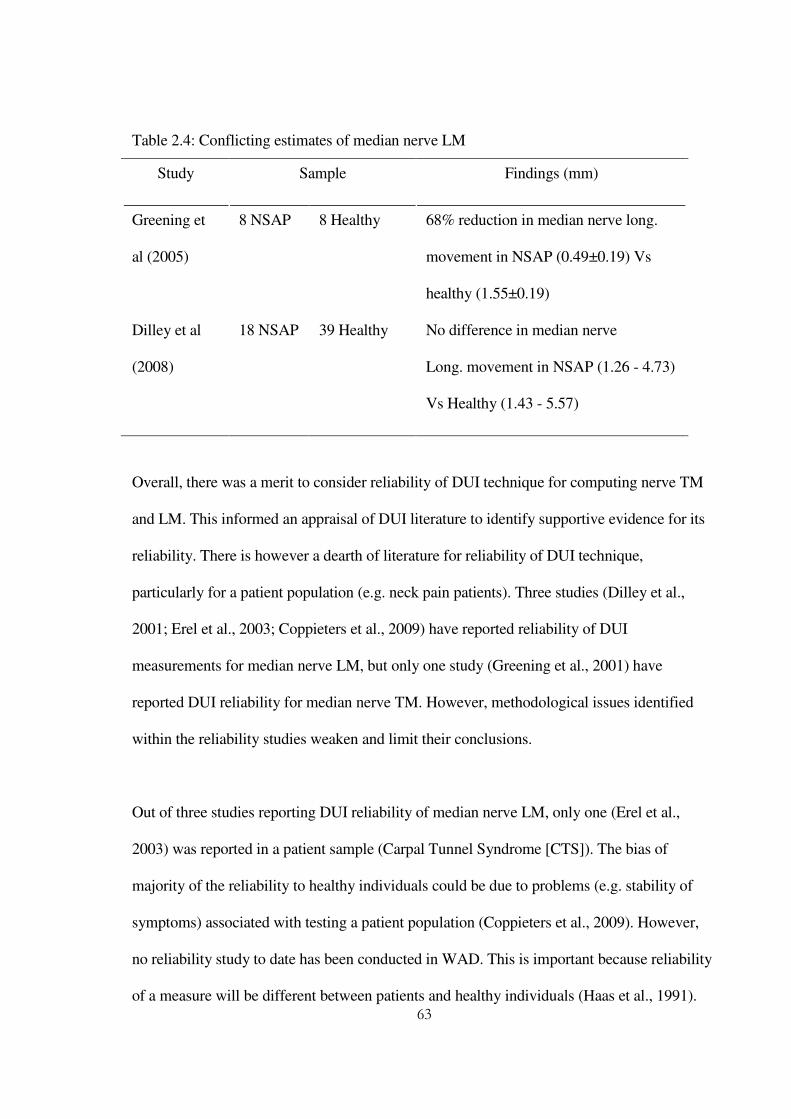
63
Table 2.4: Conflicting estimates of median nerve LM
Study Sample Findings (mm)
Greening et
al (2005)
Dilley et al
(2008)
8 NSAP
18 NSAP
8 Healthy
39 Healthy
68% reduction in median nerve long.
movement in NSAP (0.49±0.19) Vs
healthy (1.55±0.19)
No difference in median nerve
Long. movement in NSAP (1.26 - 4.73)
Vs Healthy (1.43 - 5.57)
Overall, there was a merit to consider reliability of DUI technique for computing nerve TM
and LM. This informed an appraisal of DUI literature to identify supportive evidence for its
reliability. There is however a dearth of literature for reliability of DUI technique,
particularly for a patient population (e.g. neck pain patients). Three studies (Dilley et al.,
2001; Erel et al., 2003; Coppieters et al., 2009) have reported reliability of DUI
measurements for median nerve LM, but only one study (Greening et al., 2001) have
reported DUI reliability for median nerve TM. However, methodological issues identified
within the reliability studies weaken and limit their conclusions.
Out of three studies reporting DUI reliability of median nerve LM, only one (Erel et al.,
2003) was reported in a patient sample (Carpal Tunnel Syndrome [CTS]). The bias of
majority of the reliability to healthy individuals could be due to problems (e.g. stability of
symptoms) associated with testing a patient population (Coppieters et al., 2009). However,
no reliability study to date has been conducted in WAD. This is important because reliability
of a measure will be different between patients and healthy individuals (Haas et al., 1991).

64
Also, the DUI reliability studies were focused to median nerve, and investigated intra-rater
reliability that can be associated with measurement error arising from inherent, innate bias
(Haas et al., 1991). These findings warranted further studies to provide a higher level of
evidence for reliability (inter-rater reliability) of DUI for radial and ulnar LM, as the nerves
are part of the brachial plexus implicated in sensory impairments in CWAD (Chien et al.,
2008).
The methodological quality of the three reliability studies (Dilley et al., 2001; Erel et al.,
2003; Coppieters et al., 2009) are queried [Table 2.5]. Dilley et al (2001) evaluated intra-
rater reliability of DUI estimate of median nerve LM during 3-4 repeated wrist [n=3] and
index finger [n=7] extension movement. Also, test-retest data was obtained for wrist [n=1]
and index finger [n=2] extension, at 5 and 14 days intervals respectively. They concluded
that DUI was reliable, interpreting statistics of within-participant and between-trial variation,
rather than the ICC that is widely recognised as the gold standard for interpreting reliability
(Haas et al., 1991; Bland and Altman, 1996). In addition, test-retest data for wrist and finger
extension varied by 0.5-0.7mm, which translates to >10-50% of the initial measurements.
Their study sample was also small. These limitations weaken their conclusions of good
reliability for DUI, and warrant further investigation of reliability of the technique.
Erel et al (2003) evaluated DUI reliability for median nerve LM in CTS (n=4). The authors
concluded that DUI was a reliable method, interpreting a within-participant standard
deviation of 0.31mm for repeated measurements on a single occasion and tests-retest (1-6
months) standard deviation of 0.41mm. The study was underpowered (Walter et al., 1998)
and their conclusions were not based on the ICC statistic (Haas et al., 19991). In addition, the

65
nerve movement [TM or LM] evaluated was not clear. Conclusion from the study is limited,
and generalisation to a nerve movement is difficult. Further evaluation of DUI reliability in a
patient sample is warranted.
Coppieters et al (2009) evaluated inter-rater reliability of the image analysis component of
DUI, using 3 raters and 10 median nerve LM images. The study reported excellent inter-rater
reliability [ICC2,1 = 0.96; 95% CI: 0.88 to 0.99; standard error of measurement [SEM] =
0.66mm; minimum detectable change [MDC] = 1.84mm]. They concluded that DUI was a
reliable technique. However, their study was underpowered, as Walter et al (1998) defined a
sample size of n ≥ 12, using n=3 raters, at 80% power and 5% level of significance. Also,
their study investigated one of the two components of DUI, and therefore provided
incomplete evidence for DUI reliability for LM. The limitations warranted further
investigation of DUI reliability that takes into account, both components of the technique.

66
Table 2.5: DUI reliability studies of median nerve LM
Study Participants Nerve (Level of
Reliability)
DUI component Reported
Statistics
Reported
Reliability
Dilley et al
(2001)
7 Healthy Median (Intra-rater)
Nerve Image Capture
and Image Analysis
*WS SD= 0.2-0.4mm
*WT SD = 10%
Good
Erel et al (2003)
4 Carpal Tunnel
Syndrome
Median (Intra-rater)
Nerve Image Capture
and Image Analysis
*WS SD = 0.31mm
*WT SD = 0.41mm
Good
Coppieters et al
(2009)
10 Healthy
Median (Inter-rater)
3 Raters
Nerve Image Analysis ICC2,1 = 0.96 Excellent
*WS – Within Participant; WT – *Within Trial; SD – Standard Deviation
67
There is only one study (Greening et al., 2001) that has evaluated reliability of DUI estimates
for median nerve TM. Greening et al (2001) evaluated test-retest reliability of DUI
measurement of median nerve TM using a Matlab® developed TpsDig nerve image analysis
program. The study measured median nerve TM in (a) healthy individuals and NSAP
participants (n=4), on two occasions [interval of 1-6 hours] and (b) healthy individuals (n=5)
at 1-2 days interval. The authors concluded that DUI was a reliable method, using the 1-2
days re-tests standard deviation -0.03 [SD=1.88; Range = -2.0±2.0] mm, rather than the ICC
statistic. Their heterogeneous sample limits the applicability of their findings and weakens
their study conclusions (Walter et al., 1998; Haas et al., 1991). Further, there is no report in
the literature regarding reliability of DUI estimates of radial and ulnar nerve TM.
Overall, existing evidence regarding reliability of DUI for LM and TM are focused to
median nerve, healthy individuals, intra-rater reliability, and use of re-test standard deviation.
These methodological issues can mislead interpretation of findings and also limit
generalisability of conclusions that emerge from the studies. Further evaluation of DUI
reliability for median, ulnar and radial nerves, in CWAD, using inter-rater reliability design,
and the ICC statistic was warranted. This study was required before DUI can be used, with
other measures to provide evidence of construct validity for the ULNT in CWAD II.
Findings from these preliminary studies provided evidence to complete the measurement
properties of ULNT, a criterion that all selected sensory impairments fulfilled.
2.5 Conclusions from the literature review
The aim of the literature review was to identify sensory impairments from high quality
evidence, to justify sensory tests that were used to discriminate CWAD II from healthy

68
individuals. Measurement properties and clinical applicability of the sensory tests were
considered, to ensure that findings from the study are interpretable and can be translated to a
clinical setting. Moderate to high level consistent evidence was identified for altered sensory
response to pressure, cold, vibration and mechanical stretch in CWAD (Koelbaek-Johansen
et al., 1999; Sterling et al., 2003, 2006; Kasch et al., 2005; Greening et al., 2005; Raak and
Wallin 2006; Wallin and Raak 2008; Chien et al., 2009; Elliot et al., 2008, 2009; Gerdle et
al., 2008; Elliot et al., 2009). This supports inclusion of these impairments in a sensory
discrimination study. Tools for evaluating these impairments were appraised to establish
their measurement properties of reliability and validity. The evidence in regards of validity
of ULNT is incomplete due to a lack of in-vivo nerve movement data in previous reports.
Validity of ULNT therefore merits further consideration, particularly, with the emergence of
DUI technique for computing in-vivo nerve movements.
This informed the design of a construct validity study for the ULNT. However, reliability of
DUI was questioned due to conflicting estimates, and potential for measurement error, of
median nerve TM and LM within similar and same patient sample. Existing DUI studies are
limited by their focus to median nerve; healthy individuals; intra-rater reliability; and use of
re-test standard deviation. These limitations informed further evaluation of DUI reliability
for median, ulnar and radial nerves, in CWAD, using inter-rater reliability design, and the
recommended ICC statistic to interpret findings. The studies undertaken and reported in the
thesis and the underpinning rationale for them is graphically illustrated in figure 2.13.

69
2.6 Chapter summary
The literature review identified clinically important sensory impairments from high quality
CWAD II studies to justify their inclusion in the discrimination study. Consideration of
measurement properties of tools for evaluating the impairments highlighted the importance
of investigating construct validity of ULNT, prior to the discrimination study. A key
construct required to validate the ULNT is nerve movement, but existing evidence for its
reliability is weak and inconclusive, therefore warranting further evaluation of DUI
reliability, prior to the validity study.
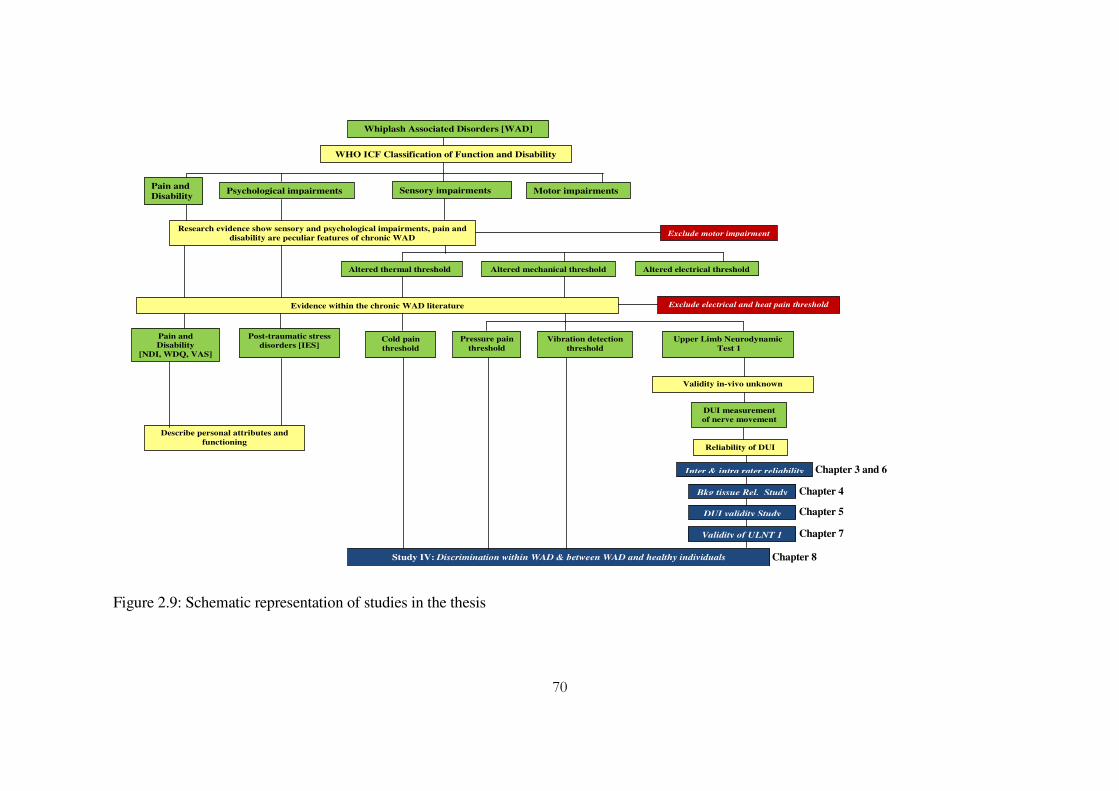
70
Figure 2.9: Schematic representation of studies in the thesis
Whiplash Associated Disorders [WAD]
Study IV: Discrimination within WAD & between WAD and healthy individuals
Exclude motor impairment
Validity of ULNT 1
Validity in-vivo unknown
Reliability of DUI
Inter & intra rater reliability
Post-traumatic stress
disorders [IES]
Pain and
Disability
[NDI, WDQ, VAS]
DUI measurement
of nerve movement
Cold pain
threshold
Upper Limb Neurodynamic
Test 1
Vibration detection
threshold
Pressure pain
threshold
Exclude electrical and heat pain threshold
Sensory impairments Psychological impairments Pain and
Disability
Altered electrical threshold Altered mechanical threshold Altered thermal threshold
Motor impairments
WHO ICF Classification of Function and Disability
Research evidence show sensory and psychological impairments, pain and
disability are peculiar features of chronic WAD
Evidence within the chronic WAD literature
Bkg tissue Rel. Study
DUI validity Study
Describe personal attributes and
functioning
Chapter 3 and 6
Chapter 4
Chapter 5
Chapter 7
Chapter 8

71
CHAPTER 3
Inter-rater reliability of the measurement of nerve movement in CWAD II using
dynamic ultrasound imaging (DUI)
3.1 Background
There are conflicting estimates for nerve movement obtained within CWAD and NSAP
sample (Table 2.3). Greening et al (2005), the only nerve study conducted in WAD,
compared DUI estimate of median nerve LM and TM in CWAD (n=9) and healthy
individuals (n=8), during inspiration and wrist extension motion. They found the TM was
approximately 7 times greater in CWAD [mean=2.57mm, SD=0.80mm] in a radial direction
in comparison to the healthy group [mean=0.39mm, SD=0.52mm], whose nerve moved in an
ulnar direction. This finding contrasts with the same author previous report demonstrating a
75% reduction in median nerve TM in n=12 NSAP [mean=1.2mm] compared to n=16
healthy individuals [mean=4.8mm], in a radial direction during wrist motion (Greening et al.,
2001). It has been suggested that CWAD and NSAP exhibit similar clinical features
(Greening et al., 2005) and comparable TM of the median nerve were expected across the
two studies. Although differences of joint motion were advanced to explain the conflicting
directions of nerve movement, the authors were not convincing. Other examples of
conflicting estimates of movement of the median nerve were discussed in the Chapter 2 and
summarised in Tables 2.3 - 2.4. The conflicting results raise questions regarding consistency
of measurements and potential measurement error that in turn implicate reliability and
validity of nerve movement measurement obtained by the DUI technique. Reliability is

72
important because it ensures reproducibility of measurements, a precondition for
measurement validity (Batterham and George, 2003; Tuijn et al., 2011). Sound measurement
properties increase clinicians’ confidence in test findings and assist meaningful interpretation
of clinical change to inform clinical decisions (Chen and Barnhart, 2008). Consequently,
establishing reliability of DUI would provide preliminary evidence for its applicability in a
clinical setting.
Reliability of DUI measurements
High reliability has been reported for estimates of median nerve LM (Dilley et al., 2001; Erel
et al., 2003; Coppieters et al., 2009) and TM (Greening et al., 2001) using DUI. Existing
DUI reliability studies have been focused to longitudinal nerve movement measurements and
were limited by methodological issues such as inadequate sample sizes, bias to healthy
individuals and median nerve, and inappropriate design and data analysis [Table 2.5]. For
example, only one (Erel et al., 2003) out of three (Dilley et al., 2001; Coppieters et al., 2009)
DUI reliability studies were conducted in a patient sample CTS. The data are however,
limited by their small sample sizes and inappropriate statistical analysis (Table 2.5). There is
no DUI reliability data for CWAD, which is important because reliability estimates could
vary within subsets of samples (Haas et al., 1991), and there is no DUI reliability data for
ulnar and radial nerves. There is no DUI inter-rater reliability study that involves both
components of the technique [Table 2.5]. Generally, estimates of reliability from intra-rater
studies are larger than those from inter-rater studies and over-estimate reliability of methods
or tools used in a clinical setting (Haas et al., 1991).

73
Overall, conflicting median nerve TM and LM estimates, as well as, inconclusive evidence
of DUI reliability for both nerve movements necessitated its further consideration,
particularly in CWAD II.
3.2 Aims and objectives
3.2.1 Aim of study
To evaluate inter-rater reliability of DUI estimates of median and ulnar nerve movements,
during passive contra-lateral neck side-flexion [CNSF], a key component of ULNT, in
CWAD II
3.2.2 Objectives of study
1. To estimate inter-rater reliability of estimates (mm) of LM for:
1. median nerve at the wrist
2. median nerve at mid forearm
3. ulnar nerve at the upper arm proximal to the elbow and
2. To estimate inter-rater reliability of estimates (mm) of TM for:
4. median nerve at the wrist;
5. median nerve at mid forearm;
6. ulnar nerve at the upper arm proximal to the elbow during CNSF in CWAD II.
The obtained reliability coefficient encompassed measurement error from nerve image
capture through to computation of nerve movement using offline image analysis programs.

74
3.3 Method
3.3.1 Design
A cross-sectional design was used to evaluate inter-rater reliability of movement of median
and ulnar nerves, during passive CNSF in a CWAD II sample using three raters
[Physiotherapists].
Radial nerve was excluded due to poor DUI image quality and delineation of its borders
during a pilot phase. CNSF was chosen to reflect the sensitizing component of ULNT that is
used commonly in the clinical setting (Shacklock 2005; Nee and Butler 2006). WAD II is the
most predominant of the five established WAD subgroups that present to Physiotherapists in
a clinical setting (Sterling et al., 2004), and individuals presenting with WAD ≥ 6 months
post injury [chronic] were targeted because reported symptoms during this phase of the
condition were expected to be stable, ensuring that repeat measurements were collected
under the same conditions (Sterling et al., 2006). Randomisation using a random-number
table was conducted to decide the sequence of examiners measuring each participant during
data collection and to balance any potential order effect. Raters were blinded to each other
scanned DUI images to eliminate visual bias as well as to replicate testing conditions for a
clinical setting (Ellis et al., 2008).
3.3.2 Participants
A convenience sample of eighteen (14 females, 4 males) CWAD II, mean age (SD) = 35
years (12) who were not presenting for treatment at the time of data collection, participated
in the study. A Sample size of n≥12 was calculated a priori so that the study had 80% power

75
with an alpha level of 0.05 for ICC estimates of reliability of 0.9 and 0.7, using 3 raters
(Walter et al., 1998). A sample of 18 participants allowed for potential data loss or
corruption during data transfer between the ultrasound scanner and the computer system
used for offline data analyses.
3.3.3 Eligibility criteria
Eligibility criteria were established to focus to the sample and nerve characteristics of
interest and also to eliminate potential confounding factors that can compromise nerve
mobility or mislead interpretation of reliability results.
Inclusion criteria were defined as:
� Currently enrolled students or employed staff of a UK University. The sampling method
provided access to CWAD II that were not presenting for treatment, to minimise
participants variability during testing.
� WAD II according to QTF whiplash classification (Spitzer et al., 1995)
� Six months post whiplash injury (Sterling et al., 2004)
� Aged between 18 and 55 years, as a significant proportion of WAD fall within this age
range (Hendriks et al., 2005).
� Understand and communicate in English language, as this is the language of
communication in the University
Exclusion criteria were:
� CWAD II patients receiving treatment

76
� Cervical hernia, past cervical pathologies not associated with whiplash injury (Hendriks
et al., 2005)
� Concussions, loss of consciousness and head injury as a result of the accident (Sterling et
al., 2004)
� Diabetes Miletus, renal failure, rheumatoid arthritis, epilepsy, HIV, tuberculosis, cancer,
uncontrolled hypertension and pregnancy (Sterling et al., 2004).
3.3.4 Ethical Considerations
Ethical clearance was obtained from the Medical Research Ethics Committee of the School
of Sports and Exercise Sciences and Health and Population Sciences. A Participant
Information Sheet (PIS), Consent Form and Risk assessment were produced and submitted
as part of the ethical approval process [Appendix A].
3.3.5 Raters
Three musculoskeletal [MSK] physiotherapists were involved as raters in nerve image
capture and analysis, while a fourth MSK physiotherapist performed all passive contra-
lateral neck side flexion to limit of pain [P2] (Maitland, 2001) or movement [R2] (Petty and
Moore 2011). Prior to the study, all three raters were trained and certified competent in
regard to nerve image capture by a qualified Sonographer. Two raters received training and
undertook practice sessions over an 8 week period, while the third rater practised over a five
month period. The MSK physiotherapists had a minimum of two years post-qualification
clinical experience and were studying at a postgraduate level at the time of data collection.

77
3.3.6 Recruitment strategy
Recruitment of participants was done through posters, e-mail and word of mouth within the
University.
3.3.7 Data collection
A. Health questionnaire and neurological examination
Participants were asked to complete a health questionnaire. A point tenderness and
restriction of neck ROM as described by Spitzer et al., (1995) was used as criteria to define
CWAD II participants. A neurological examination was carried out to evaluate eligibility
criteria and to rule out CWAD III.
B. Nerve image capture equipment
Ultrasound imaging of median and ulnar nerve movement in both transverse and longitudinal
plane were captured using a Diasus ultrasound system (Dynamic Imaging, Livingston,
Scotland, UK) with an 8-16 MHz 26mm linear array transducer. Sequences of nerve images
were acquired at 10 frames per second, converted to digital format and analysed offline using
software developed in Matlab®. Image resolution was 0.044 mm/pixel with an image size of
590 X 790 pixels. To ensure study findings are comparable to previous DUI reliability
studies, images were analysed using a conversion algorithm in a cross-correlation program to
achieve the equivalent equipment and image setup used in the DUI literature (Erel et al.,
2003; Dilley et al., 2001, 2003, 2007; Greening et al., 2001, 2005; Ellis et al., 2008;
Coppieters et al., 2009).
78
C. DUI transducer position
The DUI transducer was first positioned in the transverse plane to identify the relevant
nerve. Median and ulnar nerve TM were imaged during CNSF, in this transducer position.
The transducer was then turned 900 to align with the longitudinal plane of the nerve and
median and ulnar nerve LM imaged during CNSF in this US transducer position. The
transducer positions are established within the DUI literature (Dilley et al., 2001, 2003,
2007a, 2007b; Greening et at 2001, 2005; Erel et al., 2003; Ellis et al., 2008; Coppieters et
al., 2009).
D. Participant position
For median nerve movement measurements, the participant’s starting position was supine
lying, 30 degrees shoulder abduction, elbow extension and wrist in neutral (Greening et al.,
2005). During median nerve imaging, the participant’s neck was moved in an opposite
direction to the side of the arm being imaged (Nee and Butler, 2006). Median nerve images
were acquired at the wrist and mid-forearm (Greening et al., 2005). For ulnar nerve
movement measurements, the participant’s starting position was supine lying, shoulder
abduction, elbow flexion and wrist extension to their maximal range without causing any
discomfort or pain. The sequence of joint motion replicates the ulnar nerve ULNT position
(Nee and Butler, 2006). During ulnar nerve imaging, the participant’s neck was moved in an
opposite direction to the side of the arm being imaged (Nee and Butler, 2006). Ulnar nerve
images were acquired at the upper arm proximal to the elbow (Dilley et al., 2003, 2007,
2007). CNSF was used to lengthen the nerve bed to produce nerve movement (Szabo et al.,
1994; Shacklock 1995; Byl et al., 2002; Dilley et al., 2003; Coppieters et al., 2006). Five

79
passive CNSF warm-ups were carried out prior to imaging, to eliminate serial effects as was
reported by Shuba (2009) (Unpublished Dissertation). The sixth CNSF range of movement
value was recorded and maintained during nerve movement imaging for each participant. A
pictorial view of the testing protocol is illustrated in Figure 3.1A-B.
Figure 3.1A: Arm starting positions for median [left] and ulnar nerve [right]
Figure 3.1B: Nerve movement image capture during contralateral passive neck side flexion

80
E. Image capture by raters
Each rater imaged each participant once, for each test position. There was no rest period
between measurements because no evidence exists to support adverse reaction following
repeated CNSF. The testing protocol is presented as appendix B.
F. Image Analysis by Raters
Offline analysis programs developed in Matlab were used to analyse the acquired nerve
images. These programs were developed by A. Dilley and J. Rohlf, who gave permission for
their use. Each rater analysed their own acquired images of median and ulnar nerve
movement for all n=18 CWAD participants, reflecting practice in a clinical setting. Each
image was analysed three times and the mean (mm) calculated as a measure of nerve
movement (Dilley et al., 2001). The image analysis methodology is established within the
ultrasound literature (Dilley et al., 2001, 2003, 2007; Greening et at., 2001; Erel et al., 2003;
Greening et al., 2005; Ellis et al., 2008; Coppieters et al., 2009).
(i) Analysis of LM images
A cross-correlation algorithm program was used to estimate movement of speckle features in
selected regions of nerve between consecutive frames of nerve images (Dilley et al., 2001).
The pixel shift that produced the highest correlation coefficient between consecutive frames
corresponded to the relative nerve movement in the region of interest (Dilley et al., 2001). To
control for any probe or arm movement, speckle features in deep static structures (bone)
were tracked using the same method. Movement of the bone was subtracted from nerve

81
movement values to compute overall estimates of nerve movement (Dilley et al., 2001, 2003,
2007). The detailed protocol of the longitudinal image analysis is presented in appendix C.
Figure 3.2A and B: (A) Four boxes are placed within the nerve and (B) Two boxes are placed over bone (fixed tissue) used as reference to compare the nerve movement against

82
Nerve image analysis template used for LM
The protocol described in appendix C for the analysis of LM images utilised three boxes of
varying sizes placed within the nerve (Ellis et al., 2008), to enable the oflline program to
track movement of fine speckles within the boxes [regions of interest]. Korstanje et al (2010)
reported that the number, size and position of boxes affected DUI estimates. To enhance
consistency across raters’ placement of boxes during longitudinal nerve image analysis and
to improve upon the previously established protocol (Dilley et al., 2001), a template was
developed [Figure 3.3]. The template divided the nerve into four equal quarters, and a box
was positioned within each quarter across the nerve length. Boxes were placed 0.1cm below
the upper and lower margins of the nerve and separated by 0.5cm [Figure 3.3]. Using the
template, analysis of median nerve images by 3 researchers in a pilot phase produced
excellent inter-rater reliability of image analysis (ICC = 0.93) [Table 3.1].
Figure 3.3: The image analysis template developed to improve consistency of box sizes and position used during offline analysis of LM

83
Table 3.1 : Reliability between each rater 3 repeated analysis of n=18 CWAD II median and ulnar nerve LM images using the image analysis template
Researcher A Researcher B Researcher C
Nerve Mean
movement (mm)
SEM (mm)
ICC
Mean movement
(mm)
SEM (mm)
ICC
Mean movement
(mm)
SEM (mm)
ICC
Median 0.36 0.08 0.97 0.15 0.12 0.93 0.63 0.11 0.98
Ulnar 0.32 0.09 0.93 0.15 0.04 0.98 0.35 0.10 0.96
(ii) Analysis of TM images
Nerve TM was calculated offline from bitmap images of nerve TM using the “TpsDig”
software program (Department of Ecology and Evolution, State University of New York).
Points representing coordinates were selected within nerve images taken pre and post CNSF.
The points were placed at the upper and lower extreme borders, as well as at the left and
right borders of the nerve. Two additional points were placed on two skin markers used as
reference points [Figure 3.4A]. The coordinates for all six selected points were loaded into
Excel “WhipTrans” program and the change in nerve position was computed from the
coordinates [Figure 3.4B].

84
Figure 3.4 A: Positions of markers used to generate movement coordinates for TM during image analysis
Figure 3.4 B: Excel “WhipTrans” program used to compare changes in the coordinates of markers between pre and post CNSF TM images

85
3.4 Statistical Analysis
The ICC2,1 (Haas, 1991; Bland and Altman, 1996) was used to assess reliability of nerve
measurements by three raters using the DUI technique. However, the ICC can be affected by
between participant variations (Haas 1991). Small differences between participants can
produce a false negative [type II error] i.e. an overestimation of standard error of regression
coefficients and a false low reliability estimates (Haas, 1991). In addition, the ICC does not
give an indication of the magnitude of inter-rater discrepancy (Sim and Wright 2000).
Hence, 95% Confidence Interval [95% CI] of the ICC, coefficient of variation [CV],
standard error of measurement [SEM], and minimum detectable change [MDC] were
reported to assist interpretation of reliability results. All statistics were computed using SPSS
[version 15.0].
3.4.1 Intra-class correlation coefficient [ICC]
The ICCs are used to evaluate level of reliability on measurements taken by two or more
raters (Shrout and Fleiss 1979; Haas 1991; Bland and Altman 1996). ICC is a dimensionless
index, with values between 0 [indicating no reliability] and 1 [indicating perfect reliability]
(Sim and Wright 2000). In this study, ICC was used to estimate reliability in nerve
movements obtained by three different raters, where each movement was a mean value from
3 repeated analyses of nerve images. An ICC2,1 model (selecting the “absolute reliability”
option in SPSS) was used because each rater assessed each participant and the three raters
were considered to be representative of potential raters, enabling the results to be generalised
to a similar sample of clinicians (Shrout and Fleiss 1979; Eliasziw et al., 1994).
Interpretation of the ICC has usually been based on pre-specified cut-off values or

86
boundaries, although these might be considered arbitrary (Jordan, 2000). Several boundaries
have been suggested in the literature. Landis and Koch (2000) proposed the following –
ICC values between: 0.1 and 0.2 indicate slight reliability, 0.21 to 0.40 fair reliability, 0.41
to 0.60 moderate reliability, 0.61 to 0.80 substantial reliability, and 0.81 to 1 almost perfect
reliability. Eliasziw et al (1994) proposed acceptable cut-offs to be ICC=0.6 for inter-rater
and ICC=0.8 for intra-rater reliability, permitting only a dichotomous labelling of reliability.
Previous DUI reliability studies of median (Coppieters et al., 2009) and sciatic (Ellis et al.,
2008) nerve movement used the following boundaries and descriptors:
• “Excellent” = ICC ≥ 0.90
• “Good” = 0.70 ≤ ICC < 0.90
• “Fair” = 0.40 ≤ ICC < 0.70
• “Poor” = ICC < 0.40
It was decided to adopt these boundaries to assist comparison of findings from the current
study with those from previous studies. In addition, the descriptors were simple, clinically
meaningful and applicable to the current study.
3.4.2 The 95% Confidence interval of the ICC
The 95% confidence interval is a useful statistic when interpreting an ICC (Bland and
Altman 2000; Sim and Wright 2000; Peat et al., 2002). It defines a band of values that has a
95% chance of containing the value of the sample ICC. A narrow confidence interval is
indicative of a more precise estimate of the true ICC, that in turn increase confidence in the
measurement reliability for the DUI technique (Bland and Altman 2000; Sim and Wright

87
2000). The 95% CI has been used in previous DUI reliability studies (Ellis et al., 2008;
Coppieters et al., 2009).
3.4.3 Standard error of measurement (SEM)
Keating and Matyas (1998) and Bruton et al (2000) argued that limitations of the ICC negate
its use as a sole indicator of reliability because it can be affected by between-participant
variability. In a heterogeneous sample of participant, ICC values are likely to be larger than
when estimated in a homogeneous sample, other conditions being the same, and vice versa
(Weir 2005). In addition, the ICC value does not provide an estimate of the expected
variation between measurements of the same situation, which would be important to
clinicians for patient assessment (Weir 2005). To address these issues, the standard error of
measurement [SEM] was calculated to interpret reliability in the current study (Domholdt
2005; de Vet et al., 2006). The SEM computes variation between measurements of the same
quantity, on the same individual, and is expressed in the unit of the measurement (de Vet et
al., 2006). A small SEM is associated with a higher reliability coefficient and vice versa.
SEM was also used, in the current study, to establish degree of systematic and random error
associated with the DUI technique.
3.4.4 Minimum detectable change [MDC]
The MDC is defined as the minimal change that falls outside the measurement error in the
score of an instrument used to measure a symptom or construct (Kovacs et al., 2008). This
implies that measurements above the MDC can be interpreted, with 95% certainty, not to be
due to measurement error (Van der Roer et al., 2006). The MDC was calculated from the

88
SEM, which is the measurement error inherent to a measurement tool, through 1.96 x √2 x
SEM (Bago´ et al., 2009). The MDC interprets clinical relevance of measurements, and was
used in this study to assist interpretation of reliability estimates.
4 Coefficient of Variation
The coefficient of variation [CV] is a measure of variability relative to the mean and is
calculated as the standard deviation [SD] divided by the mean, expressed as a percentage
(Sim & Wright 2000). Higher values of CV would indicate lower precision of the
measurement technique, and lower values a higher precision. In general, the CV does not
change in proportion to the magnitude of the mean or the measurement units (Reed et al.,
2002). The CV allows comparison of variability across different raters (Hopkins 2000) and
can be used as a measure of precision of a measurement technique (Reed et al., 2002). Since
no cut-off value has been reported for CV relating to nerve movement measurements, CV ≤
20% was adopted for the current study. This value has been reported and accepted within the
science literature (Reed et al., 2002). CV values were used to compare inter-rater precision
of computed DUI nerve movement estimates, for median and ulnar nerves.
3.5 Results
This study sought to evaluate inter-rater reliability of DUI measurements of median and
ulnar nerve TM and LM in a CWAD II sample.

89
3.5.1 Median and ulnar nerve TM
The ICC2,1 estimate of inter-rater reliability on analyses of images of nerve TM for n=18
CWAD II participants during CNSF are presented in Table 3.3. Inter-rater reliability
estimates were poor for median and ulnar TM estimates (Coppieters et al., 2009).The 95%
CI of the ICC was narrow. A large SEM and high MDC in comparison to the nerve
movement were demonstrated. The CV between raters’ computed median and ulnar nerve
TM was high. The variation between the 3 raters’ measurements is graphically illustrated in
Figure 3.3A, B, C.
Table 3.2: Inter-rater reliability across three raters mean of three repeat computation of median and ulnar TM of n=18 CWAD II participants
Nerve ICC2,1 95% CI Movement
[mm]
SEM
(mm) MDC
(mm)
CV
[%]
Median [at the wrist] 0.00 0 to 0.22 1.1 1.90 5.27 35
Median[at the
forearm] 0.00 0 to 0.31 0.46 0.50 1.39 30
Ulnar [above elbow] 0.00 0 to 0.26 0.89 1.56 4.32 24

90
(A) Median nerve (Wrist)
(B) Median nerve (forearm)
(C) Ulnar nerve [Above elbow]
Figure 3.5 A, B, C: Descriptive illustration of reliability across three raters mean of three repeat computations of median and ulnar TM of n=18 CWAD II participants

91
3.5.2 Median and ulnar nerve LM
The ICC2,1 estimate across 3 physiotherapists’ analyses of images of nerve LM for n=18
CWAD II participants during CNSF are presented in table 3.3.
Inter-rater reliability estimates was fair for median LM (Coppieters et al., 2009).The 95% CI
of the ICC for median nerve was wide. The SEM in comparison to the nerve movement was
small and the MDC was greater than the nerve movement. The CV between raters computed
median nerve LM estimates was low. The variation between the 3 raters’ measurements is
graphically illustrated in Figure 3.4A.
Inter-rater reliability estimates was poor for ulnar nerve LM (Coppieters et al., 2009). The
95% CI of the ICC for the ulnar nerve was wide. The SEM was large and the MDC was
greater, both in comparison to the nerve movement. The CV between the 3 raters computed
ulnar nerve LM estimates was low. The variation between the 3 raters’ measurements is
graphically illustrated in Figure 3.4B.
Table 3.3: Inter-rater reliability across three raters mean of three repeat computation of median and ulnar nerve LM of n=18 CWAD II participants
Nerve ICC2,1 95% CI Movement
[mm]
SEM
(mm) MDC
(mm) CV [%]
Median 0.4 0.1 to 0.66 0.69 0.38 1.05 16
Ulnar 0.20 0 to 0.55 0.45 0.31 0.86 24

92
(A) Median [Forearm]
(B) Ulnar [above elbow]
Figure 3.6A and B: Descriptive illustration of reliability across three raters mean of three repeat computation of median and ulnar nerve LM of n=18 CWAD II participants
3.6 Discussion
This study provided the first DUI reliability data for measurements of median and ulnar
nerve movement in CWAD II participants. It was also the first inter-rater reliability study
involving both DUI components of image capture and image analyses, using the CNSF
movement component of ULNT, and physiotherapists as raters. Although previous DUI
reliability studies have used experienced DUI operators, the involvement of physiotherapists

93
as raters reflects the focus of the current study to clinical setting where physiotherapists are
increasingly using DUI as a part of their professional practice.
3.6.1 Median and ulnar nerve TM
Inter-rater reliability estimates were poor for median (ICC2,1 = 0.00) and ulnar (ICC2,1 = 0.00)
nerve TM. The high SEM data corroborated the low ICC and were suggestive of the
presence of measurement error within the DUI technique. Also, high CV ≥ 20% (Reed et al.,
2002) demonstrated significant variance between raters’ measurements that contributed to
the low reliability coefficients, affecting computation and interpretation of nerve
measurements obtained by different raters from the same participants. The low ICC
estimates obtained in the present study were unexpected and contrast with previous reports
of high reliability for DUI (Greening et al., 2001; Ellis et al., 2008). Differences of study
sample, starting positions, joint motion used to induce nerve movement, amount of nerve
movement produced data analysis method and experience of image capture and image
analysis could individually or collectively have contributed to the low reliability coefficients.
The findings explain the conflicting TM estimates reported within the DUI literature
[Chapter 2, Table 2.3 - 2.4] and questions continued use of DUI in research to compute TM.
The literature relating to DUI reliability of TM for upper limb peripheral nerves is sparse
(Greening et al., 2001) and as a result limit comparisons between previous studies and the
current reliability study.

94
A. Issues associated with DUI image capture
Greening et al (2001) reported high reliability for DUI measurement of median nerve TM
using statistics of within-participant standard deviation [WSD]. However, their use of WSD
alone to interpret high reliability can be misleading considering that the SD can be affected
by magnitude of the mean (Weir, 2005). Complimenting statistics of ICC, 95% CI, SEM and
CV have been suggested when interpreting reliability (Bland and Altman 1996, 2000;
Keating and Matyas, 1998; Bruton et al., 2000; Sim and Wright, 2000; Peat et al., 2002;
Domholdt, 2005; Weir, 2005; de Vet et al., 2006). Further, Greening et al (2001) found that
median nerve TM obtained between 1-2 days (n=5) versus 1-6 days (n=4) interval varied
more as the days between testing increased. In reliability with their findings, variability in
TM was observed in this reliability study and could have arisen from intervals between the
three raters’ testing. This could have resulted in subtle variance in computed TM estimates
and contributed to the poor reliability coefficients found.
Differences across raters’ experience of nerve image capture could have contributed to low
reliability estimates. Evidence within the literature has indicated that assessments can be
influenced by inter-rater variation (de Vet et al., 2006) and DUI has been described as an
operator dependent technique (Martinoli et al., 2000; Peer et al., 2002; Chiou et al., 2003;
Beekman and Visser 2003, 2004). Ellis et al (2008) suggested that potential sources of error
exist within the image capture component of the technique. Systematic error can be
introduced during nerve image capture as a result of angulation of the DUI transducer,
applying excessive pressure on the transducer as well as movement of the transducer over
skin (Kristjansson 2004; Ellis et al., 2008). These can individually or collectively affect

95
image quality, lead to an under or over estimation of nerve movement and consequently
compromise reliability (Ellis et al., 2008). However, sources of measurement error in DUI
have not been verified in any known DUI nerve movement study. To control for raters’
experience of image capture, all raters were trained and certified competent with regards to
the DUI transducer handling and orientation, identification of the nerve in the transverse
plane, as well as, image acquisition prior to data collection. However, differences of length
of DUI practice (between 8 and 20 weeks) might have impacted on raters’ experience of TM
image capture. This merits further investigation in order to inform the best methods for nerve
image capture in future DUI studies, as well as clinical practice.
It has been observed that nerves can move in multiple planes (Ellis et al., 2008). This is an
anatomical, biomechanical and neurodynamic characteristic demonstrated by peripheral
nerves. Such a movement is practically impossible to capture and account for when
computing transverse nerve movement analysis using the present DUI technique that relied
on a 2D ultrasound scanner. Nerve rotation movements can compromise consistent
positioning of markers utilised by the image analysis program to compute movement
between pre and post CNSF images. This could have led to an under or over estimation of
nerve movement estimates and consequently compromised reliability coefficients (Ellis et
al., 2008). This could have contributed to the poor inter-rater reliability estimates.
B. Issues associated with DUI image analysis
Ellis et al (2008) have suggested that measurement error could be introduced during nerve
image analysis from incorrect and inconsistent positioning of markers used to identify areas

96
of interest within the nerve. The image analysis program used four markers over the nerve,
and two fixed skin surface markers to account for DUI transducer movement during nerve
image capture. To enhance consistency in raters’ identification and placement of markers, a
transparent graph sheet was used during the nerve image analysis. The nerve borders (top,
right, left and bottom) were identified relative to the centre of the nerve using visual
assessment of gridlines of the graph. However, individual differences could have affected
consistency of raters’ visual identification and placement of image markers. These could
have contributed to the poor reliability estimates.
3.6.2 Median and ulnar LM
Inter-rater reliability estimates were fair (ICC2,1 = 0.4) for median and poor for ulnar (ICC2,1
= 0.2) LM. A larger SEM was associated with ulnar (SEM = 0.31) than median (SEM =
0.38) nerve LM when compared to their mean nerve movement values. Also, a high CV ≥
20% (Reed et al., 2002) indicated differences between raters’ measurements that could have
affected reliability coefficients. The low ICC estimates were unexpected and contrast
previous reports of high reliability for DUI (Dilley et al., 2001; Erel et al., 2003; Coppieters
et al., 2009). Differences of study sample, starting positions, joint motion used to induce
nerve movement, amount of nerve movement produced, data analysis method, and DUI
components investigated could individually or collectively have accounted for differences
between the present study and previous reliability reports. These differences exist, and could
limit comparison of previous studies to the present reliability study (Haas et al., 1991).

97
A. Issues associated with DUI image capture
Greening et al (2001) observed that computed estimates of median nerve LM varied as
intervals between measurements increased, although no reason was advanced for the
observation. Similarly, Erel et al (2003) found that median nerve LM increased by 33.3%
[0.31mm] against [0.41mm] between 1 - 6 months of testing, with no reason provided for
their result. Also, Dilley et al (2001) found a variation of 0.5 - 0.7mm for median nerve LM
during index finger extension obtained at 1-2 weeks interval and the difference was an 11 -
51% increase to the initial median nerve LM estimate. The variability across these studies
suggests that DUI might provide inconsistent nerve movement estimates as intervals between
testing increases. The intervals between raters testing in the present study could therefore
have resulted in subtle variation in nerve movement data obtained by the 3 raters, and could
have contributed to the low reliability estimates.
Differences of method used in the present study in comparison to previous studies could
have contributed to the low inter-rater reliability estimates. Coppieters et al (2009) evaluated
inter-rater reliability across 3 raters’ analysis of the same set of 10 median nerve LM images.
Their study focused on the nerve image analysis component of DUI, eliminating potential
error that is associated with nerve image capture. Only one study (Ellis et al., 2008) has
evaluated both DUI components. Their study however, contrasted with the present inter-rater
reliability study with regards to the nerve (sciatic), sample (healthy) and level of reliability
(intra-rater design). The inter-rater reliability design used in the present reliability study was
likely to be associated with higher rater variance and measurement error (Haas, 1991), as all

98
the 3 raters acquired and analysed their own-acquired images, a method that potentially
increased inter-rater variance and potential systematic error, and contributed to affect
reliability. However, the inter-rater reliability design provided a higher level of evidence for
considering reliability (Haas, 1991; Bland and Altman, 1996). In addition, the present study
evaluated both DUI components, so that reliability estimates were more representative of the
DUI technique than Coppieters et al (2009). Moreover, the present inter-rater design
replicated practice in a clinical setting better than the intra-rater design used in Ellis et al.,
(2008). The present reliability study therefore provided a higher, clinically relevant evidence
for reliability of DUI than previous DUI studies.
Differences of study sample could have contributed to the low reliability estimate.
Coppieters et al (2009) reported high inter-rater reliability estimates for DUI measurement of
median nerve LM in n=13 healthy individuals. The absence of symptoms in their study
sample negate translation of their findings into clinical practice, and could have influenced
their reliability estimates, because presence of pain during joint motion can limit amount of
nerve movement produced due to activation of the nociceptive motor reflex (Coveney et al.,
1997). The implication would be less variability in nerve LM in a patient population and,
consequently, low ICC estimates. Coppieters et al (2009) found a high variability in nerve
movement estimates across their healthy individuals. This could explain high inter-rater
reliability reported for their healthy individuals because ICC estimates can be affected by
high variation across participants’ measurement (Haas 1991). de Vet et al (2006) observed
that ICC estimates for shoulder ROM obtained by two physiotherapists in n=155 patients
were different for the affected and non-affected sides. The authors attributed their high ICC

99
estimates to variability [heterogeneity] in ROM on the affected versus non-affected shoulder.
Kristjansson (2004) findings corroborated claims in de Vet et al (2006) when they evaluated
inter-rater reliability for DUI measurements of cross-sectional area of cervical multifidus
muscle in both patient and healthy individuals. Kristjansson (2004) found good and poor
reliability estimates for their healthy and WAD participants, respectively. Their finding of
poor inter-rater reliability in WAD agrees with low ICC estimates in the present study.
Differences in the joint motion used to produce nerve movement could have contributed to
the low reliability estimates in the present study. Coppieters et al (2009) used a combination
of neck and arm motion that produced more nerve movements in comparison to CNSF.
CNSF is used as part of ULNT to further lengthen a nerve after the slack in the nerve has
been taken up (Dilley et al., 2003, 2007). The position limits the amount of nerve movement
that can occur beyond this point (Shacklock, 2005). However, CNSF was used in the present
reliability study because it is the most common sensitising manoeuvre used during ULNT.
The CNSF used in the present study could have resulted in low ICC estimates. This finding
query usefulness of CNSF induced nerve movement when using DUI technique.
B. Issues associated with DUI image analysis
Variance in nerve image analysis skills of raters could have contributed to low reliability
estimates. Evidence within the literature indicated that assessments made by clinicians might
be influenced by inter-rater variation (de Vet et al., 2006), and DUI has been described as an
operator dependent technique (Martinoli et al., 2000; Peer et al., 2002; Chiou et al., 2003;
Beekman and Visser 2003, 2004). Ellis et al (2008) suggested sources of error within DUI
100
nerve image analysis. Systematic error during nerve image capture can affect image quality
and, in turn, affect computed measurements of nerve movement during analysis of such
images (Ellis et al., 2008). However, the suggested nerve image quality affect on nerve
image analysis, and reliability merits further investigation as it has not been verified in any
known DUI study.
Ellis et al (2008) suggested that measurement error could be introduced during nerve image
analysis as a result of incorrect and inconsistent positioning of markers used to identify
regions of interest within the nerve. In the present study, raters’ experience of nerve image
analysis could have introduced error that in turn affected reliability estimates. However, to
control for plausible differences in raters’ experience of image analysis, a template was
developed and adopted for placement of markers [boxes]. The template improved the images
analysis [Table 3.1], but no conclusions can be drawn regarding contribution of template to
error arising from DUI image capture component.
The cross-correlation algorithm program used for nerve image analysis could have
contributed to low reliability estimates. The image analysis program tracked DUI transducer
movements as a fixed reference [background] to the nerve movement. The background
movement data was then subtracted from the nerve estimates to compute actual nerve
movement (Dilley et al., 2001; Greening et al., 2001). However, when background
movement is large, it might have resulted in smaller residual nerve movements. The residual
nerve movement value could represent measurement error rather than actual nerve

101
movement. However, this hypothesis has not been verified in any known DUI study and
therefore merit further evaluation.
Again, nerve movements can occur in multiple planes (Ellis et al., 2008). The cross-
correlation program was limited in that it did not capture nerve rotation movement. This
could have impacted on nerve image quality, affected nerve movement estimates and,
consequently, affected reliability coefficients. Kristjansson (2004) has reported a similar
influence of multi-planar nerve movements on quality of nerve images and inter-rater
reliability estimates. To address the issue, Ellis et al (2008) recommended using a three
dimensional [3D] or four dimensional [4D] DUI scanner and image analysis program.
However, as 3D or 4D ultrasound scanners are still in development, clinical practice and
research methods continue to rely on 2D scanners for DUI measurements.
3.7 Chapter conclusions
The inter-rater reliability study found poor reliability for all TM [median and ulnar] and LM
[ulnar]. However, inter-rater reliability for median nerve LM was fair, indicating it’s
potential. Although these findings contrasted with previous reports indicating high reliability
for DUI computation of nerve measurements, this study provided a higher level of evidence
because it addressed limitations of previous DUI reliability studies. Overall, the low
reliability findings suggested that DUI might not provide a reliable method for evaluating
upper limb nerve movement in-vivo in CWAD II. Plausible sources of measurement error
within DUI image capture and image analysis were proposed as contributing to poor
reliability of the technique but these have not been verified in any DUI research to date. In

102
order to improve reliability of the technique, further evaluation potential error was
warranted. This informed further analysis of the images obtained in this inter-rater reliability
study to gain additional insight into potential error within the DUI technique. The further
analysis is reported in Chapters 4 and 5 of the thesis.
103
Chapter 4
A re-analysis of nerve images to investigate sources of error within DUI image capture
and image analysis using inter-image capture and inter-image analysis methods
4.1 Background
Conflicting nerve movement estimates (Chapter 2, Tables 2.3 – 2.4), methodologically
limited DUI reliability studies (Chapter 2, Table 2.5), and poor DUI reliability for median
and ulnar nerve movement measurements (Chapter 3, Tables 3.3 - 3.4) suggests presence of
potential sources of measurement error within image capture and image analysis components
of DUI. However, the error has not been verified to date and existing knowledge of sources
of error within DUI is speculative (Kristjansson, 2004; Ellis et al., 2008), and where
available is focused to Doppler ultrasound (Hough et al., 2000), and muscle tendon
(Korstanje et al., 2010). As a result, confidence in DUI estimates of nerve movement
obtained using the Diasus equipment is limited. A significant proportion of DUI studies have
used the Diasus equipment, and it is important to identify and address the error in order to
improve reliability of nerve measurements. This necessitated design of a further nerve image
analysis study, focused to sources of measurement error within DUI. It was hypothesised that
the finding will add to existing knowledge regarding sources of error within DUI, and inform
future DUI reliability studies.

104
4.2 Aim
Using data from the inter-rater reliability study reported in Chapter 3, the aim of the study
was to evaluate:
(a) Inter-rater image capture reliability between 3 physiotherapists acquired n=18 median
and ulnar nerve images
(b) Inter-rater image analysis reliability between 3 physiotherapists’ analysis of n=18 median
and ulnar nerve images
4.3 Method
4.3.1 Design
Image re-analysis to compare reliability across computed estimates of median and ulnar
nerve TM and LM in order to interpret the error associated with DUI image capture and
image analysis components. Nerve movements were computed by:
(a) One Physiotherapist analysed median and ulnar nerve images acquired by 3
physiotherapists [each physiotherapists acquired (n=18) nerve images from n=18 CWAD
II participants]. This design identified variation across the acquired nerve images that in
turn, interpreted error arising from DUI image capture component.
(b) Three physiotherapists analysed median and ulnar nerve images acquired by 1
physiotherapist [n=18 images were acquired from n=18 CWAD II participants]. This

105
design identified variation during the image analysis that in turn, interpreted error arising
from DUI image analysis component.
4.3.2 Physiotherapists involved in the re-analysis of nerve images
The same physiotherapists that were involved in image analysis in Chapter 3 performed the
analysis. The physiotherapists have previously demonstrated excellent intra-rater reliability
during image analysis that used the developed nerve image analysis template [Table 3.1].
4.3.3 Image analysis program
The same programs for nerve image analysis in Chapter 3 were used.
4.4 Statistical Analysis
The same statistics and statistical analysis package in Chapter 3 were used. However, the
MDC was not computed as there is no indication for its usefulness in this chapter.
4.5 Results
Results of descriptive and inferential statistics for inter-rater image capture reliability [nerve
movement from each of 3 physiotherapists acquired (n=18) median and ulnar nerve images,
to demonstrate error within DUI image capture] and inter-rater image analysis reliability
[nerve movement obtained by 3 physiotherapists analyses of n=18 nerve images depicting
error during DUI image analysis] are presented as Tables 4.1 – 4.2 and Figure 4.1 – 4.2, and
Table 4.3 – 4.4 and Figure 4.3 – 4.4 respectively.

106
4.5.1 DUI image capture
A. Median and ulnar nerve TM
The estimates of inter-rater image capture reliability for each of 3 physiotherapists acquired
n=18 median and ulnar TM images are presented as Table 4.1 and Figure 4.1A-C.
The inter-rater image capture reliability for median nerve TM images was poor (ICC2,1 =
0.00) (Coppieters et al., 2009). The 95% CI of the ICC was narrow and the SEM was lower
than the mean median nerve TM. The CV was also high except for median nerve at the
forearm. The variation between measurements obtained from the 3 physiotherapists acquired
median TM images is graphically illustrated in Figure 4.1A and B.
The inter-rater image capture reliability for ulnar nerve TM images was fair (ICC2,1 = 0.4)
(Coppieters et al., 2009). The 95% CI of the ICC was wide and the SEM was larger than the
mean ulnar nerve movement. The CV was also high. The variation between measurements
obtained from 3 physiotherapists acquired ulnar nerve TM images is graphically illustrated in
Figure 4.1C.
Table 4.1: Inter-rater image capture reliability for each of 3 physiotherapists acquired n=18 median and ulnar TM images
Nerve ICC2,1 95% CI Movement
(mm)
SEM (mm) CV
(%)
Median at the wrist 0.01 0 to 0.33 0.36 0.29 20
Median at the forearm 0.00 0 to 0.15 0.46 0.32 13
Ulnar 0.4 0.08 to 0.65 0.67 0.98 24

107
(A) Median (wrist)
(B) Median (forearm)
(C) Ulnar (above elbow)
Figure 4.1(A – C): Scatter plot depicting inter-rater image capture reliability for each of 3 physiotherapists acquired n=18 median and ulnar nerve TM images

108
B. Median and ulnar nerve LM
The estimates of inter-rater image capture reliability for each of 3 physiotherapists acquired
n=18 median and ulnar nerve LM images are presented as Table 4.2 and Figure 4.2A-B.
The inter-rater image capture reliability for median nerve LM images was fair (ICC2,1 = 0.43)
(Coppieters et al., 2009). The 95% CI of the ICC was wide and the SEM was small in
comparison to the mean median nerve LM. The CV for median nerve LM was smaller when
compared to ulnar nerve LM. The variation between measurements obtained for each of 3
physiotherapists acquired median nerve LM images is graphically illustrated in Figure 4.2A.
The inter-rater image capture reliability for ulnar nerve LM images was poor (ICC2,1 = 0.29)
(Coppieters et al., 2009). The 95% CI of the ICC was wide and the SEM was small when
compared to mean ulnar nerve LM. The CV for ulnar nerve LM was higher than for median
nerve LM. The variation between measurements obtained from each of 3 physiotherapists
acquired ulnar nerve images is graphically illustrated in Figure 4.2B.
Table 4.2: Inter-image capture reliability for each of 3 physiotherapists acquired n=18
median and ulnar nerve LM images
Nerve ICC2,1 95 % CI Movement
[mm] SEM (mm) CV (%)
Median 0.43 0.15 to 0.71 0.72 0.35 9
Ulnar 0.29 0 to 0.61 0.51 0.22 14

109
4.5.2 DUI image analysis
A. Median and ulnar nerve TM
The estimate of inter-rater image analysis reliability for 3 physiotherapists analyses of n=18
median and ulnar nerve TM images are presented as Table 4.3 and Figure 4.3A-B.
(A) Median (forearm)
(B) Ulnar (above elbow)
Figure 4.2 (A – B): Scatter plot depicting inter-rater image capture reliability for each of 3
physiotherapists acquired n=18 median and ulnar nerve LM images
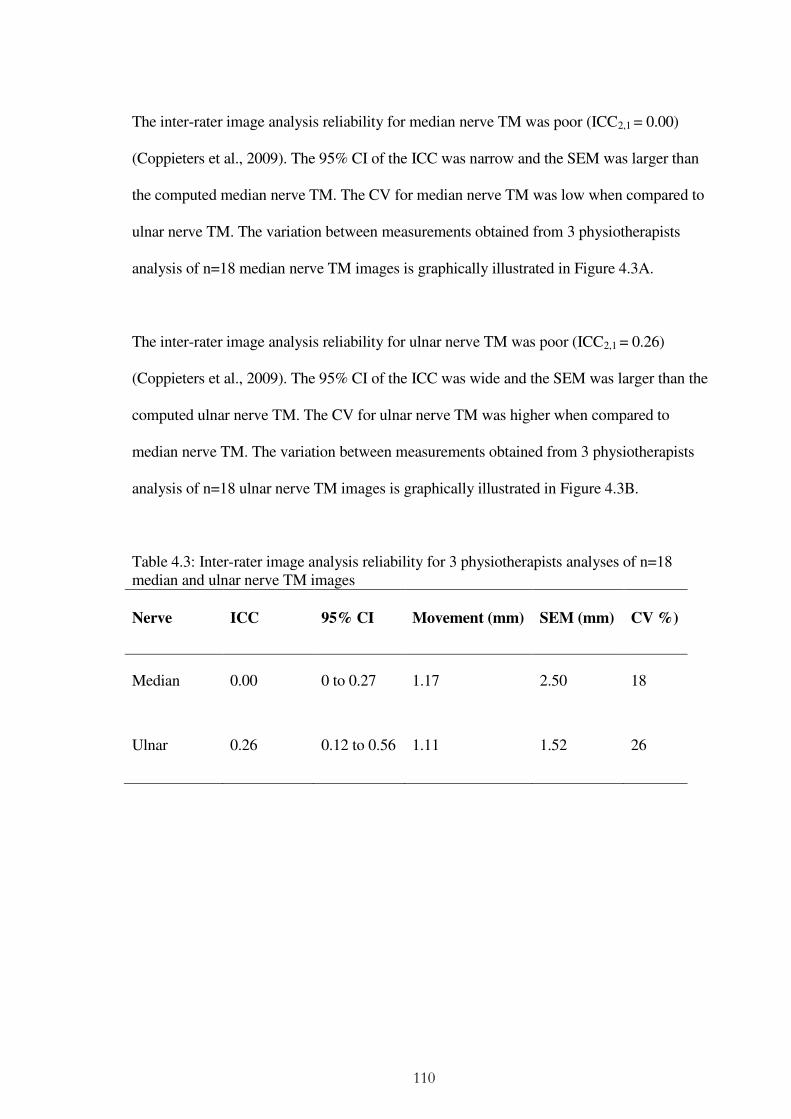
110
The inter-rater image analysis reliability for median nerve TM was poor (ICC2,1 = 0.00)
(Coppieters et al., 2009). The 95% CI of the ICC was narrow and the SEM was larger than
the computed median nerve TM. The CV for median nerve TM was low when compared to
ulnar nerve TM. The variation between measurements obtained from 3 physiotherapists
analysis of n=18 median nerve TM images is graphically illustrated in Figure 4.3A.
The inter-rater image analysis reliability for ulnar nerve TM was poor (ICC2,1 = 0.26)
(Coppieters et al., 2009). The 95% CI of the ICC was wide and the SEM was larger than the
computed ulnar nerve TM. The CV for ulnar nerve TM was higher when compared to
median nerve TM. The variation between measurements obtained from 3 physiotherapists
analysis of n=18 ulnar nerve TM images is graphically illustrated in Figure 4.3B.
Table 4.3: Inter-rater image analysis reliability for 3 physiotherapists analyses of n=18 median and ulnar nerve TM images
Nerve ICC 95% CI Movement (mm) SEM (mm) CV %)
Median 0.00 0 to 0.27 1.17 2.50 18
Ulnar 0.26 0.12 to 0.56 1.11 1.52 26
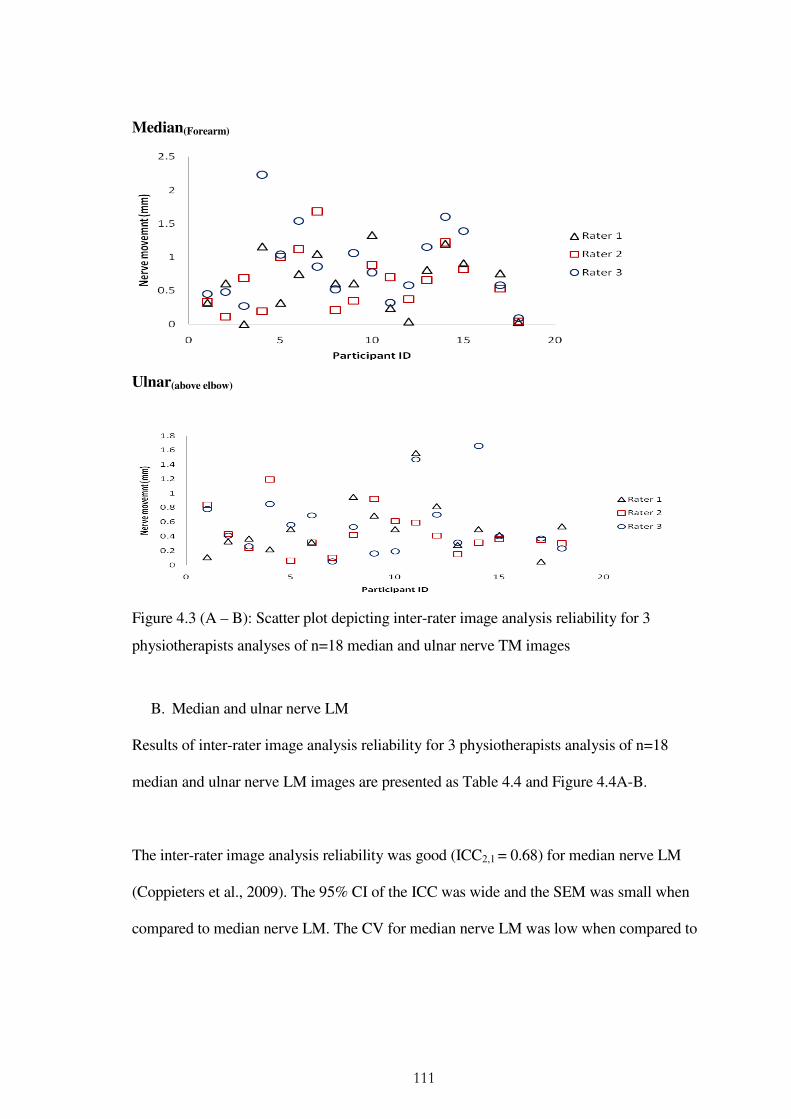
111
B. Median and ulnar nerve LM
Results of inter-rater image analysis reliability for 3 physiotherapists analysis of n=18
median and ulnar nerve LM images are presented as Table 4.4 and Figure 4.4A-B.
The inter-rater image analysis reliability was good (ICC2,1 = 0.68) for median nerve LM
(Coppieters et al., 2009). The 95% CI of the ICC was wide and the SEM was small when
compared to median nerve LM. The CV for median nerve LM was low when compared to
Median(Forearm)
Ulnar(above elbow)
Figure 4.3 (A – B): Scatter plot depicting inter-rater image analysis reliability for 3
physiotherapists analyses of n=18 median and ulnar nerve TM images

112
ulnar nerve LM. The variation between measurements obtained from 3 physiotherapists
analysis of n=18 median nerve LM images is graphically illustrated in Figure 4.4A.
The inter-rater image analysis reliability was poor (ICC2,1 = 0.29) for ulnar nerve LM
(Coppieters et al., 2009). The 95% CI of the ICC was wide and the SEM was smaller than
the ulnar nerve LM. The CV for ulnar nerve LM was high when compared to median nerve
LM. The variation between measurements obtained from 3 physiotherapists analysis of n=18
ulnar nerve LM images is graphically illustrated in Figure 4.4B.
Table 4.4: Inter-rater image analysis reliability for 3 physiotherapists’ analyses of n=18 median and ulnar nerve LM image
Nerve ICC 95% CI Movement (mm) SEM (mm) CV (%)
Median 0.68 0.43 to 0.85 0.70 0.25 13
Ulnar 0.29 0 to 0.61 0.41 0.22 15

113
Median
Ulnar
Figure 4.4 (A-B): Scatter plot depicting inter-rater image analysis reliability for 3 physiotherapists analyses of n=18 median and ulnar nerve LM images
4.6 Discussion
This study compared inter-rater image capture reliability for each of 3 physiotherapists n=18
median and ulnar nerve TM and LM images [DUI image capture] as well as inter-rater
image analysis reliability for 3 physiotherapists analysis of n=18 median and ulnar nerve TM
and LM images. This is the first analysis to identify potential sources of error within DUI
image capture and image analysis components for median and ulnar nerve TM and LM in a
CWAD II sample.

114
4.6.1 DUI image capture
A. Median and ulnar nerve TM
Estimates of inter-rater image capture reliability for median nerve TM was poor (ICC2,1 =
0.01) and fair for ulnar nerve TM (ICC2,1 = 0.4) [Table 4.1]. The 95% CI of the ICC was
narrow for median (0 to 0.33) in comparison to ulnar nerve (0.08 to 0.65). The SEM was low
for median (0.29mm) and high for ulnar nerve (0.98mm), when both are compared to their
mean nerve movement [Table 4.1]. The nerve images demonstrated high levels of CV ≥ 20%
(Reed et al., 2002). The ICC, SEM and CV values are interpretive of measurement error
within DUI image capture. The findings suggest different levels of DUI image capture
experience that could affect image quality and consequently reliability of the technique. The
findings support previous suggestions of measurement error within DUI image capture
(Kristjansson, 2004; Ellis et al., 2008; Chapter 3).
B. Median and ulnar nerve LM
Median nerve
Estimates of inter-image capture reliability for median nerve LM was fair (ICC2,1 = 0.43;
95% CI = 0.15 to 0.71) [Table 4.2]. The SEM of 0.35mm was 48.6% of the size of the mean
nerve movement (0.72mm) [Table 4.2]. Variability between median nerve images (CV =
9%) was within acceptable level of 20% (Reed et al., 2002). The ICC and SEM values
suggest presence of potential error within DUI image capture. The results corroborate the
measurement issues of image capture suggested within the literature (Kristjansson 2004;
Ellis et al., 2008; Chapter 3). However, the fair ICC and low CV values for median nerve
LM suggest a potential merit for its reliability to be further investigated.

115
Ulnar nerve
Estimates of inter-image capture reliability for ulnar nerve LM was poor (ICC2,1 = 0.29; 95%
CI = 0.00 to 0.61) [Table 4.2]. The wide 95% CI of the ICC and a high SEM of 43% the size
of mean nerve movement (0.51mm) [Table 4.2] suggest varying levels of DUI imaging
capture experience, and support suggestions for presence of error during DUI image capture
(Kristjansson 2004; Ellis et al., 2008; Chapter 3). Although variability across the ulnar nerve
images (CV = 14%) was within acceptable level of 20% (Reed et al., 2002), the poor
reliability weakens the merit for its reliability to be further evaluated.
C. Measurement issues associated with image capture
DUI has been described as an operator dependent technique, implying that, experience may
affect the quality of acquired images (Martinoli et al., 2000; Peer et al., 2002; Chiou et al.,
2003; Beekman and Visser 2003, 2004). There is no evidence to date that indicates level of
image capture experience that DUI operators e.g. physiotherapists need to achieve in order to
provide reliable TM and LM estimates. Individual operator differences relating to visual
interpretation of images and manual handling of DUI transducer can lead to variations in
nerve image quality (Kristjansson 2004; de Vet et al., 2006; Ellis et al., 2008). In addition,
differences of the anatomical characteristics of nerves e.g. its course, depth, surrounding
tissue [nerve bed], and dynamics could equally have contributed to variability demonstrated
across the median and ulnar nerve images (Moore and Dalley, 2005). The results require that
future DUI study designs address potential error in order to provide reliable nerve movement
measurements (Collinger et al., 2009). For example, single operator designs can be adopted
to address inherent rater image capture variability (Ellis et al., 2008; Collinger et al., 2009).

116
Overall, the variation demonstrated for inter-rater image capture of median and ulnar TM
and ulnar nerve LM limit the merit for taking this movement further, until measurement
issues associated with the technique are addressed. However, median nerve LM
demonstrated a potential merit for its reliability to be further investigated.
4.6.2 DUI image analysis
A. Median and ulnar nerve TM
Estimates of inter-rater image analysis reliability was poor for median nerve TM (ICC2,1 =
0.00; 95% CI = 0.00 to 0.27) [Table 4.3]. The narrow 95% CI and SEM (2.50mm) that was
larger than mean median nerve TM (1.17mm) suggests presence of measurement error
within the DUI image analysis for TM [Table 4.3]. Variability across estimates computed by
the 3 physiotherapists (CV = 18%) was within the acceptable level of CV=20% (Reed et al.,
2002). In addition to issues related to image capture, the results demonstrate variability
during DUI image analysis and suggest the potential for introducing error. The results
support previous suggestion for measurement error within DUI image analysis (Ellis et al.,
2008; Chapter 3). Estimates of inter-rater image analysis reliability was poor for ulnar nerve
TM (ICC2,1 = 0.26; 95% CI = 0.12 to 0.56) [Table 4.3]. The narrow 95% CI and SEM
(1.52mm) that was larger than mean median nerve TM (1.11mm) suggests presence of
measurement error within the DUI image analysis for TM [Table 4.3], and negate further
evaluation of TM, without first addressing the sources of error.

117
B. Median and ulnar nerve LM
Median nerve
Estimates of inter-rater image analysis reliability for median nerve LM was good (ICC2,1 =
0.68; 95% CI = 0.43 to 0.85) [Table 4.4]. The 95% CI of the ICC was small and SEM was
36% the magnitude of the nerve movement estimates [Table 4.4]. The SEM values suggest
potential error within the DUI image analysis component. Variability across estimates
computed by the 3 physiotherapists (CV = 13%) was within the acceptable level of CV=20%
(Reed et al., 2002). The high ICC and low CV suggest a potential merit for reliability of
median nerve LM to be further investigated. In addition, the results is in reliability with
Coppieters et al., (2009) report of high inter-rater image analysis for median nerve LM
[n=10]. However, their sample (n=10) was below proposed size (n=12) for inter-rater
reliability using 3 raters at 80% power and 5% level of significance (Walter et al., 1998). The
present image analysis (n=18) therefore provides a higher level of evidence compared to
Coppieters et al., (2009).
Ulnar nerve
Estimates of inter-rater image analysis reliability for ulnar LM was poor (ICC2,1 = 0.29 and
95% CI = 0.00 to 0.61) [Table 4.4]. The 95% CI of the ICC was wide and the SEM was 54%
the magnitude of the mean ulnar nerve movement [Table 4.4]. Variability across nerve
estimates (CV = 15%) was within the acceptable level of CV=20% (Reed et al., 2002). The
findings are suggestive of differences of DUI image analysis experience, supporting previous
reports of measurement error during DUI analysis (Hough et al., 2000; Ellis et al., 2008;
Korstanje et al., 2010; Chapter 3). The poor level of inter-rater image analysis reliability for
118
ulnar nerve LM limits merit for taking its reliability forwards, without first addressing the
sources of measurement error. Also, there is no previous ulnar nerve DUI study to compare
the present inter-rater image analysis results with.
C. Measurement issues associated with image analysis
Transverse and longitudinal nerve movement estimates computed from 3 physiotherapists’
analysis of the same n=18 nerve images returned low CVs, and poor [ulnar] and good
[median] inter-rater image analysis reliability. The results are suggestive of differences
across the 3 physiotherapists’ experience of nerve image analysis that compromised
reliability coefficients across their computed nerve movement estimates (Hough et al.,
2000; Kristjansson 2004; Ellis et al., 2008). Sources of error during image analysis are
suggested to arise from (a) inconsistent and inappropriate sizes and placement of image
markers (due to deformations and tracking local of artefact), (b) speckle tracking moving
out-of-plane, (c) precision of the correlation algorithm to process very small frame-to-
frame displacements (quantization error), (d) inappropriate frame intervals, and (e)
consistency and clarity of speckle features (f) background tissue used to track transducer
movement (Ellis et al., 2008; Korstanje et al., 2009, 2010, Chapter 3).
Strategies to address some of the measurement issues (a) to (e) above have been suggested,
including use of (a) the nerve image analysis template [Figure 3.3], (b) larger joint motion, as
well as involving an (c) experienced DUI operator. However, measurement issues that relate
to stationery subcutaneous or background tissue used to track transducer movement during
longitudinal nerve image analysis remain unaddressed. This is important because supportive

119
evidence to inform background tissue used to track movement of DUI transducer is sparse
(Dilley et al., 2001) and is limited by its small sample (n=4). The existing evidence provides
support for the use of superficial fascia. However, a significant proportion of DUI studies
have used bone, without supportive scientific evidence. Different background tissue has been
used arbitrarily within DUI studies (Dilley et al., 2001; Erel et al., 2003; Greening et al.,
2005). As a consequence, comparison of findings across studies is difficult, in addition to the
inherent potential for computed nerve movement estimates to become inflated or
underestimated when they are subtracted from nerve estimates. This will mislead
conclusions drawn from DUI research and limit the usefulness of the technique. There is a
merit for further evaluation of DUI background tissues used to track transducer motion when
computing LM estimates.
4.7 Chapter conclusions
The aim of Chapter 4 was to evaluate measurement error during image capture and image
analysis using methods of inter-rater image capture and inter-rater image analysis reliability
respectively. The study was designed to investigate potential sources of measurement error
within the DUI technique. The results of poor inter-rater image capture and inter-rater image
analysis reliability for median and ulnar nerve TM suggest that the technique possesses
substantial measurement error that contributes to poor reliability. The technique requires
review and further development in order to become a useful tool for clinical and research
purposes.

120
The poor inter-rater image capture and inter-rater image analysis reliability returned for ulnar
nerve LM also demonstrate that the measurement technique for this movement possesses
substantial measurement error that contributes to poor reliability. In contrast, the fair to good
estimate of inter-image capture and inter-image analysis reliability for median nerve LM is
indicative of its potential for providing reliable measurements. However, sources of
measurement error within both components must first be addressed.
As discussed, a potentially important source of measurement error that has not been
addressed, relate to the choice of background tissue used to track DUI transducer movement
during image analysis, because of its inherent potential to under or over estimate nerve
movement. Evidence in this regard is sparse, limited and relates to superficial fascia,
although a significant proportion of DUI studies have used bone, despite no supportive
evidence. Responsiveness to findings for median nerve LM in this chapter, informed further
re-analysis of n=18 median nerve LM images, to further investigate affect of different
subcutaneous tissue on computed nerve estimates and reliability in order to provide evidence
for the best background tissue for nerve image analysis. The background tissue study is
reported as Chapter 5 of the thesis.

121
Chapter 5
An evaluation of inter-rater reliability and construct validity of superficial fascia and
bone movement as representative of DUI transducer motion
5.1 Background
Evidence suggests that sources of measurement error associated with DUI components of
image capture and image analysis can affect estimates of nerve movement and reliability of
the technique and should therefore be addressed (Kristjansson 2004; Ellis et al., 2008;
Korstanje et al., 2010; Chapter 4). Image capture issues are easily addressable by involving
an experienced DUI operator (Ellis et al., 2008). However, potential error within DUI image
analysis such as (a) inconsistent and inappropriate sizes and placement of image markers
(due to deformations and tracking local of artefact), (b) speckle tracking moving out-of-
plane, (c) precision of the correlation algorithm to process very small frame-to-frame
displacements (quantization error), (d) inappropriate frame intervals, and (e) consistency and
clarity of speckle features (f) background tissue used to track transducer movement (Ellis et
al., 2008; Korstanje et al., 2009, 2010, Chapter 3) merit attention as strategies suggested to
address the sources of error, including use of (a) nerve image analysis template [Figure 3.3],
(b) larger joint motion, and involving an (c) experienced DUI operator have not addressed
error arising from stationery subcutaneous or background tissue used to track transducer
movement during LM image analysis. This component of nerve image analysis is important
considering its potential to inflate or underestimate LM, when subtracted from nerve
estimates, a hypothesis that warrant investigating.
122
Background tissue tracking, is an important component of the DUI analysis algorithm is that
is underpinned by the assumption that movement of subcutaneous tissue is reflective of DUI
transducer motion (Dilley et al., 2001). Preliminary evidence to support the claim has been
demonstrated using superficial fascia (Dilley et al., 2001), although the evidence is limited
by its small sample size (n=4) and use of freehand scanning to represent a fixed transducer.
Transducer motion was not tracked in their method, despite the potential for motion to occur
during freehand DUI scanning (Fenster et al., 1996, 2001). Despite the limited available
evidence, the same authors proceeded to use bone rather than superficial fascia for their
nerve image analysis, a method that has become widely accepted and used in DUI studies
(Dilley et al., 2001, 2003, 2007; Erel et al., 2003; Greening et al., 2005; Ellis et al., 2008;
Coppieters et al., 2009).
The argument in favour of bone as background tissue is that because it is a rigid and fixed
tissue, movement of bone possesses the greatest potential to represent motion of the
transducer. To date, this argument has not been scientifically investigated. Further evaluation
of reliability and construct validity of estimates of DUI transducer motion, computed from
subcutaneous tissue of bone and superficial fascia is therefore required. The findings from
this study will inform (a) choice of background tissue and (b) validate the DUI technique.
5.2 Aim
To compare for bone and superficial fascia as the background tissue:
(i) Inter-rater reliability for median nerve LM computed from re-analysis of each of 3
physiotherapists’ acquired n=18 images used in Chapter 3.

123
(ii) Construct validity for estimates of transducer motion using re-analysis of n=22 CWAD II
median nerve LM images. The 22 nerve images was data collected for an intra-rater
reliability study (Chapter 6), and was used because DUI transducer was fixed to the
forearm, during elbow extension ROM
5.3 Method
5.3.1 Design
(i) Frame by frame analysis of DUI images was used to compare nerve estimates computed
from bone and superficial fascia as background tissue. One physiotherapist analysed 3
raters acquired images of median nerve LM from 18 CWAD II participants. A sample
size of n≥12 was required to detect a difference in ICC estimates of reliability of 0.9 and
0.7 at 80% power and 5% level of significance level, using images from 3 raters (Walter
et al., 1998). The images were previously obtained for a DUI inter-rater reliability study
reported as Chapter 3.
(ii) To evaluate the validity of nerve movement estimates, frame by frame analysis of DUI
images was used to compare estimates of a fixed DUI transducer movement [motion =
0.0mm] computed from bone and superficial fascia. 1 physiotherapist analysed images of
median nerve LM obtained from a fixed DUI transducer attached to the forearm of 22
CWAD II participants. The method employed to evaluate construct validity for DUI
nerve estimates was underpinned by the hypothesis that the background tissue that
returned movement estimates closest to zero (mm) is reflective of the fixed DUI
transducer and interprets a valid method for computing nerve movement in-vivo. The

124
method was informed by Dilley et al’s (2001) report of validity for DUI, while
addressing the small sample size limitations (n=4) in Dilley et al (2001), warranted
addressing in the present analysis.
5.3.2 Physiotherapists involved in image analysis
The same musculoskeletal physiotherapists involved in Chapter 4 nerve image analysis
conducted the image analysis for both reliability and validity components of this study.
5.3.3 Image analysis program and protocol
The same program used to analyse LM in previous Chapters 3 and 4 was utilised for image
analysis for both reliability and validity components of this Chapter.
5.4 Statistical Analysis
Inter-rater reliability was analysed using descriptive statistics of arithmetic mean and
inferential statistics of ICC2,1 , 95% CI, SEM, and CV. Construct validity was analysed using
descriptive scatter plots (Dilley et al., 2001). The statistics were computed using SPSS
version 19.0 and Microsoft excel spreadsheet 2010.
5.5 Results
5.5.1 Inter-rater reliability of nerve estimates comparing bone and superficial facia
The reliability across estimates of median nerve LM computed by 1 physiotherapist from
each of 3 physiotherapists acquired n=18 nerve images, comparing bone and superficial
fascia as background tissue, is presented in Table 5.1 and Figure 5.1. A higher reliability

125
coefficient, narrower 95% CI, larger median nerve movement and low CV for superficial
fascia in comparison to bone, demonstrated superficial ability to provide a more reliable
estimate of median nerve movement. Nerve movement that was computed from bone was
under-estimated, and this suggests presence of potential error that in turn, could compromise
DUI reliability for LM.
Table 5.1: Inter-rater reliability of median nerve LM estimates computed by 1 physiotherapist analysis of each of three physiotherapists acquired n=18 images using bone and superficial fascia as background tissue
Background tissue
ICC 95% CI of
ICC Movement
[mm] SEM (mm)
CV [%]
Superficial fascia
0.7 0.4 to 0.84 0.90 0.37 14
Bone 0.4 0.15 to 0.71 0.72 0.35 20
Superficial fascia
Figure 5.1A: Description of reliability across median nerve LM computed from each of 3 physiotherapists n=18 DUI images using superficial fascia as background tissue Bone
Figure 5.1B: Description of reliability across median nerve LM estimates computed from each of 3 physiotherapists n=18 DUI images using bone as background tissue

126
5.5.2 Construct validity comparing estimates from bone and superficial fascia to a fixed DUI
transducer
A line plot of cumulative movement across 100 image frames for bone and superficial fascia
is presented in Figure 5.2. Median nerve cumulative movement across the image frames was
also plotted (Dilley et al., 2001). From the results, movement was greater in the median
nerve [2.60mm] compared to bone and superficial fascia. The result support preliminary data
from Dilley et al (2001). Superficial fascia demonstrated a mean cumulative frame by frame
movement of 0.00mm that was representative of the fixed transducer, and supporting
preliminary data from (Dilley et al., 2001). In contrast, bone demonstrated a movement of
0.3mm that translate to a 12% (0.9/0.72) underestimation of median nerve LM in comparison
to superficial fascia. The underestimated LM has potential to mislead interpretations and
conclusions particularly for small nerve movement, e.g. during CNSF [Chapter 3].
0.00
0.50
1.00
1.50
2.00
2.50
3.00
1 11 21 31 41 51 61 71 81 91
CU
MU
LAT
IVE
M
OV
EM
EN
T (
mm
)
FRAME NUMBER
MEDIAN NERVE
BONE
SUPERFICIAL FASCIA
Figure 5.2: Descriptive representation of frame by frame estimate of mean cummulative movement of median nerve, bone and superficial fascia in 22 nerve images

127
5.6 Discussion
The aim of this Chapter was to establish whether DUI tracking of bone and superficial fascia
can provide reliable median nerve LM estimates as well as valid computation of transducer
motion, to address discrepancies between DUI evidence and practice in relation to the
background tissue of interest.
5.6.1 Inter-rater reliability of nerve estimates comparing bone and superficial facia
To evaluate inter-rater reliability for median nerve movement estimates computed using
bone and superficial fascia as background tissue, one physiotherapist analysed each of 3
physiotherapists acquired n=18 images. Using superficial fascia as the background tissue
demonstrated good reliability [ICC2,1 = 0.7; 95% CI = 0.4 to 0.84] and higher estimates of
LM [0.9mm, SEM = 0.37mm] in contrast with fair reliability [ICC2,1 = 0.4; 95% CI = 0.15 to
0.71] and lower estimates of LM for bone [0.72mm, SEM = 0.35mm]. This is the first study
comparing reliability coefficients of nerve movement estimates computed from bone and
superficial fascia as background tissue. It is also the first time superficial fascia has been
reported as the background tissue in a DUI reliability study. A high reliability coefficient for
median nerve LM estimates using bone as background tissue has been reported in the DUI
literature (Coppieters et al., 2009). However, the fair reliability coefficients returned for bone
in the present analysis questions previous findings. Methodological differences between the
DUI analyses in the two studies could have contributed to the differences. Conclusions from
Coppieters et al.’s (2009) study were limited by its small sample size (n=10) in comparison
to n≥12 recommended for 3 raters to detect a difference in reliability of 0.9 and 0.7 at 80%
power and 5% level of significance (Walter et al., 1998). Their reliability finding is also

128
limited by their focus to healthy individuals. Both of these limitations can contribute to
compromise of reliability measurements (Haas et al., 1991; Walter et al., 1998). This study
has addressed these limitations and therefore provided a higher quality study to enable
confidence in conclusions.
Superficial fascia demonstrated good reliability, a narrow 95% CI, larger median nerve
movement, and a low CV in comparison to bone. The results could be due to clarity and
consistency of speckle features within superficial fascia in comparison to bone. This is
because both image characteristics contribute to image quality that affects reliability of nerve
movement estimates (Hough et al., 2000; Kristjansson 2004; Ellis et al., 2008; Korstanje et
al., 2010; Chapter 4). Based on visual analysis, all the 22 median nerve images demonstrated
clear speckle features and distinct boundaries for superficial fascia (100%), in contrast to
15/22 for bone (68%). The image characteristics are required for good correlation between
consecutive DUI frames [Fenster et al., 1996, 2001; Korstanje et al., 2010]. Added to this, as
it is a superficial tissue, its use overcomes potential problem of subcutaneous tissue [e.g.
bone] falling out of the ultrasound field during nerve image capture (Korstanje et al., 2010).
Both characteristics contribute to improve DUI image quality, reduce error, lead to accurate
nerve movement estimates and overall improve reliability of measurements obtained by the
technique (Korstanje et al., 2010). In addition, use of fascia as the background tissue will
increase confidence in nerve movement results as well as assist interpretation and
comparison of nerve movement data across clinicians’ measurements and DUI studies. The
results suggest therefore that using superficial fascia as the background tissue can provide a
more reliable nerve movement estimate than bone. However, information regarding the

129
validity of superficial fascia and bone to compute DUI transducer motion is required to
complete the information needed to guide future clinical measurements and DUI studies.
5.6.2 Construct validity comparing estimates from bone and superficial fascia to a fixed
DUI transducer
The frame-by-frame analysis showed that superficial fascia returned a cumulative movement
of 0.00mm in comparison to bone (Figure 5.2). The results agree with, but provide higher
quality supportive evidence for superficial fascia, in line with Dilley et al (2001). Dilley et al
(2001) conclusions were limited by a small sample size (n=4) and a focus to healthy
individuals. Both limitations were addressed in this study. Further to this, Dilley et al (2001)
used freehand transducer scanning to investigate superficial fascia. The potential for hand
movements suggested that the method lacked an objective reference point against which to
compare their computed background tissue movement. This study used a fixed transducer to
address this limitation, and image analysis used this fixed reference point to compare bone
and superficial fascia motion. The present analysis adds to preliminary data and supports
superficial fascia measurement of DUI transducer motion, as well as its use when computing
nerve movement estimates.
5.7 Chapter conclusions
Measurement properties of inter-rater reliability and construct validity demonstrated for
superficial fascia favour its use for estimating DUI transducer motion when computing
median nerve LM in CWAD II. The results support its use for research and clinical practice,
which challenges current practice of using bone as the background tissue. The findings from

130
this Chapter informed use of superficial fascia as background tissue in addition to other
strategies for improving reliability of DUI (Chapters 3 and 4). As a consequence, a further
reliability study was conducted and is reported as Chapter 6 of the thesis.

131
CHAPTER 6
Intra-rater reliability of DUI method of computing median nerve longitudinal
movement in CWAD II
6.1 Background
A range of measurement issues are suggested to affect DUI computed nerve movement
estimates as well as reliability of the technique (Ellis et al., 2008; Chapter 3, 4, 5). They
include rater skill and dexterity of DUI image capture and image analysis, inconsistent sizing
and placement of boxes to track speckle motion within regions of interest, boxes falling out
of the image plane, poor handling of small frame displacements by the analysis program, and
effect of type of selected subcutaneous [background] tissue on computed estimate of DUI
transducer motion (Ellis et al., 2008; Korstanje et al., 2009, 2010).
Chapter 4 reported use of the method of inter image-capture and inter image-analysis
reliability to establish the presence of measurement error within nerve image capture and
nerve image analysis respectively. For image capture, reliability across all transverse and
longitudinal images was poor, with the exception of median nerve longitudinal images that
was fair [Table 4.1 - 4.2]. Within image analysis, reliability across all transverse and
longitudinal analyses was poor, with the exception of median nerve longitudinal analysis that
was good [Table 4.3 – 4.4]. The results demonstrate differences across images and analyses
that are indicative of the presence of measurement error when the technique is used.
Strategies of involving a single, skilled DUI operator, using large joint motion and utilizing a

132
nerve image analysis template have been advanced to address some of the error. However,
they have not been investigated to establish their potential to improve reliability of DUI.
An important source of error within the DUI image analysis that has potential to under or
overestimate nerve movement relates to the choice of background tissue used to track DUI
transducer motion. Supportive evidence to inform choice of background tissue is sparse and
limited (Dilley et al., 2001), and relates to superficial fascia. Interestingly, the background
tissue that is widely accepted and used in DUI practice is bone (Dilley et al., 2001, 2003,
2007; Greening et at 2001; Erel et al., 2003; Greening et al., 2005; Ellis et al., 2008;
Coppieters et al., 2009) and this practice contradicts existing evidence (n=4) for superficial
fascia (Dilley et al., 2001). The contrast between DUI practice and existing evidence for
superficial fascia warranted further investigation of inter-rater reliability and construct
validity, comparing bone and superficial fascia (Chapter 5).
Chapter 5 conducted a re-analysis of median nerve LM images (n=18) to investigate inter-
rater reliability and construct validity of using bone and superficial fascia as a fixed reference
point to track DUI transducer motion. The analysis found fair inter-rater reliability for bone
(ICC2,1 = 0.4; 95% CI = 0.15 to 0.71), and good inter-rater reliability for superficial fascia
(ICC2,1 = 0.7; 95% CI = 0.4 to 0.84) (Coppieters et al., 2009). Construct validity of bone and
superficial fascia to track a fixed DUI transducer was also assessed and the result
demonstrated movement in superficial fascia = 0.0mm, in comparison to bone = 0.3mm. The
findings agree with Dilley et al (2001). This evidence supports use of the superficial fascia as

133
the background reference tissue in order to reduce error and improve reliability of computed
nerve movement estimates, although its usefulness in this regard has not been investigated.
Overall, there is merit for strategies advanced to address sources of measurement error
within DUI image capture and image analysis, to be evaluated in regards of their ability to
improve reliability of the technique. This informed further evaluation of reliability of DUI
estimate of median nerve LM.
6.2 Aim
To determine the intra-rater reliability of DUI estimates of median nerve LM at the mid-
forearm during elbow extension in CWAD II participants.
6.3 Methodology
6.3.1 Design
A cross sectional intra-rater reliability design was used to compare DUI estimates of median
nerve LM during elbow extension in CWAD II participants on one occasion by 1
physiotherapist [rater]. Intra-rater reliability was determined to address potential influence of
rater experience of DUI image capture and image analysis (Ellis et al., 2008; Chapters 3 and
4). The median nerve was selected because previous analysis has showed its potential for
achieving consistent estimates (Chapter 4). Elbow extension movement was selected to
provide larger nerve movement that are suitable for the fixed 1 – 3 frame interval preset in
the cross-correlation analysis program (Dilley et al., 2001; Korstanje et al., 2010). Elbow
extension is a clinically relevant joint motion because it is used as a key component during

134
ULNT (Nee and Butler, 2006). The poor results demonstrated in Chapters 3 and 4 for
median and ulnar nerve TM as well as ulnar nerve LM informed their exclusion from this
study.
6.3.2 Participants
22 [19 females, 3 males] CWAD II participants, mean age (SD) = 26 (7) years who had
experienced a previous whiplash injury were recruited into the study. A sample size of n≥18
was required to detect a difference in reliability of 0.9 and 0.7 at 80% power and 5% level of
significance using 2 ratings (Walter et al., 1998). 22 participants were recruited to allow for
potential data loss or corruption during data transfer between ultrasound scanner and
computer system used for data analysis.
6.3.3 Inclusion and exclusion criteria
The Same inclusion and exclusion criteria for previous Chapters were used.
6.3.4 Ethical Considerations
Ethical clearance for this study was obtained from the ethics committee of the School of
Sports and Exercise Sciences and Health and Population Sciences.
6.3.5 Recruitment strategy
The same methods for recruiting participants in previous studies were used.

135
6.3.6 Rater
The same rater involved in previous studies, acquired and analysed nerve images.
6.4 Data collection
6.4.1 Health questionnaire and neurological examination
The same procedure used in previous studies explored criteria for participant inclusion into
the study.
6.4.2 Participant position for nerve image capture
The participant’s starting position for image capture was supine lying, 900 degrees shoulder
abduction, wrist in neutral and 900 elbow flexion (Dilley et al., 2003). Sequences of images
of median nerve LM were captured while the elbow was moved from 900 flexion to 00
extension (Dilley et al., 2003). Elbow extension was used to lengthen the nerve bed in order
to produce nerve movement (Szabo et al., 1994; Shacklock 1995; Byl et al., 2002; Dilley et
al., 2003; Coppieters et al., 2006). Median nerve movement was captured in a sequence of
images acquired at the mid-forearm (Greening et al., 2005). This study used a fixed DUI
transducer. The DUI transducer was placed in a holder and fixed to the mid-forearm by
means of Velcro straps. Two sets of nerve images separated by 30 minutes (to eliminate
learning effects) were taken by the rater for each participant. The same DUI equipment,
nerve image size and resolution, and transducer alignment position used for median nerve
LM in Chapter 3 was used.

136
6.4.3 Image Analysis
The same nerve image analysis program and protocol for previous studies was employed for
image analysis. However, movement of superficial fascia rather than bone was used to
compute DUI transducer motion (Dilley et al., 2001; Chapter 5).
6.5 Statistical Analysis
The same statistics and statistical package of previous inter-rater reliability study (Chapter 3)
was used.
6.6 Results
The intra-rater reliability of median nerve LM obtained at the mid-forearm by 1 rater from
22 CWAD II participants is presented as Table 6.4 and Figure 6.1.
Table 6.1: Intra-rater reliability of median nerve LM during elbow extension in n=22 CWAD II participants
Nerve ICC 95% CI of ICC Movement
[mm] SEM (mm)
MDC (mm)
CV [%]
Median 0.8 0.55 to 0.90 2.60 0.86 2.38 7
Figure 6.1: Descriptive presentation of median nerve LM computed from 2 sets of n=22 DUI images

137
6.7 Discussion
The results demonstrated excellent DUI intra-rater reliability (ICC = 0.8; 95%CI = 0.6 to
0.9) (Coppieters et al., 2009), that was associated with a small error and variability [nerve
movement = 2.60mm; SEM = 0.86; CV = 7%] during elbow extension in a CWAD II. The
excellent intra-rater reliability indicates that a physiotherapist can use DUI technique to
compute reliable estimates of median nerve LM in a CWAD II during elbow extension
motion. The excellent reliability support previous reports of high reliability of DUI
computed for median nerve LM (Erel et al., 2003; Coppieters et al., 2009). However, the
present study differ from previous DUI reliability studies in that it provides a higher quality
of DUI reliability evidence that is relevant and reproducible in a clinical setting. Coppieters
et al (2009) had evaluated inter-rater reliability for the DUI image analysis component alone,
involving a small sample (n=10) of healthy individuals, a study method that limit their study
conclusions, and generalisabilty of their findings to a patient sample (Haas et al., 1991). In
contrast, the present study evaluated DUI intra-rater reliability for both image capture and
image analysis because both components are used by physiotherapists during computation of
estimates of nerve movement in a clinical setting. Erel et al (2003) used within-participant
standard deviation [WSD] to report high intra-rater reliability for DUI estimate of median
nerve LM in a small sample of CTS patients (n=4). Adding to error associated with
interpreting findings generated from small sample data (Haas, 1991), the potential of the
WSD statistic to be affected by increases in mean nerve movement can mislead
interpretation of reliability and therefore limit its usefulness (Bland and Altman, 1996). This
issue informed the recruitment of n=22 CWAD II participants and the use of the

138
recommended ICC statistic in the present study (Bland and Altman 1996; Eliasziw et al.,
1998; de Vet et al., 2006).
This DUI intra-rater reliability study is the first to be conducted in CWAD. The results and
method adopted provide evidence to support its use in a clinical setting, because intra-rater
reliability coefficients achieved in the study meets the ICC = 0.8 cut-off recommended for
clinical measurements (Haas et al., 1991). Heterogeneity or differences between participants’
nerve data can lead to high ICC estimates (Haas 1991). However, the low SEM and CV
obtained in the present study showed that the achieved reliability coefficients cannot be
attributed to participant heterogeneity (Keating and Matyas 1998; Bruton et al., 2000;
Domholdt 2005; de Vet et al., 2006; Tighe et al., 2010). The size of the SEM has been
suggested to affect the estimate of reliability (Tighe et al., 2010). However, the low SEM
demonstrated in this study increases confidence in the returned intra-rater reliability estimate.
6.8 Chapter conclusions
The aim of this study was to determine intra-rater reliability of DUI technique of computing
median nerve LM at the mid-forearm during elbow extension in CWAD II. The results
support DUI as a reliable method for computing median nerve LM in CWAD II participants,
using large joint motion [elbow extension].
The results provide supportive evidence to inform use of DUI to evaluate nerve movement as
one of the theorised components underpinning the ULNT 1 [median nerve bias] (Greening et

139
al., 2005). These conclusions informed using the DUI technique to compute median nerve
movement for a ULNT validity study that is reported as Chapter 7 of the thesis.

140
CHAPTER 7
Construct validity of ULNT 1 using median nerve longitudinal movement, elbow
extension ROM, pain response, and Brachialis muscle activity in CWAD II
7.1 Background
The evidence for the validity of the ULNT 1 test to assess hypersensitivity of peripheral
nerves in chronic pain conditions such as CWAD is incomplete (Chapter 2, Section 2.6.IVb).
Theorised constructs that underpin the test indicate that restriction of nerve movement
contribute to increased nerve tension, increased pain response, decreased elbow extension
ROM and increased flexor muscle activity during the test (Nee and Butler, 2006). However,
in clinical practice, physiotherapists interpret the ULNT 1 test through constructs of
increased pain response, decreased elbow extension ROM and increased flexor muscle
activity (Nee and Butler, 2006).
Nerve movement can now be measured in-vivo with the emergence of the DUI technique,
although evaluation of in-vivo nerve tension measurements remains a challenge for existing
biomedical equipment. It is recognised that nerve movement and tension have been
measured in cadaveric studies that are widely relied upon to inform validity of the ULNT
(Kleinrensink et al., 1995, 2000; Shaclock 1996; Wright et al., 1996; Lewis et al., 1998;
Coppieters et al., 2001; Coppieters and Butler 2008). However, a limitation of these studies
is that they lack the detail of the pain response and flexor muscle activity required to
complete the evaluation of the validity of the test. In addition, nerves in cadavers possess

141
characteristics that are different from those of living tissue; with embalming procedures
further compromising tissue characteristics (Coppieters et al., 2009). As a result, existing
cadaver studies provide limited evidence to evaluate the validity of the ULNT through the
theorised constructs.
Studies in humans have also been conducted to provide supportive evidence for constructs
underpinning the ULNT, although they are sparse [n=3] and incomplete as they lack nerve
movement and nerve tension (in-vivo) data, due to the unavailability of appropriate medical
equipment at the time of conducting the studies. In addition, the majority of the studies were
focused to healthy individuals, and this limits their translation to a patient population.
Overall therefore, evidence for validity of ULNT in CWAD is lacking. In addition, present
understanding of physiological mechanisms that contribute to responses during the ULNT is
limited. This understanding could underpin conflicting arguments regarding clinical
relevance and usefulness of the test for a patient population such as CWAD. While some
authors favour the test because it can assist interpretation of neural hypersensitivity, (Nee
and Butler 2006), others advocate against its use because of its potential to further provoke
hypersensitivity of nerves that are already sensitised (Dilley et al., 2008). The conflicting
arguments corroborate limitations of existing information regarding validity of the ULNT
and highlight a need for further evaluation of ULNT, particularly, with the emergence and
evidence for the DUI technique to provide in-vivo nerve movement estimates (Chapter 6).
Supportive reliability and validity evidence for DUI estimates of median nerve LM in
CWAD II have been established in Chapters 5 and 6. Potential clinical benefits such as
clarity of reasoning to justify clinicians use of the test for patients, and supportive evidence

142
for constructs used to interpret the test, amongst others, will emerge as the validity evidence
for ULNT, particularly within a patient population e.g. CWAD, is updated. This informed
the design of a study to further evaluate construct validity of ULNT 1 in CWAD II. The
specificity and sensitivity of the median nerve ULNT 1 has been reported (Kleinrensink et
al., 2000). Intra- and inter-rater reliability of ULNT 1 measurements has also been
established within the literature (Selvaratnam et al., 1994; Grant et al., 1995; Byng, 1997;
Kelly and Jull, 1998; Coppieters et al., 2001, 2002; Wainner et al., 2003; Heide et al., 2006;
Oliver and Rushton, 2011).
7.2 Aim of study
To evaluate construct validity of the ULNT 1 [median nerve] using correlation of test
constructs of median nerve LM, brachialis muscle activity, pain response, and elbow
extension ROM in CWAD II.
7.3 Methodology
7.3.1 Design
A construct validity design to establish correlation between estimates of median nerve LM,
pain, brachialis muscle activity and range of elbow extension in a CWAD II population.
7.3.2 Participants
A sample of 22 CWAD II participants [19 females, 3 males], mean age (SD) = 26 (7) years,
who had experienced a previous whiplash injury participated in the study. Coppieters et al
(2009) reported validity for different types of median nerve neurodynamic exercises [sliders

143
and tensioners], from a calculated sample size n=13, used to detect a significant difference of
nerve movement at a power of 90% and 10% level of significance. A sample size n≥13 was
adopted to account for potential loss or corruption of data.
7.3.3 Inclusion and exclusion criteria
The same inclusion and exclusion criteria for previous studies were used.
7.3.4 Ethical Considerations
Ethical clearance was obtained from the ethics committee of the School of Sports and
Exercise Sciences and Health and Population Sciences.
7.3.5 Recruitment strategy
The same methods for previous studies were used.
7.3.6 Rater
Electromyography [EMG] recordings were captured and acquired by the same
physiotherapist who captured and analysed the DUI images in previous studies (Chapters 5
and 6), who was trained in EMG data capture and data analysis. A second researcher was
involved in taking measurements of elbow range of movement and routinely uses
goniometry during patient assessment in clinical practice. Both researchers are
musculoskeletal physiotherapists with ≥ 2 years post qualification clinical experience and
were studying at the postgraduate level during the time of data collection.
7.3.7 Testing Protocol

144
G. Health questionnaire and neurological examination
The same procedure for previous studies was used.
7.3.8 Data collection
The participants starting position was supine lying, shoulder fixed to prevent elevation, 900
shoulder abduction, shoulder lateral rotation, forearm supination, wrist and finger extension,
and 900 elbow flexion (Shacklock, 2005) [Figure 7.1C]. Pain level prior to performing the
ULNT was marked by the participant on a VAS marked 0 [no pain] to 10 [worst pain]. The
Visual Analogue Scale [VAS] score is widely recognised, and used in research and clinical
settings, to measure pain response, and has been used in CWAD (Sterling, 2004). Resting
electromyography recordings of brachialis muscle was also captured at this point. The EMG
is the gold standard for evaluating muscle activity, and has been used in previous ULNT
studies (Jaberzadeh et al., 2001). The upper limb neurodynamic test was performed by
moving the elbow joint from 900 flexion into extension. Elbow extension ROM, an
important component of ULNT, was taken to participant’s limit of pain [P2] or available
range [R2] in other to lengthen the nerve bed and produce nerve movement (Szabo et al.,
1994; Shacklock 1995; Byl et al., 2002; Dilley et al., 2003; Coppieters et al., 2006; Nee and
Butler 2006). Median nerve LM (Dilley et al., 2003) and Brachialis muscle activity
(Jaberzadeh et al., 2001) were captured simultaneously during the ULNT. Elbow extension
[ROM] to P2 or R2 was measured for both arms (Jaberzadeh et al., 2001) and side differences
were computed. Pain level post ULNT was marked by the participant on the visual analogue
scale [VAS] and compared with pre ULNT levels.

145
Images of median nerve LM were captured using same DUI equipment and protocol used for
previous studies (Chapters 3, 4, 5 and 6) [Figure 7.1A]. Bipolar surface EMG electrodes
were attached over the brachialis muscle in the distal third of the arm (Moore and Dalley,
2006) [Figure 7.1C]. The electrodes were Velcro-secured to the participant’s arm to
minimise movement artefacts (Jaberzadeh et al., 2001). Detection electrode surface was
made of pure silver (>99.5%) in the form of 2 parallel bars 10 mm long and 1 mm wide with
an inter-detection surface spacing of 1.0 cm [Figure 7.1B]. The small electrode size and
inter-detection surface spacing minimised cross-talk susceptibility from adjacent muscles
(DeLuca 1997). A bandwidth between 20 and 450 Hz was used to capture the full frequency
spectrum of brachialis EMG signal and to suppress noise at higher frequencies (DeLuca,
1997, 2002). Control measures such as clear instruction at the start and end point of data
capture were adopted to ensure that EMG data for the duration of the ULNT was captured.
The test protocol was described clearly to the participants in other to eliminate plausible
apprehension or fear avoidance that could lead to subtle arm movement as well as signal
artefacts within the muscle, both of which can contribute to affect EMG data quality. This
method was adopted as evidence indicates that psychological factors of pain catastrophising
within a fear-avoidance model of musculoskeletal pain are suggested to predict clinical pain
response in healthy individuals [n=62; p<0.01] (Beneciuka et al., 2010). The authors
recommended consideration of the effect of psychological factors on evoked pain responses
when performing the neurodynamic test. Elbow extension ROM was measured using a
universal goniometer positioned along the longitudinal axis of the tested arm and forearm as
described in the goniometry literature to ensure accuracy of obtained measurements
(Jaberzadeh et al., 2001).

146
7.4 Data analysis
The same method for conducting DUI image analysis in previous study (Chapter 6) was
used. For Brachialis muscle activity, acquired EMG data was first amplified 3000 times by a
low-noise EMG amplifier with a high common mode rejection ratio [120 db] (Basmajian et
al., 1985). The signals were then filtered with a band-pass filter with corner frequencies of 10
– 500 Hz. A band-reject filter centred on 50 Hz removed the power line hum. The filtered
EMG signals were band-limited using a second order Butterworth filter and digitised using a
sampling rate of 1000 Hz (Jaberzadeh et al., 2001). Change in pain score was obtained by
computing difference between participant’s pre and post test pain levels. The difference
between both arm’s elbow extension ROM was also recorded to assist comparison.
Fig 7.1A: DUI scanner and transducer Fig 7.1B: EMG equipment set up

147
Fig 7.1C: ULNT 1 arm starting position with transducer and EMG electrode at the mid-forearm and distal third of arm respectively
Fig 7.1D: ULNT 1 arm ending position with transducer, EMG electrode and goniometry measurements
7.5 Statistical Analysis
The Pearson product moment correlation coefficient [denoted by r] was used to measure
correlation between the ULNT 1 test constructs measured in this study. The statistic is
widely used as a measure of strength of linear dependence between two variables (Sim and
Wright, 2000), and has also been used in previous human ULNT validity studies (Jaberzadeh
et al., 2001, 2005). Pearson’s r can have a value between +1 and −1 (Sim and Wright 2000).
SPSS [version 19.0] was used to compute Pearson’s r. A value r = 0.5 has been
recommended as a cut-off point to interpret clinically important and strong association
between outcome variables (Cohen, 1988).
7.6 Results
The study sought to evaluate construct validity of ULNT 1 using association between
estimates of median nerve LM; pain response; activity of Brachialis muscle; and elbow

148
extension ROM in CWAD II participants. The results demonstrated a statistically significant,
strong positive association between elbow extension ROM and median nerve LM (r=0.6) as
well as pain response and median nerve LM (r=0.7) [Table 7.1]. There was however a
statistically non-significant, weak but positive association between brachialis muscle activity
and pain response (r=0.1), median nerve LM (r=0.2), and elbow extension ROM (r=0.1)
[Table 7.1]. The correlation coefficient returned for 3 (nerve movement, pain and elbow
ROM) out of 4 theorised constructs underpinning the ULNT support the validity of the test
in addition to previous cadaver (Kleinrensink et al., 1995, 2000; Shaclock 1996; Wright et
al., 1996; Lewis et al., 1998; Coppieters et al., 2001; Coppieters and Butler, 2008) and
human (Jaberzadeh et al., 2001, 2005) ULNT studies. The results obtained for a 4th construct,
flexor muscle activity, and contrast reports with previous report suggesting association
between flexor muscle activity and pain response (Jaberzadeh et al., 2001, 2005).
Table 7.1: Mean, standard deviation and Pearson r for the ULNT 1 test components studied
ULNT Component
Pearson’s r Mean
Standard Deviation Nerve
movement Elbow ROM
Pain Change
Brachialis Activity
Nerve movement 1 0.5* 0.7** 0.2 1.5mm 0.85mm
Elbow ROM 0.5* 1 0.4 0.1 780 5.00
Pain Change 0.7** 0.4 1 0.1 43mm 29.32mm
Brachialis Activity 0.2 0.1 0.1 1 1.5mV 1.46mv
* Correlation is significant at the 0.05 level (2-tailed) ** Correlation is significant at the 0.01 level (2-tailed)
7.7 Discussion

149
The construct validity study of the ULNT 1 test in CWAD II population has provided further
evidence to support use of the test for assessing chronic musculoskeletal pain conditions. In
addition, the study results justify current clinical practice of using pain response and elbow
extension ROM when interpreting the ULNT 1 test (Shacklock, 2005). The result also
supports nerve movement data being used as an additional construct for interpreting the
ULNT 1 test. This information was previously unknown in the ULNT literature and merits
dissemination and translation to clinical practice. The results will also inform future ULNT
validity studies that are focused to in-vivo nerve tension that the present construct validity
evidence has been unable to address, because of previous limitations of medical equipment.
Despite these merits, the results of poor correlation between flexor muscle activity and pain,
as well as for nerve movement and elbow ROM constructs warrant further consideration,
particularly as they challenge current practice that uses a physiotherapist’s subjective
perception of a patient’s muscle resistance to interpret the test (Nee and Butler, 2006). This is
an important issue as quantification of a physiotherapist’s perception of a patient’s resistance
is difficult and could bias comparison and interpretation of results (Nee and Butler, 2006).
Pain response during the test is equally difficult and depends on the patient’s cognitive
feedback (Nee and Butler, 2006), although the adoption of the VAS minimises the bias.
Further evaluation of the usefulness and clinical relevance of this construct is warranted,
particularly as it shows a potential to mislead clinicians assessment of ULNT findings.
The construct validity evidence for ULNT in CWAD showed a statistically significantly
strong but positive association between constructs of elbow extension ROM, median nerve
LM and pain score [VAS]. The study therefore substantiated most of the theorised constructs
150
underpinning the ULNT 1. The ULNT is theorised to challenge the physical and mechanical
capabilities of peripheral nerves using multi-joint movements of limbs and/or trunk that
produces increase in nerve tension in and nerve movement (Elvey 1997; Hall and Elvey
1999; Millesi et al., 1990; Butler, 1991, 2000; Shacklock 1995; Beith et al., 1996; Coppieters
et al., 2001; Nee and Butler 2006). The test reflects an interdependent link between
physiological response (sensory) and mechanics of neural tissue (movement) that determine
the extent of joint motion (Shacklock, 1995). This theorised concept is also supported by the
present construct validity results. Also, a pathological [positive] response during the ULNT
is determined by reproduction of pain symptoms that coincide with a decrease in range of
movement [elbow extension] (Shacklock, 2005; Nee and Butler 2006). The construct
validity findings of a statistically significant and strong positive correlation for elbow
extension ROM and median nerve LM (r=0.6) as well as for pain score [VAS] and median
nerve LM (r=0.7) support this construct for interpreting a positive ULNT test. The study
findings also support findings from cadaver-based ULNT validity studies (Kleinrensink et
al., 1994, 1995, 2000; Shacklock, 1995; Wright et al., 1996; Lewis et al., 1998; Coppieters et
al., 2001; Coppieters and Butler 2008), although its merit over these studies has already been
highlighted.
The present study did not show a statistically significant correlation between brachialis
muscle and pain (r=0.1), median nerve movement (r=0.2) and elbow extension (r=0.1). The
result contrasts with findings of previous ULNT validity studies (Jaberzadeh et al., 2001,
2005). However, differences of study sample and methods might account for the present
study results. For example, Jaberzadeh et al (2001) investigated correlation between passive

151
elbow resistive torque and EMG activity of shoulder and arm muscles during elbow
extension at periods of pain onset and limit of pain in healthy participants [n=10]. Their
result showed that pain and elbow resistive torque were positively correlated with EMG
activity of shoulder and arm muscles. The same authors (Jaberzadeh et al., 2005) evaluated
correlation between elbow ROM, elbow flexor resistive torque and EMG activity of 10
shoulder and arm muscles at movement onset, pain onset and pain limit during ULNT 1 in
healthy individuals [n=26]. They found elbow extension range to be positively associated
with an increase in resistive torque and the EMG measurements of muscles evaluated. Nine
out of the 10 muscles evaluated demonstrated increased muscle activity pre pain onset that
became further increased post pain onset. Their results suggest a relationship between
elevated perception of pain and motor responses that the present study failed to replicate.
The healthy individuals investigated in their study differ from the patient sample in the
present construct validity study. In addition, study methods were different. For example, the
present validity study did not measure EMG activity of brachialis muscles at time points of
movement onset, pain onset, and pain limit as was reported in Jaberzadeh et al (2001, 2005).
The inability of available DUI (image analysis focused to frame by frame correlation) to
synchronize nerve movement data at these time points prevented replication of their method.
This might have influenced the correlation results between DU and EMG data. The same
reason can be advanced for poor correlation between brachialis muscle activity and elbow
extension ROM.
7.8 Chapter conclusions

152
The evidence for the construct validity of the ULNT 1 test support use of median nerve LM,
pain, and elbow extension ROM when assessing chronic pain conditions like CWAD II in a
clinical setting. However, findings of a weak correlation between Brachialis muscle activity
and constructs of pain, median nerve LM and elbow extension ROM does not support use of
muscle activity when interpreting ULNT responses. However, considering limitations of
DUI technique to synchronise with EMG data at times points reported in previous ULNT
studies, further evaluation of muscle activity is warranted in a patient sample. This will in
turn provide the opportunity to add to the present study results in order to further explore the
validity of theorised constructs for ULNT 1 test. Until then, clinicians and researchers can
continue to rely on the present evidence when performing and interpreting ULNT. This
includes its consideration as a reliable and valid sensory test, in addition to QST when
assessing CWAD II.
Chapter 2 [literature review] of the thesis has showed merit for ULNT inclusion amongst the
range of sensory tests to discriminate CWAD II. However, evidence regarding its validity
was limited and incomplete, therefore warranting further evaluation. This study has provided
evidence in support of the validity of the ULNT. As a result, its inclusion in a sensory
discrimination study [Chapter 8] based on the criteria of its measurement validity is
supported by the results from this study.
Chapter 8

153
Sensory Hyperalgesia, Hypersensitivity and Hypoaesthesia Discriminate between
CWAD II and Healthy individuals
8.1 Background
Impairments of sensory hypersensitivity and hypoaesthesia are suggested as discriminative
of CWAD from INP and healthy individuals (Scott et al., 2005; Elliott et al., 2008; Chien
and Sterling 2010). Evidence in support of this claim is however limited, incomplete and
inconclusive. A detailed critique of the sensory discriminative evidence has been discussed
in the literature review (Chapter 2). However, the key limitations within the existing
evidence are highlighted in this Chapter to justify further evaluation of sensory impairments
to discriminate CWAD II.
Scott et al (2005) investigated sensory changes in CWAD [n=29] and INP [n=20]
participants using PPT and TPT and von Frey hair sensibility over sites local and remote to
the injury. They found that PPT discriminated both groups over local (P < 0.05) and remote
sites (P < 0.001). In addition, a decreased HPT as well as increased CPT at all sites
discriminated both groups (P < 0.03). The increased CPT contrasted with findings from both
Elliot et al (2008) and Chien and Sterling et al (2010) in support of a decreased CPT
discrimination between CWAD and INP. The PPT discrimination of CWAD however was
not replicated in future studies (Elliot et al., 2008; Chien and Sterling, 2010).
Elliot et al (2008) investigated characteristics of fatty infiltrate in the cervical extensor
musculature as well as QST measures of PPT and TPT to determine those that discriminated

154
CWAD [n = 79 women, mean age(SD) = 29.7(7.8) years] from INP [n=23 women; mean
age (SD)= 29.2 (6.9) years]. Although their study reported that the QST [CPT (p < 0.001)
and HPT (p = 0.001)] discriminated both groups, their bias to the female gender [Elliot et al.,
2008] limited generalisation of their conclusions, particularly, as gender differences to QST
have been reported (Edwards et al., 2004; Sullivan et al., 2005; Rolke et al., 2006). Further,
PPT in their study failed to discriminate both groups. This contrasts with results reported by
Scott et al (2005) and Chien and Sterling et al (2010) to support PPT discrimination between
CWAD and INP populations.
Chien and Sterling (2010) investigated sensory hypersensitivity and hypoaesthesia using a
range of QST detection and pain thresholds [thermal, pressure, electrical] applied over local
and remote site to the injury in CWAD [n= 50] and INP [n=28] participants. They found that
remote lowered PPT discriminated both groups (p = 0.02), in contrast to Scott et al (2005)
findings that both local (P < 0.05) and remote lowered PPT (P < 0.001) discriminated the
groups. Chien and Sterling (2101) reported that elevated VDT (p < 0.04), HDT (p < 0.02)
and EDT (p < 0.04) over local and remote sites (indicative of peripheral and central
hypoaesthesia) discriminated between CWAD and INP participants. However, confidence in
their conclusion is limited because their INP group did not demonstrate features of sensory
hypoaesthesia (p > 0.12). Surprisingly, sensory hypoaesthesia has been reported in similar
musculoskeletal pain conditions such as diffuse upper limb pain, hip osteoarthritis and
patellofemoral pain (Jensen et al., 2007b; Tucker et al., 2007). It was therefore interesting
that their INP participants did not demonstrate these sensory impairments. The authors
therefore recommended further replication of their findings.

155
Another limitation of the discrimination studies is their exclusion of a routinely used ULNT
sensory test. ULNT is a simple and costless sensory test, widely used to interpret changes to
peripheral and central neural functioning (Elvey 1997; Nee and Buttler 2006). The exclusion
negates recent cost saving initiatives in the NHS for simple and affordable clinical
assessment tests. This omission in combination with the limitations within the existing
evidence reflects an incomplete, limited, and inconclusive evidence for sensory
discrimination of CWAD, and necessitated a further sensory discrimination study of CWAD
II. However, because other impairments and mechanisms exists in CWAD, and are useful for
gaining further understanding of the condition, outcome measures that capture pain and
disability as well as psychological factors were explored and used to describe the study
CWAD II participants.
8.1.1 Psychological impairments in CWAD
Certain features of psychological impairment and elevated levels of pain and disability are
reported to co-exist with and contribute to modulate sensory manifestations in CWAD
(Rhudy and Meagher, 2000). The features are not considered to be discriminative of CWAD
(Sterling, 2010). Reports to indicate moderate association between sensory impairments
[pressure and cold hypersensitivity at some upper and lower limb sites] and psychological
factors [PTSD, psychological factors and pain catastrophisation] in CWAD participants
exists and potentially suggests psychological factors may also contribute to a hyperexcitable
neural system. Importantly, PTSD, measured by the impact of event scale [IES] provides
prognosis for WAD patient at risk of poor recovery (Williamson 2007). This finding further

156
indicates importance of psychological factors to better understand CWAD. PTSD does not
possess discriminative ability in CWAD, although this was not investigated in previous
sensory studies (Sterling, 2010). This implies that psychological factors are not predominant
triggers for spinal cord hyperexcitability demonstrated in CWAD (Sterling et al., 2008;
Sterling, 2010). However, measures of psychological impairments are important to reflect
other mechanisms in the complex clinical presentation of WAD, and are used in the sensory
discrimination study to describe the participants, as in previous discriminative studies (Scott
et al., 2005; Elliot et al., 2008; Chien and Sterling 2010).
A. Impact of Event Scale [IES]
The Impact of Event Scale [IES] is a widely used patient-reported questionnaire comprising
15 items used to measure current subjective stress related to specific life event or post-
traumatic stress reactions (Horowitz et al., 1979). The IES has been used in previous work by
Sterling et al (2005) to describe such relationships. Seven statements address intrusive
symptoms and 8 statements address avoidance symptoms. IES is reported to demonstrate
measurement properties of reliability and sensitivity (Horowitz et al., 1979). Its construct
validity has been reported (Karlehagen et al., 1993; Sundin and Horowitz, 2002; Joseph,
2000). The use of IES in clinic and research has also been justified (Joseph, 2000). The IES
comprises a total score 0 to 80, that can be described in four categories: sub-clinical [0–8],
mild [9–25], moderate [26–43] and severe stress reactions [44–75] (Kongstd et al., 2007).
8.1.2 Pain and disability association with sensory impairments in CWAD

157
CWAD precipitates a number of clinical symptoms such as pain and disability (Kamper et
al., 2008). The disability occurs because patients limit and restrict their level of personal
functioning in other to cope with symptoms of pain (Dysvik et al., 2005; Krohne and
Ihlebaek 2010). Such maladaptive coping strategies are used to prepare for potential pain-
triggering situations or events (Krohne and Ihlebaek 2010). The resulting restriction of
activity leads to disability that further impacts on levels of pain and activity [Figure 8.1].
Pain and disability co-exist with sensory impairments of local hypersensitivity to cold and
pressure in CWAD (Sterling and Kenardy, 2006; Sterling et al., 2008; Bossman et al., 2011).
This suggests that the same mechanisms that promote sensory impairments in CWAD may
be responsible for pain persistence in the condition. However, pain has not been shown to be
discriminative of CWAD participants, stressing the point that it is not the trigger for
symptoms in CWAD. Pain and disability however helps to understand and interpret sensory
impairments post whiplash injury, and Kamper et al (2008) have used same measures to
describe their CWAD participants such as the Neck Disability Index [NDI].
Figure 8.1: Diagram illustrating relationship of pain, psychological impairment and disability
A. Neck Disability Index [NDI]
Maladaptive coping
Disability [Impaired
Pain
Limitation of personal

158
NDI comprises of 10 items describing functional activities as well as pain intensity,
concentration and headache (Sterling et al., 2006). A higher score indicates greater pain and
disability (Vernon & Mior 1991). The NDI was originally designed for chronic neck pain
disorders but has been used in WAD (Sterling et al., 2006). It is the most validated pain-
disability outcome measure in the literature (Vernon & Mior 1991; Pietrobon et al., 2002).
WAD groups have been previously classified using the NDI as recovered (<8 NDI), mild
pain and disability (10 – 28 NDI) and moderate/severe pain and disability (≥30 NDI)
(Vernon, 1996; Sterling et al., 2003). A cut-off score of ≥30/100 is accepted as predictive of
poor recovery post whiplash, as well as a reference for identifying moderate/severe levels of
pain and disability by clinicians (Nederhand et al., 2004; Sterling et al., 2005).
B. Whiplash Disability Questionnaire [WDQ]
The WDQ was designed to assess the impact of whiplash injury on patient symptoms and
lifestyle. It uses 13 items that measure disability post whiplash injury (Pinfold et al., 2004).
WDQ covers current levels of pain, personal care, role performance (work/study/home
duties), mobility (driving / public transport), sleep disturbances, tiredness, social and leisure
(sporting and non-sporting) activity, emotional (sadness/depression, anger, anxiety) and
concentration impairments. The WDQ was developed following observed limitations of the
NDI and Northwick Park Neck Pain Questionnaire relating to social and emotional issues
reported in WAD (Leak et al., 1994; Hoving et al., 2003). The WDQ total score is 130, with
higher scores indicating a higher level of disability. A minimum detectable change in score
of 15 is regarded as clinically important (Willis et al., 2004). The WDQ has excellent content
and construct validity (Niere, 2006), demonstrated short term [24 hour] reliability ICC =

159
0.96 and medium term [one month] reliability ICC = 0.93 in 63 WAD patients (Willis et al.,
2004). It also demonstrated excellent internal consistency (Cronbach’s alpha = 0.96); sound
factor structure; no substantial floor or ceiling effects, and excellent response rates in 101
whiplash patients (Pinfold et al., 2004).
C. Self-report version of Leeds Assessment of Neuropathic Symptoms and Signs pain scale
[S-LANSS]
The LANSS pain scale is a 7-item (5 symptom items - patient reported; and 2 clinical
examinations – clinician reported) bedside tool that was developed and validated to
discriminate pain underpinned by neurogenic and nociceptive mechanisms (Bennett, 2001).
Screening tools such as LANNS assist separating patients into categories of diagnostic
certainty (Rasmussen et al., 2004a). The original LANSS was developed from a sample of
60 patients presenting with chronic nociceptive or neuropathic pain and further validated in a
sample of 40 patients presenting with the same pain features. Comparing results obtained
from the LANNS and clinical assessment, the LANSS correctly identified 82% of patients,
demonstrating 85% sensitivity and 80% specificity (Bennett, 2001). LANNS Cut-off score >
12 points yielded a positive predictive value of 81% and a negative predictive value of 84%
[16/19] (Bennett, 2001). However, a limitation of the original LANNS was its need for
clinical examination component, including the use of pin prick, both of which are
impracticable in a non-clinical setting (Backonja 2002; Bennett et al., 2005). A self-report
version [S-LANNS] of the LANNS was subsequently developed to achieve the aim of the
LANSS without the need for clinical examination (Bennett, 2005). A comparison of 200
chronic pain patients self-completed SLANNS against a researcher administered S-LANSS

160
[using interview format] found that the SLANNs identified 75% and 80% of pain types when
compared to a clinical diagnosis (Bennett et al., 2005). Sensitivity for the S-LANSS was
74% to 78%. The LANSS and S-LANNS have been tested in fibromyalgia (Martínez-Lavin
et al., 2003); low back pain (Kaki et al., 2005); and WAD (Sterling, 2008).
8.2 Aim
The aim of this study was to evaluate the capacity of sensory tests that evaluate hyperalgesia,
hypersensitivity and hypoaesthesia to discriminate CWAD II from healthy individuals using
ULNT and QST.
8.3 Methodology
8.3.1 Design
A cross-sectional design was used to discriminate between two groups of participants
(CWAD II and healthy) using QST pain [cold and pressure] and detection [vibration]
thresholds, and ULNT induced responses [pain change, nerve movement and elbow
extension ROM]. A total of 11 sensory tests were investigated.
8.3.2 Participants
Ninety nine individuals showed interest but 54 actually participated in the study. A total of
45 (n=4 illness, n=10 work commitment, n=31 no reason given) did not join the study,
coinciding with the treacherous weather condition experienced in UK at the time of data
collection and 9 were excluded at the screening stage for not satisfying the eligibility criteria.
There were 22 CWAD II participants (19 female; mean (SD) age 26(7) years) and 32 healthy

161
participants (24 females, mean (SD) age 24(9) years). A sample size calculation of n=110
was planned, as 10 participants per outcome variable (sensory test) have been recommended
for logistic regression analysis (Tabachnick and Fidell, 2001).
8.3.3 Inclusion and exclusion criteria
8.3.4 Ethical approval
8.3.5 Recruitment strategy
The procedures developed for previous studies, reported in Chapters 3, 6 and 7 were
followed for Section 8.3.3 – 8.3.5
8.3.6 Researchers involved in data collection
Data were collected by two musculoskeletal physiotherapists (designated as researchers 1
and 2), with ≥ 10 years post-qualification clinical experience and studying at postgraduate
level at the time of data collection. Both physiotherapists were trained on use of the QST and
ULNT measures. A third physiotherapist, researcher 3, conducted pre-test screening to
ensure that participants fulfilled eligibility criteria for the study, and identified the most
symptomatic side for testing in CWAD II participants.
8.3.7 Testing protocol
A. Health questionnaire and neurological examination
The same procedures as previous studies were used. In addition, patient reported
questionnaires (NDI, WDQ, IES, SLANNS) were completed by CWAD II participants.
B. Participants position, testing sites and equipments

162
The participant’s position during sensory testing was supine lying for the hand and leg and
prone lying for the neck. Neck measurements were taken over the articular pillars of C5/6.
This position corresponds to the nerve root for the median nerve and was relevant to the
ULNT variant adopted for the study. Hand measurements taken over the thenar eminence
corresponded to the median nerve distribution, supporting the study focus to ULNT 1. The
three test sites have been used in previous CWAD sensory studies (Sterling et al., 2003;
2004, 2009). Testing over the Tibialis Anterior muscle was to demonstrate presence of
sensory impairments not directly due to the original injury but potentially indicating altered
central pain processing mechanisms (Sterling et al., 2003; 2004, 2009; Gerdle et al., 2008).
The three sites were tested in a randomised order across participants, based on the six
possible permutations of testing three sites. The most symptomatic side was tested for
CWAD II participants (Greening et al., 2005), and the dominant side for those presenting
with a bilateral distribution of symptoms. The dominant side was tested for healthy
participants because no inter-side differences to QST have been found by Rolke et al. (2006).
A clear explanation of testing procedures and sites were given to each participant by
researcher 3 before testing began. Testing was carried out within a quiet room, void of
distractions. Researchers 1 and 2 were blind to participants’ group allocation and followed
standardised protocols and scripts of instructions for each participant. Triplicate recordings
were taken for each sensory measure over the test areas (Chien et al., 2008). A pictorial view
of QST and ULNT 1 testing is presented as Figure 8.2 – 8.6.
Researcher 1 conducted ultrasound scanning and the ULNT 1 test, while researcher 2
performed all the QST testing. The participants’ starting position for the ULNT 1test was

163
supine lying, shoulder fixed to prevent elevation, 900 degrees shoulder abduction, shoulder
lateral rotation, forearm supination, wrist and finger extension, and 900 elbow flexion
(Shacklock, 2005). During the ULNT 1 test, the elbow joint was moved from 900 flexion into
extension (Szabo et al., 1994; Shacklock, 1995; Byl et al., 2002; Dilley et al., 2003;
Coppieters et al., 2006; Nee and Butler, 2006). As the elbow was moved, median nerve LM
data through the DUI and Brachialis muscle activity through the EMG were obtained
simultaneously. The elbow movement during the ULNT 1 test was stopped either at the
participant’s limit of pain [P2] or end of available ROM [R2] (Shacklock 2005; Nee and
Butler, 2006). Elbow ROM was measured to P2 or R2 by universal goniometer (Jaberzadeh et
al., 2001) and pain levels pre- and post- test were recorded by the participants on a VAS
scale [0 to 100]. At the end of testing, the SLANSS, WDQ, NDI and IES questionnaires
were completed by CWAD II participants. The QST and DUI equipments and their
measurement properties were discussed in Chapter 2 of the thesis. A pictorial view of QST
and ULNT 1 testing is presented as Figure 8.2 – 8.6.

164
(A) Equipment
(B) Thermotest
(C) Pressure Algometer
(D) Vibratimer and tuning fork
Figure 8.2: Equipment Setup for Sensory Discrimination Study

165
(A) CPT testing over the neck
(B) CPT testing over the thenar
(C) CPT testing over the Tibialis anterior muscle
Figure 8.3: CPT testing using the thermotest’s thermode over 3 sites

166
(A) PPT testing over the neck
(B) PPT testing over the thenar
(C) PPT testing over the Tibialis anterior muscle
Figure 8.4: PPT testing using the algometer over 3 sites

167
(A) Vibratimer and Tuning fork
(B) VDT testing over the neck
(C) VDT testing over the thenar eminence
(D) VDT testing over the Tibialis anterior muscle
Figure 8.5: VDT testing using the tuning fork over 3 sites

168
(A) ULNT 1 arm starting position
ULNT 1 test with simultaneous DUI median nerve LM image capture and
EMG Brachialis muscle activity recording
(B) ULNT 1 arm ending position to P1 or P2
(C) Measurement of elbow extension ROM at the end of ULNT 1 test using a universal goniometer
Figure 8.6: ULNT 1 testing

169
Data analysis
8.4.1 Descriptive statistics
All analyses were conducted using Excel (version 2010) and SPSS (versions 19). Participant
characteristics were summarised using counts and percentages, means and standard
deviations, medians, or minimum and maximum values, as appropriate. Symptom profiles of
participants in the CWAD II group were summarised using reported cut-offs on NDI
(Vernon 1996; Sterling et al., 2003), WDQ (Pinfold et al., 2004), IES (Kongstd et al., 2007)
and SLANSS (Bennett, 2001).
8.4.2 Factor analysis
The literature review (Chapter 2) suggests associations between several of the sensory
outcome measures. Exploratory factor analysis [EFA] was used to pull together sensory
outcome measures that correlate highly to form a new relatively independent variable called
a ‘factor’ (Field, 2000). EFA involved a series of steps: (1) estimate or extract the factors (2)
decide how many factors to retain (3) rotate factors to an interpretable orientation and (4)
obtain individual factor scores (Lorenzo-seva and Ferrando, 2006). Factors were first
extracted using principal component analysis (Osborne and Costello, 2009). This method is
predominantly reported in behavioural sciences research and is comparable to other methods
for factor extraction (Velicer, 1988; Velicer and Jackson, 1990). Identified factors that were
associated with eigen values ≥1.0 were considered important using Kaiser’s rule (Kaiser
1960). This value is widely accepted to represent a substantial amount of variation explained
by extracted factors (Osborne and Costello, 2009). A scree plot or graph of the eigen values,
show a natural bend or break point in the curve (Eigen = 1), used to make decisions about

170
factors that are retained (Osborne and Costello, 2009). Factors above the bend were retained
and then rotated using varimax (method to align factors), so that loadings [correlation of the
original measure with a factor] of sensory outcome measures are maximised to the factors to
which they relate most (Osborne and Costello, 2009). Reliability and interpretation of factors
is hypothesised to depend largely on the weightings of the loadings as well as the sample size
(Field, 2000). However, clear cut-offs for loadings in relation to sample size are arbitrary and
inconclusive (Osborne and Costello, 2009). Stevens (1992) recommended that only factor
loadings with an absolute value ≥ 0.4 [explaining 16% of the variance] should be interpreted.
Guadagnoli and Velicer (1988) however suggested that factors with four or more loadings
greater than 0.6 are reliable, regardless of the sample size. Field (2000) recommended
loading cut-off ≥ 0.5 for a sample size (n=54) was adopted to retain and interpret generated
factors in the analysis. Retained factors yielded scores for each participant [factor scores]
that was entered into the logistic regression analysis to assess sensory discrimination of
CWAD II from a healthy group.
8.4.3 Logistic Regression
A logistic regression was conducted to predict “participant group” using factors scores that
were generated from the factor analysis (Rietveld & Van Hout 1993; Portney and Watkins
2000). Logistic regression was developed to allow prediction of dichotomous category
membership [dependent variables of presence or absence of CWAD] from continuous
independent variables [sensory outcome measures]. This method has been used in studies
that have investigated sensory impairment discrimination of CWAD II from healthy
participants (Scott et al., 2005; Elliot et al., 2008; Chien and Sterling 2010). Peduzzi et al

171
(1996) and Steyerberg et al (2001) recommended a sample size of at least ten events per
variable. A criterion probability cut-off value of 0.5 was set, above which a participant factor
score was assigned to the CWAD II group (Kinnear and Gray 2004). Factor scores were first
entered into the regression using forward stepwise (likelihood ratio) and then backward
stepwise (LR) methods and the results were compared for plausible differences in variance
accounted for by the model (Kinnear and Gray 2004). To assist interpretation of the logistic
regression analysis, statistics of (a) Barletts test of sphericity and Kaisers measure of
sampling adequacy [indicative of reliability of correlations] (b) β, Wald and p-value wer
used to assess statistical significance of each factor at a significance level of 5% (Tabachnick
and Fidell 2001).
8.5 Results
8.5.1 Description of physical characteristics of CWAD II and healthy individuals
Data was analysed for all 22 CWAD II participants; summary statistics are presented in
Table 8.1. The mean (SD) age was 25.5 (7.4) years. The majority of whiplash injuries
occurred from road traffic accidents (n=21), with duration of injury ranging from 9 months
to 14 years. Fourteen participants had sought treatment comprising examination by a
General Practitioner or Accident and Emergency medical officer, 9 had attended
physiotherapy, and 6 have never sought treatment since their injury. Reported distribution of
pain in the CWAD II group included localised pain being described over the neck [n=14],
neck and shoulders [n=6], or neck and hands [n=2]. None described symptoms over remote
areas, such as the legs. There were n=32 healthy individuals, 20 females aged (SD) = 20 (62)
years.

172
Table 8.1: Characteristics of study participants (n=54), by Group
CWAD II group
(n =22) Healthy group
(n = 32)
Demographics
Gender [Female]: n (%) 19 (86) 20 (62)
Age [years]: mean (SD) 25.5 (7.4) 21.4 (6.0)
Clinical
Duration of Injury [years]: (Minm to Maxm) 0.75 to 14 -
Distribution of symptoms: n (%) -
Neck 12 (54)
Neck and shoulder 6 (27) -
Hands 2 ( 9) -
Leg 0 (0) -
Accessed Treatment before post injury: n (%) -
GP / A&E 14 (64)
Physiotherapy 9 (41) -
Chiropractor 2 (9) -
Physiotherapy and Chiropractor 2 (9) -
Cervical Collar 1 (5) -
None 6 (27) -
Symptoms on dominant side: n (%) 15 (68) -
Social
Compensation / claims: n (%) 9 (41) -
Off work / Studying: n (%) 0 (0) -
Footnote: A&E = Accident and Emergency; GP = General Practitioner; Maxm = Maximum; Minm = Minimum; SD = Standard deviation
8.5.2 Pain, disability and psychological characteristics of CWAD II participants
The CWAD II participants had scores ranging from 0 to 46 (median = 21) on NDI; 0 to 83
(median = 16) on WDQ; 0 to 14 (median = 3) on SLANSS; 0 to 60 (median = 8) on IES.

173
Using cut-offs described in Section 8.1 – 8.2, six (27%) of participants had moderate or
severe pain or disability (NDI or WDQ); two (9%) reported moderate or severe stress
reactions (IES) and one (5%) showed signs of neurogenic pain (SLANSS) [Table 8.2]. This
data indicated that a significant proportion of the CWAD II participants reported mild levels
of pain, disability and psychological characteristics. This was consistent with none in the
CWAD II group accessing treatment at the time of data collection.
Table 8.2: Symptom profile of CWAD II participants (n=22)
Symptom Profile
CWAD II
group
n (%)
Supporting Reference
Features of pain and disability
NDI ≥ 30 / 100 [Moderate/Severe] 6 (27) (Vernon 1996; Sterling et al., 2003)
WDQ ≥ 30 / 130 [Moderate/Severe] 6 (27) (Pinfold et al., 2004)
Features of post-traumatic stress
IES ≥ 26 /80 [Moderate/Severe stress reactions] 2 (9) (Kongstd et al., 2007)
Features of Neurogenic Pain
SLANNS ≥ 12 / 52 [Presence of neurogenic type pain]
1 (5) (Bennett 2001)
8.5.3 Factor analysis and logistic regression result
Mean values for CPT were marginally higher for participants in the CWAD II group, at all
three sites (Table 8.3). Mean values for PPT were higher at each site for healthy participants,
as were the standard deviations (Table 8.3). Small inter-group differences were observed in
mean VDT across the three sites between the groups of participants, for mean nerve
movement during ULNT and for mean change in pain during ULNT (Table 8.3).

174
Table 8.3: Sensory outcome variables, by Group Sensory Outcome Variable CWAD II group
Mean (SD) (n=22)
Healthy group
Mean (SD) (n=32)
CPT
Neck (0C) 17.37 (8.88) 14.05 (8.90)
Thenar (0C) 17.58 (6.87) 14.33 (7.74)
Tib. Anterior (0C) 14.75 (8.58) 11.92 (8.98)
PPT
Neck (N) 19.84 (8.59) 24.11 (11.07)
Thenar (N) 35.25 (16.87) 45.50 (21.83)
Tib. Anterior (N) 51.42 (24.23) 63.29 (33.36)
VDT
Neck (s) 11.09 (3.95) 12.06 (5.40)
Thenar (s) 22.74 (8.78) 22.80 (7.29)
Tib. Anterior (s) 12.83 (7.04) 10.55 (3.82)
Nerve movement during ULNT (mm) 1.44 (0.76) 1.72 (0.71)
Change in Pain during ULNT (VAS) 37.71 (36.76) 36.33 (21.97)
Footnote: SD = standard deviation; Tib. = Tibialis; ULNT = Upper limb neurodynamic test; VAS = Visual analogue scale
The factor analysis resulted in three factors associated with eigen values greater than 1.0
(Figure 8.3), that jointly accounted for 64% of the variation associated with the data from the
original 11 sensory outcome measures (Table 8.4). Using the highest loadings, from each of
the 11 outcome measures, against each factor (Table 8.5) led to labelling the three
components as Hyperalgesia (accounting for 35% of variation), Hypoesthesia (accounting
for 16% of variation) and Hypersensitivity (accounting for 13 of the variation) (Table 8.5)
based on previous reports in the CWAD literature (Scott et al., 2005; Elliot et al 2008; Chien
and Sterling, 2010).

175
None of the three sensory components were statistically significant in the logistic regression
(all p-values > .05 [Table 8.6]). On the basis of these data, group membership (CWAD II and
Healthy participants) could not be predicted from these components. Overall, 60% (12 out
of 20) CWAD II participants were correctly identified and 81.5% (22 out of 27) healthy
participants (Table 8.7) using the best fit logistic regression model. The 3 generated factors
supported a sample of n=30 (10 events per variable) was adequate for the logistic regression
analysis (Tabachnick and Fidell 2004).
Figure 8.7\: Scree plot of Eigen values for factors generated from the factor analysis on 11 sensory outcome measures

176
Table 8.4: Factor Analysis on 11 Sensory Outcome Measures (n= 47): Un-rotated and Rotated loadings [Data corruption of some sensory measures affected n=7].
Un-rotated loadings Rotated loadings
Component Eigen
value
%
Variance
Cumulative %
Variance
Eigen
value
%
Variance
Cumulative
% Variance
1 4.2 38 38 3.8 35 35
2 1.6 14 52 1.7 16 52
3 1.3 12 64 1.4 13 64
4 0.95 9 73
5 0.7 7 79
6 0.7 6 86
7 0.6 5 91
8 0.4 4 94
9 0.3 2 96
10 0.2 2 99
11 0.2 1 100
Table 8.5: Interpreting the three main components; loadings against each sensory outcome in the rotated 3-factor model (n=47)
Sensory Outcome variable
Components from the factor
analysis Clinical Features
1 2 3
Cold Pain Threshold
Hyperalgesia
Neck -0.71
Thenar -0.80
Tib. Anterior -0.82
Pressure Pain Threshold
Neck 0.77
Thenar 0.85
Tib. Anterior 0.77
Vibration Detection Threshold
Neck 0.69
Hypoesthesia Thenar 0.72
Tib. Anterior 0.53
Nerve movement during ULNT
-0.69
Hypersensitivity Change in Pain during ULNT 0.65
Footnote: Tib. = Tibialis; ULNT = Upper limb neurodynamic test
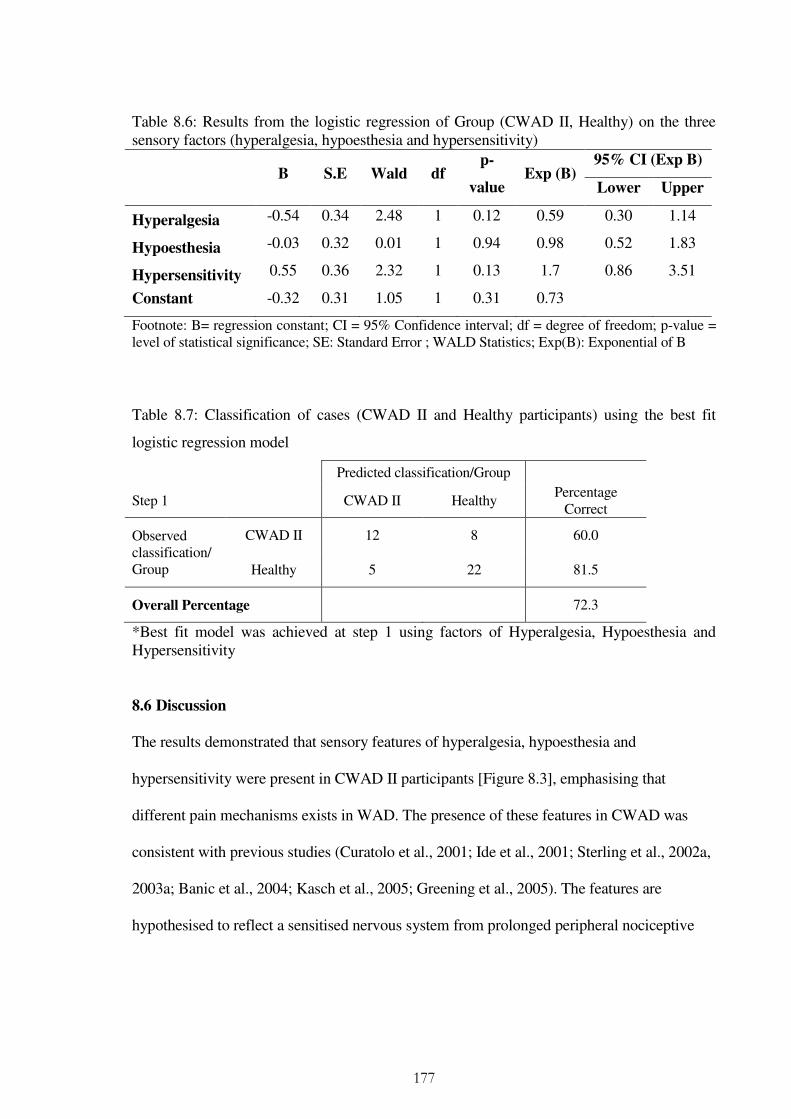
177
Table 8.6: Results from the logistic regression of Group (CWAD II, Healthy) on the three sensory factors (hyperalgesia, hypoesthesia and hypersensitivity)
B S.E Wald df p-
value Exp (B)
95% CI (Exp B)
Lower Upper
Hyperalgesia -0.54 0.34 2.48 1 0.12 0.59 0.30 1.14
Hypoesthesia -0.03 0.32 0.01 1 0.94 0.98 0.52 1.83
Hypersensitivity 0.55 0.36 2.32 1 0.13 1.7 0.86 3.51
Constant -0.32 0.31 1.05 1 0.31 0.73
Footnote: B= regression constant; CI = 95% Confidence interval; df = degree of freedom; p-value = level of statistical significance; SE: Standard Error ; WALD Statistics; Exp(B): Exponential of B
Table 8.7: Classification of cases (CWAD II and Healthy participants) using the best fit
logistic regression model
Predicted classification/Group
Step 1 CWAD II Healthy Percentage
Correct
Observed classification/ Group
CWAD II 12 8 60.0
Healthy 5 22 81.5
Overall Percentage 72.3
*Best fit model was achieved at step 1 using factors of Hyperalgesia, Hypoesthesia and Hypersensitivity
8.6 Discussion
The results demonstrated that sensory features of hyperalgesia, hypoesthesia and
hypersensitivity were present in CWAD II participants [Figure 8.3], emphasising that
different pain mechanisms exists in WAD. The presence of these features in CWAD was
consistent with previous studies (Curatolo et al., 2001; Ide et al., 2001; Sterling et al., 2002a,
2003a; Banic et al., 2004; Kasch et al., 2005; Greening et al., 2005). The features are
hypothesised to reflect a sensitised nervous system from prolonged peripheral nociceptive

178
[peripheral sensitisation] input, as well as, a disordered central nervous system pain-
processing mechanism [central sensitisation] (Curatolo et al., 2001; Sterling et al., 2003a,
2008, 2009; Banic et al., 2004; Kasch et al., 2005; Chien et al., 2009). Sensory
hypersensitivity, hypoaesthesia and hypersensitivity were observed at two sites for the
CWAD II participants in the neck (nerve root of C5/6) and hand (peripheral of C5/6) the
remote site of the Tibialis anterior muscle.
Some results however contrast with findings from previous WAD sensory discriminatory
studies (Scott et al., 2005; Elliot et al., 2008; Chien and Sterling 2010). Differences in the
symptom severity level of the study sample could have contributed to the contrasting
finding. Scott et al (2005) did not collect data relating to their study participants self report of
pain and disability or psychological impairment and therefore limits comparison of their
findings to the present study. On the other hand, Elliot et al (2008) and Chien and Sterling
(2010) recruited participants with pain and disability score NDI > 30 (moderate / severe]
(Vernon 1996; Sterling et al., 2003). This is in contrast to the significant proportion of the
present study participants [80%] (Figure 8.4) who reported NDI scores < 30 reflecting
recovered / low disability levels (Vernon 1996; Sterling et al., 2003). The previous studies
(Scott et al., 2005; Elliot et al., 2008; and Chien and Sterling, 2010) all recruited participants
from a Primary Care Trust, in contrast to the convenience sample recruited from within a
university community. These differences could have accounted for the low severity of the
CWAD II participants in this study, and in turn the non-discrimination between the study
groups. Similar findings of non-significant group differences, based on independent t-test
statistical analysis, between their CWAD presenting as recovered / low disability and healthy

179
individuals Sterling et al (2003, 2004). However, this present study did not investigate group
differences. It was unanticipated at the outset of the study that the majority of the recruited
participants will present as low severity subgroup.
This study additionally obtained data for pain and disability using the WDQ, a whiplash
specific self-reported questionnaire (WDQ), IES that is reflective of PTSD and the S-
LANNS that interpreted neuropathic type pain. These questionnaires assisted interpretation
of the symptom severity of the CWAD II participants beyond using only pain and disability
or psychological characteristics (Scott et al., 2005; Elliot et al., 2008; Chien and Sterling
2010). For example, the present study participants reported subclinical / mild levels of PTSD
as well as absence of signs reflective of neuropathic pain that is associated with low NDI and
WDQ scores and suggestive of low disability.
These findings could also explain the non-significant discrimination of measurements
between the two study groups. Sensory hyperalgesia, hypoaesthesia and hypersensitivity
discrimination of CWAD II is largely moderated by severity levels of pain, disability as well
as psychological impairments (Sterling, 2010), supported by previous reports that these
impairments co-exist with and contribute to modulate sensory manifestations in CWAD
(Rhudy and Meagher 2000; Sterling and Kenardy 2005; Sterling et al., 2008; Bossman et al.,
2011). The implication is that different mechanisms exists and interact in CWAD II and their
consideration during assessment and management of the condition in a clinical setting is
warranted.

180
Previous CWAD discriminative studies (Scott et al., 2005; Elliot et al., 2008; Chien and
Sterling 2010) did not include ULNT 1amongst their sensory tests. The present study
included the ULNT 1 but did not show benefit of the test for CWAD II participants reporting
low pain, disability, as well as mild psychological impairment. No conclusion can be drawn
regarding the use of ULNT 1 test for CWAD II patients presenting with moderate to severe
levels of pain, disability and psychological factors, and this needs to be investigated through
future sensory studies.
8.7 Chapter conclusions
The results demonstrated that although sensory features of hyperalgesia, hypoesthesia and
hypersensitivity are present in CWAD II, these sensory impairments lack the capacity to
discriminate between low severity CWAD II participants and healthy individuals. It also
demonstrated that sensory tests used in the study lack the capacity to discriminate a low
severity CWAD II subgroup. Further evaluation of CWAD II patients presenting with higher
levels of pain and disability as well psychological factors is warranted using both QST and
ULNT. In addition, further evaluation of discriminative capacity of additional sensory tests
for the low severity group is warranted, as they emerge in the evolving body of knowledge of
CWAD II. Furthermore, a range of other impairments, pain, disability and psychological
factors exists in a low severity CWAD II subgroup that merit consideration during
assessment of patients, and this approach fits well with the widely advocated
biopsychosocial model.

181
Chapter 9
Discussion
9.1 Background to the study (Chapters 1 and 2 of thesis)
CWAD is an example of a chronic pain condition that can affect an individual’s quality of
life and earning (Breivik et al., 2006, 2008).The cost of managing the condition can be
considerable, with lost hours due to work absences being significant (Spitzer et al., 1995;
Provinciali et al., 1999). The incidence and impact of WAD is increasing (Provinciali et al.,
1996; Borchgrevink et al., 1998; Rosenfeld et al., 2000, 2003), largely due to poor
understanding of the mechanisms responsible for chronicity of the condition (Panjabi et al.,
1998; Jull et al., 2007). Consequently, current management methods provide only marginal
benefit for reducing the incidence of CWAD (Jull et al., 2007; Stewart et al., 2007). Research
over the last decade has focused on impairments in CWAD to assist understanding of the
predominant mechanisms in the condition to guide assessment and management decisions
(Sterling et al., 2011).
WAD has been described as a complex and heterogeneous condition, because of the range of
impairments presenting in the condition (Sterling 2009). Impairments include motor
[movement loss, altered muscle recruitment patterns] (Heikkila & Wenngren 1998;
Dall’Alba et al., 2001; Nederhand et al., 2002; Sterling et al., 2002, 2004; Jull et al., 2004),
sensory hypersensitivity and hypoaesthesia (Curatolo et al., 2001; Moog et al., 2001; Sterling
et al., 2003a, 2004, 2006, 2007, 2008; Raak & Wallin 2006, 2008; Chien et al., 2009) and
psychological factors (Williamson et al., 2008). Motor dysfunction of loss of cervical

182
movement, is not present in CWAD (Kasch et al., 2001), neither does it provide predictive
capacity of poor recovery post whiplash injury (Sterling et al., 2005). This is supported by
treatment targeting motor dysfunction yielding marginal effects on patients’ self reported
pain and disability levels (Jull et al., 2007; Stewart et al., 2007). Evidence suggests that
psychological factors are associated with reported levels of pain and disability (Rhudy and
Meagher 2000), although data from Wenzel et al (2002) only found the association in
participants reporting persistent pain and disability, and not in those who recovered. This
suggests that symptom persistence could be the overriding trigger for psychological factors
(Sterling 2010). Evidence therefore suggests that other mechanisms are responsible for the
persistence of symptoms in WAD.
Recent evidence suggests that some of the sensory impairments indicate an underlying
augmented or disinhibited nervous system (Sterling 2009), a finding that is gaining support
as a plausible trigger for symptom persistence in CWAD (Sterling, 2010). Sensory
impairments are not, however, peculiar to CWAD, as they have also been identified in
chronic diffuse upper limb pain (Jensen et al., 2007b), patellofemoral pain (Tucker et al.,
2007), fibromyalgia, tension-type headache and migraine (Yunus, 2007). An important
finding across recent WAD studies (Scott et al., 2005; Elliott et al., 2008; Chien and Sterling
2010) is that sensory hypersensitivity and hypoaesthesia can discriminate CWAD from INP.
The findings are however inconclusive, due to conflicting results across the sensory
discriminative studies (Chapters 2 and 8). In addition, all the sensory discriminative studies
omitted the ULNT, a sensory test commonly used in clinical practice. Also, supportive
evidence for using ULNT to assess CWAD is implied from other samples but its ability to

183
discriminate between CWAD and other musculoskeletal neck pain conditions has not been
verified. This finding plausibly underpins divergent opinions regarding clinical usefulness of
ULNT in chronic pain conditions as CWAD (Greening et al., 2008). Evaluation of sensory
impairments to discriminate CWAD using both QST and ULNT was warranted.
However, evidence in regards of validity of ULNT is incomplete due to lack of nerve
movement data; an important theorized construct for the test (Coppieters et al., 2009).
Further evaluation of the validity of ULNT in CWAD was therefore required. With recent
advance in medical imaging, in-vivo nerve movement data can be obtained using DUI in
order to validate the constructs underlying the test. However, confidence in DUI estimate of
nerve is weak due to conflicting estimates of nerve movement within the same [NSAP] and
symptom-related [WAD / NSAP] patient samples (Greening et al., 2001; Greening et al.,
2005; Erel et al., 2003; Hough et al., 2007; Greening et al., 2005; Dilley et al., 2007)
necessitating a consideration of the evidence for reliability and validity of DUI.
Reliability studies for DUI are also sparse (Hough et al., 2000; Greening et al., 2001; Dilley
et al., 2001; Erel et al., 2003; Ellis et al., 2008; Coppieters et al., 2009), particularly in a
patient sample (Greening et al., 2001; Erel et al., 2003). Findings from published studies are
largely inconclusive due to small study sizes and the use of inappropriate statistics.
Evaluation of inter-rater reliability of DUI in a CWAD II sample was therefore required first
as an important component of the thesis. Inter-rater reliability design provided a higher level
of evidence in comparison to intra-rater design (Haas 1991).
184
9.2 Inter-rater reliability of DUI for median and ulnar nerve movement in a CWAD II
population (Chapter 3)
This Chapter investigated inter-rater reliability of DUI measurements of median and ulnar
nerve transverse and LM in CWAD II using 3 raters. Fair inter-rater reliability [ICC=0.4]
(Coppieters et al., 2009) was returned for median nerve movement, indicating its potential
for further improvement. All TM of median as well as TM and LM for the ulnar nerve
returned poor [ICC<0.4] inter-rater reliability estimates (Coppieters et al., 2009). The results
were in contrast to high reliability reported for DUI (Hough et al., 2000; Dilley et al., 2001;
Greening et al., 2001; Erel et al., 2003; Ellis et al., 2008; Coppieters et al., 2009). Notably,
reliability estimates by Greening et al (2001) [median nerve TM in NSAP] and Erel et al
(2003) [median nerve LM in carpal tunnel syndrome] were directly comparable with the
results as both studies involved patient samples presenting with symptoms as CWAD
(Greening et al., 2005). However both studies were limited by their low sample size [n=4]
and use of within-participant standard deviation, rather than the ICC, the recommended
statistic for interpreting reliability (Bland and Altman 1996; Eliasziw et al., 1998). The
CWAD II inter-rater reliability had addressed methodological limitations of previous
reliability studies in other to improve internal validity and provide a higher quality of
evidence for DUI reliability. It also involved physiotherapists as raters, in order to
demonstrate external validity and clinical applicability of its findings.
Despite the rigour of the study methods (Chapter 3), results of low reliability for DUI
indicate that the technique is associated with potential sources of measurement error that
were not reported in the literature at the time of conducting the study. However, in recent
185
DUI publications, it is now acknowledged that such error does exist (Ellis et al., 2008; and
Korstanje et al., 2010). Measurement issues relating to DUI image capture e.g. slight
angulations and excessive pressure and movement of the DUI transducer have been
advanced as affecting quality of DUI images, and the quality issues compromise nerve
movement estimates as well as reliability of the technique (Kristjansson 2004; Ellis et al.,
2008). Although advanced, these issues have not been investigated in any DUI study to date.
Findings from the inter-rater reliability study corroborate such measurement issues during
DUI image capture. Although training was provided to the raters prior to DUI image capture,
it can be hypothesised from the results that rater experience influenced their dexterity in
providing high quality DUI images, and supports DUI being described as an operator –
dependent technique (Martinoli, 2000).
Apart from error arising from DUI image capture, Ellis et al (2008) also proposed that erro
can be introduced during DUI image analysis. Supportive evidence for this claim has been
provided for Doppler Ultrasound by Hough et al (2000) finding of a 2-5% over estimation of
nerve movement using the Doppler image analysis technique. The error was attributed to
inconsistent placement of image markers due to poor visual discrimination of nerve borders
(Ellis et al., 2008), though this is not supported by evidence. The effect of the error on nerve
estimates and reliability has not been verified. Other aspects of nerve image analysis such as
method used to track DUI transducer motion during image capture as well as size of the
frame interval have been hypothesised as contributing to poor reliability of DUI (Korstanje
et al., 2011). A further evaluation of the DUI image capture and image analysis component

186
was therefore warranted to investigate potential sources of error in the technique. This
informed re-analysis of DUI nerve images in Chapter 4 and 5.
9.3 Further analysis of nerve images focused to measurement error within DUI image
capture and image analysis (Chapter 4)
Limited evidence investigating measurement error within DUI image capture and image
analysis necessitated further re-analysis of DUI images. The methods adopted were: (a) 1
researcher analysed each of 3 physiotherapists acquired n=18 median nerve LM images to
investigate error arising from DUI image capture and (b) 3 researchers’ analysed n=18
median nerve LM images to investigate error arising from DUI image analysis. The re-
analysis method assisted interpretation of issues contributing to the poor reliability (Chapter
3). The analysis returned poor reliability for inter-image capture and inter-image analysis for
all transverse and ulnar nerve LM [ICC<0.4] (Coppieters et al., 2009), indicating that error
were associated with both DUI image capture and image analysis. In contrast, reliability for
inter-image capture and inter-image analysis for median nerve LM was fair [ICC=0.4] and
good [ICC = 0.7] respectively (Coppieters et al., 2009), indicating a potential for further
evaluation of its reliability. The analysis established presence of measurement error within
DUI technique of image capture and image analysis that more recent DUI studies
corroborate (Korstanje et al., 2010). The image capture issues are easily addressable through
involving an experienced DUI operator (Ellis et al., 2008). However, potential error within
DUI image analysis such as (a) inconsistent and inappropriate sizes and placement of image
markers (due to deformations and tracking local of artefact), (b) speckle tracking moving
out-of-plane, (c) precision of the correlation algorithm to process very small frame-to-frame

187
displacements (quantization error), (d) inappropriate frame intervals, and (e) consistency and
clarity of speckle features (f) background tissue used to track transducer movement (Ellis et
al., 2008; Korstanje et al., 2009, 2010, Chapter 3) merit attention as strategies suggested to
address the sources of error, including use of (a) nerve image analysis template [Figure 3.3],
(b) larger joint motion, and involving an (c) experienced DUI operator have not addressed
error arising from stationery subcutaneous or background tissue used to track transducer
movement during LM image analysis. This component of nerve image analysis is important
considering its potential to inflate or underestimate LM, when subtracted from nerve
estimates, a hypothesis that warrant investigating.
Interestingly, bone is accepted and used, despite absence of evidence to support the practice.
The use of superficial fascia is supported within the DUI literature, although the evidence is
limited by its small sample size [n=4] (Dilley et al., 2001). Conflicting nerve results, existing
limited evidence for superficial fascia, and no evidence for bone tissue warranted a further
re-analysis of nerve images to assess background tissue [bone and superficial fascia] that
provide reliable estimates of nerve movement (Sim and Wright 2000) as well as construct
validity of using both tissue to track a fixed DUI transducer (Dilley et al., 2001).
9.4 Further nerve image analysis focused to bone and superficial fascia as DUI
background tissue (Chapter 5)
Chapter 5 investigated the effects of different background tissue [bone and superficial facia
used as fixed reference to track DUI transducer motion] on reliability of estimates of median
nerve movement as well as construct validity of using both tissues to track a fixed DUI
188
transducer. The reliability component was evaluated using inter-image capture reliability
where 1 researcher analysed each of 3 physiotherapists acquired n=18 median nerve LM,
comparing bone and superficial fascia as background tissue. The construct validity
component was assessed by frame by frame analysis of median nerve images to compare
computed motion of DUI motion from bone and superficial fascia against a fixed DUI
transducer [motion = 0.0mm], where 1 physiotherapist analysed 22 median nerve LM
images. Results for the inter-image capture reliability component showed that superficial
fascia demonstrated good reliability [ICC2,1 = 0.7; 95% CI = 0.4 to 0.84] and higher nerve
movement estimates [0.9mm, SEM = 0.37mm] in contrast with fair reliability [ICC2,1 = 0.4;
95% CI = 0.15 to 0.71] and lower nerve movement estimate for bone [0.72mm, SEM =
0.35mm]. Unlike Dilley et al (2001) that investigated superficial fascia, the present study if
the first to compare reliability of estimates of nerve movement using bone and superficial
fascia as background tissue. It is also the first time superficial fascia is reported as
background tissue in a DUI reliability study. For the construct validity component, frame-by-
frame analysis showed that superficial fascia returned zero cumulative movement in
comparison to bone (Figure 5.2). The finding agrees with, but provides higher quality
supportive evidence for superficial fascia than Dilley et al (2001).
Summary of further analysis of data (Chapter 4 and 5)
Chapters 4 and 5 evaluated sources of error within DUI image capture and image analysis
components to inform strategies to address the identified error, so as to improve reliability of
DUI technique, particularly for median nerve LM in CWAD II. Strategies such as single
operator design (Ellis et al., 2008), use of large joint motion (Dilley et al., 2001; Korstanje et

189
al., 2010), use of image analysis template (Chapter 3), as well as using superficial fascia as
comparative background tissue have been hypothesised to improve reliability of the
technique. However, the effect of the strategies to improve reliability estimates of DUI has
not been investigated. This informed design of an intra-rater reliability study to reflect the
strategies (Chapter 6).
9.5 Intra-rater reliability of dynamic ultrasound imaging method of computing median
nerve movement in CWAD II (Chapter 6)
Chapter 6 evaluated intra-rater reliability of DUI estimates of median nerve LM obtained at
the mid-forearm during elbow extension in CWAD II. The results showed excellent intra-
rater reliability [ICC=0.8; 95% CI = 0.6 to 0.9] (Coppieters et al., 2009). The ICC was
associated with low error and variability [nerve movement = 2.60mm; SEM = 0.86; CV =
7%] (Reed et al., 2002; Tighe et al., 2010). This is the first study to report DUI reliability in
CWAD II and the results provide a higher quality of DUI evidence that relate to both
components of image capture and image analysis. This in contrast to Coppieters et al (2009)
report of high inter-image capture reliability for median nerve [n=10]. Their small sample
size fell below that recommended [n=13] by Eliasziw et al (1998). This study’s intra-rater
reliability sample size [n=22] and focus to physiotherapists and CWAD participants
increases it’s internal and external validity and therefore increases confidence in the study’s
conclusions. The evidence supported the use of DUI to estimate median nerve LM during
elbow extension in CWAD II, and provided LM data to validate the ULNT. This informed
the use of DUI to validate constructs underpinning the ULNT 1 test.

190
9.6 Construct validity of upper limb neurodynamic test 1 in CWAD II (Chapter 7)
The evidence to support theorised constructs that underpin the ULNT is sparse in humans
and limited because in-vivo nerve movement data, an important construct underpinning the
test has not been investigated (Greening et al., 2005; Shacklock 2005; Nee and Butler 2006).
Chapter 7 investigated validity of theorised constructs underpinning ULNT 1 by evaluating
association between nerve movement, elbow extension ROM, Brachialis muscle activity and
pain response during the test. The results showed a statistically significant, strong positive
association between elbow extension ROM and nerve movement (r=0.6) (Cohen 1998), and
for pain score and nerve movement (r=0.7) (Cohen 1998). This is consistent with previous
ULNT 1 cross sectional studies in CWAD that found elevated levels of pain perception to be
associated with decreased elbow ROM (Sterling et al., 2002); and reduced median nerve LM
(Greening et al., 2005). The findings are also consistent with previous cadaver and human
ULNT validity studies (Kleinrensink et al., 1994, 1995, 2000; Shacklock 1996; Wright et al.,
1996; Lewis et al., 1998; Daborn et al., 2000; Coppieters et al., 2001; Jaberzadeh et al., 2001;
Byl et al., 2002; Coppieters and Butler 2008), although this validity study investigated nerve
movement alongside other constructs that was not investigated in previous studies. The
results support clinician’s use of measures of pain perception and elbow ROM to interpret
the test (Shacklock 2005). The results also showed, for the first time, that DUI nerve
movement data can add to constructs used to interpret ULNT 1 test.
The mechanism underpinning response of pain and decreased elbow extension ROM during
the application of ULNT 1 is suggested to occur following altered nerve mobility and
mechanical irritation due to compressive, tensile, friction or vibration forces acting near

191
anatomically narrow tissue spaces through which the nerve passes (Takahashi et al., 2003;
Murata et al., 2005; Shacklock, 2005). It is proposed that the forces compromise intraneural
circulation and axoplasmic flow, leading to inflammatory response and sensitivity in dorsal
root ganglion and nerve trunks to mechanical stimuli (Hall and Elvey 1997; Kobayashi et al.,
2000; Parke and Whalen 2002; Watkins and Maier 2004). The injured nerve segment and
DRG may develop into abnormal impulse generating sites producing symptoms of increased
pain and signs of mechanosensitivity when stress is applied to it (Devor and Seltzer 1999).
This could explain association between pain, median nerve movement and elbow extension
ROM in the ULNT construct validity study.
There was a non-significant weak, positive association between brachialis muscle activity
and measures of pain (r=0.1), median nerve LM (r=0.2), and elbow extension ROM (r=0.1)
(Cohen 1998). This contrast previous studies that have showed association between
increased motor response and elevated levels of pain (Jaberzadeh et al., 2001, 2005), and
decreased elbow ROM (Wright et al., 1994; Hall and Quintner 1996; Balster and Jull 1997;
Elvey 1997; Hall and Elvey 1997; Jaberzadeh et al., 2001, 2005). The evidence regarding
flexor muscle activity during ULNT is inconclusive. Whereas Jaberzadeh et al (2001, 2005)
and Van der Heide et al (2001) have showed association between pain, elbow ROM and
muscle activity during ULNT in healthy participants, work by Balster and Jull (1997) for
ULNT and Boyd et al (2009) using the straight leg raise testing, both in healthy participants,
have found no association between the constructs of muscle activity and elevated levels of
pain.

192
Jaberzadeh et al (2001) found a positive association between pain and passive elbow
resistive torque of shoulder and arm muscles at periods of pain onset and pain limit in 10
healthy. The authors also found in 26 healthy, positive association between elbow ROM and
elbow flexor resistive torque of 10 shoulder and arm muscles at movement onset, pain onset
and pain limit (Jaberzadeh et al., 2005). Van der Heide et al (2001) reported similar
association between onset of pain and muscle activity for ULNT in healthy participants.
Differences of study sample and methods could be responsible for the conflicting findings.
Whereas Jaberzadeh et al (2001) involved healthy participants, the present construct validity
study involved a patient sample in other to reflect patient sample that the test is used for
(Shacklock 2005). The method also ensures direct application of findings to clinical practice.
Additionally, muscle activation in Jaberzadeh et al (2005) was captured at 3 time points
(movement onset, pain onset, and pain limit), whereas the present study captured brachialis
muscle activity through the range of elbow extension. As discussed in Chapter 7, this method
was not adopted due to limitations of DUI image analysis to synchronise with these points.
Brachialis muscle activity was therefore analysed from movement onset through to pain or
movement limit [P2 or R2], consistent with the nerve movement data analysis. The ULNT
construct validity findings of no association between muscle activity and pain level at pain
onset and pain limit agree with previous ULNT study (Balster and Jull 1997). This study
conclusion agree with findings from the present.
Overall, this study supports previous work regarding validity of ULNT. However, nerve
movement data included in the present study, particularly in a symptomatic population,

193
CWAD II has added to existing ULNT validity evidence. In addition, this is the first ULNT
validity study to be conducted in CWAD, using physiotherapists. This increases external
validity of the study, and increases confidence in translating the findings into a clinical
setting. Overall, this study has demonstrated that 3 [pain perception, elbow ROM, nerve
movement] out of the 4 [flexor muscle activity] constructs that underpin ULNT demonstrate
construct validity. The merits for including the ULNT amongst sensory test to be used for
sensory discrimination of CWAD II participants have been argued (Chapter 2). As construct
validity of ULNT has now been established in CWAD II (Chapter 7), its inclusion based on
criteria of measurement properties is justified. This informed design of a study to evaluate
sensory discrimination of CWAD II using QST and ULNT (Chapter 8).
9.7 Sensory hyperalgesia, hypersensitivity and hypoaesthesia discrimination of CWAD
II from healthy individuals (Chapter 8)
The evidence for sensory impairments that discriminate CWAD using QST is inconsistent
and weak due to a focus to the female gender and use of a limited range of sensory tests that
excludes the ULNT. This sensory discrimination study evaluated capacity of sensory
impairments of hyperalgesia, hypersensitivity and hypoaesthesia to discriminate CWAD II
participants from healthy individuals using ULNT 1 and QST. The results showed that
sensory features of hyperalgesia, hypoesthesia and hypersensitivity were present in CWAD
II, emphasising that different mechanism operate in WAD; and supports previous
descriptions of WAD as a heterogeneous condition. The presence of these features in CWAD
II is consistent with previous studies (Curatolo et al., 2001; Ide et al., 2001; Sterling et al.,
2002, 2003a; Banic et al., 2004; Kasch et al., 2005; Greening et al., 2005). These features are

194
suggested to be indicative of a disordered and sensitised nervous system as a result of
prolonged peripheral nociceptive [peripheral sensitisation] input as well as altered central
nervous system pain-processing mechanism [central sensitisation] (Curatolo et al., 2001;
Sterling et al., 2003a, 2008, 2009; Banic et al., 2004; Kasch et al., 2005; Chien et al., 2009).
In this study, sensory hypersensitivity, hypoaesthesia and hypersensitivity were found over
local areas of the neck (nerve root of C5/6), hand (peripheral input of C5/6) and leg (remote
area) reflecting involvement of peripheral and central mechanisms (Coderre et al., 1993; Li
et al., 1999; Kidd and Urban 2001; Graven-Nielsen and Arendt-Nielsen 2002; Staud and
Smitherman 2002; Carpenter and Dickenson 2005).
The study findings of non-discrimination of CWAD II, however contrast with previous
reports indicating that sensory impairments discriminate CWAD from other neck pain and
healthy individuals (Scott et al., 2005; Elliot et al., 2008; Chien and Sterling 2010).
Differences in levels of symptom severity between the present study and previous
discrimination studies might have contributed to the contrasting findings. Scott et al (2005)
for example, did not collect data relating to their study participants pain and disability or
psychological factors levels, unlike the present study. The lack of data in this regard for their
study sample limits comparison of participants’ symptom profile as well as findings across
the 2 studies. Data from Elliot et al (2008) and Chien and Sterling (2010) showed that their
participants reported pain and disability scores of NDI > 30 reflecting moderate / severe
levels of disability (Vernon 1996; Sterling et al., 2003). In comparison, 90% participants in
this study reported NDI scores < 30 reflecting recovered / low disability levels (Vernon
1996; Sterling et al., 2003). Additionally, study participants reported in (Scott et al., 2005;

195
Elliot et al., 2008; Chien and Sterling, 2010) was recruited from a Primary Care Trust, unlike
the present study that recruited a convenience sample within a university community. This
method of recruitment could have accounted for the low severity symptom profile reported
in the present study. The existing sensory discrimination evidence (Scott et al., 2005; Elliot
et al., 2008; Chien and Sterling 2009) showed that local and generalised hypersensitivity and
hypoaesthesia to mechanical stimuli, and hyperalgesia to mechanical and cold stimuli
discriminated CWAD presenting with persistent moderate/severe symptoms [NDI ≥30/100].
Sensory discrimination of CWAD patients presenting with mild to moderate symptoms [NDI
= 10 to 28/100] has not been investigated or previously reported. Findings in the present
study have demonstrated that sensory impairments of hyperalgesia, hypersensitivity,
hypoaesthesia, although present in this low severity subgroup, lack the capacity to
discriminate CWAD II from healthy individuals. Similar findings in a recently published,
secondary data re-analysis (Verhagen et al., 2011) found that pain, functional limitation and
recovery were not discriminative of CWAD presenting with mild to moderate symptoms
[n=133] and other neck pain conditions [n=671]. Their conclusions query consideration of
the low severity CWAD subgroup as a distinct clinical cluster when accessing or managing
patients.
It is important to note that unlike previous studies (Scott et al., 2005; Elliot et al., 2008;
Chien and Sterling 2010), this study captured additional data of pain and disability [WDQ],
PTSD that is reflective of post traumatic stress [IES] and the S-LANNS that interprets
neuropathic type pain. These questionnaires provided the additional advantage of assisting
interpretation of the results by providing further information on the biopsychosocial

196
components of the CWAD II participants, illustrating the importance of these impairments
for understanding CWAD and the significance of the biopsychosocial model adopted by the
WHO ICF (Bossman et al., 2011). The model recognises whiplash injury can cause minor
tissue damage that can lead to impairments of physical and psychological functioning as well
as disability and participation problems in work and other activities (Scholten-Peeters et al.,
2002). The biopsychosocial model has been suggested as important to understand the
development of CWAD (Malt and Sundet 2002; Richter et al., 2004). The study participants
reported subclinical / mild levels of PTSD as well as absence of signs reflective of
neuropathic pain. Their reported levels for both characteristics corroborates with their NDI
and WDQ scores, indicative of low levels of disability.
Previous WAD discriminative studies (Scott et al., 2005; Elliot et al., 2008; Chien and
Sterling 2010) did not include ULNT, an important sensory test, widely used by
physiotherapist for assessing WAD. An aim of the present study was to evaluate the
discriminative capacity of ULNT in CWAD so that the use of the test could be evaluated.
The study did not demonstrate discriminative capacity of ULNT for the CWAD II
participants, plausibly due to the reasons advanced above regarding severity of the
population.
9.8 Limitation of study
The key limitation of the study relates to the low severity CWAD II participants it accessed,
although this was not anticipated at the onset. The profile of the CWAD II participants
impacted on preliminary work on inter-rater reliability of DUI as well as the overall sensory

197
discrimination study. However, areas to progress different components (studies) of the thesis
have already been identified in the individual Chapters, but key ones have been summarised
as recommendations.
9.9 Recommendations for future studies
I. Further evaluation of CWAD II patients presenting with higher levels of pain, disability
and psychological impairments using both QST and ULNT.
II. Further evaluation of the discriminative capacity of additional sensory tests for the low
severity CWAD II population is also warranted.

198
Chapter 10
Conclusion
The preliminary studies undertaken found good inter-rater reliability and construct validity
for superficial facia used to track transducer during DUI image analysis, good intra-rater
reliability of DUI measurement of median nerve LM, supportive evidence for construct
validity of the ULNT 1. The use of both QST and ULNT to assess CWAD II was evidenced
from the literature review of the thesis. The sensory features of hyperalgesia, hypoesthesia
and hypersensitivity, although existing in CWAD II, did not discriminate low severity
CWAD II participants from healthy individuals. The present study found that although
sensory features of hyperalgesia, hypoesthesia and hypersensitivity exists in low severity
CWAD II participants, the presence of other mechanisms such as psychological factors, pain
and disability, moderate their capacity to discriminate the condition from healthy individuals.
The implication is that whereas sensory impairments are widely accepted as reflective of
predominant central mechanisms operative in CWAD II, they do not dictate the symptom
profile in the condition alone, as other mechanisms also contribute. This is supported by the
biopsychosocial approach adopted by WHO ICF framework, used to evaluate impact of
disease on health and functioning. The thesis therefore emphasised the importance of
different mechanisms in CWAD II that should be considered when addressing a low severity
CWAD II population. The findings in the present study have important implications for
clinical assessment of a low severity CWAD II population, and for future research.

199

200
APPENDICES
THE UNIVERSITY OF BIRMINGHAM SCHOOL OF SPORT AND EXERCISE SCIENCES
M E M O R A N D U M
FROM: Members of the Ethics Sub Committee
TO: Dr. Alison Rushton
Chris Wright
Dr. Martin Lakie
Edeni Kennedy
DATE: 12.8.08
LE 08/20 An evaluation of the physical characteristics in subjects who have
previously experienced a whiplash injury
The Ethics Sub-Committee is happy to approve this proposal.


201
School of Sport and Exercise Sciences
MEMORANDUM
To: Dr. Alison Rushton, Dr. Martin Lakie, Chris Wright, Edeni Kennedy
From: Professor Douglas Carroll Tel: 47240 Date: 10.10.08 Amendment to 08/20 – An evaluation of the physical characteristics in subjects who have previously experience a whiplash injury I am happy to take chairs action and approve the amendment/extension to the above protocol.

202
THE UNIVERSITY OF BIRMINGHAM SCHOOL OF SPORT AND EXERCISE SCIENCES
M E M O R A N D U M
FROM Professor D Carroll TO: Dr. Alison Rushton Dr. Martin Lakie Edeni Kennedy DATE: 11.8.09 LE 08/20 An evaluation of sensory and physical characteristics in subjects who have
previously experienced a whiplash injury
I am happy to take chairs action and approve the further extension/modifications to the above
proposal.

203
APPENDIX A: HEALTH SCREENING QUESTIONNAIRE
IDENTIFICATION NUMBER: ____________________________
SURNAME: ____________________________________________
FIRST NAME: __________________________________________
AGE: ___YEARS GENDER: MALE / FEMALE (PLEASE CIRCLE)

204
APPENDIX 1: HEALTH SCREENING
QUESTIONNAIRE
The following information is required before you are able to partake in this study. If you answer positive to any of the following questions, it is important that you make this known to the researcher. Please take your time to read all questions and answer honestly. If you do not understand a question or need further clarification with a particular question please ask. Thank you for agreeing to be a participant in this study. You are vital to our research project and we appreciate you giving up your time to participate. An appointment has been made for you to register for the study at the Health Sciences Labs. A map of the campus is included in this pack. If you are unable to attend for any reason please let us know by contacting us as soon as possible. You will have the chance to ask any further questions before you are registered into the study. Please complete the questions below prior to attending for registration. All answers will be kept strictly confidential. If there are any sections you are not sure how to answer, leave that question blank and inform the person who registers you at your appointment. Section 1: Your Details
Identification number: ________________________________________
Please answer the following questions relating to your health (please circle). 1. Have you been diagnosed with:
Diabetes Y / N Renal Failure Y / N Rheumatoid Arthritis Y / N Epilepsy Y / N HIV / AIDS Y / N Tuberculosis (TB) Y / N Cancer Y / N Hypertension Y / N Infection Y / N
2. Are you currently pregnant? Y / N 3. Have you ever had pain or other symptoms in your neck, shoulders or arms? Y / N 4. Have you ever had an operation on your neck, shoulders or arms? Y / N

205
5. Have you ever had a fracture in your neck, shoulders or arms? Y / N 6. How many units of alcohol do you consume in a typical week? ____
If you have answered yes to any of there questions you may not be eligible to take part
in the study. If you are not sure please contact us to discuss this.
If you have answered ‘no’ to questions 1 to 5 above please continue.
Section 2: All participants
Are you right handed? Y / N
Have you ever experienced dizziness while turning you head or looking up and down? Y / N If yes, when? …………………………. and how frequent? ………………………………………………… If so, what actions did you take (e.g. visit to a GP, inner ear disorder, etc)? ……………………………………….....and what was the problem……………………. Have you ever experienced unsteadiness with a feeling of almost falling or bumping into things? Y / N If yes, when? ………………………….and how frequent? ………………………………… If so, what actions did you take (e.g. visit to a GP, inner ear disorder, etc)? ……………………………………….....and what was the problem…………………………. If you have not been involved in a road traffic accident in the past, please do not
complete any of the remaining sections. Thank you for completing the above questions.
Section 3: Participants who have been involved in a road traffic accident
If you have suffered a road traffic accident in the past please answer the following
questions (please circle one answer only):
1. How long ago was the accident? __________Years_________months. (If you cannot remember exactly, please estimate).
2. Which part of your vehicle was involved? Front / Side / Rear
3. Did you suffer concussion, loss of consciousness or a direct head injury as a result of
the accident? Y/N
4. Have you made a compensation claim as a result of the accident? Y/N If so, is the claim process now completed? Y/N 5. Have you had any treatment for your whiplash injury? Y/N

206
If so: what treatment did you receive: Physiotherapy treatment Chiropractic treatment Acupuncture Other (please state): _____________________ How many treatments did you have? 1-5 / 6-10 / 10+
Section 4: Your symptoms
1. Are you currently experiencing any pain? Y / N If yes, please put an X on the line below to indicate your current level of pain (when resting).
2. Please indicate any pain medication you are currently taking
.................................................................................................................................................
................................................................................................................................................. 3. Please use the scale below to indicate how cold your pain feels. Words often used to
describe cold pain feelings include “like ice” and “freezing”.
1. Are you more or less sensitive to cold in the area of your pain? (E.g. sitting by an open window) More / Less / Neither 2. Is your pain provoked or increased by contact with something cold on the painful area?
Y / N 3. Do you find hot weather increases your symptoms? Y / N
4. Do you find pressure increases your symptoms? Y / N
5. Do you find touch increases your symptoms? Y / N
Thank you for completing the above questions.
No “freezing” pain
Worst “freezing” pain
imaginable
No pain
Worst pain imaginable

207
The University of Birmingham
Nursing and Physiotherapy and School of Sport and Exercise Sciences
Study title
An evaluation of the physical characteristics in subjects who have previously experienced a whiplash injury
Invitation
You are being invited to take part in a research study. Before you decide, it is important for you to understand why the research is being done and what it will involve. Please take time to read the following information carefully and discuss it with others if you wish. Please ask if there is anything that is not clear or if you would like more information. Take time to decide whether or not you wish to take part. This work is being undertaking as part of an educational qualification. What is the purpose of the study?
The purpose of this research is to compare the physical characteristics (ultrasound evaluation of nerve characteristics and the upper limb tension test) in subjects who have previously experienced a whiplash injury compared with those who have not previously had an injury.
Why have I been chosen?
You have been asked to participate because you are a member of staff or a student at the university and you either: 1. have previously experienced a whiplash injury 2. have no previous whiplash, head or neck injury.
Do I have to take part?
It is up to you to decide whether or not to take part. If you do decide to take part you will be given this information sheet to keep, and be asked to sign a consent form. If you decide to take part, you are still free to withdraw at any time and without giving a reason. A decision to withdraw at any time, or a decision not to take part, will not affect you in any way.
Participant Information Sheet

208
What will happen to me if I take part?
We will phone you to organise a time when you can attend for the study during the week of
the testing. Before you arrive at the study we will send you a health questionnaire. On the day of the study, a maximum of one hour of your time will be required.
What do I have to do?
You will need to attend one session that will last approximately one hour. During this session, the researchers will answer any questions you may have and if you are willing to take part. A researcher will then discuss your completed questionnaire with you to ensure you meet all the inclusion criteria for the study and that you consent to your participation in the study. The physical measurements can then be completed on that same day. The researcher will explain the procedure in full to you and show you the equipment that we need to use in testing. Ultrasound imaging of your arm nerves will then be taken. The measurements will be taken in the School of Sports Sciences. In the laboratory a researcher will ask you to complete three questionnaires that will take approximately 10 minutes. If you have any difficulty completing the questionnaires the researcher will be able to assist you. The questionnaires will provide us with some background information for the study. In the Sports Science laboratory you will have measurements taken of the movement of the nerves in your arms. One test will ask you about any symptoms you experience as your arm is moved by a researcher to tension the nerves, and this may cause some temporary discomfort. The researcher will ask you to rate any discomfort that you feel on a scale. The other tests will measure the movement of the nerves using an ultrasound machine similar to the machine used to look at babies during pregnancy. You will not feel any discomfort during the ultrasound testing. These tests will take approximately 45 minutes and 3 researchers will take the ultrasound measurement. The research team will be working together to ensure that the measurements are taken efficiently and that you are comfortable throughout the tests. To take the required measurements, the researcher needs access to your neck and arms, so it is preferred that you wear a short sleeved upper garment such as a vest or t-shirt, and shorts. If you wear a long sleeved shirt/top, you will be asked to remove this and you will be provided with an open backed gown. What happens after the session?
You will not be required to return for further testing. What are the possible benefits of taking part?
This is an opportunity to take part in an exciting research project that may help us further understand how nerves are affected, both physically and in their function following some

209
whiplash injuries. Knowing this information may help healthcare professionals to decide how best to assess nerve function. The results could also assist in the development of future management strategies following whiplash. Am I eligible for this study?
If you are between 18-55 years of age and you are a staff member or student of the
University of Birmingham then you are eligible to be included in the study. If you have
also had a previous ‘whiplash’ injury as a result of a road traffic accident over 6 months,
and you still have restricted neck movements and/or tenderness in the neck and/or arm –
you are also eligible to be included in the study.
To take part in the study you must not:
• Have had any surgery or fracture to the upper limb or neck in the past.
• Have diabetes, epilepsy, HIV, renal failure, tuberculosis, rheumatoid arthritis, or cancer.
• Be pregnant.
• Have an ongoing infection.
• Have experienced neck or arm pain prior to any road traffic accident that required healthcare treatment.
• Currently be receiving treatment for whiplash injury.
What are the possible disadvantages and risks of taking part?
The use of ultrasound is considered a safe procedure and widely used by health. The study
will be utilizing low frequency and levels of power which meet the American Federal Drug
Administration (FDA) levels of exposure. There have been no documented side effects in
the use of ultrasound using these powers. The use of the other sensory testing procedures is
considered safe and is widely used by health care professionals. Some of the measures will

210
cause you to feel pressure / temperature / vibratory sensations which are only present when
measurements are made.
Will my taking part in this study be kept confidential?
All information that is collected about you during the course of the research will be kept strictly confidential. Information about you will be removed so that you cannot be recognised from it. What will happen to the results of the research study?
They will be presented as part of educational qualifications. They may be presented within the university, and used for conference presentations or publications in academic journals. Can I claim expenses?
We regret that we are unable to offer any expenses payment. Who is organising and funding the research?
Dr Alison Rushton* is the lead researcher and this study is being conducted in collaboration with Chris Wright*, Dr. Martin Lakie**, Edeni Kennedy (Research student)*. There is no funding for this research. * Nursing and Physiotherapy ** Sport and Exercise Sciences. Who has reviewed the study?
Sport and Exercise Sciences Research Sub-Committee
Thank you for taking the time to read this leaflet. If you have any questions or complaints, please do not hesitate to contact:
Alison Rushton (Supervisor) 0121 415 8597 Email: [email protected] Christine Wright (Supervisor) 0121 415 8597 Email: [email protected]

211
APPENDIX 3: CONSENT FORM
The University of Birmingham
School of Health Sciences and School of Sport and Exercise Sciences
Participant Identification number: ..........................................................
CONSENT FORM Title of Project An evaluation of the physical characteristics in subjects who have previously experienced a whiplash injury Name of Researchers: Kennedy Edeni This research is not a diagnostic tool, nor a means for providing treatment.
Please tick appropriate box 1. I confirm that I have read and understand the information sheet and have had the
opportunity to ask any questions. 2. I understand that my participation is voluntary and that I am free to withdraw at any time, without giving any reason. 3. I agree to take part in the above study. ________________________ ____________________________ Name of Participant Date Signature ________________________ ___________________________ Name of person taking consent (If different from researcher) Date Signature ________________________ ____________________________ Name of Researcher Date Signature
(Copies of consent for: participant and researcher) All information collected will be stored in accordance with the Data Protection Act 1998.
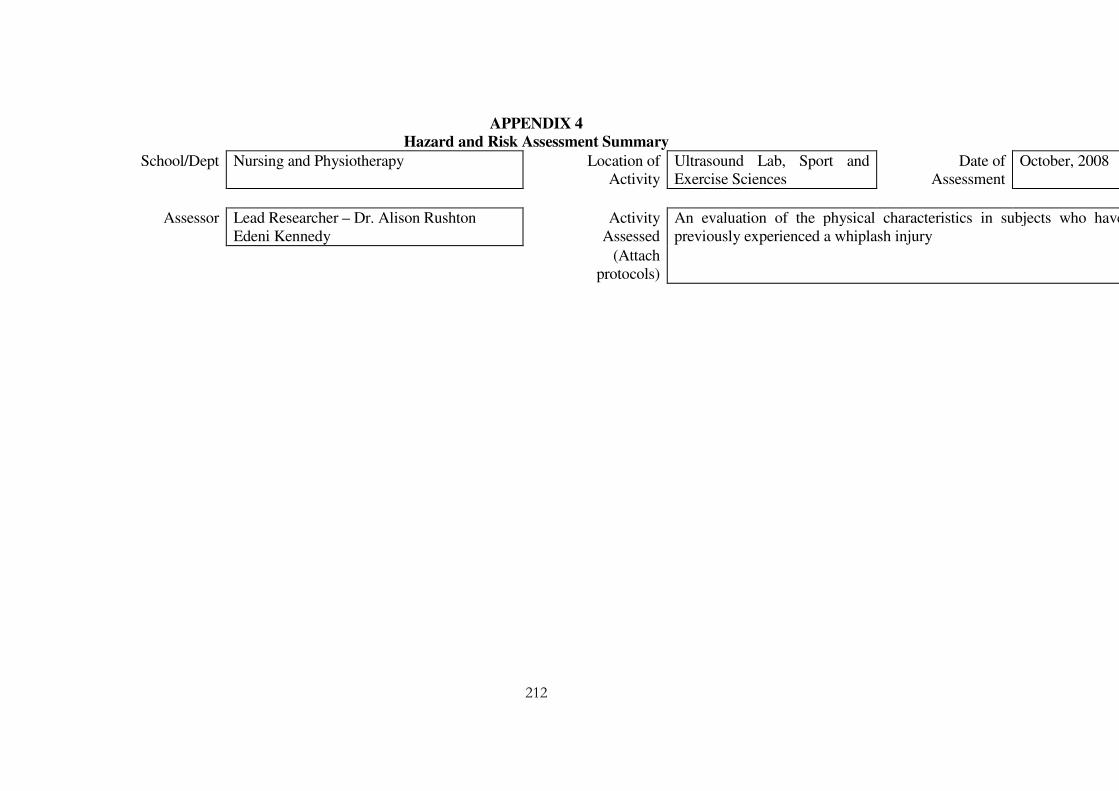
212
APPENDIX 4
Hazard and Risk Assessment Summary
School/Dept Nursing and Physiotherapy Location of Activity
Ultrasound Lab, Sport and Exercise Sciences
Date of Assessment
October, 2008
Assessor Lead Researcher – Dr. Alison Rushton Edeni Kennedy
Activity Assessed
An evaluation of the physical characteristics in subjects who havepreviously experienced a whiplash injury
(Attach protocols)
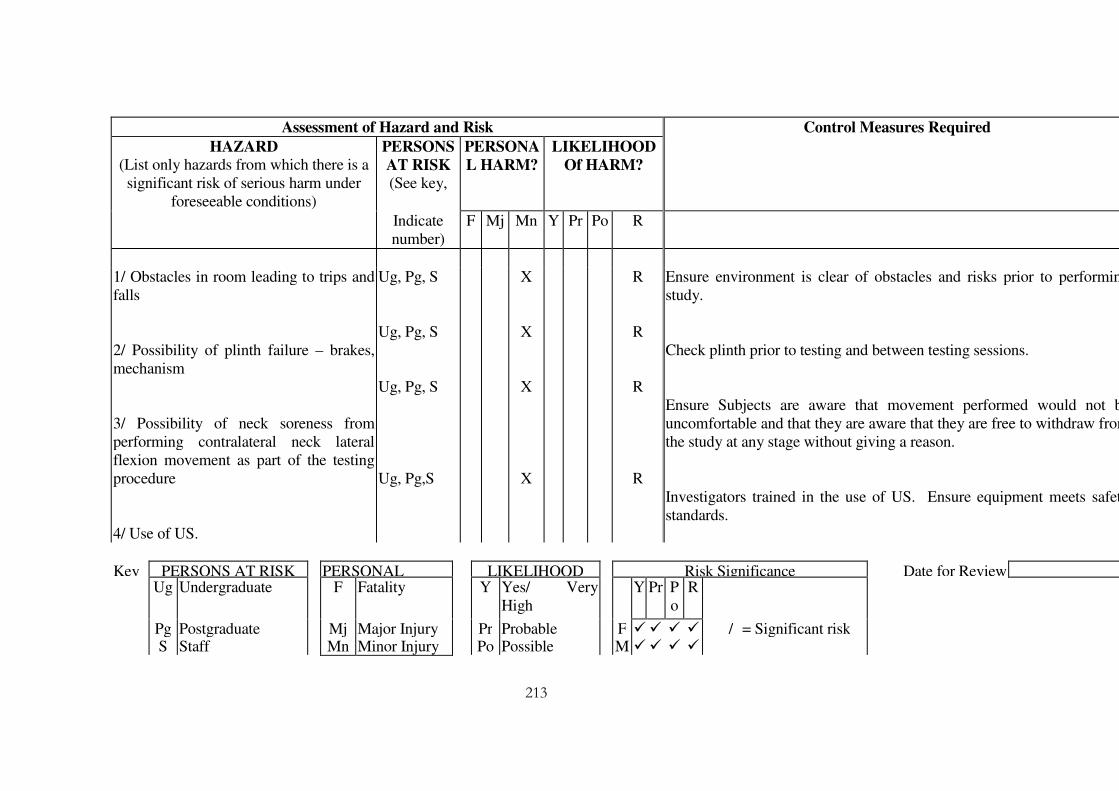
213
Key PERSONS AT RISK PERSONAL LIKELIHOOD Risk Significance Date for Review Ug Undergraduate F Fatality Y Yes/ Very
High Y Pr P
o R
Pg Postgraduate Mj Major Injury Pr Probable F � � � � / = Significant risk S Staff Mn Minor Injury Po Possible M � � � �
Assessment of Hazard and Risk Control Measures Required
HAZARD
(List only hazards from which there is a significant risk of serious harm under
foreseeable conditions)
PERSONS
AT RISK (See key,
PERSONA
L HARM?
LIKELIHOOD
Of HARM?
Indicate number)
F Mj Mn Y Pr Po R
1/ Obstacles in room leading to trips and falls 2/ Possibility of plinth failure – brakes, mechanism 3/ Possibility of neck soreness from performing contralateral neck lateral flexion movement as part of the testing procedure 4/ Use of US.
Ug, Pg, S Ug, Pg, S Ug, Pg, S Ug, Pg,S
X
X
X
X
R
R
R
R
Ensure environment is clear of obstacles and risks prior to performingstudy. Check plinth prior to testing and between testing sessions. Ensure Subjects are aware that movement performed would not beuncomfortable and that they are aware that they are free to withdraw fromthe study at any stage without giving a reason. Investigators trained in the use of US. Ensure equipment meets safetystandards.
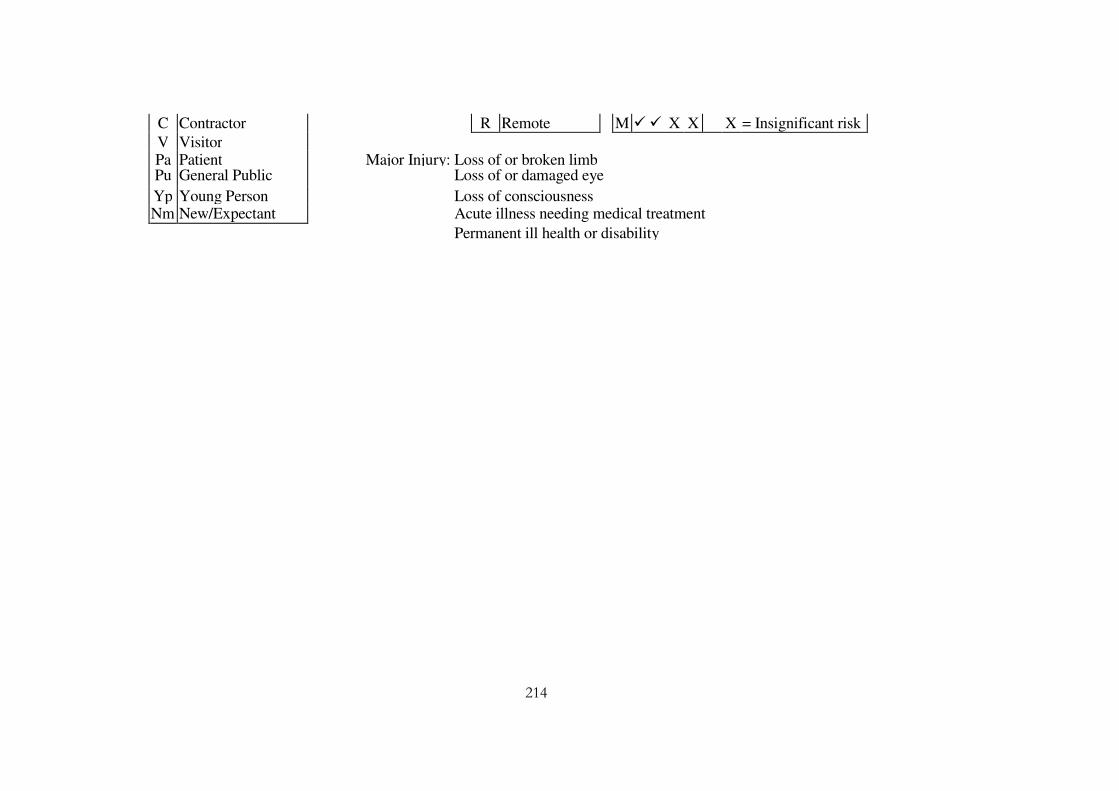
214
C Contractor R Remote M � � X X X = Insignificant risk
V Visitor Pa Patient Major Injury: Loss of or broken limb Pu General Public Loss of or damaged eye
Yp Young Person Loss of consciousness Nm New/Expectant
Mother Acute illness needing medical treatment
Permanent ill health or disability

Appendix B: DUI Image capture protocol
Ultrasound imaging of the median and ulnar nerve in the transverse and longitudinal plane
was assessed using the Diasus Ultrasound system (Dynamic Imaging, Livingston, Scotland,
UK); 8-16 MHz 26mm linear array transducer. Sequences of images were obtained at 10
frames per second and the images were converted to digital format and analysed offline
using software developed in Matlab®. The image resolution was 0.093 mm/pixels with an
image size of 590 X 790. The offline analysis employed a cross-correlation algorithm to
determine relative movement between adjacent frames in sequences of the ultrasound images
(Dilley et al., 2001).
Subject’s identification details were entered into the ultrasound system. Two test positions
was utilised in capturing nerve movements in the upper limb during the study. One test
position was used for median nerve imaging and the other for the ulnar nerve. In both test
positions, contralateral neck side flexion (CNSF) to the limit of pain tolerance (P1) or the
available ROM (R2) for each subject was carried out. The CNSF has been used in previous
DUI study (Dilley et al., 2003) and is also used in clinical practice as a component of the
ULNT to sensitize or desensitize a peripheral nerve when it is loaded.
Five practice repetitions were carried out passively to eliminate serial effect (Shuba,
unpublished dissertation, 2008). The CNSF was maintained during all measurements for
each subject. Three measurements were taken by each rater for each subject in each test
position and the order of rating was balanced to eliminate order effect. There were no rest in
between measurements as there is no evidence within literature supporting adverse reaction
following such manoeuvre.
Median Nerve
Limb position
In the laboratory, measurements of the movement of the median nerve in the upper limb
were taken at the wrist and forearm. Subjects were required to expose the arms and a full
explanation of the procedure was given. The participant lay down in supine position on a

couch. The arm was placed in a splint that allowed for 30 degrees shoulder abduction, elbow
extension and wrist in neutral position. Movement is induced in the median nerve when the
shoulder is abducted and the elbow and wrist are extended (Wright et al, 1996; Dilley et al.,
2003). Velcro strapping was used to prevent the arm from moving off this position.
Subsequently, the CNSF was applied and images of nerve movement were captured. Passive
CNSF stopped if the subject experienced pain or reported P2; otherwise movement was
carried to the end of available ROM.
Transverse Section
Imaging in transverse section of the median nerve was taken at both the wrist crease and mid
forearm. In this test position, the median nerve lay superficially and this enhanced image
clarity. These test positions have been reported in the literature to demonstrate transverse
movement (Greening et al, 2005; Dilley et al, 2007).
Probe position
(a) Wrist crease: this was the skin crease just proximal to the two prominences in the palmer
surface of the hand.
(b) Mid forearm: this position was defined as the midpoint between the wrist crease and
elbow joint line. In both test positions, the surface of the skin was marked using thin strips of
tape (2mm).
The testing protocol involved:
• Ultrasound Gel was placed on the arm position where the measurement was taken.
• Two strips were positioned apart along the longitudinal axis of the forearm to serve as
skin markers so that nerve movement was measured relative to these markers.
• Passive CNSF was performed.
• Nerve images pre and post CNSF in the transverse plane of the nerve was captured into
the PC hard drive.
• Captured images were transferred into a memory stick and stored.

Longitudinal Section
Probe position
• Mid forearm: This position has been used in previous studies (Dilley et al., 2003;
Greening et al., 2005).
The testing protocol involved:
• Ultrasound Gel was placed on the mid forearm
• Passive CNSF movement was performed
• Cine loop measurements of the corresponding nerve movement were captured into the
PC temporal memory.
• The image was played and then saved into the PC hard drive.
• Saved images were transferred into memory stick and stored.
Ulnar Nerve
Limb position
Measurements of ulnar nerve movement in the upper limb were taken 4 inches proximal to
the medial epicondyle of the humerus. The ulnar nerve lay superficially in this position, and
this enhanced image clarity. The ultrasound probe was freed from any bony interference
(Humeral medial epicondyle) as it moved from the transverse to the longitudinal plane
(Greening et al., 2005)
Subjects were required to expose their arm and a full explanation of the procedure was given.
The participant lay down in supine position on a couch. The arm was positioned in full
available shoulder abduction, elbow flexion and wrist extension. Dilley et al (2007) reported
that the ulnar nerve begins to stretch when the wrist is extended with the shoulder abducted
to 90o and the elbow flexed to 90o, simulating the ULTT 2a used in clinical setting to
mechanically provoke the ulnar nerve. Velcro strapping was used to prevent the arm from
moving off this position. Subsequently, the CNSF was applied and images of nerve
movement were captured. Passive CNSF stopped if the subject experienced pain or reported
P2; otherwise movement was carried to the end of available ROM.

Transverse plane
Probe position
(a) 4 inches proximal to the medial epicondyle of the humerus
The testing protocol involved:
• Ultrasound Gel was placed on the arm position where the measurement was taken.
• The surface of the skin was marked using thin strips of tape (2mm).
• Two strips were positioned apart along the longitudinal axis of the arm to serve as skin
markers so that nerve movement can be measured relative to these markers.
• Passive CNSF was performed.
• Nerve images pre and post CNSF in the transverse plane of the nerve was captured into
the PC hard drive.
Longitudinal Section
Probe position
(a) 4 inches proximal to the medial epicondyle of the humerus
The testing protocol involved:
• Ultrasound Gel was placed over this position.
• Passive CNSF movement was performed
• Cine loop measurements of the corresponding nerve movement were captured into the
PC temporal memory.
• The image was played and then saved into the PC hard drive.
• Saved image was transferred into memory stick and stored.

APPENDIX C: DUI image analysis protocol
STEPS
• Horizontal Nerve Movement
A. Run Analysis program
a) Double click ® on the Analysis program icon “shortcut to motion06.exe” on the
desktop
b) Click ok.
c) Double click on Ultrasound, and then click ok.
d) Use the browser to find the image files to be analysed on the desktop.
e) Highlight any ‘bmp’ file from the sequence to be analysed, and press open (you
should see JUST ONE file in the browser) and then press continue.
f) Use the initial two symbols in the browser (single point/double point) to return to
previous/higher directories).
g) Select frame number sequence: If the sequence is numbered 1, 2, 3….10 etc,
select No. However, if the sequence is numbered 01, 02 03….10, i.e. there is a
zero in front of frames 1-9, then select Yes.
h) Preview movie.
i) Enter the length of the loop at the prompt. This is useful to determine the
approximate frame during the sequence that the movement starts.
B. Cross-Correlation Image Analysis panel
a) Start Frame Enter the start frame number.
b) End frame Enter the end frame of sequence.
c) Start horizontal pixel shift Maximum extent in pixels that the compared
(Left) frame will be offset along the horizontal image
plane to the left (denoted by negative value).
d) End horizontal pixel shift As above but maximum shift to the right (positive
(right) value)

e) Save As Filenames of the excel results files. Change
‘_Nerve’ to the name of the tissue of interest.
f) Directory Directory in which the files will be saved (the default is the
original ‘bmp’ directory).
g) Vertical tracking of ROI Switches off vertical tracking (only required if the
tissue of interest has a steep gradient).
h) Start vertical pixel shift (up) Maximum vertical offset (up screen). Each
Horizontal cross correlation is performed with the compared frame offset along
the vertical image plane (default= -2 to +2 pixels) so a value for vertical
movement can also be obtained.
i) End vertical pixel shift (down) Maximum vertical offset (down screen).
j) Background (0)/Tissue of interest (1) Select (1) for tracking nerve
etc. Select (0) for tracking background (e.g. bone etc). The background can
then be subtracted from the tissue of interest.
k) Pixels/mm Selects the number of pixels per mm
I. Determine the probe length used to capture the images
II. Determine the resolution and pixel size of stored image
III. Calculate the conversion scale for the cross-correlation offline program. The
scale is a ratio of the image length in pixels divided by the transducer length
in mm and it enables the offline analysis program to convert any nerve
movement measured in pixels in the image to length in mm.

Dilley & Greening et al (2001)
280 Pixels (Image length) = 10.8 pixels/mm
26mm (Probe length)
Present Study
596 Pixels (Image length) = 22.9 pixels/mm
26mm (Probe length)
l) The last two boxes enable the pixel shift threshold and the ‘a’ value threshold to
be altered. These values should not be altered.
C. Select Region of Interest
a) Press and hold left mouse button at the top left corner of the region of interest.
Drag mouse (holding button) to bottom right corner of region. The coordinates
are displayed at the top left of screen (x, y, x offset, y offset). Multiple regions
can be selected. Press ‘No’ (on ‘another region?’) to run cross correlation.
b) The larger the area, the more reliable the result (because there are more pixels to
cross correlate). Previous studies that utilised this method for nerve movement
analysis have found that three areas over the nerve is sufficient. However, the
present study carried out a pilot analysis which showed that 4 areas will reduce
error due to variability in box positioning within the nerve.
c) Selected region of interest should not cross areas between different tissues.
a. Divide the nerve into 4 regions or segments and place a box in each using a
transparent template
b. Place a box in areas of grey contrast within each region of the nerve and
avoid areas with little or no grey contrast

c. Place 2 boxes in areas of grey contrast on the bone interface and avoid areas
with little or no grey contrast. The boxes should cover the same area of nerve
analysed above.
d. Gold standard for accepting the values from data analysed will be a
straight or near–straight square wave graph of the horizontal movement
after subtraction from the hypotenuse (Dilley et al., 2001).
e. The estimated time of the analysis is displayed at the bottom right.
f. To maintain consistency with the placement and size of boxes used in the
region of interest during image analysis, a transparent template containing 4
and 2 equidistant boxes for the nerve and background respectively will be
placed on the screen over the image to be analysed.
g. To further improve the quality of the result, the boxes within the nerve will be
in a way that keeps them inside the region of interest throughout the
movement.
d) Background subtraction (Hypotenuse): The horizontal result for the background
has been subtracted from the tissue of interest hypotenuse result.
e) Background subtraction (Horizontal): The horizontal result for the background
has been subtracted from the tissue of interest horizontal result.
f) A movie can be previewed of the results. The blue rectangles represent the
regions of interest. The small yellow squares represent the result for each area.
The white squares are the result for the total/combined area. The white squares
move the same in each area of interest.

g) With the background analysed, the following option will be displayed: ‘Do you
wish to view the subtracted background from the total area results?’ This option
will produce graphs of the results for the background (total/combined area result)
subtracted from the tissue of interest (total/combined area result).
h) Pressing ‘Yes’ will produce the following option: ‘Subtract from the hypotenuse
(select no to subtract from the horizontal’). This allows you to either subtract the
background (horizontal result) from either the hypotenuse or the horizontal
total/combined area results for the tissue of interest.
i) The graphs are arranged in 3 columns:
I. Velocity profile and cumulative hypotenuse result for the total/combined area
of the tissue of interest.
II. Velocity profile and cumulative hypotenuse result for the total/combined area
of the background.
III. Velocity profile and cumulative hypotenuse result for the subtraction.
IV. These graphs can be printed.
V. Each image is analysed 3 times and the average of the 3 values calculated.
D. Result
a) The results for the total (combined areas) and each individual area are displayed
in each column. The first column is the total/combined area result. The total
combined column (1st column) is generally the most reliable result. This is similar
to an average of the individual regions.

b) A poor result may be because the individual areas of interest were too small or
the image quality is not good enough. It may be necessary to reanalyse but
without the bad areas.
c) Most movements should be smooth. The velocity profile graph should look like a
square wave.
d) Each of the above is displayed in mm and a summary of these results can be
printed off.
• Transverse Nerve Movement
A. Image Optimization
a) Open the transverse image in Microsoft Office picture manager.
b) Press ‘’autocorrect’’ to enhance visibility of the nerve margin and adjacent
markers.
B. Run Analysis program
a) Double click on the Analysis program folder “tpsDig2” on the desktop.
b) Double click on the ‘’tpsDig2.exe’’ to run the program.
c) Select the first image (pre-movement) to be analysed from the image folder.
d) Image is displayed in the main window.
e) Digitize the landmarks or the outlines of the nerve and adjacent markers.

I. Digitize the landmarks of the Nerve by clicking on the top centre, bottom
centre, right edge and left edge of the nerve.
II. Digitize the landmarks of the markers by clicking on the top midpoint of each
marker.
f) Click on ‘’Save data as TPS file’’ through the file drop down menu.
g) Input a file name and clink on ‘’Save’’
h) Select the second image (post-movement) to be analysed from the image folder.
i) Image is displayed in the main window.
j) Digitize the landmarks or outlines of the nerve and adjacent markers.
I. Digitize the landmarks of the Nerve by clicking on the top centre, bottom
centre, right edge and left edge of the nerve.
II. Digitize the landmarks of the markers by clicking on the top midpoint of each
marker.
k) Click on ‘’Save data as TPS file’’ through the file drop down menu.
l) Input the same file name used above and clink on ‘’Save’’.
m) Click on ‘’Append’’ in the resulting dialogue box.
n) Exit the TpsDig2 program.
o) Double click on the ‘’WhipTrans2cons.xls’’ inside the TpsDig folder. An excel
spreadsheet opens.

p) Calculate the conversion scale for the WhipTrans offline program. The scale is a
ratio of the image length in pixels divided by the transducer length in mm and it
enables the offline analysis program to convert any nerve movement measured in
pixels in the image to length in mm.
Greening et al (2005)
280 Pixels (Image length) = 10.8 pixels/mm
26mm (Probe length)
Present Study
596 Pixels (Image length) = 22.9 pixels/mm
26mm (Probe length)
q) Input the conversion scale into the ‘’Calibration’’ row in the WhipTrans
spreadsheet.
r) Open the saved TPS data file in a new page in Excel using the file drop down
menu.
s) Click on ‘Next’ in the ‘’text import wizard’’ and check the ‘’space’’ box
t) Click on the Next and Finish button thereafter.
u) The spreadsheet shows 2 sets of figures in two columns
v) Copy and paste each set into the WhipTrans program. The upper set of figures is
pasted into “row 15’’ and the lower set of figures into “row 23” of the
spreadsheet.

w) The nerve movement in the AP and horizontal plane is calculated in pixels and
mm.
x) Each image is analysed 3 times and the average of the 3 values calculated.

REFERENCES
Alpar, E.K., Onuoha, G., Killampalli, V.V., et al. (2002) Management of chronic pain in whiplash injury. Journal of Bone and Joint Surgery, 84-B (6):807-811. Armstrong, B.S., McNair, P.J., Williams M. (2005) Head and neck position sense in whiplash patients and healthy individuals and the effect of the cranio-cervical flexion action. Clinical Biomechanics, 20: 675-684. Anderson, W.S., Ohara, S., Lawson, H.C. et al. (2006) Plasticity of pain-related neuronal activity in the human thalamus. Progress in Brain Research, 157: 353-364. Ansari, M.T., Tsertsvadze, A., Moher, D. (2009) Grading quality of evidence and strength of recommendations: a perspective. PLoS Med, 6: e1000151. Apkarian, A.V., Stea, R.A., Bolanowski, S.J. (1994) Heat-induced pain diminishes vibrotactile perception: a touch gate. Somatosens Mot Res, 11: 259–267. Arana, E., Martí-Bonmatí, L., Montijano, R., et al. (2006) Relationship between Northwick Park neck pain questionnaire and cervical spine MR imaging findings. EUROPEAN SPINE
JOURNAL, 15 (8): 1183-1188. Asbury, A.K, Fields, H.L. (1984) Pain due to peripheral nerve damage: a hypothesis. Neurology, 34:1587–1590. Atkins, D., Eccles, M., Flottorp, S. et al. (2004) Systems for grading the quality of evidence and the strength of recommendations I: critical appraisal of existing approaches. The GRADE Working Group. BMC Health Serv Res, 4(1):38. Backonja, M.M. (2002) Use of anticonvulsants for treatment of neuropathic pain. Neurology, 59(suppl 2): S14–S17. Bago, J., Perez-Grueso, F.J.S., Pellise, F. et al (2009) How do idiopathic scoliosis patients who improve after surgery differ from those who do not exceed a minimum detectable change? EUROPEAN SPINE JOURNAL, 21(1): 50-56.

Baker, A., Young, K., Potter, J. et al. (2010) A review of grading systems for evidence-based guidelines produced by medical specialities. Clinical Medicine, 10 (4), 358–363. Balster, S., Jull, G. (1997) Upper trapezius activity during the brachial plexus tension test in asymptomatic subjects. Manual Therapy, 2: 144-149. Banic, B., Petersen-Felix, S., Andersen, O.K. et al. (2004) Evidence for spinal cord hypersensitivity in chronic pain after whiplash injury and in fibromyalgia. Pain, 107:7–15. Baranauskas, G., Nistri, A. (1998) Sensitization of pain pathways in the spinal cord: cellular mechanisms. Prog Neurobiol, 54: 349–365. Barnsley, L., Lord, S., Bogduk, N. (1994) Clinical review. Whiplash injury. Pain, 58: 283-307. Barnsley, L., Lord, S., Bogduk, N. (1998) The pathophysiology of whiplash. Spine, 12: 209-242.
Basmajian, J.V., and De Luca, C.J. (1985) Muscles Alive, Their Functions Revealed by
Electromyography. Williams and Wilkins, Baltimore, pp. 561.
Batterham, A.M., George, K.P. (2003) Reliability in evidence-based clinical practice: a primer for allied health professionals. Phys Ther Sport, 4: 122–128.
BBC News (2008) "Warning over whiplash 'epidemic'". Available from http://news.bbc.co.uk/1/hi/health/7729336.stm (Accessed 2010).
Beekman, R., Visser, L.H. (2004) High-resolution sonography of the peripheral nervous system - a review of the literature. Eur J Neurol, 11:305–314.
Beekman, R., Visser, L.H. (2003) Sonography in the diagnosis of carpal tunnel syndrome: A critical review of the literature. Muscle Nerve, 27:26–33.

Beggs, I. (1997) Pictorial review: imaging of peripheral nerve tumours. Clin Radiol, 52: (1):8–17. Beith, I.D., Richards, P.R., Robins, E.J. (1995) Changes in length of peripheral nerve beds of the lower limb during movements of adjacent joints. J Anatomy, 185:700–701. Beneciuk, J.M., Bishop, M.D., George, S.Z. (2010) Pain Catastrophizing predicts Pain Intensity during a Neurodynamic Test for the Median Nerve in Healthy Participants. Man
Ther, 15(4): 370–375. Bennett, M. (2001) The LANSS Pain Scale – the Leeds Assessment of Neuropathic Symptoms and Signs. Pain, 92:147–57. Bennett, M.I., Smith, B.H., Torrance, N. et al. (2005) The S-LANSS score for identifying pain of predominantly neuropathic origin: validation for use in clinic and postal research. J
Pain, 6:149–58. Bergholm, U., Johansson, B.H., Johansson, H (2004) New diagnostic tools and treatments in whiplash associated disorders. J Whiplash Relat Disord, 3:5–19. Bernardes, S.F., Keogh, E., Lima, M.L. (2008) Bridging the gap between pain and gender research: A selective literature review. European Journal of Pain, 12: 427-440. Bjelland, I., Dahl, A.A., Haug, T.T. et al. (2002) The validity of the Hospital Anxiety and Depression Scale. An updated literature review. J Psychosom Res, 52(2):69-77. Bjornstig, U., Hildingsson, C., Toolanen, G. (1990) Soft-tissue injury of the neck in a Hospital based material. Scand J Soc Med, 18 (4): 263-7. Bland, J.M., and Altman, D.G. (2000) Statistics notes: the odds ratio. BMJ, 320:1468 Bland, J.M., and Altman D.G. (1996) Logarithms. BMJ, 312:700 Blanken, P., Koeter, M.W.J., van Zwieten,B.J. (2003) Medical prescription of heroin to treatment resistant heroin addicts: two randomised controlled trials. BMJ, 327(7410):310.

Borchgrevink, G.E., Kaasa, A., McDonagh, D. et al. (1998) Acute treatment of whiplash neck sprain injuries.A randomized trial of treatment during the first 14 days after a car accident. Spine, 23:25–31. Bossmann, T. Kirchbergera, I. Glaesselb, A. et al (2011) Validation of the Comprehensive ICF Core Set for Osteoarthritis: the perspective of physical therapists. Physiotherapy, 97 (1): 3–16. Bove, G.M., Ransil, B.J., Lin, H.C. et al. (2003) Inflammation induces ectopic Mechanical sensitivity in axons of nociceptors innervating deep tissues. J Neurophysiol, 90: 1949–55. Boyd, B.S., Wanek, L., Gray, A.T. et al. (2009) Mechanosensitivity of the lower Extremity nervous system during straight leg raise neurodynamic testing in healthy individuals. J Ortho Sports Phys Ther, 39:780–790. Breivik, H., Collett, B., Ventafridda V. et al. (2006) Survey of chronic pain in Europe: Prevalence, impact on daily life, and treatment. Eur J Pain, 10: 287-333. Breivik H, Borchgrevink PC, Allen SM, et al. Assessment of pain. Br J Anaesth.
2008, 101(1):17–24. Brocklehurst P, Jones C, Tickle M (2011) QIPP: cutting budgets or working smarter? British
Dental Journal, 210: 369 – 373 Brozek, J.L., Akl, E.A., Alonso-Coello, P. et al. (2008) Grading quality of evidence and strength of recommendations in clinical practice guidelines. An overview of the GRADE approach and grading quality of evidence about interventions. Allergy, 64: 669–677. Bruton, A., CONWAY, J.H., HOLGATE, S.T. (2000) Reliability: What is it and how is it measured. Physiotherapy, 86:94–99. Buitenhuis, J., Spanjer, J., Fidler, V. (2003) Recovery from acute whiplash: the role of coping styles. Spine. 28(9):896-901.
Bunketorp, L., Lindh, M., Carlsson, J. et al. (2006) The effectiveness of a supervised physical training model tailored to the individual needs of patients with whiplash-associated disorders - A randomized controlled trial. Clinical Rehabilitation, 20(3): 201-217. Butler, D.S. (2000) Sensitive nervous system. Adelaide, Australia: NOIgroup Publications. Butler, D.S. (1991) Mobilisation of the Nervous System. Churchill Livingstone, Melbourne. Byl, C., Puttlitz, C., Byl, N. et al. (2002) Strain in the median and ulnar nerves during upper- extremity positioning. J Hand Surg Am, 27:1032– 1040. Byng, J. (1997) Overuse syndromes of the upper limb and the upper limb tension test: a Comparison between patients, asymptomatic keyboard workers and asymptomatic non- keyboard workers. Man Ther, 2:157–164. Carpenter, K.J., Dickenson, A.H. (2002) Molecular aspects of pain research. The
Pharmacogenomics Journal, 2(2): 87-95. Carroll, L.J., Hogg-Johnson, S., van der Velde, G. et al. (2008) Course and prognostic factors for neck pain in the general population. Results of the Bone and Joint Decade 2000–2010 Task Force on Neck Pain and Its Associated Disorders. Spine, 33(Suppl):S75–S82. Carroll, L.J, Hogg-Johnson S, Côté P. et al. (2008) Course and prognostic factors for neck pain in workers. Results of the Bone and Joint Decade 2000–2010 Task Force on Neck Pain and Its Associated Disorders. Spine, 33(Suppl):S93–S100. Carroll, L.J., Cassidy, J.D., Peloso, P.M. et al. (2008) Methods for the best evidence synthesis on neck Pain and its associated disorders. The Bone and Joint Decade 2000–2010 Task Force on Neck Pain and its Associated Disorders. Spine, 33(Suppl):S33–S38. Carroll, L.J., Ferrari, R., Cassidy, J.D., (2007) Reduced or painful jaw movement after collision-related injuries: a population-based study. Journal of the American Dental
Association, 138(1):86-93. Centre for Reviews and Dissemination (CRD). (2009) Systematic Reviews: CRD's
Guidance for Undertaking Reviews in Healthcare. 3rd edn. York: CRD University of

York, York Publishing Services Ltd. Chen, C.C., and Barnhart, H.X. (2011) Assessing agreement with repeated measures for random observers. Statistics in Medicine, 30 (30): 3546–3559. Chien, A., Sterling., M (2010) Sensory hypoaesthesia is a feature of chronic whiplash but not Chronic idiopathic neck pain. Manual therapy, 15 (1): p48-53. Chien, A., Eliav, E., Sterling, M (2009) Hypoaesthesia occurs with sensory hypersensitivity in chronic whiplash – Further evidence of a neuropathic condition. Manual Therapy, 14 (2): 138–146. Chien A, Eliav E, Sterling M (2008) Hypoaesthesia occurs in acute whiplash irrespective of pain and disability levels and the presence of sensory hypersensitivity. Clin J Pain, 24: 759–766. Chien, A., Eliav, E., Sterling M. (2008b) Whiplash (grade II) and cervical radiculopathy share a similar sensory presentation: an investigation using quantitative sensory testing. Clin
J Pain, 24: 595–603. Chiou, H.J., Chou, Y.H., Chiou, S.Y. et al. (2003) Peripheral nerve lesions: Role of high-resolution US. Radiographics, 23:e15. Coderre, T.J, Katz, J., Vaccarino, A.L. et al (1993) Contribution of central neuroplasticity to pathological pain: review of clinical and experimental evidence. Pain, 52: 259–285. Cohen, J. (1988). Statistical power analysis for the behavioral sciences. (2nd ed.). Hillsdale, NJ: Erlbaum. Collinger, J.L., Gagnon, D., Jacobson, J., et al. (2009) Reliability of quantitative ultrasound measures of the biceps and supraspinatus tendons. Acad Radiol, 16: 1424–32. Coppieters, M.W., Alan, D., Hough, D. et al. (2009) Different Nerve-Gliding Exercises Induce Different Magnitudes of Median Nerve Longitudinal Excursion: An In Vivo Study Using Dynamic Ultrasound Imaging. J Orthop Sports Phys Ther, 39(3):164-171.

Coppieters, M.W., and Butler, D.S. (2008) Do ‘sliders’ slide and ‘tensioners’ tension? An analysis of neurodynamic techniques and considerations regarding their application. Man
Ther. 213. Coppieters, M.W., Alshami, A.M. (2007) Longitudinal excursion and strain in the median nerve during novel nerve gliding exercises for carpal tunnel syndrome. J.Orthop.Res,
25:972–980. Coppieters, M.W. (2006) The Brachial Plexus Provocation Test. Arch Phys Med Rehabil, 87: 1412–1417. Coppieters, M., Stappaerts, K., Janssens, K. et al. (2002) Reliability of detecting ‘onset of pain’ and ‘submaximal pain’ during neural provocation testing of the upper quadrant. Physiother. Res. Int, 7(3): 146–156. Côté, P., Cassidy, J.D., Linda, F. et al. (2001) A Systematic Review of the Prognosis of Acute Whiplash and a New Conceptual Framework to Synthesize the Literature. Spine, 26(19): E445-E458. Côté, P., Hogg-Johnson, S., Cassidy, J.D. et al. (2005) Initial Patterns of Clinical Care and Recovery From Whiplash Injuries. Arch Intern Med. 165; 2257-2263. Coveney, B., Trott, P., Grimmer, K.A. et al. (1997) The upper limb tension test in a group
of subjects with a clinical presentation of carpal tunnel syndrome. In: Proceedings of the 10th Biennial Conference of Manipulative Physiotherapists Association of Australia. Cronbach, L.J., and Meehl, P.E. (1955) Construct validity in psychological tests. Psychological Bulletin, 52: 281-302. Crouch, R., Whitewick, R., Clancy, M. et al. (2006) Whiplash associated disorder: incidence and natural history over the first month for patients presenting to a UK emergency department. Emerg Med J, 23: 114-118. Curatolo, M., Arendt-Nielsen, L., Petersen-Felix. S. (2004) Evidence, mechanisms, and clinical implications of central hypersensitivity in chronic pain after whiplash injury. Clinical Journal of Pain, 20(6): 469-476.

Curatolo, M., Petersen-Felix, S., Arendt-Nielsen, L. et al. (2001) Central hypersensitivity in chronic pain after whiplash injury. Clin J Pain, 17:306–15. Daffner R.H. (2010) Radiologic evaluation of chronic neck pain. Am Fam Physician, 82(8):959-64. Dankaerts W., O’Sullivan P., Burnett A, et al. (2009) Discriminating healthy controls and two clinical subgroups of nonspecific chronic low back pain patients using trunk muscle activation and lumbosacral kinematics of postures and movements: a statistical classification model. Spine, 34 (15): 1610–1618. Dall’Alba P, Sterling M, Trealeven J, Edwards S, Jull G (2001) Cervical range of motion discriminates between asymptomatic and whiplash subjects. Spine, 26: 2090–4. Daborn, C.E., Stephenson, R., Richardson, B. (2000) Effect of the Upper Limb Tension Test on the Conduction Characteristics of the Median Nerve. Physiotherapy, 86(11): 588. Daykin, A.R. Richardson, B. (2004) Physiotherapists’ Pain Beliefs and Their Influence on the Management of Patients with Chronic Low Back Pain. Spine, 29 (7): 783-795. De Bruin E D, Rozendal R H, Stussi E (1998) Reliability of phase velocity measurement of tibial bone. Physical Therapy, 78: 1166-1174. De Luca, C.J., and Erim, Z. (2002) Common drive in motor units of a synergistic muscle pair. J Neurophysiol, 87: 2200–2204. De Luca, C.J. (1993) Use of the surface EMG signal for performance evaluation of back muscles. Muscle Nerve, 16 (2):210–216. Descarreaux M. Mayrand N. Raymond J.(2007) Neuromuscular control of the head in an isometric force reproduction task: comparison of whiplash subjects and healthy controls. Spine Journal, 7(6): 647-653. De Vet, H. C. W., Terwee, C. B., Knol, D. L., et al. (2006). When to use agreement versus reliability measures. Journal Clinical Epidemiology, 59: 1033–1039.

Devor, M., and Seltzer, Z. (1999) Pathophysiology of damaged nerves in relation to
chronic pain. In: P. Wall, R. Melzack (Eds.), Textbook of pain (4th ed.), Churchill Livingstone, Edinburgh, pp. 129–164.
Dilley, A., Odeyinde, S., Greening, J. et al. (2008) Longitudinal sliding of the median nerve in patients with non-specific arm pain. Man Ther, 13: 536–543.
Dilley, A, Summerhayes C, Lynn B. (2007) An in vivo investigation of ulnar nerve sliding during upper limb movements. Clinical Biomechanics, 22:774-779. Dilley, A, Summerhayes C, Lynn B (2003) Quantitative in vivo studies of median nerve sliding in response to wrist, elbow, shoulder, and neck movements. Clinical Biomechanics, 18: 899-907.
Dilley, A, Greening. J., Lynn, B., Leary, R., Morris, V. (2001) Cross correlation analysis between high frequency ultrasound images of longitudinal median nerve movement. Ultrasound Med Biol, 27: 1211- 1218. Domholdt, E. (2005) Rehabilitation research: principles and applications (3rd ed.) Elsevier Saunders, St Louis. Dysvik, G.K., Natvig, O.J., Eikeland, T.C. et al. (2005) Coping with chronic pain. Int J
Nurs Stud, 42: 297–305. Easterbrook, P.J., Berlin, J.A., Gopalan, R. et al. (1991) Publication bias in clinical research. Lancet, 337:867-72. Eck JC, Hodges SD, Humphreys SC (2001) Whiplash: a review of a commonly misunderstood injury. The American Journal of Medicine, 110 (8): 651-656. Edwards RR, Sarlani E, Wesselmann U, Fillingim RB (2005) Quantitative assessment of experimental pain perception: Multiple domains of clinical relevance. Pain, 114: 315–319. Edwards R.R., Haythornthwaite J.A., Sullivan M.J. et al. (2004) Catastrophizing as a mediator of sex differences in pain: differential effects for daily pain versus laboratory-induced pain. Pain, 111: 335–41.

Elliott J, Sterling M, Noteboom JT. et al. (2009) The clinical presentation of chronic whiplash and the relationship to findings of MRI fatty infiltrates in the cervical extensor musculature: a preliminary investigation. Eur Spine J, 18: 1371–1378 Elliott J, Jull G, Sterling M, Noteboom T, Darnell R, Galloway G (2008) Fatty infiltrate in the cervical extensor muscles is not a feature of chronic insidious onset neck pain. Clin
Radiol, 63: 681–7. Ellis R, Wayne H, Dilley A, McNair P (2008) Reliability of measuring sciatic and tibial nerve movement with diagnostic ultrasound during a neural mobilisation technique. Ultrasound in Med & Biol, 34 (8): 1209-1216. Eliasziw M., Young S.L., Woodbury M.G. et al (1994) Statistical methodology for the concurrent assessment of interrater and intrarater reliability: using goniometric measurements as an example. Phys Ther, 74:777–788. Elvey R. (1997) Physical evaluation of the peripheral nervous system in disorders of pain and dysfunction. Journal of Hand Therapy, 10: 122-129.
Engel, G.L. (1977) The need for a new medical model: a challenge for biomedicine. Science,
196: 129-36.
Erel E, Dilley A, Greening J, et al. (2003) Longitudinal sliding of the median nerve in patients with carpal tunnel syndrome. J Hand Surg, 28B: 439-443. Eriksen, H.R., and Ursin, H. (2004) Subjective health complaints, sensitization, and sustained cognitive activation (stress). Journal of Psychosomatic Research, 56: 445–448. Esselinckx W, Trigaux JP, Maldague B, et al. (1986) Sciatic neuropathy at the popliteal fossa: clinical, ultrasonographic and computed tomographic diagnosis. Clin Rheumatol,
5(1): 107–11. Fairbank J (2011) Total disc replacement for chronic low back pain. BMJ, 342.

Felix E.R., and Widerström-Noga E.G. (2009) Reliability and validity if quantitative sensory testing in persons with spinal cord injury and neuropathic pain. J Rehabil Res Devel, 46: 69–84. Fenster A., Downey D.B., Cardinal H.N. (2001) Review: three-dimensional ultrasound imaging. Phys Med Biol, 46: R67–R99. Fenster, A., and D.B. Downey, D.B (1996) 3-D ultrasound imaging: a review. IEEE Eng
Med Biol, 15: 41–51. Field S, Treleaven J, Jull G. (2008) Standing balance: a comparison between idiopathic and whiplash induced neck pain. Manual Therapy, 13(3): 183-191. Field, A.P. (2000) Discovering statistics using SPSS for windows: advanced techniques for the beginner. London: Sage. Ferrari R, Russell AS, Carroll LJ, Cassidy JD (2005) A re-examination of the whiplash-associated disorders (WAD) as a systemic illness. Ann Rheum Dis, 64: 1337–1342. Fischer, A.A. (1987) Pressure algometry over normal muscles. Standard values, validity and reproducibility of pressure threshold. Pain, 30: 115-126. Fornage BD (1998) Peripheral nerves of the extremities: imaging with US. Radiology;
167:179. Freeman M., Croft A., Rossignol A. (1998) Whiplash associated disorders: redefining whiplash and its management by the Quebec Task Force - A critical evaluation. Spine, 23: 1043–1049. Gargan M, Bannister G, Main C, Hollis S (1997) The behavioural response to whiplash injury. J Bone Joint Surg B; 79: 523-6. Gargan M.F., and Bannister G.C. (1994) The rate of recovery following whiplash injury. Eur Spine J, 3: 162–164.

Gerdle, B., Lemming, D., Kristiansen, J. et al. (2008) Biochemical alterations in the trapezius muscle of patients with chronic whiplash associated disorders (WAD) – A microdialysis study. European Journal of Pain, 12: 82–93. Goldberg, J.M., and Lindblom, U. (1979) Standardised method of determining vibratory perception thresholds for diagnosis and screening in neurological investigation. Journal of
Neurology, Neurosurgery and Psychiatry, 42: 793–803. Gracely R.H., Lynch SA.., Bennett G.J. (1992) Painful neuropathy: altered central processing maintained dynamically by peripheral input. Pain, 51:175–194. Grant R, Forrester C, Hides J. (1995) Screen based keyboard operation: the adverse effects on the neural system. Aust J Physiother, 41:99–105.
Graven-Nielsen T, Arendt-Nielsen L (2002) Peripheral and central sensitization in musculoskeletal pain disorders: an experimental approach. Curr Rheumatol Rep, 4: 313–321.
Greening J. (2006) Workshop: Clinical implications for clinicians treating patients with non-specific arm pain, whiplash and carpal tunnel syndrome. Manual Therapy, 11: 171-172.
Greening J, Dilley A., Lynn B, (2005) In vivo study of nerve movement and mechanosensitivity of the median nerve in whiplash and non-specific arm pain patients. Pain, 115: 248–253.
Greening J, Lynn B, Leary R, et al. (2001) The use of ultrasound imaging to demonstrate reduced movement of the median nerve during wrist flexion in patients with non specific arm pain. J Hand Surg, 26B: 401-406.
Greening J, Lynn B, (1998) Minor peripheral nerve injuries: an underestimated source of pain. Manual Therapy, 3: 187-194. Greenspan, J.D. (2001) Quantitative assessment of neuropathic pain. Curr Pain Headache
Rep, 5: 107–113.

Guadagnoli, E., and Velicer, W.F. (1988) Relation of Sample-Size to the Stability of Component Patterns. Psychological Bulletin, 103(2): 265-275. Guyatt G.H., Oxman A.D., Kunz R. et al. GRADE guidelines: 5. Rating the quality of evidence – publication bias. J Clin Epidemiol. In press. Guyatt G.H., Oxman A.D., Kunz R. et al. GRADEguidelines: 6.Rating the quality of evidencedimprecision (random error). J Clin Epidemiol. In press. Guyatt G.H., Oxman A.D., Kunz R. et al. GRADE guidelines: 7. Rating the quality of evidenced inconsistency. J Clin Epidemiol. In press. Guyatt G.H., Oxman A.D., Kunz R. et al. GRADE guidelines: 8. Rating the quality of evidencedindirectness. J Clin Epidemiol. In press. Guyatt G.H., Oxman A.D., Kunz R. et al. (2011) GRADE guidelines: 1. Introduction - GRADE evidence profiles and summary of findings tables. J Clin Epidemiol, 64: 383e94 Guyatt G.H., Oxman A.D., Kunz R. et al. (2011) GRADE guidelines: 2. Framing the question and deciding on important outcomes. J Clin Epidemiol, 64: 395e400 Guyatt G.H., Oxman A.D., Kunz R. et al. (2011) GRADE guidelines: 4. Rating the quality of evidence - study limitations (risk of bias). J Clin Epidemiol, 64: 407e15. Guyatt G.H., Oxman A.D., Kunz R. et al. (2008) Incorporating considerations of resources use into grading recommendations. Br Med J, 336:1170-1173. Guzman J, Hurwitz EL, Carroll LJ, et al (2008) A conceptual model for the course and care of neck pain. Results of the bone and joint decade 2000 –2010 task force on neck pain and its associated disorders. Spine, 33(Suppl): S14–S23.
Haas M (1991) The reliability of reliability. Journal of Manipulative and Physiological
Therapeutics, 14: 199-208.

Haas M. (1991) Statistical methodology for reliability studies. J Manip Physiol Ther, 14: 119–131. Hall, T., and Elvey, R. (1999) Nerve trunk pain: physical diagnosis and treatment. Manual
Therapy, 4: 63-73.
Hall T., and Quintner J. (1996) Responses to mechanical stimulation of the upper limb in painful cervical radiculopathy. Australian Journal of Physiotherapy, 42: 277–285.
Hall T, Pyne E, Hamer P. (1993) Limiting factors of the straight leg raise test. In: 8th
Biennial conference Manipulative Physiotherapists Association of Austrailia, MPAA, Perth, pp 32-39.
Hansson P, Backonja M, Bouhassira D. (2007) Usefulness and limitations of quantitative sensory testing: clinical and research application in neuropathic pain states. Pain, 129:256–59.
Hansson, P. (2002) Neuropathic pain: clinical characteristics and diagnostic workup. European Journal of Pain, 6 (Suppl A): 47–50. Harder S, Veilleux M, Suissa S (1998) The effect of socio-demographic and crash-related factors on the prognosis of whiplash. J Clin Epidemiol, 51:377-384. Hartling L, Brison, RJ. Ardern C, Pickett W. (2001) Prognostic Value of the Quebec Classification of Whiplash-Associated Disorders. Spine, 26 (1): 36-41. Heide B.V., Bourgoin C., Eils G. et al (2006) Test-retest reliability and face validity of a modified neural tissue provocation test in patients with cervicobrachial pain syndrome. J
Man Manip Ther, 14:30–36. Heikkilä, H.V., Wenngren, B.I. (1998) Cervicocephalic kinesthetic sensibility, active range of cervical motion aqnd oculomotor function in patients with whiplash injury. Arch Phys
Med Rehabil, 79: 1089–1094.

Heinemeyer O, Reimers C D (1999) Ultrasound of radial, ulnar, median, and sciatic nerves in healthy subjects and patients with hereditary motor and sensory neuropathies. Ultrasound
Med Biol, 25 (3):481–5. Hendriks, G.G., Scholten-Peeters, D.A., van der Windt. et al. (2005) Prognostic factors for poor recovery in acute whiplash patients. Pain, 114: 408–416. Higgins J.P.T., Green S. (Eds.) (2008). Cochrane handbook for systematic reviews of
interventions. Chichester (UK): John Wiley & Sons. Holdcroft, A., and Jaggar S. (Eds.) (2005) Core Topics in Pain. Cambridge University Press, Cambridge, UK. Holm LW, Carroll LJ, Cassidy JD, et al. (2008) The burden and determinants of neck pain in whiplash-associated disorders after traffic collisions. Results of the Bone and Joint Decade 2000–2010 Task Force on Neck Pain and Its Associated Disorders. Spine, 33(Suppl):S52–S59. Holm L.W., Carroll L.J., Cassidy J.D. et al. (2007) Widespread pain following whiplash-associated disorders: incidence, course, and risk factors. J Rheumatol 34:193–200. Hoitsma E., Reulen J.P., de Baets M., et al. (2004) Small fiber neuropathy: a common and important clinical disorder. J Neurol Sci, 227: 119-30. Hopkins W.G. (2000) Measures of reliability in sports medicine and science. Sports Med, 30: 1–15. Horowitz, M., Wilner, N., Alvarez, W. (1979) Impact of event scale: a measure of subjective stress. Psychosomatic Medicine, 41: 209–218. Hough A.D., Moore A.P., Jones M.P. (2000a) Measuring longitudinal nerve motion using ultrasonography. Manual Ther, 5:173-180. Hough A.D., Moore A.P., Jones M.P. (2000b) Peripheral nerve motion measurement with spectral Doppler sonography: A reliability study. J Hand Surg, 25B: 585-576.

Hough A.D., Moore A.P., Jones M. P. (2007) Reduced Longitudinal Excursion of the Median Nerve in Carpal Tunnel Syndrome. Archives of Physical Medicine and
Rehabilitation, 88(5): 569-576 Hoving, J.L., O'Leary, E.F., Niere, K.R. et al. (2003) Validity of the Neck Disability Index, Northwick Park Neck Pain Questionnaire, and problem elicitation technique for measuring disability associated with whiplash-associated disorders. Pain, 102: 273–281 Hurley RW, Adams MCB (2008) Sex, gender and pain: an overview of a complex field. Anesth Analg, 107:309–17. Ide, M., Ide, J., Yamaga, M., et al. (2001) Symptoms and signs of irritation of the brachial plexus in whiplash injuries. J Bone Joint Surg Br, 83: 226–229. Irving B A, Weltman J Y, Brock D W, Davis C K, Gaesser G A (2007) NIH ImageJ and Slice-O-Matic Computed Tomography imaging software to Quantify Soft Tissue. OBESITY; 15(2): 370-376.
Jaberzadeh S, Scutter S, Nazeran H. (2005) Mechanosensitivity of the median nerve and mechanically produced motor response during Upper Limb Neurodynamic Test 1. Physiotherapy, 91:94–100.
Jaberzadeh, S., Nazeran, H., Warden-Flood. et al. (2001) Mechanically evoked torque and electromyographic responses during passive elbow extension in upper limb tension test position. Engineering in Medicine and Biology Society, Proceedings of the 23rd Annual
International Conference of the IEEE, 2: 1123 – 1126.
Jensen, R., Hystad, T., Kvale, A. et al. (2007a) Quantitative sensory testing of patients with long lasting patellofemoral pain syndrome. Eur J Pain, 11: 665–676.
Jensen, R. Kvale, A., Baerheim, A. (2007b) Is pain in patellofemoral pain syndrome neuropathic? Clin J Pain, 24: 384–394.

Jensen, T.S., and R. Baron, R. (2003) Translation of symptoms and signs into mechanisms in neuropathic pain. Pain, 102: 1–8.
Jordan K. (2000) Assessment of published reliability studies for cervical spine range of motion measurement tools. J Manipulative Physiol Ther, 23.
Joseph S. (2000) Psychometric evaluation of Horowitz's Impact of Event Scale: a review. J
Trauma Stress, 13:101–113.
Jull G, Sterling M, Kenardy J. et al (2007) Does the presence of sensory hypersensitivity influence outcomes of physical rehabilitation for chronic whiplash? – A preliminary RCT. Pain, 129:28–34.
Kaki AM, El-Yaski AZ, Youseif E. (2005) Identifying Neuropathic Pain Among Patients With Chronic Low-Back Pain: Use of the Leeds Assessment of Neuropathic Symptoms and Signs Pain Scale. Reg Anesth Pain Med, 30: 422.e1-422.e9.
Kamper SJ, Rebbeck T.J., Maher C.G., et al. (2008) Course and prognostic factors of whiplash: a systematic review and meta-analysis. Pain, 138: 617–629.
Karlehagen, S., Malt, U., Hoff, H. (1993) The effect of major railway accidents on the psychological health of train drivers. J Psychosom Res, 37: 807–817. Kasch H., Qerama E., Bach F.W., et al. (2005) Reduced cold pressor pain tolerance in non-recovered whiplash patients: a 1-year prospective study. Eur J Pain, 9:561–9. Kavanagh B (2009) The GRADE system for rating clinical guidelines. PLoS Med 6(9): e1000094. Keating, J., and Matyas T. (1998) Unreliable inferences from reliable measurements. Aust.
Physiother, 44:5–10. 1998.

Kelley S., and Jull G. (1998) Breast surgery and neural tissue mechanosensitivity. Aust J
Physiother, 44:31–37. Khedr E.M., Kotb H., Kamel N.F. et al (2005) Long lasting antalgic effects of daily sessions of repetitive transcranial magnetic stimulation in central and peripheral neuropathic pain. J
Neurol Neurosurg Psychiatry, 76:833–8 Kleinrensink G, Stoeckart R, Mulder PGH, et al. (2000) Upper limb tension tests as tools in the diagnosis of nerve and plexus lesions. Anatomical and biomechanical aspects. Clin
Biomech, 15:9–14.
Kleinrensink G., Stoeckart R., Vleeming A. et al (1995) Mechanical tension in the medial nerve. The effects of joint positions. Clin Biomech, 10:240–4. Kleinrensink G., Stoeckart R., Vleeming A. et al (1994) Peripheral nerve tension due to joint motion. A comparison between embalmed and unembalmed human bodies. Clin Biomech, 10:235–9. Kidd BL, Urban LA (2001) Mechanisms of inflammatory pain. Br J Anaesth, 87: 3–11. Kinear P.R., and Gray C.D. (2004) SPSS 12 made simple. Hove: Psychology Press, pp 234. Kinser AM, Sands WA, Stone MH.(2009) Reliability and validity of a pressure algometer. J
Strength Cond Res, 23(1):312-4. Klapow JC, Slater MA, Patterson TL. et al. (1993) An empirical evaluation of multidimensional clinical outcome in chronic low back pain patients. Pain, 55:107-118. Knappertz VA, Tegeler CH, Hardin SJ, McKinney WM (1998) Vagus nerve imaging with ultrasound: anatomic and in vivo validation. Otolaryngol Head Neck Surg, 118(1): 82–5. Kobayashi S, Yoshizawa H, Nakai S. (2000) Experimental study on the dynamics of lumbosacral nerve root circulation. Spine, 25: 298–305.

Koelbaek-Johansen M, Graven-Nielsen T, Schou-Olesen A, Arendt-Nielsen L (1999) Muscular hyperalgesia and referred pain in chronic whiplash syndrome. Pain, 83:229–34. Kongsted A, Bendix T, Qerama E, et al. (2008) Acute stress response and recovery after whiplash injuries: a one-year prospective study. Eur J Pain, 12: 455–463. Kosek, E, Ekholm, J, and Nordemar, R. (1993) A comparison of pressure pain thresholds in different tissues and body regions. Long-term reliability of pressure algometry in healthy volunteers. Scand J Rehabil Med, 25: 117-124. Korstanje, J.H., Selles, R.W., Stam, H.J. et al (2010) Development and validation of ultrasound speckle tracking to quantify tendon displacement. Journal of Biomechanics, 43 (7): 1373–1379. Korstanje, J.W.H., Selles, R.W., Stam, H.J. et al. (2009) Dedicated ultrasound speckle
tracking to study tendon displacement. In: conference proceedings of SPIE Medical Imaging: Ultrasonic Imaging and Signal Processing. Lake Buena Vista, FL, USA. Kovacs F.M., Abraira V., Royuela A., et al. (2008) Minimum detectable and minimal clinically important changes for pain in patients with nonspecific neck pain. BMC
Musculoskelet Disord, 9:43. Krassioukov, A., Wolfe D.L., Hsieh J.T., et al. (1999) Quantitative sensory testing in patients with incomplete spinal cord injury. Arch Phys Med Rehabil, 80(10):1258–63. Kristjansson E., Dall'Alba P., Jull G. (2003) A study of five cervicocephalic relocation tests in three different subject groups. Clin Rehabil, 17:768–74. Krohne1, K., and Ihlebæk, C. (2010) Maintaining a balance: a focus group study on living and coping with chronic whiplash-associated disorder. BMC Musculoskeletal Disorders, 11:158. Lacomis D. (2002) Small-fiber neuropathy. Muscle Nerve, 26:173–188 Landis J.R., and Koch G.G. (1977) The measurement of observer agreement for categorical data. Biometrics, 33:159–74.

Leak, A. M., Cooper, J., Dyer, S. et al. (1994) The Northwick Park Neck Pain Questionnaire, devised to measure neck pain and disability. British Journal of Rheumatology, 33(5): 469–474. Lee Y.S, Lin C.Y, Robertson R.T, Hsiao I, Lin V.W (2004) Motor recovery and anatomical evidence of axonal regrowth in spinal cord-repaired adult rats. J. Neuropathol. Exp.
Neurol, 63: 233–245. Lewis J, Ramot R, Green A. (1998) Changes in mechanical tension in the median nerve: possible implications for the upper limb tension test. Physiotherapy, 84(6):254–261. Li, J., Simone, D.A., Larson, A.A. (1999) Windup leads to characteristics of central sensitization. Pain, 79:75–82. Liberati A., Altman D.A., Tetzlaff J., et al. The PRISMA Statement for reporting systematic reviews and metanalyses of studies that evaluate health care interventions: explanation and elaboration. Annals of Internal Medicine, 151:w1-w30. Lin YH, Hsieh SC, Chao CC, Chang YC, Hsieh ST (2005) Influence of aging on thermal and vibratory thresholds of quantitative sensory testing. J Peripher Nerv Syst; 10(3):269–81 Lorenzo-Seva, U., Ferrando, P.J. (2006) FACTOR: A computer program to fit the exploratory factor analysis model. Behavior Research Methods, 38: 88–91. Lovell ME, Galasko CS (2002) Whiplash disorders: a review. Injury, 33:97–101. Lundborg G (1988) Intraneural microcirculation. The Orthopaedic clinics of North
America, 19(1): 1-12. Malt E.A., and Sundet, K. (2002) A psychosomatic approach to the understanding of whiplash- associated disorders. Tidskr Nor Leagefor, 122: 1291–1295. Maitland, G.D., Hengeveld, E., Banks, K. et al (2001) Maitland's vertebral manipulation. 6th ed. Butterworth, London.

Masciocchi C, Innacoli M, Cisternino S, Barile A, Rossi F, Passariello R (1992) Myxoid intraneural cysts of external popliteal ischiadic nerve. Report of 2 cases studied with ultrasound, computer tomography and magnetic resonance imaging. Eur J Radiol, 14(1):52–5. Martinez-Lavin M., Lopez S., Medina M. et al. (2003) Use of the Leeds assessment of neuropathic symptoms and signs questionnaire in patients with fibromyalgia. Semin
Arthritis Rheum, 32:407-411. Martinoli C, Bianchi S, Gandolfo N, Valle M, Simonetti S, Derchi LE (2000) US of nerve entrapments in osteofibrous tunnels of the upper and lower limbs. Radiographics, 20(S199):213–7. Melzack R, Wall PD. (1982) The challenge of pain. New York: Basic Books. Mercer C, Jackson A, Moore A (2007) Developing clinical guidelines for the physiotherapy management of whiplash associated disorder (WAD). International Journal of Osteopathic
Medicine; 10 (2): 50-54. Mills H, Horne G (1986) Whiplash: manmade disease? N Z Med J, 99: 373-4. Millard, R.W. (1995) Psychological assessment in medical rehabilitation. In: Cushman LA, and Scherer, M.J. (Eds) Measurement and instrumentation in psychology. American Psychological Association, Washington DC, USA. pp. 237-273. Millesi H. (1986) The nerve gap. Theory and clinical practice. Hand Clin, 2: 651. Moog, M., Quintner, J., Hall, T., et al (2002) The late whiplash syndrome: A psychophysical study. European Journal of Pain, 6(4): 283-294. Moore K.L., Dalley A.F. (2005) Clinically oriented anatomy (5th edition). Lippincott Williams & Wilkins, Philadelphia, Pennsylvania. Murata, Y. , Iwasaki, H. , Sasaki, M. et al (2005) Phosphoinositide phosphatase activity coupled to an intrinsic voltage sensor. Nature, 435: 1239–1243.
Nachemson AL (1992) "Newest knowledge of low back pain: A critical look". Clinical
Orthopaedics, 279; 8–20. Nederhand M, Ijzerman M, Hermens H, Turk D, Zilvold G. (2004) Predictive value of fear avoidance in developing chronic neck pain disability: consequences for clinical decision making. Archives of Physical Medicine and Rehabilitation, 85:496–501.
Nederhand M.J., Hermens H.J., IJzerman M.J. et al. (2003) Chronic neck pain disability due to an acute whiplash injury. Pain, 102: 63–71.
Nederhand M.J., Hermens H.J., IJzerman M.J. et al. (2002) Cervical muscle dysfunction in chronic whiplash-associated disorder grade 2the relevance of the trauma. Spine, 27: 1056–1061.
Nee R.J., and Butler D. (2006) Management of peripheral neuropathic pain: Integrating neurobiology, neurodynamics, and clinical evidence. Physical Therapy in Sport, 7 (1): 36-49. NICE (2009) Methods of the Development of NICE. Public Health Guidance, 2nd edn. London: NICE. Niekerk S.V., Louw Q., Vaughan C. et al. (2008) Photographic measurement of upper-body sitting posture of high school students: A reliability and validity study. BMC
Musculoskeletal Disorders, 9:113-124. Niere, K. (2006) The Whiplash Disability Questionnaire (WDQ). Australian Journal of
Physiotherapy, 52: 151. Nussbaum, EL and Downes, L. (1998) Reliability of clinical pressure-pain algometric measurements obtained on consecutive days. Phys Ther 78: 160-169. O’ Conaire E., Rushton, A., Wright, C. (2011) The assessment of vibration sense in the musculoskeletal examination: Moving towards a valid and reliable quantitative approach to vibration testing in clinical practice. Manual Therapy, 16(3): 296–300.

Oliver, G.S., and Rushton, A. (2011) A study to explore the reliability and precision of intra and inter-rater measures of ULNT1 on an asymptomatic population. Manual Therapy, 16(2): 203-206. Osborne, J., Costello, A.B., Kellow, J.T. (2008) Best practices in exploratory factor
analysis. In: J.Osborne (Ed.), Best practices in quantitative methods (pp. 86–124). Thousand Oaks, CA: Sage. Ottosson, C., Nyren, O., Johansson, S.E., Ponzer, S (2005) Outcome after minor traffic accidents: a follow-up study of orthopaedic patients in an inner-city area emergency room. J
Trauma, 58:553–560. Panjabi MM, Nibu K, Cholewicki J. (1998) Whiplash injuries and the potential for mechanical instability. Eur Spine J, 7:484–92. Panjabi M.M., Cholewicki J., Nibu K. et al. Mechanism of whiplash injury. Clin Biomech,
13:239–49. Park R, Wallace MS, Schulteis G. Relative sensitivity to alfentanil and reliability of current perception threshold vs von Frey tactile stimulation and thermal sensory testing. J Peripher
Nerv Syst, 6(4):232–40. Parke, W., Whalen, J. (2002) The vascular pattern of the human dorsal root ganglion and its probable bearing on a compartment syndrome. Spine, 27: 347–352.
Peebles J., McWilliams L., MacLennan, R. (2001) A comparison of symptom checklist 90-revised profiles from patients with chronic pain from whiplash and patients with other musculoskeletal injuries. Spine, 26:766–70.
Peat J.K., Mellis C., Williams K. et al. (2002) Health Science Research: A handbook of quantitative methods. London: SAGE Publications. Peduzzi, P., Concato, J., Kemper, E. et al. (1996) A simulation study of the number of events per variable in logistic regression analysis. J Clin Epidemiol, 49: 1373–1379.

Peer S., Kovacs P., Harpf, C. et al. (2002) High-resolution sonography of lower extremity peripheral nerves. J Ultrasound Med, 21:315–322. Peolsson M, Gerdle B (2004) Coping in patients with chronic whiplash-associated disorders: a descriptive study. J Rehabil Med, 36: 28–35. Peters, E.W., Bienfait, H.M.E., de Visser, M. R. et al (2003) The reliability of assessment of vibration sense. Acta Neurologica Scandinavica, 107: 293–298. Petty N.J., Moore A.P. (2011) Principles of neuromusculoskeletal treatment and
management: a guide for therapists. Churchill Livingstone; London. Pleger, P., Ragert, P., Schwenkreis, A.F. et al. (2006) Patterns of cortical reorganization parallel impaired tactile discrimination and pain intensity in complex regional pain syndrome. NeuroImage, 32: 503–510. Puvanachandra, N., Lyons, C.J. (2009) Rapid measurement of corneal diameter in children: Validation of a clinic-based digital photographic technique. Journal of AAPOS, 13: 287-288. Pietroban, R., Coeytaux, R.R., Carey, T.S. et al. (2002) Standard scales for measurement of functional outcome for cervical pain or dysfunction - A systematic review. Pain, 27(5): 515-522.
Pinfold, M., Niere, K.R., O’Leary, E.F., et al. (2004) Validity and Internal Consistency of a Whiplash-Specific Disability Measure. Spine, 29 (3): 263-268. Portney, L. G., and Watkins, M. P. (2000) Foundations of clinical research: Applications to practice (2nd ed.). Upper Saddle River, NJ: Prentice Hall Health. Potter J, Higginson IJ, Scadding JW, Quigley C. (2003) Identifying neuropathic pain in patients with head and neck cancer: use of the Leeds Assessment of Neuropathic Symptoms and Signs Scale. J R Soc Med, 96:379-383. Provinciali, L., Ceravolo, M.G., Bartolini, M. et al. (1999) A multidimensional assessment of multiple sclerosis: relationships between disability domains. Acta Neurologica
Scandinavica, 100 (3): 156–162.

Provinciali L., Baroni M., Illuminati L. et al. (1996) Multimodal treatment to prevent the late whiplash syndrome. Scand J Rehabil, Med 28: 105–11. Raak, R., and Wallin, M. (2006) Thermal thresholds and catastrophising in individuals with chronic pain after whiplash injury. Biol Res Nurs, 8: 138–146. Radanov BP, Dvorak J, Valach L. (1992a) Cognitive deficits in patients after soft tissue injury of the cervical spine. Spine, 17: 127-131. Radanov BP, Schnidrig A, Stefano C. et al. (1992b) Illness behaviour after common whiplash. Lancet, 339: 749-750.
Radanov B.P., Hirlinger I., Di Stefano C. et al. (1992c) Attentional processing in cervical spine syndromes. Acta Neurol. Scand, 85: 358-362. Rasmussen, P.V., Sindrup, S.H., Jensen, T.S. et al. (2004) Symptoms and signs in patients with suspected neuropathic pain. Pain, 110: 461–469. Reed G.F., Lynn F., Meade B.D. (2002) Use of coefficient of variation in assessing variability of quantitative assays. Clin Diagn Lab Immunol, 9: 1235–1239.
Richard R, Ford J, Miller S, Staley M (1994) Photographic measurement of volar forearm skin movement with Wrist Extension: The influence of elbow position. J Burn Care
Rehabil, 15(1):58-61. Richard R L, Lester M E, Miller S F, Bailey J K, Hedman T L, Dewey W S, Greer M, Renz E M, Wolf S E, Blackbourne L H (2009) Identification of cutaneous functional units related to burn scar contracture development. Journal of Burn Care & Research, 30 (4): 625-631. Richter M, Ferrari R, Otte D, et al. (2004) Correlation of clinical findings, collision parameters, and psychological factors in the outcome of whiplash associated disorders. J
Neurol Neurosurg Psychiatry, 75:758–64.

Rietveld, T., and Van Hout, R. (1993) Statistical techniques for the study of language and
language behaviour. Berlin: Mouton de Gruyter. Rolke R, Baron R, Maier C, Tölle TR, et al. (2006) Quantitative sensory testing in the German Research Network on Neuropathic Pain (DFNS): Standardized protocol and reference values. PAIN, 123 (3); 231-243. Ropper, A.H., Brown, R.H., (Eds.) Adams and Victor's principles of neurology. McGraw-Hill. New York: pp. 271–301. Roush J, Karen B, Ellen L (2008) Measurement error between a goniometer and the NIH ImageJ program for measuring quadriceps angle. Internet Journal of Allied Health
Sciences and Practice, 6 (2): 1-6. Rashband W.S. (2007) ImageJ. U.S National Institutes of health, Bethesda, Maryland, USA. http://rsb.info.nih.gov/ij Rhudy, J.L., and Meagher, M.W. (2000) Fear and anxiety: Divergent effects on human pain thresholds. Pain, 84: 65-75. Rushton A., Wright C., Heneghan N. (2011) et al. Physiotherapy rehabilitation for whiplash associated disorder II: a systematic review and meta-analysis of randomised controlled trials. BMJ, 1(2): 1-15. Riddle D.L., Stratford P.W. (1998) Use of generic versus region-specific functional status measures on patients with cervical spine disorders. Phys Ther, 78: 951–963. Rosenfeld M, Serferiadas A, Carlsson J. et al. (2003) Active intervention in patients with whiplash-associated disorders improves long-term prognosis. Spine, 28:2491–8. Rosenfeld M, Gunnarsson R, Borenstein P. (2000) Early intervention in whiplash-associated disorders: a comparison of two treatment protocols. Spine, 25:1782–7. Sackett D.L., Rosenberg W.M.C., Muir Gray J.A., et al. (1996) Evidence based medicine: what it is and what it isn't. BMJ, 312: 71-2.

Safrit MJ, Wood TM. (1989) Measurement concepts in physical education and exercise
science. Champaign: Human Kinetic Books. Selvaratnam P.J., Matyas T.A., Glasgow E.F. (1994) Noninvasive discrimination of brachial plexus involvement in upper limb pain. Spine, 19:26–33. Schmitt MA, van Meeteren NL, de Wijer A., et al. (2008) Functional health status in subjects after a motor vehicle accident, with emphasis on whiplash associated disorders: design of a descriptive, prospective inception cohort study. BMC Musculoskelet Disord, 9:168. Schultz, I.Z. Crook, J. Fraser, K. Joy, P.W (2000) Models of diagnosis and rehabilitation in musculoskeletal pain-related occupational disability. J Occup Rehabil, 10: 271–293. Scholten-Peeters G.G.M, Verhagen A.P., Bekkering G.E., et al. (2003) Prognostic factors of whiplash-associated disorders: A systematic review of prospective cohort studies. Pain, 104:303–22. Scholten-Peeters, G.G.M., Bekkering, G.E., Verhagen A.P., et al. (2002) Clinical Practice Guideline for the Physiotherapy of Patients with Whiplash-Associated Disorders. Spine, 27 (4):412-422. Scott D, Jull G, Sterling M. (2005) Sensory hypersensitivity is a feature of chronic whiplash associated disorders but not chronic idiopathic neck pain. Clinical Journal of Pain, 21: 175–81.
Shacklock M.O. (2005) Improving application of neurodynamic (neural tension) testing and treatments: A message to researchers and clinicians. Manual Therapy, 10(3):175-179. Shacklock M. (2005) Clinical neurodynamics: a new system of neuromusculoskeletal
treatment. Oxford: Elsevier. Shacklock M. (1995) Neurodynamics. Physiotherapy, 81:9–16. Sheather R., Cohen, M.L. (1998) Psychophysical evidence for a neuropathic component of chronic neck pain. Pain, 75: 341–347.
Sherman, E.M.S, Brooks, B.L., Iverson, G.L. et al. (2011) Reliability and Validity in
Neuropsychology. THE LITTLE BLACK BOOK OF NEUROPSYCHOLOGY, 873-892. Shrout P E, Fleiss J (1979) Intraclass correlations: uses in assessing rater reliability. Psychological Bulletin, 86: 420-428. Sim J., and Wright C. (2000) Research in health care. Cheltenham: Stanley Thornes. Smart K., Doody C. (2007) The clinical reasoning of pain by experienced musculoskeletal physiotherapists. Manual Therapy, 12 (1): 40–49. Söderlund A, Denison E. (2006) Classification of patients with whiplash associated disorders (WAD): Reliable and valid subgroups based on the Multidimensional Pain Inventory (MPI-S). European Journal of Pain, 10: 113-119. Soderlund A, Olerud C, Lindberg P (2000) Acute whiplash-associated disorders (WAD): the effects of early mobilization and prognostic factors in long-term symptomatology. Clin
Rehabil, 14: 457-467.
Spitzer W, Skovron M, Salmi L, Cassidy J, Duronceau J, Suissa S. (1995) Scientific monograph of Quebec task force on whiplash associated disorders: redefining ‘whiplash’ and its management. Spine, 20(8S):1–73.
Staud R, Smitherman ML (2002) Peripheral and central sensitization in FM: pathogenic role. Curr Pain Headache Rep, 6: 259–266. Sterling M. (2011) Does knowledge of predictors of recovery and non-recovery assist outcomes after whiplash injury? Spine, 36 (25): S257-62. Sterling, M (2010) Differential development of sensory hypersensitivity and a measure of spinal cord hyperexcitability following whiplash injury. Pain, 150:501–6. Sterling M (2009) Differential development of sensory hypersensitivity and a measure of spinal cord hyperexcitability following whiplash injury. Pain, 150:501–506.

Sterling M, Pedler A (2009) A neuropathic pain component is common in acute whiplash and associated with a more complex clinical presentation. Manual therapy, 14 (2):173-179. Sterling, M., Hodkinson, E., Pettiford, C., et al. (2008) Psychologic Factors Are Related to Some Sensory Pain Thresholds but Not Nociceptive Flexion Reflex Threshold in Chronic Whiplash. Clinical Journal of Pain, 24 (2): 124-130. Sterling, M., and Kenardy, J. (2008) Physical and psychological aspects of whiplash: Important considerations for primary care assessment. Manual Therapy, 13(2): 93–102. Sterling, M. (2007) Whiplash injury pain: basic science and current/future therapeutics. Reviews in Analgesia, 9: 105–116. Sterling M, Kenardy J (2006) Physical and psychological aspects of whiplash: Important considerations for primary care assessment. Manual Therapy, 13: 93-102. Sterling M, Jull G, Kenardy J. (2006) Physical and psychological predictors of outcome following whiplash injury maintain predictive capacity at long term follow-up. Pain, 122:102–8. Sterling M, Jull G, Vicenzino B. et al. (2005) Physical and psychological factors predict outcome following whiplash injury. Pain, 114:141–8. Sterling, M. (2004) A proposed new classification system for whiplash associate disorders-implications for assessment and management. Manual Therapy, 9: 60–70. Sterling M, Kenardy J, Jull G, Vicenzino B. (2003c) The development of psychological changes following whiplash injury. Pain; 106: 481–9. Sterling M, Jull G, Vizenzino B, Kenardy J, Darnell R. (2003b) Development of motor system dysfunction following whiplash injury. Pain, 103: 65–73. Sterling M, Jull G, Vicenzino B, Kenardy J. (2003a) Sensory hypersensitivity occurs soon after whiplash injury and is associated with poor recovery. Pain, 104: 509–17.

Sterling M, Treleaven J, Jull G. (2002) Reponses to a clinical test of mechanical provocation of nerve tissue in whiplash associated disorder. Manual Therapy, 10: 69–81.
Sterner Y, Toolanen G, Knibestol M, Gerdle B, Hildingsson C (2001) Prospective study of trigeminal sensibility after whiplash trauma. Journal of Spinal Disorders, 14: 479–86. Stevens, J. (1992) Applied Multivariate Statistics for the Social Sciences (2nd ed.) Lawrence Erlbaum, Hillsdale, N.J. Steyerberg E.W., Harrell F.E., Borsboom G.J. et al. (2001) Internal validation of predictive models. J Clin Epidemiol, 54: 774. Stovner L.J. (1996) The nosological status of the whiplash syndrome: a critical review based on a methodological approach. Spine, 21: 2735–2746. Stratford, P.W., Riddle, D.L., Binkley, J.M., Spadoni, G, Westaway, M.D., & Padfield, B. (1999) Using the Neck Disability Index to make decisions concerning individual patients. Physiotherapy Canada, 51: 107-12. Stucky C.L., Gold M.S., Zhang X (2001) Mechanisms of pain. Proc Natl Acad Sci, 98:11845–11846. Sullivan E.V., Rosenbloom M., Serventi K.L. et al. (2004) Effects of age and sex on volumes of the thalamus, pons, and cortex. Neurobiol Aging, 25: 185–192. Sunderland S. (1978) Nerve and nerve injuries. Churchill Livingstone, Edinburgh. Sundin E.C., and Horowitz M.J. (2003) Horowitz's Impact of Event Scale evaluation of 20 years of use. Psychosom Med, 65: 870–876. Sundin E.C., and Horowitz, M.J. (2002) Impact of Event Scale: psychometric properties. Br
J Psychiatry, 180: 205–209.

Szabo R, Chidgey L. (1989) Stress carpal tunnel pressures in patients with carpal tunnel syndrome and normal patients. J Hand Surg Am, 14: 624– 627. Tabachnick, B.G., and Fidell, L.S. (2001) Using Multivariate Statistics (4th ed.). New York: Harper Collins. Tamburrelli C, Salgarello T, Caputo CG, et al. (2000) Ultrasonographic evaluation of optic disc swelling: comparison with CSLO in idiopathic intracranial hypertension. Invest
Ophthalmol Vis Sci, 41(10): 2960–6. Takahashi, T., Svoboda, K., Malinow, R. (2003) Experience strengthening transmission by driving AMPA receptors into synapses. Science, 299: 1585–1588. Tenenbaum A, Rivano-Fischer M, Tjell C, et al. (2002) THE QUEBEC CLASSIFICATION AND A NEW SWEDISH CLASSIFICATION FOR WHIPLASH-ASSOCIATED DISORDERS IN RELATION TO LIFE SATISFACTION IN PATIENTS AT HIGH RISK OF CHRONIC FUNCTIONAL IMPAIRMENT AND DISABILITY. J Rehabil Med, 34: 114–118. Tighe J., McManus I.C., Dewhurst N.G. et al. (2010) The standard error of measurement is a more appropriate measure of quality for postgraduate medical assessments than is reliability: an analysis of MRCP(UK) written examinations, 2002‐2008, and specialty certificate examinations. BMC Medical Education, 10:40. Tran A, Rugh J D, Hatch J P, Chacon J A, An Y C (2002) Reliability and validity of a
computer –based little irregularity index. IADR/AADR/CADR 80th General Session, San Diego, USA. Tucker, A., White, P., Kosek, E. (2007) Comparison of vibration perception thresholds in individuals with diffuse upper limb pain and carpal tunnel syndrome. Pain, 127: 263–269. Tuijn, S. M., Janssens, F. J. G., Van den Bergh, H. et al. (2009) One judgment is not the other judgment: interrater reliability of inspectors of IGZ. [in Dutch] (Het ene oordeel is het andere niet: interinspecteursvariatie bij inspecteurs van de IGZ: een kwantitatieve analyse). Nederlands Tijdschrift Voor Geneeskunde, 322 (8), 326.
Tuijn, S. M., Van den Bergh, H., Robben, P. B. M. et al. (2009) The relation between standards and judgments in regulation of health care. [in Dutch] (De relatie tussen normen en oordelen in het toezicht op de gezondheidszorg). Tijdschrift Voor
Gezondheidswetenschappen, 6, 264–271. Tuijn, S. M., Robben, P. B. M., Janssens, F. J. G. & Van den Bergh, H. (2011) Evaluating instruments for regulation of health care in the Netherlands. Journal of Evaluation in
Clinical Practice, 17(3): 411–419. Turk, D.C., and Rudy, T.C (1990) The robustness of an empirically derived taxonomy of chronic pain patients. Pain, 43: 27–35. Twa M.D., Bailey, M.D., John H.J. et al (2004) Estimation of pupil size by digital photography. J Cataract Refract Surg, 30:381–389. van der Heide, B., Allison, G., Zusman, M. (2001) Pain and muscular responses to a neural tissue provocation test in the upper limb. Manual Therapy, 6: 154–162. van der Roer N., Ostelo R.W., Bekkering G.E. et al. (2006) Minimal clinically important change for pain intensity, functional status, and general health status in patients with nonspecific low back pain. Spine, 31(5):578-82. Velicer, W.F., and Fava, J.L. (1998) Effects of variable and subject sampling on factor pattern recovery. Psychological Methods, 3(2): 231-251. Velicer, W.F., and Jackson, D.N. (1990) Component analysis versus common factor analysis: Some issues in selecting an appropriate procedure. Multivariate Behavioral
Research, 25: 1–28. Verhagen A.P., Lewis, M., Schellingerhout, J.M. et al. (2011) Do whiplash patients differ from other patients with non-specific neck pain regarding pain, function or prognosis? Man
Ther, 16:452–62. Vernon, H. (1996) The neck disability index: patient assessment and outcome monitoring in whiplash. J Musculoskelet Pain, 4: 95-104.

Vernon, H., and Mior, S. (1991) The neck disability index: a study of reliability and validity. Journal of Manipulative Physiological Therapeutics, 14: 409–15. Voerman, V., van Egmond, J., Crul, B. (2000) Elevated detection thresholds for mechanical stimuli in chronic pain patients: support for a central mechanism. Arch Phys Med Rehabil, 81: 430–435. Volle E, Montazem A (2001) MRI video diagnosis and surgical therapy of soft tissue trauma to the craniocervical junction. Ear Nose Throat J, 80:41–48. Walter S.D., Eliasziw M., Donner A. (1998) Sample size and optimal designs for reliability studies. Statistics in medicine, 17: 101-110. Wainner R.S., Fritz J.M., Irrgang J.J. et al. (2003) Reliability and diagnostic accuracy of the clinical examination and patient self-report measures for cervical radiculopathy. Spine, 28:52–62. Wallin M.K.M. and Raak R.I.(2008) Quality of life in subgroups of individuals with whiplash associated disorders. European Journal of Pain, 12(7): 842-849. Watkins, L., and Maier, S. (2004) Neuropathic pain: The immune connection. Pain Clinical
Updates, 13: 1–4. WEIR, J.P (2005) QUANTIFYING TEST-RETEST RELIABILITY USING THE INTRACLASS CORRELATION COEFFICIENT AND THE SEM. Journal of Strength
and Conditioning Research, 19(1), 231–240. Wenzel, H.G., Mykletun, A., Nilsen T.I. (2009) Symptom profile of persons self-reporting whiplash: a Norwegian population-based study (HUNT 2). European Spine Journal, 18(9):1363-70. Wenzel H.G. Haug T.T. Mykletun A. Dahl A.A. (2002) A population study of anxiety and depression among persons who report whiplash traumas. Journal of Psychosomatic
Research, 53(3): 831-835. Wild T; Prinz M; Fortner N; Krois W; Sahora K; Stremitzer S; Hoelzenbein T (2008) Digital measurement and analysis of wounds based on colour segmentation. Eur Surg, 40(1): 5–10

Williams, Williamson E, Gates S, Lamb S, Cooke M, (2007) A Systematic Literature Review of Physical Prognostic Factors for the Development of Late Whiplash Syndrome. Spine, 32 (25): E764-E780. Williamson E, Williams M, Gates S, Lamb SEA (2008) Systematic literature review of psychological factors and the development of late whiplash syndrome. Pain, 135: 20–30 Willis, C., Niere, K., Hoving, J. et al. (2004)Reproducibility and responsiveness of the Whiplash Disability Questionnaire. Pain, 110(3): 681-688. Wismans KSHM, Huijkens CG (1994) Incidence and prevalence of whiplash injuries). TNO Road-Vehicle Research Institute, Delft, The Netherlands: TNO report in Dutch, R.B.V.041.1/JW Woodhouse, A., and Vasseljen, O. (2008) Altered motor control patterns in whiplash and chronic neck pain. BMC Musculoskeletal Disorders, 9:90. Woolf, C.J., Salter, M.W. (2000) Neuronal plasticity: increasing the gain in pain. Science, 288: 1765–1769. World Health Organization. ICF: International Classification of Functioning, Disability
and Health. Available from http://www.who.int/classification/icf (Accessed 2008). World Health Organization. International Classification of Functioning, Disability and
Health: ICF. Geneva: WHO; 2001. Wright T.W., Glowczewskie F., Wheeler D. et al. (1996) Excursion and strain of the median nerve. J Bone Joint Surg Am, 78A:1897–1903. Wright, A., Thurnwald, P., O'Callaghan, J. (1994) Hyperalgesia in tennis elbow patients. Journal of Musculoskeletal Pain, 2: 83–97. Ylinen, J, Nykanen, M, Kautiainen, H, and Hakkinen, A. (2007) Evaluation of repeatability of pressure algometry on the neck muscles for clinical use. Man Ther, 12: 192-197.

Yucel A, Senocak M, Kocasoy Orhan E, Cimen A, Ertas M. (2004) Results of the Leeds assessment of neuropathic symptoms and signs pain scale in Turkey: A validation study. J
Pain, 5: 427-432.
Yunus M.B. (2007) Fibromyalgia and overlapping disorders: the unifying concept of central sensitivity syndromes. Semin Arthritis Rheum, 36: 339–56.
Zigmond AS, Snaith RP (1983) The Hospital Anxiety And Depression Scale. Acta
Psychiatr Scand, 67: 361-70.
Zimmerman, C. Tansella, M.(1996) Psychosocial factors and physical illness in primary care: Promoting the biopsychosocial model in medical practice. Journal of Psychosomatic
Research, 40(4):351–358.