the canadian rockies and alberta network (crane): new ...ygu/publications/crane... · the...
TRANSCRIPT
The Canadian Rockies and Alberta Network (CRANE): New
Constraints on the Rockies and Western Canada Sedimentary Basin
Yu Jeffrey Gu, Ahmet Okeler, Luyi Shen, Sean Contenti
Department of Physics, University of Alberta, Edmonton, AB, T6G2G7, Canada.
(Phone: 780-492-2292; Email: [email protected])
Abstract
The Canadian Rockies and its neighboring Alberta basin mark the transition from the old
North American continental lithosphere (east) to young accreted ‘terranes’ (west).
Geologic, seismic and magnetic data in this region have suggested complex crustal
domains, conductive anomalies and major seismic velocity gradients in the mantle.
However, the nature of the boundaries between the basement domains and their vertical
extents remain controversial due to the lack of exposed geology and limited seismic and
electromagnetic receivers. Since 2006, the seismic data coverage and depth sensitivity
received a major boost from the establishment of the Canadian Rockies and Alberta
Network (nicknamed CRANE), the first semi-permanent broadband seismic array in
Alberta. The availability of the array data provides vital constraints on the regional
micro-earthquakes and crust/mantle seismic structures. Among the broad range of
ongoing efforts, this study highlights promising results from the analyses of P-to-S wave
receiver functions, shear wave splitting amplitudes/directions and ambient seismic noise.
Our preliminary receiver-function stacks show that the base of the crust gradually
shallows from approximately 60 km beneath the Rockies near the Canada-US border to

37-40 km beneath Central Alberta; the latter range is consistent with earlier findings from
active-source experiments. Converted waves from ‘littered’ crust and/or lithsophere have
also been detected at a number of stations in the depth range of 80-130 km. Complexities
in the lithosphere are further evidenced by our regional shear wave splitting
measurements. We observe a strong east-west change of mantle flow pattern, consistent
with present-day plate motion. The spatial distribution of the SKS orientations highlights
the contrasting crust/mantle structures and histories between the Rockies and its adjacent
domains. Dynamic effects associated with a migrating continental root east of the
province may be important. Finally, our preliminary inversions using ambient seismic
noise indicate 0.8+ km peak-to-peak group velocity variations throughout the crust. The
upper crust beneath the Alberta Basin is dominated by low Rayleigh-wave group
velocities. A lower-than-expected correlation between seismic velocities and tectonic
domain boundaries suggests significant tectonic overprinting in the southern Western
Canada Sedimentary Basin. Overall, the broadband seismic data from CRANE could
play a key role in uncovering the mysteries of the crust and mantle beneath the transition
region between cratons and terranes.
1. Introduction
The emergence of three-component, broadband seismic networks in recent years has
accelerated the progress in seismic monitoring and structural imaging. Equipped with
digital instruments sensitive to a wide frequency band (0.01-100 Hz), earthquake
seismologists no longer need to contend with analogue records or inaccurate readings
from microfiche machines. The exceptional global data quality and coverage from dense
temporary/permanent deployments, such as USArray (Continental US) and Hi-net/J-
Array (Japan), have overcome many conceptual and practical barriers in global
seismological data analysis. Consequently, the “global seismology community” can now
take greater advantage of methods predicated upon superior data density and distribution
(see Gu, 2009 for reviews).
Canada has traditionally been at the forefront of this era of improved seismic monitoring
and imaging. The success of the LITHOPROBE project, a trans-Canada experiment
initiated in 1995, marked a milestone in multi-scale, multi-disciplinary research efforts.
Continuously evolving array experiments in Yellowknife, British Columbia and Hudson
Bay have also been crucial in mapping regional seismicity and crust/mantle structure
under North America. Unfortunately, the data coverage within inland provinces such as
Alberta, Saskatchewan and Manitoba remains spotty. Most of the seismic experiments
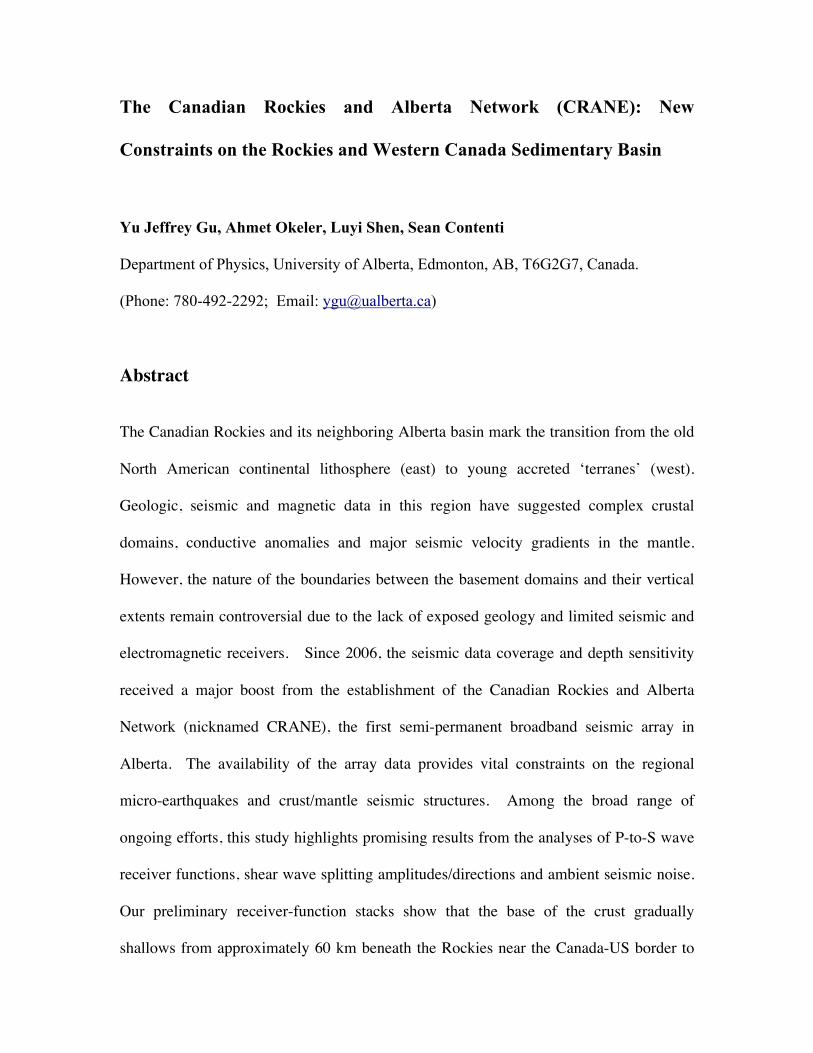
prior to 2005, e.g., LITHOPROBE (Clowes and collaborators), FLED (Fischer and
collaborators) and CANOE (Gaherty and collaborators) (Figure 1), adopted linear
receiver geometries that considerably under-sampled the southern part of the Western
Canada Sedimentary Basin (WCSB).
Since early 2006 the regional seismic data coverage has been improved significant by the
establishment of the Canadian Rockies and Alberta Network (nicknamed CRANE), the
first semi-permanent broadband seismic array in Alberta and parts of Saskatchewan,
Canada. Continuous seismic signals from this array show great promise in resolving the
details of regional seismicity and crust/mantle structures. Important inferences could be
made, despite the early stage of the data analysis, regarding the tectonic history and
dynamics of the northern Rockies and WCSB. This study aims to provide an overview
of the array and some of the early findings based on the data collected during the past 3
years.
2. Array Setup and Seismic Data Acquisition
The deployment of CRANE stations began in late 2005 under the funding support of the
Canadian Foundation for Innovation (CFI) and the University of Alberta (from here on,
the U of A). Six broadband seismic instruments were initially acquired and installed in
central and southern Alberta, mostly on private land relatively removed from cultural and
industrial noise. The array has since been expanded to 18 stations and presently forms a
semi-uniform grid with an average station spacing of ~150 km (see Figure 1). Site
selections were made based on 1) distance from the two operational permanent CNSN
(Canadian National Seismic Network) stations EDM and WALA in Alberta, 2) local
topography and soil characteristics, 3) all-season road access and security, and finally 4)
level of cultural noise associated with traffic and power lines.
The majority of the CRANE stations are equipped with three-component (east-west,
north-south and vertical) Trillium 240 and 120 seismometers (manufactured by
Nanometrics Inc.) with relatively flat responses between corner frequencies of 0.005-0.01
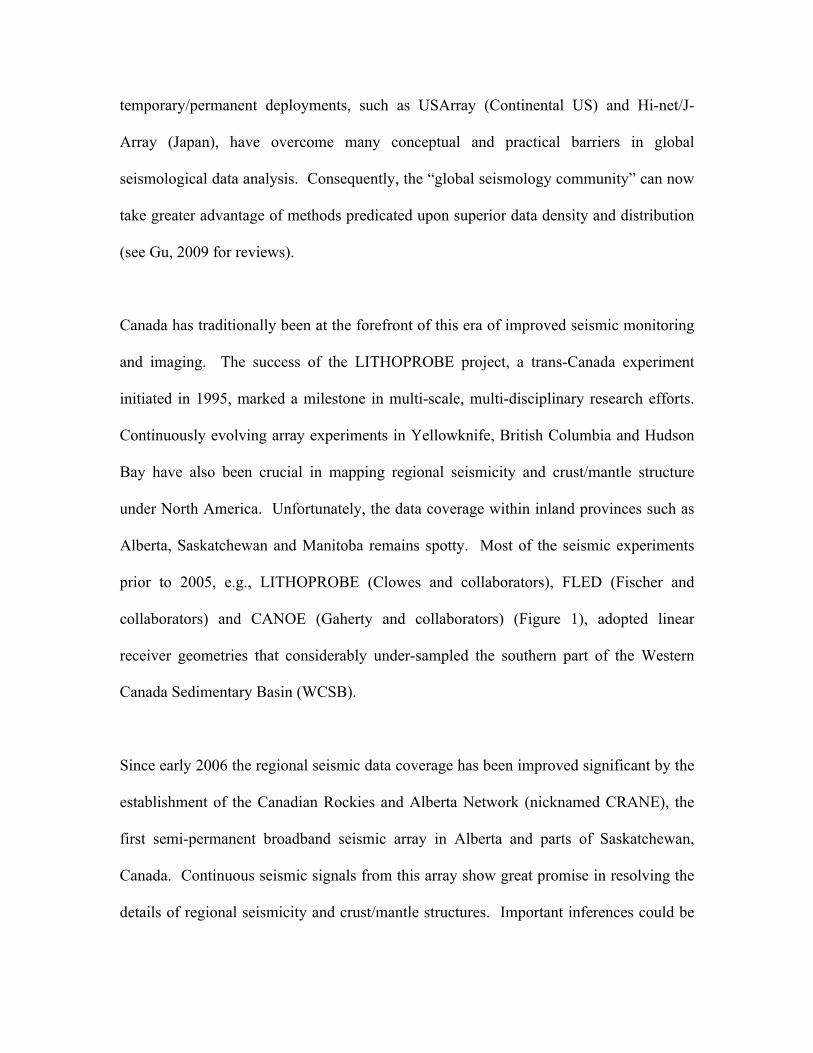
Hz (low) and 100+ Hz (high). Each seismometer is connected to a digitizer (Taurus,
Nanometrics Inc.) (Figure 2) where the sample rate is generally set at 20 Hz.
Seismometers and digitizers are housed within separate underground vaults, powered by
30-80 W solar panels connected to 12V rechargeable batteries; see Figure 2 for a
schematic diagram of this self-sustaining system. These ~1.5 m. deep vaults are sealed
and well insulated to 1) protect against water or animal-related damages, 2) reduce
instrument noise associated with severe diurnal temperature changes, and 3) maintain the
functionality of compact flashcards (4-8 Gigabytes) during the harshest winter
conditions. Despite our extensive efforts to optimize site selection and installation, one
of the original sites (REC) had to be relocated after ~8 months due to severe ground
distortion in response to frost heaves.
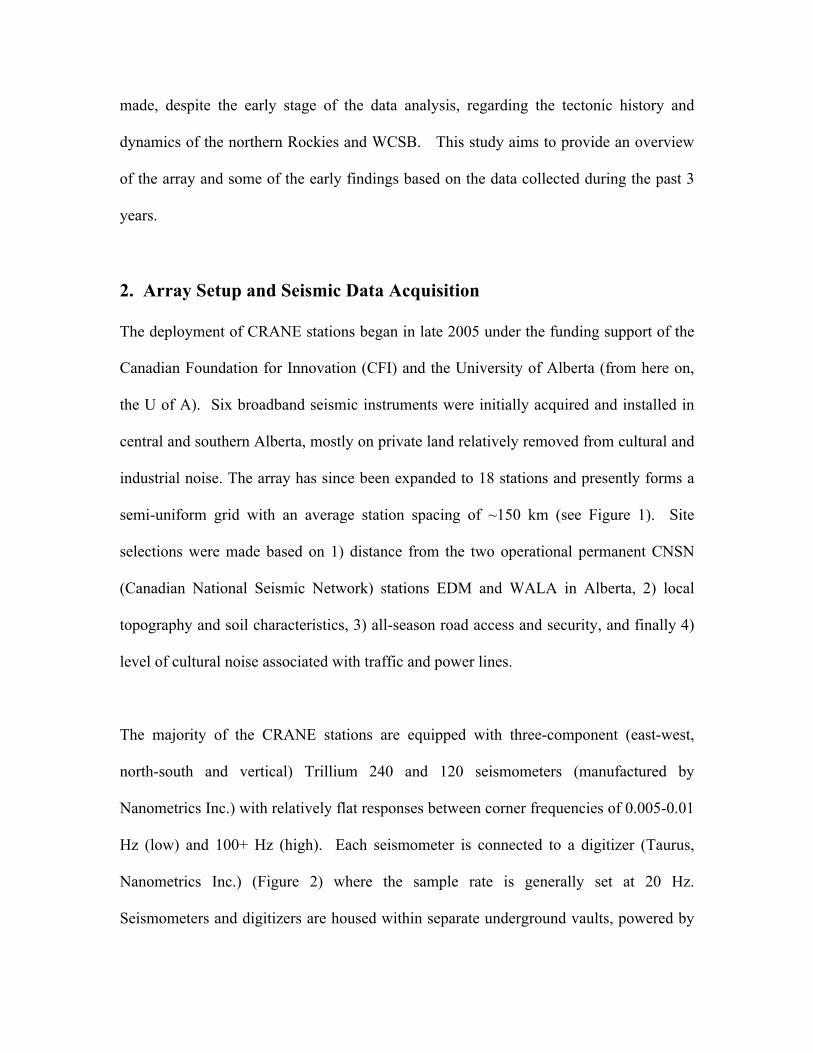
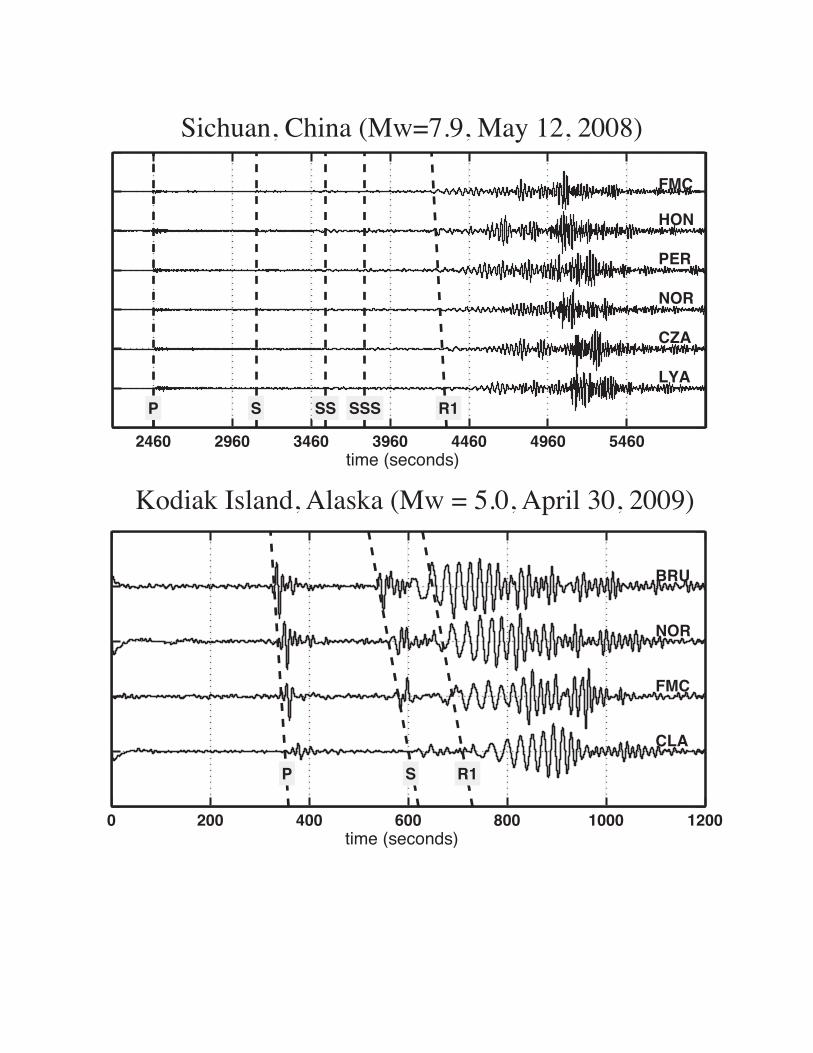
Most of the CRANE stations have been operating continuously since early 2007,
recording more than 500 Mw>5 earthquakes over the past 3+ years. Figure 3 shows
sample waveforms from a devastating Mw 7.9 earthquake (Sichuan, May 2008) and a
modest Mw 5.0 earthquake in Alaska (Apr 2009). In both cases, body (P and S) and
surface wave arrivals are consistently identified on the vertical-component seismograms.
Due to shallow vault depths, the quality of the horizontal component at most of the
CRANE stations is adversely affected by noise associated with local weather conditions.
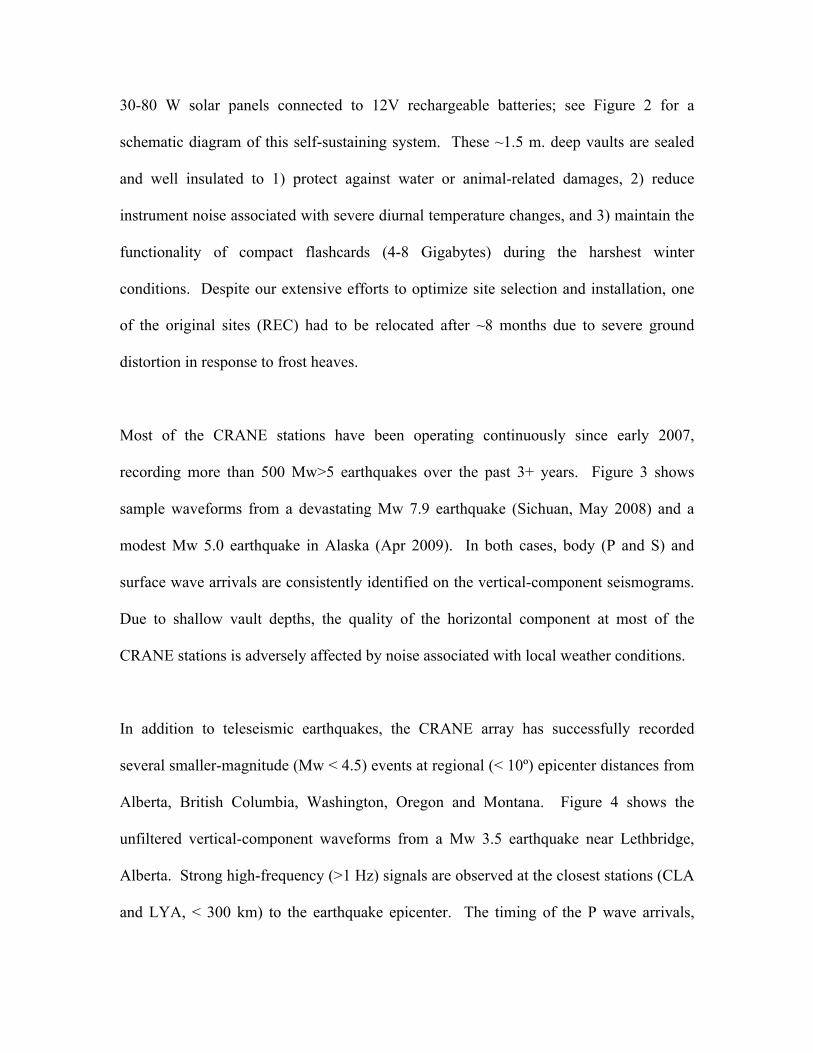
In addition to teleseismic earthquakes, the CRANE array has successfully recorded
several smaller-magnitude (Mw < 4.5) events at regional (< 10º) epicenter distances from
Alberta, British Columbia, Washington, Oregon and Montana. Figure 4 shows the
unfiltered vertical-component waveforms from a Mw 3.5 earthquake near Lethbridge,
Alberta. Strong high-frequency (>1 Hz) signals are observed at the closest stations (CLA
and LYA, < 300 km) to the earthquake epicenter. The timing of the P wave arrivals,
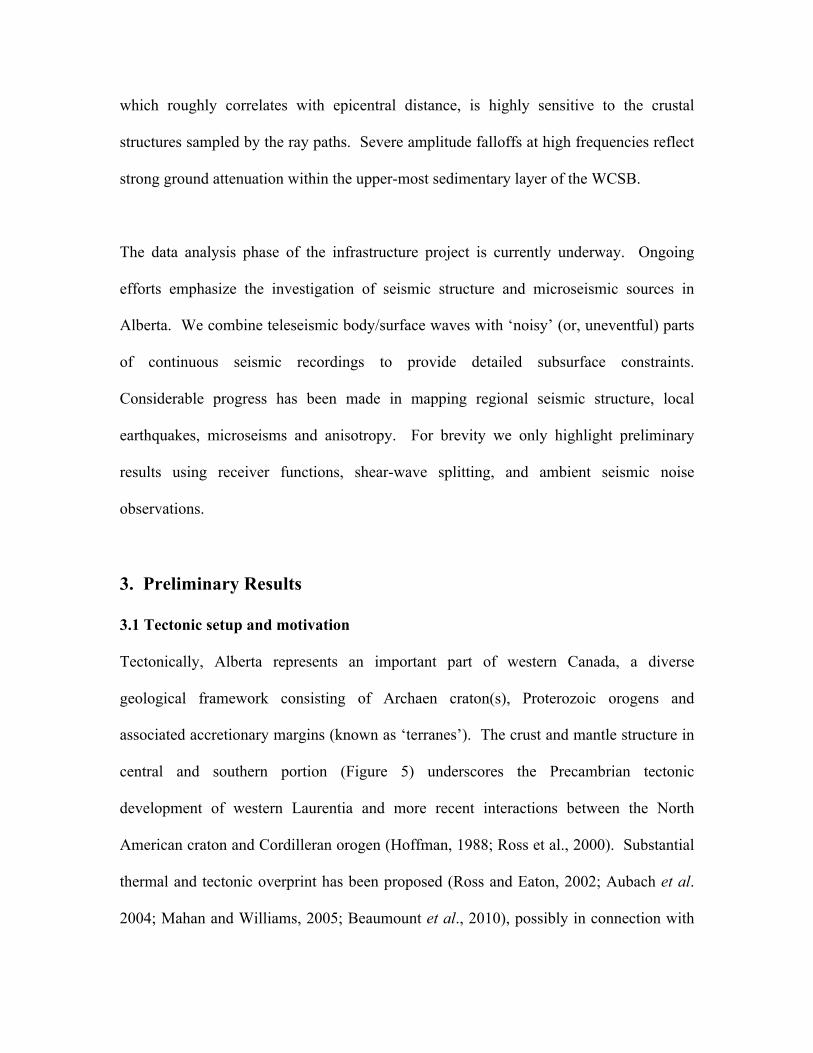
which roughly correlates with epicentral distance, is highly sensitive to the crustal
structures sampled by the ray paths. Severe amplitude falloffs at high frequencies reflect
strong ground attenuation within the upper-most sedimentary layer of the WCSB.
The data analysis phase of the infrastructure project is currently underway. Ongoing
efforts emphasize the investigation of seismic structure and microseismic sources in
Alberta. We combine teleseismic body/surface waves with ‘noisy’ (or, uneventful) parts
of continuous seismic recordings to provide detailed subsurface constraints.
Considerable progress has been made in mapping regional seismic structure, local
earthquakes, microseisms and anisotropy. For brevity we only highlight preliminary
results using receiver functions, shear-wave splitting, and ambient seismic noise
observations.
3. Preliminary Results
3.1 Tectonic setup and motivation
Tectonically, Alberta represents an important part of western Canada, a diverse
geological framework consisting of Archaen craton(s), Proterozoic orogens and
associated accretionary margins (known as ‘terranes’). The crust and mantle structure in
central and southern portion (Figure 5) underscores the Precambrian tectonic
development of western Laurentia and more recent interactions between the North
American craton and Cordilleran orogen (Hoffman, 1988; Ross et al., 2000). Substantial
thermal and tectonic overprint has been proposed (Ross and Eaton, 2002; Aubach et al.
2004; Mahan and Williams, 2005; Beaumount et al., 2010), possibly in connection with
the Trans-Hudson Orogen east of this region (see Figure 5) (Hoffman, 1988; Banks et al.,
1998; Zelt and Ellis, 1999). The western edge of the sedimentary basin is demarcated by
the Canadian Rockies, a part of the Western Cordillera likely formed in late Cretaceous
and early Tertiary during the Laramide orogeny (Livaccari et al., 1981; Bird, 1998;
Maxson and Tickoff, 1996; Cook et al., 2002; English and Johnson, 2010; Liu et al.,
2010). While regionally deep Moho interfaces have been observed and interpreted as the
isostatic response to loading of the lithosphere by Mesozoic thrust sheets (e.g., Price,
1981; Cook, 1995, 2002), the cause of the Laramide phase of mountain building and its
effect on crust/lithosphere thickness remains uncertain (Liu et al., 2010; English and
Johnson, 2010).
Evidence from regional gravity, magnetic and seismic surveys (see Ross, 2000 and
references there in; van der Lee and Frederiksen, 2005; Marone and Romanowicz, 2007;
Courtier et al., 2010; Yuan and Romanowicz, 2010) suggest the presence of major
seismic velocity gradients and shear wave anisotropy beneath a broad spectrum of
tectonic domains (e.g., Buffalo Head, Wabamum, Thorsby, Lacombe Eyehill and
Loverna (Hoffman, 1988; Ross et al., 2000; Clowes et al., 2002)) (see Figure 5). The age
and origin of these domains and the extent of tectonic overprinting (e.g., Ross and Eaton,
2002) remain questionable. A key objective of our research is to reach a better
understanding of the boundary and vertical extent of surface tectonics through the depths
of crust/mantle interfaces, anisotropy and wave speeds.
3.2 Moho imaging using receiver functions
Among the various approaches we select P-to-S converted waves as a baseline constraint
on deep-crustal and shallow-mantle stratigraphy. The use of converted waves, both P-to-
S and S-to-P, as an imaging tool has an extensive history dating back to the mid 1970’s
(e.g., Vinnik, 1977; Langston, 1979; Gurrola et al., 1994; Yang et al., 1996; Zhu and
Kanamori, 2000; see also Rondenay, 2010 for a detailed review). In a nutshell, a body
wave encountering a discontinuity in material properties is partitioned into transmitted
and reflected waves. The arrival time difference between the direct P wave and a
subsequent conversion or reverberation is a sensitive indicator of the seismic velocity
structure between the interface and receiver.
We construct a waveform database with 500+ Mw>5 earthquakes recorded between 2007
and 2009 (Figure 6a). All earthquake-station pairs are restricted to the epicentral distance
range of 30-90 deg and the distribution of source-receiver paths shows a dominant
northwest-southeast orientation (Figure 6b). Displacement seismograms from each event
are filtered between corner frequencies of 0.04-1.0 Hz, a range that includes signals from
both crust and mantle interfaces. At the final stage of data preparation, the two horizontal
(East-West, North-South) components are rotated to radial and transverse orientations
based on station back-azimuths. We then compute radial receiver functions for all
stations through a water-level deconvolution approach (Ammon et al., 1990; Ammon,
1991). For the preliminary analysis we adopt a water level of 0.02, which is determined
through trial-and-error based on the noise level of a typical Mw 5.5 earthquake record. A
Gaussian filter with a pulse width of 1.5 is subsequently applied to suppress high-
frequency noise further.
Figure 7 shows the receiver functions for the available CNSN and CRANE stations after
stacking over all azimuths. We convert these time-domain receiver functions to depth
based on PREM (Dziewonski and Anderson, 1981), which provides a first-order
approximation for the depths of crust and mantle reflectors in the absence of more
accepted regional P or S velocity models. If one assumes a travel time uncertainty of 1
sec and an epicentral distance of 60-deg, a net velocity perturbation of 2 km/sec (1
km/sec increase in mantle P velocity and 1 km/sec decrease in lower-crustal S velocity
relative to PREM) will displace the Moho interface by ~2.6 km using the perturbation
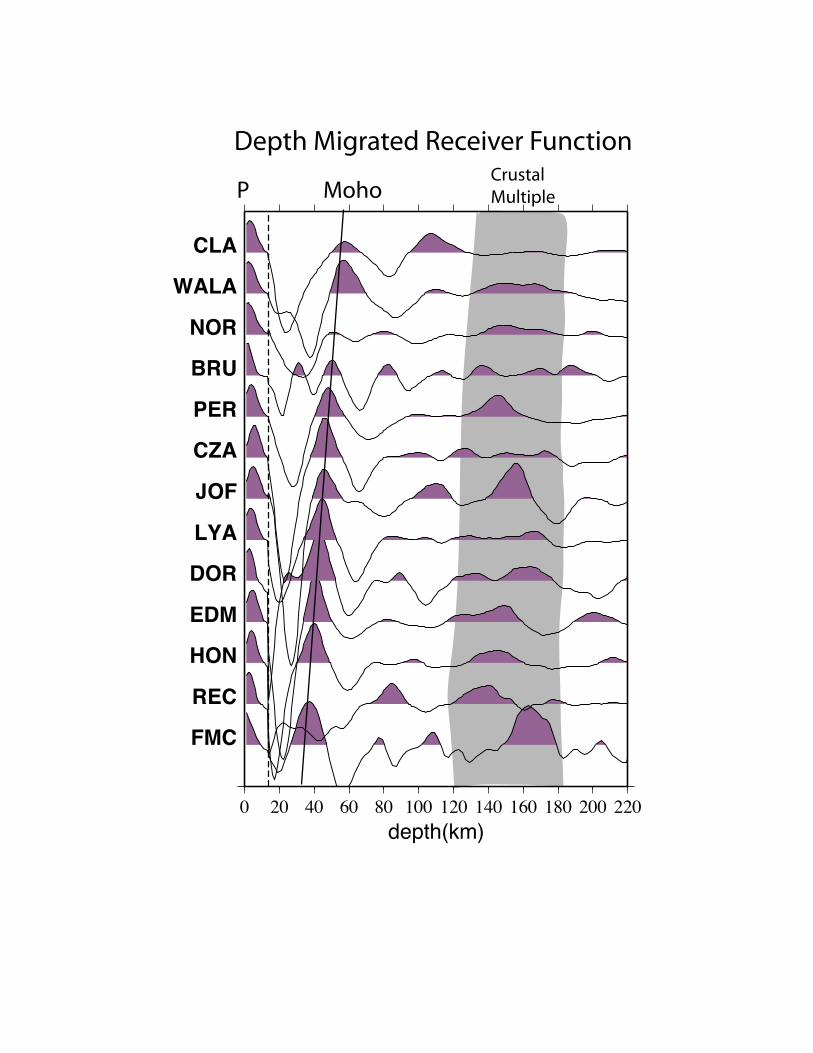
theory introduced by Dziewonski and Gilbert (1976). With the exception of REC, which
has a sizeable transverse-component signal, conversions from the crustal interface (for
short, Pms, m for Moho) are clearly detected at depths ranging from 35 km beneath the
northern part of the array (FMC) to 58 km beneath the southernmost station (WALA).
The amplitude of Pms generally decreases towards the Rocky Mountain foreland, where
a dipping Moho interface (Cassidy, 1992) and/or anisotropy with a non-horizontal axis of
symmetry (Levin and Park, 1997) could be important. Significant timing (near 0 sec) and
pulse width variations of P phase on the radial receiver functions (see Figure 7) indicate
slower, more complex radial-component signal relative to the vertical. Similar
observations have generally been attributed to low-velocity sedimentary layers beneath
seismic receivers (Cassidy, 1992; Sheehan et al., 1998; Zelt and Ellis, 1999). Depending
on the thickness of this sedimentary layer, Pms at the base of this low-velocity layer
could interfere with the direct P phase and cause a ~1-sec delay on radial receiver
functions (Sheehan et al., 1998; Mangino and Priestley, 1998). Our preliminary results

are consistent with the general outline of the sedimentary basin: for example, Pms under
mountainous regions (e.g., BRU, NOR, WALA) take place at significantly shallower
depths than the surrounding regions within the southern WCSB (e.g., EDM, JOF, HON,
CZA) (see Figure 7). The maximum delay time (0.8 sec) of radial-component P phase is
observed at station CZA, which translates to a sediment thickness of ~6 km based on
PREM (Dziewonski and Anderson, 1981) velocities.
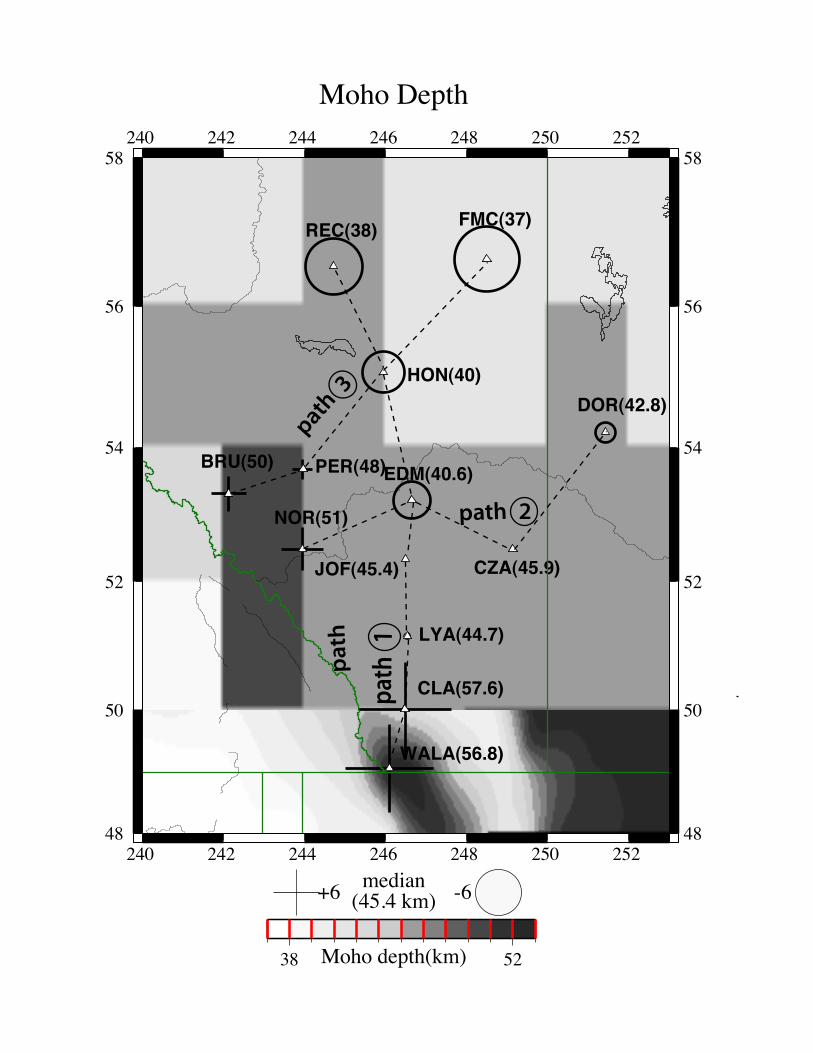
The depth variation of the Moho interface from the CRANE stations improves the lateral
resolution of existing regional models. A comparison with Crust2.0 (Bassin et al., 2000;
Figure 8), a 2 deg x 2 deg global model, shows remarkable consistency despite apparent
resolution differences. For instance, the crust is nearly ~50 km thick underneath the
Rockies north of 52-deg longitude, as suggested by BRU and NOR. The Moho depths
beneath the central Alberta basin range from 37 to 41 km, which are within 2 km of the
values reported by CRUST2.0 and regional refraction/reflection surveys (Bouzidi et al.
2002).
Semi-linear cross-sections (see Figure 8 for orientations) show coherent trends in Moho
depths (Figure 9). The crust thickens from north to south along Paths 1 and from west to
east at low latitudes along Path 2. The deepest crustal root (~58 km, WALA) is identified
near the southern tip of the Canadian Rockies, which is consistent with regional estimates
using exploration (SARAX, Clowes et al., 2002) and USArray (Levander and Miller,
2010) data; values from all three studies are ~10 km thicker than that of CRUST2.0 (40-
45 km, not plotted). An anomalously thick and seismic fast crust beneath southernmost
Alberta has been attributed to (1) proterozoic underplating of a fast, lower crustal layer
(Clowes et al., 2002), and (2) subduction of the Shasky and Hess ocean plateaus during
the Laramide phase of the mountain building (Livaccari et al., 1981; Liu et al., 2010).
Mafic igneous rocks with relatively high density and seismic velocity (Lemieux et al.,
2000; Mueller et al., 2001; Clowes et al., 2002), stishovite-structured silica originated by
the post-stishovite phase transition within the subducted mid-ocean-ridge basalts
(Carpenter et al., 2000), and eclogization of the mafic lower crust (Hynes and Snyder,
1995; Fischer, 2002), may further contribute to the enhanced lower-crustal seismic
velocities in the latter hypothesis. On the other hand, consistently thick crust beneath the
mountain belt appears to favor a mechanism that is inherent to the formation and
evolution of the northern Rockies.
Moho depth variations from receiver function analysis could aid our efforts in mapping
the crustal domains within the Alberta basin. On average, the crust is ~5 km thicker
under the proposed southern edge of the Loverna Block (~51-deg latitude, near JOF,
LYA and CZA) than the Locombe domain (Clowes et al., 2002; Cook et al., 2002; Cook
et al., 2010). The crustal root continues to shallow under the juxtaposed Precambrian
domains consisting of Rimbey, Taltson, and Buffalo Head (near FMC and REC). The
thickness differences between these domains (2-5 km) fall below the statistical
measurement uncertainties (1-2 km) and are highly consistent with reported values from
earlier active source experiments (see Bouzidi et al., 2002; Clowes et al., 2002; Cook et
al., 2002).
3.3 Seismic anisotropy
Similar to crustal thickness variations, surface tectonics could have far reaching
implications for the understanding of seismic anisotropy. Due to an extensive strain
history that includes episodes of faulting, magmatism, accretion and subduction
(Hoffman, 1988; Ross et al., 2000), permanent deformation would be expected below
WCSB at mantle depths and a direct consequence is seismic anisotropy, where olivine’s
crystollographic fast axis is preferentially aligned with the direction of maximum shear
or least compression.
In this phase of the array analysis we select multiple magnitude Mw > 6.5 earthquakes
recorded at every CRANE station and examine SKS splitting (Bowman and Ando, 1987;
Silver and Chan, 1991; Menke and Levin, 2003; Gu et al. 2009), a phenomenon often
interpreted as the consequence of anisotropy similar to optical birefringence of minerals
under polarized light (see review by Long and Silver, 2009). The splitting parameters,
which consist of delay time (between the fast and slow shear waves) and fast polarization
azimuth, directly reflect the strength and direction of anisotropy. In this analysis each
measurement is made based on the cross-convolution method for multiple earthquakes
(Menke and Levin, 2003), and then independently confirmed by the rotation correction
method (Bowman and Ando, 1987), minimum energy method (Silver and Chan, 1991)
and eigenvalue method (Silver and Chan, 1991). The majority of the stations are
constrained by more than 10 earthquakes, with the glaring exception of HYLO where
only one earthquake is available due to a late deployment schedule. Both single- and
two-layer anisotropy are considered for each station based on waveform correlations.
Finally, the delay times and azimuth uncertainties are determined by a bootstrap re-
sampling algorithm (Efron and Tibshirani, 1991) using randomly selected subsets of
earthquakes.
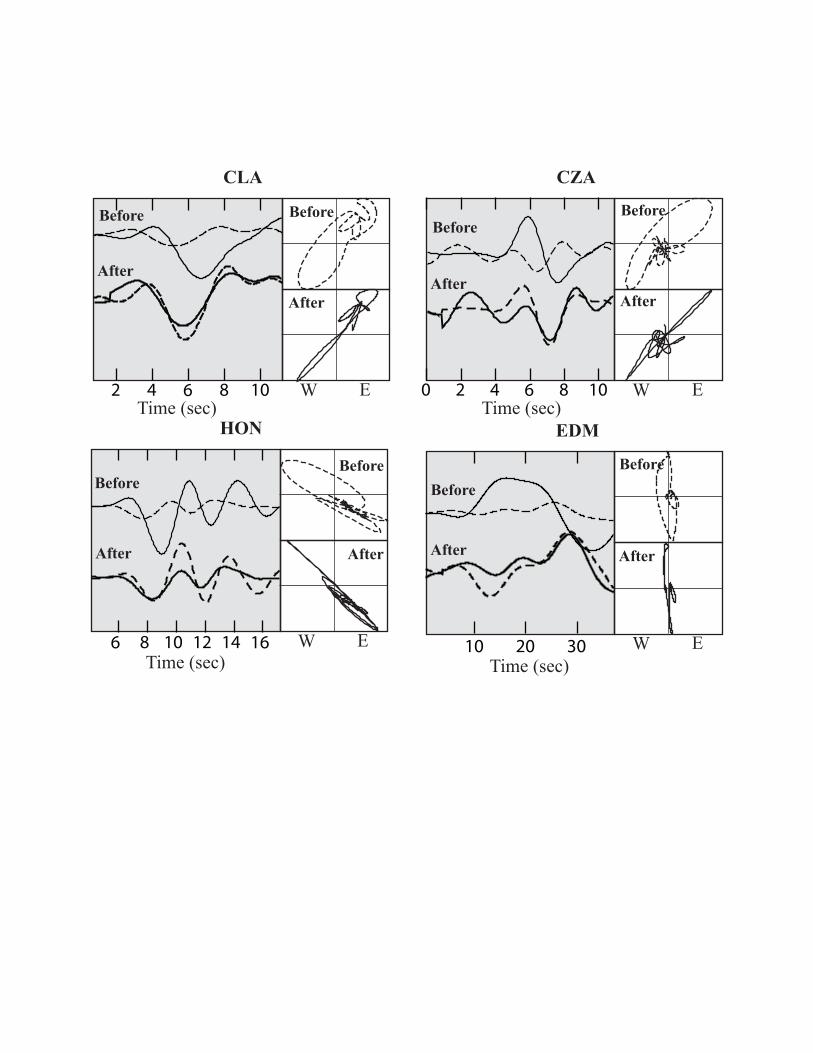
Our preliminary analysis of the CRANE array data shows clear evidence of shear wave
splitting. The particle motions for SKS phases after correcting for anisotropy are
approximately linear, as would be expected for an isotropic mantle (Figure 10). Splitting
parameters vary systematically across the CRANE array (Figure 11): The majority of the
measurements along the Rocky Mountain foothills (e.g., CLA, LYA, NOR, BRU) is
oriented along a northwest-southeast orientation and shows consistently large (~1.5-1.9
sec) time delays; in comparison, substantially lower splitting time delays are observed
beneath eastern-central Alberta where the fast axes appear tangential to a north-south
trending ellipse centered at 200-300 km northeast of Edmonton.
The splitting parameters in the vicinity of the Canadian Rockies suggest strong ‘order’ in
mantle mineralogy (Long and Silver, 2009). The northeast-southwest trending fast
direction is consistent with previously reported values utilizing Lithoprobe data (Shragge
et al., 2002 and the direction of maximum horizontal stress – a proxy for the ‘fossil’
strain field within the lithosphere in response to the past episodes of northwest-southeast
plate convergence and subduction of Farallon and Kula plates (e.g., Helmstaedt and
Schulze, 1989; Ross et al. 2000). The combination of pre-existing fabric within the
mantle lithosphere and the present-day absolute plate-motion that is, coincidentally,
northeast-southwest, offers an attractive explanation for the large SKS delays and 3-6%
azimuthal anisotropy in this region. Without further data constraint it is difficult to
resolve the full history of mantle deformation or the number of anisotropic layers (e.g.,
Shragge et al. 2002; Marone and Romanowicz, 2007), however.
The origin of the complex shear-wave splitting pattern beneath eastern-central Alberta
remains unclear. It could potentially be linked to the adjacent Buffalo Head Terrane, a
region that has attracted national attention in recent years due to the discovery of precious
minerals. The vicinity of the anisotropic anomaly exhibits enhanced heat-flow
(Blackwell and Richards, 2004) and below-average seismic velocity (van der Lee and
Frederiksen, 2005) and bouguer gravity values. The presence of a divot (Fouch et al.,
2000) or an abandoned plume conduit (Bank et al., 1998) on the continental root offers a
viable explanation. On a local scale, geometrical imperfection associated with past plate
interactions could trap hot asthenospheric material and disrupt the mantle flow around it.
Within a larger tectonic framework, the anomalous shear-wave splitting observations in
eastern-central Alberta could signal a hidden tectonic boundary between stable continents
(east/northeast) and accreted terranes (west). For instance, streamlined mantle flow
around the edges of moving continental `keels' (e.g., Gaherty and Jordan, 1995; Ben
Ismail and Mainprice, 1998; Bokelmann and Silver, 2002) can induce strong north-south
oriented horizontal strain. In other words, shear deformation base of the lithosphere
(~200 km) and disrupted flow at shallower depths could both be present, hence producing
complex, multi-layered anisotropy in this region. Furthermore, due to the substantial
topographical relief on the base of the lithosphere (Hyndman et al., 2005), both radial and
azimuthal anisotropy would be expected in this transitional region.
The aforementioned shear wave splitting results show only an integral component of our
infrastructure project. Interpretations aside, the data from CRANE present a window of
opportunity to visualize the present state and geometry of the continental lithosphere.
Expected outcomes of the ongoing research efforts may ultimately contribute to the
discussion of the mechanism(s) by which lithosphere evolves from thin convergent
margins to thick, depleted continental roots.
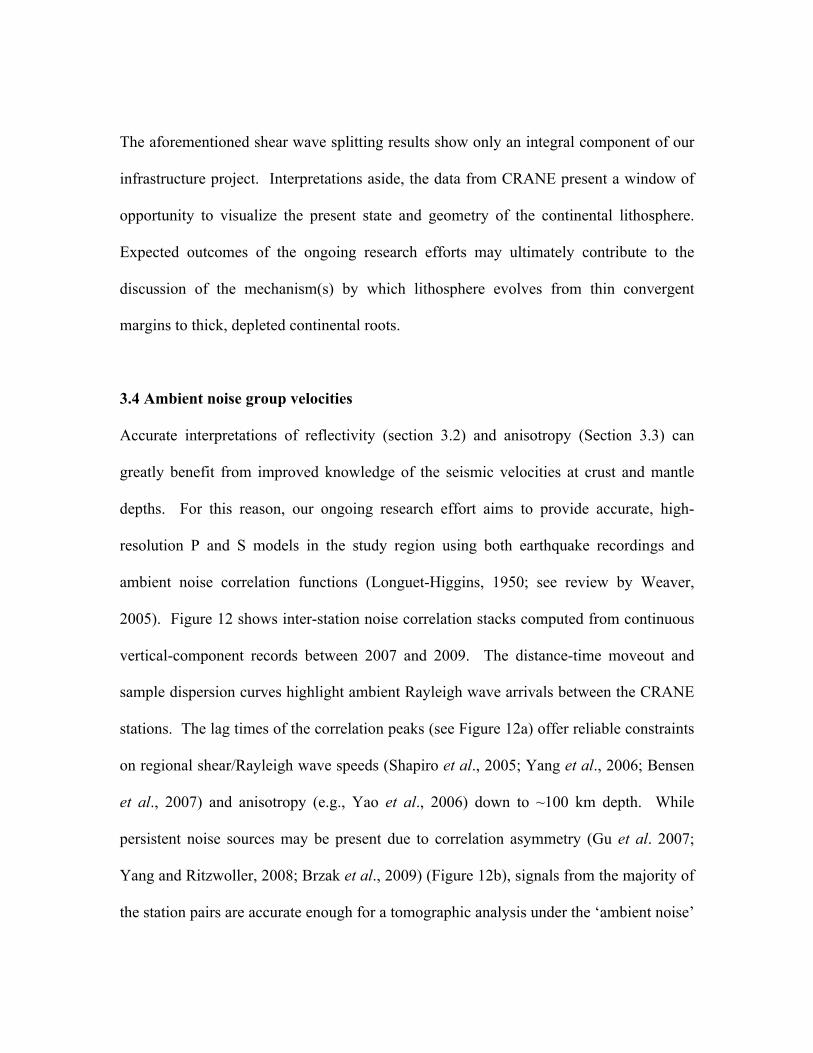
3.4 Ambient noise group velocities
Accurate interpretations of reflectivity (section 3.2) and anisotropy (Section 3.3) can
greatly benefit from improved knowledge of the seismic velocities at crust and mantle
depths. For this reason, our ongoing research effort aims to provide accurate, high-
resolution P and S models in the study region using both earthquake recordings and
ambient noise correlation functions (Longuet-Higgins, 1950; see review by Weaver,
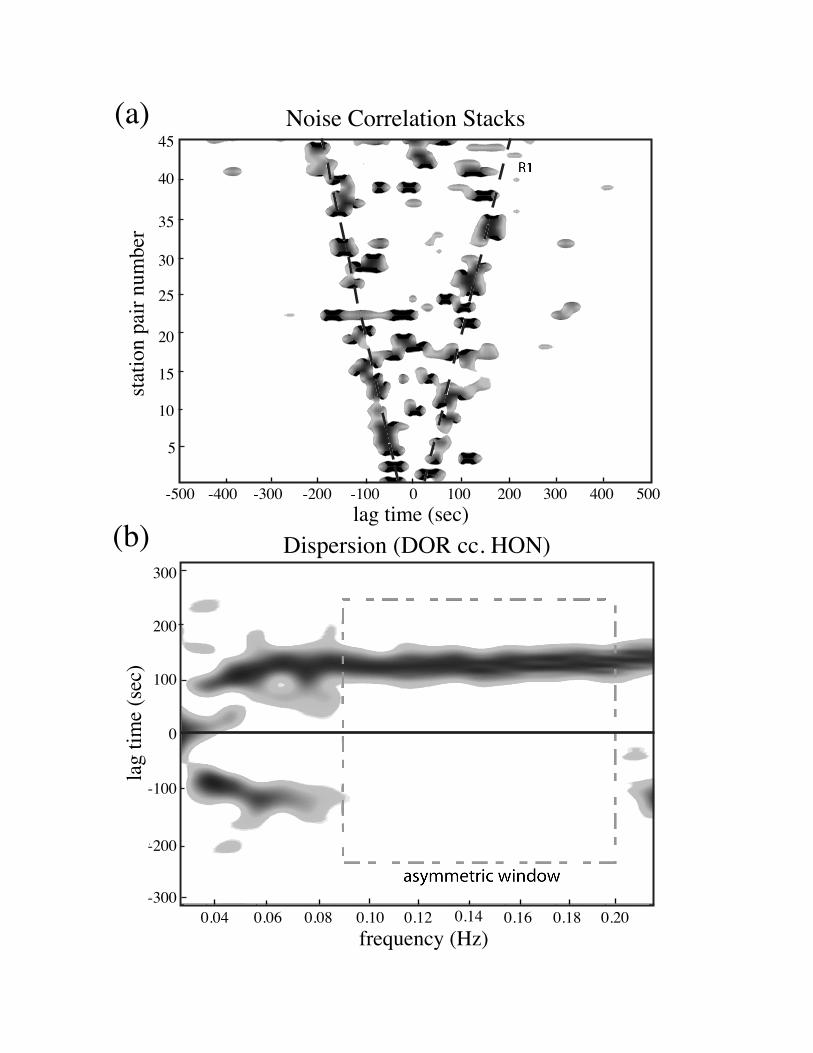
2005). Figure 12 shows inter-station noise correlation stacks computed from continuous
vertical-component records between 2007 and 2009. The distance-time moveout and
sample dispersion curves highlight ambient Rayleigh wave arrivals between the CRANE
stations. The lag times of the correlation peaks (see Figure 12a) offer reliable constraints
on regional shear/Rayleigh wave speeds (Shapiro et al., 2005; Yang et al., 2006; Bensen
et al., 2007) and anisotropy (e.g., Yao et al., 2006) down to ~100 km depth. While
persistent noise sources may be present due to correlation asymmetry (Gu et al. 2007;
Yang and Ritzwoller, 2008; Brzak et al., 2009) (Figure 12b), signals from the majority of
the station pairs are accurate enough for a tomographic analysis under the ‘ambient noise’
assumption (see Weaver, 2005).
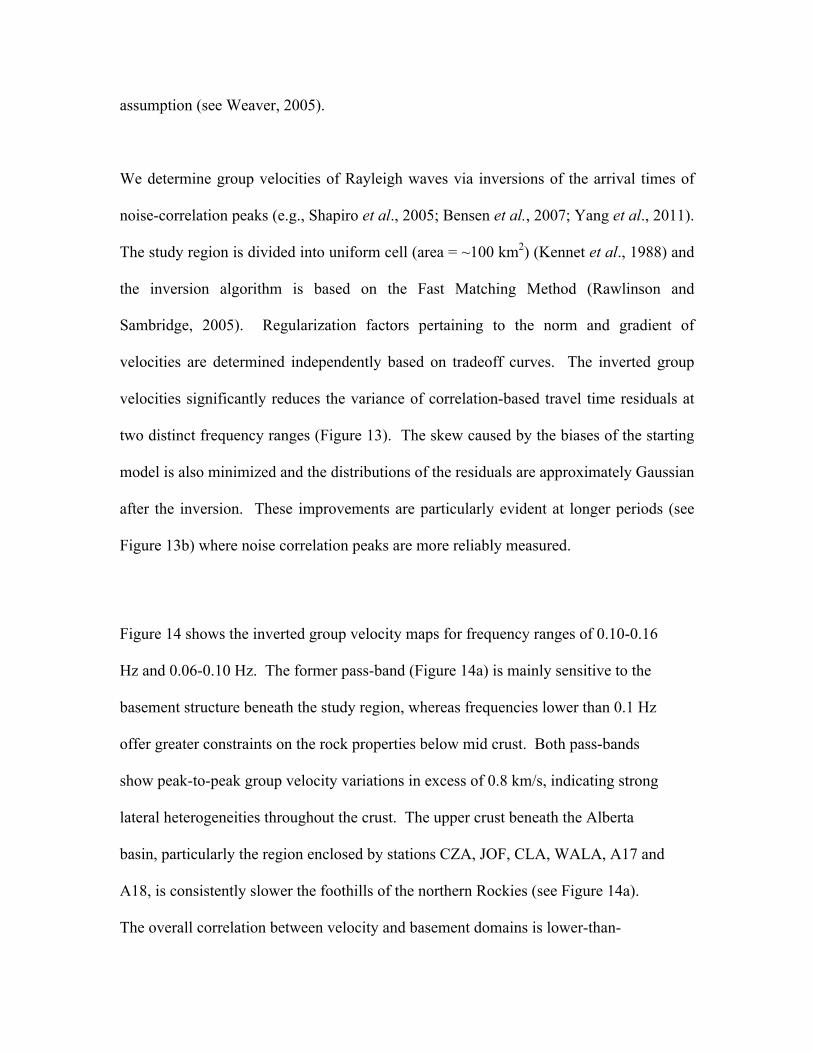
We determine group velocities of Rayleigh waves via inversions of the arrival times of
noise-correlation peaks (e.g., Shapiro et al., 2005; Bensen et al., 2007; Yang et al., 2011).
The study region is divided into uniform cell (area = ~100 km2) (Kennet et al., 1988) and
the inversion algorithm is based on the Fast Matching Method (Rawlinson and
Sambridge, 2005). Regularization factors pertaining to the norm and gradient of
velocities are determined independently based on tradeoff curves. The inverted group
velocities significantly reduces the variance of correlation-based travel time residuals at
two distinct frequency ranges (Figure 13). The skew caused by the biases of the starting
model is also minimized and the distributions of the residuals are approximately Gaussian
after the inversion. These improvements are particularly evident at longer periods (see
Figure 13b) where noise correlation peaks are more reliably measured.
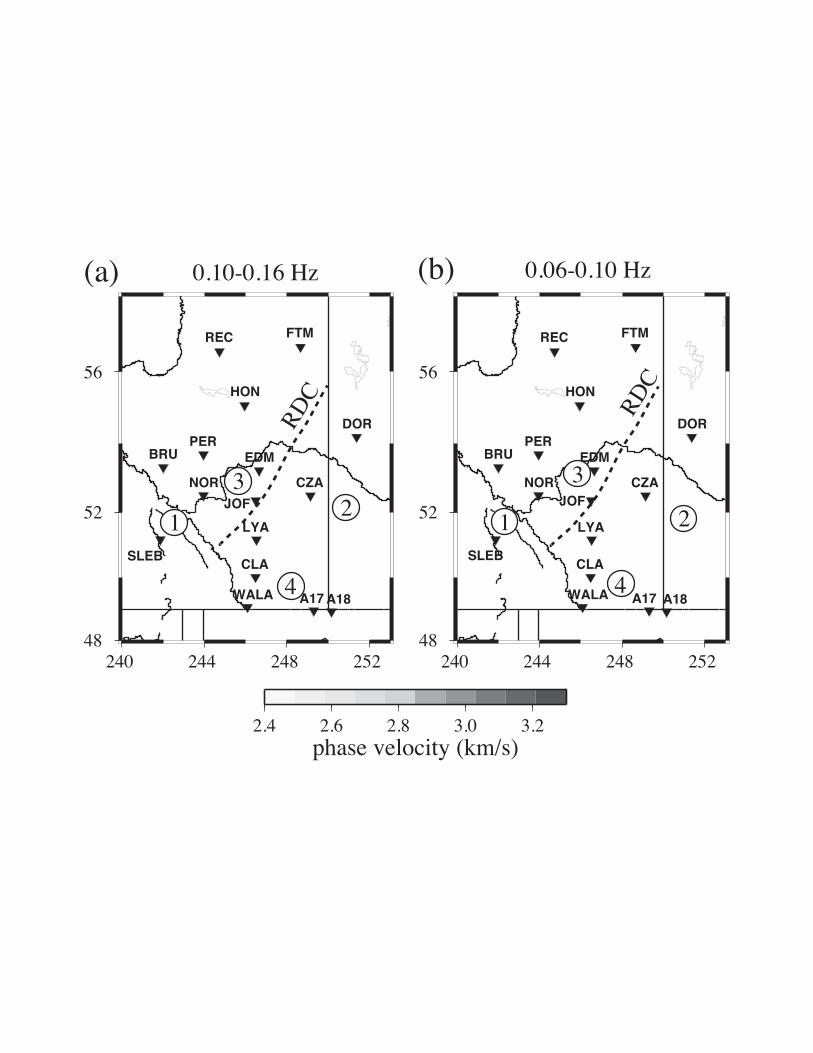
Figure 14 shows the inverted group velocity maps for frequency ranges of 0.10-0.16
Hz and 0.06-0.10 Hz. The former pass-band (Figure 14a) is mainly sensitive to the
basement structure beneath the study region, whereas frequencies lower than 0.1 Hz
offer greater constraints on the rock properties below mid crust. Both pass-bands
show peak-to-peak group velocity variations in excess of 0.8 km/s, indicating strong
lateral heterogeneities throughout the crust. The upper crust beneath the Alberta
basin, particularly the region enclosed by stations CZA, JOF, CLA, WALA, A17 and
A18, is consistently slower the foothills of the northern Rockies (see Figure 14a).
The overall correlation between velocity and basement domains is lower-than-

expected, however, suggesting significant tectonic overprinting since the formation
of these domains (e.g., Ross and Eaton, 2002; Beaumount et al., 2010). Low seismic
velocities are further identified beneath the Wabamum domain, the Taltson
Magmatic Belt, and the northern Rockies southwest of the Thorsby domain (see
Figure 5 and Hoffman, 1988 and Ross et al., 1991). Among them, the anomaly
beneath station SLEB (labeled ‘1’ in Figure 14) extends well below mid crust, as
suggested both by Figure 14b and by frequencies lower than 0.03 Hz (not shown).
Geographically, this structure resides directly west of the proposed Cordilleran
Deformation Front by Mercier et al. (2009) and supports a sharp transition from fast
(east of the boundary) to slow (west of the boundary) lower-crust and upper-mantle
wave speeds. Unfortunately, a direct velocity comparison of velocities is not
possible due to a visible gap in data coverage in Mercier et al. (2009). Further east,
our model shows consistently high shear velocities beneath the southeastern
provincial boundary between Alberta and Saskatchewan (labeled ‘2 ‘ on Figure 14).
The crust and lithospheric mantle beneath this region could be dominated by rocks of
Archean (or reworked Archean) age (e.g., Ross et al., 1991; Shragge et al., 2002), as
suggested by sharply increased mantle velocities in recent models of high-resolution
seismic tomography (see Figure 11; van der Lee and Frederiksen, 2005; Nettles and
Dziewonski, 2008).
Interpretations of some of the heterogeneous structures from this preliminary study
(see Figure 14, labeled ‘3’ and ‘4’) could be more controversial. For instance,
streaking high velocities are observed near stations EDM and JOF, and extend
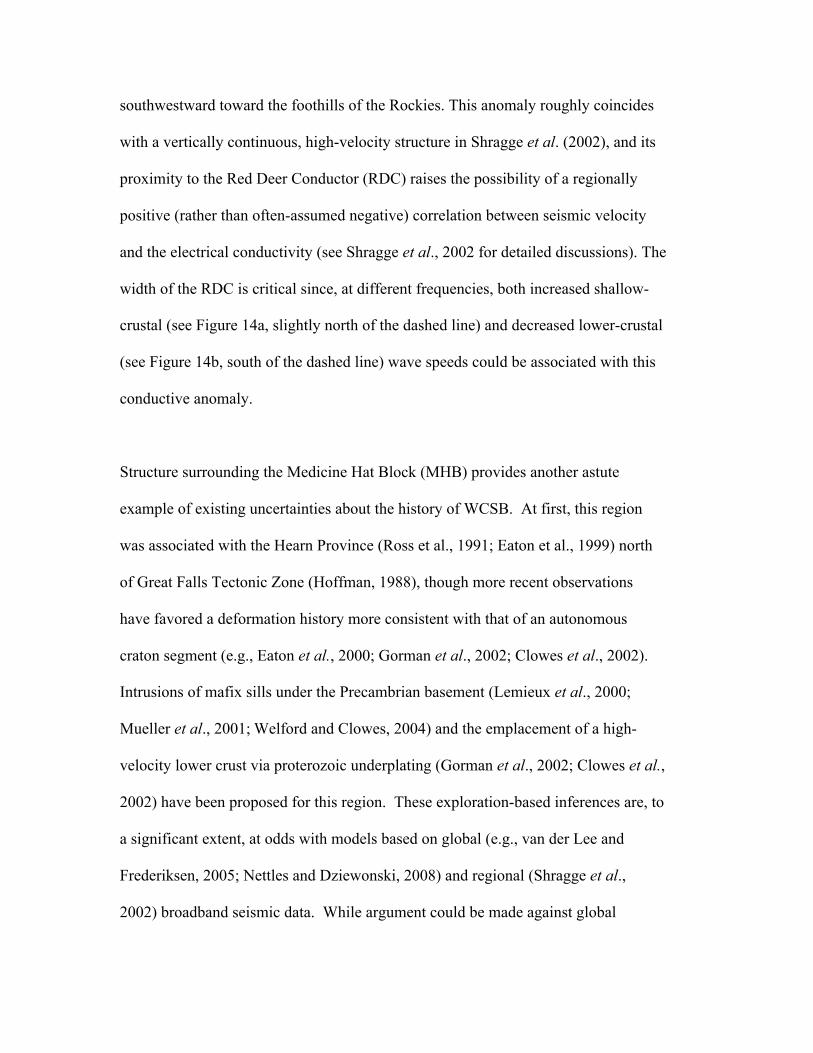
southwestward toward the foothills of the Rockies. This anomaly roughly coincides
with a vertically continuous, high-velocity structure in Shragge et al. (2002), and its
proximity to the Red Deer Conductor (RDC) raises the possibility of a regionally
positive (rather than often-assumed negative) correlation between seismic velocity
and the electrical conductivity (see Shragge et al., 2002 for detailed discussions). The
width of the RDC is critical since, at different frequencies, both increased shallow-
crustal (see Figure 14a, slightly north of the dashed line) and decreased lower-crustal
(see Figure 14b, south of the dashed line) wave speeds could be associated with this
conductive anomaly.
Structure surrounding the Medicine Hat Block (MHB) provides another astute
example of existing uncertainties about the history of WCSB. At first, this region
was associated with the Hearn Province (Ross et al., 1991; Eaton et al., 1999) north
of Great Falls Tectonic Zone (Hoffman, 1988), though more recent observations
have favored a deformation history more consistent with that of an autonomous
craton segment (e.g., Eaton et al., 2000; Gorman et al., 2002; Clowes et al., 2002).
Intrusions of mafix sills under the Precambrian basement (Lemieux et al., 2000;
Mueller et al., 2001; Welford and Clowes, 2004) and the emplacement of a high-
velocity lower crust via proterozoic underplating (Gorman et al., 2002; Clowes et al.,
2002) have been proposed for this region. These exploration-based inferences are, to
a significant extent, at odds with models based on global (e.g., van der Lee and
Frederiksen, 2005; Nettles and Dziewonski, 2008) and regional (Shragge et al.,
2002) broadband seismic data. While argument could be made against global
tomography on the basis of limited spatial resolution, the lack of more distinctive
signatures surrounding MHB in the regional body-wave model is indeed enigmatic.
Our regional noise-correlation tomography shows increased surface wave group
velocities below mid crust, especially east of 114-deg W at low frequencies (see
structure labeled ‘4’ in Figure 14) near Medicine Hat and the adjacent Vulcan
regions. This anomaly appears to persist down to ~50 km (and possibly deeper)
according to noise-correlation peaks at frequencies below 0.03 Hz. The segmented
appearance and limited strength of this high-velocity ‘tongue’ remain problematic,
though its presence would provide marginal support the hypothesis of Proterozoic
underplating where decreased density and increased Fe content are not explicitly
required in the lower crust and upper mantle (see Shragge et al. 2002).
As mentioned earlier, the tomographic imaging of regional P and S velocities remains a
work in progress. Hence, the results shown in this section are only preliminary in nature
and require more rigorous analyses of data accuracy and resolution. In time, the rich data
sets offered by CRANE and existing regional broadband stations should vastly improve
the regional structural constraints on the southern WCSB.
4. Conclusions
The establishment of the CRANE array opens a new chapter in regional seismicity
monitoring and crust/mantle imaging in Alberta and nearby regions. The array
deployment schedule and the geometry complement the USArray project, the leading
international initiative with dense seismic and magnetotelluric arrays presently deployed

southeast of Alberta. The high-quality data records from CRANE have shown significant
promise in both seismic source and structure analyses, the latter being evidenced by the
preliminary results presented in this article. This project will foster further in-province
and cross-border, multi-disciplinary collaborations. By integrating a wide range of data
constraints and methodologies, the nature of the seismic anomalies presented in this
study, as well as other fundamental properties of the southwestern Canadian subsurface,
will become clearer in the near future. Additional information pertaining to the array
project can be found in recent Edmonton Journal article “Alberta’s seismic pulse gets a
reading” (June 10, 2009) and Rocky Mountain House Mountaineer article “Nordegg
Earthquake research aids Alberta scientists.” (June 23, 2009). Continuous data from
CRANE, presently managed by the IRIS Data Management Center, are open to the
general public.
Acknowledgements
We sincerely thank Dinu Pana, David Snyder, Virginia Stern and Corey Froese for their
scientific input and support of the instrument project. We also thank all of the hosts of
our seismic stations. Their passion for fundamental scientific research is exemplary.
This instrument project also benefited from two constructive reviews, as well as from the
technical assistance from the CNSN and IRIS Data Management Center. This project is
jointly funded by CFI, Alberta Innovates, Alberta Geological Survey, National Science
and Engineering Council (NSERC), and the U of A.

References:
Aulbach, S., W. L. Griffin, S. Y. O’Reilly, and T. E. McCandless (2004). Genesis and
evolution of the lithospheric mantle beneath the Buffalo Head Terrane, Alberta (Canada).
Lithos 77, 413– 451.
Bank, C.-G., M. G. Bostock, Z. Hajnal, Z., and J. C. VanDecar (1998). Lithospheric
mantle structure beneath the Trans-Hudson Orogen and the origin of diamondiferous
kimberlites. Journal of Geophysical Research 103, 10,103–10,114.
Bassin, C., G. Laske, and G. Masters (2000). Current limits of resolution for surface
wave tomography in North America. EOS Transactions of Americal Geophysical Union
81, F897.
.
Ben Ismail, W., and D. Mainprice (1998). An olivine fabric database: An overview of
upper mantle fabrics and seismic anisotropy. Tectonophysics 296, 145-157.
Bensen, G. D., M. H. Ritzwoller, M. P. Barmin, A. L. Levshin, A.L., F. Lin, M. P.
Moschetti, N. M. Shapiro, and Y. Yang (2007). Processing seismic ambient noise data to
obtain reliable broad-band surface wave dispersion measurements. Geophysical Journal
International 169, 1,239-1,260, doi:10.1111/j.1365-246X.2007.03374.x.
Blackwell, D.D., and M. Richards (2004). Geothermal Map of North America.
American Association of Petrolium Geology (AAPG), 1 sheet, scale 1:6,500,000.
Boerner, D. E., R. D. Kurtz, J. A. Craven, S. Rondenay, and W. Qian (1995). Burried
Proterozoic foredeep under the Western Canada Sedimentary Basin. Geology 23, 297-
300.
Boerner, D. E., R. D. Kurtz, J. A. Craven, G. M. Ross, F. W. Jones (2002). A synthesis
of electromagnetic studies in the Lithoprobe Alberta Basement Transect: constraints on
paleoproterozoic indentation tectonics. Canadian Journal of Earth Sciences 37, 1,509-
1,534.
Bokelmann, G., and P. G. Silver (2002). Shear stress at the base of shield lithosphere.
Geophysical Research Letters 29, doi:10.1029/2002GL015925.
Bouzidi, Y., D. R. Schmitt, R. A. Burwash, and E.R. Kanasewich (2002). Depth
migration of deep seismic reflection profiles: crustal thickness variations in Alberta.
Canadian Journal of Earth Sciences 39, 331–350.
Bowman, J.R., and M. Ando (1987). Shear wave splitting in the upper-mantle wedge
above the Tonga subduction zone. Geophysical Journal of Royal Astronomical Society
88, 25-41.
Brzak, K., Y. J. Gu, A. Okeler, M. Steckler, and A. Lerner-Lam (2009). Migration
imaging and forward modeling of microseismic noise sources near southern Italy.
Geochemistry, Geophysics, and Geosystems, doi:10.1029/2008GC002234.
Carpenter, M.A., R. J. Hemley, and H.-K. Mao (2000). High-pressure elasticity of
stishovite and the P4(2)/mnm↔Pnnm phase transition. Journal of Geophysical Research
105, 10,807–10,816.
Cassidy, J. F. (1992). Numerical Experiment in Broadband Receiver Function Analysis.
Bulletin of the Seismological Society of America 82, 1,453–1,474.
Clowes, R.M.; M.J.A. Burianyk, A.R. Gorman, and E.R. Kanasewich (2002). Crustal
velocity structure from SAREX, the Southern Alberta Refraction Experiment. Canadian
Journal of Earth Sciences 39, 351-373.
Courtier, A. M., J. B. Gaherty, J. Revenaugh, M. G. Bostock, and E. J. Garnero (2010).
Seismic anisotropy associated with continental lithosphere accretion beneath the CANOE
array, northwestern Canada. Geology 38, 887-890, doi:10.1130/G31120.1.
Cook, F. A. (1995). The reflection Moho beneath the southern Canadian Cordillera.
Canadian Journal of Earth Sciences 32, 1,520-1,530.
Cook, F. A. (2002). Fine structure of the continental reflection Moho. GSA Bulletin 114,
64-79, doi:10.1130/0016-7606.
Cook, F. A., D. J. White, A. G. Jones, D. W.S. Eaton, J. Hall, and R. M. Clowes (2010).
How the crust meets the mantle: Lithoprobe perspectives on the Mohorovicic
discontinuity and crust–mantle transition. Canadian Journal of Earth Sciences 47, 315–
351, doi:10.1139/E09-076.
Dziewonski, A. M., and D. Anderson (1981). Preliminary reference earth model. Physics
of the Earth and Planetary Interiors 25, 297–356.
Dziewonski, A. M., and F. Gilbert (1976). The effect of small, aspherical perturbations
on travel times and a re-examination of the corrections for ellipticity. Geophysical
Journal of Astronomical Society, and Planetary Interiors 44, 7–17.
Eaton, D. W., G. M. Ross, and R. M. Clowes (1999). Seismic reflection and potential-
field studies of theVulcan structure, westernCanada: a Paleoproterozoic Pyrenees?
Journal of Geophysical Research 104, 255–269.
Efron, B., and R. Tibshirani (1991). Statistical data analysis in the computer age.
Science 253, 390-395.
English, J. M., and S. T. Jonhson (2004). The Laramide orogeny: What were the driving
forces, International Geology Review 46, 833–838.
Fischer, K. M. (2002). Waning buoyancy in the crustal roots of old mountains. Nature
417, 933–835.
Fouch, M.J., K. M. Fischer, M. E. Wysession, and T. J. Clarke (2000). Shear wave
splitting, continental keels, and patterns of mantle flow. Journal of Geophysical Research
105, 6,255-6,276.
Gaherty, J., and T. H. Jordan (1995). Lehmann Discontinuity as the Base of an
Anisotropic Layer Beneath Continents. Science 268, 1,468-1,471.
Gorman, A.R., R. M. Clowes, R.M. Ellis, T. J. Henstock, G. D. Spence,
G. R. Keller, A. R. Levander, C. M. Snelson, M. J. A. Burianyk, E. R. Kanasewich, I.
Asudeh, Z. Hajnal, and K. C. Miller (2002). Deep Probe—Imaging the roots of western
North America. Canadian Journal of Earth Sciences 39, 375-398.
Gu, Y. J. Ed (2010). Arrays and array methods in global seismology, 274 pp., Springer,
Netherland.
Gu, Y. J., K. Kocon, and A. Okeler (2009). Mapping the Western Boundary of the North
American continent. American Geophysical Union Fall Meeting 2009, abstract DI41B-
1807.
Gu, Y.J., C. Dublanko, A. Lerner-Lam, K. Brzak, and M. Steckler (2007). Probing the
sources of ambient seismic noise near the coasts of southern Italy. Geophysical Research
Letters 34, L22315, doi:10.1029/2007GL031967.
Gurrola, H., J. B. Minster, and T. Owens (1994). The use of velocity spectrum for
stacking receiver functions and imaging upper mantle discontinuities. Geophysical
Journal International 117, 427-440.
Helmstaedt, H., and D. J. Schulze (1989). Southern African kimberlites and their mantle
sample: implications for Archaean tectonics and lithosphère evolution, in “Kimberlites
and related rocks, vol. 1. Their composition, occurrence, origin, and emplacement”, Ed:
Ross. Journal of Geological Society of Australia 14, 358-368.
Hyndman, R. D., C. A. Currie, and S. P. Mazzotti (2005). Subduction zone backarcs,
mobile belts, and orogenic heat. GSA Today 15, 4-10.
Hynes, A., and D. B. Snyder (1995). Deep-crustal mineral assemblages and potential for
crustal rocks below the Moho in the Scottish Caledonides. Geophysical Journal
International 123, 323-339.
Hoffman, P. F. (1988). United plates of America, the birth of a craton: Early Proterozoic
assembly and growth of Laurentia. Annual Review of Earth Planetary Sciences 16, 543-
603.
Kennett, B. L. N., M. Sambridge, and P. R. Williamson (1988). Subspace methods for
large scale inverse problems involving multiple parameter classes. Geophysical Journal
International 94, 237-247.
Langston, C. A. (1979). Structure under Mount Rainier, Washington, inferred from
teleseismic body waves. Journal of Geophysical Research 84, 4,749-4,762.
Levander, A., and M.S. Miller (2010). The Moho and the lithosphere-asthenosphere
boundary in the Western U.S. Submitted to Geology.
Liu, L., M. Gurnis, M. Seton, J. Saleeby, R. D. Mueller, and J. M. Jackson (2010). The
role of oceanic plateau subduction in theLaramide orogeny. Nature Geoscience 3, 353-
357.
Livaccari, R. F., K. Burke, and A. M. Sengor(1981). Was the Laramide orogeny
related to subduction of an oceanic plateau? Nature 289, 276-278.
Park, J., and V. Levin (2000). Receiver functions from multiple-taper spectral correlation
estimates. Bulletin of the Seismological Society of America 90, 1,507-1,520,
doi:10.1785/0119990122.
Long, M. D., and P. G. Silver (2009). Shear wave splitting and mantle anisotropy:
measurements, interpretations, and new directions. Surveys in Geophysics 30, 407-461.
Longuet-Higgins, M. S. (1950). A theory on the origin of microseisms. Philosophical
Transactions of Royal Society of London 243, 1–35.

Mahan, K. H., and M. L. Williams (2005) Reconstruction of a large deep-crustal terrane:
Implications for the Snowbird tectonic zone and early growth of Laurentia. Geology 33,
385-388, doi:10.1130/G27273.1.
Mangino, S., and K. Priestley (1998). The crustal structure of the southern Caspian
region. Geophysical Journal International 133, 630-648.
Marone, F., and B. Romanowicz (2007). On the depth distribution of azimuthal
anisotropy in the continental upper mantle. Nature 447, 198-201.
Maxson, J., and B. Tickoff (1996). Hit-and-run collision model for the Laramide
orogeny, western United States. Geology 24, 968-972; doi:10.1130/0091-7613(1996)024.
Menke, W., and V. Levin (2003). The cross-convolution method for interpreting SKS
splitting observations, with application to one and two layer anisotropic Earth models.
Geophysical Journal International 15, 379-392.
Mercier, J.-P., M. G. Bostock, J. F. Cassidy, K. Dueker, J. B. Gaherty, E. J. Garnero, J.
Revenaugh, and G. Zandt (2009) Body-wave tomography of western Canada.
Tectonophysics 475, 480-492, doi:10.1016/j.tecto.2009.05.030.
Mueller, P. A., A. L. Heatherington, D. M. Kelly, J. L. Wooden, and D. W. Mogk (2001).

Paleoproterozoic crust within the Great Falls tectonic zone: Implications for the assembly
of southern Laurentia. Geology 30, 127-130, doi:10.1130/0091-7613.
Nettles, M., and A. M. Dziewonski (2008). Radially anisotropic shear-velocity structure
of the upper mantle globally and beneath North America. Journal of Geophysical
Research 113, B02303, doi:10.1029/2006JB004819.
Rawlinson, N., and M. Sambridge (2005). The fast marching method: An effective tool
for tomographic imaging and tracking multiple phases in complex layered media.
Exploration Geophysics 36, 341-350.
Rondenay, S. (2009). Upper mantle imaging with array recordings of converted and
scattered teleseismic waves. Surveys in Geophysics 4-5, 377-405, doi:10.1007/s10712-
009-9071-5.
Ross, G. M., R. R. Parrish, M.E. Villeneuve, and S. A. Bowring (1991). Geophysics and
geochronology of the crystalline basement of the Alberta Basin, western Canada.
Canadian Journal of Earth Sciences 28, 512–522.
Ross, G. M., and D. W. Eaton (2002). Proterozoic tectonic accretion and growth of
western Laurentia: results from Lithoprobe studies in northern Alberta. Canadian
Journal of Earth Sciences 39, 313–329, doi:10.1139/E01-081.
Ross, G.M., D. W. Eaton, D. E. Boerner, and W. Miles (2000). Tectonic entrapment and
its role in the evolution of continental lithosphere: An example from the Precambrian of
western Canada. Tectonics 19, 116-134.
Shapiro, N.M., M. Campillo, L. Stehly, and M. H. Ritzwoller (2005). High resolution
surface wave tomography from ambient seismic noise. Science 307, 1,615-1,618.
Sheehan, A. F., G. A. Abets, C. H. Jones, and A. L. Lerner-Lam (1995). Crustal
thickness variations across the Colorado Rocky Mountains from teleseismic receiver
functions. Journal of Geophysical Research 100, 20,391-20,404.
Shragge, J., M. G. Bostock, R. M. Ellis (2002). Integrated teleseismic studies of the
southern Alberta upper mantle. Canadian Journal of Earth Sciences 39. 399-411.
Silver, P. G., and W. W. Chan (1991). Shear wave splitting and subcontinental mantle
deformation. Journal of Geophysical Research 96, 16,429-16,454.
van der Lee, S., and A. Frederiksen, A. (2005). Surface wave tomography applied to the
North American upper mantle, in AGU Monograph “ Seismic Earth: Array analysis of
broadband seismograms”, Eds: Levander A., and G. Nolet, 67-80.
Vinnik, L. (1977). Detection of waves converted from P to SV in the mantle. Physics of
the Earth and Planetary Interiors 15, 39–45.

Weaver, R. L. (2005). Information from seismic noise. Science 307, 1,568-1,569.
Welford, J. K., R. M. Clowes (2004). Deep 3-D seismic reflection imaging of
Precambrian sills in southwestern Alberta, Canada. Tectonophysics 388, 161–172.
Yang, X., Y. J. Gu, P. Shen, X. Liu, and Z. Zheng (2006). A study of the adaptive
method for decoupling overlapped seismic records. Pure and Applied Geophysics 163,
1,515–1,536.
Yang Y., and M. Ritzwoller (2008). Characteristics of ambient seismic noise as a source
for surface wave tomography. Geochemistry, Geophysics, and Geosystems 9, Q02008,
doi:10.1029/2007GC001814.
Yang,Y., M. H. Ritzwoller, and C. H. Jones (2011). Crustal structure determined from
ambient noise tomography near the magmatic center of Coso region, southeastern
California. Geophysics, Geochemistry and Geosystems 12, Q02009,
doi10.1029/2010GC003362.
Yang Y., M. H. Ritzwoller, A. L. Levshi, and N. M. Shapiro (2006). Ambient noise
Rayleigh wave tomography across Europe. Geophysical Journal International 168, 259–
274.
Yao, H., R. D. van der Hilst, and M. V. De Hoop (2006). Surface-wave array

tomography in SE Tibet from ambient seismic noise and two-station analysis: I—Phase
velocity maps. Geophysical Journal International 166, 732–744.
Zelt., B. C., and R. M. Ellis (1999). Receiver-function studies in the Trans-Hudson
Orogen, Saskatchewan. Canadian Journal of Earth Sciences 36, 585–603.
Zhu, L., and H. Kanamori (2000). Moho Depth Variation in Southern California from
Teleseismic Receiver Functions. Journal of Geophysical Research 105, 2,969-2,980.
Figure Captions:
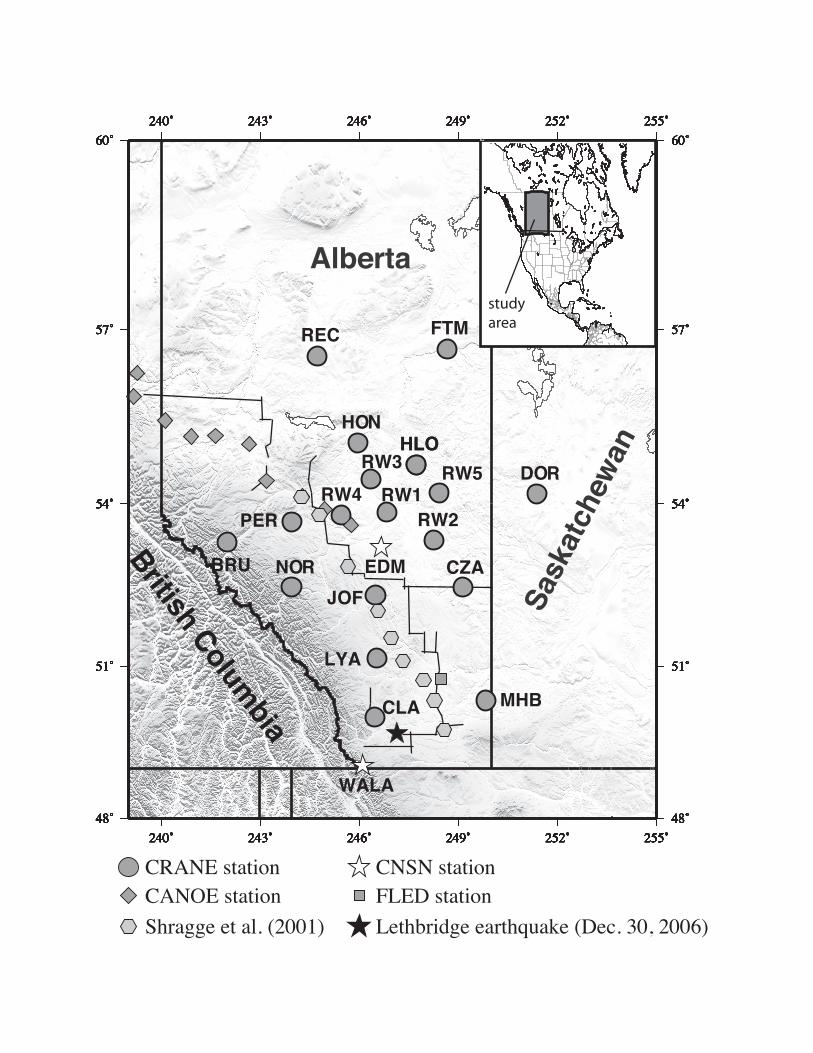
Figure 1: Distribution of CRANE, Canadian National Seismic Network (CNSN) and
other temporary stations in Alberta. Also shown are active source reflection/refraction
lines from the LITHOPROBE project and a local Mb=3.5 earthquake that took place on
Dec 30, 2006. The map inset shows the geographical location of the study area in
relation to the North American continent.
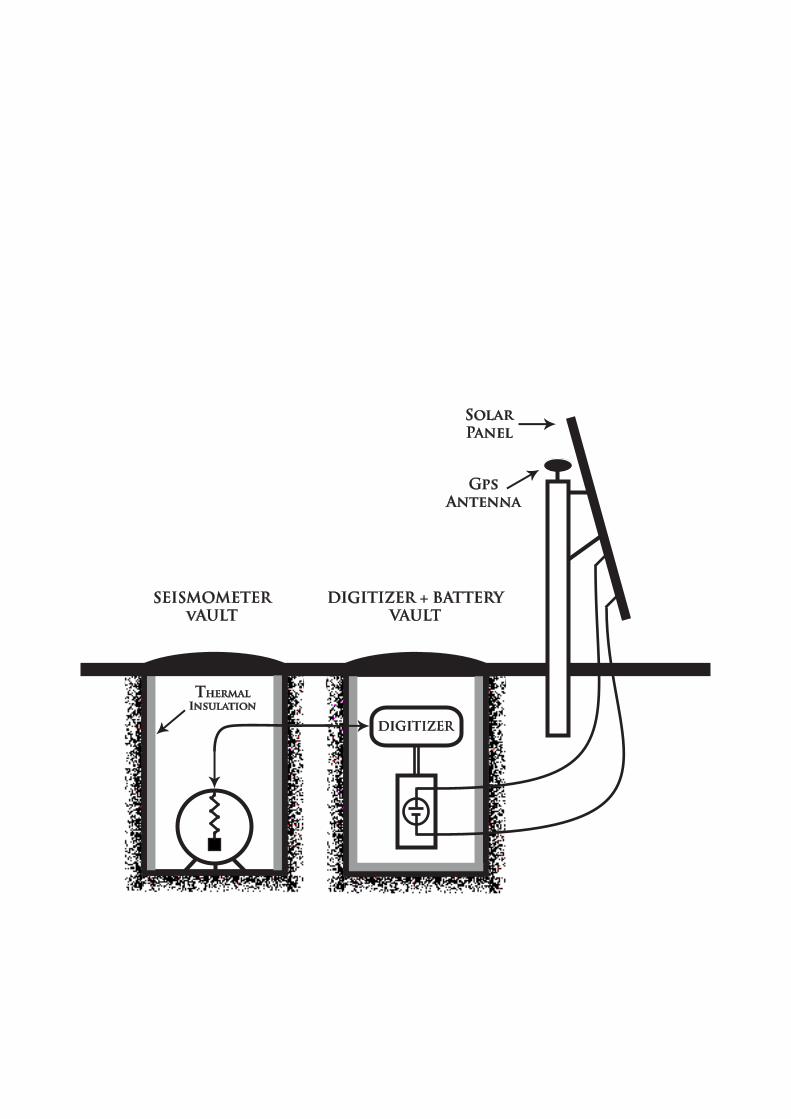
Figure 2: A schematic diagram of the instrument setup at a typical CRANE station.
Seismometers and digitizers are housed in different underground vaults powered by a
solar panel and a rechargeable 12V battery.
Figure 3: Vertical-component waveforms at selected CRANE stations. The predicted
arrival times and phase names are as indicated. The data from the Alaska event have
been band-pass filtered to the frequency range of 0.03-0.06 Hz.
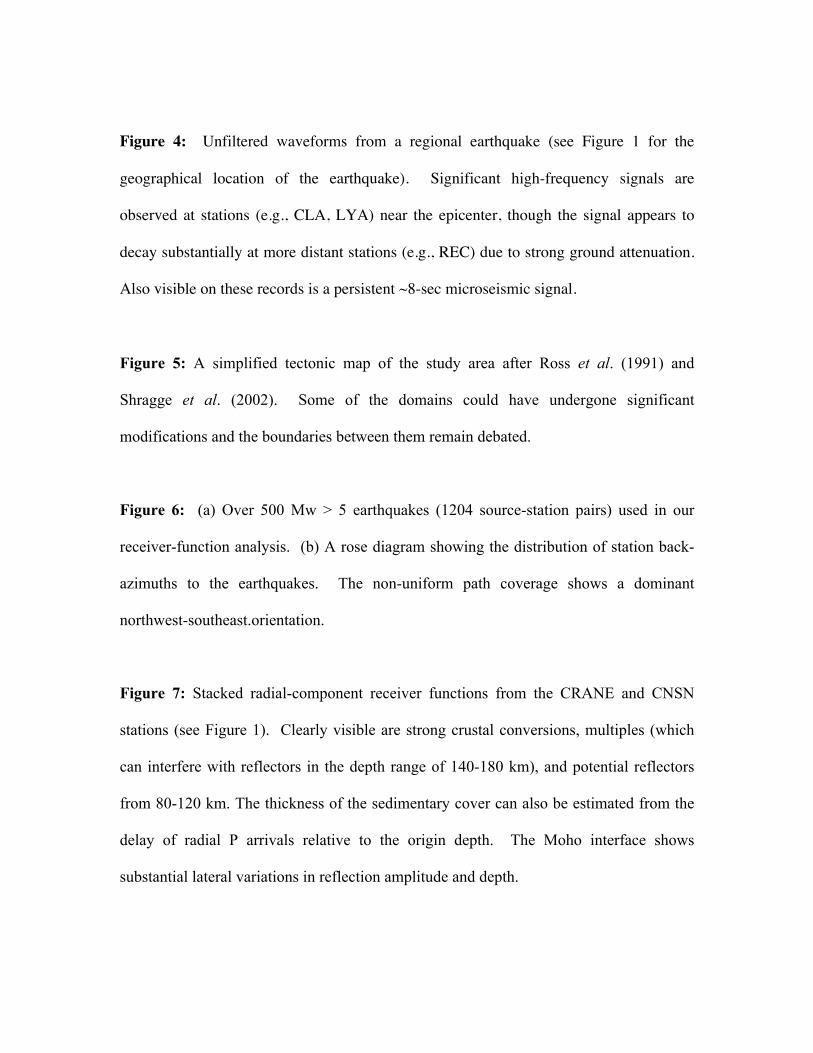
Figure 4: Unfiltered waveforms from a regional earthquake (see Figure 1 for the
geographical location of the earthquake). Significant high-frequency signals are
observed at stations (e.g., CLA, LYA) near the epicenter, though the signal appears to
decay substantially at more distant stations (e.g., REC) due to strong ground attenuation.
Also visible on these records is a persistent ~8-sec microseismic signal.
Figure 5: A simplified tectonic map of the study area after Ross et al. (1991) and
Shragge et al. (2002). Some of the domains could have undergone significant
modifications and the boundaries between them remain debated.
Figure 6: (a) Over 500 Mw > 5 earthquakes (1204 source-station pairs) used in our
receiver-function analysis. (b) A rose diagram showing the distribution of station back-
azimuths to the earthquakes. The non-uniform path coverage shows a dominant
northwest-southeast.orientation.
Figure 7: Stacked radial-component receiver functions from the CRANE and CNSN
stations (see Figure 1). Clearly visible are strong crustal conversions, multiples (which
can interfere with reflectors in the depth range of 140-180 km), and potential reflectors
from 80-120 km. The thickness of the sedimentary cover can also be estimated from the
delay of radial P arrivals relative to the origin depth. The Moho interface shows
substantial lateral variations in reflection amplitude and depth.
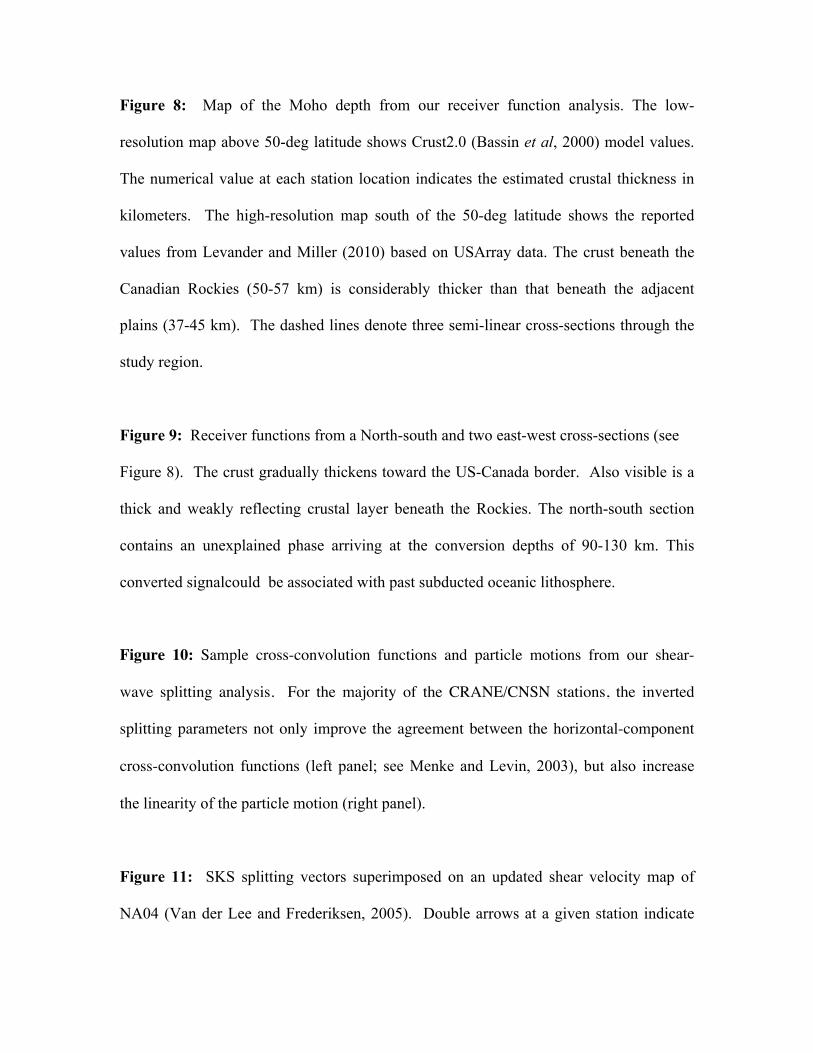
Figure 8: Map of the Moho depth from our receiver function analysis. The low-
resolution map above 50-deg latitude shows Crust2.0 (Bassin et al, 2000) model values.
The numerical value at each station location indicates the estimated crustal thickness in
kilometers. The high-resolution map south of the 50-deg latitude shows the reported
values from Levander and Miller (2010) based on USArray data. The crust beneath the
Canadian Rockies (50-57 km) is considerably thicker than that beneath the adjacent
plains (37-45 km). The dashed lines denote three semi-linear cross-sections through the
study region.
Figure 9: Receiver functions from a North-south and two east-west cross-sections (see
Figure 8). The crust gradually thickens toward the US-Canada border. Also visible is a
thick and weakly reflecting crustal layer beneath the Rockies. The north-south section
contains an unexplained phase arriving at the conversion depths of 90-130 km. This
converted signalcould be associated with past subducted oceanic lithosphere.
Figure 10: Sample cross-convolution functions and particle motions from our shear-
wave splitting analysis. For the majority of the CRANE/CNSN stations, the inverted
splitting parameters not only improve the agreement between the horizontal-component
cross-convolution functions (left panel; see Menke and Levin, 2003), but also increase
the linearity of the particle motion (right panel).
Figure 11: SKS splitting vectors superimposed on an updated shear velocity map of
NA04 (Van der Lee and Frederiksen, 2005). Double arrows at a given station indicate

potential two-layer anisotropy. The splitting directions change rapidly with distance from
the Rockies. Three distinct zones are present: Zone 3 suggests strong anisotropy
associated with past and present-day plate motions, whereas Zone 1 and Zone 2 are likely
caused by disrupted mantle flow around a migrating ‘continental keel’.
Figure 12: (a) Vertical-component cross-correlation functions of seismic noise,
computed from a full year of CRANE station recordings. The scale on the y-axis is
nonlinear and only approximates the true distance between any two stations. A band-pass
filter (0.03-0.06 Hz) has been applied to the original cross-correlation functions. (b)
Dispersion curves computed from multi-tapered correlation functions. The decreased lag
times at low frequencies are caused by higher wave speeds (relative to the Earth’s
surface) at lower-crustal/shallow-mantle depths. The apparent asymmetry in the
frequency range of 0.08-0.2 Hz suggests the presence of a potential non-ambient noise
source.
Figure 13: Noise correlation-based travel time residuals before and after least-squares
group velocity inversions for frequency ranges of (a) 0.10-0.16 Hz, and (b) 0.06-0.10 Hz.
The residuals are computed by removing travel time predictions of a constant starting
(left panels) and best-fit (right panels) models. The residuals distributions are
approximately Gaussian after the inversions.
Figure 14: Inverted group velocities using the lag times of noise correlation peaks. The
correlation functions are filtered between corner frequencies of (a) 0.10 Hz and 0.16 Hz,
and (b) 0.06 Hz and 0.10 Hz. Signals in these two frequency ranges are sensitive to the
upper-middle crust (panel a) and lower crust/upper mantle (panel b), respectively. The
dashed line shows the Red Deer Conductor (RDC) (Boerner et al., 2002). The peak-to-
peak variation in group velocity is as large as ~0.8 km/sec. See Section 3.4 for the
detailed explanations of the numbered regions.
240˚
240˚
243˚
243˚
246˚
246˚
249˚
249˚
252˚
252˚
255˚
255˚
48˚ 48˚
51˚ 51˚
54˚ 54˚
57˚ 57˚
60˚ 60˚
240˚
240˚
243˚
243˚
246˚
246˚
249˚
249˚
252˚
252˚
255˚
255˚
48˚ 48˚
51˚ 51˚
54˚ 54˚
57˚ 57˚
60˚ 60˚
240˚
240˚
243˚
243˚
246˚
246˚
249˚
249˚
252˚
252˚
255˚
255˚
48˚ 48˚
51˚ 51˚
54˚ 54˚
57˚ 57˚
60˚ 60˚
240˚
240˚
243˚
243˚
246˚
246˚
249˚
249˚
252˚
252˚
255˚
255˚
48˚ 48˚
51˚ 51˚
54˚ 54˚
57˚ 57˚
60˚ 60˚
240˚
240˚
243˚
243˚
246˚
246˚
249˚
249˚
252˚
252˚
255˚
255˚
48˚ 48˚
51˚ 51˚
54˚ 54˚
57˚ 57˚
60˚ 60˚
240˚
240˚
243˚
243˚
246˚
246˚
249˚
249˚
252˚
252˚
255˚
255˚
48˚ 48˚
51˚ 51˚
54˚ 54˚
57˚ 57˚
60˚ 60˚
Alberta
Sask
atch
ewan
240˚
240˚
243˚
243˚
246˚
246˚
249˚
249˚
252˚
252˚
255˚
255˚
48˚ 48˚
51˚ 51˚
54˚ 54˚
57˚ 57˚
60˚ 60˚
British Columbia
240˚
240˚
243˚
243˚
246˚
246˚
249˚
249˚
252˚
252˚
255˚
255˚
48˚ 48˚
51˚ 51˚
54˚ 54˚
57˚ 57˚
60˚ 60˚
240˚
240˚
243˚
243˚
246˚
246˚
249˚
249˚
252˚
252˚
255˚
255˚
48˚ 48˚
51˚ 51˚
54˚ 54˚
57˚ 57˚
60˚ 60˚
240˚
240˚
243˚
243˚
246˚
246˚
249˚
249˚
252˚
252˚
255˚
255˚
48˚ 48˚
51˚ 51˚
54˚ 54˚
57˚ 57˚
60˚ 60˚
CRANE station CNSN station
Lethbridge earthquake (Dec. 30, 2006)
EDM
WALA
PER
BRU
CLA
LYA
NOR
HON
FTM
DOR
CZA
HLO
JO F
REC
HLO
MHB
RW1RW2
RW3RW4
RW5
240˚
240˚
243˚
243˚
246˚
246˚
249˚
249˚
252˚
252˚
255˚
255˚
48˚ 48˚
51˚ 51˚
54˚ 54˚
57˚ 57˚
60˚ 60˚
FLED station
240˚
240˚
243˚
243˚
246˚
246˚
249˚
249˚
252˚
252˚
255˚
255˚
48˚ 48˚
51˚ 51˚
54˚ 54˚
57˚ 57˚
60˚ 60˚
CANOE station
240˚
240˚
243˚
243˚
246˚
246˚
249˚
249˚
252˚
252˚
255˚
255˚
48˚ 48˚
51˚ 51˚
54˚ 54˚
57˚ 57˚
60˚ 60˚
Shragge et al. (2001)
study area
DIGITIZER
SEISMOMETERvAULT
DIGITIZER + BATTERYVAULT
GpsAntenna
SolarPanel
ThermalInsulation
2460 2960 3460 3960 4460 4960 5460
P S SS SSS R1
FMC
HON
PER
NOR
CZA
LYA
time (seconds)
0 200 400 600 800 1000 1200
P S R1
BRU
NOR
FMC
CLA
time (seconds)
Sichuan, China (Mw=7.9, May 12, 2008)
Kodiak Island, Alaska (Mw = 5.0, April 30, 2009)

0 50 100 150time (second)
PCLA
Regional Earthquake (Dec 30, 2006, Lethbridge, Mag=3.5)
HON
REC
NOR
JOF
LYA
240 242 244 246 248 250 252 254 48
50
52
54
56
58
Laco
mbe
Structure
Rimbey
Thorsb
y
Chinchaga
Bulfalo Head Taltson
Rae
Medicine Hat Block
EyehillHigh
A
Trans- Hudsond
Wabamun
HON
EDMONTON
Vulcan
Lesser Slave Lake
Rocky Mountain
Reworked Archean?
LovernaBlock
Simpli�ed Tectonic Map

Event Back Azimuth
50
EASTWEST
NORTH
SOUTH
50 100 150 200
30
60
CRANE
Seismic Events(a) (b)
0 20 40 60 80 100 120 140 160 180 200 220depth(km)
FMC
REC
HON
EDM
DOR
LYA
JOF
CZA
PER
BRU
NOR
WALA
CLA
MohoCrustalMultipleP
Depth Migrated Receiver Function
38 52
FMC(37)REC(38)
HON(40)
EDM(40.6)
DOR(42.8)
LYA(44.7)
JOF(45.4) CZA(45.9)
PER(48)BRU(50)
NOR(51)
WALA(56.8)
CLA(57.6)
Moho Depth
median(45.4 km)
Moho depth(km)
+6 -6
240
240
242
242
244
244
246
246
248
248
250
250
252
252
48 48
50 50
52 52
54 54
56 56
58 58
path
path
2
1pa
th
3
path

0 20 40 60 80 100 120 140 160 180depth(km)
WALA
CLA
LYA
JOF
EDM
HON
REC
0 20 40 60 80 100 120 140 160 180depth(km)
WALA
CLA
LYA
CZA
DOR
0 20 40 60 80 100 120 140 160 180depth(km)
BRU
PER
HON
FMC
(a) (b)
(c)
Moho Moho
Moho
slab?
Multiple
Multiple
Path 1 Path 2
Path 3
W ETime (sec)
CLA
W E
CZA
W E
EDM
W E
HON
2 4 6 8 10 0 2 4 6 8 10
10 20 306 8 10 12 14 16Time (sec) Time (sec)
Time (sec)
Before
After
AfterAfter
After
Before
Before
Before
Before
After
Before
After
Before
After
Before
After

100 150 200 250 300
S-wave Velocity Perturbation (m/s)
240˚
240˚
245˚
245˚
250˚
250˚
50˚ 50˚
55˚ 55˚
PERBRU
CLA
NOR
HON
FMC
240˚
240˚
245˚
245˚
250˚
250˚
50˚ 50˚
55˚ 55˚
JOF
REC
PER
CLA
NOR
EDM
HLO
Lethbridge
Jasper
Alberta
Sask
atch
ewanRocky M
ountains
Bonnyville
BRU
CZA
LYA
JOF
REC
DOR
FA28
Zone 3
Zone 2
Zone 1
Noise Correlation Stacks
-500 0-100-200-300-400 100 200 300 500400lag time (sec)
5
10
20
25
30
35
40
45
15
stat
ion
pair
num
ber
Dispersion (DOR cc. HON)
0.200.180.160.140.120.100.080.060.04frequency (Hz)
lag
time
(sec
)
300
200
100
0
-300
-200
-100
(a)
(b)

0
2
4
6
Num
ber o
f rec
eive
r pai
rs
-15 -10 -5 0 5 10 15Travel time residual (s)
0
2
4
6
-15 -10 -5 0 5 10 15Travel time residual (s)
0
2
4
Num
ber o
f rec
eive
r pai
rs
-15 -10 -5 0 5 10 15Travel time residual (s)
0
2
4
-15 -10 -5 0 5 10 15Travel time residual (s)
Mean = 7.8 sStd = 7.6 s
0.10-0.16 Hz 0.10-0.16 Hz
0.06-0.10 Hz 0.06-0.10 Hz
Before After
Before After
(a)
(b)
Mean = 4.8 sStd = 4.4 s
Mean = -0.3 sStd = 3.9 s
Mean = 0.2 sStd = 2.9 s
240 244 248 252 48
52
56
PERBRU
CLA
LYA
HON
FTM
DOR
CZA
EDM
REC
NORJOF
A17 A18
SLEB
WALA
240 244 248 252 48
52
56
PERBRU
CLA
LYA
HON
FTM
DOR
CZA
EDM
REC
NORJOF
A17 A18
SLEB
WALA
2.4 2.6 2.8 3.0 3.2
(a) (b)0.10-0.16 Hz 0.06-0.10 Hz
phase velocity (km/s)
4
2 21 1
4
33
RDC RD
C