the caltech photooxidation flow tube reactor: design, … · we highlight fundamental consideration...
TRANSCRIPT

Atmos. Meas. Tech., 10, 839–867, 2017www.atmos-meas-tech.net/10/839/2017/doi:10.5194/amt-10-839-2017© Author(s) 2017. CC Attribution 3.0 License.
The Caltech Photooxidation Flow Tube reactor:design, fluid dynamics and characterizationYuanlong Huang1,*, Matthew M. Coggon2,a,*, Ran Zhao2, Hanna Lignell2,b, Michael U. Bauer2, Richard C. Flagan1,2,and John H. Seinfeld1,2
1Department of Environmental Science and Engineering, California Institute of Technology, Pasadena, CA, USA2Division of Chemistry and Chemical Engineering, California Institute of Technology, Pasadena, CA, USAanow at: CIRES, University of Colorado, and NOAA Earth System Research Laboratory, Boulder, CO, USAbnow at: South Coast Air Quality Management District, Diamond Bar, CA, USA*These authors contributed equally to this work.
Correspondence to: John H. Seinfeld ([email protected])
Received: 29 August 2016 – Discussion started: 22 September 2016Revised: 7 February 2017 – Accepted: 24 February 2017 – Published: 9 March 2017
Abstract. Flow tube reactors are widely employed tostudy gas-phase atmospheric chemistry and secondary or-ganic aerosol (SOA) formation. The development of a newlaminar-flow tube reactor, the Caltech Photooxidation FlowTube (CPOT), intended for the study of gas-phase atmo-spheric chemistry and SOA formation, is reported here. Thepresent work addresses the reactor design based on fluid dy-namical characterization and the fundamental behavior of va-por molecules and particles in the reactor. The design of theinlet to the reactor, based on computational fluid dynamics(CFD) simulations, comprises a static mixer and a conicaldiffuser to facilitate development of a characteristic laminarflow profile. To assess the extent to which the actual per-formance adheres to the theoretical CFD model, residencetime distribution (RTD) experiments are reported with vapormolecules (O3) and submicrometer ammonium sulfate parti-cles. As confirmed by the CFD prediction, the presence of aslight deviation from strictly isothermal conditions leads tosecondary flows in the reactor that produce deviations fromthe ideal parabolic laminar flow. The characterization exper-iments, in conjunction with theory, provide a basis for in-terpretation of atmospheric chemistry and SOA studies tofollow. A 1-D photochemical model within an axially dis-persed plug flow reactor (AD-PFR) framework is formulatedto evaluate the oxidation level in the reactor. The simulationindicates that the OH concentration is uniform along the re-actor, and an OH exposure (OHexp) ranging from ∼ 109 to∼ 1012 molecules cm−3 s can be achieved from photolysis of
H2O2. A method to calculate OHexp with a consideration forthe axial dispersion in the present photochemical system isdeveloped.
1 Introduction
Experimental evaluation of atmospheric chemistry andaerosol formation is typically carried out in laboratory re-actors. Such reactors comprise both chambers and flow reac-tors. The flow tube reactor has emerged as a widely used plat-form (Bruns et al., 2015; Chen et al., 2013; Ezell et al., 2010;Kang et al., 2007, 2011; Karjalainen et al., 2016; Keller andBurtscher, 2012; Khalizov et al., 2006; Lambe et al., 2011a,b, 2012, 2015; Li et al., 2015; Ortega et al., 2013, 2016; Palmet al., 2016; Peng et al., 2015, 2016; Simonen et al., 2016;Tkacik et al., 2014).
The flow tube reactor is generally operated under steady-state conditions. An attribute of the flow tube reactor is that,by control of the inlet concentration and oxidation condi-tions, it is possible to simulate atmospheric oxidation underconditions equivalent to multiple days of atmospheric expo-sure with a reactor residence time over a range of minutes.It should be noted that the chemistry occurring in such ahighly oxidizing environment may differ from that in the at-mosphere and batch chamber, even though no discrepancybetween the components of the secondary organic aerosol(SOA) generated in the flow tube reactor and the batch cham-
Published by Copernicus Publications on behalf of the European Geosciences Union.

840 Y. Huang et al.: The Caltech Photooxidation Flow Tube reactor
ber has yet to be reported (Lambe et al., 2015). Moreover,under the steady-state operating conditions, it is possible toaccumulate sufficient products for detailed analytical eval-uation. Key factors relevant to atmospheric processes, suchas gas-phase kinetics (Donahue et al., 1996; Howard, 1979;Thornton and Abbatt, 2005), nucleation rates (Mikheev et al.,2000), uptake coefficients of vapors on particles (Matthewset al., 2014) and heterogeneous reactions on particle surfaces(George et al., 2007), can be evaluated via flow tube studies.
Since the concept of potential aerosol mass (PAM) wasproposed, the PAM reactor, operated as a flow tube reactor,has been widely used in laboratory and field studies of SOAformation (Chen et al., 2013; Kang et al., 2007, 2011; Kellerand Burtscher, 2012; Kroll et al., 2009; Lambe et al., 2011a,2012, 2015; Ortega et al., 2016, 2013; Palm et al., 2016;Slowik et al., 2012; Smith et al., 2009). A powerful attributeof the PAM and subsequent flow reactors is the capability togenerate hydroxyl radical (OH) levels that lead to integratedOH exposure ranging as high as ∼ 1012 molecules cm−3 s, atwhich it is possible to simulate atmospheric oxidation condi-tions comparable to those occurring over ∼ 1 week. Chemi-cal kinetic modeling studies have investigated the free radicalchemistry in the oxidation flow reactor (OFR) (e.g., Li et al.,2015; Peng et al., 2015, 2016).
Flow tube designs vary in dimension, detailed construc-tion and strategy for generating the oxidizing environment.Each specific design aspect of a flow reactor can significantlyaffect both the fluid dynamics and the chemistry within thereactor. For example, the design of the inlet to the reactor de-termines the extent of initial mixing of the reactants as wellas the development of concentration profiles in the reactor.The classical flow tube for gas-phase kinetic measurementsemploys a movable inlet in the axial position surrounded bya carrier gas to achieve the flexibility in varying reactiontime (Howard, 1979). The wavelength-dependent radiationsource determines the choice of oxidants that initiate freeradical chemistry. In the atmosphere, the ubiquitous oxidantOH is generated largely by the reaction of H2O with O(1D),which is produced by the photolysis of O3 at wavelengths< 320 nm. In the flow reactor, a variety of OH generationstrategies exist. One option is to use blacklights that cen-ter around 350 nm to gently photolyze OH precursors suchas H2O2, HONO and CH3ONO. The material of the flowtube determines the placement of radiation sources. For ex-ample, the PAM reactor described by Kang et al. (2007) isconstructed of Teflon, which is transparent to UV radiation;consequently, the UV lamps that drive the photochemistrycan be positioned outside the reactor itself. By contrast, an-other class of flow reactors is constructed of aluminum, forwhich the UV lamps must be positioned inside the reactoritself (Li et al., 2015; Ezell et al., 2010). Characterizationof the behavior of the flow tube reactor requires ideally acombination of flow and residence time modeling and exper-iment, chemical kinetic modeling and experiment, and mod-
eling and experimental measurement of interactions of vapormolecules and particles with reactor walls.
We present here the development and characterization ofthe Caltech Photooxidation Flow Tube reactor (CPOT). TheCPOT has been constructed as a complement to the Caltech24 m3 batch chambers (Bates et al., 2014, 2016; Schillinget al., 2015; Hodas et al., 2015; Loza et al., 2013, 2014; Mc-Vay et al., 2014, 2016; Nguyen et al., 2014, 2015; Schwanteset al., 2015; Yee et al., 2013; Zhang et al., 2014; X. Zhanget al., 2015) in carrying out studies of SOA formation re-sulting from the oxidation of volatile organic compounds(VOCs) by oxidants OH, O3 and NO3 over timescales notaccessible in a batch chamber. Due to its steady-state opera-tion, the CPOT also affords the capability to collect sufficientquantities of SOA generated in the reactor for comprehensivecomposition determination by offline mass spectrometry.
While the reactor itself is not unlike a number of thosealready developed and cited above, we endeavor here to de-scribe in some detail the theoretical–experimental character-ization of the reactor. Using computational fluid dynamics(CFD) simulations, we describe the design and characteriza-tion of the CPOT. We highlight fundamental considerationof the design of a laminar flow tube reactor, including meth-ods of injection of gases and particles, the behavior of vapormolecules and particles in the reactor, and effects of non-isothermal conditions on the flow in the reactor. We evalu-ate the extent to which the fluid dynamics modeling agreeswith experimental residence time distribution (RTD) mea-surements.
Experimental measurements of SOA formation in labora-tory Teflon chambers are influenced by deposition of bothparticles and vapors to the chamber walls, and evaluation ofthe SOA yield from VOC oxidation must take careful ac-counting for such wall losses (e.g., Zhang et al., 2014; Nahet al., 2017, 2016). We seek to assess the extent to whichboth vapor and particle deposition onto the entrance regionand quartz wall of the flow tube is influential in flow tubereactor studies. While experimental measurements of theseprocesses will be presented in future studies, the transportmodeling presented here provides a basis for evaluating theeffect of reactor surfaces on experimental measurements ofatmospheric chemistry and SOA formation.
A photochemical kinetic model is formulated to simulateOH production in the reactor. Typically, at steady state, theflow tube reactor gives only one data point under a specificcondition. Such a model is essential in evaluating oxidationdata in the reactor since the model predicts how the reac-tants evolve along the reactor. Generally, the ideal plug flowreactor (PFR) framework is used in the modeling of a flowtube system (Li et al., 2015; Peng et al., 2015, 2016). For anon-ideal flow reactor, the axially dispersed plug flow reac-tor (AD-PFR) framework couples the RTD with the chem-ical reaction system. The axial dispersion plays the role ofbackward and forward mixing of the reactants, smoothingthe concentration gradients. By the comparison between AD-
Atmos. Meas. Tech., 10, 839–867, 2017 www.atmos-meas-tech.net/10/839/2017/

Y. Huang et al.: The Caltech Photooxidation Flow Tube reactor 841
Reactor 1
(1.2 m)
Reactor 2
(1.2 m)
Diffuser inlet
(53.3 cm)
Mixing
tube
Exit cone
(53.5 cm)
SP 1 SP 2 SP 3 SP 4
SP 5
MFC
To house
vacuum
CP, out CP, in T/RHT/RH
15º150 mm
I.D.
CP, inCP, out
CP: Coolant port
SP: Sample port
MFC: Mass flow controller
T/RH: Temperature/
relative humidity
HE: Heat exchanger
(b) Diffuser inlet design
Legend
170 mm
I.D.
16 mm
I.D.
(d) UV light housing
51 cm
51 cm 1.5 m
1.5 m
(a) System overview
(c) Injection scheme
MFC
Needle
valve
O3 generator
HE HE
Atomizer
Drier Neutralizer
To
instruments
Teflon bag
H2O2
MFC
SO2
Figure 1. Overall schematic of the Caltech Photooxidation Flow Tube (CPOT). (a) The inlet design. (b) The injection scheme. (c) Schematicfor the housing chamber. (d) UV lamps.
PFR and PFR models, we will show how the non-ideal flowreactor impacts the data interpretation and suggest a methodfor correction.
2 Design and experimental setup
2.1 CPOT reactor
The CPOT comprises three sections: the inlet section, themain reaction section and the outlet section (Fig. 1a). Theinlet consists of two components – the static mixer and theconical diffuser (Fig. 1b). The static mixer is designed tothoroughly mix reactant streams, whereas the diffuser servesto expand the mixed flow to the diameter of the reaction sec-tion while maintaining an idealized laminar flow profile. Thestatic mixer is constructed of stainless steel and consists of12 helical elements (StaticMixCo, NY). The Pyrex glass dif-fuser section expands from an inner diameter of 1.6 to 15 cmat an angle of 15◦. The diffuser angle was chosen based onCFD simulations in order to minimize flow separation and re-circulation. Detailed design of the inlet section is discussedin Sect. 3.
The CPOT reaction section consists of two 1.2 m× 17 cmID cylindrical quartz tubes surrounded by an external wa-ter jacket (1 cm thickness) and flanged together with clampsand chemically resistant O-rings. Four ports along the reac-
tor axis allow sampling of the reactor contents at differentresidence times. A transition cone at the end of the reactorconcentrates the reactants into a common sampling line thatcan be split among multiple instruments; thus, samples ex-tracted at the end of the reactor represent the so-called cup-mixed average of the entire reactor cross section. This designis similar to the exit cone of the UC Irvine flow tube reac-tor (Ezell et al., 2010). The Pyrex glass exit cone graduallyreduces the diameter of the reactor from 15 to 0.72 cm at anangle of 15◦. Similar to the inlet diffuser, the exit cone istemperature controlled (Sect. 2.3).
The CPOT is designed to operate under laminar flow. Theessential dimensionless group that differentiates laminar vs.turbulent flow is the Reynolds number, Re= ρUD
µ, where ρ
is the fluid density, U is a characteristic velocity of the fluid,µ is the fluid viscosity and D is the tube diameter. For cylin-drical tubes, the flow is considered laminar when Re< 2100.Under the typical CPOT flow rate (2 L min−1), the Reynoldsnumbers at the inlet cone in the cylindrical section and at theexit cone are 150, 20 and 450, respectively, well below thetransition to turbulent flow.
2.2 Photolytic environment
The reactor is housed within a 51× 51× 300 cm chambercontaining 16 wall-mounted UV lamps. The arrangement ofthe lamps is outlined in Fig. 1d. Light intensity is adjustable
www.atmos-meas-tech.net/10/839/2017/ Atmos. Meas. Tech., 10, 839–867, 2017

842 Y. Huang et al.: The Caltech Photooxidation Flow Tube reactor
(0, 25, 50, 75 and 100 %), and the UV spectrum can be setto a specific wavelength range with the installation of vari-ous T12 UV lamps, including Hg vapor lamps (emit narrowbands at 254 and 185 nm), UVB lamps (polychromatic irra-diation centered at 305 nm) and UVA lamps (polychromaticirradiation centered at 350 nm), based on the experimentalgoals.
Quantification of light fluxes for each type of lamp is theprerequisite for performing photochemical experiments. Achallenge associated with quantifying photon fluxes is thatthe flux emitted by the lamps is not necessarily that perceivedby a molecule inside the reactor. Attenuation of photon fluxescan potentially arise from (1) attenuation by the quartz walland the water jacket surrounding the experimental sections,(2) reflection and/or refraction of light inside the chamber,and (3) absorption of light by gas-phase molecules (e.g., ab-sorption of the 185 nm band by O2 molecules). To overcomethis challenge, we employ a method combining direct mea-surements and gas-phase chemical actinometry, where the di-rectly recorded emission spectra are adjusted to the observedphotolysis rate of NO2 (jNO2 ). The advantage of this methodis that the actual output spectra of the lamps are used, sincethe quantification of fluxes is based on what the moleculesperceive inside the reactor. The water coolant in the jacketsurrounding the tube is transparent at the UV wavelengthsof interest, with the exception that it absorbs at the 185 nmband emitted by the Hg vapor lamps. Although the generalUV cutoff of water is at 190 nm, we observed formation of60 ppb of O3 with a 2 L min−1 flow rate under the full powerof the Hg vapor lamp. The radiation intensity at 185 nm thatpenetrates into the reaction section is calculated to be about10−5 of that at 254 nm. The photon fluxes in the CPOT fromthe three types of lamps are shown in Fig. 2 with a detaileddescription of the determination of photon fluxes provided inAppendix A.
2.3 Temperature control in the reaction section
At full photolytic intensity, the lamps generate as much as550 W of heat. To maintain a constant temperature and mini-mize convective mixing in the tube due to temperature inho-mogeneity, each of the two reaction sections is fitted with aquartz cooling jacket, in which chilled water is circulated at arate of 13 L min−1. Coolant is introduced into the jacket nearthe exit cone and exits at the inlet (Fig. 1a). Under typicaloperation, the cooling jacket can maintain the steady-statereactor temperature at a desired value between 20 and 38 ◦C.Under full photolytic intensity of the UVA lamps, which pro-duce the most heating among the three types of lamps, thetemperature rise of air in the reactor is≤ 0.3 K at steady state.Reactor temperature control is further addressed in Sect. 3.3.
1.2x10¹⁵
1.0
0.8
0.6
0.4
0.2
0.0
Pho
ton
flux
(cm
-2 s
-1 n
m-1
)
400350300250200
Wavelength (nm)
100
80
60
40
20
0
Transm
ittance (%)
Flux: Hg vapor UVB UVATransmittance: Water Fused quartz
Figure 2. Photon fluxes inside the reactor, as well as the transmit-tance of water and fused quartz (Beder et al., 1971).
2.4 Experimental testing
Particles and vapor species are used to experimentally char-acterize the fluid dynamics inside the reactor. The injectionscheme is illustrated by Fig. 1c. Polydisperse ammonium sul-fate particles were generated by atomizing a 0.01 M aque-ous solution with a constant rate atomizer (Liu and Lee,1975). The atomized particles were immediately dried by asilica gel diffusion drier. The size distribution of particleswas measured by a custom-built scanning mobility particlesizer (SMPS). For the particle RTD measurement, the par-ticle counts were monitored with a TSI 3010 condensationparticle counter (CPC, Minneapolis, MN). Gas-phase RTDstudies were performed under dark conditions. O3 was gen-erated by passing purified air through an O3 generator (UVP,97-0067-01), and the O3 mixing ratio was monitored by aO3 monitor (Horiba APOA-360). A Teledyne NOx Analyzer(Model T200) was used to monitor NO, NO2 and NOx inthe experiment of the determination of photon flux. To mea-sure the penetration efficiency of gas-phase species, a SO2monitor (Meloy Lab, SA285E) was used to detect SO2 anda chemical ionization mass spectrometry (CIMS, Crounseet al., 2006; St. Clair et al., 2010) was employed to detectH2O2.
2.5 CFD simulations
CFD simulations were performed using COMSOL Mul-tiphysics 5.0 software (Stockholm, Sweden, http://www.comsol.com) to assist the design and characterization of thereactor. COMSOL uses a finite element method and has anumber of built-in modules that can be utilized to simulatea specific experimental condition. Recently, several researchgroups have employed COMSOL in atmospheric and aerosolchemistry studies (Grayson et al., 2015; Sellier et al., 2015;Y. Zhang et al., 2015). Here, the model geometry replicatesthat of the actual design; thus, the simulations include a staticmixer, diffuser inlet, reaction section and exit cone with exactdimensions (Fig. 3a).
Atmos. Meas. Tech., 10, 839–867, 2017 www.atmos-meas-tech.net/10/839/2017/

Y. Huang et al.: The Caltech Photooxidation Flow Tube reactor 843
Diffuser inlet
geometry
Static mixer
geometry
Exit conegeometry
Diffuser
Static mixer
Diffuserinlet
Exitcone Full
model
Reactionsection
(a) COMSOL geometry (b) Inlet meshing
(c) Non-isothermal surface temperature
Tout = Tin T Tin
T
Figure 3. (a) Overview of the geometry used to simulate flow and species transport within the CPOT. (b) Inlet meshing for static mixer.(c) Schematic illustration of the temperature gradient used in non-isothermal simulations.
At the design stage, the performance of the inlet sectionwas simulated numerically using CFD models (Sect. 2.5).The actual static mixer containing 12 mixing elements wassimulated by a two-element mixer using the COMSOL built-in static mixer model. Flow profiles calculated using thetwo-element static mixer model were found to be identi-cal to those using static mixers with four or more elements.Since static mixers yield asymmetric flow patterns, the modelwas solved in a 3-D geometry. The entire 3-D model wasdiscretized with a fine mesh composed of approximately1.25× 106 tetrahedral elements (Fig. 3b). The average ele-ment quality, which is a reflection of cell distortion (a valueof 1 reflects a perfect element shape), was 0.77 with a min-imum of 0.12. A finer mesh within the domain of the staticmixer was applied to capture flow dynamics near the entranceto the diffuser cone (Fig. 3b). Model sensitivity to meshingwas tested using a finer mesh density, and results were foundto be identical. An impermeable and no-slip boundary con-dition was applied to all surfaces. The flow at the entranceinto the static mixer was set to be 2 L min−1, and the outletpressure was assumed to be atmospheric. Simulations wereconducted until a steady state was achieved, and the errorsconverged to < 10−6.
Navier–Stokes equations were solved using the COMSOLlaminar flow package in the CFD module assuming com-pressible, isothermal flow. The isothermal assumption willbe relaxed subsequently. To evaluate the effect of reactortemperature gradients, the COMSOL laminar flow packagewas coupled to the convective and diffusive heat transferinterface. To visualize fluid flow through the reactor, tran-sient simulations were performed using the COMSOL di-lute species transport package. This model, when coupled tothe Navier–Stokes equations, enables one to track convec-
tion and diffusion of a tracer species, as described in Sect. 4.After first generating the steady-state laminar flow profile, a30 s rectangular pulse of a 0.1 mol m−3 tracer was introducednumerically into the reactor at the entrance to the static mixerto generate the RTD. No wall uptake of gases or particles wasassumed in this computation. Molecular or Brownian diffu-sivity can be varied over several orders of magnitude to rep-resent that of vapor molecules and particles. The simulationwas run for 80 min with data output every 15 s (consistentwith the data acquisition of the instruments, e.g., O3 moni-tor and CPC). Simulations were performed for a variety ofdifferent inlet geometries, flow rates and reactor temperaturegradients. These simulations served to evaluate the designagainst alternative configurations and also demonstrate thesensitivity of fluid field to various flow conditions.
2.6 Photochemical model
While the CFD simulation serves as a comprehensive methodto understand the fluid dynamics, it is not efficient to solve acomplex chemical kinetic system within this framework. Asimplified 1-D axial-dispersion photochemical model basedon the RTD measurement is built here to evaluate the ox-idation level. The mechanism presented here is that in theabsence of NOx . The oxidation of 100 ppb SO2 by the OHradical is studied. H2O2 at 1 ppm serves as the OH precursor.The three types of UV lamps are considered, sequentially, toinvestigate the effect of the radiation source on OH exposure.Each simulation is carried out at a relative humidity (RH) of5 % and T = 295 K (corresponding to [H2O]= 1500 ppm).The case in the absence of H2O2 input is also simulated tocheck the background OH level. Reactions of the full mech-anisms and the rate coefficients including photolysis rate un-
www.atmos-meas-tech.net/10/839/2017/ Atmos. Meas. Tech., 10, 839–867, 2017

844 Y. Huang et al.: The Caltech Photooxidation Flow Tube reactor
der different lamps that are necessary for the chemical kineticmodeling are listed in Appendix B.
The AD-PFR model setup is used in the present study anddescribed in Appendix C. The Danckwerts boundary condi-tion is employed to ensure the flux continuity at both the in-let and outlet (Davis and Davis, 2003). This model system issolved in MATLAB (R2015b) by a boundary value problemsolver bvp4c. The PFR model is run simultaneously as acomparison. No wall interaction and new particle formationare considered in the models. The result will be discussed inSect. 6.
3 Design of the flow tube reactor
Essential elements of the design of a flow tube reactor are(1) the manner by which reactants are introduced into the re-actor; (2) the nature of the flow inside the reactor; (3) the typeand location of the radiation source relative to the reactor it-self; and (4) the management of heat generation due to theradiation source. The first two correspond to the inlet sectiondesign, while the latter two address the problem of possiblenon-isothermal conditions in the reaction section.
3.1 Injection method
A number of possible arrangements exist to introduce mate-rial into a flow tube reactor (Fig. 4). The nature of the injec-tion manifold has the potential to profoundly affect the flowprofile in the subsequent reaction section. In the case of alaminar flow reactor, it is desirable to minimize such “endeffects” in order to establish parabolic flow quickly withinthe reaction section; otherwise, phenomena such as jettingand recirculation have the potential to impact flow patternsthroughout the entire reactor. Figure 4a depicts the simplestinjection method, by which vapor and particles are intro-duced into the reaction section through a short injection tube.While a benefit of this design is its simplicity, with this modeof injection, it is challenging to distribute reactant mixturesevenly across the reactor cross section. We tested this in-let method on a cylindrical Pyrex glass tube and visualizedthe flow pattern by the injection of smoke (Fig. 4a). Withflow controlled by a vacuum line attached to the exit sec-tion, the gas-particle mixture is pulled into the reaction tubeat a rate that is dictated by mass conservation. Smoke visu-alization studies illustrate that the mixture concentrates in aplug at the center of the reactor. This “fire hose” effect arisesfrom the enhanced velocity at the exit of the injection tube(Uavg, injection). Such flow behavior is typical for that occur-ring with a sudden expansion (Bird et al., 2007).
Some flow tube designs address inlet issues using flowmanagement devices, e.g., a spoked-hub/showerhead disk in-let (Bonn et al., 2002; Ezell et al., 2010) that distributes thereactants evenly about the reactor cross section and providessufficient mixing (Fig. 4b). Even when reactants are intro-
duced gently into the tube, an axial distance is still requiredfor the flow to develop to the characteristic parabolic lami-nar flow profile. This entrance length, Lentr, is estimated tobe 0.035DRe (Bird et al., 2007). The inlet section should bedesigned with a sufficient entrance length Lentr to ensure thedevelopment of the laminar profile prior to the reaction sec-tion.
In the CPOT, reactants are injected via a conical diffuser(Fig. 4c), which has the advantage of gradually decreasingthe velocity, thereby assisting with the formation of the lam-inar parabolic profile. The employment of a diffuser cone es-sentially replaces Lentr, and a parabolic profile is fully devel-oped when the reactants reach the reaction section.
In addition to the flow field inside the reactor introducedby the inlet design, the transmission of different reactants(i.e., gas-phase species and particles) in the inlet systemshould also be considered (Karjalainen et al., 2016; Ortegaet al., 2013, 2016; Palm et al., 2016; Simonen et al., 2016;Tkacik et al., 2014). Generally, a larger surface area meansmore interaction between the reactants and the walls, espe-cially for “sticky” molecules. The effect of static mixer onthe transmission of gas-phase species will be investigated inSect. 5.1.
3.2 Angle of the diffuser
A key consideration in designing a diffuser is avoiding flowseparation that occurs when streamlines detach from the dif-fuser wall. Separation may be characterized by two flow pat-terns: stall and jetting flow. In stall, an asymmetrical flowpattern develops due to an adverse pressure gradient. Fluidis accelerated along one wall of the diffuser and recirculatesslowly back along the other wall to the point of streamline de-tachment (Tavoularis, 2005). As demonstrated in Fig. 4a, jet-ting flow is characterized by a symmetric flow pattern wherethe fluid is accelerated at the center of the diffuser and re-circulates slowly along the walls. Recirculation introducesnon-ideality since it accelerates gases and particles down thereactor, thereby affecting the RTD and leading to uncertainreaction times.
Diffusers are routinely applied in larger systems such aswind tunnels and turbines; therefore, most literature on dif-fuser design focuses on flow patterns at high Re (Re> 5000,e.g., Mehta and Bradshaw, 1979; Seltsam, 1995; Tavoularis,2005; Prakash et al., 2014). As a rule of thumb for high Resystems, flow separation can be suppressed when the diffuserhalf-angle is ≤ 5◦; however, smaller angles are needed whenthe area ratio between the diffuser inlet and reactor sectionis much greater than 5 (Mehta and Bradshaw, 1979). We areunaware of studies that report diffuser performance at modestRe (< 500). Fried and Idel’chik (1989) recommend that dif-fusers be designed with an angle of divergence < 7◦ to avoidflow separation; alternatively, White (2008) recommends anangle < 15◦. Sparrow et al. (2009) modeled the flow of fluid
Atmos. Meas. Tech., 10, 839–867, 2017 www.atmos-meas-tech.net/10/839/2017/

Y. Huang et al.: The Caltech Photooxidation Flow Tube reactor 845
Uavg,injection Uavg,bulk
Uavg,injection >>Uavg,bulk
“Fire hose” effect
Uavg,1
Uavg,i
Uavg,2……
Uavg,bulk
Uavg,i Uavg,bulk
Static m ixer
Uavg,bulk
Reaction section
Reaction section
(a) Straight tube inlet
(b) Showerhead inlet
(c) Diffuser inlet
Reactantm ixture
Reactantm ixture
Entrance length, Lentr
Figure 4. Inlet designs exemplified by (a) straight tube injection, (b) showerhead injection and (c) diffuser injection. Uavg,injection, Uavg,bulkand Uavg,i values denote the average velocities at the inlet, in the bulk reaction section and at the exit of a showerhead hole, respectively.Panel (a) also illustrates the “fire hose” effect, as demonstrated by the visualization of smoke in a Pyrex glass tube.
through diffuser cones at various Re. For further discussionabout flow separation within diffusers, see Tavoularis (2005).
Under a typical working flow rate (2 L min−1), the value ofRe at the entrance of the conical diffuser is ∼ 200. Figure 5shows simulated flow profiles for a range of diffuser angles.The red traces represent streamlines, whereas the blue sur-face illustrates points where flow recirculation occurs, thatis, where the axial velocity < 0 cm s−1. Collectively, thesetraces provide a visualization of the recirculation zone. Wepresent flow profiles in the presence and absence of a staticmixer since swirling flow has been shown to improve dif-fuser performance for systems with appreciable separation(McDonald et al., 1971).
As the diffuser angle increases, separation becomes moreappreciable, and the recirculation zone penetrates farther intothe reaction section (1z > 0). At the most extreme angle weconsidered (θ = 37◦), the simulation predicts that the first46 cm of the reaction section is impacted by recirculation.For reference, the extreme of a sudden expansion (θ = 90◦)exhibits recirculation that penetrates nearly halfway throughthe reactor (1z= 110 cm). For flow tube systems operated atsimilar Re as here, if a parabolic flow profile is desired, it isrecommended that one utilizes a diffuser with θ < 20◦ in or-der to minimize laminar flow disturbance within the reactionsection.
The presence of a static mixer tends to quell separationat moderate diffuser angles. The recirculation zone appears
Static mixer + diffuser cone
θ = 19°
θ = 25°
θ = 30°
θ = 37°
Δz = 57 cm
Δz = 0 cm
Δz = 0 cm
Δz = 11 cm
Δz = 2 cm
θ = 90°
Δz
Δz = 46 cm
Δz = 37 cm
Δz = 26 cm
Δz = 1 cm
Δz = 110 cm
Diffuser cone only(a) (b)
Figure 5. COMSOL simulation results for a suite of diffuser anglesassuming isothermal conditions. Images in the left column are fromsimulations conducted in the absence of a static mixer. Images in theright column are from simulations employing a two-element staticmixer upstream of the diffuser cone. The red traces are streamlinesdemonstrating the flow pattern of fluid introduced upstream of thestatic mixer. The blue surfaces illustrate regions where the axial ve-locity < 0 m s−1. Together, these traces illustrate the recirculationzone.1z is the length that the recirculation zone penetrates into thereaction section. All simulations were performed for a volumetricreactor flow of 2 L min−1.
www.atmos-meas-tech.net/10/839/2017/ Atmos. Meas. Tech., 10, 839–867, 2017

846 Y. Huang et al.: The Caltech Photooxidation Flow Tube reactor
Figure 6. COMSOL simulated velocity field at the reactor inlet under isothermal conditions. Simulations were performed for the actualCPOT design: a 15◦ diffuser cone coupled to a static mixer. The velocity magnitude at various axial positions is shown in panel (a), and1-D axial velocity profiles within the “inlet-affected” region are shown in panel (b). The velocity magnitude in panel (b) is presented on theaxis below each velocity profile. Note that DL indicates diffuser length (53.3 cm). Panel (c) shows the normalized residence time of vapormolecules and monodisperse particles at various axial positions. A 30 s square wave pulse is used as the input.
to propagate into the reaction section only at diffuser angles> 30◦; however, the extent of this recirculation is substan-tially reduced compared to simulations in the absence of astatic mixer. Furthermore, the recirculation zone is predictedto be symmetric; fluid from the static mixer is directed radi-ally towards the walls of the diffuser and recirculates backtowards the center. In contrast, the recirculation zone in dif-fusers without static mixers is predicted to be asymmetric(Fig. 5), with flow recirculating at one wall of the diffuser.With flow introduced via a sudden expansion, the presenceof a static mixer does little to minimize recirculation. Theimprovement in diffuser performance with swirling flow atthe inlet is consistent with observations at high Re (McDon-ald et al., 1971), suggesting that the addition of a static mixermay help to mitigate moderate separation in systems employ-ing wide-angled diffusers.
Figure 6 further illustrates the CFD-modeled velocity pro-files for the actual CPOT design, with a 15◦ diffuser conecoupled to a static mixer, in the region of the reactor ex-tending from the inlet cone to the first 10 cm of the reactionsection. We refer to this section of the reactor as the “inlet-
affected” region, since axial positions farther downstream ex-hibit fully developed laminar profiles. Figure 6a visualizesthe entire velocity field along select cross sections within theinlet-affected region, whereas Fig. 6b presents 1-D velocityprofiles at various axial positions. Note that Fig. 6a presentsthe velocity magnitude, whereas Fig. 6b illustrates the axialvelocity component (i.e., flow in the z direction) to facilitateidentification of regions impacted by flow recirculation. Ingeneral, the simulation predicts the absence of recirculationwithin the reactor under isothermal conditions. As demon-strated by Fig. 6b, the simulated axial velocity profile im-mediately downstream of the static mixer exhibits two jetswith a maximum axial velocity of 31 cm s−1. The jets quicklydissipate as the flow develops through the diffuser cone. Atthe exit of the diffuser cone, the flow is nearly parabolic andthe maximum velocity slows to 0.5 cm s−1. Within 10 cm ofthe diffuser exit, the flow becomes parabolic with a maxi-mum centerline velocity of 0.4 cm s−1. We also simulated thefluid field under higher flow rates (e.g., 4 and 6 L min−1) andfound no separation of flow within the diffuser. These resultsdemonstrate that the CPOT inlet is within the design limits
Atmos. Meas. Tech., 10, 839–867, 2017 www.atmos-meas-tech.net/10/839/2017/

Y. Huang et al.: The Caltech Photooxidation Flow Tube reactor 847
for a diffuser with non-separated flows and that the presenceof a static mixer has little effect on the parabolic profile inan isothermal reaction section. However, the presence of thestatic mixer does have an impact on the residence time of thereactants. Figure 6c shows the corresponding residence timeat the three positions for both vapor molecules and monodis-perse particles, both of which are a 30 s square wave input.Section 4.3 addresses RTD.
3.3 Non-isothermal effect
Precise control of temperature is crucial to maintaining aswell-characterized a laminar flow as possible in the reactionsection (Khalizov et al., 2006; Jonsson et al., 2008). In oneclass of flow tube design, the radiation source is positionedwithin the flow tube reactor itself, and the reactor walls areconstructed of a UV blocking material. In that design, the ef-fect of the internal heat source on the flow must be taken intoaccount. In the present design, with the reaction tube sus-pended at the center of the chamber and the lights positionedon the outside of the tube, an exterior water jacket provides aheat transfer medium, while allowing penetration of UV ra-diation to the reactor. If water recirculation in the jacket issufficiently rapid, axial temperature gradients in the coolingjacket can be minimized. Any jacket temperature maintainedappreciably below or above that in the reactor itself will leadto temperature gradients that may induce secondary flows inthe reactor.
Although the CPOT is equipped with a temperature con-trol system (Sect. 2.3), maintaining a target temperature un-der UV irradiation is challenging. The measured rise incoolant temperature at steady state under full irradiation con-ditions is ≤ 0.2 K. Given the absence of heat sources withinthe reactor itself, the increase in coolant temperature is a re-sult of the absorption of heat generated by the exterior UVlamps. Temperature gradients along the reactor wall have thepotential to induce recirculation from changes in density. Theestablishment of radial temperature gradients near the wallinduces recirculation cells as density variations force the flowto stratify.
The dimensionless group that characterizes the effect offree convection on flow is the Richardson number, whichrelates the strength of buoyancy forces to that of convec-tive forces. The Richardson number (Holman, 2010), Ri, canbe expressed as the ratio of the Grashof number, Gr, to thesquare of the Reynolds number, Re:
Ri=GrRe2 =
gβD31T/ν2(ρUavgD/µ
)2 ∼ gD
TU2avg1T, (1)
where g is the gravitational acceleration, β is the thermalexpansion coefficient of air (1/T for ideal gases), Uavg isthe average fluid velocity, ν is the kinematic viscosity of air(µ/ρ) and 1T is a characteristic temperature difference be-tween the tube wall and centerline. When Ri< 0.1, convec-tive forces dominate, and effects of buoyancy on the flow are
small. When Ri> 10, buoyancy forces may lead to flow bi-furcation and recirculation. Under typical CPOT operatingconditions, a radial temperature gradient between the fluidand wall of ∼ 0.007 K is required to maintain Ri< 10. Be-cause this is a very small temperature difference, modest in-equalities in temperature are anticipated to affect flow pat-terns within the reactor.
To investigate the effect of wall temperature differenceson flow within the reaction section, we performed COM-SOL simulations, assuming a non-isothermal reactor wall.The COMSOL laminar flow package was coupled to the con-vective and diffusive heat transfer interface. Since water isassumed to flow uniformly through the annular water jacketcross section from the exit to the entrance, we apply an ax-ial temperature gradient to the simulation. A schematic il-lustration of the simulation setup is shown in Fig. 3c. Atthe exit of the reaction section, the temperature of the re-actor wall is set to that of water entering the cooling jacket(Tin). At the entrance to the reaction section, we assume thatthe wall temperature is that of the water exiting the coolingjacket (Tout = Tin+1T ). The wall temperature is assumedto change linearly between the entrance and exit. The dif-fuser cone is prescribed at a constant temperature equivalentto the cooling jacket temperature Tout, whereas the exit coneis prescribed a constant temperature of Tin. In the followingdiscussion, we focus on results with Tin = 23 ◦C, which is thetypical room temperature in the Caltech laboratory. Note thatthis model setup is a simplified case, since in actual experi-ments the entrance and exit cones should be kept at the sametemperature (i.e., Tin); this will introduce temperature dis-continuity between the entrance cone and the reaction tube.Nonetheless, this idealized model provides insight into thetemperature-difference-induced flow perturbation within theflow tube reactor.
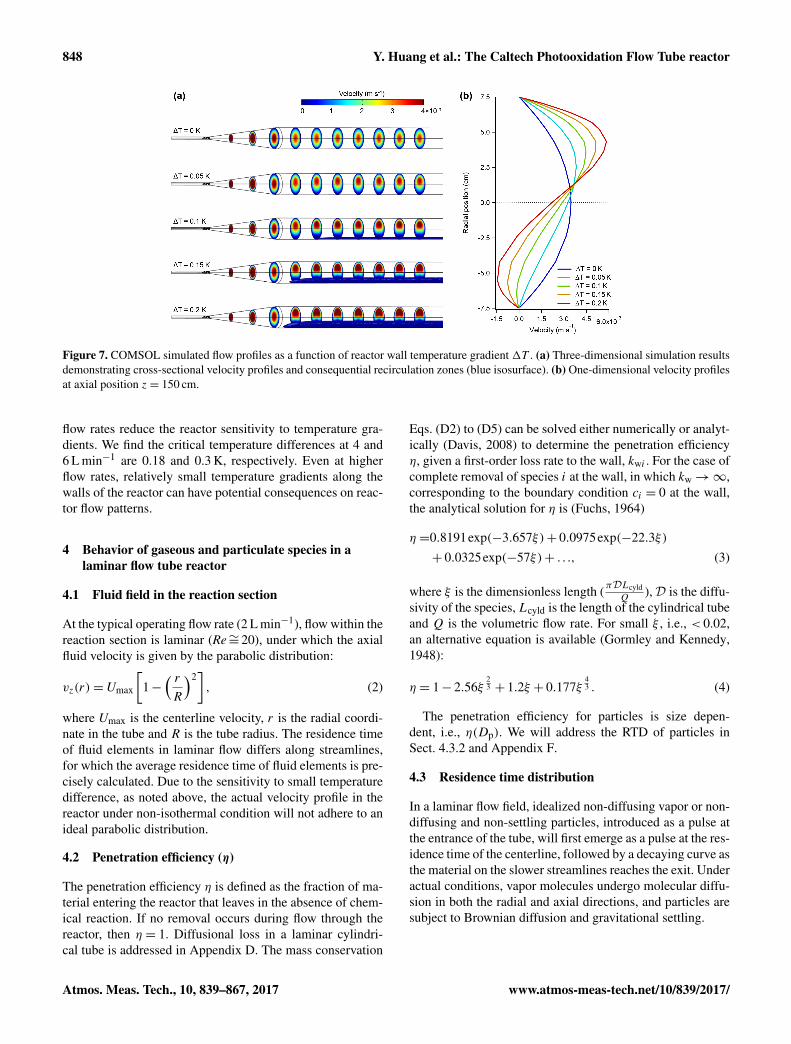
Figure 7 demonstrates the simulated effect of an axialtemperature gradient (1T ) on flow profiles within the reac-tor. Figure 7a illustrates 2-D velocity profiles at various ax-ial positions and a blue isosurface where the axial velocity< 0 cm s−1. Figure 7b illustrates 1-D velocity profiles at themidpoint of the reactor. As the temperature gradient withinthe reactor increases, the velocity profiles skew due to thebuoyancy of the warm air. This bifurcation induces recircu-lation and is predicted to affect the entire reactor region. Fora temperature gradient of 0.2 K (equivalent to that actuallymeasured), the recirculation zone exhibits a maximum ve-locity of −0.15 cm s−1.
The simulations demonstrate the sensitivity of the ve-locity profile in the reactor to small temperature gradientswithin the reaction section. Such disturbances will manifestin shorter, broader residence times due to induced recircu-lating flow. As demonstrated in Fig. 7, a critical temperaturedifference exists at which recirculation becomes important.At a volumetric flow of 2 L min−1, this critical temperaturedifference between the exit and the entrance is estimated tobe ∼ 0.08 K. The Ri number criterion indicates that higher
www.atmos-meas-tech.net/10/839/2017/ Atmos. Meas. Tech., 10, 839–867, 2017
848 Y. Huang et al.: The Caltech Photooxidation Flow Tube reactor
Figure 7. COMSOL simulated flow profiles as a function of reactor wall temperature gradient1T . (a) Three-dimensional simulation resultsdemonstrating cross-sectional velocity profiles and consequential recirculation zones (blue isosurface). (b) One-dimensional velocity profilesat axial position z= 150 cm.
flow rates reduce the reactor sensitivity to temperature gra-dients. We find the critical temperature differences at 4 and6 L min−1 are 0.18 and 0.3 K, respectively. Even at higherflow rates, relatively small temperature gradients along thewalls of the reactor can have potential consequences on reac-tor flow patterns.
4 Behavior of gaseous and particulate species in alaminar flow tube reactor
4.1 Fluid field in the reaction section
At the typical operating flow rate (2 L min−1), flow within thereaction section is laminar (Re∼= 20), under which the axialfluid velocity is given by the parabolic distribution:
vz(r)= Umax
[1−
( rR
)2], (2)
where Umax is the centerline velocity, r is the radial coordi-nate in the tube and R is the tube radius. The residence timeof fluid elements in laminar flow differs along streamlines,for which the average residence time of fluid elements is pre-cisely calculated. Due to the sensitivity to small temperaturedifference, as noted above, the actual velocity profile in thereactor under non-isothermal condition will not adhere to anideal parabolic distribution.
4.2 Penetration efficiency (η)
The penetration efficiency η is defined as the fraction of ma-terial entering the reactor that leaves in the absence of chem-ical reaction. If no removal occurs during flow through thereactor, then η = 1. Diffusional loss in a laminar cylindri-cal tube is addressed in Appendix D. The mass conservation
Eqs. (D2) to (D5) can be solved either numerically or analyt-ically (Davis, 2008) to determine the penetration efficiencyη, given a first-order loss rate to the wall, kwi . For the case ofcomplete removal of species i at the wall, in which kw→∞,corresponding to the boundary condition ci = 0 at the wall,the analytical solution for η is (Fuchs, 1964)
η =0.8191exp(−3.657ξ)+ 0.0975exp(−22.3ξ)+ 0.0325exp(−57ξ)+ . . ., (3)
where ξ is the dimensionless length (πDLcyldQ
),D is the diffu-sivity of the species, Lcyld is the length of the cylindrical tubeand Q is the volumetric flow rate. For small ξ , i.e., < 0.02,an alternative equation is available (Gormley and Kennedy,1948):
η = 1− 2.56ξ23 + 1.2ξ + 0.177ξ
43 . (4)
The penetration efficiency for particles is size depen-dent, i.e., η(Dp). We will address the RTD of particles inSect. 4.3.2 and Appendix F.
4.3 Residence time distribution
In a laminar flow field, idealized non-diffusing vapor or non-diffusing and non-settling particles, introduced as a pulse atthe entrance of the tube, will first emerge as a pulse at the res-idence time of the centerline, followed by a decaying curve asthe material on the slower streamlines reaches the exit. Underactual conditions, vapor molecules undergo molecular diffu-sion in both the radial and axial directions, and particles aresubject to Brownian diffusion and gravitational settling.
Atmos. Meas. Tech., 10, 839–867, 2017 www.atmos-meas-tech.net/10/839/2017/

Y. Huang et al.: The Caltech Photooxidation Flow Tube reactor 849
4.3.1 Vapor molecule RTD
Vapor molecules in laminar flow in a tube undergo moleculardiffusion in both the radial and axial directions. With molec-ular diffusion coefficientDi , the characteristic diffusion timein the radial direction is τc,Di =
R2
Di . To assess the impor-tance of radial diffusion as a mechanism for smearing va-por molecules across the tube cross section during convectiondown the tube, one can compare the characteristic timescalefor radial diffusion with the characteristic residence time inthe cylindrical tube, τc,cyld =
LcyldUavg
. If τc,Di � τc,cyld, for ex-ample, the vapor molecules will diffuse more or less uni-formly across the tube radius in the time it takes for thefluid to flow to the tube exit. Likewise, if τc,Di � τc,cyld,each vapor molecule will effectively remain on the stream-line upon which it entered. Vapor molecules also diffuse inthe axial direction; this process is represented by the axialdiffusion term, Di ∂
2ci∂z2 , on the right-hand side of Eq. (D1).
As noted earlier, for flow velocities of the magnitude ofthose here, the effect of this axial diffusion is negligiblewhen compared with axial convection. However, an appar-ent axial diffusion can arise from the interaction of radialmolecular diffusion and the laminar flow, a process knownas Taylor dispersion (Taylor, 1953; Bird et al., 2007). Underthe criterion, τc,cyld�
τc,Di3.832 , the concentration becomes ap-
proximately uniform over the cross section of the tube. Ap-pendix E presents a discussion of the application of Taylor-dispersion-based RTDs with respect to different initial con-ditions.
In the PAM reactor (Lambe et al., 2011a), the Taylor dis-persion criteria do not strictly meet the working conditions;however, the two flow regime fitting results suggest that twotypes of flow may exist in the reactor: a direct flow with mi-nor dispersion and a secondary recirculation flow with signif-icant dispersion. Under the current flow rate of 2 L min−1 andcharacteristic vapor molecular diffusivity∼ 1×10⁻⁵ m2 s−1,τc,cyld = 1290 s�
τc,Di3.832 = 50 s; therefore, the Taylor disper-
sion approximation for the gas-molecule RTD applies, andTaylor dispersion can be expected to be important. Note thatthe presence of the static mixer and conical diffuser in theinlet section alters the input distribution of vapor moleculesand particles at the entrance of the reaction section (Fig. 6c)from an idealized uniform initial condition, and Eq. (E3) willnot hold exactly for the fitting of the results from actual pulseRTD experiments. The convolution (Eq. E6) of the skewedinput shape must be numerically calculated. The actual RTDof the reactor should also include the RTDs in the exit coneand sample line.
4.3.2 Particle RTD
For the behavior of particles in the reactor, in general,the following processes need to be accounted for: (1) ad-vection, (2) Brownian diffusion, (3) gravitational settling,(4) growth/shrinkage due to mass transfer from or to the gas
phase, and (5) coagulation. The particle number concentra-tion distribution as a function of particle diameter Dp is de-noted n(Dp, r,z). Processes (1)–(4) are related to the penetra-tion efficiency, while the total mass of particles are conservedduring the coagulation process with the size distribution be-ing shifted. To discuss the penetration efficiency, coagula-tion is not included here, which will be further discussed inSect. 5.1.2
In general, particles undergo both Brownian diffusion inthe flow as well as settling under the influence of gravity. Col-lectively, these processes give rise to particle loss by deposi-tion on the wall during transit through a laminar flow tubereactor. The Brownian diffusion coefficient of a 80 nm diam-eter particle is approximately 4 orders of magnitude smallerthan that of a typical vapor molecule. Consequently, for typi-cal particle sizes and residence times in the reactor, the Brow-nian diffusion of particles can be neglected, except in the re-gion very close to the wall, wherein particle uptake at thewall because of diffusion can occur. Gravitational settling ofparticles in a horizontal tubular flow reactor occurs as parti-cles fall across streamlines and deposit on the lower half ofthe tube. To assess the effect of gravitational settling of parti-cles, one needs to compare the characteristic settling distanceduring transit through the reactor, vsτc,cyld, with the tube ra-dius, R, where vs is the particle settling velocity. Figure 8shows the size-dependent settling velocity and particle diffu-sivity for spherical particles. Under typical operating condi-tions, particles introduced uniformly across the entrance willtend to settle somewhat during transit down the reactor, sothis process needs to be accounted for in analyzing particleRTDs. The full equation describing the motion of particles inthe horizontal tubular laminar flow under simultaneous dif-fusion and settling cannot be easily solved. As suggested bythe particle-size dependence of settling velocity and diffusiv-ity in Fig. 8, consideration of the two separate regimes, i.e.,diffusion and settling, respectively, can simplify the problem.Here we define the diffusion regime as that for particles withdiameter ≤ 80 nm and otherwise for the settling regime. Ineach regime, we will consider only one process, i.e., eitherdiffusion or settling.
A discussion of the motion of particles in the settlingregime is presented in Appendix F. The corresponding RTD(Eq. F4) can be calculated based on the particle trajecto-ries. In the diffusion regime, the settling velocity can be ig-nored, and Taylor dispersion is not applicable. The RTD ofa pulse input can be approximated by the residence timealong each streamline (Eq. F7). Since actual particles un-dergo some degree of radial Brownian diffusion, which is notconsidered in Eq. (F7), the full RTD should exhibit a broaderand smoother profile than that predicted by Eq. (F7) (as sim-ulated by COMSOL; see Sect. 5.2.2).
The penetration efficiency (η) for mono-disperse particlescan be calculated in their respective regimes. In the settlingregime, Eq. (F6) calculates the size-dependent η. The behav-ior of particles in the diffusion regime can be calculated by
www.atmos-meas-tech.net/10/839/2017/ Atmos. Meas. Tech., 10, 839–867, 2017

850 Y. Huang et al.: The Caltech Photooxidation Flow Tube reactor
10-6
10-5
10-4
10-3
10-2
Set
tling
vel
ocity
(cm
s)
-1
102 3 4 5 6 7 8 9
1002 3 4 5 6 7 8 9
1000Diameter (nm)
10-7
10-6
10-5
10-4
10-3
Diffusivity (cm
2 s-1)
Settling velocity Diffusivity
Figure 8. Particle settling velocity and Brownian diffusivity forspherical particles of unit density as a function of particle diame-ter (Seinfeld and Pandis, 2016).
Eqs. (3) and (4), where removal of particles at the wall is as-sumed. This is consistent with the boundary condition of theparticles in the settling regime.
5 Results and discussion
5.1 Experimental evaluation of penetration efficiency
The penetration efficiency (η) was determined by using aconstant input of either gas-phase species (SO2, O3 andH2O2) or polydisperse ammonium sulfate particles throughthe static mixer or through the flow tube. The RH-dependentpenetration efficiency is investigated for both gas-phasespecies and particles. The results are shown in Fig. 9.
5.1.1 Vapor molecules
The η of O3 in both the static mixer and the flow tube isconstant (η ∼ 98 %) over a wide RH range. SO2 shows noremoval by the static mixer, while H2O2 exhibits a lose of 20to 40 % in the static mixer. The measured η values in the flowtube of all the gas-phase species (O3, SO2 and H2O2) are es-sentially 100 % under dry conditions (RH< 5 %). In the flowtube, the η values of both SO2 and H2O2 decrease with RH.At RH= 42 %, about 70 % of H2O2 is lost, while at this RHabout 20 % of SO2 is lost. These results show the complexityof the η of gas-phase species. The extent of wall depositionof organic vapors in the flow tube reactor requires a compre-hensive study and will be addressed in a future publication.
5.1.2 Particles
The η values for polydisperse ammonium sulfate particlesare also investigated at different RH. No RH dependencewas found for RH< 50 %, which is below the deliquescenceRH of ammonium sulfate (results not shown). Figure 9c andd show the measured size distributions before and after thestatic mixer and the flow tube, as well as the size-dependentpenetration efficiency obtained as a ratio. Figure 9c indicates
that about half of the small particles (< 50 nm) are lost in thestatic mixer, while large particles (> 100 nm) penetrate es-sentially entirely through the static mixer. This is reasonablesince the flow inside the static mixer is laminar (Re= 150).The smaller particles diffuse to the static mixer, while thelarger ones follow the flow streamline.
The theoretical particle η curves under the influence ofloss by gravitational settling and diffusion have also been cal-culated by applying the relevant parameters to Eqs. (4) and(F6) (Fig. 9d). Only the reaction sections were consideredin this theoretical calculation (i.e., the inlet and exit conesare excluded). We consider this calculation as a qualitativeguideline for η. Settling velocity and diffusivity of particlesare size dependent (Fig. 8), resulting in reduced transmissionfor very small and large particles due to diffusion loss andgravitational settling, respectively. Both measurements andtheory indicate that η is maximized at a particle diameter ofapproximately 100 nm. The measured maximum penetrationefficiency is ∼ 80 %, indicating a loss of particles, which islikely caused by secondary flow that actively conveys parti-cles closer to the wall. This secondary flow will be discussedin Sect. 5.3. Also, the behavior of particles in the exit cone isdifficult to predict and may reflect a certain extent of particleloss.
A numerical coagulation model is used to check the influ-ence of coagulation on particle size distribution. This modeluses a PFR framework with an average residence time of1520 s, which is the measured particle average residence time(Sect. 5.2.2). A unity coagulation efficiency is assumed andno wall deposition of particles. The result is shown in Fig. 10.The comparison indicates that the coagulation process low-ers the small particle number, accounting for about half of themissing small particles. The total particle number concentra-tion and average residence time are the two key parametersthat impact the coagulation process. Coagulation will havea negligible influence in the case of smaller particle numberand shorter residence time. The CPOT typically uses parti-cle number and surface concentrations in the order of magni-tude of 104 cm−3 and 103 µm2 cm−3. Note that coagulationprocess itself has an impact only on the size distribution notthe total particle mass. However, the presence of coagulationmay enhance the gravitational settling effect due to the pro-duction of larger particles.
5.2 Experimental evaluation of RTD
We present here the results of experimental evaluation ofthe RTD for both vapor molecules and particles. The RTDprofiles were determined by introducing a 30 s pulse of O3or polydisperse ammonium sulfate particles into the reac-tor under dry conditions (RH< 5 %). All experiments wereperformed at the typical operating flow rate of 2 L min−1 inat least triplicate. The average residence time (τavg) was ob-
Atmos. Meas. Tech., 10, 839–867, 2017 www.atmos-meas-tech.net/10/839/2017/

Y. Huang et al.: The Caltech Photooxidation Flow Tube reactor 851
0 10 20 30 40 50
0.0
0.2
0.4
0.6
0.8
1.0
SO2
Pene
tratio
n ef
ficie
ncy
Relative h umidity (%)
H2O
2 O
3
1.0x10⁵
0.8
0.6
0.4
0.2
0.0dN
/dlo
gD
p10
2 4 6 8
1002 4 6 8
1000
Dp (nm)
1.0
0.8
0.6
0.4
0.2
0.0
Penetration efficiency (η) I
nle
t O
utle
t
PEexperiment
PEdiffusion
PEsettling
3.6x10⁴
3.0
2.4
1.8
1.2
0.6
0.0
dN
/dlo
gD
p
102 4 6 8
1002 4 6 8
1000
Dp (nm)
1.2
1.0
0.8
0.6
0.4
0.2
0.0Penetration efficiency (η
) Atm
ize
r S
atic M
ixe
r P
Ee
xp
erim
en
t
(a) (b)
(c) (d)
0 10 20 30 40 50
0.0
0.2
0.4
0.6
0.8
1.0
Relative humidity (%)
Pene
tratio
n effi
cien
cy
SO2
H2O
2 O
3
Figure 9. Penetration efficiency (η) of gases and particles in the static mixer and the flow tube. (a) Relative-humidity-dependent η of SO2,H2O2 and O3 in the static mixer. (b) Relative-humidity-dependent η of SO2, H2O2 and O3 in the flow tube. Error bar indicates the measureduncertainty. (c) Measured ammonium sulfate particle size distributions before and after the static mixer, as well as the η derived from thesemeasurements. The gray dashed line indicates η = 1, i.e., no particle loss. (d) Measured ammonium sulfate particle size distributions at theinlet and outlet of the flow tube, as well as the η derived from these measurements. The calculated η with respect to particle diffusion loss(Eq. 4) and gravitational settling (Eq. F6) are indicated by the dashed lines.
1.0x10⁵
0.8
0.6
0.4
0.2
0.0
dN/d
logD
p
102 3 4 5 6 7
1002 3 4 5 6 7
1000Dp (nm)
Inlet Outlet Diffusion Settling Coagulation
Figure 10. Particle size distributions at the outlet when diffusion,gravitational settling and coagulation processes are coupled sepa-rately with the size distribution at the inlet. The measured size dis-tribution at the outlet is plotted as a reference. The coupling of dif-fusion and gravitational settling with the inlet size distribution isthe product of dashed lines and the red line in Fig. 9d. The coag-ulation process is calculated in a coagulation model, which uses aPFR model with an average residence time of 1520 s by assuminga unity coagulation efficiency and no wall deposition. The coagula-tion model input is the size distribution at the inlet.
tained from each RTD profile according to
τavg =6Ij tj
6Ij, (5)
where Ii is the signal recorded at each time step tj .
5.2.1 Vapor molecules
As noted earlier, a typical value of diffusivity, 1×10⁻⁵ m2 s−1, is used in COMSOL to predict the gas-phaseRTD. Measured and predicted gas-phase RTDs are shown inFig. 11a. A large discrepancy is observed between the mea-sured and theoretical RTD under presumed isothermal con-ditions. The predicted gas-phase RTD exhibits a symmetri-cal distribution centered at approximately 27 min. However,the measured RTD of gas-phase O3 exhibits an asymmetricalfeature, somewhat similar to the particle RTD (Fig. 11b). Theτavg values obtained from the O3 pulse experiments and sim-ulations are also summarized in Fig. 11a. The measured τavgvalue of O3 is shorter than predicted by 1.5 min. Potentialexplanations for measured RTDs are discussed in Sect. 5.3.
5.2.2 Particles
A typical value of particle diffusivity, 1× 10⁻⁹ m2 s−1, cor-responding to that of a ∼ 100 nm diameter particle, is usedin COMSOL to predict the RTD. Figure 11b compares themeasured RTD of polydisperse ammonium sulfate particlesto that of the COMSOL simulation. Under isothermal con-
www.atmos-meas-tech.net/10/839/2017/ Atmos. Meas. Tech., 10, 839–867, 2017

852 Y. Huang et al.: The Caltech Photooxidation Flow Tube reactor
1.0
0.8
0.6
0.4
0.2
0.0
Nor
mal
ized
O3
mix
ing
ratio
100806040200Minutes after pulse (min)
1.0
0.8
0.6
0.4
0.2
0.0
Nor
mal
ized
par
ticle
cou
nt
30
29
28
27
26
25
24
Ave
rage
res
iden
ce ti
me
(τav
g)
(min
)
O3 Modeled
30
29
28
27
26
25
24
Ave
rage
res
iden
ce ti
me
(τav
g)
(min
)
Isothermal Light Modeled
Experiment Isothermal model
(a)
Experiment With light Isothermal
Model
Isothermal
(b)
Figure 11. Experimental and COMSOL simulated residence time distributions of (a) O3 vapor molecules and (b) polydisperse ammoniumsulfate particles. The diffusivity used in COMSOL for O3 is that for a generic gas-phase species 1× 10⁻⁵ m2 s−1 and for particles is1×10−9 m2 s−1 corresponding to a particle size of∼ 100 nm. The average residence time in each case is compared in the insets as reference.
ditions, the particle RTD exhibits a zigzag feature, whichis likely due to the static mixer that may distribute parti-cles somewhat unevenly across streamlines, as can be seenin the velocity profile in Fig. 6a. As laminar flow devel-ops in the reaction section, particles follow their respectivestreamlines until the exit cone, appearing as the zigzag pat-tern on the RTD profile. This zigzag feature is absent in thevapor molecule RTD, likely due to the larger diffusivity ofvapor molecules. The theoretical RTD of particles in an ide-alized laminar flow reactor exhibits a sharp peak when thecenter line first arrives at the exit (Eq. F7). The experimen-tal RTD observed exhibits a rather gradual rise instead of asharp pulse likely due to the method of introduction (Fig. 6c).Figure 11b shows that, under isothermal conditions, the mod-eled RTD reproduces the shape and the peak time of the ob-served RTD, and the τavg values also show excellent agree-ment. However, the modeled RTD appears narrower than thatobserved. This indicates that particles arrive earlier and re-main for a longer time than COMSOL predicts.
Overall, the experimental RTD results of both gas-phasespecies and particles in the CPOT are essentially comparableto those of present flow reactors (Lambe et al., 2011a), giventhe arrival time and the width of the peak. This discrepancyof the RTDs between the theoretical laminar flow and the realflow indicates the presence of non-ideal flow in the reactor.
5.3 Non-ideal flow in the reactor
The discrepancy between isothermal laminar flow theory andthe experimental results can be attributed in part to non-isothermal conditions in the reactor. As noted earlier, theRichardson number (Eq. 1) criterion indicates that a smalltemperature difference (∼ 0.007 K) between the bulk and thewall can induce recirculation flows. The measured particleRTDs under isothermal conditions are compared to that ob-tained under maximum UVA radiation in Fig. 11b. A pro-nounced difference is that the RTD curve under radiationappears much smoother. The τavg value under irradiation isshortened by 1.5 min compared to that under isothermal con-ditions. Given the close agreement between the two RTD pro-files, it is unlikely that a recirculation within the tube exists;more likely, the slight non-isothermal condition has createdsecondary flows that act to mix the tracers both radially andaxially.
To further investigate non-isothermal effects, the temper-ature of the water jacket was raised in a step-wise mannerto approach a significant temperature difference between thebulk flow and the wall. The experiments were conductedin the absence of UV radiation. The injected air was atroom temperature (approximately 23 ◦C), so a higher waterjacket temperature exacerbates the deviation from isothermalconditions. The results of these experiments are shown in
Atmos. Meas. Tech., 10, 839–867, 2017 www.atmos-meas-tech.net/10/839/2017/

Y. Huang et al.: The Caltech Photooxidation Flow Tube reactor 853
Fig. 12. The RTD at each temperature is the average of threeto four replicates. As shown in Fig. 12a, the RTD at 25 ◦Cappears indistinguishable from that at quasi-isothermal con-ditions (the dashed line; we use “quasi-isothermal” here todistinguish from strict isothermal conditions in the model).Particles arrive at the exit cone earlier at higher water jackettemperatures, mirroring the observed discrepancy betweenthe modeled and observed RTD profiles. This trend is clearlyillustrated by Fig. 12b, where the arrival time of particles ineach experiment is shown as a function of the water jackettemperature. This observation is consistent with the hypoth-esis that a difference in temperature between the wall and theinlet flow leads to the non-ideal conditions.
Consider that the wall of the reactor is at a constant roomtemperature as slightly cooler air is introduced into the re-actor. Two orthogonal forces interact with each other in thehorizontal flow tube when they are of similar orders of mag-nitude: forced convection by the pressure gradient (horizon-tal) and buoyancy-induced free convection (vertical). The ac-tual velocity field in this situation is challenging to simu-late (Iqbal and Stachiewicz, 1966; Mori and Futagami, 1967;Faris and Viskanta, 1969; Siegwarth et al., 1969). Gener-ally, to satisfy mass conservation, the air close to the wallis warmed and rises along the side wall, inducing a down-ward flow in the center of the tube, forming two symmet-ric vortices. Superposition of the primary forced convectiveand the secondary free convective flows converts the verticalrecirculation into spiral motions along the tube. The spiralflow developed in the reaction section plays a similar role asthe static mixer in the inlet section. The spiral flow is moreeasily established if there are hot spots inside, which can belikely, as the sample ports on the reaction sections are notheat-insulated by the water jacket. To quantitatively representthis effect, one can introduce an enhanced isotropic eddy-likediffusivity (De), a statistical fluid-field-related property.
To verify the presence of the spiral secondary flow in theCPOT, we systematically increased the diffusivity used inthe COMSOL simulations. The agreement between simu-lated and observed RTD improves, as the value of De is in-creased in the COMSOL simulation, with the optimal agree-ment achieved whenDe = 4.5×10⁻⁴ and 6.0×10⁻⁴ m2 s−1
for O3 and particles, respectively (Fig. 13). These De valuesare, respectively, 45 and 6×10⁵ times the diffusivity of vapormolecules and particles from the strictly parabolic flow basecase (Fig. 11). The vapor molecule RTD (Fig. 13a) no longerexhibits the symmetrical feature of the base case, due to theenhanced Taylor dispersion. The particle RTD (Fig. 13b) isalso substantially broadened compared to the base case andexhibits close agreement with the observations. The optimalDe values for vapor molecules and particles are similar, sug-gesting that the molecular diffusion in the CPOT is domi-nated by the secondary flows. This offers an explanation forthe similarity in the observed RTD profiles of O3 and parti-cles, despite orders of magnitude difference in their inherentdiffusivity.
1.0
0.8
0.6
0.4
0.2
0.0
Nor
mal
ized
par
ticle
cou
nts
181614121086
Time after pulse (min)
16
15
14
13
12
11
10
Firs
t arr
ival
tim
e (m
in)
31302928272625
Flowtube temperature (°C)
(a) (b)Flowtube temperature (ºC):
31.5 30.7 29.5 28.3 27.2 26.1 25.0 ~23 (isothermal)
Figure 12. Non-isothermal effects on particle RTD. The waterjacket temperature was raised systematically against the room tem-perature (∼ 23 ◦C). (a) Normalized ammonium sulfate particlecounts recorded at the exit are plotted against time after a pulseis introduced at the inlet. The experiment at each temperature isrepeated three to four times. The results from a set of isothermal ex-periments are also included (dashed line) for reference. (b) Arrivaltimes of the first major peak of each experiment.
1.0
0.8
0.6
0.4
0.2
0.0
Nor
mal
ized
par
ticle
cou
nt
806040200Time after pulse (min)
1.0
0.8
0.6
0.4
0.2
0.0
Nor
mal
ized
O3
mix
ing
ratio
ExperimentModel:
COMSOL simulation Fitting of Eq.(E5)
(a)
(b)
Figure 13. Comparison of experimentally determined RTD of(a) O3 vapor molecules and (b) polydisperse ammonium sulfateparticles to optimized simulation results employing an eddy-likediffusivity (De) in the Taylor dispersion model. The COMSOL sim-ulation employs an optimal De values of 4.5×10⁻⁴ m2 s−1 for O3and 6.0× 10⁻⁴ m2 s−1 for particles. The fittings of Eq. (E5) em-ploys the same optimal De, as well as an optimal average velocity(Uavg,fit) of 2.1× 10⁻³ m s−1 and an optimal characteristic resi-dence time (τc,cyld,fit) of 1360 s.
www.atmos-meas-tech.net/10/839/2017/ Atmos. Meas. Tech., 10, 839–867, 2017

854 Y. Huang et al.: The Caltech Photooxidation Flow Tube reactor
To further evaluate the De values determined from theCOMSOL simulations and the hypothesis of secondaryflows, one can adopt a separate approach to examine De.Given the mixing provided by the static mixer and the conicaldiffuser, the optimal values of De can be applied in Eq. (E5).The values ofUavg,fit and τc,cyld,fit are adjusted to find the bestmatch between Eq. (E5) and the observed RTD profiles. Theoptimal fitting results are shown in Fig. 13. The fitted aver-age flow velocity (Uavg,fit) is 2.1×10⁻³ m s−1, which resultsin a characteristic residence time τc,cyld,fit of 1360 s. ThisUavg,fit value agrees well with the designed average veloc-ity (2.0× 10⁻³ m s−1). This observation again suggests thatthe non-isothermal secondary-flow-induced eddy-like diffu-sion dominates the mass transport process in the tube.
Overall, these results highlight the importance of temper-ature effects in approaching an ideal flow condition in a gas-phase laminar flow reactor. Even a small temperature devi-ation can likely create secondary flows in the flow field thataffect both the RTD and the τavg of tracers. It is to be notedthat these secondary flows occurring at Re∼= 20 should bedistinguished from the classic turbulent flow.
6 Photochemical model
6.1 Behavior of species in the models
The fitted parameters in Sect. 5.3 have been used in the sim-ulation of the photochemical reactions, and the results areshown in Fig. 14. The absorption cross section of H2O2 in-creases exponentially towards shorter wavelengths; hence,the Hg vapor lamp (Fig. 2) is highly efficient in photolyz-ing H2O2, whereas the efficiency drops substantially whenUVB and UVA lamps are employed (Fig. 14a). The decayof SO2 (Fig. 14b) and the steady-state concentration of theOH radical (Fig. 14c) follow the photolysis rates of H2O2under each type of radiation. The model simulation also con-firms that the OH radical reaches a steady state immediately,with its steady-state concentration, ranging from ∼ 106 to∼ 109 molecules cm−3, staying uniform along the entire tubein the presence of a high mixing ratio of H2O2.
As mentioned in Sect. 2.2, a small amount of the 185 nmradiation is present in the CPOT when Hg vapor lamps areequipped. Radiation at 185 nm generates additional OH rad-icals via photolysis of O2 and subsequent reaction betweenO(1D) and H2O. We have performed control simulations toinvestigate the relative contribution of the OH radical gener-ated from this pathway. No OH was generated in the absenceof photolysis of O2 that happens only in the presence of the185 nm radiation (data not shown). With the full Hg vaporemission, even at an RH as low as 5 %, a significant amountof the OH radical was generated in the absence of H2O2. TheSO2 decay without H2O2 was approximately half that withH2O2 (Fig. 14b). The OH concentration at the end of the re-actor reached the same level as the case in which H2O2 is
added (Fig. 14c) but a major difference was observed in theconcentration profile of the OH radical along the tube. With-out H2O2, the OH concentration increases along the tube, andconsequently the decay profiles of SO2 do not follow that ofa first-order decay.
Discrepancies were observed in the H2O2 and SO2 con-centration profiles near the inlet and exit of the CPOT be-tween the PFR and AD-PFR models (Fig. 14a and b). Thesediscrepancies arise from the necessary Danckwerts boundarycondition, which is more significant at higher oxidation lev-els. The profiles indicate the effect from the axial dispersion,which arises from the axial mixing induced by secondaryflow inside the reactor. The axial dispersion always acts tolower the conversion of the reactant by smoothing the con-centration gradient caused by reactions.
6.2 OH exposure calculation
The OH exposure (OHexp) is commonly obtained based onthe PFR assumption, using the initial and final concentrationsof SO2, i.e., [SO2]0 and [SO2]τ . However, to use the PFR as-sumption, the effects of radial and axial dispersion need tobe addressed. Under the PFR framework, radial diffusion isconsidered to be rapid, such that the concentration is uni-form within a cross section. This assumption can be justifiedby comparing the radial diffusion timescale (R2/D) with theaxial convection timescale (L/U ), i.e., R/LPe, where Pe isthe Péclet number. A ratio of ∼ 0.01 with the fitted parame-ters indicates that radial diffusion is approximately 100 timesfaster than axial convection and that a uniform cross-sectionconcentration can be expected in the absence of any chemi-cal reactions. The dimensionless group that relates the reac-tion rate to the diffusion rate is the Damköhler number (Da=kIR2
D , where kI is a first-order reaction rate constant). In thecase of the oxidation of SO2 by OH, kI
= kIISO2+OH[OH]. If
Da� 1, the radial diffusion rate is much faster than the reac-tion rate, and a uniform cross-section concentration results.In the current chemical system, even with the Hg vapor lamps(the largest jH2O2 and therefore the most rapid kI), the Davalue is 0.011� 1. We conclude that radial diffusion willdominate in the reactor and that the simplified 1-D modelframework is valid.
The effect of axial dispersion, in contrast, should be ac-counted for in interpreting experimental data (Donahue et al.,1996; Howard, 1979). For the first-order reaction system,Howard (1979) showed that the presence of axial dispersionlowers the effective rate constant of a pseudo-first-order reac-tion by the factor (1−Dk
I
U2 ). This correction factor also appliesto the OHexp calculation.
Starting from the continuity equation, by the assumptionof pseudo-first-order reaction (kI
= kII[OH]), the equationgoverning the steady-state concentration of the tracer down
Atmos. Meas. Tech., 10, 839–867, 2017 www.atmos-meas-tech.net/10/839/2017/

Y. Huang et al.: The Caltech Photooxidation Flow Tube reactor 855
106
2
4
6
810
7
2
4
6
810
8
2
4
6
810
9
OH
co
nce
ntr
atio
n (
mo
lec c
m-3
)
1.00.80.60.40.20.0
Dimensionless distance (x/Ltube)
UVA UVB Hg lamp w H2O2
Hg lamp w/o H2O2
AD-PFR PFR
100
90
80
70
60
50
40
SO
2 m
ixin
g r
atio
(p
pb
)
1.00.80.60.40.20.0
Dimensionless distance (x/Ltube)
UVA UVB Hg lamp w H2O2
Hg lamp w/o H2O2
AD-PFR PFR
1000
800
600
400
200
0
H2O
2 m
ixin
g r
atio
(p
pb
)
1.00.80.60.40.20.0
Dimensionless distance (x/Ltube)
AD-PFR PFR
UVA UVB Hg lamp w H2O2
Hg lamp w/o H2O2
(a) (b) (c)
Figure 14. One-dimensional photochemical model using axially dispersed assumption (AD-PFR, solid line) and plug flow assumption (PFR,dashed line). In the simulation, 1 ppm H2O2 and 100 ppb SO2 at RH= 5 % and T = 295 K is used. Hg vapor (purple), UVB (green) and UVA(red) lamps at full emission are used to drive the photochemical reactions. (a) Axial profile of H2O2, (b) axial profile of SO2 and (c) axialprofile of OH.
the tube C(z) is
UdCdz=D
d2C
dz2 − kIC. (6)
Given two appropriate boundary conditions, one can ob-tain an analytical solution to Eq. (6). In order to use thesame initial condition in the AD-PFR model as that in thePFR model, the second-order differential equation can be re-duced to a first-order equation through scale analysis. Scal-ing C ∼ C0, where C0 is the concentration of the tracer in thefeed, and z∼ U/kI, Eq. (6) becomes
fd2C
dz2 −dCdz− C = 0, (7)
where C = CC0
, z= kI
Uz and f = DkI
U2 . In the CPOT sys-tem, typical parameter values are D ∼ 10−4 m2 s−1, kI
∼
10−4 s−1 and U ∼ 10−3 m s−1; thus f ∼ 10−2. Due to therelatively small magnitude of f , neglecting the second-orderderivative term in Eq. (7), the solution of Eq. (7) is
C(z)= C0 exp(−kI
Uz
). (8)
Although f is small, it is not identically zero. To accountfor the perturbation that occurs due to the small axial disper-sion term in Eq. (6), we substitute Eq. (8) into the diffusionterm but retain the advection term in derivative form:
UdCdz=D
(−kI
U
)2
C− kIC =−kI(1− f )C. (9)
Then, substituting dt = dzU
and kI= kII[OH] in Eq. (9) one
obtains
dCdt=−kII(1− f )C[OH]. (10)
In so doing, the diffusion–advection equation has been re-duced to a single advection equation, in which the effect ofaxial dispersion is incorporated into the factor 1− f .
Integrating Eq. (10), we obtain the OHexp expression thataccounts for the presence of axial dispersion:
OHexp =
∫[OH]dt =
1kII(1− f )
lnC0
Cτ. (11)
Eq. (11) offers two ways to calculate OHexp.The left-hand term is a direct calculation based on the def-
inition of exposure, and the integration incorporates the RTDinduced by non-ideal flow conditions. This direct calculationof OHexp is most feasible by integrating a mechanism of OH-tracer chemistry, since OH is expected to be a function of t ,which can be simulated. Specifically, if OH is uniform alongthe tube,
∫[OH]dt = [OH]τavg, where τavg is the average res-
idence time. This corresponds to the usual mode of operation.The right-hand expression in Eq. (11) is an indirect calcu-lation, OHexp, based on the measured concentrations of thetracer at the inlet and the outlet of the reactor, C0 and Cτ ,respectively. Due to the presence of axial dispersion, the ac-tual measured concentration Cτ at the outlet is higher thanit would be in the absence of axial dispersion. If no correc-tion for the axial dispersion is applied, the calculated OHexpwill be lower than it actually is. However, since f is gener-ally small, the increase of OHexp due to the presence of axialdispersion is limited to a factor of ∼ f (since 1
1−f ≈ 1+ fas f � 1). For example, the largest f = 0.05 occurs in theHg lamp system. If f > 0.1, e.g., more significant axial dis-persion or much higher OH level, additional terms should beincluded in the approximate solution (Eq. 8) and Eq. (10)has to be modified correspondingly. By comparison, in thetypical advection system in the absence of axial dispersion,
www.atmos-meas-tech.net/10/839/2017/ Atmos. Meas. Tech., 10, 839–867, 2017

856 Y. Huang et al.: The Caltech Photooxidation Flow Tube reactor
OHexp is calculated simply as
OHexp =1kII ln
C0
Cτ. (12)
According to Eq. (11), the effect of axial dispersion is en-hanced when the OH oxidation proceeds more rapidly (i.e.,at higher kI values) or the axial dispersion is stronger. Thereare several ways to estimate the OH exposure in the axiallydispersed flow system. Li et al. (2015) calculate the residencetime-dependent OHexp first and then couple this relationshipwith the RTD. Because of the uniform OH concentrationalong the tube, the method by Li et al. (2015) and Eq. (12)give the same OHexp. In this work, we employ Eq. (11) forthe AD-PFR model and compare the results with those calcu-lated by Eq. (12) for the PFR model. The simulated OHexp re-sults are summarized in Table 1, along with their atmosphericequivalent timescale. The results show that the PFR modelalways gives a higher OHexp value and there is an ∼ 8–10 %difference between the values calculated by the PFR and AD-PFR models, indicating the effect from axial dispersion. Penget al. (2015) have performed a detailed comparison of OHexpcalculated with the PFR model, the coupling of RTD withPFR model and the experimental tracer decay method. Theauthors have recommended using the experimental tracer de-cay method. For a non-ideal flow reactor, we suggest to useEq. (11) to account for axial dispersion in the evaluation ofOHexp.
Overall, the current photochemical model indicates thatwith H2O2 as the OH precursor in the absence of NOx , theCPOT can achieve a wide range of steady-state OH concen-trations and OHexp that are comparable to the PAM system(Lambe et al., 2011a; Li et al., 2015).
7 Conclusions
We report the development of a laminar flow tube reactor forstudies of atmospheric VOC oxidation and formation of sec-ondary organic aerosol. The flow tube reactor has been de-signed to achieve a relatively well-defined flow environmentfor interpretation of reaction conditions. As has been recog-nized in existing flow tube reactors, inlet design plays a sig-nificant role in establishing the fluid dynamic environmentin the reactor. The current design comprises a static mixerfollowed by a conical diffuser. Computational fluid dynam-ics simulations demonstrate that this injection scheme intro-duces flow into the reaction section that avoids flow separa-tion from the wall, assisting a rapid transition to a parabolicprofile under idealized, isothermal conditions. Some loss ofreactive species, H2O2, used as an OH precursor, occurs inthe static mixer; however, this loss can be compensated byan increased feed concentration designed to generate the de-sired OH level in the reactor.
The fluid dynamics in the reactor was examined experi-mentally by comparing the penetration efficiency (η) and res-
Table 1. Simulated OH exposure under full light emission.
Lamp type OHaexp Atmos. equiv.b
(molecules cm−3 s) (h)PFR AD-PFRc
corr PFR AD-PFRcorr
Hg vapor 8.0× 10¹¹ 7.3× 10¹¹ 222 203UVB 5.4× 10¹⁰ 4.9× 10¹⁰ 15 13.6UVA 6.0× 10⁹ 5.4× 10⁹ 1.7 1.5
a Input of OH exposure (OHexp) simulation: 1 ppm H2O2 and 100 ppb SO2 atRH= 5 % and T = 295 K ([H2O]= 1500 ppm).b Atmospheric equivalent (Atmos. equiv.) OHexp values are converted to theirequivalent hours of OH exposure in the ambient atmosphere, assuming a typicalambient OH concentration of 1× 10⁶ molecules cm−3.c PFR and AD-PFRcorr are calculated by Eqs. (12) and (11), respectively.
idence time distribution of vapor molecules and particles tothose predicted under ideal laminar flow conditions. O3 andSO2 molecules exhibit ∼ 100 % transmission in the staticmixer. H2O2 losses in the static mixer are 20 to 40 %, in-creasing as RH increases. Small particles are lost at ∼ 50 %in the static mixer. The penetration efficiency of polydisperseammonium sulfate particles under dry conditions was mea-sured and compared with theoretical predictions accountingfor diffusional deposition and gravitational sedimentation inlaminar flow. The penetration efficiency calculated with thistheory captures the trend in the two regimes; i.e., in the diffu-sion regime, the smaller the particles are, the more loss theyexhibit, while in the settling regime the larger the particlesthe more the deposition. A simple coagulation model calcu-lation suggests that the coagulation process accounts for halfof the particle number loss over the small size range.
As has been noted in prior studies of flow regime behaviorin flow tube reactors, comparison of theoretically predictedand observed RTDs of vapors and particles reveals the im-portance of small temperature gradients in inducing a depar-ture from the ideal laminar flow. Despite the presence of atemperature-controlled water jacket, the RTD profiles are af-fected by slightly non-isothermal conditions in the reactorthat lead to secondary flows. This conclusion is supported bysubstantially improved agreement between observed and pre-dicted RTDs when an enhanced eddy-like diffusivity (De) isemployed in the CFD simulations. The best-fit (De) values,4.5× 10−4 and 6.0× 10⁻⁴ m2 s−1 for O3 and particles, re-spectively, are sufficiently large to indicate that the transportof tracers is likely dominated by secondary flow.
Despite these flow non-idealities, the observations andsimulations demonstrate that the combination of the staticmixer/conical diffuser allows a radially uniform and axiallydispersed flow system to develop within the reactor, usefulfor quantitative kinetics studies. A 1-D photochemical modelis formulated correspondingly. When H2O2 is employed asthe OH precursor, the model predicts that the OH concentra-tion is uniform along the whole tube. The extent to whichthis uniformity depends on the external OH reactivity, i.e.,[tracer]ktracer+OH, will be evaluated in future work. The sys-
Atmos. Meas. Tech., 10, 839–867, 2017 www.atmos-meas-tech.net/10/839/2017/

Y. Huang et al.: The Caltech Photooxidation Flow Tube reactor 857
tem can produce a wide range of OHexp under different radia-tion conditions for specific scientific objectives. Future workwill focus on detailed studies of secondary organic aerosolformation, with particular attention given to wall interactionsof gases and particles.
Data availability. Data presented in this work are available fromthe authors.
www.atmos-meas-tech.net/10/839/2017/ Atmos. Meas. Tech., 10, 839–867, 2017

858 Y. Huang et al.: The Caltech Photooxidation Flow Tube reactor
Appendix A: Determination of photon fluxes
The irradiance of the three types of lamps from 190 to850 nm (Ee,λ) was recorded using an Ocean Optics fiber op-tic spectroradiometer (HR2000CG-UV-NIR). The unit is pre-calibrated by the manufacturer and is equipped with a 20 cmlong fiber optic cable which can be inserted into the CPOTthrough one of the sampling ports so that the recorded spectrareflect those inside the CPOT.
The jNO2 values were determined by photolyzing 200 ppbof NO2 that is continuously supplied to the reactor. Mixingratios of NO2, NO and O3 were monitored at the exit cone.Experimental results employing the UVA lamps are shownin Fig. A1. A fraction of NO2 is photolyzed, forming anequivalent amount of NO and O3. The jNO2 value can be ob-tained using the photostationary state assumption (Seinfeldand Pandis, 2016):
jNO2 =kNO+O3 [O3][NO]
[NO2], (A1)
where [O3], [NO2] and [NO] are the concentrations of thesethree species at photostationary state, respectively. kNO+O3 isthe rate coefficient of the reaction NO+O3, and a value of1.9× 10−14 cm3 molec−1 s−1 (298 K) is used here (Seinfeldand Pandis, 2016). The jNO2 value obtained from this exper-iment is 5.36×10⁻³ s−1. The validity of the photostationaryphase was confirmed by solving a simple kinetic model ofrelevant species (i.e., the mixing ratios of the three speciesdid not further change within the CPOT run time).
The UVA flux was adjusted until we obtained a light inten-sity I (λ) that best represents the observed jNO2 . The photol-ysis rate of species i,ji , can be obtained as the integral of itsquantum yield (φi(λ)), absorption cross section (σi(λ)) andthe photon flux (I (λ)) over wavelengths λ1 to λ2:
ji =
λ2∫λ1
φi(λ)σi(λ)I (λ)dλ. (A2)
Determination of jNO2 under the Hg vapor lamps and UVBlamps, however, was difficult because photolysis of NO2leads to a net loss of NOx when these lamps were used (i.e.,the photostationary state was not achieved). We suspect thereason is that light with shorter wavelengths created an ex-cess amount of O(1D).
200
150
100
50
Mix
ing
ratio
(pp
b)
11:00 AM 12:00 PM 01:00 PM 02:00 PMTime
NO NO2
NOx
O3
Figure A1. The temporal profiles of NO2, NO, NOx and O3 at theend of the CPOT during a NO2 photolysis experiment. The lampswere turned on at the time indicated by the dashed line.
Alternatively, we determined the fluxes of the Hg vaporlamp and the UVB lamp by relating the signal strength ob-tained from these two types of lamp to that from the UVAlamp. We fixed the fiber optics probe at the same positionwhile changing the type of lamps surrounding the CPOT. Bydoing this, we assume that the ratio between the recordedspectra represents the ratio of their photon fluxes.
The Hg vapor lamp emits wavelength at 185 nm at an in-tensity typically less than 1 % of that at 254 nm (Li et al.,2015). Direct quantification of 185 nm light in the CPOT isdifficult because the fiber optic spectrometer cannot recordradiation with wavelengths shorter than 190 nm. Instead, theintensity of the 185 nm light can be roughly estimated fromO3 formation. Under full emission of the Hg vapor lamp with2 L min−1 of clean air flowing through, we observe 60 ppbof O3 at the exit cone. Assuming all of O3 has arisen fromO2 photolysis, the radiation intensity at 185 nm can be evalu-ated based on the Chapman mechanism (Seinfeld and Pandis,2016) with an average residence time of 1520 s (Sect. 5.2.2).The intensity of the 185 nm band is estimated to be 10−5 thatof the 254 nm band, the majority of which is likely absorbedby the water jacket.
Atmos. Meas. Tech., 10, 839–867, 2017 www.atmos-meas-tech.net/10/839/2017/

Y. Huang et al.: The Caltech Photooxidation Flow Tube reactor 859
Appendix B: Photochemical reactions
Table B1. Photolysis reactions in OH generation.
No. Reaction Photolysis rate Photolysis rate Photolysis rateHg lamps [s−1] UVB lamps [s−1] UVA lamps [s−1]
1 H2O2hν−→ 2OH 5.48× 10⁻⁴ 3.54× 10⁻⁵ 4.44× 10⁻⁶
2 O2hν−→ 2O 1.97× 10⁻¹¹ 0 0
3 O3hν−→ O2+O(1D) 7.64× 10⁻² 1.94× 10⁻³ 1.53× 10⁻⁵
4 O3hν−→ O2+O 8.50× 10⁻³ 3.22× 10⁻⁴ 2.61× 10⁻⁵
5 H2Ohν−→ OH+H 5.79× 10⁻¹⁰ 0 0
6 HO2hν−→ OH+O(1D) 2.60× 10⁻³ 3.86× 10⁻⁵ 1.76× 10⁻⁷
Absorption cross sections and quantum yields come from Burkholder et al. (2015) and IUPAC (http://iupac.pole-ether.fr/).The photon flux was measured in the current study conducted in Caltech. O refers to O(3P). All lamps are at full emission.
Table B2. Reactions in OH generation and SO2 oxidation.
No. Reaction Rate constant Low-pressure limit High-pressure limit[(cm3 molecule−1)n−1 s−1]a rate constant (k0) rate constant (k∞)
1 Ob+O2+M→ O3+M 6.0× 10⁻³⁴M(300/T )2.4
2 O+O3→ 2O2 8.0× 10⁻¹² exp(−2060/T )3 H+HO2→ H2+O2 6.9× 10⁻¹²
4 H+HO2→ 2OH 7.2× 10⁻¹¹
5 H+HO2→ H2O+O 1.6× 10⁻¹²
6 H+O2+M→ HO2+M Eq. (1)c 4.4× 10⁻³²M(300/T )1.3 7.5× 10⁻¹¹(300/T )−0.2
7 H+O3→ OH+O2 1.4× 10⁻¹⁰ exp(−470/T )8 O+OH→ O2+H 1.8× 10⁻¹¹ exp(180/T )9 O+HO2→ OH+O2 3.0× 10⁻¹¹ exp(200/T )10 O+H2O2→ OH+HO2 1.4× 10⁻¹² exp(−2000/T )11 OH+H2→ H2O+H 2.8× 10⁻¹² exp(−1800/T )12 2OH→ H2O+O 1.8× 10⁻¹²
13 2OH+M→ H2O2+M Eq. (1) 6.9× 10⁻³¹(300/T ) 2.6× 10⁻¹¹
14 OH+HO2→ H2O+O2 4.8× 10⁻¹¹ exp(250/T )15 OH+H2O2→ H2O+HO2 1.8× 10⁻¹²
16 OH+O3→ HO2+O2 1.7× 10⁻¹² exp(−940/T )(3.0× 10⁻¹³ exp(460/T )
17 HO2+HO2→ H2O2+O2 +2.1× 10⁻³³ exp(920/T ))(1+ 1.4× 10⁻²¹
[H2O]exp(2200/T ))18 HO2+O3→ OH+O2+O2 1.0× 10⁻¹⁴ exp(−490/T )19 O(1D)+O2→ O+O2 3.3× 10⁻¹¹ exp(55/T )20 O(1D)+N2→ O+N2 2.15× 10⁻¹¹ exp(110/T )21 O(1D)+O3→ 2O2 1.2× 10⁻¹⁰
22 O(1D)+O3→ O2+ 2O 1.2× 10⁻¹⁰
23 O(1D)+H2→ OH+H 1.2× 10⁻¹⁰
24 O(1D)+H2O→ 2OH 1.63× 10⁻¹⁰ exp(60/T )25 O+SO2+M→ SO3+M Eq. (1) 5.3× 10⁻²⁹(300/T )4.4 1.9× 10⁻¹¹(300/T )1.8
26 OH+SO2+M→ HOSO2+M Eq. (1) 3.3× 10⁻³¹(300/T )4.3 1.6× 10⁻¹²
27 SO3+ 2H2O→ H2O+H2SO4 8.5× 10−41 exp(6540/T )[H2O]2
28 HOSO2+O2→ HO2+SO3 1.3× 10⁻¹² exp(−330/T )Rate constants from Burkholder et al. (2015) and IUPAC (http://iupac.pole-ether.fr/).a Note that n represents the reaction order not including the effects of the bath gas M. The bath gas is already considered in the calculation of each rate constant.b Without any specific indication, O refers to O(3P).c Eq. (1): k(M,T )= k0M
1+k0M/k∞0.6
{1+[log10
(k0M/k∞
)]}−1.
www.atmos-meas-tech.net/10/839/2017/ Atmos. Meas. Tech., 10, 839–867, 2017

860 Y. Huang et al.: The Caltech Photooxidation Flow Tube reactor
Appendix C: Danckwerts boundary condition
At steady state, the simplified 1-D governing equation is
Ded2ci
dz2 −Uavg,fitdcidz+
∑i
Ri = 0. (C1)
The first term is the axial diffusion, the second term is theconvection and the third term contains all the sources andsinks. Equation (C1) has incorporated the Taylor-dispersion-derived RTD information. Thus we can solve it as a RTDcoupled transport problem. We also employ the Danckwertsboundary condition, which ensures the continuity of the flux:
Uavg,fitci
∣∣∣0−=
[Uavg,fitci −De
dcidz
]∣∣∣∣0+
, (C2)
dcidz
∣∣∣∣L−
= 0. (C3)
In Eq. (C2), ci∣∣0−
is the input concentration, while ci∣∣0+
is unknown and should be solved. It is this form that de-termines the discontinuity of the concentration at the in-let. With all the known reactions (Appendix B), one cansolve Eqs. (C1) to (C3) numerically. If one wants to addthe wall loss terms, assuming a first-order wall loss rate,kwi , the surface-to-volume ratio (S/V ) of the reactor shouldbe added, i.e., S
Vkwici . The kwi value can be preset if we
are interested in the output, or be determined as long aswe know the output. The parameters used in these equa-tions areDe = 4.5×10⁻⁴ m2 s−1,Uavg,fit = 2.1×10⁻³ m s−1,τc,cyld,fit = 1360 s and L= Uavg,fitτc,cyld,fit. As a comparison,a plug flow reactor model runs at the same time, with the onlyparameter as τavg = 1520 s.
Appendix D: Diffusional loss in a laminar cylindricaltube
The full conservation equation for gas-phase species i,ci(t, r,z), is
∂ci
∂t+vz(r)
∂ci
∂z=Di
[1r
∂
∂r
(r∂ci
∂r
)+∂2ci
∂z2
]+Pi−Si, (D1)
where Di is the molecular diffusivity of species i in air, andPi and Si are the rates of generation and consumption ofspecies i, by chemical reaction and gas-particle partition-ing, respectively. A typical order of magnitude estimate ofthe molecular diffusion coefficient for vapor molecules in airis ∼ 10−5 m2 s−1. Under conditions typical of the operationof the flow tube reactor, the magnitude of the axial molec-ular diffusion term in Eq. (D1) is small relative to that ofthe other terms in the equation and may be neglected. Davis(2008) gives a thorough discussion on the analytical solutionfor this system that is at steady state. Without any generation
and consumption of species i, Eq. (D1) becomes
vz(r)∂ci
∂z=Di
[1r
∂
∂r
(r∂ci
∂r
)]. (D2)
Equation (D2) is subject to a boundary condition at the reac-tor entrance, z= 0:
ci(r,0)= ci0, (D3)
where a uniform concentration ci0 is assumed at the inlet ofthe reactor, and the symmetry condition at the centerline ofthe reactor, r = 0:
∂ci
∂r(0,z)= 0. (D4)
A general boundary condition at the reactor wall allows forthe possible deposition of species i on the wall, is
Di∂ci
∂r(R,z)=−kwici, (D5)
where kwi is a first-order wall deposition coefficient forspecies i. kwi can be expressed in terms of the uptake co-efficient for species i, γi , as kwi =
14γiωi , where ωi is the
mean molecular speed of species i. Either kwi or γi must bedetermined experimentally. If no uptake of species i occursat the wall, then kwi = 0.
Appendix E: Taylor dispersion-based RTD
By cross-section averaging of Eq. (D1) (without sources andsinks), the average concentration at any cross section obeys
∂〈ci〉
∂t+Uavg
∂〈ci〉
∂z=Deff,i
∂2〈ci〉
∂z2 , (E1)
where Deff,i =Di(1+ Pe2
192 ), which accounts for the convec-tive enhancement in diffusivity (Aris, 1956), where Pe, thePéclet number, is 2RUavg
Di .The solution of Eq. (E1) for a pulse input at the entrance
to the reactor, of N0 moles over the cross-section area A ofthe tube, is
〈ci〉(t,z)=1√
4πDeff,i t
N0
Aexp
[−(z−Uavgt)
2
4Deff,i t
]. (E2)
The RTD of the diffusive species in the flow tube, i.e., atz= Lcyld, is
〈ci〉(t,Lcyld)=1√
4πDeff,i t
N0
Vexp
[−(1− t )2
4Deff,i t
], (E3)
where V is the volume of the tube, Deff,i =Deff,i
τc,cyldU2avg
and t =t
τc,cyld.
Atmos. Meas. Tech., 10, 839–867, 2017 www.atmos-meas-tech.net/10/839/2017/

Y. Huang et al.: The Caltech Photooxidation Flow Tube reactor 861
For a pulse input, of finite duration t0,
〈ci〉(t,z= 0)=
N0
AUavgt00≤ t ≤ t0
0 t > t0.
(E4)
The RTD at z= Lcyld is
〈ci〉(t,Lcyld)=
N0
2V
erf
1− t√4Deff,i t
− erf
1− t − t0√4Deff,i t
, (E5)
where erf(x)= 2√π
∫ x0 exp(−η2)dη and t0 =
t0τc,cyld
. More
generally, by transforming t =− zUavg=−
zLcyld
LcyldUavg=
−zτc,cyld, where z= zLcyld
, the RTD for a non-ideal pulseinput f (t) (e.g., the solid profile in Fig. 6c) is in the form of
〈ci〉(t,Lcyld)=1√
4πDeff,i t
N0
V
+∞∫−∞
f(−zτc,cyld
)exp
[−(1− t − z)2
4Deff,i t
]dz, (E6)
where Deff,i and t are defined as in Eqs. (E3) and (E5).
Appendix F: Particle size-dependent RTDs
Figure 8 can be used to define two separate regimes ofparticle behavior, i.e., settling regime (diameter larger than80 nm) and diffusion regime (otherwise).
While cylindrical coordinates are usually employed in aflow tube reactor, it will prove to be advantageous to use aCartesian coordinate framework for the numerical simulationof particle settling in horizontal laminar flow in a tubular ge-ometry. In the settling regime, particle motion in a horizontaltubular laminar flow is governed by the following differentialequations for particle position, (x(t), y(t), z(t)), in a Carte-sian coordinate system (with origin at the center of the tubeat t = 0, as shown in Fig. F1):
dxdt= 0, (F1)
dydt=−vy
(Dp)=−vs
(Dp), (F2)
dzdt= vz(x,y)= Umax
(1−
x2+ y2
R2
). (F3)
Given an initial particle position, x(0)= x0, y(0)= y0,z(0)= z0, this set of equations can be solved either numer-ically or analytically. Examples of the numerical simulationof particle trajectories are shown in Fig. F1.
The analytical solution of Eqs. (F1)–(F3) for the time τthat a particle resides in the flow is
t3− 2y t2−(
1− x2− y2
)t +
t1
t2= 0, (F4)
where x = x0/R, y = y0/R, t1 = Lcyld/Umax, t2 = R/vs andt = t/t2. x and y are subject to the condition
y(
1− x2)−
13y3−t1
t2+
23
(1− x2
) 32≤ x2+ y2≤ 1. (F5)
The integral over this closed space leads to the penetrationefficiency η for non-diffusive monodisperse particles:
η =
2π
(−2ε
√1− ε
23 + ε
13
√1− ε
23 + arcsin
√1− ε
23
), (F6)
where ε = 3t14t2
and the implicit condition here is that ε ≤ 1,i.e., vs ≤
4R3Lcyld
Umax, otherwise η = 0. Calculated theoreticalRTD and η are shown in Fig. F2.
The RTD of non-diffusing materials along each streamlinefor a pulse input is
〈n〉(t,Lcyld)=
0 0≤ t < t1
2N0t21
AUavgt3t ≥ t1,
(F7)
where N0 is the total input quantity of the pulse, the same asdefined in Appendix E.
www.atmos-meas-tech.net/10/839/2017/ Atmos. Meas. Tech., 10, 839–867, 2017

862 Y. Huang et al.: The Caltech Photooxidation Flow Tube reactor
Figure F1. Particle trajectories in a vertical plane in a laminar flow tube. Particles are of the same size and are subject to gravitationalsettling and fluid advection. The Cartesian coordinate framework is indicated. Two different cases are shown: blue particles are those thatcan successfully penetrate through the tube, while red particles eventually deposit on the tube wall.
500 nm, η=88% 1000 nm, η=65%
100 nm, η=99% 200 nm, η=95%
Pure convection
Figure F2. Theoretical residence time distribution (Eq. F4) and penetration efficiency (Eq. F6) of particles with different diameters in a hor-izontal flow tube. Only gravitational settling and convection are considered. The simulation assumes a uniform distribution of monodisperseparticles at the entrance of a well-developed laminar flow with no interaction between particles. Each point corresponds to the residencetime and the initial position of the particle. The color bar indicates the residence time (min). The open space between the dashed curve andthe tube wall indicates the region in which particles have deposited on the tube wall (η = 0 %). The residence time of purely convective,non-diffusing particles (Eq. F7) is shown for reference.
Atmos. Meas. Tech., 10, 839–867, 2017 www.atmos-meas-tech.net/10/839/2017/

Y. Huang et al.: The Caltech Photooxidation Flow Tube reactor 863
Appendix G: List of symbols
Symbol Meaning Unit
A cross section of the reactor m2
c concentration mol m−3
D reactor diameter mDp particle diameter nmD diffusivity m2 s−1
g gravitational acceleration m s−2
kw mass transport coefficient to the wall m s−1
L length of the reactor mn particle number concentration cm−3
N0 total moles or number of the pulse input mole or numberP generation rate of species molec cm−3 s−1
R radius of the reactor mS consumption rate of species molec cm−3 s−1
t0 duration sT temperature KU characteristic velocity of the fluid m s−1
v velocity m s−1
V volume of the reactor m3
Q volumetric flow rate m3 s−1
Greek
β thermal expansion coefficient of fluid K−1
µ viscosity of the fluid kg m−1 s−1
ν kinematic viscosity m2 s−1
ρ density of fluid kg m−3
θ angle of the cone ◦
τ residence time sω mean molecular speed m s−1
Note: some of the symbols appear in Appendix D–F.
www.atmos-meas-tech.net/10/839/2017/ Atmos. Meas. Tech., 10, 839–867, 2017

864 Y. Huang et al.: The Caltech Photooxidation Flow Tube reactor
Appendix H: List of dimensionless numbers andsubscripts
Symbol Name Expression
Greek
γ uptake coefficientη penetration efficiencyε ratio of timescale of convection to that of settling 3Lcyldvs/4RUmaxξ dimensionless length πDLcyld/Q
Dimensionless groups
Gr Grashof number gβD31T/ν2
Pe Péclet number 2RUavg/DiRe Reynolds number ρUavgD/µ
Ri Richardson number Gr/Re2
Subscripts
c characteristic valuecyld cylindrical tubee eddy-likefit fitted resulti speciesj time steps settlingavg average valueeff effective valueentr entrancein inletmax maximum valueout outletr r component in cylindrical frameworkx x component in Cartesian frameworky y component in Cartesian frameworkz z component in Cartesian or cylindrical framework
Superscripts
I first-order reaction rateII second-order reaction rate
Overbar˜ nondimensionalized variable
Note: some of the symbols appear in Appendix D–F.
Atmos. Meas. Tech., 10, 839–867, 2017 www.atmos-meas-tech.net/10/839/2017/

Y. Huang et al.: The Caltech Photooxidation Flow Tube reactor 865
Competing interests. The authors declare that they have no conflictof interest.
Acknowledgements. We gratefully acknowledge a generous giftby Christine and Dwight Landis to support the construction ofthis reactor. We also thank Paul Wennberg for useful discussionsand for offering laboratory supplies. This work was supportedby National Science Foundation grant AGS-1523500. Ran Zhaowas supported by the Natural Science and Engineering ResearchCouncil of Canada.
Edited by: H. HarderReviewed by: A. Lambe and four anonymous referees
References
Aris, R.: On the dispersion of a solute in a fluid flowing through atube, P. Roy. Soc. Lond. A Mat., 235, 67–77, 1956.
Bates, K. H., Crounse, J. D., St Clair, J. M., Bennett, N. B., Nguyen,T. B., Seinfeld, J. H., Stoltz, B. M., and Wennberg, P. O.: GasPhase Production and Loss of Isoprene Epoxydiols, J. Phys.Chem. A, 118, 1237–1246, 2014.
Bates, K. H., Nguyen, T. B., Teng, A. P., Crounse, J. D., Kjaergaard,H. G., Stoltz, B. M., Seinfeld, J. H., and Wennberg, P. O.: Pro-duction and Fate of C-4 Dihydroxycarbonyl Compounds fromIsoprene Oxidation, J. Phys. Chem. A, 120, 106–117, 2016.
Beder, E. C., Bass, C. D., and Shackleford, W. L.: Transmissivityand Absorption of Fused Quartz Between 0.22 µ and 3.5 µ fromRoom Temperature to 1500 ◦C, Appl. Optics, 10, 2263–2268,1971.
Bird, R. B., Stewart, W. E., and Lightfoot, E. N.: Transport Phenom-ena (revised), 2 edn., John Wiley & Sons Inc., New York, USA,2007.
Bonn, B., Schuster, G., and Moortgat, G. K.: Influence of Water Va-por on the Process of New Particle Formation during Monoter-pene Ozonolysis, J. Phys. Chem. A, 106, 2869–2881, 2002.
Bruns, E. A., El Haddad, I., Keller, A., Klein, F., Kumar, N. K.,Pieber, S. M., Corbin, J. C., Slowik, J. G., Brune, W. H., Bal-tensperger, U., and Prévôt, A. S. H.: Inter-comparison of lab-oratory smog chamber and flow reactor systems on organicaerosol yield and composition, Atmos. Meas. Tech., 8, 2315–2332, doi:10.5194/amt-8-2315-2015, 2015.
Burkholder, J. B., Sander, S. P., Abbatt, J., Barker, J. R., Huie, R. E.,Kolb, C. E., Kurylo, M. J., Orkin, V. L., Wilmouth, D. M., andWine, P. H.: Chemical Kinetics and Photochemical Data for Usein Atmospheric Studies, Evaluation No. 18, JPL Publication 15-10, Jet Propulsion Laboratory, Pasadena, USA, 2015.
Chen, S., Brune, W. H., Lambe, A. T., Davidovits, P., and Onasch, T.B.: Modeling organic aerosol from the oxidation of α-pinene ina Potential Aerosol Mass (PAM) chamber, Atmos. Chem. Phys.,13, 5017–5031, doi:10.5194/acp-13-5017-2013, 2013.
Crounse, J. D., McKinney, K. A., Kwan, A. J., and Wennberg, P. O.:Measurement of Gas-Phase Hydroperoxides by Chemical Ioniza-tion Mass Spectrometry, Anal. Chem., 78, 6726–6732, 2006.
Davis, E. J.: Interpretation of uptake coefficient data obtained withflow tubes, J. Phys. Chem. A, 112, 1922–1932, 2008.
Davis, M. E. and Davis, R. J.: Fundamentals of Chemical ReactionEngineering, Courier Corporation, New York, USA, 2003.
Donahue, N. M., Clarke, J. S., Demerjian, K. L., and Anderson,J. G.: Free-Radical Kinetics at High Pressure: A MathematicalAnalysis of the Flow Reactor, J. Phys. Chem., 100, 5821–5838,1996.
Ezell, M. J., Johnson, S. N., Yu, Y., Perraud, V., Bruns, E. A.,Alexander, M. L., Zelenyuk, A., Dabdub, D., and Finlayson-Pitts, B. J.: A new aerosol flow system for photochemical andthermal studies of tropospheric aerosols, Aerosol Sci. Tech., 44,329–338, 2010.
Faris, G. N. and Viskanta, R.: An analysis of laminar combinedforced and free convection heat transfer in a horizontal tube, Int.J. Heat Mass Tran., 12, 1295–1309, 1969.
Fried, E. and Idel’chik, I. E.: Flow Resistance: A Design Guide forEngineers, Hemisphere Pub. Co., New York, USA, 1989.
Fuchs, N. A.: The Mechanics of Aerosols, Pergamon, New York,USA, 1964.
George, I. J., Vlasenko, A., Slowik, J. G., Broekhuizen, K., andAbbatt, J. P. D.: Heterogeneous oxidation of saturated organicaerosols by hydroxyl radicals: uptake kinetics, condensed-phaseproducts, and particle size change, Atmos. Chem. Phys., 7, 4187–4201, doi:10.5194/acp-7-4187-2007, 2007.
Gormley, P. G. and Kennedy, M.: Diffusion from a stream flowingthrough a cylindrical tube, P. Roy. Irish Acad. A, 52, 163–169,1948.
Grayson, J. W., Song, M., Sellier, M., and Bertram, A. K.: Vali-dation of the poke-flow technique combined with simulations offluid flow for determining viscosities in samples with small vol-umes and high viscosities, Atmos. Meas. Tech., 8, 2463–2472,doi:10.5194/amt-8-2463-2015, 2015.
Hodas, N., Zuend, A., Mui, W., Flagan, R. C., and Seinfeld, J.H.: Influence of particle-phase state on the hygroscopic behav-ior of mixed organic–inorganic aerosols, Atmos. Chem. Phys.,15, 5027–5045, doi:10.5194/acp-15-5027-2015, 2015.
Holman, J. P.: Heat Transfer, 10 edn., McGraw-Hill, New York,USA, 2010.
Howard, C. J.: Kinetic measurements using flow tubes, J. Phys.Chem., 83, 3–9, 1979.
Iqbal, M. and Stachiewicz, J. W.: Influence of tube orientation oncombined free and forced laminar convection heat transfer, J.Heat Transf., 88, 109–116, 1966.
Jonsson, Å. M., Hallquist, M., and Ljungström, E.: Influence of OHScavenger on the Water Effect on Secondary Organic AerosolFormation from Ozonolysis of Limonene, 13-Carene, and α-Pinene, Environ. Sci. Technol., 42, 5938–5944, 2008.
Kang, E., Root, M. J., Toohey, D. W., and Brune, W. H.: Introduc-ing the concept of Potential Aerosol Mass (PAM), Atmos. Chem.Phys., 7, 5727–5744, doi:10.5194/acp-7-5727-2007, 2007.
Kang, E., Toohey, D. W., and Brune, W. H.: Dependence of SOAoxidation on organic aerosol mass concentration and OH expo-sure: experimental PAM chamber studies, Atmos. Chem. Phys.,11, 1837–1852, doi:10.5194/acp-11-1837-2011, 2011.
Karjalainen, P., Timonen, H., Saukko, E., Kuuluvainen, H.,Saarikoski, S., Aakko-Saksa, P., Murtonen, T., Bloss, M., DalMaso, M., Simonen, P., Ahlberg, E., Svenningsson, B., Brune,W. H., Hillamo, R., Keskinen, J., and Rönkkö, T.: Time-resolvedcharacterization of primary particle emissions and secondary par-ticle formation from a modern gasoline passenger car, Atmos.
www.atmos-meas-tech.net/10/839/2017/ Atmos. Meas. Tech., 10, 839–867, 2017

866 Y. Huang et al.: The Caltech Photooxidation Flow Tube reactor
Chem. Phys., 16, 8559–8570, doi:10.5194/acp-16-8559-2016,2016.
Keller, A. and Burtscher, H.: A continuous photo-oxidation flow re-actor for a defined measurement of the SOA formation potentialof wood burning emissions, J. Aerosol Sci., 49, 9–20, 2012.
Khalizov, A. F., Earle, M. E., Johnson, W. J. W., Stubley,G. D., and Sloan, J. J.: Development and characterization ofa laminar aerosol flow tube, Rev. Sci. Instrum., 77, 033102,doi:10.1063/1.2175958, 2006.
Kroll, J. H., Smith, J. D., Che, D. L., Kessler, S. H., Worsnop, D. R.,and Wilson, K. R.: Measurement of fragmentation and function-alization pathways in the heterogeneous oxidation of oxidized or-ganic aerosol, Phys. Chem. Chem. Phys., 11, 8005–8014, 2009.
Lambe, A. T., Ahern, A. T., Williams, L. R., Slowik, J. G., Wong,J. P. S., Abbatt, J. P. D., Brune, W. H., Ng, N. L., Wright, J. P.,Croasdale, D. R., Worsnop, D. R., Davidovits, P., and Onasch, T.B.: Characterization of aerosol photooxidation flow reactors: het-erogeneous oxidation, secondary organic aerosol formation andcloud condensation nuclei activity measurements, Atmos. Meas.Tech., 4, 445–461, doi:10.5194/amt-4-445-2011, 2011a.
Lambe, A. T., Onasch, T. B., Massoli, P., Croasdale, D. R., Wright,J. P., Ahern, A. T., Williams, L. R., Worsnop, D. R., Brune, W. H.,and Davidovits, P.: Laboratory studies of the chemical composi-tion and cloud condensation nuclei (CCN) activity of secondaryorganic aerosol (SOA) and oxidized primary organic aerosol(OPOA), Atmos. Chem. Phys., 11, 8913–8928, doi:10.5194/acp-11-8913-2011, 2011b.
Lambe, A. T., Onasch, T. B., Croasdale, D. R., Wright, J. P., Martin,A. T., Franklin, J. P., Massoli, P., Kroll, J. H., Canagaratna, M. R.,Brune, W. H., Worsnop, D. R., and Davidovits, P.: Transitionsfrom functionalization to fragmentation reactions of laboratorysecondary organic aerosol (SOA) generated from the OH oxida-tion of alkane precursors, Environ. Sci. Technol., 46, 5430–5437,2012.
Lambe, A. T., Chhabra, P. S., Onasch, T. B., Brune, W. H., Hunter,J. F., Kroll, J. H., Cummings, M. J., Brogan, J. F., Parmar, Y.,Worsnop, D. R., Kolb, C. E., and Davidovits, P.: Effect of oxidantconcentration, exposure time, and seed particles on secondaryorganic aerosol chemical composition and yield, Atmos. Chem.Phys., 15, 3063–3075, doi:10.5194/acp-15-3063-2015, 2015.
Li, R., Palm, B. B., Ortega, A. M., Hlywiak, J., Hu, W., Peng,Z., Day, D. A., Knote, C., Brune, W. H., de Gouw, J. A., andJimenez, J. L.: Modeling the radical chemistry in an oxidationflow reactor: Radical formation and recycling, sensitivities, andthe OH exposure estimation equation, J. Phys. Chem. A, 119,4418–4432, 2015.
Liu, B. Y. H. and Lee, K. W.: An aerosol generator of high stability,Am. Ind. Hyg. Assoc. J., 36, 861–865, 1975.
Loza, C. L., Coggon, M. M., Nguyen, T. B., Zuend, A., Flagan,R. C., and Seinfeld, J. H.: On the Mixing and Evaporation ofSecondary Organic Aerosol Components, Environ. Sci. Technol.,47, 6173–6180, 2013.
Loza, C. L., Craven, J. S., Yee, L. D., Coggon, M. M., Schwantes,R. H., Shiraiwa, M., Zhang, X., Schilling, K. A., Ng, N. L.,Canagaratna, M. R., Ziemann, P. J., Flagan, R. C., and Seinfeld,J. H.: Secondary organic aerosol yields of 12-carbon alkanes,Atmos. Chem. Phys., 14, 1423–1439, doi:10.5194/acp-14-1423-2014, 2014.
Matthews, P. S. J., Baeza-Romero, M. T., Whalley, L. K., and Heard,D. E.: Uptake of HO2 radicals onto Arizona test dust particlesusing an aerosol flow tube, Atmos. Chem. Phys., 14, 7397–7408,doi:10.5194/acp-14-7397-2014, 2014.
McDonald, A. T., Fox, R. W., and Van Dawoestine, R. V.: Effectsof swirling inlet flow on pressure recovery in conical diffusers,AIAA J., 9, 2014–2018, 1971.
McVay, R. C., Cappa, C. D., and Seinfeld, J. H.: Vapor-Wall De-position in Chambers: Theoretical Considerations, Environ. Sci.Technol., 48, 10251–10258, 2014.
McVay, R. C., Zhang, X., Aumont, B., Valorso, R., Camredon, M.,La, Y. S., Wennberg, P. O., and Seinfeld, J. H.: SOA formationfrom the photooxidation of α-pinene: systematic exploration ofthe simulation of chamber data, Atmos. Chem. Phys., 16, 2785–2802, doi:10.5194/acp-16-2785-2016, 2016.
Mehta, R. D. and Bradshaw, P.: Design rules for small low speedwind tunnels, Aeronaut. J., 83, 443–449, 1979.
Mikheev, V. B., Laulainen, N. S., Barlow, S. E., Knott, M., andFord, I. J.: The laminar flow tube reactor as a quantitative tool fornucleation studies: Experimental results and theoretical analysisof homogeneous nucleation of dibutylphthalate, J. Chem. Phys.,113, 3704–3718, 2000.
Mori, Y. and Futagami, K.: Forced convective heat transfer in uni-formly heated horizontal tubes (2nd report, theoretical study),Int. J. Heat Mass Tran., 10, 1801–1813, 1967.
Nah, T., McVay, R. C., Zhang, X., Boyd, C. M., Seinfeld, J. H., andNg, N. L.: Influence of seed aerosol surface area and oxidationrate on vapor wall deposition and SOA mass yields: a case studywith α-pinene ozonolysis, Atmos. Chem. Phys., 16, 9361–9379,doi:10.5194/acp-16-9361-2016, 2016.
Nah, T., McVay, R. C., Pierce, J. R., Seinfeld, J. H., and Ng, N. L.:Constraining uncertainties in particle-wall deposition correctionduring SOA formation in chamber experiments, Atmos. Chem.Phys., 17, 2297–2310, doi:10.5194/acp-17-2297-2017, 2017.
Nguyen, T. B., Coggon, M. M., Bates, K. H., Zhang, X., Schwantes,R. H., Schilling, K. A., Loza, C. L., Flagan, R. C., Wennberg,P. O., and Seinfeld, J. H.: Organic aerosol formation fromthe reactive uptake of isoprene epoxydiols (IEPOX) onto non-acidified inorganic seeds, Atmos. Chem. Phys., 14, 3497–3510,doi:10.5194/acp-14-3497-2014, 2014.
Nguyen, T. B., Bates, K. H., Crounse, J. D., Schwantes, R. H.,Zhang, X., Kjaergaard, H. G., Surratt, J. D., Lin, P., Laskin, A.,Seinfeld, J. H., and Wennberg, P. O.: Mechanism of the hydroxylradical oxidation of methacryloyl peroxynitrate (MPAN) and itspathway toward secondary organic aerosol formation in the at-mosphere, Phys. Chem. Chem. Phys., 17, 17914–17926, 2015.
Ortega, A. M., Day, D. A., Cubison, M. J., Brune, W. H., Bon,D., de Gouw, J. A., and Jimenez, J. L.: Secondary organicaerosol formation and primary organic aerosol oxidation frombiomass-burning smoke in a flow reactor during FLAME-3,Atmos. Chem. Phys., 13, 11551–11571, doi:10.5194/acp-13-11551-2013, 2013.
Ortega, A. M., Hayes, P. L., Peng, Z., Palm, B. B., Hu, W., Day, D.A., Li, R., Cubison, M. J., Brune, W. H., Graus, M., Warneke,C., Gilman, J. B., Kuster, W. C., de Gouw, J., Gutiérrez-Montes,C., and Jimenez, J. L.: Real-time measurements of secondary or-ganic aerosol formation and aging from ambient air in an oxida-tion flow reactor in the Los Angeles area, Atmos. Chem. Phys.,16, 7411–7433, doi:10.5194/acp-16-7411-2016, 2016.
Atmos. Meas. Tech., 10, 839–867, 2017 www.atmos-meas-tech.net/10/839/2017/

Y. Huang et al.: The Caltech Photooxidation Flow Tube reactor 867
Palm, B. B., Campuzano-Jost, P., Ortega, A. M., Day, D. A., Kaser,L., Jud, W., Karl, T., Hansel, A., Hunter, J. F., Cross, E. S., Kroll,J. H., Peng, Z., Brune, W. H., and Jimenez, J. L.: In situ sec-ondary organic aerosol formation from ambient pine forest airusing an oxidation flow reactor, Atmos. Chem. Phys., 16, 2943–2970, doi:10.5194/acp-16-2943-2016, 2016.
Peng, Z., Day, D. A., Stark, H., Li, R., Lee-Taylor, J., Palm, B. B.,Brune, W. H., and Jimenez, J. L.: HOx radical chemistry in oxi-dation flow reactors with low-pressure mercury lamps systemati-cally examined by modeling, Atmos. Meas. Tech., 8, 4863–4890,doi:10.5194/amt-8-4863-2015, 2015.
Peng, Z., Day, D. A., Ortega, A. M., Palm, B. B., Hu, W., Stark, H.,Li, R., Tsigaridis, K., Brune, W. H., and Jimenez, J. L.: Non-OHchemistry in oxidation flow reactors for the study of atmosphericchemistry systematically examined by modeling, Atmos. Chem.Phys., 16, 4283–4305, doi:10.5194/acp-16-4283-2016, 2016.
Prakash, R., Christopher, D., and Kumarrathinam, K.: CFD analy-sis of flow through a conical exhaust diffuser, Int. J. Res. Eng.Technol., 3, 239–248, 2014.
Schilling, F.-K. A., Yee, L. D., Loza, C. L., Coggon, M. M.,Schwantes, R., Zhang, X., Dalleska, N. F., and Seinfeld, J. H.:Secondary Organic Aerosol Composition from C-12 Alkanes, J.Phys. Chem. A, 119, 4281–4297, 2015.
Schwantes, R. H., Teng, A. P., Nguyen, T. B., Coggon, M. M.,Crounse, J. D., St Clair, J. M., Zhang, X., Schilling, K. A.,Seinfeld, J. H., and Wennberg, P. O.: Isoprene NO3 OxidationProducts from the RO2+HO2 Pathway, J. Phys. Chem. A, 119,10158–10171, 2015.
Seinfeld, J. H. and Pandis, S. N.: Atmospheric Chemistry andPhysics: From Air Pollution to Climate Change, 3 edn., WileySons, Hoboken, New Jersey, USA, 2016.
Sellier, M., Grayson, J. W., Renbaum-Wolff, L., Song, M., andBertram, A. K.: Estimating the viscosity of a highly viscous liq-uid droplet through the relaxation time of a dry spot, J. Rheol.,59, 733–750, 2015.
Seltsam, M. M.: Experimental and theoretical study of wide-anglediffuser flow with screens, AIAA J., 33, 2092–2100, 1995.
Siegwarth, D. P., Mikesell, R. D., Readal, T. C., and Hanratty, T. J.:Effect of secondary flow on the temperature field and primaryflow in a heated horizontal tube, Int. J. Heat Mass Tran., 12,1535–1552, 1969.
Simonen, P., Saukko, E., Karjalainen, P., Timonen, H., Bloss,M., Aakko-Saksa, P., Rönkkö, T., Keskinen, J., and Dal Maso,M.: A New Oxidation Flow Reactor for Measuring SecondaryAerosol Formation of Rapidly Changing Emission Sources, At-mos. Meas. Tech. Discuss., doi:10.5194/amt-2016-300, in re-view, 2016.
Slowik, J. G., Wong, J. P. S., and Abbatt, J. P. D.: Real-time,controlled OH-initiated oxidation of biogenic secondary organicaerosol, Atmos. Chem. Phys., 12, 9775–9790, doi:10.5194/acp-12-9775-2012, 2012.
Smith, J. D., Kroll, J. H., Cappa, C. D., Che, D. L., Liu, C. L.,Ahmed, M., Leone, S. R., Worsnop, D. R., and Wilson, K.R.: The heterogeneous reaction of hydroxyl radicals with sub-micron squalane particles: a model system for understanding theoxidative aging of ambient aerosols, Atmos. Chem. Phys., 9,3209–3222, doi:10.5194/acp-9-3209-2009, 2009.
Sparrow, E. M., Abraham, J. P., and Minkowycz, W. J.: Flow Sep-aration in a diverging conical duct: Effect of Reynolds numberand divergence angle, Int. J. Heat Mass Tran., 52, 3079–3083,2009.
St. Clair, J. M., McCabe, D. C., Crounse, J. D., Steiner, U., andWennberg, P. O.: Chemical ionization tandem mass spectrometerfor the in situ measurement of methyl hydrogen peroxide, Rev.Sci. Instrum., 81, 094102, doi:10.1063/1.3480552, 2010.
Tavoularis, S.: Measurement in Fluid Mechanics, Cambridge Uni-versity Press, New York, USA, 2005.
Taylor, G.: Dispersion of soluble matter in solvent flowing slowlythrough a tube, P. Roy. Soc. Lond. A Mat., 219, 186–203, 1953.
Thornton, J. and Abbatt, J. P. D.: Measurements of HO2 up-take to aqueous aerosol: Mass accommodation coefficientsand net reactive loss, J. Geophys. Res.-Atmos., 110, D08309,doi:10.1029/2004JD005402, 2005.
Tkacik, D. S., Lambe, A. T., Jathar, S., Li, X., Presto, A. A., Zhao,Y., Blake, D., Meinardi, S., Jayne, J. T., Croteau, P. L., andRobinson, A. L.: Secondary Organic Aerosol Formation from in-Use Motor Vehicle Emissions Using a Potential Aerosol MassReactor, Environ. Sci. Technol., 48, 11235–11242, 2014.
White, F. M.: Fluid Mechanics, McGraw-Hill, New York, USA,2008.
Yee, L. D., Craven, J. S., Loza, C. L., Schilling, K. A., Ng, N. L.,Canagaratna, M. R., Ziemann, P. J., Flagan, R. C., and Seinfeld,J. H.: Effect of chemical structure on secondary organic aerosolformation from C12 alkanes, Atmos. Chem. Phys., 13, 11121–11140, doi:10.5194/acp-13-11121-2013, 2013.
Zhang, X., Cappa, C. D., Jathar, S. H., McVay, R. C., Ensberg, J. J.,Kleeman, M. J., and Seinfeld, J. H.: Influence of vapor wall lossin laboratory chambers on yields of secondary organic aerosol, P.Natl. Acad. Sci. USA, 111, 5802–5807, 2014.
Zhang, X., McVay, R. C., Huang, D. D., Dalleska, N. F., Aumont,B., Flagan, R. C., and Seinfeld, J. H.: Formation and evolution ofmolecular products in alpha-pinene secondary organic aerosol, P.Natl. Acad. Sci. USA, 112, 14168–14173, 2015.
Zhang, Y., Sanchez, M. S., Douet, C., Wang, Y., Bateman, A. P.,Gong, Z., Kuwata, M., Renbaum-Wolff, L., Sato, B. B., Liu, P.F., Bertram, A. K., Geiger, F. M., and Martin, S. T.: Changingshapes and implied viscosities of suspended submicron particles,Atmos. Chem. Phys., 15, 7819–7829, doi:10.5194/acp-15-7819-2015, 2015.
www.atmos-meas-tech.net/10/839/2017/ Atmos. Meas. Tech., 10, 839–867, 2017