the calcification process and measurement techniques · what is calcification? • the accumulation...
TRANSCRIPT

The calcification process and measurement techniques
Photo from JC073 Changing Oceans Research Cruise

What is calcification?
• The accumulation of calcium salts into body tissue, such as bones, shells, and carapaces.
• A biologically-mediated process
• In marine calcifiers, calcification predominantly results in calcium carbonate structures that are made of either calcite, aragonite or high-Mg calcite.
What is calcification?
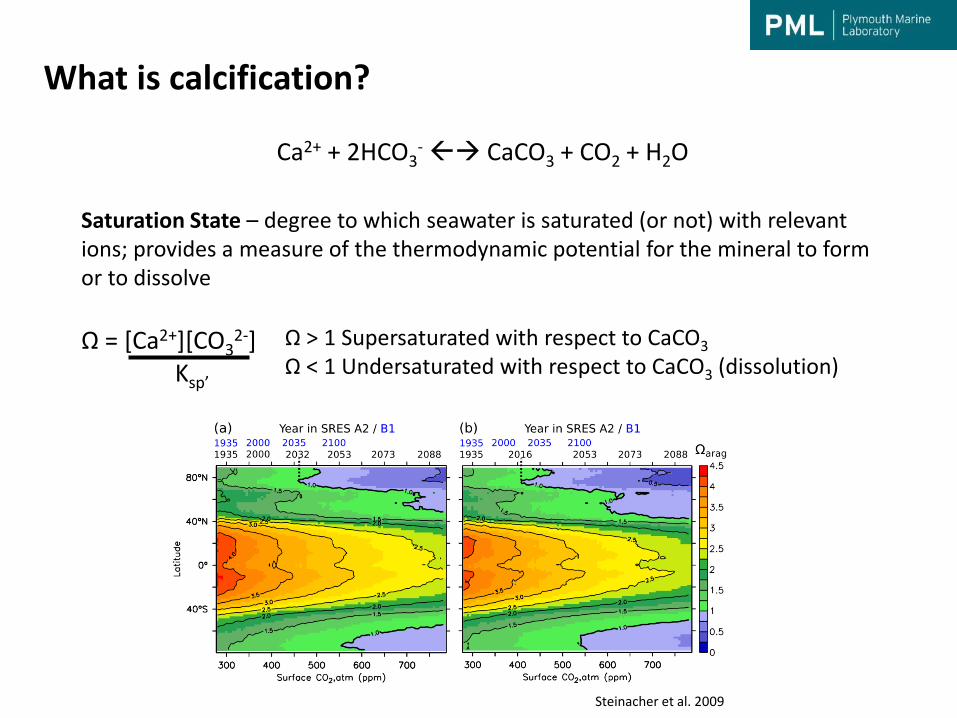
Ca2+ + 2HCO3- CaCO3 + CO2 + H2O
Ω = [Ca2+][CO32-]
Ksp’
Ω > 1 Supersaturated with respect to CaCO3
Ω < 1 Undersaturated with respect to CaCO3 (dissolution)
Saturation State – degree to which seawater is saturated (or not) with relevant ions; provides a measure of the thermodynamic potential for the mineral to form or to dissolve
Steinacher et al. 2009
Major invertebrate calcifying groups: - Molluscs - Cnidarians - Echinoderms - Crustaceans Other organism types: - Formaminifera - Phytoplankton: Haptophytes (coccolithophores) - Algae: Rhodophytes (coralline algae)
In most biological systems, the site of mineral deposition is isolated from the environment, the extent of isolation is variable. Biologically induced mineralisation – organism uses cellular activities to direct the nucleation, growth, morphology, and final location of the mineral that is deposited. Several types, but most CaCO3 forming marine organisms either use an extracellular biologically-controlled process or an intracellular strategy.
Who calcifies, and how?

Extracellular biologically-controlled process e.g. Molluscs, Corals,
Who calcifies, and how?
• Basic form of calcification • Organic matrix important for
defining structure • Ions can be actively pumped
out of the cell or pumped into a vesicle within the cell which is then secreted outside.
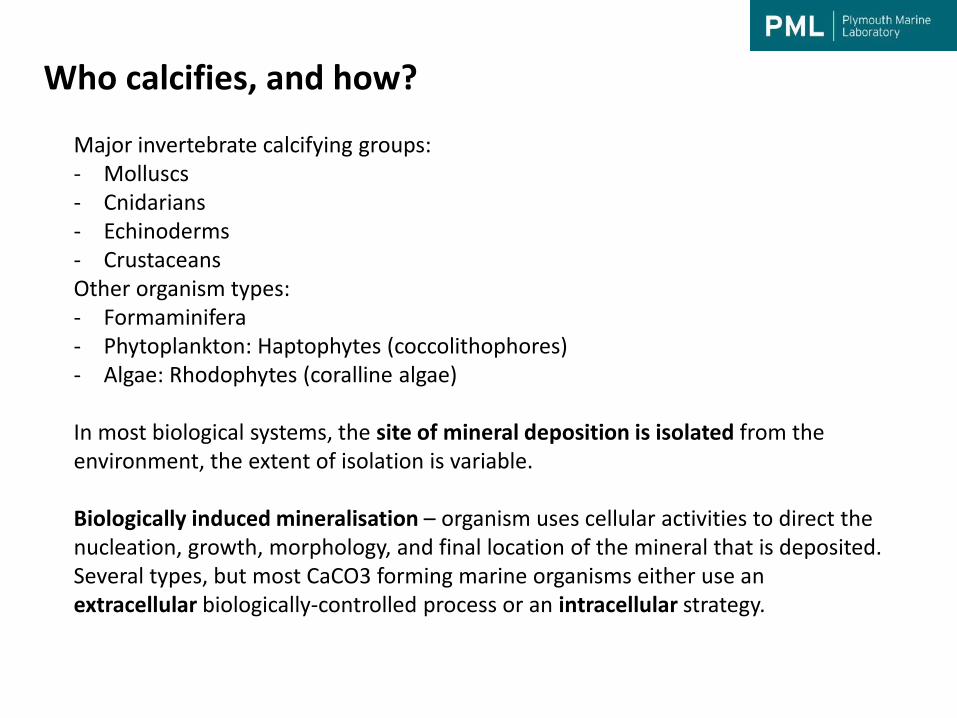
e.g. Corals
Who calcifies, and how?
Furla et al. 2000
• Model of dissolved inorganic carbon (DIC) absorption for coral calcification and photosynthesis.
• Extracellular space has controlled pH environment
• Anion exchange pumps are utilised for control
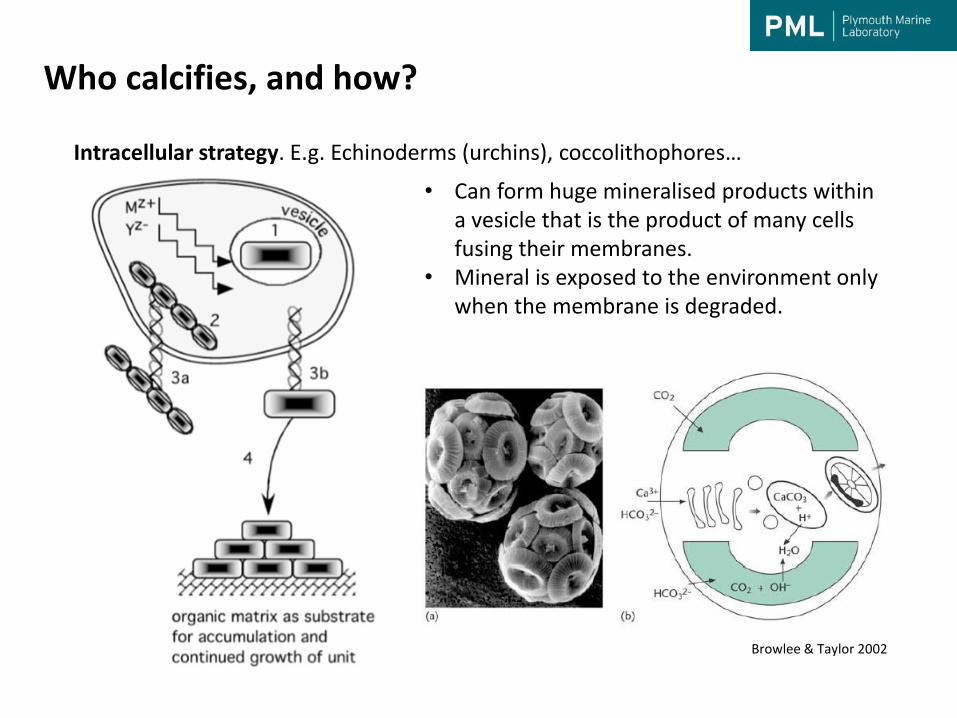
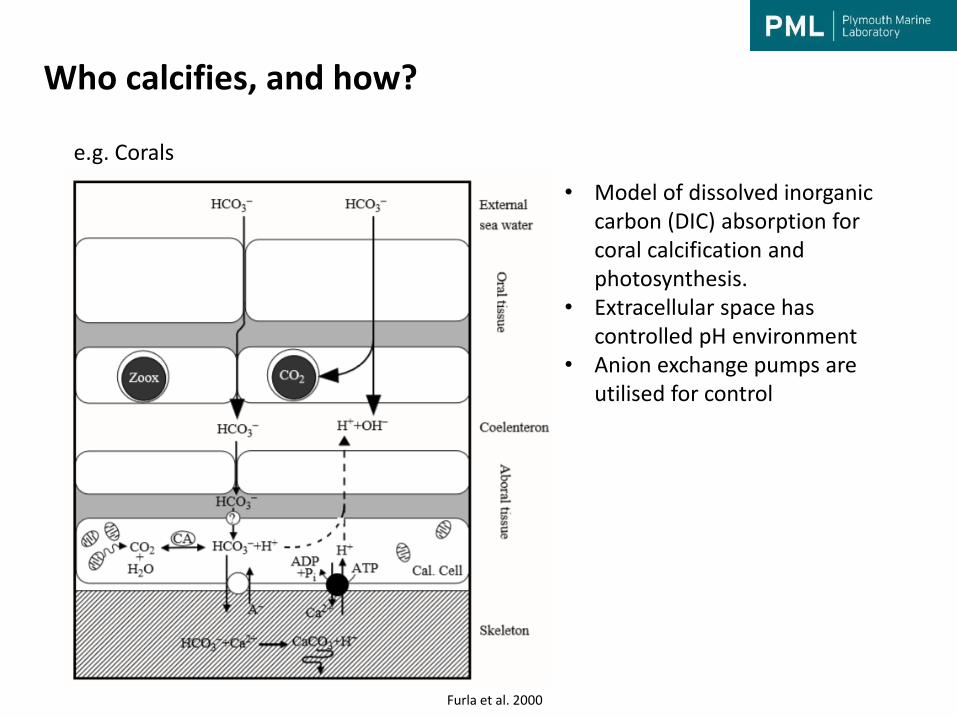
Intracellular strategy. E.g. Echinoderms (urchins), coccolithophores…
Who calcifies, and how?
• Can form huge mineralised products within a vesicle that is the product of many cells fusing their membranes.
• Mineral is exposed to the environment only when the membrane is degraded.
Browlee & Taylor 2002

Who calcifies, and how?
• Crustaceans have complex moult cycles • Able to reabsorb minerals from ‘old’ shell to
incorporate into ‘new’ shell • High organic component, as well as chitin • Organic matrix important for structuring
mineral formation • Different parts of crustaceans (e.g. claws,
carapace, legs) have different mineral content which determines ‘hardness’ and strength
Pane & Barry 2007; Photo MBARI (2006)
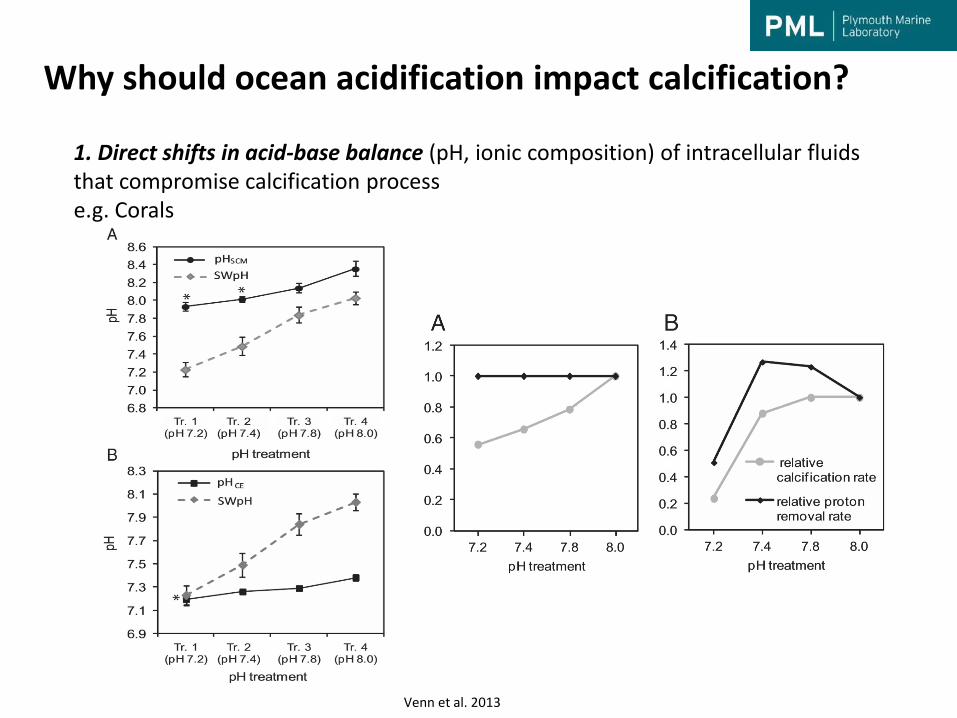
1. Direct shifts in acid-base balance (pH, ionic composition) of intracellular fluids that compromise calcification process e.g. Corals
Why should ocean acidification impact calcification?
Venn et al. 2013
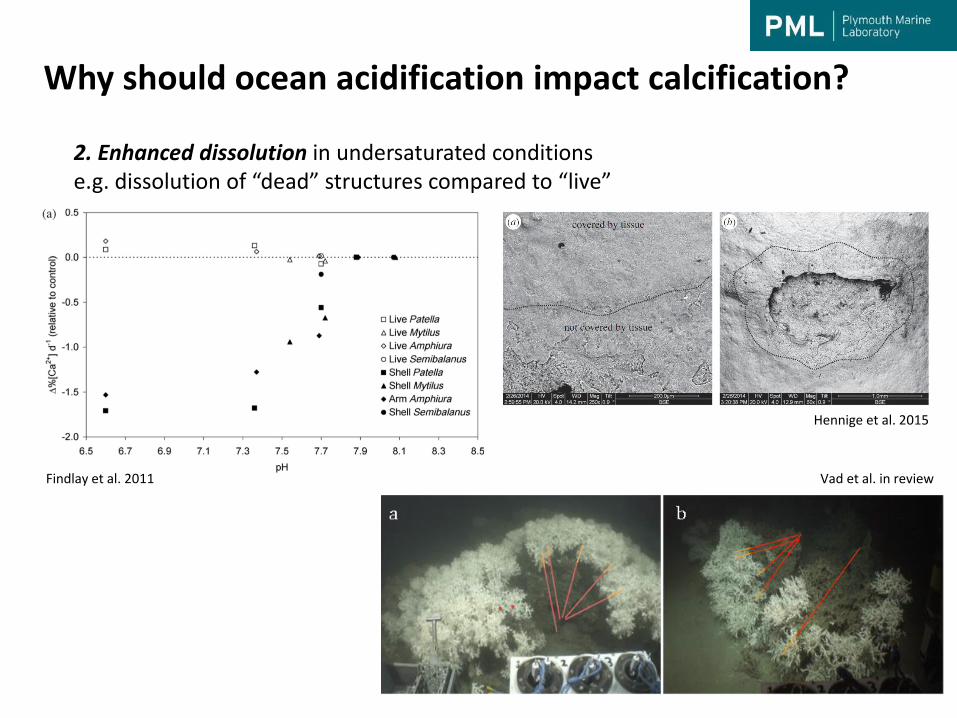
2. Enhanced dissolution in undersaturated conditions e.g. dissolution of “dead” structures compared to “live”
Why should ocean acidification impact calcification?
Findlay et al. 2011 Vad et al. in review
Hennige et al. 2015
0
5
10
15
20
25
30
35
40
8 7.7 7.3 6.8
pH
% c
alci
um/ g
of a
rm ±
95%
CI
established
regrowth
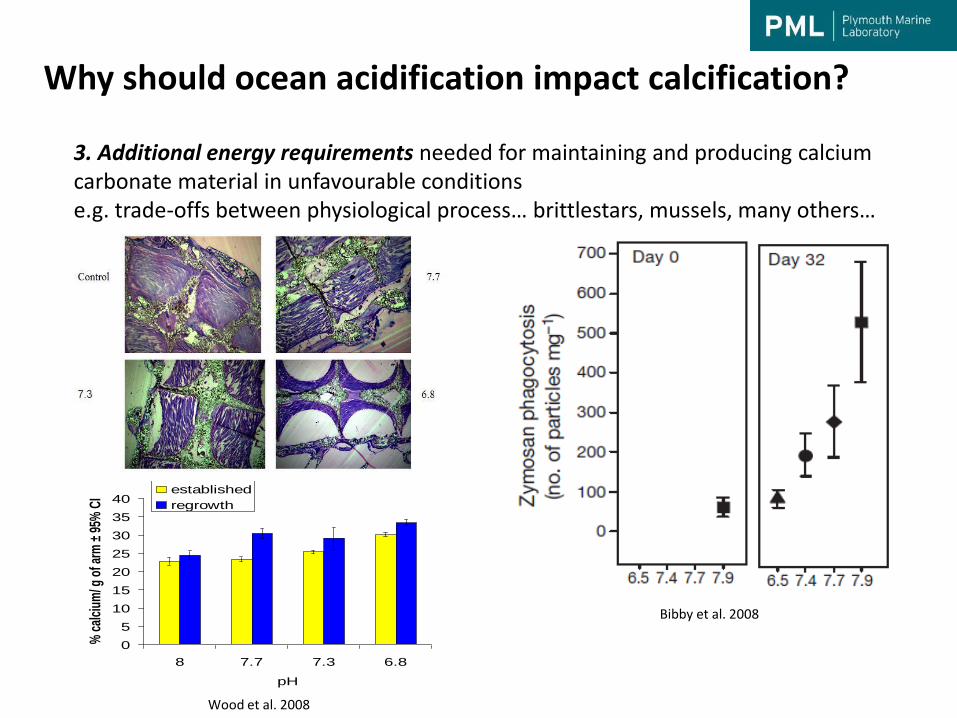
3. Additional energy requirements needed for maintaining and producing calcium carbonate material in unfavourable conditions e.g. trade-offs between physiological process… brittlestars, mussels, many others…
Why should ocean acidification impact calcification?
Wood et al. 2008
Bibby et al. 2008
• Gross calcification CaCO3 precipitated by an organism or community
• Net calcification CaCO3 precipitated by an organism or community minus
dissolution of CaCO3 from the organism or community.
• Potential calcification Gross calcification, assuming that the organisms
considered cover 100% of the area
• Net accumulation Amount of CaCO3 precipitated locally plus the amount of
material imported minus dissolution and export
Some definitions
• Geological approach • Sedimentalogical approach • Alkalinity Anomaly Technique • pH-O2
• Change in calcium concentration • Radioisotopes (45Ca, 14C, 3H-tetracycline) • Changes in particulate calcium content • X-ray analysis • Buoyant weight • “Biological” approach • Changes in Particulate Inorganic Carbon content • Molecular tools
Summary of techniques

CaCO3 accumulates in sediment over long time periods giving an indication of rates of calcification. Net accumulation of CaCO3 is calculated by the thickness of the layer multiplied by the density, divided by the time increment (measured by radiocarbon dating) Level: Community Timescale: 1000-20000 years Examples: Chave et al. (1972) Pros: Provides integrated, long-term estimates Cons: Numerous uncertainties and assumptions. Highly constrained by sea level
Geological
Turley et al. 2009
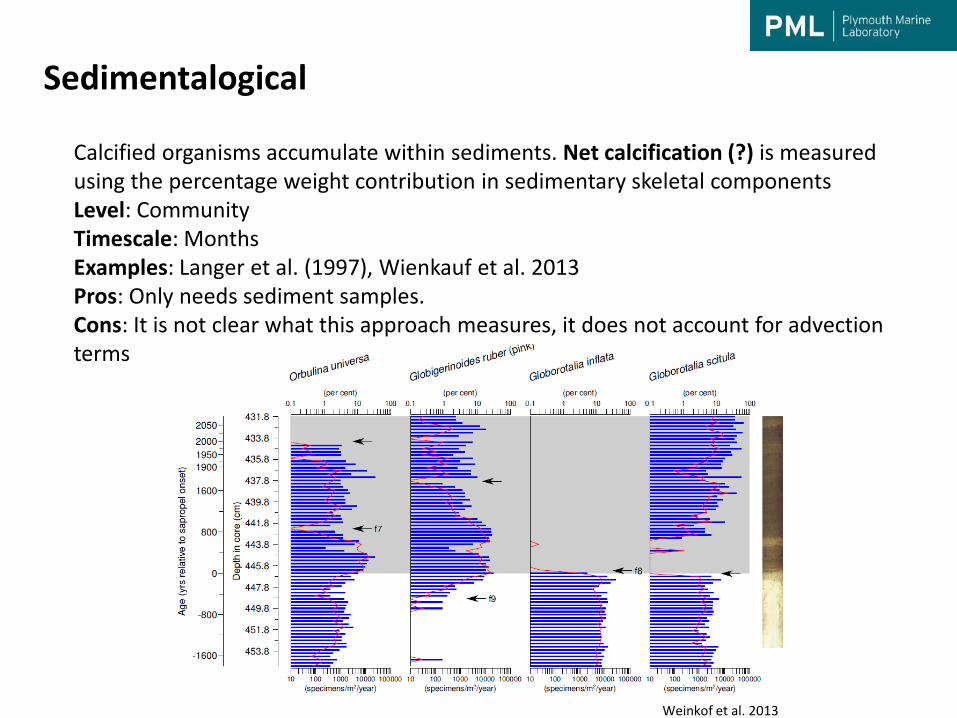
Calcified organisms accumulate within sediments. Net calcification (?) is measured using the percentage weight contribution in sedimentary skeletal components Level: Community Timescale: Months Examples: Langer et al. (1997), Wienkauf et al. 2013 Pros: Only needs sediment samples. Cons: It is not clear what this approach measures, it does not account for advection terms
Sedimentalogical
Weinkof et al. 2013

Alkalinity is lowered by two equivalents for each mole of CaCO3 precipitated. Net calcification is calculated by measuring the TA before and after an incubation period, and the ∆TA is scaled to ∆CaCO3 (i.e. calcification = 0.5x∆TA ) Level: Organisms and communities Timescale: Hours to weeks Examples: Smith & Key (1975), Gazeau et al. (2007), Martin et al. (2013), Inoue et al. (2013) Pros: Very precise (1 SD = 3 µmol/kg or about 0.2%) Cons: Needs discrete samples (but see Watanabe et al., 2004). A correction for changes in nutrients may be needed. Need to enclose or know residence time.
Alkalinity Anomaly Technique
Gazeau et al. 2007

Relationships exist between ΔO2 and ΔDICorg, the metabolic quotients. Net calcification can be measured by estimating net community production and respiration from changes in the concentration of dissolved O2. ∆DICcalc is then calculated by subtracting ΔDICorg from the upstream DIC value. ∆DICcalc can be converted to ∆TA and consequently calcification. Level: Organisms and communities Timescale: Hours Examples: Chisholm & Barnes (1998), Barnes (1983) Pros: It does not require TA monitor (which is timely) Cons: Needs DIC (hence TA) upstream. Assumes metabolic quotients
pH-O2
Chrisholm & Barnes 1998

Calcium concentration can directly be measured within internal fluids of organisms. Net calcification can be estimated from calcium removal measured using chemical titrations or sensors Level: Organisms and communities Timescale: Minutes to weeks Examples: Chisholm & Gattuso (1991), Al-Horani et al. (2003) Pros: Direct measurement of calcium uptake; no major assumptions Cons: Low detection limit, high background concentration (10 mmol/l)
Calcium concentration
Al-Horni et al. 2003
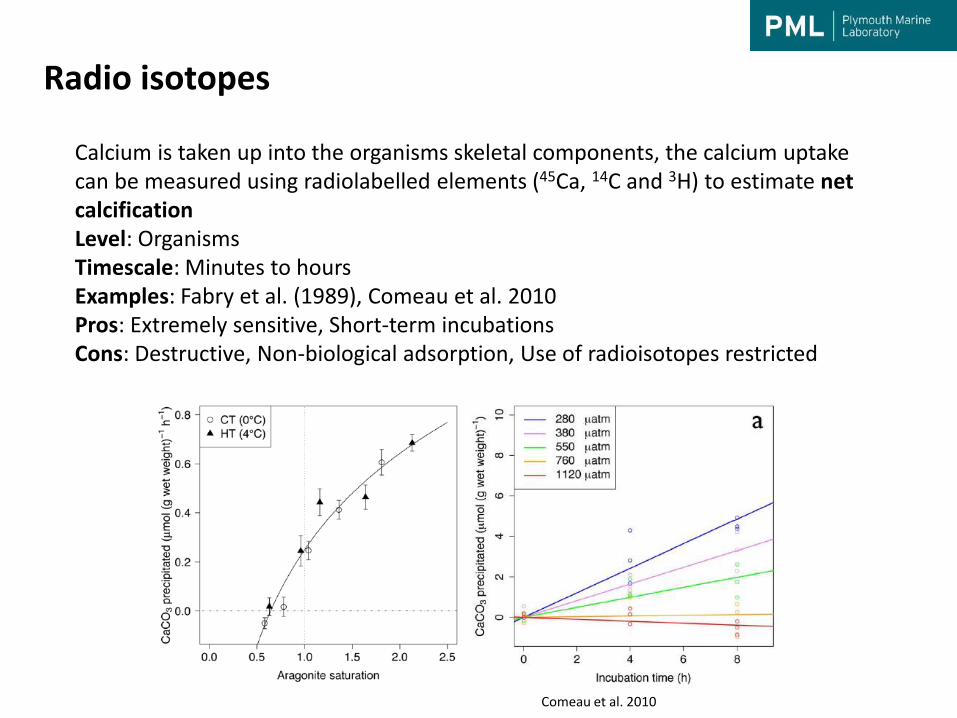
Calcium is taken up into the organisms skeletal components, the calcium uptake can be measured using radiolabelled elements (45Ca, 14C and 3H) to estimate net calcification Level: Organisms Timescale: Minutes to hours Examples: Fabry et al. (1989), Comeau et al. 2010 Pros: Extremely sensitive, Short-term incubations Cons: Destructive, Non-biological adsorption, Use of radioisotopes restricted
Radio isotopes
Comeau et al. 2010
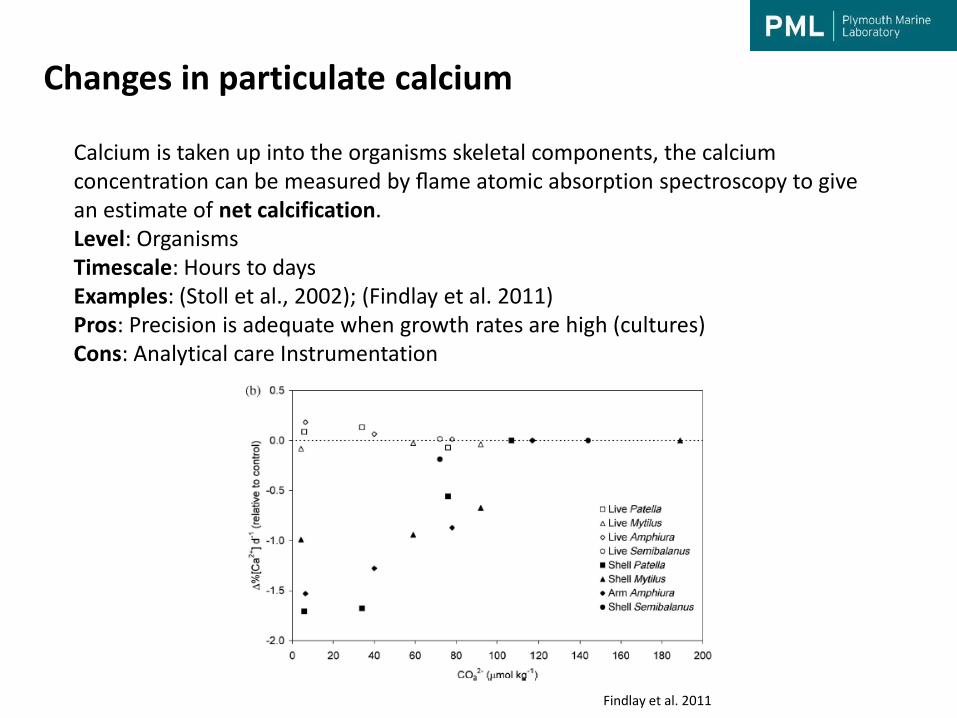
Calcium is taken up into the organisms skeletal components, the calcium concentration can be measured by flame atomic absorption spectroscopy to give an estimate of net calcification. Level: Organisms Timescale: Hours to days Examples: (Stoll et al., 2002); (Findlay et al. 2011) Pros: Precision is adequate when growth rates are high (cultures) Cons: Analytical care Instrumentation
Changes in particulate calcium
Findlay et al. 2011

X-rays (and Computerised tomography (CT) scanning) measure the density and mass of skeleton, providing a direct measure of net calcification, particularly through time (using long-lived coral structures). Level: Organisms Timescale: days, months, to 100s years Examples: Lough & Barnes (2000), Crook et al. (2013) Pros: Enables retrospective analysis, provides an assessment of erosion Cons: Requires substantial equipment & instrumentation
X-rays
Crook et al. 2013

Increases in mass of an organisms skeleton directly correspond to increases in net calcification. Level: Organisms Timescale: Sub-daily to months/years Examples: Dodge et al. 1984, Jokiel et al. 2008 Pros: Quite sensitive, Not destructive, No incubation required Cons: Serious problem of normalization for comparative analysis
Buoyant weight
Dodge et al. 1984

Growth measurements or turnover rates (for populations) are associated with an increase in mass of calcifed structure and can be used to estimate net calcification. Techniques can include using flurouscent dyes (e.g. calcein staining) to observe specific growth areas. Level: Organisms Timescale: Days, months to years Examples: Fabry (1990), Smith (1972), Migné et al. (1998), Comeau et al. (2009) Pros: Simple, individual level Cons: Short term growth not always significant, lots of variability
Biological approaches
Comeau et al. 2009
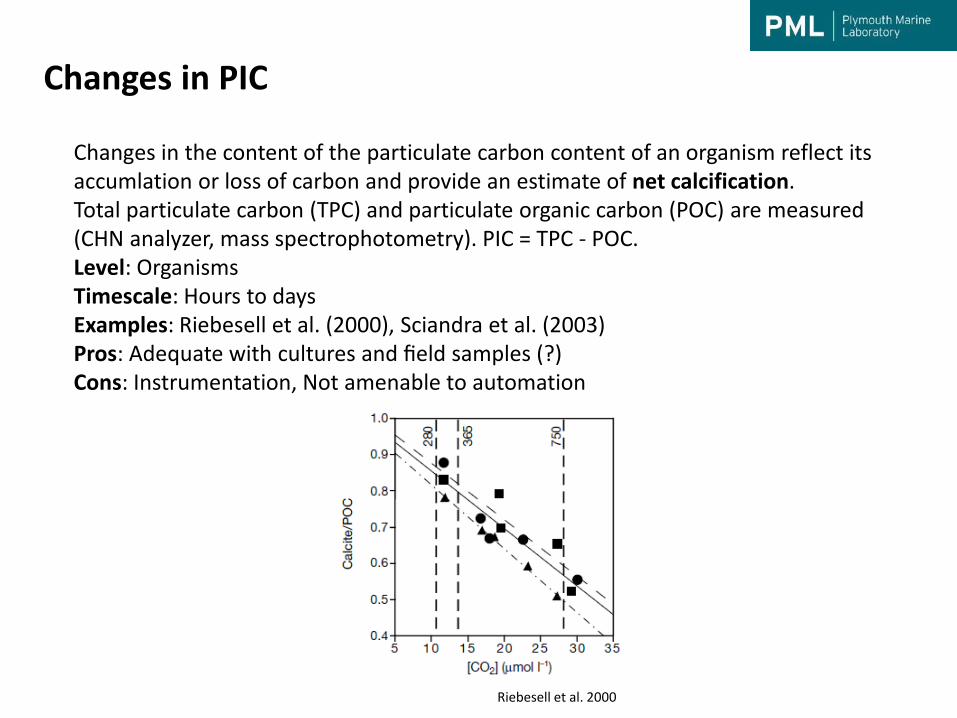
Changes in the content of the particulate carbon content of an organism reflect its accumlation or loss of carbon and provide an estimate of net calcification. Total particulate carbon (TPC) and particulate organic carbon (POC) are measured (CHN analyzer, mass spectrophotometry). PIC = TPC - POC. Level: Organisms Timescale: Hours to days Examples: Riebesell et al. (2000), Sciandra et al. (2003) Pros: Adequate with cultures and field samples (?) Cons: Instrumentation, Not amenable to automation
Changes in PIC
Riebesell et al. 2000
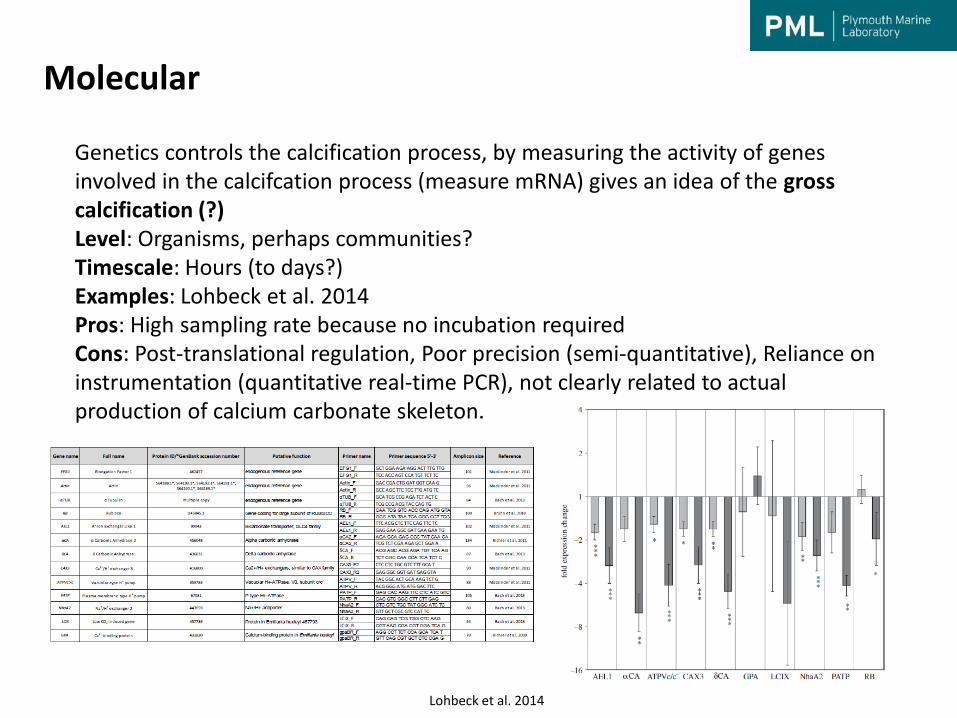
Genetics controls the calcification process, by measuring the activity of genes involved in the calcifcation process (measure mRNA) gives an idea of the gross calcification (?) Level: Organisms, perhaps communities? Timescale: Hours (to days?) Examples: Lohbeck et al. 2014 Pros: High sampling rate because no incubation required Cons: Post-translational regulation, Poor precision (semi-quantitative), Reliance on instrumentation (quantitative real-time PCR), not clearly related to actual production of calcium carbonate skeleton.
Molecular
Lohbeck et al. 2014

• Considerably different units across the different techniques
• Measurements tend to need to be normalised - organism: surface area, skeletal weight, body mass, biomass… - communities: volumetric, surface area…
• Not trivial to compare!
• Most measure NET calcification – difficult to disentangle the impacts on
the organisms ability to calcify with dissolution.
Generic measuring issues
Chan & Connolly, 2013
• Calcification ability has a connection to energy budgets
• Feeding rates may overcome some of the costs –will food supply change?
• Dissolution rates will increase as saturation state decreases – important for exposed material
• Bio-erosion may also further impact of OA
• Adaptation potential?
• Interactions between organisms
• Complexity of multiple stressors
Summary