the ca ifornia geogr pher - scholarworks.csun.edu
TRANSCRIPT
The Ca ifornia Geogr pher
Volume SO 2010
G 7 2 . C24 v.so
GEOGRAPHICAL
SOCIETY
201 o A Publication of the LIFORNIA GEOGRAPHICAL SOCIETY


The California Geographer
Volume SO, 2010
A Publication of the
CALIFORNIA GEoGRAPHICAL SociETY
Edited by
DoROTHY FREIDEL
Copyediting and layout by Rick Cooper Editing & Design,
Philomath, Oregon
Printed by OSU Printing, Corvallis, Oregon

The California Geographer
Editor Dorothy Freidel, Sonoma State University
Editorial Board Jeff Baldwin, Sonoma State University Gregory S. Bohr, Cal Poly San Luis
Crystal Kolden, University of Idaho James Wanket, CSU Sacramento Nancy Wilkinson, San Francisco State University Obispo
James Keese, Cal Poly San Luis Obispo Robert A. Voeks, CSU Fullerton
The California Geographer is a refereed journal of the California Geographical Society, and has been published annually since 1960. All statements and opinions that appear in the journal are the full responsibility of the authors and do not necessarily reflect the views of the California Geographical Society.
Volume XVII (1977) indexes volumes through IXVll, and volume XXIX (1989) indexes volumes through lXXIX. Volume numbering changed from Roman to Arabic numbering with volume 42 (2002). Volume 44 (2004) indexes volumes IXXX through 43.
For information on submitting a manuscript, see "Instructions to Contributors" on back page or Web site, http://www.csun.edu/-calgeosoc/. Direct all manuscript inquiries to Dorothy Freidel, CG Editor, Department of Geography and Global Studies, Sonoma State University; e-mail: [email protected].
Information for Subscribers and Advertisers Subscriptions: The domestic subscription rate is $20 per year; the foreign rate is $25 per year. Back issues are available for $20 each. Questions regarding subscriptions should be directed to: CGS, 1149 E. Steffen Street, Glendora, CA 91741-3736.
Advertising: Full-page ( 4.5" w x 7 .5" h) ads: inside front cover= $300; inside back cover= $250; back cover= $300; elsewhere= $200. Half-page (2.25" w x 3.75" h) ads are 50% of full-page rates. For more information, contact Jim Wanket, Cal State Sacramento, 6000 J Street, Sacramento, CA 95819, (916) 278-7580, fax (916) 278-7584, e-mail [email protected].
Copyright 2010 by the California Geographical Society
California Geographical Society 1149 E. Steffen St.
Glendora, CA 91741-3736

CALIFORNIA GEOGRAPHICAL SOCIETY 2009-2010
OFFICERS President
Robert A. Voeks CSU Fullerton
Secretary Sally Otton San Joaquin Delta College
Past President Jennifer Helzer CSU Stanislaus
BOARD MEMBERS John Carroll, CSU Fullerton
Vice President Steve Graves CSU Northridge
Treasurer Dan Walsh Saddleback College
Scott Crosier, Cosumnes River College Peggy Hauselt, CSU Stanislaus James Hayes, CSU Northridge Jason Pittman, Folsom Lake City College Greg Shaw, CSU Sacramento Maureen Smith, San Bernardino Valley College Jodi Titus, Irvine Valley College Peter Vorster, The Bay Institute Jim Wanket, CSU Sacramento Nicki Young, Beattie Middle School
Student Members Alison McNally, CSU Stanislaus Zia Salim, San Diego State University
Business Manager Steve Slakey University of La Verne
2010 Conference Chairs Robert A. Voeks CSU Fullerton John Carroll CSU Fullerton
Editor, CGS Bulletin Crystal LoVetere Cerritos College
Webmaster Steven M. Graves CSU Northridge
Web site: http:/ /www.csun.edu/-calgeosoc/

Table of Contents Articles
1 Agricultural Retention in California: Modeling the Effectiveness of the Williamson Act as Public Policy Jeffrey Onsted, Florida International University
37 Locating Protest in Public Space: One Year in San Francisco and Los Angeles Paul Stangl, Western Washington University
59 Water Resource Problems within Pre-platted Communities in the U.S.: the Case of Lake Havasu City, Arizona Hurbert B. Stroud, Arkansas State University and Thomas 0. Graff, University of Arkansas University
Geographic Education
75 eLearning by Doing: A Geographic Approach to Service Learning and Building Community Jennifer Helzer, California State University, Stanislaus
The Geographer's Viewpoint
89 The Pacific Asian Financial Crisis, Indonesian Forests, and "Us": Synthesizing a Multi-Perspective Application of Massey's Space Jeff Baldwin, Sonoma State University
Geographic Chronicles 129 2010 Meeting Report: Fullerton
Robert Voeks, California State University Fullerton
132 2010 Award Winners

Agricultural Retention in California: Modeling the
Effectiveness of the Williamson Act as Public Policy
Abstract
Jeffrey Onsted Florida International University
The Williamson Act has served as a major regulatory tool to impede the loss of farmland in California. Since similar voluntary, tax-incentive programs for farmland conservation exist in nearly every state in the Union, it is pertinent to ask the question: Will this Act and other similar programs remain effective and viable in the years to come? Past observation of Tulare County, California, reveals a significant and growing number of parcels leaving the Williamson Act around urban areas and major roads. Furthermore, cellular automata simulation of the future in Tulare County suggests that the current decline in enrolled hectares will continue well into the future. Finally, parcels terminating their contracts tend to be disproportionately near urban areas and contain prime farmland, rather than less-valuable grazing lands, causing them to share a greater burden of urban development.
Keywords: cellular automata, farmland protection, Williamson Act, urban growth modeling
Introduction FoR ovER Two HUNDRED YEARS, agriculture has been a defining attribute of California's social and physical geography, as many geographers and historians have noted.1 In that time, hundreds of thousands of settlers, from other states as well as nations, moved to California (see Figure 1), seeking prosperity first in gold Qelinek 1982) and later, in successive waves, the state's orchards and fields Qelinek 1982, Kirsch 1993, Bradley 1997) .
As Johnson and McCalla (2004) note, California's agricultural landscape has been dynamic, changing in response to shifting patterns of settlement, labor availability, altered global agricultural and financial markets, and to the demands of other industries, such as defense, as well as water availability and infrastructure. The suburban boom of
The Califomia Geographer 50,© 2010 by The California Geographical Society

r--:<.o. ><::»»;<::>::>"'""·"" "'""'"'' "'•·'-" * '»" _.,.... K ,.,.,., ...,_,.,._,.. ,....._ , �,:-•>"'"'' -�M«: ,..,.. >< :::< .. .,< ....... : ........... -..._.. __ ,__,..........,"..,-�--AA:::���:::<:»..,_...,.,.,�:->..>.«<:1
! California's Population. j " ! 4S,ooo,ooo 1 ��� 1,1 3s.ooo.ooo / I ��:���:��� /�· :· �= I ��:���:��� /L'" .. _ .... . -··"�'� -Population I
I' 1o.ooo.ooo ___., · ··---- 1 5,000,000 __.,..,. . --· ···--- i
I 0 ,� �� ·;-q�� q.,�' q'>� q�� �.#'- /� I !. •- ······ · ................. �� . . . , ... � ............ : ....... .... � .... ........... : .... ······=·······-··=·· ......... : ........ �...... . ·······························-··1 Figure 1.-Califomia's Historical Population. (*California Department of Finance Estimate. All other decennial points come from US Census Bureau.)
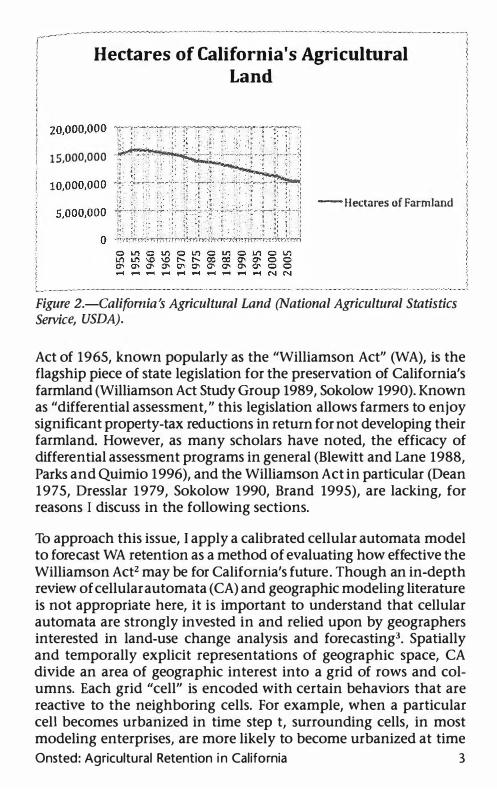
the post-World War II era brought about an additional shift, with enormous amounts of farmland being converted for residential and commercial uses along the coast. At the same time, new agricultural lands were becoming available in the Central Valley (Sokolow and Spezia 1992), due in large part to publicly funded water projects (Johnson and McCalla 2004). More recently, though, the Central Valley has become the new center of gravity for population growth in California, enticing would-be homeowners priced out of the coastal market as well as newcomers from other states (Teitz, Dietzel, and Fulton 2005). However, as others have pointed out, there are no new areas for agricultural expansion in California (Johnston 1990, Sokolow 1997). Therefore, as suburban developments sprawl throughout the Central Valley, total hectares of state farmland have been irrevocably reduced. Consequently, since its peak in the 1950s, California has lost well over five million hectares of crop and ranchlands, more than a third of its peak total (United States Department of Agriculture (USDA), National Agricultural Statistics Service (NASS); see Figure 2) .
Growing concern over the loss of these agricultural lands, particularly in terms of the environmental and economic costs of these conversions, led California to establish agricultural protection policies, beginning in the 1960s. The California Land Conservation 2 The California Geographer Ill Volume 50, 201 0
Hectares of California's Agricultural Land
15,000,000
- Hectares of Farmland
Figure 2.-Califomia's Agricultural Land (National Agricultural Statistics Service, USDA).
Act of 1965, known popularly as the "Williamson Act" (WA), is the flagship piece of state legislation for the preservation of California's farmland (Williamson Act Study Group 1989, Sokolow 1990). Known as "differential assessment, " this legislation allows farmers to enjoy significant property-tax reductions in return for not developing their farmland. However, as many scholars have noted, the efficacy of differential assessment programs in general (Blewitt and Lane 1988, Parks and Quimio 1996), and the Williamson Act in particular (Dean 1975, Dresslar 1979, Sokolow 1990, Brand 1995), are lacking, for reasons I discuss in the following sections.
To approach this issue, I apply a calibrated cellular automata model to forecast WA retention as a method of evaluating how effective the Williamson Act2 may be for California's future. Though an in-depth review of cellular automata (CA) and geographic modeling literature is not appropriate here, it is important to understand that cellular automata are strongly invested in and relied upon by geographers interested in land-use change analysis and forecasting3• Spatially and temporally explicit representations of geographic space, CA divide an area of geographic interest into a grid of rows and columns. Each grid "cell" is encoded with certain behaviors that are reactive to the neighboring cells. For example, when a particular cell becomes urbanized in time step t, surrounding cells, in most modeling enterprises, are more likely to become urbanized at time Onsted: Agricultural Retention i n California 3

step t+ 1 . In my successful utilization of the CA method, I produced maps of one county's forecast WA regulatory landscape. This effort allows urban planners as well as policymakers an opportunity to visualize where enrolled lands may be in the future.
While this particular CA model, SLEUTH (explained below), has been applied in several geographic areas in California (Clarke, Hoppen, and Gaydos 1997; Clarke and Gaydos 1998; Tietz, Dietzel, and Fulton 2005; Osherenko et al. 2008; Onsted 2007), this article focuses only on one Central Valley County: Tulare. As the center of the state's dairy industry, as the producer of the majority of the state's citrus products Oohnston and McCalla 2004), and yielding the secondhighest agricultural market value in the nation ($3,872,000,000 in 2006 [American Farmland Trust (AFT), 2009a]), Tulare is an especially relevant county of study. However, it is also facing tremendous urban growth and population pressure. From 1986 to 2008, the county lost 1 1 ,000 hectares of prime (see Figure 3 for specific farmland definitions) and irrigated farmland as well as an additional l l ,OOO hectares of farmland of statewide importance4• Over 8,200 hectares of this land, most of it prime or irrigated farmland, (CA Dept of Conservation b), was developed.
This large increase in development and loss of irrigated and prime farmland has not gone unchallenged. The AFT has made extended public comments on the new Tulare County General Plan Update (AFT 2007c) in order to persuade policymakers to reduce the amount of land each new residence is consuming. AFT (2009b) claims that it is not growth itself that is the problem, but rather, "wasteful land use." It cites the fact that from 1982 to 1997, the population of the United States grew 1 7 percent, but the amount of urbanized land grew 47 percent. Therefore, the amount of urbanized land per person is growing. Also, since 1994, 55 percent of newly developed land has been "ranchettes," or 10+ acre housing lots (Ibid). Tulare County, therefore, and the conclusions drawn from its past and possible future, are emblematic of the entire Central Valley as well as the state as a whole.
As Veldkamp (2009) has used the term Gov-scape to describe the geographic manifestations of regulatory conditions, particularly those that mediate possible land use/ land cover change, I will be using this term to designate both current conditions of the WA as well as future forecasting. This research can also allow for a better understanding of the possible Gov-scapes that the Williamson Act
4 The Califo rnia Geographer • Volume 50, 201 0

Figure 3.-CA Dept. of Conservation's FMMP Farmland Categories. (Text
excerpted and edited from: http://www.conservation.ca.gov/dlrp/fmmp/ mccufPages/map _categories.aspx)
IMPORTANf FARMLAND CATEGORIES About 94 percent of the FMMP's study area is covered by US Department of Agriculture (USDA) modern soil surveys. A classification system that combines technical soil ratings and current land use is the basis for the Important Farmland Maps of these lands. In areas where no soil survey is available, a series of Interim Farmland definitions have been developed to allow land use monitoring until soils data becomes available.
IMPORTANf FARMLAND MAP CATEGORIES The minimum land use mapping unit is 10 acres unless specified. Smaller units of land are incorporated into the surrounding map classifications. In order to most accurately represent the NRCS digital soil survey, soil units of one acre or larger are depicted in Important Farmland Maps.
Prime Farmland (P) Farmland with the best combination of physical and chemical features able to sustain long term agricultural production. This land has the soil quality, growing season, and moisture supply needed to produce sustained high yields. Land must have been used for irrigated agricultural production at some time during the four years prior to the mapping date.
Farmland of Statewide Importance (S) Farmland similar to Prime Farmland but with minor shortcomings, such as greater slopes or less ability to store soil moisture. Land must have been used for irrigated agricultural production at some time during the four years prior to the mapping date. Download information on the soils qualifying for Farmland of Statewide Importance.
Unique Farmland (U) Farmland of lesser quality soils used for the production of the state's leading agricultural crops. This land is usually irrigated, but may include nonirrigated orchards or vineyards as found in some climatic zones in California. Land must have been cropped at some time during the four years prior to the mapping date.
Farmland of Local Importance (L) Land of importance to· the local agricultural economy as determined by each county's board of supervisors and a local advisory committee.
Grazing Land (G) Land on which the existing vegetation is suited to the grazing of livestock. This category was developed in cooperation with the California Cattlem�n's Association, University of California Co-
(continued on next page)
Onsted: Agricultural Retention in California 5

Figure 3 continued
6
operative Extension, and other groups interested in the extent of grazing activities.
Urban and Built-up Land (D) Land occupied by structures with a building density of at least 1 unit to 1.5 acres, or approximately 6 structures to a 10-acre parcel. This land is used for residential, industrial, commercial, construction, institutional, public administration, railroad and other transportation yards, cemeteries, airports, golf courses, sanitary landfills, sewage treatment, water control structures, and other developed purposes.
Other Land (X) Land not included in any other mapping category. Common examples include low density rural developments; brush, timber, wetland, and riparian areas not suitable for livestock grazing; confined livestock, poultry or aquaculture facilities; strip mines, borrow pits; and water bodies smaller than forty acres. Vacant and nonagricultural land surrounded on all sides by urban development and greater than 40 acres is mapped as Other Land.
Beginning in 2002, the pilot Rural Land Mapping Project provides more detail on the distribution of various land uses within the Other Land category in four San joaquin Valley counties.
Water (W) Perennial water bodies with an extent of at least 40 acres.
Interim Farmland Map Categories (categories no longer in use in Tulare County after 1998. Text below excerpted from: http://www. conservation.ca.gov/dlrp/fmmp/Documents/fmmp_guide_2004. pdf)
For farmed areas lacking modern soil survey information and for which there is expressed local concern on the status of farmland, the following categories substitute for the categories of P, S, U, and L. This had historically included Butte, Colusa, and portions of Kern and Tulare Counties. With the completion of the Colusa and Western Tulare soil surveys (1998), only Butte and Kern counties continue to have Interim Farmland data.
• IRRIGATED FARMLAND (I): Cropped land with a developed irrigation water supply that is dependable and of adequate quality. Land must have been used for irrigated agricultural production at some time during the four years prior to the mapping date.
• NON-IRRIGATED FARMLAND (N): Land on which agricultural commodities are produced on a continuing or cyclic basis utilizing stored soil moisture.
The California Geographer • Volume 50, 201 0

and other differential assessment programs may be creating. Policy
makers as well as administrators, therefore, are well served by any
research that can better allow for them to effect the result that the
Williamson Act and other similar programs were originally designed to achieve. The legislature, under the Act, seeks to prevent the "premature and unnecessary conversion of agricultural land to urban
uses. " (California Government Code Section 51220(c), see Figure 4). However, the nebulous wording "premature and unnecessary"
leaves open to interpretation just how to evaluate the Act's effective
ness, because such words conjure normative ideas of community priorities rather than rigorously derived and objectively definable criteria. This normative valuation varies over space as well as time, adding concomitant variability to the manifestations of the Act's local administration. Consequently, different county authorities may feel they are abiding by the spirit of this provision yet making very different decisions regarding the WA. Nonetheless, despite the difficulty in evaluating the success of the Williamson Act in any particular jurisdiction, it is possible to evaluate and model the enrollment as well as termination of participating parcels, because the effectiveness of the Act must correspond, at least somewhat, with the amount and types of agricultural parcels enrolled, as reflective of overall retention. This research, therefore, is one response to a suggestion made by Parks and Quimio (1996): "A spatially detailed analysis could employ geographic information (e .g., maps and aerial photographs) to determine which agricultural land uses were present in urbanizing areas, and could further examine the effectiveness of farmland assessment on these specific locations" (p. 6) .
Thus, this article explores the following research questions: 1 . Given past enrollment and termination trends, as well as patterns of urban growth, when will WA enrollment saturation take place? 2. Where are the lands most likely to leave the WA located?
In the following sections, I give an overview of farmland losses in California as well as the various policy tools in place to address this and the scholarly debate within which this work is framed. Then, I discuss the modeling itself, detailing the data, as well as the model's architecture. Results are offered and I then conclude the article with a discussion on the implications of this work as well as future research.
Onsted: Ag ricultu ral Retention i n Cal ifornia 7

Figure 4.-Enabling Williamson Act Legislation. From California Government Code Section 51220.
8
5 1 220. The Legislature finds:
(a) That the preservation of a maximum amount of the limited supply of agricultural land is necessary to the conservation of the state's economic resources, and is necessary not only to the maintenance of the agricultural economy of the state, but also for the assurance of adequate, healthful and nutritious food for future residents of this state and nation.
(b) That the agricultural work force is vital to sustaining agricultural productivity; that this work force has the lowest average income of any occupational group in this state; that there exists a need to house this work force of crisis proportions which requires including among agricultural uses the housing of agricultural laborers; and that such use of agricultural land is in the public interest and in conformity with the state's Farmworker Housing Assistance Plan.
(c) That the discouragement of premature and unnecessary conversion of agricultural land to urban uses is a matter of public interest and will be of benefit to urban dwellers themselves in that it will discourage discontiguous urban development patterns which unnecessarily increase the costs of community services to community residents.
(d) That in a rapidly urbanizing society agricultural lands have a definite public value as open space, and the preservation in agricultural production of such lands, the use of which may be limited under the provisions of this chapter, constitutes an important physical, social, esthetic and economic asset to existing or pending urban or metropolitan developments.
(e) That land within a scenic highway corridor or wildlife habitat area as defined in this chapter has a value to the state because of its scenic beauty and its location adjacent to or within view of a state scenic highway or because it is of great importance as habitat for wildlife and contributes to the preservation or enhancement thereof.
(f) For these reasons, this chapter is necessary for the promotion of the general welfare and the protection of the public interest in agricultural land.
The California Geographer • Volume 50, 201 0

california Farmland Conversion and Protection Farmland in the United States is steadily being converted to urban and suburban uses. Since its peak in 1954, there has been a net loss nationwide of over 1 1 5 million hectares of farmland (US Depart
ment of Agriculture (USDA) National Agricultural Statistics Service [NASS], 2010) . The public sector, aware of the problem, has tools in place at multiple levels of jurisdiction to address this. At the federal level, the United States Government has provided the Agricultural Land Preservation Program (as part of the 2008 US Farm Bill), which provides $743 million in matching funds to qualified entities (states, counties, etc.) from fiscal years 2008 to 2012. However, the actual administration, acquisition, and regulation of farmland preservation still takes place at the local or state level.
The most-common form of land-use control in the nation, zoning,
is found at the local level (Daniels and Bowers 1997, Cordes 1999, Salkin 2008) . In particular, agricultural protection zoning exists in over seven hundred counties in twenty-four states (Freilich 1999) . However, the loss of farmland historically has not been halted permanently by these measures, because variances and exemptions are often granted while agricultural zoning and even master plans can and do change over time (Libby 1994, Cordes 2002, Duke and Lynch 2006). Therefore, the continued existence of zoning measures, which are nearly ubiquitous in the U.S., should not be considered, in their totality, as all that is necessary to keep farmland solvent. In fact, agricultural zoning is much more powerful when in combination with other programs, including Transfer of Development Rights (TDRs), Right-to-farm ordinances, and protection from misuse of eminent domain (Parks and Quimio 1996, Daniels 1997, Daniels and Bowers 1997, Cordes 2002) .
At the state level, there is a variety of programs nationwide designed to protect agricultural lands. The most powerful of these programs, because they provide permanent protection, are referred to generically as PACE (Purchase of Agricultural Conservation Easements) programs, whereby states, local governments, or other agencies, buy development rights from farmers. California has one such program, the California Farmland Conservancy Program, or CFCP. This has provided funding for local agencies to conserve roughly 17,500 hectares thus far (California Department of Conservation [DOC] 2010a) . Similar efforts at the local level have acquired approximately 22,000 more (American Farmland Trust (AFT) 2009a). This may seem significant, but when put in contrast with California's
Onsted: Agricultural Retention in California 9

private farmland total of 10.3 million hectares (USDA NASS, 2009), this provides only about 0.38 percent perpetual protection of California's agricultural lands. In contrast, the state of Maryland in 2009 had a total of 830,000 hectares of farmland (NASS), with 136,000 hectares in a PACE state-level program (AFT 2009b) and roughly 34,500 hectares held in local programs (AFT 2009a), yielding over twenty percent permanent protection. Given the small percentage of PACE lands in California, therefore, the Williamson Act's future retention takes on greater significance.
Under the Act, land is valued for the net income farmers can expect to receive from farming their property, rather than the development potential of the parcel, reflected in the full market price. Differential assessment, by valuing farmers and their land for their agricultural output rather than their potential for development, helps farming operations, particularly those near urban areas, to remain solvent, because market-rate property taxes would create an untenable economic hardship (Sokolow 1990) . They also help preserve farmland by mitigating other various push factors that may influence farmers to sell or develop their land in suburbanizing areas (including trespassers, hostile neighbors, and increased traffic (Handel 1999). Differential-assessment programs, however, are voluntary and, unlike easements, they may be entered into and exited from as market conditions change. In California, local governments received partial compensation from the state for foregone tax revenues via the Open Space Subvention Act of 1971 (CA Government Code Section 16140-16154), which has recently, and for the first time since its inception, been all but eliminated5 due to California's ongoing budget crisis. Though most states do not employ subventions, nearly all utilize some form of differential assessment, broadening the applicability of this research.
Currently, there are about 6.7 (DOC 2007c) million hectares under Williamson Act contract, well over half of all private agricultural land in California. Yet, as Figure 2 clearly demonstrates, farmland loss has not only failed to be checked, but has steadily advanced. From 1992 to 2006, approximately 145,000 hectares were converted from agricultural uses to urban uses6 (CA Dept. of Conservation Web site b). However, this is out of a 1992 pool of 9.4 million hectares of agricultural land7, equaling an average annual conversion rate of only 0. 1 1 percent. Consequently, some scholars contend this rate of conversion is so slow, there is no reason for panic (Plaut 1980,
·
1 0 Th e Cal ifornia Geographer • Volume 50, 201 0

Fischel 1982, Gustafson and Bills 1984; Kuminoff, Sokolow, and sumner 2001) .
Despite these seemingly infinitesimal rates of loss, though, impacts are uneven. First, as other researchers have noted (Mandelker et
al . 2005), these overall calculations do not reveal the acceleration over this period in urbanization. Though the period 1992 to 1994 saw 12,200 hectares developed, the pace steadily accelerated until, in the 2004-06 figures, 25,000 hectares were converted, a 106 per
cent increase in the conversion rate (CA Dept. of Conservation) . second, most of the highly productive farmland rings urban areas and is in the direct path of expanding cities (see Figure 5). According to California's Farmland Mapping and Monitoring Program (FMMP), 46,500 hectares of prime farmland were urbanized during this fourteen-year period. Therefore, given a base of 1 . 74 million hectares in 19928, prime farmland urbanized at an average rate of nearly 0.2 percent per year, a rate nearly three times faster than for less valuable grazing lands (Ibid) . Thus, those farms closest to urban centers, which tend to be the most productive, are facing a greater threat from urbanization than more distant agricultural operations (see Figure 5).
Materials and Methods
Data Acquisition Examining multi-scape models (in this case, COV-scapes [land cover] and GOV-scapes [regulatory conditions of parcels]), especially how they dynamically interact, is a difficult but emerging field of inquiry in land-use science (Veldkamp 2009) . Despite the challenge, to begin to understand both land governance change and land-cover and -use change, they must be examined simultaneously. In this research, both urban growth and Williamson Act change are based on human decisions that are modified and regulated by government entities. Specifically, urban growth cannot take place on lands under a Williamson Act contract until said contract is terminated, usually at the request of the landowner. Conversely, proximity to urban lands, as well as other relevant geographic factors, puts pressure on landowners to terminate their Williamson Act contracts so they may maximize their land value by developing it, despite high taxes incurred in the process (Dean 1975, Dresslar 1979, Sokolow 1990, Brand 1995, Onsted 2007, Osherenko et. al . 2008; also see Blewit and Lane 1988 for a graphical illustration of this phenomenon).
Onsted: Ag ricultu ral Retention in Cal ifornia 1 1

Tulare County 2002 Land Use Land use - Developed Land
Fhme F•rml•nd Less Important
- GmingLand 1 _ _ j \Mner �.;��l Parkm!
... .l.., .
1 ,'-" .. '· .. ,.- �.
2.5 1.25 0 - -
Figure 5.-Tulare County 2002 Land Use Only.
By populating a Geographic Information System (GIS) with data from the FMMP, the Public Policy Institute of California (PPIC), the Tulare County Assessor, as well as other sources, I could observe WA contracted lands over time and in spatial proximity to urban areas, major roads, and various slopes. However, discovering Former WA lands was more difficult. Toward this end, I procured documents
1 2 The California Geographer • Volume 50, 201 0

from the California Department of Conservation (DOC) that allowed
for an editing of the assessor's shapefiles. These revised shapefiles
then reflected not only the location of current Williamson Act con
tracted lands but also former Williamson Act (FWA) lands9•
Because the Williamson Act is regulated with attention to farmland
type (prime farmland, etc.), I have classified my forecasts in the same
manner (see Figure 3 for land-use category definitions). The FMMP
parcel boundary digital map files for Tulare County exist biennially, from 1986 to 2002, the last year used in this research. Once all of the parcel map files were collected, urban growth throughout the years and conversion of surrounding farmlands could be observed. Earlier urban-growth and land-use data for modeling purposes (19 7 4) was acquired from Dr. Charles Dietzel, of PPIC.
The combination of land-use mapping with not only current Wil
liamson Act contracted lands but former WA lands is one advantage of this research. This was achieved by matching Assessor Parcel Numbers (APNs) between the documents and the Assessor's database. This record was then edited to reflect (a) whether the parcel is or was in the WA, (b) the parcel's entry date into the WA, and (c) the parcel's exit date from the WA (see Figures 5, 6, and 7) .
Data Rendering The initial function of this map creation was visual exploration. Toward this end, I examined a series of images at biennial intervals beginning with 1 986. For each of these years, a cadastral framewod overlaying the land-use layer reflects those lands under WA contract for that year, those lands that were not under WA contract, and. most importantly, those parcels that had since terminated thei1 contracts.10
With the different temporal layers properly arranged, it appeared visually that, indeed, those parcels leaving the WA were not randomly distributed and that, in fact, a case could be made that the same phenomena cited by Clarke et al. ( 1996, 1997) as causal factors in urban growth (slope, proximity to urban areas, proximity to roads) were also relevant for the spread of former Williamson Act (FWA) lands (see Figures 6 and 7) . Though it has been known for some time that those lands in the path of urban growth are more likely to leave the WA (Dresslar 1979), generating a more-specific forecast of future termination using this data can be helpful for planners and policymakers.
Onsted: Agricultu ral Retention in California 1 3

Tulare County - Developed Land
�Land Water P'or�land 1986 w;;amson Act Lands
- 198!iFormerW\Lands
2.5 M•los
Figure 6.-Visalia and Tulare, 1986 (WA Gov-Scape, Tulare County).
Williamson Act Forecasting To quantify this general observation, I applied a cellular automata urban growth model, SLEUTH. Taking into account proximity to existing urban areas, proximity to roads, and slope, SLEUTH is a widely consulted application that has been employed by researchers all over the world: from Albuquerque, New Mexico, to Yaounde, Cameroon (Clarke et al. 2007). In my novel research approach,
1 4 The California Geographer • Volume 50, 201 0

Tulare
L.and Use - Cevc!opml Land
Ag Land
;-:-:::J \1'.-llter
�£I-;:J Parkland
� 20CJ V\1!1iamson Act L.ar,ds
- 2002 Former\1\tU�amson Act Lands
N
A
Figure 7.-Visalia and Tulare, 2002 (WA Gov-Scape, Tulare County).
however, SLEUTH was used to forecast which Williamson Act lands are likely to terminate their contracts in the future. The calibration metrics for this exercise, which measure the fit of predicted values against actual data (Onsted 2007), yielded scores comparable with urban growth calibration in Tulare County. Therefore, using SLEUTH to predict Williamson Act termination is justified.
Onsted: Agricultural Retention in California 15

. -, ... --�···· ········:�-;-: �
: · •.. . .. � :_
, II Former Williamson Act and Urban
Non-Prime, Non-WA
II Prime Non-WA
Williamson Act Non-Prime
Williamson Act Prime
Ill Other Land
,.�--.
. .•..• : . . . .
: i
.. Jii
Figure 8.-2003 Tulare County Current and Former WA lands (one MC iteration). 16 The California Geographer • Volume 50, 2010
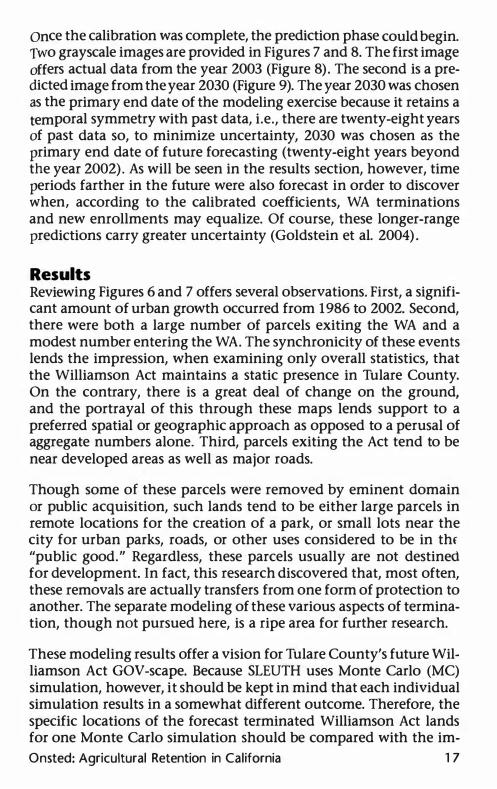
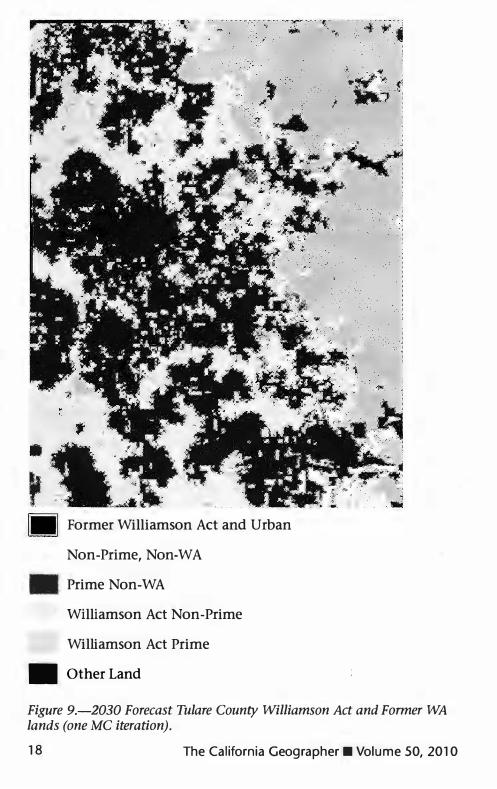
once the calibration was complete, the prediction phase could begin. rwo grayscale images are provided in Figures 7 and 8. The first image offers actual data from the year 2003 (Figure 8) . The second is a predicted image from the year 2030 (Figure 9). The year 2030 was chosen as the primary end date of the modeling exercise because it retains a temporal symmetry with past data, i.e., there are twenty-eight years of past data so, to minimize uncertainty, 2030 was chosen as the primary end date of future forecasting (twenty-eight years beyond the year 2002). As will be seen in the results section, however, time periods farther in the future were also forecast in order to discover when, according to the calibrated coefficients, WA terminations and new enrollments may equalize. Of course, these longer-range predictions carry greater uncertainty (Goldstein et al. 2004) .
Results Reviewing Figures 6 and 7 offers several observations. First, a significant amount of urban growth occurred from 1986 to 2002. Second, there were both a large number of parcels exiting the WA and a modest number entering the WA. The synchronicity of these events lends the impression, when examining only overall statistics, that the Williamson Act maintains a static presence in Tulare County. On the contrary, there is a great deal of change on the ground, and the portrayal of this through these maps lends support to a preferred spatial or geographic approach as opposed to a perusal of aggregate numbers alone. Third, parcels exiting the Act tend to be near developed areas as well as major roads.
Though some of these parcels were removed by eminent domain or public acquisition, such lands tend to be either large parcels in remote locations for the creation of a park, or small lots near the city for urban parks, roads, or other uses considered to be in thf "public good." Regardless, these· parcels usually are not destined for development. In fact, this research discovered that, most often, these removals are actually transfers from one form of protection to another. The separate modeling of these various aspects of termination, though not pursued here, is a ripe area for further research.
These modeling results offer a vision for Tulare County's future Williamson Act GOV-scape. Because SLEUTH uses Monte Carlo (MC) simulation, however, it should be kept in mind that each individual simulation results in a somewhat different outcome. Therefore, the specific locations of the forecast terminated Williamson Act lands for one Monte Carlo simulation should be compared with the im-Onsted: Agricultural Retention in California 1 7
Former Williamson Act and Urban
Non-Prime, Non-WA
.. Prime Non-WA
Williamson Act Non-Prime
Williamson Act Prime
II Other Land
Figure 9.-2030 Forecast Tulare County Williamson Act and Former WA lands (one MC iteration).
18 The California Geographer • Volume 50, 2010

age that was created from 100 cumulative MC simulations for the year 2030 (see Figure 10) . Nevertheless, even one simulation can offer insight.
Though there is considerable land that is added to the WA program (Figures 9 and 1 2), significant hectares are also removed, evidenced by the spread of white pixels. This spread, just as in urban growth, is primarily near other urban and former WA areas as well as along major roads. Figures 1 1 and 12 graphically quantify these land classifications in the form of pie charts.
When examining Figures 8 and 9, a flux of non-prime land can be observed leaving and entering the WA in this forecast, offering more insight than the pie charts alone. The charts reveal that FWA and Urban land11 more than triple between 2002 and 2030. By subtracting out projected urban growth by 2030, generated in a different modeling exercise (Onsted 2007), the amount of FWA land alone can be deduced as increasing from approximately 1.8 percent of Tulare County's land to roughly 10 percent of all of Tulare County's land, over a five-fold increase. Also, over the twenty-eight years displayed in the two pie charts the amount of farmland that is neither in the WA nor was ever in the WA is constantly diminishing. Over half of the unprotected non-prime farmland in 2002 joined the WA by 2030, while over half of the unprotected prime farmland joined as well. However, the charts also reveal that a great deal of prime farmland will vacate the WA by 2030. Although 1 . 1 percent of all of Tulare County's land in 2030, around 14,000 hectares, would be recently enrolled prime WA farmland, this amount would be dwarfed by the hectares that had left the WA, with the total amount of protected prime farmland dropping by nearly a third, to 81,000 hectares. However, that is only the net loss, because the 14,000 hectares were also added during this time. The gross loss, then, is 95,000 hectares. Only one-fourth of the total 129,000 hectares leaving the WA are non-prime, with a very small fraction being Other Land.
When running the model hundreds of years into the future (which, as discussed above, carries much-greater uncertainty), sometime around the year 2060 the land categories largely stabilized and, even many decades later, showed little change. Figures 13 and 14 offer depictions of the year 2060, while Figure 15, for context, offers long-term forecasts. In Figures 13 and 14, when examining enrolled non-prime farmland versus enrolled prime farmland, a large discrepancy becomes apparent. Though the total amount of enrolled
Onsted: Agricultural Retention in California 1 9
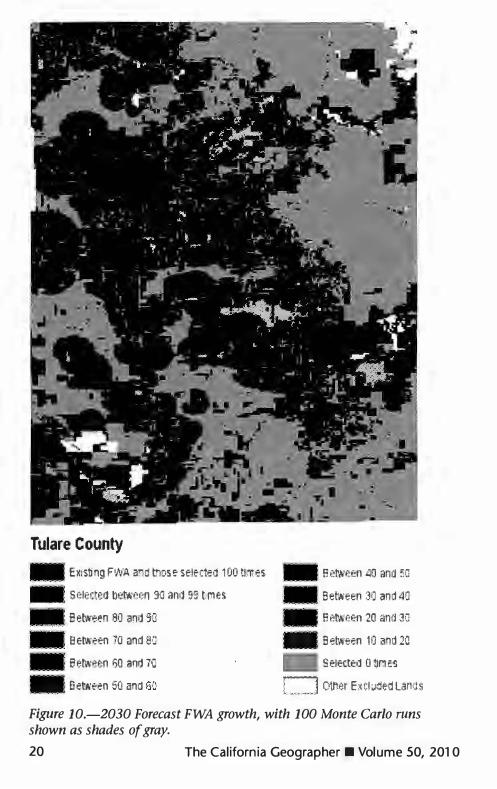
Tulare County .. Exis1i ng FWA anrJ those sel!!'ctea 100 times
Select.;a b(.<tween 90 an11 �:; t;m,;s e etween 80 and '3G
.. e etvr.·een 70 and �Ei ' sw;r.veen 60 aM 7Q
- Between 50 and 60
e eri.'et!n 40 and 50 .. Bet-Neeri 3!J and4G
er:�.\·een 20 and JiJ .. Between 10 and2C
Seiecte•:l 0 �mes
L J C1Ner E:<eltlt'led l<iMs
Figure 10.-2030 Forecast FWA growth, with 100 Monte Carlo runs shown as shades of gray.
20 The California Geographer • Volume 50, 201 0

Tulare WA Status: 2003 FWAand
Urban
4.0%
Non-WA
Non-Prime
a::---...:.4:.::·5:..:'*..:::.0-Non-WA
Pf'!me
Prime 2.0%
17.9%
Figure 11.-Tulare County WA Land Classification, 2003.
r-·---------··---·--···-·· --------·-··-·-----�-1
1 Tulare WA Status: 2030 ! ! I ! .
I
FWAand
Urban
14.4% Non-WA
I Non-Prime
2.0% " �<-<----Non -WA
I I
I Oth:erLand
52.2%
l-----�··--· "-·-
WANon
Prime
17.8%
Prime
0.9%
Figure 12.-Tulare County WA Land Classification, 2030.
Onsted: Agricultural Retention in California 21

Prime Non-WA
Williamson Act Non-Prime
Williamson Act Prime
'Ill Other Land
Figure 13.-Forecast Tulare County 2060 Williamson Act and Former WA lands (one MC iteration).
22 The Ca lifornia Geographer • Volume 50, 2010

Tulare W A Status 2
/
./. I '.other t;and \ sa.a%. ·.
\ \ .
\ "
·
FWAand
Non-WA NonPrime l.lo/o
Non-WA Prime 0.6%
WA Non-P1ime 17.5%
Figure 14.-Tulare County WA Land Classification, 2060.
Forecast WA Enrollment for Tulare County
500,000
480,000
460,000
440,000 (/)
420,000 Q) ....
IU 400,000 -
u Q) 380,000 z
360,000 ··""-340,000
320,000 ...... .
300,000
2002 2030 2045 2060 2100 2200
Years
Figure 15.-Long-Range Forecast for WA Enrollment.
Onsted: Agricultural Retention in California 23

non-prime farmland decreases by 2.3 percent from 2002 to 2060, the total enrolled prime farmland decreases by 60 percent. Therefore, the majority of prime farmland in Tulare County is forecast to be unprotected, at least by the Williamson Act, in fifty years .
In light of the research questions invoked in the Introduction, several general conclusions can be deduced. First, increases in past enrollment have been due to hectares from newly enrolled farms, often in remote areas, eclipsing those near cities that are leaving (see Figures 6 and 7) . However, this phenomenon cannot last indefinitely, because eventually all agricultural lands will either be in the WA or will have formerly been in the WA. Therefore, no matter the scale, eventually WA enrollment will peak. Statewide, this occurred in 2004 (see Table 1) . In certain California counties, like Tulare, the zenith took place as early as 199 1 . Second, these enrollment numbers will continue to decline, as nearly all eligible lands (defined as lands whose owners can join and want to join) will have enrolled and the number of contract terminations continues to increase. Third, the most productive and prime soils will not only bear a disproportionate amount of the hectares leaving the WA, but will also bear the brunt of the development that will inevitably follow (Kuminoff et al. 2001, Sokolow and Spezia 1992) .
Discussion and Conclusion The ostensible raison d'etre of differential assessment programs is to prevent or at least slow down and guide farmland conversion (see Figure 4), or perhaps even to control overall growth (Goodenough 1992) . Nevertheless, a land parcel's proximity to urban areas and to roads, as well as its topographic slope, apply development pressure on the property (Kuminoff and Sumner 2001, Clarke and Gaydos 1998, Clarke et al. 1996) . Though the WA may serve to mitigate this pressure as long as parcels are enrolled, termination of contracts along the urban-rural fringe is common. This research, evaluating these geographic realities, along with Williamson Act status over time, demonstrates that indeed those parcels leaving the Act tend to do so according to a manner conditioned by these landscape factors.
A formal study conducted in 1989 claims that the Williamson Act is most effective at protecting non-prime remote agricultural lands, rather than prime parcels closer to urban areas (Williamson Act Study Group, 1989) . Also, "in remote areas) farmers can see a future for farming and often feel they can live with a combination of incentives and land-use controls designed to encourage farming
24 The Cal ifornia Geographer • Volume 50, 201 0

Ta ble 1 1 2: Wi l l iamson Act Total Acreage 1 990-2007
Tota l Reported Acreage*
Fisca l Year Calendar Yea r Total Repo rted Acreage*
1 990-91
1 99 1 -92
1 992-93
1 993-94
1 994-95
1995-9()
1 996-97
1 998-99
199�-00 2000-01
, 2001 -'02 2002-03
2003....()4 2004-05
! :2005-06
1 990
1 991
1 992
1 993 1 994
19!}5.
1 998
1 999 2000
2001 2002
2003
2006
2Q.CJ7
1 5,969, 1 59
1 s ,9461;7a3 - � . . . . . ... . . 1 5,942,758
1 S,952, 365
1 5,952, 1 44
1 5,908,538
1 5,81 2,5 1 1
1 5,889,8.04
1 5,925,301
15.9 77,11 6
1 5,9 36,43 7
) 6$344,433
1 6,504, 721
1 6,640, 1 93
1 6,580,987
1 6,565,519
and limit nonfarm development" (Daniels and Bowers 1997: 133) . Ironically, due to their distance from market centers and their associated lack of real estate development potential, these remote lands arguably require less-strenuous measures of protection. Also, these areas mostly consist of less-valuable grazing lands, while the prime and irrigated farmland tends to be closer to the urban areas. Thus, the lands just outside of California's cities are "prime" both for farmland and real estate, a competition in which agricultural use is rarely the victor. As Daniels and Bowers point out, along the urban fringe, "the incentives and land-use controls have not succeeded in protecting farmland for more than a few years. Once the price of farmland rises above what a farmer will pay for it, development is usually only a matter of time" (1997 : 133).
As a new variable, the most-recent budget crisis has caused the Open Space Subvention Act to be all but eliminated. Currently then, the
Onsted : Ag ricultural Retention in California 25

financial onus for continuing the program falls on the local governments, many of which may not be able to afford to refuse those property taxes without at least partial compensation. Though this research suggests an eventual decrease in enrollment for the WA, other research (Lynch and Carpenter 2003) suggests that outright termination of the Williamson Act would result in far greater farmland conversion. However, given the dearth of easements in California, the Williamson Act alone may not be enough to stave off persistent agricultural conversion to urban uses. Some have argued that the Williamson Act is strongest when used in conjunction with other state protective measures, such as the California Coastal Act (Osherenko et al. 2008), and/or with supplemental local initiatives (Parks and Quimio 1996, Daniels 1997).
Though the general finding of this research-that WA lands near urban areas are more likely to terminate their contracts-is not new, the specific outcomes of the predictive modeling are. The particular understanding of the geographical realities of the Williamson Act offered in this article could allow decision makers to examine its contents and perhaps make decisions armed with greater information. With regard to geographic modeling, Veldkamp (2009) calls for "future specific attention . . . (to) be paid to land governance" (p. 1 1), and this approach may be one answer. Using modeling tools to forecast not only land-use/ land-cover change but also alterations in a GOV-scape, such as the WA, can be useful for understanding feedbacks between different scapes. This has applications for academics as well as planners at local, regional, and state levels. Finally, because nearly every state in the United States has some version of a differential assessment program, and farmland conversion is a problem throughout the nation, the emerging peri-urban exodus from California's Williamson Act could herald a trend nationwide.
Endnotes 1 Adams 1946; Hart et al. 1946; Hutchison 1946; Tufts et al. 1946; Beckman 194 7; Durrenberger 1969; Dresslar 1979; Jelinek 1982; Logan and Molotch 1987; Williamson Act Study Group 1989; Carter and Nuckton 1990; Johnston 1990; Sokolow 1990; Reisner 1993; Rhode 1995; Bradley 1997; Olmstead and Rhode 1997; Bradshaw and Muller 1998; Medvitz 1999; Blank 2000; Kuminoff and Sumner 2000; Kuminoff , Sokolow, and Sumner 2001; Johnston 2004; Martin and Mason 2004; Siebert 2004
26 The Califo rnia Geogra pher • Volume 50, 201 0

z Although Farmland Security Zones (or the "Super Williamson Act") , implemented in 1998, offer greater tax incentives for longer
terms of protection, this research does not specifically address their future since enrollment is quite low (3, 600 hectares) compared to the normal Williamson Act and the program is comparatively recent (only four possible study years up to ZOOZ) .
3 Tobler 19 79; Couclelis 1 98S; Clarke, Olsen, and Brass 1993; White and Engelen 1993a; White and Engelen 1993b; Batty and Xie 1994;
Itami 1994; Clarke, Riggan, and Brass 199S; Engelen, White, and Uljee 199S; Kramer 1996; Batty, Couclelis, and Eichen 1997; Clarke, Hoppen, and Gaydos 1997; Couclelis 1997; Semboloni 1997; White and Engelen 1997; White, Engelen, and Uljee 1 997; Clarke and Gaydos 1 998; Wu and Webster 1998; Candau, Rasmussen, and Clarke ZOOO; Li and Yeh ZOOO; Torrens and O'Sullivan Z00 1; Silva and Clarke ZOOZ; Goldstein Z004; James Z004; Liu and Phinn Z004; Sietchiping Z004; Silva Z004; Benenson and Torrens ZOOS; Silva and Clarke ZOOS; Vancher et al ZOOS; Gazulis and Clarke Z006; Li and Liu Z006; Silva Z006 ; Clarke et al Z007; Wu et al Z009; Wu and Silva Z010; as well as many others.
4 These net losses are greater than total net losses of ag land because much of the high-quality farmland converted to less-productive farm uses or low-density rural developments.
S To be precise, the budget for subventions dropped from $Z8 million to $ 1 ,000, a reduction of 99 .996 percent, effectively erasing the program.
6 There is no universally agreed-upon figure. The FMMP and the NASS give different figures for California. Also, there are other categories to which agricultural lands can be converted besides urban, and these are not reflected here.
7 FMMP's 199Z figure. The FMMP does not inventory as exhaus· tively as NASS (which includes such private lands as those used fo commercial forestry); therefore, totals do not always agree. In thi case, NASS's 199Z total of all California Agricultural lands equal 1Z.Z million hectares.
8 FMMP's subcategory figure.
9 It should be noted that there are different methods of terminatin WA contracts. Most contract terminations initiated by landowne:
Onsted: Ag ricultural Retention in California 2

are done so through "non-renewal, " a method whereby a landowner is slowly ramped back up to a normal tax bracket over a nine-year phase-out period. The landowner must wait until the end of this period to convert any farmland on the property. Other contracts are terminated at the behest of local governments by eminent domain, though local governments can also initiate non-renewals. For simplicity, the methods used in this research do not distinguish among the different reasons or processes of WA termination, though future research will disaggregate them.
10 The assessor's data reflects the year it was made and, therefore, in these maps from the past, the parcel outlines are not entirely accurate. In general, the further back in time from the date of the assessor's data, the fewer number of parcels actually existed. It was deemed prohibitively difficult to find old assessor's maps that have been digitized, if any even exist. Also, in those cases where subdivision has taken place on a former WA parcel, all of the constituent parcels are treated as former WA parcels.
1 1 FWA and urban land were conflated during the modeling process for reasons of methodological expediency. See Onsted 2009 for further explanation.
12 Totals include both continuing term and nonrenewal Williamson Act contracted land, as well as a small amount of other enforceably restricted non-Williamson Act acreage. Note: Excerpted from the California Department of Conservation's Web site: http: //www. conservation.ca.gov/dlrp/lca/stats_reports/Documents/Statewide percent20WA percent20Enrollment percent20(1991-07) .xls
References Adams, F. 1946. The Historical Background of California Agri
culture. California Agriculture. C. B. Hutchison, ed., pp. 1-50. Berkeley CA: University of California Press.
American Farmland Trust. 2006. Fact sheet: differential assessment and circuit breaker tax programs [online] . Available from: http:/ I www.farmlandinfo.org/documents/29479/DA_8-06.pdf (last accessed 10 April 2010) .
American Farmland Trust. 2007a. Fact sheet: status of local PACE programs [online] . Available from: http:/ /www.farmlandinfo. org/documents/34260/PACE_Local_O? -07 .pdf (last accessed 10 April 2010).
28 The Cal ifornia Geographer • Volume 50, 201 0
-. 2007b. Fact sheet: status of state PACE programs [online] . Available from: http:/ /www.farmlandinfo.org/documents/34 1 42/PACE_State_06-0 7.pdf (last accessed 10 April 2010).
-. 2007c. Comments and recommendations on the proposed Tulare County general plan update [online] . Available from: http:/ /www.farmland.org/programs/states/Ca/documents/ Tulare County_ GeneralPlan_AFTCommentsandRecommendations_021407.pdf (last accessed 30 April 2010).
American Farmland Trust. 2009a. American Farmland Trust: California-Tulare County [online] . Available from: http://www. farmland.org/programs/ states/ ca/Tulare.asp (last accessed 30 April 2010) .
---. 2009b. Farming on the Edge Report. What's Happening to Our Farmland? [online] http:/ /www.farmland.org/resources/fote/default.asp (last accessed 2 May 2010).
Batty, M., H. Couclelis, and M. Eichen. 1997. Urban systems as cellular automata. Environment and Planning 24: 1 59-1 64.
Batty, M., and Y. Xie. 1994. From cells to cities . Environment and Planning B: Planning and Design 2 1 :3 1-48.
Beckman, H. ]. 1 947. A Century of Agricultural Progress. California Cultivator 25 October:42-43.
Benenson, 1 . , and P. Torrens, 2005 . Geosimulation. Chichester: John Wiley and Sons.
Blank, S. C. 2000. Is This California Agriculture's Last Century? California Agriculture July/August:23-25 .
Blewett, R. A. , and ]. I. Lane. 1988. Development Rights and the Differential Assessment of Agricultural land: Fractional valuation of farmland is ineffective for preserving open space and subsidizes speculation. American Journal of Economics and Sociology 47(2) :1 95-205 .
Bradley, K. J . 199 7. Cultivating the Terrain: Public Image and Politics of California Farming From the Depression to the Post War Years. Ann Arbor MI: UMI Dissertation Services.
Bradshaw, T. K., and B. Muller. 1998. Impacts of rapid urban growth on farmland conversion: Application of new regional land use policy models and geographical information systems. Rural Sociology 63(1): 1-25 .
Brand, Peter S. 1 995 . Putting Agricultural Values into Dollars and Cents. California Coast and Ocean 1 1 :3.
Burchell, R. W. 1996. Economic and fiscal impacts of alternative land-use patterns. In Michigan State University Extension (ed.),
Onsted: Agricultural Retention in California 29

Land use decision making: its role in a sustainable future for Michigan. Ann Arbor, MI: MSU Extension, 1-34.
California Department of Conservation 2010a. California Farmland Conservancy Program [online] . Available from: http://www. conservation.ca.gov I dlrp/cfcp/Pages/index.aspx (last accessed 10 April 2010).
---. 20 10b. Farmland Mapping and Monitoring Program [online] . Available from: http://www. conservation.ca.gov/dlrp/fmmp/Pages/ Index.aspx (last accessed 10 April 2010) .
--. 20 10 c. Williamson Act Program [online] . Available from: http://www.conservation.ca.gov/dlrp/lca/stats_reports/Pages/index. aspx (last accessed 10 April 2010) .
California Legal Citation. 1965. Government Code Section 51220. ---. 1971 . CA Government Code Section 16140-16154. Candau, ]. , S . Rasmussen, and K. C. Clarke. 2000. Structure and
dynamics of a coupled cellular automaton for land use/land cover change. Paper presented at 4th International Conference on Integrating GIS and Environmental Modeling (GIS/EM4), 2-8 September in Banff, Canada.
Carter, H. 0., and C. F. Nuckton. 1990. eds. California's Central Valley-Confluence of Change. Davis CA: University of California Agricultural Issues Center.
Clarke, K. C. 1997. Land transition modeling with Deltatrons [online] . Available from: http://www.geog.ucsb.edu/-kclarke/ Papers/deltatron.html (last accessed 30 April 2010)
Clarke, K. C., N. Gazulis, C. K. Dietzel, and N. C. Goldstein. 2007. A decade of SLEUTHing: lessons learned from applications of a cellular automaton land use change model. In Classics from IJGIS. Twenty Years of the International Journal of Geographical Information Systems and Science. ed. P. Fisher, pp. 413-425. Boca Raton, FL: Taylor and Francis.
Clarke, K. C., and L. Gaydos. 1998. Loose coupling a cellular automaton model and GIS: long-term growth prediction for San Francisco and Washington/Baltimore. International Journal of Geographical Information Science 12(7):699-7 14.
Clarke, K. C., S. Hoppen, and L. Gaydos. 1996. Methods and techniques for rigorous calibration of a cellular automaton model of urban growth. Paper presented at Third International Conference/ Workshop on Integrating GIS and Environmental Modeling, 21-26 January, Santa Fe. [online] Available from: http://www. ncgia.ucsb.edu/conf/SANTA_FE_CD-ROM/sf_papers/clarke_ keith/clarkeetal.html (last accessed 25 March 2010)
30 The Cal ifornia Geog ra pher • Volume 50, 201 0

Clarke, K. C., S. Happen, and L. Gaydos. 1997. A self-modifying cellular automaton model of historical urbanization in the San Francisco Bay area. Environment and Planning B: Planning and Design 24:247-261 .
Clarke, K. C., G. Olsen, and ]. A . Brass. 1993. Refining a cellular automaton model of wildfire propagation and extinction. Proceedings of the Second International Conference on the Integration of Geographic Information Systems and Environmental Modeling. Breckenridge, CO.
Clarke, K. C., P. Riggan, and ]. A. Brass. 1995. A cellular automaton model of wildfire propagation and extinction. Photogrammetric Engineering and Remote Sensing 60: 1 355-1367.
Cordes, M. 1 999. Takings, Fairness and Farmland Preservation. 60 Ohio State Law Journal 1 033: 1047-1048.
---. 2002. Agricultural Zoning: Impacts and Future Directions. Protecting Farmland at the Fringe: Do Regulations Work? Columbus, OH: OSU Swank Program in Rural-Urban Policy.
Couclelis, H. 1985. Cellular worlds: A framework for modeling micro-macro dynamics. Environment and Planning A 1 7 :585-596.
---. 1997. From cellular automata to urban models: New principles for model development and implementation. Environment and Planning B: Planning and Design 24: 1 65-1 74.
Daniels, T. L. 1997. Where does cluster zoning fit in farmland protection? Journal of the American Planning Association 63(1): 129 -1 37 .
Daniels, T., and D. Bowers. 1997 . Holding our Ground: Protecting Americas Farms and Farmland. Washington, D.C. : Island Press.
Dean, ]. B. 1975 . A panacea that wasn't. Cry California Summer: 1 8-23.
Dresslar, J. 1979. Agricultural land preservation in California: time for a new view. Ecology Law Quarterly 8(2) :303 .
Duke, J . , and L. Lynch. 2006. Farmland Retention Techniques: Property Rights Implications and Comparative Evaluation. Land Economics 82 (2) : 1 89-213.
Durrenberger, R . 1969 . California: The Last Frontier. New York NY: Van Nosti and Reinhold Company
Engelen, G., R. White, and I. Uljee. 1995. Using cellular-automata for integrated modeling of socioenvironmental systems. Environmental Monitoring and Assessment 34:203-2 1 4.
Fischel, W. A. 1982. Urbanization of Agricultural Lands: A Review of the National Agricultural Lands Study. Land Economics 58:236-59.
Onsted: Ag ricultura l Rete ntion in California 31

Freilich, R. 1999. From Sprawl to Smart Growth: Successful Legal, Planning, and Environmental Systems. Chicago, IL: Section of State and Local Government Law, American Bar Association.
Gazulis, N., and K. C. Clarke. 2006. Exploring the DNA of our regions: Classification of outputs from the SLEUTH model. In Cellular Automata. 7th International Conference on Cellular Automata for Research and Industry, ACRI 2006. 20-23 September. Perpignan, France. From Lecture Notes in Computer Science No. 4173. eds. S. El Yacoubi, B. Chapard, and S. Bandini, New York: Springer.
Goldstein, N. C. 2005. Brains vs. brawn: Comparative strategies for the calibration of a cellular automata-based urban growth model. In GeoDynamic, eds. P. Atkinson, G. Foody, S. Darby, and F. Wu, 249-272. Boca Raton, FL: CRC Press.
Goldstein, N. C., ]. T. Candau, and K. C. Clarke. 2004. Approaches to simulating the March of Bricks And Mortar. Computers, Environment and Urban Systems 28: 125-14 7.
Goodenough, R. 1992. Room to grow? Farmland conservation in California. Land Use Policy 9(1):21-35.
Gustafson, G. C., and N. L. Bills. 1984. U.S. Cropland, Urbanization, and Landownership Patterns. AER-520. Washington, D.C.: US Department of Agriculture, Economic Research Service.
Handel, M. E. 1999. Conflict on the urban fringe. In California Farmland and Urban Pressures, eds. A. Medvitz, A. Sokolow, and C. Lemp, 51-70. Davis, CA: UC Davis.
Hart, G. H., and collaborators. 1946. Wealth Pyramiding in the Production of Livestock. California Agriculture, ed. C. B. Hutchison, 5 1-1 12. Berkeley CA: University of California Press.
Hutchison, C. B. 1946. ed. California Agriculture. Berkeley and Los Angeles CA: University of California Press.
Itami, R. M. 1994. Simulating spatial dynamics: cellular automata theory. Landscape and Urban Planning 30:2 7-4 7.
]ames, R. 2004. Predicting the spatial pattern of urban growth in Honolulu County using the cellular automata SLEUTH urban growth model. MA thesis, University of Hawaii at Manoa.
Jelinek, L. J. 1982. Harvest Empire: A History of California Agriculture, 2nd edition. San Francisco: Boyd and Fraser.
Johnston, W. E. 1990. Land: Competition for a Finite ResourceFlexibility or Irreversibility? California's Central Valley-Confluence of Change. eds. H. 0. Carter and C. F. Nuckton, 43-56. Davis CA: University of California, Agricultural Issues Center.
Johnston, W. E. 2004. Cross Sections of a Diverse Agriculture: Profiles of California's Production Regions and Principal Com-
32 The California Geographer • Volume 50, 2010

modities. California Agriculture: Dimensions and Issues. Ed. ]. B . Siebert, 29-55 . Berkeley CA: Giannini Foundation of Agricultural Economics.
Johnston W. E., and A. F. McCalla. 2004 . Whither California agriculture: Up, down, or out?, Berkeley CA: Giannini Foundation of Agricultural Economics.
Kirsch, S. L. 1993. California's redistributive role in interstate migration, 1935-1990. The California Geographer 63:59-78.
Kramer, J. 1996. Integration of a GIS with a local scale self-modifying cellular automaton urban growth model in Southeastern Orange County, New York. MA thesis, Hunter College, CUNY.
Kuminoff, N. V., and D. A. Sumner. 200 1. Modeling Farmland Conversion with new GIS Data. Paper prepared for the Annual meeting of the American Agricultural Economics Association, 5-8 August, Chicago, IL.
Kuminoff, N. V., A. D. Sokolow, and D . A. Sumner. 2001 . Farmland conversion: perception and realities. Issues Brief (16) UC Davis, Agricultural Issues Center.
Libby, L. W. 1994. Conflict on the Commons: Natural Resource Entitlements, the Public Interest, and Agricultural Economics. American Journal of Agricultural Economics 76(5) :997-1009.
Li, X., and Liu, X. 2006. An extended cellular automaton using case-based reasoning for simulating urban development in a large complex region. International Journal of Geographical Information Science 20: 1 109-1 136.
Li, X., and A. Yeh. 2000. Modeling sustainable urban development by the integration of constrained cellular automata and GIS. International Journal of Geographical Information Science 14(2) : 131-152.
Liu, Y. , and S. R. Phinn. 2004. Mapping the urban development of Sydney (197 1-1996) with cellular automata in a GIS environment. Applied GIS 49.
Logan, ]. R., and H. L Molotch. 1987. Urban Fortunes. Berkeley, CA: University of California Press.
Lynch, L., and J. E. Carpenter. 2003. Is There Evidence of a Critical Mass in the Mid-Atlantic Agricultural Sector between 1949 and 1997? Agricultural and Resource Economic Review 32(1) : 1 16-128.
Mandelker, D., ] . Payne, P. Salsich Jr. , and N. Stroud. 2005. Planning and Control of Land Development: Cases and Materials. Sixth Edition. NJ, CA, VA: LexisNexis.
Martin, P., and B. Mason. 2004. Hired Workers on California Farms. California Agriculture: Dimensions and Issues, ed. ]. B .
Onsted: Ag ricu ltural Retention i n California 33
Siebert, 1 91-214. Berkeley, CA: Giannini Foundation of Agricultural Economics.
Medvitz, A. G. 1 999. Population Growth and Its Impacts on Agricultural Land in California: 1 850 to 1998. In California Farmland and Urban Pressures, eds. A. Medvitz, A. Sokolow, and C. Lemp, Davis, CA: Agricultural Issues Center, UC Davis.
National Agricultural Statistics Service (NASS) . 2010. Agricultural Statistics Database. [online] . Available from: http://www.nass. usda.gov/Data_and_Statistics/Quick_Stats/ (last accessed 20 April 201 0) .
Olmstead, A . L., and P. W. Rhode. 199 7 . An Overview of the History of California Agriculture. California Agriculture: Issues and Challenges, ed. ]. B. Siebert, 1-27. Berkeley, CA: Giannini Foundation of Agricultural Economics.
Onsted, ] . A. 2007. The Effectiveness of the Williamson Act: A Spatial Analysis. Ph.D. dissertation, University of California, Santa Barbara.
Osherenko, G., J. Onsted, K. C. Clarke, N. Boucquey, and K. Hart. 2008. Retaining California 's coastal agricultural land through economic incentives, regulation, and purchase. Final Report to NOAA. Los Angeles, CA: USC Seagrant.
Parks, P. ] . , and W. R. H. Quimio. 1996. Preserving agricultural land with farmland assessment: New Jersey as a case study. Agricultural and Resource Economics Review 25(1):22-27 .
Plaut, T. R . 1980. Urbanization Expansion and the Loss of Farmland in the United States: Implications for the Future. American Journal of Agricultural Economics 62:53 7-42.
Reisner, M. 1993 . Cadillac Desert: The American West and its Disappearing Water. Revised and updated. New York NY: Penguin Books.
Rhode, P. W. 1995. Learning, Capital Accumulation, and the Transformation of California Agriculture. Journal of Economic History 55 :773-800.
Salkin, P. 2008. American Law of Zoning. St. Paul, Minn.: Thomson/West.
Semboloni, F. 199 7 . An urban and regional model based on cellular automata. Environment and Planning B: Planning and Design 24:589-612.
Siebert, ] . B . , ed. 2004. California Agriculture: Dimensions and Issues. Berkeley CA: Giannini Foundation of Agricultural Economics.
Sietchiping, R. 2004. Geographic information systems and cellular automata-based model of informal settlement growth. Ph.D. dissertation, University of Melbourne.
34 The Ca l ifornia Geographer • Volume 50, 201 0
Silva, E. A. 2004 . The DNA of our Regions: Artificial intelligence in regional planning. Futures 36(10) : 1077-1094.
--. 2006. Expert knowledge in land use planning: The role of information in workshops, scenario building, simulation modelling and decision making. SSRN Electronic Paper Collection, 18 November. [online] . Available from http:/ /ssrn.com/ abstract=945 794. (last accessed 28 June 2010) .
Silva, E. A., and K. C. Clarke. 2002. Calibration of the SLEUTH urban growth model for Lisbon and Porto, Portugal. Computers, Environment and Urban Systems 26:525-552.
--. 2005. Complexity, emergence and cellular urban models: Lessons learned from applying SLEUTH to two Portuguese cities. European Planning Studies 13(1) :93-1 15.
Sokolow, A. D. 1990. The Williamson Act: 25 years of land conservation. Sacramento, CA: The Resources Agency of California.
--. 1997. Farmland policy in California's Central Valley: state, county, and city roles. CPS Brief 9(4) : 1-1 7 .
Sokolow, A . D . , and J . Spezia. 1992. Farmland protection policy California Policy Choices 8:15 1-168.
Teitz, M., C. Dietzel, and B. Fulton. 2005. Urban development futures in the San Joaquin Valley. San Francisco, CA: Public Policy Institute of California.
Tobler, W. 1979. Cellular geography. In Philosophy in Geography, eds. S. Gale and G. Olsson, 379-386. Dordrecht, The Netherlands: Reidel.
Torrens, P. M., and D. O'Sullivan. 2001 . Cellular automata and urban simulation: Where do we go from here? Environment and Planning B: Planning and Design 28: 163-168.
Tufts, W. P. , and collaborators. 1946. The Rich Pattern of California Crops. California Agriculture, ed. C. B. Hutchison, 1 13-238. Berkeley CA: University of California Press.
Vancher, A., D. Andrey, P. Giordano, and S. Albeverio. 2005 . Continuous valued cellular automata and decision processes of agents. Proceedings of CUPUM 2005, London, England.
Veldkamp, A. 2009 . Investigating land dynamics: future research perspectives. Journal of Land Use Science 4(1-2) :5-14.
White, R. W., and G. Engelen. 1993a. Cellular automata and fractal urban form: A cellular modeling approach to the evolution of urban land use patterns. Environment and Planning A 25 : 1 1 75-1 193.
---. 1993b. Cellular dynamics and GIS: Modelling spatial complexity. Geographical Systems 1 :237-253.
Onsted: Ag ricultural Retention in Cal ifornia 35

---. 1997. Cellular automata as the basis of integrated dynamic regional modelling. Environment and Planning B 24:235-246.
White, R., G. Engelen, and I. Uljee. 1997. The use of constrained cellular automata for high-resolution modelling of urban land use dynamics. Environment and Planning 24:323-343.
Williamson Act Study Group. 1989 . Preserving Agricultural Land in California: A Short History of the Williamson Act, Davis, CA: , Agricultural Issues Center, UC Davis.
Wu, X., Y. Hu, H. He, R. Bu, ]. Onsted, and F. Xi. 2009. Using multiple methods to evaluate the performance of SLEUTH in the Shenyang metropolitan area. Environmental Modeling and Assessment. 14(2) :221-230.
Wu, N., and E. A. Silva. 2010. Artificial intelligence solutions for Urban Land Dynamics: A Review. Journal of Planning Literature 24:246-265.
Wu, F., and C. ]. Webster. 1998. Simulation of land development through the integration of cellular automata and multicriteria evaluation. Environment and Planning B: Planning and Design 25: 103-126.
36 The Cal ifornia Geographer • Volume 50, 201 0

Locating Protest in Public Space: One Year in San Francisco
and Los Angeles
Paul Stangl Western Washington University
Abstract This paper focuses on protest as a form of political life in public space, examining the location and content of protests in San Francisco and Los Angeles in 2006. The cities are similar in terms of regulation of protest and production of privatized public spaces, but strikingly different in terms of metropolitan land use and transportation patterns, and urban morphology. Evidence suggests that these factors are significant to the accommodation of dissent in public space, though they receive limited attention in research. These findings suggest that an expanded, more comprehensive definition of "access" to public space is needed.
Introduction IN RECENT DECADES, urbanists have noted a decline of public life and of the public realm (Sennet 1976, Sorkin 1992, Zukin 1995, Mitchell 1995). On the one hand, public authorities have increased control of public assembly through the regulations of time, place, and manner, known as the public forum doctrine (Mitchell & Staeheli 2005, 799; McCarthy and McPhail 2006, 229), and have invented a plethora of additional regulatory tools of exclusion, limiting use of public spaces (Beckett and Herbert 20 10). On the other hand, there is a loss in the size of the public forum due to the "privatization of public space," resulting primarily from ( 1 ) privatization and gating of suburban developments (McCarthy and McPhail 2006, 232); (2) the establishment of "privately owned public spaces" in key downtown spaces, including new construction and pre-existing plazas and parks where private entities regulate public behavior (Kayden 2000,Loukaitou-Sideris and Banjeree 1 998, Mitchell 2003); (3) the emergence of new centers of urban activity that are either semiprivate or "limited public fora, " notably shopping malls, sports arenas, concert halls, and airports (McCarthy and McPhail 2006, 229-234); (4) the use of urban design to discourage access to public spaces (Davis 1990, Petersen 2006), (5) the disjuncture between the location of new public spaces and areas of heavy pedestrian traffic
The California Geographer 50, © 2010 by The California Geographical Society

(Loukaitou-Sideris and Banjeree 1998, 155-7); and.finally, (6) technological advances in communications, especially the Internet, which some argue has, to a degree, usurped the significance of physical public space as the main arena for public life (Loukairou-Sideris and Banjeree 1998, 180-1) .
Despite this "socio-spatial erosion," others point to the continued significance of public space. Peter Goheen observes :
The will to command public urban space expresses the desire of many urban groups and institutions to be acknowledged, to convey messages forcefully, to promote the legitimacy of one's cause. The range of such expression is great, and the contest for visibility and influence is lively . . . . It is all-important public space which lends its iconic value to those who occupy it, even briefly. (Goheen 1998, 484)
In particular, protest in public space remains a powerful medium for those without direct influence on the levers of power:
It is a signal about who you are, what you want, and what else you might do. A former White House adviser can write an op-ed against a planned war and create a stir; less prominent citizens need to do something more dramatic to win attention for their views, demonstration at the Capitol or trespassing at a military base. What you do reflects who you are and what you want .
. . . When people protest, they tell authorities that they're unhappy about something, and implicitly threaten to do more than protest: vote, contribute money, lobby, set up a picket, blockade a clinic, or try to blow up a building. (Meyer 2009)
Three points are crucial: (1) protest in public space expresses serious intentions to direct passersby and to a broader audience through the media; (2) location or place of protest is often a crucial part of the message; and (3) protest is an especially important means of political expression for the less powerful and poor.
This paper empirically investigates the location of protests in Los Angeles and California, noting striking differences, and suggests that these differences could be explained through a more fully developed understanding of "access" to public space that considers (1) the existence of a network of public space where free speech is relatively unimpeded, (2best) the impact of urban morphology and urban design at the micro-scale on the function of public space,
38 The California Geographer • Vo lume 50, 201 0

and (3) the impact of metropolitan land use and transportation patterns on residents' ability to travel to public spaces. Literature on public space commonly discusses the need for "access," most often regarding lack of access due to regulatory restrictions prohibiting protest, either by the police in the case of public land, or the owners in the case of privatized public space (see above, in particular Beckett and Herbert 2010). Some literature has pointed to a reduction of "access" due to micro-scale urban design factors, regarding physical entrances, visual connections, and symbolic expression that invites or deters entry (Nemeth and Schmidt 2007, Petersen 2006) . Loukaitou-Sideris and Banjeree (1998) go further to include both micro-scale urban design and larger morphological issues, concluding that privatized public space should be required to be physically and visually well-integrated into a vital public pedestrian network, and this works best in a downtown with small blocks, and with mixed-use buildings with plenty of doors and windows on the street. In their view, privatized public space is not the problem per se; rather, the problem is its tendency to divert pedestrian activity and life from the public realm instead of contributing vitality to it. Blumenberg and Ehrenfeucht (2008) focus on the importance of the sidewalk itself to public life and protest.
Solely Capron (2002) directly examines "accessibility" to public spaces, including consideration for metropolitan land use and transportation patterns, and consequent equity issues: in Buenos Aires, car owners can travel from suburb to center in a fraction of the time it takes the poor using transit, and with much easier conditions. Other authors directly or implicitly recognize the importance of access to the metropolitan center, whether in terms of physical mobility and symbolic welcomeness (Grimson 2008), or provisional regulatory restrictions (Herbert 2007, Uitermark 2004). In sum, all agree on the importance of access to a lively, culturally meaningful public realm, though they focus on different aspects of the problem.
Zick (2006) indicates that the public forum doctrine presumes that government is a neutral actor regarding the distribution of public space, but argues that government has an "affirmative obligation to facilitate speech by making space for it." Considering the multiple dimensions of access to public space discussed above in light of Zick's assertion, then government is obliged to provide a network of open spaces sufficient in number, size, location, and design to accommodate protest for the metropolitan area, and, equally importantly, to ensure that they are integrated into a lively pedestrian
Stangl : Locating Protest in Publ ic Space 39

network. Further, the government should take concerns to enhance the ability of residents throughout the metropolitan area.
Also of note, Zick makes this view of place-based meaning as essential to expression in the public realm the basis of a challenge to the public forum doctrine. His alternative, "Theory of Expressive Place, " is based on humanities' research on the importance of placebased meaning and defines an "expressive topography" including six types of place:
Embodied places implicate the competing interest of a speaker to reach an intended listener or viewer by, in some sense, invading her "space" and of an unwilling listener or viewer to privacy and psychological repose. Efforts by "sidewalk counselors" to persuade women not to have abortions are the primary example. Contested places are perhaps the most common spatial type. They involve the claimed right of a speaker to inhabit a particular place and express himself there, in part because the place itself is part of a specific political or social contest. For example, civil rights protesters during the 1960s sought to protest library segregation policies in the library itself, or outside a jail, as opposed to someplace else. Inscribed places consist of two types . . . "inscribed" places of a more sacred, symbolically powerful sort. These places are locales that have been closely identified over time with the exercise of expressive and associative rights. The best-known examples of this spatial type are the National Mall and Central Park in New York City. [Zick also includes places that represent public ideas through iconography in this category] . Tactical places are the product of the government's use of space as a strategy or technique of control. Broadly speaking, institutions like schools and prisons are tactical places. So are the zones, cages, buffers, and other architectures now routinely used by government to discipline and control public expressive and associative activities. Non-places are locales like malls, airports, and subways. Modern citizens spend an abundance of time in these places, but public expression is tightly regulated there, if it is permitted at all. Finally, for purposes of this discussion, cyberplaces are the various locales "in" cyberspace (Zick 2006, 442) .
Zick suggests that a specific place may fit into different categories, depending on how it is being used, and that it may fit more than one category. Further, these types should be used as a launching point by the courts, as the type of place is one determinant as to how the court approaches a particular case. This typology will be used to classify the protests for evidence regarding the provision of an accessible, meaningful public realm in the two cities .
40 The Cal ifornia Geographer • Volume 50, 201 0

San Francisco and Los Angeles 2006 San Francisco and Los Angeles were chosen for the study as they are large West Coast cities with significantly different development patterns. The city and metropolitan areas of Los Angeles have a much larger land area and population, but with considerably lower densities.1 This has great consequences for access to the downtown area, especially for those dependent on mass transit. San Francisco has a relatively effective regional rail network, whereas sprawling Los Angeles is more bus-dependent. As a result, trips from the outer suburbs of Los Angeles often take considerably longer, with significantly less riding comforU In terms of morphology, the downtowns of the two cities differ strikingly. San Francisco has small blocks, a fine grain of mixed uses, and many doors and windows on the street. Los Angeles has large blocks, a coarser grain of land uses, and fewer doors and windows adjoining the street. 3 Additionally, the heart of downtown Los Angeles has large swaths dedicated to surface parking, further eroding the pedestrian realm. In short, downtown San Francisco is a reasonable example of the transit metropolis and traditional city with a vital pedestrian realm, whereas Los Angeles is auto-centric from fringe to core. These patterns result from the development practices and governmental decisions since the founding of these cities, including San Francisco's continued commitment to transit and urban infill during the latter half of the twentieth century. Both cities have added a considerable amount of privately owned public space in recent decades. San Francisco has taken more effort to ensure that such spaces are integrated into the public domain, though it is unclear whether it has succeeded any more than Los Angeles in this regard (Loukaitou-Sideris and Banjeree 1998, 300).
Finally, with regard to regulation of public space, both cities employ a demonstration permitting process, though some differences are evident. In San Francisco, no permit is needed to protest in public space, as long as no sound-amplifying equipment is used. Permits for processions are required if they extend for more than one block and interfere with the normal flow of vehicular traffic. The San Francisco Police Department stresses that it is not very strict about enforcing permit applications (Cheung 2002, 4-9). Los Angeles requires permits for stationary and marching events if they interrupt the normal use of streets or sidewalks, or occupy city-owned parks or certain federal parks and plazas (City of Los Angeles Human Relations Commission 2009) . Los Angeles seems to take a somewhat stricter approach to regulating protest than San Francisco, though the difference is more of degree than kind.
Stangl : Locating Protest in Public Space 4 1

The year 2006 was chosen, as it included massive protests regarding federal immigration legislation and the Iraq War within one cycle of the calendar, which eliminates duplication of annual events. The analysis involved mapping all protest events involving ten or more participants that were reported in the major newspapers for each metropolitan area, the San Francisco Chronicle and the Los Angeles Times.4 The following sections examine the content and location of stationary protest events within the cities and within the civic centers, and the content and location of marching protests within the cities.
Location and Purpose of Protests-Stationary This section examines the distribution of stationary protests throughout San Francisco and Los Angeles. Maps were developed to show the size and location of pickets, rallies, and other stationary protest events that were reported in the major newspapers for each city. Continuous pickets that ran for several days or weeks but were reported in just one article in the newspaper were shown only once in the map, while events that occurred over several consecutive days but achieved newspaper reportage each day were counted as separate protest events.
The maps (Figures 1 and 2) reveal a high degree of clustering of protest activities. Most protests were grouped in a limited number of areas, while vast expanses beyond the urban core were free of protest. Protest events were held on or in front of commercial, industrial, mixed-use and civic land uses, but were largely absent from strictly residential streets. This is noteworthy, as law professor David Kennedy (1995) and sociologists McCarthy and McPhail (2006) observe that gated communities have severely reduced the size of the public forum. However, both cities encompass considerable swaths of residential land that is not gated and has public streets, but did not include protests. Thus, it seems that assertions regarding the loss of public space in suburbia as consequential for protest are greatly exaggerated-though myriad other negative consequences can be found (Low 2008) .
In San Francisco, a monocentric pattern is evident with protests heavily concentrated along the Market Street corridor between Civic Center and Embarcadero. Of the thirty-six protests staged at fixed locations, twenty-two were located in front of government offices or in associated public spaces. Seven were located in public plazas and parks not directly associated with government, including two at
42 The Cal ifornia Geographer • Volume 50, 201 0

City of San Fra ncisco Location of Stationary Protests
t S Miles
• • < 100 • 1 00 - 999 • 1,000 - 9,999
• 1 0,000 +
Figure 1 .-San Francisco Stationary Protests. Protests were heavily concentrated along the Market Street corridor; most notably in and around Civic Center.
the iconic Golden Gate Bridge. Five were located at sites of private property; three for labor actions; one outside of a Gap store to call for a store boycott due to the owners' dedication of funds to oppose Proposition 82, which would offer free preschool to all in California; and one on a sidewalk in Chinatown to oppose the exclusion of the Falun Gong from the Chinese New Year's parade (Gordon 2006, Hua 2006). These locations reflect that nearly all reported protests in San Francisco were in regard to government policies and actions, or lack thereof, and secondarily, labor issues. The targeted governments included local, state, federal, and foreign, and in most cases the protests were sited at buildings associated with the particular government involved. The protests at privately owned property normally were directed at the occupant or owner of the property. However, in Chinatown the identity of the neighborhood provided a symbolic link to the protest target. Most protests were located in heavily travelled public spaces, whether at a site associated with the protest target (e.g. , School District Headquarters), or a traditional forum for expression (e .g., Civic Center Plaza). Downtown San Francisco appears to provide a number of symbolically charged spaces in high-density areas that are accessible to protesters. Thus, the separation of public space from heavy pedestrian traffic areas may not be as significant in San Francisco as in other metropolitan areas.
Stangl : Locating Protest in Public Space 4 3

Number of Participants • < 1 00 • 1 00 - 999 • 1 ,000 - 9,999 e 1 0,000 _ 99,999
e 1 00,000 +
City of Los Angeles
• •
5 Miles t
Location of Stationary Protests
•• • •
Figure 2.-Los Angeles Stationary Protests. A more decentralized pattern is evident in Los Angeles, though they are still found in clusters.
Protest in Los Angeles displays a more polycentric pattern, with clusters found in and around Civic Center, in and around Los Angeles International Airport, and at University of California (UCLA) and Wilshire Boulevard in West Los Angeles. The largest protests can be found in an axis from Civic Center along Wilshire Boulevard to West
44 The Cal ifornia Geographer • Volume 50, 201 0

Los Angeles, though with considerable distance between them. The locations of the thirty-five protests in Los Angeles show a bit more diversity than those in San Francisco. Government offices and associated public spaces accounted for nine protests, and government institutions and authorities such as the Los Angeles Zoo, UCLA, a local high school, and the Port of Los Angeles/LongBeach account for an additional ten protests. Of these latter protests, four involved labor disputes; two involved demands related to an elephant's death at the zoo (Gorman 2006; Doan 2006, June 21); and at UCLA, two opposed state Proposition 209 regarding admissions policy (Doan 2006, April 28; Trounson 2006), one demanded an investigation into campus police use of a taser on a student (Winton et al. 2006), and one picketed a meeting between the state governor and stakeholders in state healthcare policy (Matthews 2006). This represents a more decentralized approach than San Francisco, as many of these events were directed at city and state government, and thus could have been held at City Hall or the nearby State Building. Nine protests were located at privately owned sites, five being labor disputes and four in opposition to the development of an urban farm. Of the remaining six protests, all against government policy and action, three were in parks, two on streets and sidewalks, and two at religious institutions. Two protests were held in Leimert Park, surrounded by an African-American neighborhood, to draw African-American support for anti-immigration legislation (Kaplan 2006, So 2006) . MacArthur Park was the site of an anti-war protest, most likely due to its spatial capacity and centrality, though the military namesake may have been considered (Lin and Schoch 2006) . Finally, a pro-Israeli rally and counterprotest "clogged" a central portion of Wilshire Boulevard (Watanabe and Rietman 2006), maximizing visibility and providing a degree of disruption, but with no apparent symbolic connections to U.S. or foreign governments. The use of neighborhood and regional parks for protests, and the use of the street where no sufficient plaza was available, evidences the considerable utility of a dispersed network of public spaces for accommodating protest. Taking to the street and obstructing traffic may be an option for forceful expression, but it should not be a necessity.
Classifying stationary protests according to Zick's typology reveals an additional contrast. 5 San Francisco protests include twelve in embodied space, twenty-one in contested space, and twenty in inscribed space. Los Angeles protests include seven in embodied space, twenty-four in contested space, and seven in inscribed space. The most striking difference is the relative dearth of protests in inscribed
Stangl: Locating Protest in Public Space 45

pace in Los Angeles, due in part to a lack of "adequate" civic spaces md in part to the lack of a deep tradition of protest. 6 San Francisco's :ivic center and nearby public spaces adjoining government buildngs accounts for many of the protests in inscribed space in that city, :hus a comparison of protest activity in the two cities' civic center merits closer examination.
Both cities provide publicly owned plazas in their civic centers, though the difference in the number of protests held there is striking. In San Francisco, twenty-one protests were held in the Civic Center.7 Fourteen of these were in public plazas (though one spilled well beyond the plaza), and five smaller protests were held on the steps of City Hall. In Los Angeles, only three protests were held directly in the Civic Center, all on the lawn adjoining City Hall. This raises the question as to why Los Angeles' public plazas were used far less than those in San Francisco. Both cities provide ample ;pace: allowing seven square feet per person, 8 Civic Center Plaza in )an Francisco can accommodate over 33,000 protesters, while the Jlaza adjoining Los Angeles City Hall accommodates over 12,000
500 Feet t
San Francisco Civic Center Protest Locations
Number of Participants ) < 100 .) 100 - 999 � 1,000 - 9,999 t 10,000 +
Location of Events 1 - SF School District Headquarters 2 - War Memorial Veteran's Building 3 - California State Building 4- Steps of City Hall 5 - Phillip Burton Federal Building 6 - Civic Center Plaza 7 - UN Plaza 8 - San Francisco Federal Building
Figure 3.-San Francisco Civic Center Protests. Protesters made considerable use of the plazas adjoining government buildings for their protests.
46 The Cal ifornia Geographer • Volume 50, 201 0

SOO Feet t Los Angeles Civic Center Protest Locations
•• •• '
Number of Partldpants •. 100-999
1 ,000 - 9,999
1 00,000+
Key locations 1 - City Halt West Lawn 2 - Parking lot
Figure 4.- Los Angeles Civic Center Protests. In contrast to San Francicso, Los Angeles protesters made little use of the plazas in the Civic Center.
protesters-sufficient for all but the largest protest events. The answer may have to do with the factors other than spatial capacity. At the metropolitan scale, the tremendous expanse of Los Angeles sprawl and the relatively poor public transit system translate into a considerably larger "friction factor" for protesters travelling to the center-especially the poor. In fact, the organizers of one massive immigration protest planned a series of smaller protests in suburban centers such as Pomona, Santa Ana, Pasadena, Long Beach, etc., stating, "A lot of people don't have the means to get to Los Angeles, especially students." (Lin and Gencer 2006). In San Francisco, commuter rail lines provide quick access to the Civic Center from around the region-an asset for the poor and all involved in large-scale protests. However, morphology and urban design appear equally important
Stangl: Locating Protest in Public Space 47

to the "access" issue. Civic Center Plaza in San Francisco sits in front of City Hall, and several other government buildings (local, state, and federal) face public plazas. In Los Angeles, the largest public spaces are distant from City Hall, and a large parking lot sits directly across from the entrance. T he only open space adjoining City Hall sits around the corner from the main entrance. During a student gathering to protest potential anti-immigration legislation, crowds assembled on the open space, and when the mayor appeared in front of the building, they quickly rushed around the corner to the main entrance (Cho and Gorman 2006). Christopher Hawthorne (2006), architecture critic for the Los Angeles Times, notes that "there's no obvious place for citywide gatherings" and regarding the open space adjoining City Hall, "There is no plaza to receive [protesters], just some steps, sloping lawn and a clump of trees." During the largest protest, crowds not only filled the plaza but the street in front of the building and surrounding streets (Gorman, Miller, and Landsberg 2006). Hawthorne noted that the lack of a plaza did not deter them; they simply filled the streets. However, this is not a sound option for protests sans the critical mass to take over the streets. T hey can only tuck themselves away, around the corner on the lawn, possibly mistaken for picnickers.
In sum, Civic Center design should consider the relationship of adequately sized public spaces to the entrances of key government buildings, and especially consider the provision of a large plaza directly in front of City Hall. In Los Angeles, plans for the Civic Center, now shelved, had called for a network of public spaces extending from City Hall that would have remedied many of these problems (DiMassa 2009). However, the lack of a vital pedestrian realm and auto-centric metropolitan land-use patterns and transportation systems also have large impacts, but require great lengths of time and tremendous investment to change.
Location and Purpose of Protests--Marching Marching protests through public streets, sanctioned and unsanctioned, interrupt the normal use of these spaces, providing a very strong statement. In both cities, the size of these protests varied considerably, but they tended to be larger than stationary protests, and included the very largest events. Though San Francisco had only marginally more stationary protests, it had considerably more marching protests-fifteen versus nine for Los Angeles. According to Zick's typology, approximately half the protests in both cities were held in embodied place and about half in inscribed place. Many of
48 The California Geographer • Volume 50, 2010

the largest protests were held in inscribed space along routes associated with protests, and many ended at another type of inscribed space, the civic center, where rallies were held. Contested place was insignificant for marching protests, though the rallies at their conclusion were sometimes held in front of government offices associated with the issue being addressed. Figures 5 and 6 represent the routes of all protests involving 1 ,000 or more participants. In each city a "primary route" is designated, due to its use for numerous and especially large protests.
In San Francisco, six of the ten marches involving over 1 ,000 participants took place on Market Street-the broadest, most densely built thoroughfare through the downtown. Many started at Justin Herman Plaza proceed along Market Street before ending at Civic Center Plaza, though some use only part of this route. In fact, Civic Center (City Hall in particular) functions as terminus and/or starting point for the majority of the routes and most of the marches. The Federal Building, just south of Market, was the end point for several protests regarding immigration legislation, including one originating in the Mission District, the heart of the city's Latino community. Two marches began at City Hall and proceeded through downtown streets before returning to City Hal}.9 The two remaining routes each involved one protest: an anti-abortion march from Plaza Justin Herman along Embarcadero, and a labor protest from Union Square to the Grand Hyatt hotel. The pattern in San Francisco indicates the effectiveness of ]ustin Herman Plaza as a staging ground/0 and the physical and symbolic effectiveness of Market Street and the Civic Center as route and terminus, respectively.
The pattern of marches in Los Angeles shows some similarities and differences. The largest protests here were of a considerably larger magnitude due to the immense population, especially Latinos, who led the protest against anti-immigration legislation-which accounted for all but one of the marching protests involving more than 1 ,000 participants. The primary route, along Broadway to City Hall, contained two of the five protests involving more than 1 ,000 participants and several smaller protests. Broadway is not the most significant thoroughfare in Los Angeles, though it has some of the most intense pedestrian activity in downtown, as it is a workingclass shopping street known as "Latinoway" (Loukaitou-Sideris and Banjeree 1998, 156) . Notably all of the protests following this route were against immigration legislation. This primary march route, then, is more similar in nature to the route from Mission District
Stangl : Locating Protest in Publ ic Space 49

----- Primary Route 2 M i les t ----- Secondary Route Marina Green
2 - Mission Dolores Park 3 - Civic Center Plaza 4 - Federal Building 5 Union Square 6 Grand Hyatt Hotel 7 - Justin Herman Plaza
City of San Francisco Marching Demonstrations
Figure 5.-San Francisco Marching Demonstrations. Marching demonstrations were also heavily concentrated in the core. Market Street served as the route for the most frequent and largest demonstrations.
to Civic Center in San Francisco than to Market Street. The secondlargest protest involved 400,000 and followed a densely settled portion of Wilshire Boulevard. This route is similar to Market Street in terms of being a long boulevard of very high density and heavy traffic, but it does not connect directly to the Civic Center. Due to its great length, portions are so distant from Civic Center that it is an unreasonable destination.
As with San Francisco, City Hall was the primary destination for marches, though every one of these was about immigration legislation. Another immigration march began at the Federal Building and
50 The Cal ifornia Geographer • Volume 50, 201 0

1 2 .....,
3 ---4 Z,s /6 5
1 - Koda k Theater 2 - Hollywood Blvd. & Vine St. 3 - Wilshire Boulevard & La Brea Ave. 4 - MacArthur Park
5 M i les t 5 - Broadway 6 - City Hal l 7 - Cathedral of Our Lady of Angels
. 8 - Federal Bui lding
City of Los Angeles March i ng Demonstrations
Figure 6.-Los Angeles Marching Protests. The pattern of marching demonstrations is not strikingly different from that in Los Angeles. T he primary route here follows Broadway to the Civic Center. It included the largest protest,s as it linked a large Latino commercial center with City Hall for the massive immigration legislation protests. Central Wilshire Boulevard was also notable for its protests but is too distant to link with City Hall.
ended at the Cathedral of Our Lady of Angels, both a few blocks from City Hall. Additionally, an unauthorized, spontaneous immigration march involving 40,000 students materialized along diverse routes throughout the city (which were only partially reported), but ended in a rally at City Hall (Cho and Gorman 2006) . The students walked out of classes and found their way through the city, and the schools sent buses to bring them back to campus later in the day. Finally, one massive immigration march proceeded from MacArthur Park down mid-Wilshire Boulevard before ending at La Brea Avenue (Gorman, Miller, and Landsberg 2006). The sole major march not addressing immigration issues was a march against the Iraq War beginning at Hollywood Boulevard and Vine Street and ending at the Kodak Theater (Lin and Schoch 2006) . These last two
Stangl : Locating Protest i n Public Space 5 1

marches were in extremely dense, heavily travelled areas, but were far removed from Civic Center. It seems the distance between the most densely settled, well-known streets and the civic center contributed to a more decentralized pattern of marching protests than in Los Angeles.
In both cities, marching protests were able to accommodate the largest crowds. This was particularly evident in Los Angeles, where immigration-focused protests drew from the metropolitan area, as crowds of more than 400,000 and 500,000 took over the streets on separate occasions. No reasonably sized plaza could accommodate such crowds, and the occupation of the streets makes a forceful message. In fact, conflict with cars appears in reports in both cities. Even a small group occupying a public plaza may decide to interrupt traffic, as did the anti-war demonstrators near Senator Feinstein's office in a small plaza at Market and Montgomery Streets, which they abandoned to block traffic (Garofoli 2006) . In Los Angeles these reports and concerns about blocked traffic seem especially prominent. On several occasions demonstrators made efforts to hinder traffic, and at one event teens even walked onto the Hollywood Freeway and Harbor Freeway, briefly blocking traffic (Cho and Gorman 2006) . Though the interruption of traffic makes a statement in any city, in Los Angeles, where the auto, the strip, and the freeway are entwined with the identity of the city, the interruption of traffic resonates most deeply. An article dedicated to this topic noted that Wilshire Boulevard had "spent most of the zorh century as a shrine to petroleum-based civilization," but the immigrant marchers "turned the cradle of American car culture upside down" (Reynolds 2006).
Conclusions Contrary to claims that the internet is replacing the physical space as the forum for public dissent, robust levels of protest were found in both San Francisco and Los Angeles. These were reported on in many forms of media, including newspapers, Web sites, and blogs, evidencing a symbiotic rather than competitive relationship between protest in public space and protest in cyberspace (see Zick 2006, 481-84; Goheen 1998, 494). In some cases, simply occupying a public space with considerable visibility to passers-by was sufficient to determine choice of site (embodied place); in other cases, occupying a site with particular symbolic meaning was also important (contested and inscribed space). If, as Zick suggests, the government accepts responsibility to provide access to public space for civil and
52 The Cal ifornia Geographer • Volume 50, 201 0
uncivil dissent, multiple dimensions of access need to be considered. First, the provision and regulation, or nonregulation, of inscribed space is essential. Many protest events in San Francisco occupied plazas in front of City Hall, the Federal Building, and other government buildings, suggesting the importance of providing adequate "inscribed place" or public spaces in a civic center. The second factor involves morphology and urban design. A comparison of the relationship between City Hall and its associated public spaces and uses in the two cities indicates the importance relating the public spaces directly to the building entrances, and designing them in such a way that they are useful for protest and not just viewing from the street. Many of the largest protests involved marches through the city, and again high visibility and symbolic associations were both important, though it was sometimes easier to obtain both of these at the same place in San Francisco. The apparent demand for a network of decentralized public spaces to stage marching protests and hold stationary demonstrations reinforces concerns about the "privatization" and "regulation" of public spaces beyond the civic center, and more importantly concerns about the relative location and design of these spaces, in particular their connection to the public realm. A network of unrestricted public spaces in neighborhoods throughout the city, linked into and supporting densely settled, heavily travelled areas connected by a substantial pedestrian network, is an asset to dissent in public space. In downtown Los Angeles, much of the urban form is not conducive to a vital pedestrian life, and is thus less attractive for protest. The third factor involves metropolitan land use and transportation patterns . Travel to the center is far more difficult in Los Angeles, especially for the poor, which evidently contributed to the more decentralized pattern of protest. The centrality of protest in San Francisco reflects the benefits of compact, well-designed urban form and effective regional public transportation-just one way the transit metropolis and traditional urban form contribute to the socially just city.
Endnotes 1 According to the 2000 US Census, the greater metropolitan area populations of Los Angeles and San Francisco are 16.4 million and 7 million, respectively, and the city populations are 3. 7 million and 0.8 million, respectively. Metropolitan Los Angeles has a land area of 35,000 square miles and a population density of 482 persons per square mile; the San Francisco Bay area has a land area of 8,800 square miles and a population density of 955 persons per square mile.
Stangl : Locating Protest in Public Space 53

2 For comparison, consider off-peak transit trip times from San Jose to downtown San Francisco and from Mission Viejo to downtown Los Angeles, both of which are approximately fifty miles. The former has an estimated travel time by car of approximately one and onehalf hours, whereas the latter is estimated at two and one-half hours. Accessed 2 September 2010 from http:/ /tripplanner.transit .S 1 1 .org/ mtc/XSLT_TRIP _REQUEST2?language=en and http:/ /socaltransport. org/tm_pub _start. ph
3 San Francisco's downtown blocks measure 275' x 412'; Los Angeles shows more variability, though nearly all blocks are more than 300' x S 7 S '. More significantly, San Francisco has far more doors and windows on the street, while Los Angeles is known for its "fortress architecture. " (See Davis 1992)
4 Goheen (1998) observes that the occupation of symbolic physical space is a powerful means of obtaining media exposure. Mainstream media reaches vast audiences, and these two newspapers are the primary news sources for the two cities, thus reported protest activity in these papers have achieved a high degree of success in terms of exposure.
S Classifying the protests required some degree of interpretation, and some were counted under more than one category, as Zick suggested.
6 Both of these characteristics of Los Angeles were observed by Hawthorne (2006) in his reflections on the immigration protests.
7 Though not part of the original Civic Center design area, the recently constructed federal building and adjoining plaza across Market Street is considered an extension of the Civic Center, due to its function, adjacency, and design.
8 It is possible to pack people at a density of three square feet per person, but seven square feet allows enough space so that persons are not "touching. " See Fruin, Time Saver Standards for Urban Design, C3.3-6.
9 All the routes shown are approximations based on newspaper descriptions, and are stylized for increased legibility. The shorter loop is a relatively close approximation of the streets indicated in the newspaper article. The larger loop was based on an article with a relatively vague description of the route followed, but accurately depicts the sequence of districts involved.
54 The Cal ifornia Geog ra pher • Vo lume 50, 201 0

10 Justin Herman was the first director of the San Francisco Redevelopment Agency, and no significant civic buildings adjoin the plaza, thus it is unlikely that symbolic associations play an important role in the choice of this space as a starting point.
References Beckett, K., and S. Herbert. 20 10. Banished: The new social control
in America. Oxford: Oxford University Press, Inc. Blumenberg, E., and R. Ehrenfeucht. 2008. Civil liberties and the
regulation of public space: the case of sidewalks in Las Vegas. Environment and Planning 40:303-322.
Capron, G. 2002. Accessibility to "Modern public spaces" in Latin-American cities : a multi-dimensional idea. Geojoumal 58:21 7-223.
Cheung, W. 2002. Regulation of Public Meetings and Public Processions in San Francisco, New York and London. Report RP03/01-02. Research and Library Services Division, Legislative Council of Hong Kong, Secretariat, January 1 1 .
Cho, C., and A . Gorman. 2006. The Immigration Debate: Massive Student Walkout Spreads across Southland. Los Angeles Times 28 March.
City of Los Angeles Human Relations Commission. 2009. Your Rights to Demonstrate and Protest. www.lapdonline.org/get_informed/pdf_view/38 120 [accessed 10 September] .
Davis, M. 1 992. City of quartz: Excavating the future in Los Angeles. New York: Vintage.
Doan, L. 2006. Zoo investigating Gita's death: Activists call for federal probe. Los Angeles Times 21 June: B3.
DiMassa, C. 2009. Civic Center Park takes shape in LA. Los Angeles Times 1 2 March. http:/ /articles.latimes.com/2009/mar/ 1 2/local/ me-grand-park1 2 [accessed 1 8 August] .
Fruin, J. 2005. Design standards for pedestrian circulation. In Time-saver standards for architectural design, 81h Ed., C3.3-1 -C3.C- 1 2. New York: McGraw Hill.
Garofoli, J. 2006. 1 7 Arrested seeking end to Iraq War: Rushhour rally in Financial District spotlights torture. San Francisco Chronicle 21 March: B3.
Goheen, P. 1 998. Public space and the geography of the modern city. Progress in Human Geography 22 (4) :479-496.
Gordon, R. 2006. Prop. 82 Backers Picket Gap store. San Francisco Chronicle 1 4 April: B5.
Stangl: Locating Protest i n Public Space 55
Gorman, A. 2006. Death of Gita Renews Calls to Move Elephants to Sanctuary: Activists demonstrate at the L.A. zoo to protest its plans to keep two remaining pachyderms. Los Angeles Times 12 June: B3.
Gorman, A., M. Miller, and M. Landsberg. 2006. The May Day Marches: Marchers fill L.A.'s streets: Immigrants demonstrate peaceful power. Los Angeles Times 2 May: B3.
Grimson, A. YEAR? The making of new urban borders: neoliberalism and protest in Buenos Aires. Antipode 40 (4) :504-5 12.
Hawthorne, C. 2006. The City Rediscovers the Street. Los Angeles Times 31 December: Fl .
Herbert, S. 2007. The "Battle of Seattle" revisited: Or, seven views of a protest zoning state. Political Geography 26:601-619.
Hua, V. 2006. Falun Gong Group to make Showing Along Parade Route. San Francisco Chronicle 1 1 February: B8.
Kaplan, E. 2006. Hoisting the Flag in Anger. Los Angeles Times 26 April: B13.
Kayden, ]. 2000. Privately owned public space: The New York experience. New York: John Wiley.
Kennedy, D. 1995. Residential associations as state actors: regulating the impact of gated communities on nonmembers. The Yale Law Joumal 105 :761-792.
Lin, S., and D. Schoch. 2006. Thousands Protest War's 3'ct Anniversary: From Australia to Hollywood, people march to demand that troops be withdrawn. Los Angeles Times 19 March: A1 .
Lin, R., and A. Spencer. 2006. The Immigration Debate: Gearing up, and Girding for Protests. Los Angeles Times 1 May: Al .
Lokaitou-Sideris, A . , and T. Banjeree. 1998. Urban design: Poetics and politics of form. Berkeley: University of California Press.
Low, S. 2008. Incorporation and gated communities in the greater metro-Los Angeles region as a model of privatization of residential communities. Home Cultures 5 (1) :85-108.
Matthews, J. 2006. Gov's healthcare summit reveals union divisions. Los Angeles Times 25 July: B2.
McCarthy, J., and C. McPhail. 2006. Places of protest: the public forum in principle and practice. Mobilization: An International Quarterly 1 1 (2):229-247.
Meyer, D. 2009. In Stephen Dubner, "How Much do Protests Matter? A Freakanomics Quorum." The New York Times 20 August. http:/ I freakonomics. blogs. nytimes.com/ 2009/08/20 I do-protests-matter-a-freakonomics-quorum [accessed 20 August] .
Mitchell, D. 2003. The right to the city: Social justice and the fight for public space. New York: The Guilford Press.
56 The Cal ifornia Geographer • Volume 50, 201 0

Mitchell, D. 1995. The end of public space? People's Park, defini
tions of the public and democracy. Annals of the Association of American Geographers 85: 108-133.
Mitchell, D. , and L. Staeheli. 2005. Permitting protest: Parsing the fine geography of dissent in America. International Journal of Urban and Regional Research 29 (4) :796-813.
Nemeth, ] . , and S. Schmidt. 2007. Toward a methodology for measuring the security of publicly accessible spaces. Journal of the American Planning Association 73 (3):283-297.
Petersen, M. 2006. Patrolling the plaza: Privatized public space and the neoliberal state in downtown Los Angeles. Urban Anthropology and Studies of Cultural Systems and World Economic Development 35 (4) :355-386.
Reynolds, C. 2006. Walkers reclaim Wilshire: Monday's protest turned the street into a pedestrian zone: Could this be L.A.'s future? Los Angeles Times 4 May: £4.
Sennet, R. 1976. The Fall of Public Man. New York: Norton. So, H. 2006. Minuteman Project to Launch U.S. Caravan. Los An
geles Times 3 May: B6. Sorkin, M., ed. 1992. Variations on a Theme Park. New York: Hill
and Wang. Trounson, R. 2006. UCLA Students Protest Race and Gender Poli
cies. Los Angeles Times 3 November: B3. Uitermark, J . 2004. Looking forward by looking back: May Day
protests in London and the strategic significance of the urban. Antipode 36 (4) : 706-727.
Watanabe, T., and V. Rietman. 2006. Warfare in the Middle East: 'A real defining moment' : jewish leaders say the L.A. rally shows the politically diverse community is united. Los Angeles Times 24 July: A 1 .
Winton, R., R. Lin II, and C . Proctor. 2006. UCLA Orders Outside Probe of Taser Arrest: The Move Comes Hours after a Protest March by more than 200 Students. Los Angeles Times 18 November: A1 .
Zick, T. 2006. Space, place and speech: The expressive topography. George Washington Law Review 1 1 (3):439-505.
Zukin, S. 1995. The cultures of cities. Cambridge, MA: Blackwell .
Stang l: Locating Protest in Public Space 5 7


-
Water Resource Problems within Pre-Platted Communities in the
United States: The Case of Lake Havasu City, Arizona
Abstract
Hubert B. Stroud Arkansas State University
Thomas 0. Graff University of Arkansas
This paper analyzes water resource-management issues at Lake Havasu City, Arizona, a large, pre-platted community. This amenity-based community is located in western Arizona, where water supply is a major concern. Water resource problems are intensified by poor planning and development decisions made by the original developer. The site chosen for development is an alluvial fan located in an extremely arid and drought-plagued region. To make matters worse, the entire site was platted and sold as rapidly as possible, creating problems associated with a sprawling subdivision and scattered developed. Fortunately, community officials have managed to devise ways to overcome many of these problems by implementing some rather innovative water resource-management techniques. Despite these innovative approaches, more is needed to meet the fresh water demands of a growing population. There is a special need to view water resource issues in a regional context because the demand for water supply is not limited to a single community. Competing demands for limited, potable water supplies require a cooperative effort if communities are to succeed in meeting future water resource needs. This is particularly significant at Lake Havasu City, because their water supply is determined by decisions made by those in charge of establishing Colorado River water use allocations.
Key words: pre-platted communities, potable water supplies, rapid population growth, water allocations, water conservation techniques.
Introduction WATER suPPLY Is BECOMING a serious problem in many parts of the world as the demand for fresh water continues to spiral upward. This is
The California Geographer 50, © 2010 by The California Geographical Society

certainly true in the United States, where drought and rapid population growth and development have exacerbated the problem. A significant challenge is providing an adequate water supply for residents within pre-platted communities, particularly those that have experienced rapid population growth in recent years. For purposes of the research, a community is considered to be pre-platted if the entire site was subdivided into relatively small lots and sold as potential home sites prior to the installation of basic services such as water and sewer. Developers of pre-platted communities were often motivated by profits from lot sales rather than by creating sustainable communities. A common result was a sprawling subdivision with few, if any, basic services extended to individual lots. When pre-platted communities experience rapid population increases, the demands skyrocket for a wide variety of basic goods and services, including water and waste disposal.
The purpose of this paper is to show how rapid growth within pre-platted communities (lot sales subdivisions) creates a tremendous strain on natural resources, espeCially potable water supplies. Original developers, rushing to sell lots as rapidly as possible, often failed to provide even the most basic services. It was quite often the individual lot owner's responsibility to provide water and sewer facilities on-site via individual wells and septic tanks. For those subdivisions that grow and become incorporated cities, extending utilities (central water and sewer) to hundreds or even thousands of lots is a significant problem. This paper, by using a case study, illustrates how a pre-platted community is meeting the challenge of providing an adequate water supply for a rapidly expanding population in an extremely dry environment. Coupled with the problem of water supply is an aging infrastructure.
The Setting Lake Havasu City began in 1963 when Robert McCulloch, a millionaire chainsaw executive, purchased a twenty-six square-mile parcel of barren desert along the western boundary of Arizona. It was the first of eight land development projects built by McCulloch Properties, Inc. (MPI). The 16,700-acre development is located along the eastern shore of Lake Havasu, a federal Bureau of Reclamation dam project (Figure 1) (Stroud 1995).
McCulloch devised one of the most outlandish and expensive promotional stunts ever used by a land developer to promote a project. He purchased the 140-year-old London Bridge for $2.5 million from
60 The Cal ifornia Geographer • Volume 50, 201 0

-
* Horizontal Collector Well -· •• Water Service Boundary • Wells
r::J �:�r Treatment
48" Raw Water /'../ Transmission Pipe
--·-·· lake Havasu City limits - Major Slreels
Ml!es
Figure I .-Map depicting the location of Lake Havasu City, along the shoreline of Lake Havasu in western Arizona. Notice the island that was created by the excavated channel in Lake Havasu. Source: Lake Havasu City, Water Master Plan Update, October, 2007.
the British in 1968 and spent an additional $7 to $8 million to have it disassembled into more than 10,000 pieces of granite, shipped to Arizona, and reassembled along the shore of Lake Havasu under the direction of a British engineer. Reconstruction of the bridge was on dry land, with mounds of sand added to help support the arches during construction. A channel one mile in length was dredged
Stroud and Graff: Water Resource Problems 61

at the completion of reconstruction, to provide water under the bridge. The peninsula known as Pittsburg Point became Pittsburg Island (Figure 2).
Most of Lake Havasu City's environmental problems are directly attributable to McCulloch's choice of site. Sitting on an alluvial fan, Lake Havasu City is particularly vulnerable to flash floods, a problem that is difficult to alleviate. In fact, flooding problems are magnified because the developer did not follow the natural limitations of the land. Although improvements have been made in recent years, many homes are too close to washes and drainage ways, and many roads cross arroyos (washes) without bridges (Figure 3) (Allan et al. 1976). Despite occasional flooding, a much more serious and long-term problem is water shortages. Water supply limitations are particularly acute at Lake Havasu City because it occupies an inhospitable stretch of desert, where rainfall is minimal and temperatures are extremely hot during summer months. Rainfall averages approximately five
Figure 2.-Ground view of the London Bridge crossing the artificial channel at Lake Havasu City, Arizona. Pittsburg Island, created by the digging of the artificial channel after the bridge was constructed, is visible in the background. Source: Photograph taken by one of the authors, July 2008.
62 The Cal ifornia Geographer • Volume 50, 201 0

Figure 3.-Ground view of a city street crossing a large wash (arroyo) in Lake Havasu City. Notice the homes near the wash and the city street passing through the arroyo without a bridge. Source: Photograph taken by one of the authors, July, 2008.
inches per year, and summer temperatures often exceed 1 15 degrees F. This harsh desert climate sustains only widely spaced small shrubs and cacti.
Lake Havasu City's 16, 700 acres have been subdivided into 33,5 14 lots, most of which were sold within a few years. The city also has multi-family units, motels, mobile homes, and commercial and industrial lots. While growth was slow during the early stages of development, population totals have increased dramatically in recent decades. By 1990, for example, twenty-nine percent of the population in Mohave County lived at Lake Havasu City. According to the Lake Havasu City General Plan 2002, the community nearly doubled in population, from 24,363 to 41 ,938, between 1990 and 2000. It is now the largest city in Mohave County and provides employment and recreational opportunities and a wide array of basic services. The General Plan projects a build-out population of between 90,000 and 100,000 by the year 2050 (Figure 4) and identifies water availability, transfer of land from public to private use, and infrastructure
Stroud and Graff: Water Resource Problems 63

c: 0 ·.::; .!!! ::::J a. &.
100,000
90,000
80,000
70,000
60,000
50,000
40,000
30,000
20,000
10,000
0 1990 1 995 2000 2005 201 0 201 5 2020 2025 2030 2035 2040 2045 2050 2055
Year Figure 4.-Graph depicting rapid population growth at Lake Havasu City. Source: Lake Havasu City, Water Master Plan Update, 2007.
as constraints to reaching the projected build-out population (Lake Havasu City 2002, Brown and Caldwell 2000).
During the early stages of development, Lake Havasu City had many of the problems characteristic of land development projects promoted under the guise of new community development. Except for its isolated location, Lake Havasu City was really nothing new and certainly not a model community. Initially, the desert landscape was scarred by a dense network of dirt roads and a confusion of stores and factories, mobile homes, and an irrigated golf course. As the city grew, the roads were paved and services extended to existing homes. While the city has had a master plan from the very beginning, much of the city was allowed to evolve in whatever way was most profitable for the developers (Downie 197 4, Stroud 1995). The platted area for the city was designated an Irrigation and Drainage District (IDD) to collect revenue and receive benefits under Arizona State Law (Wilson 2009).
Prior to 1978, Lake Havasu City was an unincorporated recreational area rather than a full-fledged city. Visitors came to enjoy a variety of amenities associated with the lake, primarily water skiing, fishing, and golfing on the newly created golf courses. Until recently, the permanent population was small. Today, the community boasts of
64 The California Geographer • Volume 50, 201 0

having immediate access to the largest body of water on the Colorado River along the Arizona and California border, and a population of over 55,000 with a broad demographic base. The most recent growth boom occurred between 2000 and 2006 and was primarily infill within the Irrigation and Drainage District. Many of the new arrivals during this period of phenomenal growth came from southern California, where they had become dissatisfied with the basic quality of life.
Water Supply One of the most-significant problems that had to be addressed by city officials was the dramatic increase in the demand for water that largely corresponded with the city's growth. Unfortunately, the city's entire water supply is limited to a water allocation established by the Bureau of Reclamation for use of Colorado River water. The City is allocated 25,180 acre-feet, or 8.2 billion gallons, of water per year. This amount of water, while being crucial to Lake Havasu City, pales in comparison to the 550,000 acre-feet that is allocated to Los Angeles and San Diego via the Colorado River Aqueduct, and the 550,000 acre-feet to Phoenix and Tucson via the Central Arizona project that was completed during the 1980s. These figures illustrate the significance of Colorado River water to several cities, and point to a need for regional, comprehensive water resources planning. Problems associated with supply are likely to intensify as the demand for water continues to increase, particularly irt those cities experiencing rapid population growth. Fortunately, the consumptive trend at Lake Havasu City depicts a slight decline, particularly since 2002 (Figure 5). Nevertheless, the current level of use is a concern in view of limited supplies and the continued drought that plagues the region. Projections indicate that water demand may exceed the current allocation if Lake Havasu City continues to experience population growth in the future (Wilson 2008).
Although the term groundwater is often used, all the wells at Lake Havasu City are pumping water from the Colorado River aquifer, a supply that is sustained by recharge from the Colorado River. Consequently, the water taken from wells is included as part of Lake Havasu City's allocation. Even the new horizontal well (Raney Well) that is now the sole source of the city's supply is technically taking water from the river via a 16-foot-diameter, 100-foot-deep groundwater well located at London Bridge Beach on Pittsburg Island in Lake Havasu (Figure 6) . One reason the city changed from a series
Stroud and Graff: Water Resource Problems 65

1 999 to 2008 Total and Residential Per Capita
>. 300 � 250 -g 200 � 1 50 Q) .e- 1 00 Ill g 50 n:l 0 (!) 1998
Consumption Trend - ---- -
..... -- -
1999 2000 2001 2002 2003 2004 2005 2006 2007 2008 2009
-+-Total Per Capita ---e--Resdientia1 Consumption
Figure 5.-Water use trend at Lake Havasu City since 1999. Source: Lake Havasu City, Water Master Plan Update, 2007.
of small wells to one large (Raney) well was in response to a State Department of Environmental Quality mandate to reduce nitrate levels in the water supply. The older wells fell short of producing enough water to meet the needs of a growing community, and they had elevated nitrate levels due to seepage from septic tanks. The new, smaller wells had high levels of naturally occurring manganese. Water containing manganese stains plumbing fixtures and clothes, and leaves a black powdery residue that can ruin surfaces and clog parts (Rudolf 2007, Brown and Caldwell 2001) .
Lake Havasu City hired Burns and McDonnell, an engineering firm, for help in dealing with their water resource problems. In 1997, the firm helped develop and begin the implementation of a master plan to replace a patchwork of rural septic tanks with modern sanitary sewers, and to reduce the nitrate levels that are seeping into the groundwater. The firm also began work on a system designed to enhance Lake Havasu City's water supply. The city worked for seven years to install sewer lines and a new, state-of-the-art sewertreatment plant to mitigate the problems associated with water quality. When the project is finished in 201 1 , approximately ninety percent of the city will be connected to a central sewer system, at a cost of $423 million. Since the state and federal governments are paying only $3 million of the cost, the citizens of Lake Havasu City are responsible for the bulk of the expense; base monthly sewer charges could exceed $ 100 in the next few years. If this does occur, the Lake Havasu City sewer rate would be one of the highest in the United States (Wilson 2009) .
66 The Cal ifornia Geographer • Volume 50, 201 0

Figure 6.-Ground view of the small building housing the Raney Well on Pittsburg Island in Lake Havasu. Source: Photograph taken by one of the authors, July, 2008.
Initially, a first-of-its-kind system was created. It included the 100-foot-deep horizontal collector (Raney) well with a capacity that is adequate to meet current demand (Foster 2008). The city is also actively working to select an appropriate location for a second collector well that will not only provide enough water for the buildout population, but will also provide the flexibility to continue service if the first collector well is temporarily taken out of service for maintenance. The nine older conventional wells will be used as reserves (Wilson 2009).
After extensive research into manganese removal options and the use of a test well, a pilot plant complex was designed to evaluate the biological purification method, along with a conventional membrane filtration and three other conventional oxidation filtration processes for manganese removal. All the different processes were tested based on effectiveness and cost. It was concluded that not only was the biological method effective in removing manganese, but it would save $1 million to $2 million in plant construction and reduce annual operating costs by $600,000 to $700,000 compared to traditional methods (Bums and McDonnell 2002).
The water supply system pumps water from the collector well into a filtration plant with filters containing a granular medium and
Stroud and Graff: Water Resource Problems 67
naturally occurring microorganisms that catalyze oxidation of the manganese. Chlorine is also added, but in smaller amounts than conventional methods would require. Additional benefits of the biological filter process are improved taste and color of the treated water. These benefits are accomplished by removing organic matter and other pollutants. Fortunately, the new system creates another flowing source of water in addition to the Colorado River. The source is effluent, the water re<;overed from flushed toilets and drained bathtubs. This treated effluent will increase from one million gallons per day to about fourteen million gallons per day in the near future. This is being accomplished by the expansion of two existing wastewater treatment plants and by the building of a new one. For a city that receives less than five inches of precipitation per year, reclaimed water can be an extremely valuable resource. As would be expected, the effluent is to be treated to meet State of Arizona standards.
Lake Havasu City uses the effluent to irrigate the growing number of golf courses, green spaces, and landscaping along Highway 95, which runs through the city. Another planned use of reclaimed water is to recharge the Colorado River aquifer that runs beneath Lake Havasu City. The feasibility of aquifer recharge is not fully understood. Water management officials will know more after additional testing has been completed (Wilson 2009). The Lake Havasu City Water Management Plan also includes important strategies to obtain additional water and efforts to increase conservation. Conservation and reuse are extremely important because the number of additional supplies or new sources of water are indeed limited. These efforts, many of which are included in the city's plans for the future, will do much to move the city toward water resource sustainability (Lake Havasu City 2006).
Water Conservation Measures Conservation measures include the elimination of the use of lake water to irrigate golf courses, the reduction of the overall demand for irrigation, the promotion of the use of water-saving devices such as low-flow toilets and no-flush urinals, the investigation of the feasibility of directing evaporation-cooler waste into the sewer system or to individual irrigation systems, the feasibility of subsurface injection of excess effluent to create a storage reservoir accessible for later recovery, and the continuation of public education on water consumption practices.
68 The California Geographer • Volume 50, 201 0

--
Fortunately, Lake Havasu City has taken an active role in reducing the consumptive use of water. The most dramatic reductions in water use are considered to be a direct result of pricing structure revisions and pricing increases. Prior to the introduction of the increased scale-rate structure, water was relatively inexpensive. Total usage per capita began to decrease between 2002 and 2003, and it continued to decline to approximately 220 gpcd (per capita use in gallons per day) in 2008 (Figure 5). This decrease is attributed to the cumulative effects of the closing of the McCulloch manufacturing plant (a former user of large amounts of water) and a pricing structure that charges higher rates as water use increases. Fortunately, residential use, which is seventy percent of the city's total consumption, decreased to below 170 gpcd in 2004. With the exception of a slight increase in water use in 2006, levels at or below 170 gpcd continued through 2008 (Figure 5). New ordinances mandating additional rate increases in the future are being implemented to help create additional water conservation. Other conservation measures include landscaping requirements and low-flow plumbing fixtures. The city has instituted a "no-turf" policy for commercial, multi-family, and industrial uses. The "no-turf" policy is not applicable to single-family residential property. Even so, it is a water savings method that many residents are using (Figure 7).
Finally, the city has established short-term water conservation goals for the five-year period from 2006 to 2010 (Lake Havasu City 2005). The general goals that extended through 2010 were as follows: • Decrease the total water consumption rate to between 240-220
gpcd through the five-year conservation period. • Target the residential user group with specific programs de
signed to reduce overall usage. • Increase public awareness of the water deficit that Lake Havasu
City will experience in the coming years due to population growth and projected Colorado River water shortages.
• Reduce summer-season water usage by ten percent or more. • Implement the "Slow the Flow" campaign. • Increase wastewater reuse to keep pace with increased effluent
availability.
The steps listed above to meet the growing demand for a limited resource are indeed necessary and expensive. To cover a large portion of the cost, local residents voted to support issuing a $463 million bond to fund a new central sewer system. The first phase of the project began with a $2.2 million contract that was approved by the Lake
Stroud and Graff: Water Resource Problems 69

Figure 7.-Ground view of no turf in use at single-family home site at Lake Havas-u City. Source: Photograph taken by one of the authors, July, 2008.
Havasu City Council in 2002 (Burns and McDonnell 2002). While the central system is a necessary step, it will not solve the water resource problems for this city with a history of rapid population growth. This is particularly true if flows from the already overtaxed Colorado River are less in the future. It also makes conservation and the use of reclaimed effluent even more important. Whether or not adequate water supplies are available in the future depends in part on rates of population growth and on the success with which the goals outlined above are implemented and adhered to by the general population (see, for example, Lake Havasu City 2005).
Conclusions Even communities with a poor layout and design and a history of inefficiency are now beginning to realize the importance of conservation and the need to preserve natural resources, especially fresh water. The community examined in this research is making or has already made significant changes in the way in which water supplies are obtained, and in the way in which water is used. A new well was installed to enhance water supply, and steps have been taken to remove manganese from drinking water. In addition, plans are
70 The California Geographer • Volume 50, 201 0

-
underway to utilize reclaimed effluent, as an important means to generate a new water source for irrigation, for replenishing Lake Havasu, and for recharging the underlying aquifer.
This article illustrates the importance of making provisions for water supply within pre-platted communities. Potential problems for the future include competing demands on already limited supplies, the degradation of existing sources of supply from unexpected pollution sources, or a substantial rise in the demand for water from rapid population growth. These and other potential problems highlight the importance of water resources planning and management that includes protection of existing sources and an ongoing search for new sources of supply and innovative conservation techniques.
Located along the Colorado River, Lake Havasu City must compete with faraway metropolitan areas such as Los Angeles and Tucson for river water. Fortunately, the community of this study has initiated a major water-conservation program. The situation at Lake Havasu City provides an indication of the need to view water-resource issues in a regional context. This is extremely important because population growth in cities such as Las Vegas could impact water availability in the Lower Colorado Basin if greater volumes of water are diverted to upstream users.
It is abundantly clear that societies around the globe must switch from the one-time use of water to disperse human and industrial waste. The technology is available to eliminate the practice of using vast quantities of water to wash away waste material. The "flush and forget" system must be replaced by a much more efficient system (Brown 2008) . One important option is the composting toilet, which converts human fecal matter into soil-like humus . Interest in ecological sanitation is increasing as water shortages intensify. Fortunately, several options remain available for communities that continue to use their water-based waste-disposal system. These water-saving techniques designed to be used at the household level include water-efficient shower heads, flush toilets, dishwashers, and clothes washers. As water costs rise, the appeal of water conservation will become increasingly more attractive to individual homeowners and to communities as a whole.
The severity of the situation is illustrated at Lake Havasu City, where residents have few options for obtaining fresh water if the flow of the Colorado River diminishes, if the city exceeds its allocation of
Stroud and G raff: Water Resource Problems 71
25, 1 80 acre-feet per year, or if the federal government reduces the allocation to Lake Havasu City. As a means to cope with this very serious situation, city officials are working to obtain additional water rights, increase water conservation, and increase the use of reclaimed water. Since water supplies are so limited, these efforts and more are needed to ensure adequate water supplies in the future.
References Allan, L., et al. 19 76. Promised Lands. Vol. 1, Subdivisions in Deserts
and Mountains. Inform, Inc., New York, pp. 141-153 . Brown and Caldwell. 2000. Water Resources Plan: Lake Havasu City,
Arizona. Brown and Caldwell Environmental Engineers and Consultants, Lake Havasu City, Arizona.
---. 2001 . Water Resource Plan: Lake Havasu City, Arizona. November 26, 2007. http://www.bcwaternews.com/waterresources
Brown, ]. L. 2008. Plan B 3.0: Mobilizing to Save Civilization. W. W. Norton & Company, New York.
Burns and McDonnell. 2002. A New Sewer System for a Fast-Growing Community. Lake Havasu City, Arizona.
Cech, T. V. 2003. Principles of Water Resources: History, Development, Management, and Policy. John Wiley & Sons, New York, p. 2.
Downie, L. 1974. Mortgage on America. Praeger Publishing Company, New York, pp. 156-164.
Foster, D. 2008. Production Supervisor, Public Works Department, Water Division, Lake Havasu City, Arizona, personal communication, July.
Lake Havasu City. 2002. General Plan 2002: Land Use Element, Lake Havasu City, Arizona. August. Pp. 14 and 40.
---. 2005 . Water Conservation Plan, Lake Havasu City, Arizona. Revised March 2006.
---. 2006. Water Division. Water Management. January 1 , 2008. http://www.lhcaz.gov /water.htm
Rudolf, ]. 2007. "Water Improvements to Cost $40 Million. " Today's News-Herald. Lake Havasu City, Arizona, November 12.
Stroud, H. B. 1995. The Promise of Paradise: Recreational and Retirement Communities in the United States Since 1950. Johns Hopkins University Press, Baltimore, Maryland. Pp. 3-4, 1 1 2-1 13, 1 19-124.
Wilson, D. 2008 and 2009. Water Resources Coordinator, Public Works Department, Lake Havasu City, Arizona, personal communication, July and August.
72 The Cal ifornia Geographer • Volume 50, 201 0

-
Geographic Education


>
elearning by Doing: A Geographic Approach to Service Learning and Building Community
Abstract
Jennifer Helzer California State University, Stanislaus
In this paper I describe the experiences of incorporating community service-based learning (CSBL) with an upper-division urban geography course taught at California State University, Stanislaus. Integrating a service-learning component into an existing course or creating a new course with CSBL activities and projects, one that reaches beyond the traditional classroom environment, offers a practical example of how participatory fieldwork can be applied in an urban setting. Service-learning enj oys the added benefit of engaging students from a variety of backgrounds, many of whom possess an array of skills and learning styles. Furthermore, students gain valuable experience in dealing with real-world problems in a local setting, and CSBL provides the ideal platform for applying geographic skills and knowledge to reach that goal. As educators we are increasingly asked to improve the quality of education, with fewer resources to support our creative endeavors. One possible solution is to explore the benefits of linking service-learning with geographica� inquiry. This paper provides an overview of the logistics and pedagogy involved in creating CSBL field projects and activities for an upper-division urban geography course. It also highlights the project results and benefits to the community, student reflections on urban-CSBL projects, and ongoing work linked to this initial effort.
A Serendipitous Beginning . . . IN FALL 2007, I began to prepare course materials for an upper-division Urban Geography course, to be taught the following spring semester. My initial idea for providing a field experience in the course was to take students on a day-long tour of some nearby "big city, " say, Sacramento or San Francisco, where students could experience and document urban patterns and city landscapes firsthand. Another goal for the course was to provide students with an opportunity to develop and practice skills for doing urban-based geographic research. Near the end of the semester, I was contacted by the Di-
The Califomia Geographer SO, © 2010 by The California Geographical Society

rector of Service Learning on my campus about a possible community partnership and service-learning opportunity with Habitat for Humanity based in Modesto, California. While I initially had little knowledge of service-learning as a pedagogical strategy, I have always supported a hands-on, "learning by doing" approach to teaching geography; therefore the opportunity for students to collaborate with community partners on pressing urban needs and community issues fit perfectly with the goals and student learning objectives of the course. Since the focus of the course typically emphasizes case studies and examples from leading world cities, working on a local urban project helped to create an importance balance-spotlighting urban processes and issues in our own region.
With two weeks remaining before the beginning of the semester, the structure of the class was coming together. I met with Habitat for Humanity and visited their facility in nearby Modesto. I toured a number of Habitat's current housing rehabilitations in Modesto's Airport Neighborhood and began to generate a list of ideas for class participation and projects. I shared my ideas with the Office of Service Learning, and they took care of the painstaking tasks of risk-management and coordinating a series of student visits to the Airport Neighborhood.
Based on my meetings with community members and Service Learning staff and my initial field work, I developed a CSBL project outline for the course. A main objective of the project was for students to work with Habitat for Humanity and the community group Modesto Airport Neighbors United (ANU) to produce a needs assessment for the Airport Neighborhood. Students would also participate in a number of different activities to reach this goal, including (1) the collection and analysis of census data (income, demographics, housing); (2) collection of qualitative data with an emphasis on field work (interviews, participant observation, location, landscape, and land use analysis); (3) participation in community meetings; and ( 4) collection of archival information on the Airport Neighborhood from local and county libraries and archives (theses, photographs, interviews, newspaper reports) . Ultimately, all the collected materials and data would be incorporated into a community geodatabase where GIS software and other geospatial tools would be used to analyze urban spatial patterns and to create maps from the gathered information.
76 The Cal iforn ia Geographer • Volume 50, 201 0

-
Location and Setting The unique site and situation of Modesto's Airport Neighborhood make it an ideal laboratory for observing urban issues, as well as
an excellent case study for a CSBL project. The district known as
the Airport Neighborhood encompasses an area of approximately 1 .5 square miles split between the City of Modesto and Stanislaus county. The neighborhood is a geographic isolate located in the city's southeastern sector. It is bounded on the east by the Modesto Airport, the Tuolumne River forms the southern boundary, and Highway 132, a busy four-lane commercial and industrial corridor, serves as the northern edge of the neighborhood. To the west lies the headquarters of Ernest and Julio Gallo Winery, the second-largest winery in the world. The Airport Neighborhood is small and contained, and this, along with a unique settlement past, contributes to its distinctive identity. Dust Bowl migrants are among the Airport Neighborhood's earliest settlers, and a number of the single-family dwellings date from the 1930s. Today, the area once referred to as "Little Oklahoma" is home to approximately 6,000 residents, with an ethnic-racial composition split evenly between Latino/Hispanics and Whites.
The community is characterized by substandard housing. It is not unusual to have occupied housing with dirt floors, and many households lack basic services. The neighborhood is plagued by a high poverty level, homelessness, and a high crime rate . Seventy percent of the children enrolled at local elementary school are from families receiving temporary assistance for needy families, and 100 percent receive free or reduced lunch. Poverty in the Airport Neighborhood is crushing, with per capita income at $7,7 34 compared to $ 1 7,79 7 for Modesto, and $22, 7 1 1 for the state as a whole. The poverty level for seventy-five percent of the district's inhabitants is classified as poor or struggling, which is double the average for the City of Modesto and the State of California.
Judging from newspaper reports, letters to the editor, and discussions with community leaders, the underlying problems that plague the Airport Neighborhood are largely unknown to most area residents. Like Modesto's other areas of deprivation, including the largely Hispanic westside neighborhoods, the Airport Neighborhood is viewed by many as a faceless, crime-ridden island beyond repair.
Geographic Education 7 7

Project Logistics and Course Management On the first day of the semester, I presented the idea of a field-based service-learning project to a class of fourteen students, and they seemed to like the idea. I told them about my recent excursions into the Airport Neighborhood and that I thought this would be an ideal place for our project. A concert of disbelief followed, as they replied, "You want us to go where?"
"The Airport Neighborhood, " I said. "How many of you have visited?" Silence. To ease their concern, I presented the Airport Neighborhood as a community in need of our support and services, and I emphasized that a good portion of their grade would come from participation in a variety of activities (community meetings, field work, mapping, archival research, landscape analysis, and so on) . Some raised concerns about doing research in an unfamiliar place. I assured the students that no one would be forced to carry out field work in a place where they were uncomfortable. I stressed the notion that together we would be embarking on a novel research project, since virtually no one had studied or written about the Airport Neighborhood since the publication of a 1935 dissertation. I followed with a brief overview of the district's social and economic condition, and shared images from my earlier field visits. By the end of class, no one asked to drop the course.
The class met twice a week during the semester, and during the first three weeks of the course, I allocated approximately half the time to project discussion and planning. One of our earliest discussions included a presentation by Service Learning staff. They gave an overview of the current service-learning activities at CSU Stanislaus and information about risk management, and they provided testimonials from other students who had participated in similar projects. The presentation was informative, but more importantly inspirational. Students began to see that their own participation could have an impact outside the confines of the University, and by the end of class they were eager to more clearly define the scope of the project and their individual contributions.
With momentum riding high, we scheduled the first class meeting with our community partner, Airport Neighbors United, Incorporated (ANU) . The three-hour visit included introductions and background information about the neighborhood, a guided tour of local parks and commercial and residential areas, and a lunchtime debriefing session. Our goal was to have all participants (students,
78 The Cal iforn ia Geographer • Volume 50, 201 0

-
faculty, and service-learning staff) meet with community partners to decide how best to connect the needs of the community with
course objectives. In other words, how could a group of fledgling
urban geographers apply their skills and knowledge to address community problems?
By the end of our meeting, we had generated a list of the mostpressing urban needs and community issues that could serve as a catalyst to student research projects. At the next class meeting, we reviewed the list and the weekend's events, and a lively discussion ensued about what could realistically be accomplished in the remaining ten weeks of the semester.
The project really got off the ground at the first meeting we had with ANU and they shared some of the difficulties people faced every day in their neighborhood. I could feel a spark pass through each one of us as certain topics were spoken of and once I saw the interest in the "younger" student's eyes I knew we could do something for "good" here. It was unanimously decided we would do what geographers do best: research, field work, and MAP! (Urban Geography Student CSBL reflective project essay)
The students agreed that the best way to proceed was to break into research teams, with each group taking on a research topic. They would gather resources and conduct research on a particular topic and periodically share the information with the larger group. Four research topics were selected: public transportation, commercial services, social services, and the cultural past and present. The overall goal was to provide visual representation of community assets and accessibility that would tell the untold story of the Airport Neighborhood and aid its endeavors to obtain fair representation in city and county government. Early on, students realized how little information exists about the Airport Neighborhood, thus a secondary goal emerged: to organize all project resources materials (photos, reports, newspaper articles, census and other statistical data) into an Airport Neighborhood archive. Ideally, the resources in the archive would serve as foundational materials for future student projects, as well as provide the community partners with a rich storehouse of easily retrievable information that could support their endeavors . Finally, a "chief cartographer" was selected to create base maps and thematic maps from the information gathered by each student research group.
Geographic Education 79

A multi-method approach including participant observation, interviewing, landscape analysis, mapping, surveys, analysis of census data, and archival research was devised for the overall research project. Each research team discussed its shared plan with the larger group using Blackboard and class presentations to facilitate the exchange of information. They were given feedback by other students and myself and revised their plans before engaging in field work. The Office of Service Learning was also included in these class discussions to assist with logistical matters and to respond to any risk-management issues.
By the fourth week of the semester, the research teams had clearly defined their individual and group tasks, and the project cartographer was busily constructing a base map and poster layout for the final product, an asset map of the Airport Neighborhood. The research teams gave themselves a mandatory deadline of three weeks (before spring break) to gather the information that would ultimately be ineluded in the poster. Class members regularly shared new materials or insights gathered from fieldwork at the beginning of each class. The level of student involvement and engagement noticeably increased during this time, and students who initially lacked initiative caught on that they would be expected to get things done. Frequently students would find they couldn't wait for the next class meeting, so they would show up in my office with the latest research "find." As information began to come in, two students were assigned the task of archiving (both electronic and hardcopy) all materials and posting the electronic versions on the class Blackboard site. During these discussions, they began to explore the themes of social, environmental, and transportation justice; they began to examine resource disparities and suggest ways in which such themes could be illustrated through mapping and cartographic display.
80
I had a chance to put my GIS skills to use for the improvement of a neighborhood in need. Mapping the needs and assets of Modesto Airport Neighborhood challenged my technical skills, my social ability, and my writing proficiency (Urban Geography Student CSBL reflective project essay) .
When the assignment started I didn't like the idea of having to do a group project, but once I saw how much everyone wanted to contribute, I knew this assignment was going to be something special. Everyone collected data, did write-ups, and gave their opinion on the direction of the poster board. It was exciting to see the project come together during the final weeks and to print
The California Geographer • Volume 50, 201 0
-

p
out the final poster (Urban Geography Student CSBL reflective
project essay).
As the multiple strands of the team research projects began to rnerge and take the shape of a single project, I challenged the class to present their work at the California Geographical Society (CGS) conference. While initially viewed as additional work, I pointed out that the work was already completed and that presenting at a
statewide conference would offer those who participated valuable
professional development opportunities. Furthermore, sharing the results of the project with a wider audience could indirectly advo
cate for the Airport Neighborhood-and similarly marginalized communities. The guidelines for the CGS conference poster submission were distributed in class. After reading through the criteria, three students volunteered to represent the group project at the conference. A draft abstract was shared and revised and ultimately submitted. Financial support for students to attend the conference came from two internal grants: the Dean's Teaching Initiative and a Service Learning Mini-Grant.
I really felt that for whatever reason, the stigmatization that had affected the Okies in the years past managed to have some sort of trickle-down effect and the people in this community were still fighting an uphill battle. Anything that I could do to help them, including carrying their message to the California Geographical Society's annual conference in Chico was worth doing (Urban Geography Student CSBL reflective project essay).
Public presentation of the Airport Neighborhood project was the next logical step, and one which provided an important capstone experience for students to situate their work among that of their peers in the broader geographic community. In a final, semester-end presentation, the students showcased their work at the ANU community center. The ANU community partners, Habitat for Humanity, local service providers, and a reporter from the local newspaper were invited to learn about the project and offer their feedback and advice on future projects.
After spending nine weeks on this project, students had not only developed the practical skills associated with urban-geographic analysis, but had also witnessed first-hand the connection between theory (geographic and service-learning) , method, and practice. Perhaps most importantly from a CSBL standpoint, the asset mapping project demonstrated how geospatial skills and community
Geog ra phic Education 8 1

l8
j

engagement through fieldwork can be applied to address community problems and advocate for change.
Mapping the community assets and needs allowed us to get firsthand experience in making proposals, gathering data, field work, research, creating tables and graphs, mapping, communicating and writing. These are all powerful skills and tools that will come in handy again in the future (Urban Geography Student CSBL reflective project essay).
Concluding Remarks and Reflection Many argue that service-learning is a necessary component of higher education. One often-stated benefit is that students acquire skills and knowledge via service-learning projects that better prepare them for their chosen professions. Moreover, service-learning projects tend to meet the needs of nontraditional students and provide the kind of out-of-class experiences in the community that positively influence student retention (Crump 2002, Dorsey 2001). Beyond these didactic considerations, service-learning projects offer opportunities to engage in participatory fieldwork that promote students' collaborations with one another and with faculty. Human and cultural geography have witnessed a resurgence of this type of pragmatic fieldwork, one that often emphasizes the use of geospatial technology and problemsolving and is informed by concerns for social justice (Graves 2003, Jackiewicz et al. 2005, Ives-Dewey 2008, Skop 2008).
Geographic Education 83

From my viewpoint, this project positively affected my teaching and my students' experience in the classroom and in their communities. Information gained through data gathering, meeting community members, and field research not only supported the creation of a valuable tool for community decision making, it aided my efforts to impress on students the importance of community involvement by talking with and learning from people who have different socioeconomic backgrounds, opinions, and perspectives. Taken together, the tasks and learning activities associated with the CSBL project furnished students with a real local example of how geographic knowledge and techniques can be put to use to revitalize neighborhoods and serve our communities.
Involving students in service activities that build connections with people from diverse socioeconomic backgrounds is likely to align with one or more institutional goals at two- and four-year campuses. With the University's desire to continuously be a contributing member of the larger community, creating a way for students to bring spatial technology to neighborhoods is an idea that satisfies many goals. One of the stated goals of the College of Humanities and Social Sciences, where Geography resides on my campus, is that students recognize and acknowledge their social responsibility and feel empowered to make lasting contributions in local communities. The Airport Neighborhood Project showed the real value of community-based mapping. It taught participants to see the problems of the community-and their solutions-in new ways. Because data presented in a map format is easier to understand, it is also easier to communicate to others. This is a particularly important point when working with a diverse group of people to identify and achieve shared goals.
I also began to develop a kinship of sorts with the Airport Neighborhood, as their ancestors were not unlike my own, rural farmers from the South/Southwest. Whatever the case, my perspective on this community was that they deserved to have a voice just like anyone else. They deserved to have access to government and governmental services like their fellow citizens (Urban Geography Student CSBL reflective project essay).
For any successful course, planning is important, and that is doubly true for a course with a CSBL component. I began making my initial contacts six weeks prior to the beginning of the semester. Service Learning staff set up initial meetings and often accompanied me on site visits. Their expertise and experience with diverse projects
84 The Cal ifornia Geographer • Volume 50, 201 0

proved essential to my avoiding many potential pitfalls. I concerned myself with themes and topics to explore with the class and they
helped point out logistical issues and coordinated meetings, arranged
for transportation, and sent press releases to local media.
While this initial CSBL project was successful, there are many challenges to consider. Several issues emerged during the semester and through post-course student feedback. First, research teams had difficulty scheduling meetings with ANU representatives and with each other. Second, many students had an initial aversion to work
ing in groups. A couple of students opted for tasks that required little or no time in the community (e.g., collecting online sources, organizing the archive) and therefore only indirectly experienced the rewards of CSBL. Ultimately, even the most ardent anti-groupwork student came around. In many cases, students mentored one another, turned to one another for help on specific tasks, and looked for ways to highlight particular strengths they could bring to the project. Each student found a particular niche. Some were ardent collectors and organizers; others became fact-checkers and problemsolvers. Near the end of the project, students were establishing their own lists of tasks, timelines, and due dates, and were coming up with solutions when some aspects of the project failed to work out as initially planned. They had to learn to select their best work to tell the story of the Airport Neighborhood. For some, that meant their particular piece had to be edited or greatly modified to create a coherent message for the final project.
I have never worked in a group setting before where everyone took his or her own piece, went and worked on it, brought it back to the whole . . . and it actually all came together. My previous experiences with groups led me to believe there were always slackers, always folks you had to stand on top of to get the information, but this class was different, and I commend all of my classmates (Urban Geography Student CSBL reflective project essay) .
Finally, early on it became clear that I would need to be comfortable with giving up some control as students took on more responsibility and ownership of the project. Often this meant a willingness to be flexible with the course schedule and the due dates to accommodate project demands.
I think you made it clear that the process was organic; that something would grow out of our initial meeting with ANU and
Geographic Ed ucation 85

Habitat, and that is exactly what happened. I never felt that you let us run off willy-nilly, but you also let us develop it. I don't think any of us knew what was going to be the final result of this project, but I do believe we have given ANU exactly what they wanted: a tool that they can use to secure grants and have a voice at the local government level (Urban Geography Student
CSBL reflective project essay) .
In spring 2009, another class of urban geographers expanded the work of the initial CSBL project. The first team continued to work in the Airport Neighborhood. Their efforts focused on residential tree planting and securing space for the renewal of a community garden project. A second research team began a new project in the City of Turlock that included the survey and reuse of upper-storey commercial space in the city's downtown. Both of the projects rely on a mix of methods, blending traditional techniques with geospatial skills, and learning through service to build better communities .
References Crump, Jeff. 2002. "Learning by Doing: Implementing Commu
nity Service-Based Learning. " Journal of Geography 101 : 144-1 52. Dorsey, Bryan. 2001 . "Linking Theories of Service-Learning and
Undergraduate Geography Education. " Journal of Geography 100: 124-132.
Graves, Steven. 2003. "Landscapes of Predation, Landscapes of Neglect: A Location Analysis of Payday Lenders and Banks." Professional Geographer 55 (3):303-3 1 7.
Ives-Dewey, Dorothy. 2008. "Teaching Experiential Learning in Geography: Lessons from Planning." Journal of Geography 107:167-174.
Jackiewicz, Edward, et al . 2005 . "Tales from a Tourism Geography Class." California Geographer 45:86-96.
Skop, Emily. 2008. "Creating Field Trip Based Learning Communities." Journal of Geography 107:230-235.
86 Th e California Geogra pher • Vol u me 50, 201 0

The Geographer's Viewpoint


p The Pacific Asian Financial Crisis,
Indonesian Forests, and "Us": Synthesizing a Multi-Perspective
Application of Massey's Space
] eft Baldwin Sonoma State University
"I've been working in Latin America for the past ten years . The people there asked me a question to ask you. They want to know if there's a direct relationship between their poverty and your wealth. " . . . It is a meaning
less exercise to talk about anybody's human rights if we don't talk about
that issue.
-Winona LaDuke, telling of a Maryknoll priest addressing an Exxon shareholders meeting (1992)
[H]ow does one have an imagination of a solidarity which isn't about solely the local? . . . what kinds of alternative geographies can you make that allow people to see the connections with say the people in the outskirts of Latin American cities, because their lives and ours are intimately related.
-Doreen Massey (1999, 53)
Abstract This article addresses an issue that is both a problem for society and an opportunity for geography. Increased by globalization, spatial distance and social complexity often obscure interconnections between citizens of the first world and distant and different peoples and places. While geography's spatial perspective and multiple subdisciplines offer tools that can clarify such interrelationships, our analytic perspectives do not explicitly direct researchers to do so. That the public desires such geographies is evident in the popular success of works by nongeographers, many of whom have served as keynote speakers at recent AAG meetings. This paper elaborates the relational ontology developed by Doreen Massey as a framework for combining several analytic perspectives in order to produce a narrative that explicitly identifies interrelationships between us/here/now with them/there/when. Specifically the paper draws from political ecology and economy, commodity chain analysis, cultural economy, and economic geography
The California Geographer 50, © 2010 by The California Geographical Society

perspectives. The research project itself is aimed at producing a narrative that traces the interrelationships between "us," the 1997 Thai financial collapse, the resulting wider Pacific Asian crisis, and its expression in Indonesia's forests. As the paper illustrates, through synthesis the analytic perspectives already in use by geographers can be used to clarify the intimacy and dialectic quality of relations across distance. The paper suggest that while finely focused geographic research is vital, in some instances a breadth of approach also is appropriate and useful.
Key words: Doreen Massey, relational ontology, Indonesian forests, Pacific Asian financial crisis, forest product commodity chains.
IN THEIR LIFE's woRK, these two authors, coming from rather different perspectives, share a concern for the declining or already miserable environments and life-opportunities faced by peoples who are often, though not always, spatially or socially distant from "us." Both authors are concerned with reversing the degradation of those lives and environments by changing "our" awareness. Both appeal to "us," the audiences of their speeches, a global elite whose access to financial, political, and cultural resources suggest at least some ability to change "our" practices and policies to benefit distant and different people and places.
Massey's call for "alternative geographies" in a sense challenges us to create relevance, to find ways to show connections across distance and difference. With its multidisciplinary and multiscalar potential, geography is well structured to provide that relevance. As a counter to the disjunctions created by globalization (Castells 1997) , a geographic perspective can potentially clarify such relationships and offer insights that matter to the general public, to educators, and to policy makers.1 However, while subdisciplinary geographic research continues to be well grounded and insightful, results too seldom find their way into public and policy consciousness.
My aim here is twofold. My first goal is to produce an overview of the Pacific Asian collapse and its expression in Indonesian forestlands (area inhabited by primary and secondary forests and plantations), and to clarify some of the connections between them/there/then and us/here/now. The initial crisis was triggered at highly localized, even embodied scales, but rapidly grew into a socioecological crisis that diminished the quality of life and environments for hundreds of millions of people in five countries. While the crisis had significant short-term impacts, it set in motion processes that continue
90 Th e California Geog rapher • Volume 50, 201 0

p to degrade forests and produce globally significant C02 emissions.
MY second concern is to develop a method <;>r framew�rk capable
of synthesizing research findings from across (and beyond) our dis
cipline that can be used generally to produce the sort of alternative
geographies Massey and LaDuke have called for.
In developing a multiscalar and transdisciplinary framework, I refer to Massey's conceptualization of place and space. In earlier work, Massey conceptualized "place" as a spatial identity, informed by unique and dynamic constellations of processes that interact simul
taneously and historically (1993, 1 994). Massey has consistently referred to those processes as geometries of power (1993, 2004) . In more recent work (2004, 2005), she also refers to expressions of power as "trajectories" or "stories." In For Space (2005), Massey explains that place may be understood also as the origin of new trajectories, as the author of new stories that may have the agency to affect other places. Places, then, are unique spatial identities where multiple trajectories are negotiated by human and nonhuman agents/ processes (2005, 141), which in turn author new trajectories. In this sense, place is dimensionless and ontologically dynamic. Massey's use of the term "place" is problematic in its difference from the way place has been conceptualized by geographers, particularly in our humanistic arc. Yet, given her careful development of a relational spatial ontology, Massey's construction of "place" has a certain internal consistency, and its use is perhaps preferable to introducing a completely new word, as no existing term encompasses her vision. Much less problematically, Massey explains that space is the simultaneity of stories so far, a multiplicity that can only be described partially (2005, also Thrift 1996) .
The story that follows is thoroughly geographical, yet it cannot be told satisfactorily through any one analytic perspective. Because Massey's relational ontology of place and space is not itself an analytic position, it allows and even invites a synthesis of perspectives. In the following analysis, I use Massey's framework to author one narrative of the Pacific Asian collapse, its legacy in Indonesian forestlands, and some of the connections between "them" and "us." I identify some of the crucial trajectories, and their authors, that demanded negotiation in particular places, at times by particular emplaced and variously scaled people. I follow newly authored trajectories to new negotiations in other places where still further negotiations author stories that often lead back to "us."
Baldwin: The Pacific Asian Financial Crisis 91

Geographers working through particular analytic perspectives are vital to this project. However, even those aimed at identifying connections across distance have not, by themselves, fully answered LaDuke and Massey's call. There is some truth in Lefebvre's charge that the normal practice of social science analysis tends to fragment space into "an ethnological space, a demographic space, a space particular to the information sciences, and so on ad infinitum . . . . continually abandoning any global perspective, . . . and so coming up with mere shards of knowledge" (1991 , 91)-the precise result that LaDuke and Massey ask to reform. Before beginning niy narrative, it is important to discuss, very briefly, some of the contributions that these important subdisciplines offer and some of the constraints they face in constructing integrative and connecting alternative geographies.
Subdisciplinary Contributions and Constraints Clearly some geographers understand political ecology to provide the sort of integrative approach Massey calls for (Walker 2005, Schubert 2005) . Interestingly, Blaikie and Brookfield's original "chain of explanation" method (1987) explicitly called for a story structure. The authors recommended that research begin with localized land producers and decision makers and follow influences upon their practices and decisions to more widely "scaled" actors. However, after just a few years, other political ecologists challenged the sufficiency of that approach (Greenberg and Park 1994) . Marxist (e.g., Michael Watts) and post-structuralist (e.g., Escobar 1995, Willems-Braun 1997, Demeritt 2002) influences often inverted the chain-of-explanation model so that analyses begin with various manifestations of global capitalism and trace their role in disenfranchising local producers. In each case, analyses identify arcs connecting empowered and often global or Western processes with disempowered and often remote places (Massey 2004) . However, such analyses seldom trace those stories back to "us" on either the front or back ends of the stories. Other political ecologists, working in what Walker (2005) calls a bio-physical rubric, do integrate multiple research approaches in order to vet knowledges (see Zimmerer and Bassett 2003, Bassett and Crummey 2003). While integrative and insightful, the resulting political ecologies again do not generally connect their stories explicitly back to "us," although they certainly could.
As the following case study highlights, political economy also lends insights into the Pacific Asian collapse. However, like political ecol-
92 Th e Ca l ifornia Geographer • Volume 50, 201 0

0gy, political economic analysis also tends to frustrate the identification and explication of specific connections between "us" and distant others. Marx's work has been criticized by some geographers (e.g., Gibson-Graham 1996) for reducing all of humanity into the categories of exploited workers or accumulating owners. Because capital is abstracted and labor depersonalized, this reduction devalues and obscures the historic agency of specific emplaced elites and levels the complexity of "our" connections, attending instead to disembodied and placeless structures.
commodity chain analysis explicitly transcends some of these scalar limits, illuminating connections between First World consumers and the conditions of production-including distant workers and environments Gackson 2002, Appaduri 1986) . In kinship with political economy, commodity chain analysis seeks to defetishize specific commodities to clarify the sort of interpersonal connections that Massey calls for. 2 The literature also suggests that consumers and workers may become empowered to change the character both of their connection and the conditions of production "over there" (Rothenberg-Aalami 2004) . However, as the following case study shows, there are many important connections that join "us" and "them," here and there, that do not involve commodity flows, and so may be outside the gaze of analysis.
Ethics have also been used to address interpersonal connections and obligations across distance (Corbridge 1993, Merchant 1996) . As Massey (2005, 187) observes, a Russian doll simile of ethics reflects an "everyday experience [which] suggests that favoring our nearest and dearest is a natural human sentiment" (also Smith 2000, 97). Feminist ethicists echo the commodity chain perspective in their argument that caring can overcome distance (Tronto 1993, Clement 1996, Friedman 1993, Merchant 1996) . However, several authors have observed that if the distant and "generalized other" can be made concrete and personalized, caring about may be transformed into a more immediate caring for (Benhabib, 1997, 1992, 1987; Forst 1997; Mohanty et al., 1991; Donovan 1993; though see Ang 1997, 60-61, and Mohanty in Moya 1997, 136-137). 1t is important to note that a lion's share of this discourse presumes that agency resides in global cores, while peripheral places and their inhabitants are disempowered (Sterba 1998, 57; also 2000; and Smith 2000, 93-109; Plumwood 2005). However, that perspective misses the fact that negotiations made in and trajectories arising from peripheral
Baldwin: The Pacific Asian Financial Crisis 9 3

places such as Indonesian forestlands can significantly impact "us, " the denizens of the privileged cores.
Hybridity (Whatmore 2002, Hinchcliffe 2001) and actor-network theory, or ANT (Callon 2002, Law and Hassard 1999) share Massey's relational ontology and are explicitly concerned with identifying all the participants (human and otherwise) in power regimes. Concerned with undoing limits of scale and dichotomous categorization, hybridity and network theory invites an examination of bio-physical processes through nodes and connections that are somewhat analogous to Massey's places and traj ectories. Also like Massey's ontology, ANT is not so much a theory as "a set of overlapping propositions intended to alter conventional thought and research [especially] regarding the relationships between those things we routinely think of as "social" and "natural" (Castree 2005, 23 1) . In this sense, ANT shares much with Massey's conceptualization of place and space. However, unlike Massey, hybridity perspectives do not mandate explications of how "we" and "they" are connected, though again,
. they certainly could.
Fleshing the Framework: The Pacific Asian Collapse, Declining Indonesian Forests, and "Us" The following case study focuses upon Indonesia's forestlands generally. Scholars have produced many excellent studies focusing upon specific peoples, places, and forests (e.g., McCarthy 2000a, Peluso and Watts 200 1 , Tsing 2005) . My aim here is to take a broad view of Indonesia's forestlands. At the scale of the nation-state, the two most significant processes in Indonesian deforestation are logging (legal and illegal) and conversion to palm-oil plantations. The discussion that follows focuses specifically on the acceleration of those processes associated with the various negotiations and trajectories arising from the 1997-98 Pacific Asian currency crisis. On a national scale, those negotiations precipitated a reordering of access to Indonesian forestlands. Throughout, the trajectories that tie "us" with "them" are emphasized. In the era prior to the collapse, certain cultural processes were central to the formation of distinct Pacific Asian capitalisms, as well as Western representations of the so-called "Asian miracle economies, " and so I begin with cultural economy analyses.
94 Th e Cal ifornia Geog rapher • Volume 50, 201 0

p cultures of Economies In the 1990s, the "cultural turn" in economic geography provided
valuable insights into the social relations that foregrounded the
pacific Asian financial crisis (Lee and Wills 1997, Sayer 1997, Yeung z001a, Crang 1997) . In addition to demonstrating that different cultural forms produce distinct forms of capitalism, cultural analysis of Pacific Asian economies help explain why financial liberalization created particular instabilities in those national financial systems.
specifically, in the mid-twentieth century South Korea endeavored to follow the model for industrialization pioneered by Japan. There, in the nineteenth century, Meiji-period planners partnered with
several great feudal families to form strategically managed industrial poles (zaibatsu), which continue today as Mitsubishi, Mitsui, and Sumitomo (Lincoln 1990). Similarly, in 1960 South Korean President Park's government helped several great families establish chaebol, highly paternalistic industrial conglomerates (e .g., Hyundai, Daewoo, Samsung, Hanjin, and LG) . As Japan used loans secured by the government to internally finance rapid industrialization, the chaebol also relied heavily upon government-directed loans from domestic banks. While Japan financed its Meij i industrialization through surplus value taken from its farming sector (Geertz 1963), Korean capitalists appropriated and reinvested surplus-value from industrial workers (Dicken 2004, Chang 1998, Gerlach 1992, Wade 1990) . In both countries, industrial expansion was also financed through a government-led and -backed banking system (Dicken 2004, Yeung ZOOOb, Chang 1998) . For the chaebol, that government lessened the risk presented by otherwise dangerously high debt-to-equity ratios. Though marked by violent unionization and democratization movements, between 1960 and 1995 Park's industrialization trajectory created the eleventh-largest national economy in the world. As with Japan, prior to the Clinton era South Korea's financial system remained relatively closed and protected from foreign connections that were and are imbued with power differentials.
In contrast, Southeast Asian economies were informed by distinct relational and personalistic business associations. As Chinese immigrants settled across Southeast Asia in the nineteenth and twentieth centuries, they reproduced four important econo-cultural forms or trajectories: family centered enterprise, government-client relationships, huiguan (commercial networks founded upon the home-place of members), and guanxi (a business culture of reciprocity consistent with Confucian social norms). Eventually these four forms were
Baldwin: The Pacific Asian Financial Crisis 95

enlisted by many of the governments in Southeast Asia as they organized post-independence national economies. Each of these has been negotiated in unique ways in each country/plac� (Backman 1999), but all work to produce personalistic economic structures that are antithetical to liberalist imaginings of legalistic and anonymous free-market economies (Yeung 2000b). Table 1 indicates the profound influence of the Chinese diaspora in pre-crisis Southeast Asian economies.
Ta ble 1 . Economic Power a m ong D iasporic Chi nese in Southeast Asia,
m id-1 990s (From Backm a n 1 999, 207; and Hatch and Ya mamura 1 996).
Total Population Ethi c Chinese Percent of Capital
Cou ntry (mil l ions) (% of tota l pop.) Controlled
Indonesia 201 3.5 70
Malaysia 20 29 60
The Philippines 73 2 55
Singapore 3.5 77 80
Thailand 60 1 0 75
Like Japan and South Korea, prior to the Clinton era the governments of the rapidly industrializing Southeast Asian countries had also maintained relatively closed financial systems. Like the Japanese model, government-directed banking protected domestic economies from more-powerful First World political economies, while also allowing an engagement with production for export (Dicken 1998). With that insulation, Southeast Asian governments were again able to finance industrial expansion through state-led bank debt. Again, like South Korea and Japan, throughout the 19 70s and 1980s, rising Southeast Asian economies generated "rapid capital accumulation at least in part on the basis of highly exploitative labor practices, especially on the part of women" (Glassman and Carmody 2001 , 79; see also Hart-Landsberg and Burkett 1998, 88) . It is also important to note that in distinction from North Atlantic capitalisms, the governments of the rapidly modernizing Pacific Asian economies explicitly directed flows of surplus value towards domestic investment that eventually benefited both citizen owners and citizen/workers.
Pacific Asian Discourses As the post-structural move in political ecology has so clearly demonstrated, analysis of discourse is central to understanding power and practices. In Massey's terms, discourses are also trajectories
96 The Califo rnia Geographer • Volume 50, 201 0

authored by emplaced actants and negotiated in specific places. There is a wide critical literature regarding Western representations and constructions of the Orient generally (Said 1978), and of Pacific Asia specifically as bureaucratically stagnant, decadent, and despotic (Lewis and Wigen 1997). With the success of ]apan and then Hong Kong, South Korea, Taiwan, and Singapore, an alternative Western discourse arose in which these potential threats to North Atlantic hegemony were referred to as "Asian tiger" economies. In the late 1980s, it also became apparent that Thailand, Malaysia, the Philippines, and Indonesia had avoided the debt crisis that had hobbled the rest of the developing world and were rapidly industrializing. These so-called "mini-dragons" were undergoing what the World Bank in 1993 called the "Asian miracle.'3
Recent proponents of globalization have added other trajectories. George H. W. Bush's 1990 Enterprise for Americas Initiative discursively equated the deregulation of markets and capital flows with prosperity (Kristof and Sanger 1999). Tailoring globalization to fit American Democratic Party sensibilities, President Clinton framed globalization as a political idealist strategy to build prosperity together. In a concerted effort to manifest globalization-which Clinton claimed was as inevitable and irresistible as gravity (in Massey 2005, 5)-the President established a so-called "war room"; a place where Commerce Secretary Brown coordinated efforts by the Commerce, State, and Defense departments, the CIA, and the President to win contracts for American firms, especially in "emerging markets" (Kristof and Sanger 1999). Through the "war room," the Clinton administration also pushed newly industrializing economies (or NIEs) to deregulate their financial markets. Clinton also created the National Economic Council as a counterpart to the National Security Administration and appointed Robert Rubin (former head of Goldman-Sachs, the largest Wall Street contributor to Clinton's 1992 campaign) to lead the agency Uones 1999). The discursive and practical result of those efforts became known as the "Washington consensus. "
Though Pacific Asian governments did begin to deregulate (liberalize/globalize) , other Southeast Asian leaders maintained alternative discourses. In 1996, Singapore's former Prime Minister Lee Kuan Yew stated:
[F]or America to be displaced .. .in the Western Pacific, by an Asian people long despised as decadent, feeble, corrupt and inept is
Baldwin: The Pacific Asian Financial Crisis 9 7

emotionally very difficult [for Americans] to accept. The sense of cultural supremacy of the Americans will make this adjustment very difficult to accept . . . . Americans believe their ideas are universal-the supremacy of the individual and free unfettered expression. But they are not-never were (in Gray 1998, 166) .
In very few words, P. M. Lee summarized the Western view of Pacific Asians and his view of that discourse, while also affirming a belief in the validity of explicitly relational Pacific Asian capitalisms.
The boosteristic discourse quickly changed as the collapse deepened in 1997. The relational capitalism that had guided rapid and stable economic expansion became "unbearable" to Westerners (Yeung 2000b, 191) . Economic discussants eschewed the collaborative business model they had once praised, renaming it "crony capitalism" -a sin for which the region must be punished (in Krugman 1998, 76). Some, such as Backman (1999) , added nepotism to cronyism as the cause of the collapse. Many Pacific Asian elites joined in with selfcondemnation. In 1998 the government of Singapore explicitly renounced guanxi (Poon and Parry 1999, 193); an editor for the Jakarta Post blamed regulations limiting foreign direct investment (FDI) from "enlightened" Westerners Qenkins 2001); others implied that only foreign ownership could bring efficiency and profitability to Indonesia's industry (Lingga 2001, for example) . The Indonesian reform discourse embraced the acronym KKN: Korrupsi, Kollusidan, and Nepotisme (corruption, collusion, nepotism) as shorthand for the cause of the collapse in Indonesia.
Overwhelmingly, expert opinion constructed the Pacific Asian collapse as arising from within the region as a result of "Asian" illiberalism. However, while much of the analytic financial literature concurs with that construction (e.g., Noy 2005) there are more geographically sophisticated explanations for the crisis . Both financial and Marxist perspectives provide insights into "our" connections with a crisis that both originated with and benefitted "us ."
Financial and Economic Geographic Analyses There is still no consensus among financial analysts as to what triggered the Pacific Asian financial crisis in 1997 (ibid. , Thanong Khanthong 2007) . However, there is considerable agreement regarding which financial trajectories were central to its unfolding. As the domestic, or "Asian" conditions were in place prior to globalization,
98 The Cal ifornia Geographer • Volume 50, 201 0

....
I describe those first, then discuss extraregional trajectories and possible triggers specific to Thailand.
Asian causes. Expert commentators generally agree that as Pacific Asian governments liberalized their economies, they lost the controls that had moderated the risks inherent to state-directed bank lending (Noy 2005, Khanthong 2007) . Those same policies that had encouraged "fiscal and monetary restraint . . . , high savings and investment rates, robust growth, and moderate inflation" (Moreno 1998, 1) became dangerous when national economies opened to First World credit and capital flows. The Korean chaebols' abnormally high debt-to-equity ratios became unacknowledged risk centers as the firms switched from government-guaranteed loans to credit from First World commercial banks that were both subject to currency fluctuations and punitive collection practices (Loong 1999) . Elsewhere, central banks were not equipped to track the new and much-larger capital flows, and in Indonesia the central bank cr�ti<;ally underestimated its required reserves (holdings in U.S. dollars) . The magnitude of foreign commer�ial debt increased rapidly as European banks shifted available credit away from sluggish domestic economies and toward Pacific Asia. Between 1990 and1996, commercial borrowing from foreign banks increased rapidly: from $18 to $74 billion in Thailand (equivalent to 30 and 65 percent of GDP (Pasuk and Baker 2000, 25), and from $ 1 6.6 to $51 . 1 billion in Indonesia (Hill 1999, 63).
Several governments (the Philippines, Malaysia, Taiwan, Hong Kong, and South Korean) sought an alternative form of stability by pegging the value of their currencies to the value of the U.S. dollar. Pegging encourages foreign investment by removing risks associated with currency value fluctuations. Perhaps due to inexperience or a trust in those currency pegs, many Pacific Asian corporate financial managers failed to hedge against currency devaluations, often keeping assets primarily in local currencies while debt to foreign lenders was denominated in U.S. dollars (Moreno 1998).
As Massey observes, just as there is power in making connections, there can also be power in prohibiting them (2005, Chapter 7). In accepting President Clinton's Washington Consensus, Pacific Asian governments dropped prohibitions to certain connections that had limited financial risk, and opened their economies to processes beyond their control. The resulting political economies at least partially precipitated a banking and social collapse that impacted
Baldwin: The Pacific Asian Financial Crisis 99

several hundreds of millions of Pacific Asians. "We" are related to its cause, and its effects.
First World causes . In addition to European bank credit, Western wealth flowed into capital and securities markets. In Thailand, a real-estate bubble attracted ever more investment. Small and large American investors entered Pacific Asian securities markets at the urging of experts such as Barton Biggs (of Morgan Stanley Dean Witter) , whose 1993 recommendation precipitated a seven-week, twenty-eight percent rise in the Hong Kong market index. In 1994, Biggs characterized Thai, Indonesian, and Hong Kong markets as the "best place in the world to be for the next five years" (in Kristof and Wyatt 1 999).
Trajectories authored and enacted by the G5 (representing the interests of the largest economies) also provoked local negotiations. In 1 985 the G-5 instituted the Plaza Accord, a project that devalued the U.S. dollar against the Japanese yen, increasing the effective costs of Japanese exports, while decreasing the relative cost of American exports and fueling the American economic expansion of the late 1980s (Brenner 2000, also Jameson 2000) . Though not intended, the program also fueled economic expansion in Pacific Asian NIEs. To circumvent the G-5, Japanese manufacturers rapidly increased investment in plants across Southeast Asia. In the early 1990s, South Korean and American manufacturers also established plants there to exploit cheap labor and complementarities with the Japanese plants (Park 2001, Dicken 1998). Between 1991 and 1997, total new FDI into Indonesia was valued at $22.4 billion, surpassed only by $23 .7 billion of FDI into Malaysia. Foreign firms also made capital investments totaling $ 1 5 .5 billion in Thailand, $ 1 1 .3 billion in South Korea, and $ 7 .6 billion in the Philippines over the same period (Hill 1 999, 36) .
In 1995, the G-7 instituted the Reverse Plaza Accord out of concern over a Japanese recession (Murphy 1996) . As the value of the U.S. dollar rose against the Japanese and European currencies, the value of Pacific Asian currencies pegged to the U.S. dollar also rose, and so did the relative cost of their exports (Brenner 2000). As a partial result, Thai exports, which had increased by twenty-three percent in 1995, were static in 1996, and the resultant increase in the Thai current account forced its central bank to sell some of its U.S. dollar reserves (Kristof and Sanger 1999) .4 In Indonesia, technocrats wisely anticipated a revaluation trap and loosened the rupiah's fixed peg
1 00 The Cal ifornia Geog rapher • Volume 50, 201 0

p to a "zone of variability," allowing a four- to five-percent change in value each year (Poon and Perry 1999).
Tipping points. Together, all of these trajectories pushed Pacific Asian NIEs toward bifurcation points-unstable negotiations in which a single new trajectory can cause a catastrophic change. There is gen
eral agreement that the region-wide collapse began in Thailand when
panicked Western investors began to sell off Thai assets. Though the trigger for the sell-off is contested, large American hedge funds have been implicated in that and in other cases where central banks have been forced to drop their currency pegs. Two American hedge funds (Soros' Quantum and Emerging Growth Funds and Tiger Management's Jaguar Fund) that benefited from the Thai currency devaluation almost certainly played a central role. Robert Johnson, Soros Fund manager from 1992 to 1995, describes the general process:
. . . the speculators call the bluff of the finance minister who's saying this is a fixed exchange rate for all time. It's the pressure that the speculators put on which says, "The markets don't think you can sustain it . . . . Defend the currency that you say is so vital ." That can go on so far, but a central bank might have $20, $50, $80 billion in the market that's daily volume is $600, $700 billion. And if everybody becomes focused on the same thing, $50 billion can disappear in an afternoon (in Jones 1999, 8-9).
If a hedge fund manager can inspire a sufficient number of speculative investors to sell assets from one country, the resulting panic can overwhelm a central bank's ability to soak up the excess supply of financial assets. Hedge funds can make money through so-called "short contracts" -agreements that commit financial operatives to exchange local currencies for US dollars at a set price at a designated future date. If the currency devalues in the interim, e.g., if the central bank breaks its currency peg, the hedge funds could buy Thai baht cheaply and sell them to the Bank at the agreed-upon and previously reasonable rate.
In the spring of 1997, Soros and Tiger management could not by themselves challenge Thailand's dollar peg. Together they constituted only about twenty to twenty-five percent ($5-7 billion) of all short contracts in the Bank's "future portfolio" (Fung and Hsieh 2000, IMF 1998). However, a few Fund managers, such as George Soros, have cultivated a widely held belief in their ability to anticipate or even move markets as a way of attracting investment. Evidence suggests that Tiger and Soros may have begun a sell-off by "talking
Baldwin: The Pacific Asian Financial Crisis 101

their book"-telling other traders that they anticipated a serious downturn (Corsetti, Pesenti, and Roubini 2002), thus moving an entire market, rather as Barton Biggs had done in 1993 and 1994, only this time downward.
However it began, the sell-off overwhelmed the Thai Bank. On a normal day in 1997, about $ 200 million in baht was exchanged in global markets. On May 1 3 and 14 the Thai central bank spent US$ 16.3 billion in an effort to soak up baht-denominated instruments flooding markets as Western financial investors sold their Thai assets (Kristof and Sanger 1999, Jones 1999) . Market demands forced the Thai government to drop its peg early in July, and the currency immediately lost eighteen percent of its value against the US dollar. That same month, the regionwide flight of Western capital forced the Philippines and Malaysia to drop their pegs as well (Dickie 1998). On August 14 the Indonesian central bank dropped its "zone of variation" and the rupiah began its devaluation, as illustrated in Figure 1 .
"' ::J ii > "" a> a> ... 0 <: .. � .. D.
120 ------------------------------------------------------------------------------------------------------------------------------------------------------ -----------------------------------------
100
80
60
40
20
0
\ - -�, / \ -.)(/ --···--···-······------.----·--···--······--···----······-· ········---------------------�\-----····---····-··--············· --------�---······----------------------
\ --:+-- United States -+- China \ . . � .................. .. -•- Indonesia ----.- l<orea
\ /
··--•----�---� �-.... --�-....
• ------------------------------------------------------------------------------ ------------------------•-"'"::· --------_-, L---- - --· -·---- ---------------------------'•'------------ -
-+-Thailand -+-- Malaysia --.. -+- Philippines - Singapore
June June June June June Sept. Jan. June June June June June 1993 1994 1995 1996 1997 1997 1998 1998 1999 2000 2001 2002
Figure I .-Pacific Asian Currency Values (time scale expanded during crisis onset period). Several Pacific Asian currencies lost thirty to fifty percent of their value in the last six months of 1997. The Indonesian rupiah lost eighty percent of its value during the same period. The rupiah's value remained severely depressed for several years afterward. China strategically devalued its currency in 1993, and manages its value carefully by not allowing its marketization (data from various issues ofiMF's International Financial Statistics).
1 02 The Cal ifornia Geographer • Volume 50, 201 0

Many American investors benefited from the Thai financial crisis.
Analysis by Corsetti, Pesenti, and Roubini (2002) suggest that So
ros' Quantum and Emerging Growth Funds built short baht positions
between February and May of 1997; that finding contradicts an
influential Financial Stability Forum Report (FSF 2000) . Analysis by pung and Hsein (2000) suggests that through those short contracts,
the value of the Soros' Quantum Fund increased by eighteen percent,
or $1 .6 billion, between April 1 and September 3, 199 7 . Soros has denied that he caused the collapse and cites his fund's poor performance for the year. In the end, a poor understanding of Western metageographies turned the hedge funds' profits to losses. Fund managers assumed that investors fleeing Thai markets would invest in the attractive markets in neighboring Malaysia and Indonesia. In those markets, the Soros funds built long-term positions to profit from anticipated rising currency and asset prices. Instead, Western investors, unable to distinguish one Pacific Asian NIE from another, moved capital from the region to North Atlantic markets. American analysts were reduced to using uncomprehending metaphors of "contagion" and "Asian flus" that smacked of eighteenth-century miasmal theories of disease.
That capital flight from Southeast Asia authored another financial trajectory that benefited "us ." Between June 1997 and June 1998, those capital flows put upward pressure on already advancing First World stocks. As a partial result, the U.S. equity market valuation increased by approximately $2 trillion (see Figure 2) .5 That increase in stock values resulted in approximately a $60 billion increase in U.S. consumer spending (Baker 1998) . President Clinton enjoyed the glow of a rising stock market and warming economies as "our" North Atlantic retirement funds swelled, and as millions of Pacific Asians slipped into poverty-from "their" mouths into "our" purses.6 A Marxist political economy perspective helps clarify additional connections between "our" wealth and "theirs ."
Marxist Analysis: New Geographies of Value Destruction In many ways the collapse confirmed geographers' earlier spatialization of Marxist political economic theory. After Marx, Harvey suggests that devaluation, falling profitability, and over-accumulation of capital work in concert to precipitate crisis (1982, xxiv and 190; also Smith 1984) . All three of these trajectories were co-present at the onset of the collapse (Smith 1998; Park 2001; Carmody 2001,
Ba ldwin: The Pacific Asian Financial Crisis 103

., 200 .a 180 � 160 :;; 140 � 1 20 :ii 100 ...., 80 � 60 � 40 � 20
National Stock Market Indices as Percentage of January 1 997 Value
o Jan-97 o Jul-97
a. 0 -jL-l'-"ll�.L...L-'-"""-P--l..-Malaysia Indonesia Korea Japan Germany Britain S and P NASDAQ
Figure 2.-Changes in market value of major regional equity markets, value at January 1 997 equals 100: 1997-1999. Changes in market equity value indicate sales and buying pressure. Markets in Indonesia, The Philippines, Thailand, Malaysia, South Korea, and Hong Kong lost $477 billion, while securities markets in Germany, Britain, and the United States increased in value by $3.2 trillion. (Data from Finandal Forecast Center; various issues ofThe Economist; and Kristof and Dunn 1999; the Japanese market is measured by the Nikkei 225, the British market by the FTSE, Germany's by the DAX index, and American New York Stock Exchange by the Standard and Poor's 500, and the technology-heavy NASDAQ market index.)
80; Kristof and Sanger 1999, 1 1; Dicken 1998). Marx (1976) clearly explains that economic crises and recessions are the inevitable result of the overaccumulation of value by capitalists. Harvey argues that through control of the international institutions of financial capital (1982, 441), First World capitalists have developed some ability to sequester devaluation crises away from global cores and away from the assets of global elites (ibid., 438).
For American elites, the International Monetary Fund (IMF) provided several benefits to First World capitalists. Its loans did work to stabilize fallen currencies, they reassured frightened investors and so eased the spread of the panic outside the region. They were also often timed so that active managers were able to sell investments before official announcements of policies that heralded deep devaluations (see also Jones 1999, 18; Smith 1998; Pollin 2000, 27; Merrifield 2000; Glassman and Carmody 2001; Pasuk and Baker 2000; Poon and Perry 1999). The structural adjustments tied to those loans benefited First World capitalists in other ways; one of which-the coerced agreement to drop prohibitions against the foreign ownership of firms-confirmed predictions by Marx (1969, 495; also 1967,
1 04 The California Geographer • Volume 50, 201 0

254) and Harvey (1982, 441) . Under that IMF mandate, Western
investors were able to buy Pacific Asian firms at fire-sale prices, ef
fectively channeling profits and available investment funds away
from local owners and to Western elites; i.e., from "them" to "us."
Table 2 suggests the magnitude of this process.
Table 2. Num ber of Firms Acquired by Foreign I nvestors Annually (from Zhan and Ozawa 2001 , UNCTD 2001 , Bende-Nabende 2002, Kang
2001 , and Chen 2000).
1 995 1 996 1 99 7 1 998 1 999 2000 I ndonesia 809 530 332 683 1 1 64 8 1 9 Malavsia 98 768 351 1 096 1 1 66 44 1 Korea 1 92 564 836 3,973 1 0,062 6,448 Thailand 1 61 2 34 633 3,209 2 0 1 1 2,569
A narrative note. As emplaced Pacific Asian governments and societies each negotiated the financial crisis and ensuing economic collapse in unique ways, they authored innumerable new trajectories. As my interests here lay with connections between "us" and Indonesian forestlands specifically, I identify and describe only trajectories that lead to such connections. The "financial" crisis shook all of Indonesian society. The story arc at this point could just as well follow the research of other geographers (e.g., Silvey 2001) along other trajectories/ Here I focus specifically upon negotiations of trajectories involving governance, the IMF, and the liberalization of Indonesian forests.
Indonesian Negotiations: from Currency Crises to Forest Destruction, and "Us" Though Southeast Asian currencies did stabilize eventually, that occurred only after significant devaluations, none of which were as severe or long-lived as Indonesia's . On the same mid-August day in 1997 that Thailand signed its first Letter of Intent with the IMF, the Indonesian government stopped managing the rupiah's value, hoping that allegedly rational market forces would recognize the fundamental soundness of the national economy and provide a soft landing (Hill 1999). Instead, as Figure 1 illustrates, the currency began a deep devaluation. Japan attempted a rescue through a newly endowed Asian Monetary Fund (AMF) but was stopped by U.S. Treasury Secretary Rubin, who enlisted European and Chinese support, claiming that the AMF would "undercut American interests and influence in Asia" and that Japan would "lend the money with-
· Baldwin: The Pacific Asian Financial Crisis 1 05

out insisting on tough economic reforms"; that is to say, without imposing liberalization (in Kristof and WuDunn 1999, 8) .
In September the Indonesian government asked the IMF for consultative service, and in early October they requested assistance. By late October, Indonesia's stock market began a decline that destroyed eighty percent of all value by the end of the year (see Figure 2) . On October 3 1 , the IMF announced a $38 billion standby loan agreement with Indonesia (Hill 1999) . At that point, the Indonesian rupiah had lost thirty percent of its mid-year value (Poon and Perry 1999) . The next day, sixteen Indonesian banks began liquidation. On November 3, the IMF outlined its first structural adjustment program (SAP) for Indonesia. In the next two months, the rupiah lost an additional fifty percent of its value. Ultimately the eightythree percent decrease in the rupiah 's value effectively increased the cost of all imports (e.g., food, fuel, birth control) and foreign loan interest payments 700 percent (ibid.) .
Structural adjustment programs have been widely criticized as violations of State sovereignty in their mandates over domestic policy. Initially, President Suharto was recalcitrant in his negotiations of IMF trajectories (Washington Post 1998, Hill 1999, Feridhanusetyawan 1999b, Paitoonpong 2001, Cameron 2001) . However, in the spring of 1998 Suharto was driven from office amid often violent protests over both his presidency and IMP-mandated cuts in rice and kerosene subsidies. Through the succeeding Habibe and Wahid presidencies, the IMF effected the liberalization of Indonesia's forests.
The Collapse, Forests, and "Us" Under President Suharto's "New Order, " the president used access to forestland resources (logs and land) to enlist the loyalty of otherwise fractious local and regional elites and military commanders. Through this personalistic network, Suharto both pacified opposition and helped Indonesian firms convert forested frontiers into financial capital-and in the Pacific Asian mold, directed that capital toward domestic investment catalyzing economic expansion. Suharto's failing, the social collapse, and IMF demands all projected new trajectories across Indonesia's forestlands. Emplaced Indonesians negotiated those stories and authored their own. Amid particularities of place, some commonality arose. In many rural places, forests served as shock absorbers as millions of newly unemployed urban workers turned to family farms for sustenance. 8 As a result, during the first two years of the crisis, the size of the average Indonesian farm
1 06 The Cal ifornia Geographer • Volume 50, 201 0

increased 0.28 hectares. While individually small (and temporary),
the aggregated loss of forest was about 1 .3 million hectares, or just
over 5,000 square miles (Pagiola 2000; Sunderlin et al. 2000, 22).
Fires. As Suharto's forest-access regime weakened in August 1997, human-caused forest fires proliferated. In the following month, 1 . 7
million hectares of forestlands burned. In late September, President suharto was able to mobilize the military sufficiently to partially enforce burning bans (Barber and Schweithelm 2000, 9) . Elites blamed the fires upon traditional swidden farmers and a strong El Nifio Southem oscillation (ibid., Samson 1998, Van Klinken 1998). Over the past three decades, ENSO episodes and increasing forestland desiccation due to the destruction and fragmentation of primary forests have led to ever more-severe fire seasons. However, in 1997-98 the fires were not set by traditional farmers. By geo-referencing remotely sensed ignition points, officials with Indonesia's Forestry Ministry found that only 0. 1 7 percent of fires set that summer originated on swidden plots (Waluyo 1998). The great majority of fires were set along the dry margins of plantations. There, commercial planters began to torch the adjacent lands worked by small farmers (often transmigrasi) to decrease the market price of land and allow plantation expansion (Barber and Schweithelm 2000, 32; Dauvergne 1998; Van Klinken 1998; Harwell 2000). In retribution, many small farmers also set fires amid plantations and commercial logging sites (McCarthy 2000a, 1 16; Wakker 1998; Vadya 1999; Colfer 2002).
By October 1997, IMF demands that Suharto cut payments to local civil and military officials completely unraveled President Suharto's forest -access regime (McCarthy 2000a, 1 1 7; Jim 1999; and Pagiola 2000). As a result, between July 1997 and June 1998, people burned ten million hectares (38,000 square miles) of lndonesian woodlandan area the size of Indiana. Those fires were unintended but very real negotiations of a trajectory authored intentionally by the IMF. In the face of that liberalizing trajectory, local communities/places negotiated rescaled forest-access regimes. Frequently, though, the liberalization of Indonesia's forests resulted in descaling, the creation of stateless spaces, and opened forestlands to foreign logging companies (mandated by the IMF) and newly emboldened illegal logging networks (McCarthy 2000b ). Some communities/places aware of the degradation of their water resource caused by legal and illegal logging resisted.9 Many others were enlisted by illegal logging networks, and the rate of deforestation increased rapidly (Sunderlin
Baldwin: The Pacific Asian Financial Crisis 1 07

et al. 2000, 1 7 and 26; Potter and Leslie 2001; Newman 2000; Barber and Schweithelm 2000) .
The fires of 1997-98 and ongoing deforestation have continued to author trajectories at many scales. Locally and regionally, logging, conversion of forests to plantations, burning, and forest fragmentation are causing increased seasonality, forest desiccation, flammability, and habitat loss (Field et al. 2009, McCarthy 2000a, Pagiola 2000, Dauvergne 1998, Brookfield et al 1995, Mackie 1984) . Removal of forests is also exposing soils to equatorial precipitation, resulting in the erosion of upland soils, much of which is then deposited in once-clear coastal waters. There, terrestrial sediment and nutrients degrade reef environments and associated fisheries. Indonesia's various forests had negotiated wet and dry seasons to author more moderate hydrologies; with their destruction, forestlands authored other trajectories (ibid.) .10 The smoke created by the fires directly killed 527 people (and 260 more in transportation disasters) and caused an estimated 300,000 cases of asthma, 1 .4 million cases of acute respiratory infection, and 7.2 million days of diminished productivity in Indonesia alone (SME 1998, Dauvergne 1998) . Furthermore, due to the very fine particulate ( <2.5 microns) produced by burning peat soils, carcinogenic polycyclic aromatic hydrocarbons are now embedded in the lungs of millions of Southeast Asians exposed to the smoke (Barber and Schweithelm 2000, 18) .
Forest deregulation has also allowed once-prohibited connections that have shifted most of the benefits of logging away from Indonesians. The IMF mandate to lift the ban on log exports has allowed the foreign appropriation of the wood products industry and its profits (Pagiola 2000, Carr 2001, McCarthy 2000b). Due to IMP-mandated open auctions for timber licenses, profits from state-sanctioned logging were rechanneled to the Malaysian and Singaporean elites, who bought nearly one million hectares of conversion licenses in Kalimantan, and to the German, Austrian, and Japanese investors courted by President Habibe to buy 40,000 hectare blocks of forest in Irian Jaya-Indonesian New Guinea (Pagiola 2000, Aditjondro 2001, Carr 1998) .
The post-Suharto forest regimes also have connections with "us" through the degradation of environmental or ecological services (MEA 2005) valued by Americans. Historically, Indonesia's forests have been notably bio-diverse, representing between ten and seventeen percent of all plant, bird, reptile, amphibian, and mammal
1 08 The Cal ifo rnia Geographer • Volume 50, 201 0

species (Collins 1991), and are the last refuges of rapidly declining orangutan and rhino populations-two particul�uly charismatic megafauna! species (Nellemann et al. 2007, Smits 1998) . As forests and peat soils burn in Indonesia, they release C02 into our atmosphere. In 1997 the Indonesian fires released as much C02 as all
industrial activity in North America. In 1998 fires released as much C02 as all of the European Union during the same period (Barber and Schweithelm 2000, 17; Samson 1998) .
Though burning for the sake of destroying value has been checked in Indonesia, burning and the release of C02 from Indonesian forestlands and into "our" atmosphere has increased significantly. In 2006 and 2007 Indonesia was the third-largest emitter of atmospheric C02, exceeded only by the U.S. and China (WRI 2009). Much of that carbon is released when forests are converted to palm oil plantations. In 2006 an estimated 3.5 billion tons of C02 was released from burning and desiccating peatland forests alone (Hooijer et al. 2006)---equivalent to nearly half the total release from the U.S. Ironically, plantation conversion is being driven by First World demand by "green" consumers for biodiesel. The idea that "we" can stop global warming by driving with biodiesel becomes obviously problematic once these connections are made clear. 1 1 These are precisely the sort of "alternative geographies" that Massey and LaDuke have called for.
Ongoing illegal logging and "us. " While commodity chain analysis does not explicitly encompass the sort of connections I've outlined above, it can be very useful in clarifying marketized relationships. Through the products Americans buy, "we" often become part of the trajectories authored by illegal logging networks operating in forests in Indonesia and throughout Asia. State-sanctioned timber concessions have increased rapidly in Indonesia since 1998 ( 1 1 .6 million hectares were sold in Irian Jaya in 2005 alone (Nellemann et al. 200 7)) . However, in the liberalized stateless spaces among Indonesia's forestlands, illegal logging has increased even more rapidly, and recently accounted for as much as eighty percent of all logging in Indonesia (World Bank 200 7) . In 1999, illegal logging began to exceed legal logging, clearing over one million hectares of forest (Currey et al. 2001) and costing the government $ 125 million in lost tax revenues (Indonesian Observer 2001). While illegal logging networks do provide jobs, local economies retain only onehalf to one-quarter of one percent of the final market value even of "boutique" hardwoods such as merbau and ramin (Newman and
Baldwin: The Pacific Asian Financial Crisis 1 09

Valentinus 2005, 17; Currey et al. 2001). Since 2000, as much as 2.8 million hectares (10,000 square miles) of Indonesia's forests have been lost each year to destructive illegal logging (Syumanda 2007).
The geographies of illegal logging have shifted over the past ten years. Initially, illegal log networks drew from forests in Kalimantan and Central Sumatra and fed mills in Malaysia and Singapore (Jakarta Post 2000a and 2000b; Currey et al. 2001). In the current decade, illegal logs have come increasingly from Irian Jaya. A majority of those logs are shipped to China for milling, often through Malaysian shippers. As Figure 3 illustrates, Chinese demand for log imports has risen dramatically over the past decade. This is due in part to a ban on domestic logging and, as Figure 4 suggests, rapidly
China's Share of Global Log Imports 45 ,.---,......,.-,......,._,......,.,__,_,__,_,......,.= 40 +...-........,;-........,;��........,;-'-�-'-........,;� 35 �---'-........,;........,;�........,;--........,;�--;�� 30 -f-'-.;;.,-........,;........,;�-'-�-'--'--'-���
i 25 ���,........,;........,;;;,;,_�-cc---........,;�........,;� ... a: 20 �........,;-""'-�'"--""'-�----,__,_ Q., 1 5
1 0 5 0 +-----��-r���--���--�����--��
1 994 1 998 2002 2006
Figure 3.-Soon after China instituted its domestic logging ban, log imports have risen rapidly and now dominate global trade in round wood (data from UNC 2007).
increasing production of wood based exports (UNC 2007, White et al. 2006, Newman and Valentinus 2005) .
As commodity-chain analysis has so clearly shown, through our purchases we also author trajectories that form intimate connections with distant places and people (see Jackson 2002, Hartwick 2000). As Figure 4 illustrates, if one buys wooden furniture, there is a good chance that it was manufactured in China, and if it was manufactured in China, there is a good chance that it incorporates illegally and/or unsustainably logged wood. Due to bribery, forged certification stamps (Newman and Lawson 2005, Curry et al. 2001), and porous borders, it is very difficult to trace or verify
110 The California Geographer • Volume 50, 201 0

Percent of\Vood Products lmJlortecl to the U.S. from
China by V;l lue
60 ,.---.------·-·---............ 50 t----�=:������ .-�����.�� -+- Furniture. baskets 40 +-���--------------�
� 30 +--;.,._,------------.:;"""""-1 u li; 20 +---............ --.�=-""-----1
� 1 0 f-"7"""���� 0 +---,.--�--..,..._-......... ....;...-1
2002 2003 2004 2005 2006
---- Plywood and veneers
Shingles. molding, wallboard
Figure 4.-Though China supplied about one-fifth of all furniture exports globally, Chinese manufacturers account for over one-half of wooden furniture to the United States (data from UNC 2007).
the extent of illegal log flows, or to discern whether your purchases are "sustainable." The magnitude of the illegal log trade is suggested by an Indonesian government seizure of 400,000 cubic meters of illegally harvested merbau logs in Irian jaya (three percent of the total annual international flow of logs) over two months in 2005. As a result, the quantity of merbau logs arriving in China fell by eighty-three percent (Newman and Valentinus 2005) . Data regarding log trade in Southeast Asia is problematic. In 2006, for example, Indonesia reported that log exports to China were valued at $841; the same year China reported imports from Indonesia valued at $ 7,426,053 (data from U.N. Comtrade 2007).
Efforts to regulate access to Indonesia's forests have been made at various scales. Indonesia has signed bilateral agreements with Malaysia and Singapore, and since 2001 it has promoted the now globally scaled Forest Law Enforcement and Governance panel, which seeks to end the tolerance of illegal log flows (White et al. 2006).12 However, in places across New Guinea, Borneo, Myanmar, and Siberian Russia, illegal logging has increased in the interim (Syumanda 2007, World Bank 2007), often driven by newly effective regulation elsewhere (Plafker 2006). International nongovernment organizations such as the Rainforest Action Network (RAN) and the Environmental Investigation Agency (EIA) have sought to raise awareness of tropical forest abuse at all scales, while the Forest Stewardship Council (FSC) has sought to certify wood products as "sustainable." While FSC's goals of increasing social and human capital among producing communities are commendable, it is unclear whether most wet, tropical forests can maintain integrity and function under any commercial Baldwin: The Pacific Asian Financial Crisis 1 1 1

logging regime. Due to its affinity for saturated peat soils, ramin cannot be commercially farmed. Logging also threatens to destroy numerous ecosystem services (natural capital), without which gains in human and social capital are clearly unsustainable. Problems of forgery aside, while an FSC stamp may help "us" feel good about "our" purchases, it seems valid to question whether FSC certification has been co-opted by green-washing campaigns designed to make "us" feel better about consuming. As the IKEA button in Figure 5 illustrates, consuming wood is still consuming wood, and that can never be as sustainable as not consuming wood.
PIN MADE FROM BEETLE KILL WOOD
Figure 5.-Using valuable wood to advertise that Ikea is conserving valuable wood (Earthprints 2009).
First World consumers have also been enlisted into trajectories meant to push log sourcing reforms. In 1999, for example, boycotts organized by the RAN garnered pledges from Home Depot, International Paper, Centex Homes, and Lanoga to seek sustainably logged wood (RAN 2003, Wilbert 2003). However, by the end of 2002, less than five percent of wood products sold by Home Depot were FSC certified (Goodman and Finn 2007). Such pledges are limited in many other ways. IKEA, which promotes a "green" image, obtains about one quarter of its furniture through Chinese manufacturers (IKEA 2009) . Though the firm has two foresters in China and three in Russian Siberia (the source of most of the wood used in Ikea products), Ikea acknowledges that only four percent of the wood from Chinese manufacturers is FSC certified (ibid.).
Final Thoughts We/here/now are interconnected with them/there/then. Through our consumption of new furniture and demand for supposedly low C02 biodiesel, we, and our friends and neighbors, contribute to the degradation of Asian forests, a loss of globally significant genetic diversity, and the destabilization of "our" climate. "Our" governments, both progressive and conservative, have worked to the benefit of
112 The Cal ifornia Geographer • Volume 50, 201 0

western elites whose wealth affects "our" national and very often
personal economies. President Clinton's campaign to too-rapidly
liberalize (now "deregulate" is in vogue) well-ordered and secure
pacific Asian banking systems opened whole national economies
to powers they could not control, yet which could destroy them.
president Clinton's program shifted hundreds of billions of dollars
of wealth from Pacific Asians to "us, " the stockholders of the North
Atlantic; and the American economy raged partially as a result.
This suite of connections, this alternative geography, cannot be fully conveyed using any one analytic perspective. I have had to synthesize the work of many researchers, geographer-s and nongeographers, for the purpose of explaining "our" connections to "them." Geography, as a disciplinary perspective, is well framed to allow some of "us" geographers to do this sort of multi perspective work.
This paper's contribution to geography goes to method and purpose. Massey has provided an ontological framework for constructing the sort of alternative geographies that the public, policy makers, and educators have clearly welcomed from the pens of Jared Diamond, Barry Lopez, William Cronan, Andrew Revkin, Barbara Kingsolver, and Michael Pollan. These are all authors who are not trained as geographers, yet are writing the most persuasive of geographies. Many geographers are also already well positioned to produce alternative geographies that tell of "our" connection with "them. " In authoring those stories, we can help our fellow citizens better understand the immediacy of "our" relationships with different and distant others. At the same time, we might enhance the appreciation of geography as a discipline and a perspective among our publics and our educational and policy experts.
Endnotes 1 There is considerable strategic interest in increasing the role of geography and geographers both in public education and policy formation (see Murphy 2007, 2006; Murphy et al. 2005; Johnston 2005; Martin 2001).
2 This approach is becoming increasingly, though still not widely, accessible. Patagonia Inc. (200 7), for example, has published a Web page that allows potential customers to trace the manufacture of a few of their products and critiques its own sustainability. This is a rather different treatment than Lands' End's campaigns, which seek to personalize its global commodity chains as adventures.
Baldwin: The Pacific Asian Financial Crisis 1 1 3

3 Some have argued that these metaphors are particularly meaningful: "miracle" connotes an act of God rather than the result of hard work and good management; tigers and dragons connote unpredictability, irrationality (the greatest sin in the Liberalist ethic), power, and "oriental" mystery, and therefore threat (on metaphor in Western discourse of Asia, see also Bernard and Ravenhill 1995, Demeritt 1994, Hart-Landsberg and Burkett 1998) .
4 Central banks maintain the relative value of domestic currencies by managing their supply. When currency values increase, central banks convert reserves (often kept in $US) to increase supply and check those increases. Conversely, when currency values rise, the banks sell domestic reserves to increase their supply and bring their relative value to desired levels.
5 Because all shares for a firm are valued at the most recent selling price, total market value changes do not reflect actual investment. Consequently, the variability of total market valuation magnifies the importance of current price trends. Thus, a firm with 100 shares valued at $10 each is said to indicate a market value of $ 1 ,000 . If, the next day, a single share sells for $ 1 1, all shares are simultaneously revalued and the firm if now represented to be worth $ 1 ,100.
6 There are many critics of the Clinton administration from the Left. Brenner (2000) observed that during this American market runup, real wages in the U.S. increased at only 0.5 percent per year, while in Germany and Japan, real wages increased at 3 .0 and 2.9 percent annually. In 1995, U.S. corporations enjoyed a pre-tax profitability unseen since 1973. For the working poor and nonsupervisory workers, real wages were actually lower during the Clinton era than under the previous five administrations. With wages held low, profits accrued to owners. In 1997, U.S. average corporate profit margins as a percentage of revenues reached a thirty-year high at 21 .6 percent (Follin 2000, 42; see also Mishel, Bernstein, and Schmitt 1999) .
7 For further research into social conditions and processes during the crisis, see Paitoonpong 2001; Yasmeen 2001; Pagiola 2000; Wetterberg et al., 1999, Feridhanusetyawan 1999a and 1999b, Frankenberg et al. 1999, Hill 1999, Jellinek 1999, Sandee 1999, Rigg 1997 .
8 Indonesian unemployment never rose above seven percent, despite the destruction of 5 . 1 million jobs-16. 7 percent of total formalsector jobs (Paitoonpong 2001, 8; Feridhanusetyawan 1999a, 66) .
1 1 4 The Cal ifornia Geographer • Volume 50, 201 0

9 One community's forest manager (kejuran blang) explained that when there is extensive logging in nearby state forests, "almost every wet season causes floods and water shortages for irrigation in the dry season" in the villages' hutan desa (forest) and kebun (village) gardens (quoted in McCarthy 2000b, 7) .
10 Calion argues that nonhuman processes may be understood as acting "autonomously" (1991)-an idea akin to Massey's assertion that nonhuman processes also negotiate existing, and author new trajectories.
1 1 Again, ironically, forest conversion to soy cultivation, another source of biodiesel, is a main driver of forest destruction in the Brazilian Amazon.
12 In part because ramin is now listed as a restricted commodity by the global Convention on International Trade of Endangered Species, yet remains in demand in the U.S., between August 2002 and July 2003, inspectors seized twenty-six shipments of ramin wood
from Singapore to Seattle alone (Register Guard 2003) .
References Aditjondro, G. ]. 2001 . "Suharto's fires. " Inside Indonesia 65 : 1 4-15 . Ang, I . 1997. "Comment on Felski's 'The doxa of Difference': the
uses of incommensurability." Signs 23 (1) :57-64. Apparduri, A. (ed.). 1986. The Social Life of Things. Cambridge:
Cambridge University Press. Backman, M. 1999. Asian Eclipse. New York: John Wiley. Baker, D., G. Epstein, and R. Pollin. 1998. "What's New in the
1990s." In Globalization and Progressive Economic Policy, ed. D. Baker, G. Epstein, and R. Pollin, 1-34. Cambridge: Cambridge University Press.
Barber, C. , and J. Schweithelm. 2000. Trial By Fire: Forest Fires and Forestry Policy in Indonesia's Era of Crisis and Reform. World Resources Institute.
Bassett, T. , and D. Crummey. 2003. African Savannas: Global Narratives and Local Knowledge of Environmental Change. Oxford: James Currey.
Benhabib, S. 1997. "On reconciliation and respect, justice and the good life." Philosophy and Social Criticism 23 (5) :97-1 14.
---. 1992. Situating the Self: Gender, Community and Postmodernism in Contemporary Ethics. Oxford: Polity Press.
Baldwin : The Pacific Asian F inancial Crisis 1 1 5

Benhabib, S. 1987. "General and concrete others . " In Feminism as Critique, ed. S. Benhabib and D. Cornell, 77-96. Cambridge: Polity.
Bernard, M., and ]. Ravenhill. 1995. "Beyond product cycles and flying geese: regionalization, hierarchy and the industrialization of East Asia." World Politics 4 7 : 1 71-209.
Blakie, P., and H. Brookfield. 1987. Land Degradation and Society. London, Methuen & Co.
Brenner, R. 2000. "The boom and the bubble." New Left Review 6:5-43.
Brookfield, H., L. Potter, and Y. Byron. 1995 . In the Place of Forest: Environmental and Socio-Economic Transformations in Borneo and the Eastern Malay Peninsula. Tokyo: United Nations University Press.
Calion, M. 2002. "Technology, politics and the market : an interview with Michel Callon, conducted by A. Barry and D. Slater. " Economy and Society 31 (2):285-306.
---. 1991 . "Techno-economic networks and irreversibility. " In A Sociology of Monsters: Essays on Power, Technology and Domination, ed. John Law, 132-164. London, Routledge.
Cameron, L. 2001 . "The impact of the Indonesian financial crisis on children: An analysis using the 100 village data. " Bulletin of Indonesian Economic Studies 3 7 (1):43-64.
Carr, F. 2001 . " Indorayon's last gasp ." Inside Indonesia 65 : 18-20. ---. 1998. "Mamberamo madness ." Inside Indonesia 55 :22-23. Castells, M. 1997. The Power of Identity. Blackwell, Oxford. Castree, N. 2005. "Is Geography a science?" In Questioning Geog-
raphy: Fundamental Debates, ed. N. Castree, A. Rogers, and D. Sherman, 57-79. Blackwell: Malden, MA.
Chang, H-J. 1998. "The role of institutions in Asian development." Asian Development Review 16 (2):64-95.
Clement, G. , 1996. Care, Autonomy, and Justice: Feminism and the Ethic of Care. Oxford: Westview Press.
Colfer, C. 2002. "Ten propositions to explain Kalimantan's fires." In Which Way Forward? People, Forests, and Policymaking in Indonesia, ed. C. Pierce and I. A. Pradnja Resosudarmo, 309-324. Washington D.C.: Resources for the Future.
Collins, M. 199 1 . The Conservation Atlas of Tropical Forests: Asia and the Pacific. New York: Simon & Schuster.
Corbridge, S. 1993. "Marxisms, modernities, and moralities: development praxis and the claims of distant strangers." Environment and Planning D: Society and Space 1 1 :449-472.
1 1 6 The Cal iforn ia Geographer • Volume 50, 201 0

Corsetti, G., P. Paolo, and N. Roubini. 2001 . "The Role of Large Players in Currency Crises: Working Paper No. 8303." National Bureau of Economic Research. www.eui/Personal/corsetti/reseach/ largeplayers [accessed May 2002] .
Crang, P. 1997. "Cultural turns and the (re)constitution of economic geography." In Geographies of Economies, ed. R. Lee and ] . Wills, 3-1 5. New York: Arnold.
Currey, D., F. Doherty, S. Lawson, J. Newman, and A. Ruwindrijarto. 2001 . Timber Trafficking Illegal Logging in Indonesia, South East Asia and International Consumption of Illegally Sourced Timber. Warwickshire, UK: Emmerson Press Telapak/EIA.
Dauvergne, P. 1998. "The political economy of Indonesia's 1 997 forest fires." Australian Journal of International Affairs 52 (1): 13-1 7 .
Demeritt, D. 2002. "What is the 'social construction of nature'? A typology and sympathetic critique." Progress in Human Geography 26 (6) : 767-790.
---. 1994. "The nature of metaphors in cultural geography and environmental history." Progress in Human Geography 18 (2) :1 63-185 .
Dicken, P. 2004. Global Shift: Transforming the World Economy, 4th Edition. New York: Guilford.
--. 1998. Global Shift: Transforming the World Economy, 3rd Edition. New York: Guilford.
Dickie, P. 1998. "The real culprit behind the Asian crisis." Asian Development Bank Review 30 (4):5-9 .
Donovan, J . 1993 . "Animal rights and feminist theory." In Ecofeminism, Women, Animals, Nature, ed. G. Gaard, 1 67-194. Philadelphia: Temple University Press.
Earth prints. 2009. IKEA Embraces Beetle Kill Wood. http://www. earthimprints.com/blog/IKEA [accessed May 3].
Escobar, A. 1995. Encountering Development: The Making and Unmaking of the Third World. Princeton, NJ: Princeton University Press.
Feridhanusetyawan, T. 1999a. "Social impacts of Indonesia's economic crisis: employment, income and poverty issues. " In Social Impacts of the Asian Economic crisis in Thailand, Indonesia, Malaysia and the Philippines, 47-86 . Bangkok: Thailand Development Research Institute.
---. 1999b. The Social Impact of the Indonesian Crisis: What Do We Know? Canberra: Australian National University.
Baldwin: The Pacific Asian Financial Crisis 1 1 7

Field, R. D. , G.R. van der Wert, and S.S.P. Shen. 2009. "Human amplification of drought-induced biomass burning in Indonesia since 1960." Nature Geoscience 2:185-188.
Forst, R. 1997. "Situations of the self: reflections on Seyla Benhabib's version of critical theory." Philosophy and Social Criticism 23 (5) : 79-96.
Frankenberg, E. , D. Thomas, and K. Beegle. 1999. The real Costs of Indonesia's Economic Crisis: Preliminary Findings from the Indonesia Family Life Surveys. Santa Monica, CA: Rand.
Friedman, M. 1993. What are Friends For? Feminist Perspectives on Personal Relationships and Moral Theory. Ithica, NY: Cornell University Press.
FSF (Financial Stability Forum) . 2000. Report of the Market Dynamics Study Group of the FSF Working Group on Highly Leveraged Institutions. www.fsforum.org/ Reports/RepHLI.html [accessed May 2008] .
Financial Forecast Center LLC. 2008. Business, Finance, & Economic Data http:/ /www.forecasts.org/ [accessed May 2008] .
Fung, W., and D. Hsieh. 2000. "Measuring the market impact of hedge funds." Journal of Empirical Finance 7: 1-36.
Geertz, C. 1963. Agricultural Innvolution: The Process of Ecological Change in Indonesia. Berkeley: University of California Press.
Gerlach, M. L. 1992. Alliance Capitalism: The Social Organization of Japanese Business. Berkeley: University of California Press.
Gibson-Graham, ]. K., 1996. The End of Capitalism As We Knew It: A Feminist Critique of Political Economy. Malden, MA: Blackwell.
Glassman, ] . , and P. Carmody. 2001 . "Structural adjustment in East and Southeast Asia: lessons from Latin America. " Geoforum 32 (1) :77-90.
Goodman, P., and P. Finn. 2007. "Corruption Stains Timber Trade: Forests Destroyed in China's Race to Feed Global Wood-Processing Industry." Washington Post Foreign Service Sunday, April 1 : AOl .
Gray, ] . 1998. False Dawn: The Delusions of Global Capitalism. London: Granta Books.
Greenberg, J. B . , and T. K. Park Thoma. 1994. "Political Ecology. " Journal of Political Ecology 1 (1) : 1-12.
Hart-Landsberg, M., and P. Burkett. 1998. "Contradictions of capitalist industrialization in East Asia: a critique of "Flying Geese" theories of development. " Economic Geography 74: 87-1 10.
Hartwick, E. 2000. "Towards a geographic politics of consumption. " Environment and Planning A (32) : 1 1 7 7-1 192.
1 1 8 The California Geographer • Volume 50, 201 0

Harvey, D. 1982. Limits to Capital. Oxford: Basil Blackwell. Harwell, E. 2000. "Remote sensibilities: discourses of technology
and the making of Indonesia's natural disaster, 1997-98." Development and Change 3 1 :307-340.
Hill, H . 1999. The Indonesian Economy in Crisis: Causes, Consequences and Lessons . New York: St. Martin's Press.
Hinchcliffe, S. 2001 . Indeterminacy in-decisions-science, policy and the politics of BSE." Transactions of the Institute of British Geographers 26:182-204.
Hooijer, A., M. Silvius, H. Wosten, and S. Page. 2006. PEAT-C02: Assessment of C02 emissions from drained peatlands in SE Asia. Delft Hydraulics report Q3943 .
IKEA. Social and Environmental Responsibility. http:/ /www.ikea. com/ms/en_ US/ about_ikea _new I about/read_our_materials/ ikea_se_brochure_english [accessed May 3, 2009] .
IMF (International Monetary Fund) . 1998. Hedge Funds and Financial Market Dynamics: IMF Occasional Paper no. 166. Washington, D.C.: International Monetary Fund.
IMF (International Monetary Fund) Statistics Department. 1993-2003. International Financial Statistics. Washington, D.C.: IMF.
Indonesian Observer. 200 1 . "Government losing revenues to illegal logging" (February 19).
Jackson, P. 2002. "Commercial cultures: transcending the cultural and the economic. " Progress in Human Geography 26:3-18.
Jakarta Post. 2000a. "Tracing Large scale Illegal Logging Business in Kalimantan" (May 23) .
---,. 2000b. "Illegal Logging Involves Central Government Officials" (August 19).
Jameson, F. 2000. "Globalization and political strategy." New Left Review 4:49-68.
Jellinek, L. 1999. "The new poor. " Inside Indonesia 57 :4-6. Jenkins, M. 2001 . "Local property is for all ." Jakarta Post (August
8) :4. Jim, C. Y. 1999. "The forest fires in Indonesia 199 7-98: Possible
causes and pervasive consequences." Geography 84 (3) :25 1-260. Johnston, R. 2005. "Geography-Coming apart at the seams?" In
Questioning Geography: Fundamental Debates, ed. N. Castree, A. Rogers, and D. Sherman, 13-38. Blackwell: Malden, MA.
Jones, S. 1999 Gune 29) . The Crash . Frontline: www.pbs.org/wgbh/ pages/frontline/shows/ crash/ect/script [accessed July 1999] .
Khanthong , T. 200 7. "Mini series on 1997 crisis. " The Nation, Bangkok, Thailand. http://www. nationmultimedia.corn/option/print.php?newsid=30038863 [accessed December 2007] .
Baldwin: The Pacific Asian Financial Crisis 1 1 9

Kristof, N., and D. Sanger. 1999. "How U.S. wooed Asia to let cash flow in." New York Times (February 16) : A1 , 10-1 1 .
Kristof, N., and S. WuDunn. 1999. "Of world markets, none an island." New York Times (February 1 7): A1 , 8-9.
Kristof, N., and E. Wyatt. 1999. "Who went under in the world's sea of cash." New York Times (February 15): A1, 10-1 1 .
Krugman, P. 1998. "Saving Asia: It's time to get radical. " Fortune 138 (5):75-80.
LaDuke, W. 1992. From Genocide to Resistance. Speech given at the University of Colorado at Boulder, April 21 .
Law, J . , and J . Hassard (ed). 1999. Actor Network Theory and After. Oxford: Blackwell.
Lee, R., and ]. Wills (ed) . 1997. Geographies ofEconomies. New York: Arnold.
Lefebvre, H. 199 1 . The Production of Space, trans. Donald Nicholson-Smith. Oxford: Blackwell.
Lewis, M., and K. Wigen. 1997. The Myth of Continents: A Critique ofMetageography. Berkeley: University of California Press.
Lincoln, E. 1990. "The Showa economic experience." Daedalus 1 19 (3) :191-208
Lingga, V. 2001 . "Stronger case for faster privatization." Jakarta Post (October 5): 6.
Loong, L. H. 1999. Towards Sounder International Finance. Monetary Authority of Singapore. www.mas.gov.sg/news_room/statements/1999 /Towards_Sounder_International_ Finance_29 _ Aug_1999.html [accessed August 1999] .
MEA (Millennium Ecosystem Assessment) . 2005. Ecosystems and Human Well-being: Synthesis. Island Press, Washington, D.C.
Mackie, C. 1984. "The lessons behind East Kalimantan's forest fires." Borneo Research Bulletin 16:63-74.
Martin, R. 2001 . "Geography and public policy: the case of the missing agenda." Progress in Human Geography 25 (2) : 189-210.
Marx, K. 1976. Capital: A Critique of Political Economy, Vol. 1 , trans. B. Fowkes. New York: Vintage.
---. 1969. Theories of Surplus Value, Volume 2, trans. R. Simpson. London: Lawrence and Wishart.
---. 1967. Capital: A Critique of Political Economy, Volume 2, trans. S. Moore and E. Aveling. New York: International Publishers.
Massey, D. 2005. For Space. Thousand Oakes: Sage. ---. 2004. "Geographies of responsibility." Geografiska Annuler
86 (B) :5-18.
120 The Cal iforn ia Geographer II Volume 50, 201 0

--. 1999. Power-Geometries and the Politics of Space-Time: Hettner-Lecture 1998. Heidelberg: Department of Geography, University of Heidelberg.
--. 1994. Space, Place, and Gender. Minneapolis: University of Minnesota Press.
--. 1993. "Power geometry and a progressive sense of place." In Mapping the Futures: Local Cultures, Global Change, ed. J . Bird, B. Curtis, T. Putnam, G. Robertson, and L. Tickner, 60-70. New York: Routledge.
McCarthy, ]. 2000a. "The changing regime: forest property and reformasi in Indonesia." Development and Change 3 1 :91-129.
--. 2000b. '"Wild logging': the rise and fall of logging networks and biodiversity conservation projects on Sumatra's rainforest frontier. " Occasional Paper Number 31. Jakarta: Center for International Forestry Research.
Merchant, C. 1996. Earthcare: Women and the Environment. New York: Routledge.
Merrifield, A. 2000. "Phantoms and spectres: capital and labour at the millennium." Environment and Planning D: Society and Space 8 (1) :15-36.
Mishel, L., ]. Bernstein, and J. Schmitt. 2001 . The State of Working America: 2000-2001 . Ithica: Economic Policy Institute.
Mohanty, C., A. Rosso, and L. Torres. 1991 . Third World Women and the Politics of Feminism. Bloomington: Indiana University Press.
Moreno, R. 1998. "What caused East Asia's Financial Crisis?" Federal Reserve Bank of San Francisco Economic Letter. www. Fsbsf. org/econrsrch/wklyltr [accessed Dec. 1999] .
Moya, P. M. L. 1997. "Postmodernism, 'Realism,' And The Politics Of Identity: Cherrie Morgana And Chicana Feminism." In Feminist Genealogies, Colonial Legacies, and Democratic Futures, ed. C. T. Mohanty and ]. M. Alexander, 125-150. New York: Routledge.
Murphy, A. B. 2007. "Geography's place in higher education in the United States." Journal of Geography in Higher Education 3 1 (1) :121-141 .
--. 2006. "Enhancing Geography's role in public debate." Annals of the Association of American Geographers 96 (1) : 1-13.
Murphy, A. B, H. ]. de Blij, B. L. Turner II, R. Gilmore, and D. Gregory. 2005. "The role of geography in public debate. Progress in Human Geography 29 (2) :165-193.
Murphy, R. T. 1996. The Weight of the Yen. New York: W. W. Norton.
Baldwin: The Pacific Asian Financial Crisis 1 2 1

Nellemann, C., L. Miles, B. P. Kaltenborn, M. Virtue, and H. Ahlenius (ed). 2007 . The Last Stand of the Orangutan-State of Emergency: Illegal Logging, Fire and Palm Oil in Indonesia 's National Parks. United Nations Environment Programme, GRID-Arendal, Norway.
Newman, ]. 2000. "Gutted by greed." Inside Indonesia 61 :24. Newman, ]. , and S. Lawson. 2005 . The Last Frontier: Illegal Logging
in Papua and China's Massive Timber Theft. Warwickshire, UK: Emmerson Press Telapak/EIA.
Newman, ]., and A. Valentinus. 2005. The Last Frontier: Illegal Logging in Papua and China's Massive Timber Theft EIA/Telepak, http:/ /www.eia-international.org/files/reports93-l . pdf [ accessec January 2006] .
Noy, I . 2005. "Banking crises in East Asia: the price tag of liberalization?" AsiaPacific Issues 78, November.
Pasuk, P., and C. Baker. 2000. Thailand's Crisis. Bangkok: Silkworm.
Pagiola, S. 2000. Deforestation and Land Use Changes Induced by the East Asian Economic Collapse. World Bank.
Paitoonpong, S. 2001 . "Social impacts of the Asian economic crisis in Thailand, Indonesia, Malaysia and the Philippines: synthesis report." TDRI Quarterly Review 16 (1) :3-14.
Park, B-G. 2001 . "Labor regulation and economic change: a view on the Korean economic crisis . " Geoforum 32 (1) :61-75.
Patagonia, Inc. 2007. The Footprint Chronicles. http:/ /www.patagonia.com/web/us /footprint /index.jsp [accessed November 2007] .
Peluso, N., and M. Watts. 2001 . Violent Environments. Ithaca, NY: Cornell University Press.
Plafker, T. 2006. "Crackdown drives illegal logging to neighboring nations." International Herald Tribune. Sunday, October 29, 2006. http:/ /www.iht.com/articles/2006 /10/29/business/rchinwood.php [accessed November 2006] .
Plumwood, V. 2005. "Toward a progressive naturalism." In Recognizing the Autonomy of Nature, ed. T. Heyd, 25-53. New York: Columbia University Press.
Pollin, R. 2000. "Anatomy of Clintonomics. " New Left Review 3 : 1 7-46.
Poon, ]. P. H., and M. Perry. 1 999. "The Asian economic 'flu:' a geography of crisis ." Professional Geographer 5 1 (2) : 184-196.
Potter, L., and S. Badcock. 2001. "Reformasi and Riau's forests." Inside Indonesia 65:16-1 7.
1 22 The Cal ifornia Geogra pher • Volume 50, 201 0

Purvis, M., and A. Grainger. 2004. Exploring Sustainable Development: Geographical Perspectives. Sterling, VA: Earthscan.
RAN (Rainforest Action Network). 2003. "Lumber and paper giants to announce ban of Indonesian wood and pulp." Old Growth Forest News May 15 . www.ran.org/ran_campaigns/oldgrowth/indonesia/ [accessed January 2004] .
Register Guard. 2003. "Illegal wood seized at Northwest ports." Eugene, Oregon Quly 6).
Rigg, J. 1997. Southeast Asia: The Human Landscape of Modernization and Development. New York: Routledge.
Rothenberg-Aalami, J. 2004. "Coming full circle? Forging missing links along Nike's integrated production networks." Global Networks 4 ( 4):335-354.
Sa'id, E. 1978. Orientalism. New York: Pantheon. Samson, M. 1998. "Clear skies ahead: preventing and mitigating
transboundary atmospheric pollution." Asian Development Bank Review 30 (3) : 1 1-13.
Sandee, H. 1999. "The impact of the crisis on village development in Java." Bulletin of Indonesian Economic Studies 35 (1) : 141-142.
Sayer, A. 1997. "The dialectic of culture and economy." In Geographies of Economies, ed. R. Lee and J. Wills, 16--26. New York: Arnold.
Schubert, J. 2005. Political Ecology in Development research: An Introductory Overview and Annotated Bibliography. Zurich: Swisspeace.
Silvey, R. 2001 . "Migration under crisis: household safety nets in Indonesia's economic collapse." Geoforum 32 (1) :33-45.
Smith, D. 2000. Moral Geographies: Ethics in a World of Difference. Edinburgh: Edinburgh University Press.
Smith, N. 1998. "El Nifio Capitalism." ·Progress in Human Geography 22 (2) :159-163.
---. 1984. Uneven Development: Nature, Capital and the Production of Space. New York: Basil Blackwell.
Smits, W. 1998. "They just want love." Inside Indonesia 56:30-31 . SME (State Ministry for Environment, Indonesia). 1998. Forest and
Land Fires in Indonesia. Vol. 1: Impacts Factors and Evaluation. Jakarta: UNDP.
Sterba, J. 2000. Earth Ethics: Introductory Readings on Animal Rights and Environmental Ethics, second edition. Upper Saddle River, NJ: Prentice Hall.
---,, 1998. /ustice for Here and Now. Cambridge: Cambridge University Press.
Baldwin : The Pacific Asian Financial Crisis 123

Sunderlin, W., A. P. Ida, E. R. Resosudarmo, and A. Angelson. 2000. "The effect of Indonesia's economic crisis on small farmers and natural forest cover in the outer islands." Occasional Paper Number 28(E). Jakarta: Center for International Forestry Research.
Syumanda, R. 2007. Destructive Logging and Deforestation WALHI, 28 Mar, 2007. http://www.eng.walhi.or.id/kampanye/hutan/ jeda/070328_deforest_cu/ [accessed May 2008] .
Thrift, N. 1996. Spatial Fonnations. London: Sage. Tronto, J. 1993. Moral Boundaries: A Political Argument for an Ethic
of Care .. London: Routledge. Tsing, A. 2005. Friction: An Ethnography of Global Connection.
Princeton, NJ: Princeton University Press. UNC (United Nations Comtrade). 2007. United Nations Comtrade
Database. http:/ /comtrade.un.org/db/ [accessed May 2008] . Vadya, A. 1999 . Finding causes of the 1997-98 Indonesian Forest
Fires: Problems and Possibilities. Jakarta: World Wide Fund for Nature Indonesia Programme.
Van Klinken, G. 1998. "Taking on the timber tycoons." Inside Indonesia 53:25.
Wade, R. 1990. Governing the Market: Economic Theory and the role of Government in East Asian Industrialization. Princeton: Princeton University Press.
Wakker, E. 1998. Introducing Zero-Burning Techniques in Indonesia 's Oil Palm Plantations. Jakarta: World Wide Fund for Nature Indonesia Programme.
Walker, P. 2005 . "Political ecology: where is the ecology?" Progress in Human Geography 29 (1) :73-89.
Waluyo, J . 1998. "Smoking gun." Inside Indonesia 53 :24. Washington Post. 1 998. "IMF unhappy with Suharto." January 8. Wetterberg, A. , S. Sumataro, and L. Pritchett. 1999. "A national
snapshot of the social impact of Indonesia's crisis." Bulletin of Indonesian Economic Studies 35 (3):145-152.
Whatmore, S. 2002. Hybrid Geographies: Natures, Cultures, Spaces Thousand Oaks, CA: Sage.
White A., X. Sun, K. Canby, J. Xu, C. Barr, E. Katsigris, G. Bull, C. Cossalter, and S. Nilsson. 2006. China and the Global Market for Forest Products: Transfonning Trade to Benefit Forests and Livelihoods. Forest Trends [accessed March 2006] .
Wilbert, T. 2003. "Environmental group targets Home Depot, G-P." Atlanta Journal Constitution May 15 .
1 24 The California Geographer • Volume 50, 201 0
Willems-Braun, B. 1997. "Buried epistemologies: the politics of nature in (post)colonial British Columbia." Annals of the Association of American Geographers 87:3-3 1 .
World Bank. 200 7. Forest Law Enforcement and Governance (FLEG) - East Asia & Pacific. http:/ /web.worldbank.org/WBSITE/EXTERNAL/COUNTRIES/EASTASIAPACIFICEXT /EXTEAPREGTOPENV IRONMENT/O,contentMDK:21093295-pagePK:340041 73-piPK: 34003 707 -theSitePK:502886,00.html [accessed May 2008] .
WRI (World Resources Institute) . "Indicators: Greenhouse Gas Emissions. " Climate Analysis Indicators Tool. http:/ /cait.wri.org/ cait.php?page=yearly&mode=view [accessed May 2009] .
Yasmeen, G. 2001. "Stockbrokers turned sandwich vendors: the economic crisis and small scale food retailing in Southeast Asia." Geoforum 32 (1) :9 1-102. ·
Yeung, H. W-C. 2000a. "Embedding foreign affiliates in transnational business networks: the case of Hong Kong firms in Southeast Asia." Environment and Planning A 32:201-222.
---. 2000b. "Guest editorial. " Environment and Planning A 32: 19 1-200.
Zimmerer, K. and T. Bassett. 2003 . Political ecology: An Integrative Approach to Geography and Environment-Development Studies. New York: Guilford.
Baldwin: The Pacific Asian Financial Crisis 1 25


Geographic Chronicles


201 0 Conference Report: Fullerton, California
by Robert Voeks, CSU Fullerton
The 64th Annual California Geographical Society Conference was held on the campus of California State University-Fullerton, April 30 through May 2, 2010. As this was the first assembly of the CGS in Orange County in its sixty-four-year history, the faculty and student club went all out to introduce participants to the largest CSU in the state (over thirty thousand students) and to the diverse cultural and environmental features that characterize this extra-Los Angeles region.
Roughly three hundred students and faculty and friends of geography attended. Given the seriousness of the state's fiscal situation, many colleagues were unable to travel to the meeting from distant locations. But their absence was compensated for, in part, by the waves of local community-college students who took advantage of the close proximity of the meeting. Friday field trips were dominated by walking tours, including " Authentic Suburban Roots: Downtown Fullerton" (led by Ray Young and Peggy Smith), "Downtown Los Angeles" (led by Mark Drayse), and "The Disney Resort" (led by Dan Walsh). Lei Xu led a reconnaissance of suburban Chinatown, highlighted by a vegetarian lunch at the Hsi Lai Chinese Buddhist Temple, and Peggy Smith piloted a flyover of Orange and Los Angeles Counties' spectacular coastline.
The traditional Friday barbecue and mixer was held at the Fullerton Arboretum. Orange County's "green jewel," wedged between the freeways and apartment complexes, proved to be a perfect meeting place for the conference. With succulent barbecue chicken and ribs supplied by Big B 's, a Fullerton landmark eatery, the conference was kicked off by a keynote address by CSU Fullerton professor Ray Young. With bellies full of barbecue, guests enjoyed Dr. Young's myth-busting exploration of the "real" Orange County, "Beyond the Newport Coast. " It turns out that, with over three million residents, Orange County is just as diverse as the rest of California and, contrary to public opinion, isn't the richest, whitest, or most conservative region of the state. Who knew?
The California Geographer 50, © 2010 by The California Geographical Society 1 29

Saturday featured a full slate of panels, papers, posters, and maps prepared and presented by geography students and faculty. A wellattended workshop titled "Using Remote Sensing for Environmental Research" was offered by Jindong Wu, and an especially timely panel discussion, "Why Geography Is Important for California's Future, " was organized by past CGS president Jennifer Helzer. The afternoon included a Presidential Plenary Presentation by Dean MacCannell, UC Davis Professor of Environmental Design and Landscape Architecture, titled "Looking through the Cornish Landscape." The talk was a thought-provoking exploration of the self and the other, the familiar and the unknown, as they both connect and disconnect humans with landscape. The evening was topped off by the annual Awards Banquet, at Roscoe's in historical downtown Fullerton. The clear spring skies of the outdoor event attracted over two hundred participants, with many students supported by the continued generosity of Bill and Marilyn Bowen. The Student Award Raffle, organized and run by CGS student reps Zia Salim and Alision McNally, was especially successful, bringing in much-needed funds to support student travel awards. A special thanks goes to all those who donated gifts to the event.
In addition to the many student awards for papers, posters, and maps, the CGS presents several special awards each year. This year's Outstanding Educator Award went to Irene Naesse, of Orange Coast College. Irene received this honor for her many years of service to the CGS, and for the inspiration she has provided to her many grateful students. This year's Friend of Geography Award went to Steve Koletty, who has been a long-time CGS supporter, and has advanced the cause of undergraduate geography at USC. Finally, this year's Distinguished Teaching Award went to Dayna Wells, who was recognized for her outstanding contributions to the California Geographical Alliance and for inspiring a love of geography among her fourth-grade students.
Sunday was set aside for recovery from the banquet and for field trips. This year featured a visit to the largest Vietnamese population outside of Vietnam, "A Taste of Little Saigon," led by Vienne Vu. Zia Salim introduced the cultural and political geography of Los Angeles's downtown mural-scape in his trip, "Street Gallery! A Los Angeles Mural Tour. " And for hardier souls, Jim Miller led a ninemile hike into the San Gabriel Mountains, allowing participants to burn some of the calories accumulated at Friday's feast.
1 30 The Ca l ifornia Geographer • Volume 50, 201 0

This year's conference went a long way toward dispelling some of the "blandscape" perceptions of Orange County. The Board thanks the Fullerton faculty who organized the conference, the yeomen's efforts of the field-trip leaders, and especially the CSUF student Geography Club, whose assistance was noted (and needed) at every event. Our venue for next year's conference is Bishop, gateway to the great "east side." Hemmed in by the High Sierra and the White Mountains, Bishop is a geographer's paradise. We hope to see you all there, April 29-May 1, and don't forget to bring your fishing poles!
Geographic Chron icles 1 31

California Geographical Society Award Winners 201 0
DAVID LANTIS SCHOLARSHIPS GRADUATE AWARD ($500) :
Rosamarie Rosen-Temple, UC Davis UNDERGRADUATE AWARD ($500) :
Elizabeth Bettencourt Machado, CSU Stanislaus
GEOSYSTEMS AWARD ($250) GRADUATE
Michele Tobias, UC Davis Do It Yourself Remote Sensing: Model Hot Air Balloon Remote Sensing of California 's Beach Vegetation
UNDERGRADUATE
Susannah Frantz, San Francisco State University Hydrogeomorphological Post-Fire Assessment of Crane Creek
TOM MCKNIGHT PROFESSIONAL PAPERS Graduate Papers FIRST PLACE ($ 150):
Bin (Owen) Mo, CSU Los Angeles GIS Network Analysis for Finding the Potential Metro Rail Ridership by Access Modes in Los Angeles County
SECOND PLACE ($ 125): Aline Gregorio, CSU Fullerton The Grey Areas of Green: Insights into Life and Conservation in Vila Picinguaba, Serra do Mar State Park, Brazil
THIRD PLACE ($ 100) : Jenny Novak, USC The Role of Place Attachment in One Foothills Community's Reaction to Wildfire
Undergraduate Papers FIRST PLACE ($ 150) :
Jade Dean, CSU Long Beach The Disturbance Regime of California Coastal Sage Scrub
SECOND PLACE ($ 125): Hannah Brown, Humboldt State University Ferndale's Saint Mary's Cemetery: Changes in Cultural Practices and Trends Through Three Time Periods, Reflected in the Landscape
1 32 The Cal ifornia Geographer • Volume 50, 201 0

THIRD PLACE ($ 100) : Areeya Tivasuradej, CSU Northridge Bicycle Commuting Assessment at California State University, Northridge
JOE BEATON PROFESSIONAL POSTER FIRST PLACE ($125) :
Jennifer McHenry, CSU Sacramento Images of Florin
SECOND PLACE ($100) : Cameron Burkett, USC Geography of Fear in Highland Park
THIRD PLACE ($ 75): Natasha Hanley/Melissa Moebius, CSU Stanislaus Caribbean Island Land Cover
PROFESSIONAL PAPER CARTOGRAPHIC FIRST PLACE ($125):
Reed Michaelsen, USC The Airlines of Small-Town America-Mapping the Essential Air Service System
SECOND PLACE ($100) : Ronald Lehman, USC Solar Facility Siting: Optimal Locations for Future Development of San Bernardino County, CA
THIRD PLACE ($ 75): Jacqueline Holmes, CSU Chico Parks of New Zealand
PROFESSIONAL PAPERS CARTOGRAPHY-DIGITAL FIRST PLACE ($125):
Zia Salim, CSU San Diego /UC Santa Barbara Murals, Maps, and Meanings: An Interactive Guide to Mural Art in Los Angeles
SECOND PLACE ($100) : Jan Eave Wan, USC Where Trojans Come From-Mapping the Recruits of the USC Football Program
THIRD PLACE ($ 75) : Lucas Biging, USC Waterfowl Habitat of the Pacific Flyway in California
Geographic Chronicles 1 3 3

STUDENT TRAVEL AWARDS ($ 150) Student Nominator Butterworth, Melinda Andrew Comrie (U Arizona) Davis, Brittany Sallie Marston (U Arizona) Flower, Aquila Dan Gavin (U Oregon) Hill, Gretchen Susan Hardwick (U Oregon) Kitson, Jennifer Kevin McHugh (Arizona State) Kusler, Jenn Dan Gavin (U Oregon) Lewis, Robin Jan Monk (U Arizona)
SPECIAL AWARDS FRIEND OF GEOGRAPHY AWARD:
Steve Koletty, USC OUTSTANDING EDUCATOR AWARD:
Irene Naesse, Orange Coast College DISTINGUISHED SERVICE AwARD:
(none offered this year) DISTINGUISHED TEACHING AWARD:
Dayna Wells, Park Western Place Elementary School
1 34 The Cal ifornia Geographer • Volume 50, 201 0

