the business case for data protection: what senior ... · sponsored by ibm ponemon institute©...
TRANSCRIPT

The Business Case for Data Protection: What Senior Executives Think about Data Protection
Sponsored by
IBM Independently conducted by Ponemon Institute LLC Publication Date: February 2012
Ponemon Institute© Private & Confidential Document

Sponsored by IBM Ponemon Institute© Private & Confidential Survey Page
1
The Business Case for Data Protection:
What Senior Executives Think about Data Protection By Dr. Larry Ponemon March 2012
Part 1. Introduction The steady occurrence of data breaches and attacks on sensitive and confidential information is making data protection a critical component of an organization’s leadership and governance strategy. What Senior Executives Think about Data Protection, conducted by Ponemon Institute and sponsored by IBM, was conducted to determine what corporate executives believe are the most important factors and activities to consider when safeguarding sensitive information and complying with increasing regulation, including the data breach notification laws that now exist in more than 45 states. This is the second study sponsored by IBM and conducted by Ponemon Institute to investigate what senior executives think about the value of corporate data protection efforts within their organizations. The research focuses on how aware CEOs and other senior executives are about their organization’s data protection efforts, what they believe is the economic justification for investment in a data protection program, how such efforts support organizational goals, and what are the major risks to sensitive and confidential data in the cloud. In this study, we surveyed 265 C-level executives, of whom 44 are CEOs, in organizations with a data protection and privacy program or initiative. This is an increase from the 213 C-level executives surveyed in the 2009 research. Some of the most interesting findings are: ! Ninety percent of senior executives surveyed say their company has had a data breach and
almost half (forty-eight percent) expect more data breaches to occur. ! Senior executives believe the most important information to safeguard is non-financial
confidential business information, typically stored as unstructured data. This is followed by intellectual property and business customer information.
! Senior executives concur that mobile devices in the workplace are putting sensitive and
confidential information at greater risk and they acknowledge that they are challenged to secure them.
! Thirty-nine percent of executives say their companies do not address security issues in
application development, waiting until the launch or post-launch phase. ! Seventy percent of organizations in this study use public, private and/or hybrid cloud
computing resources. Senior executives in organizations using cloud resources are more confident that their organization will not suffer a data breach in the next 12 months.
! Executives believe spending to achieve compliance with regulations is diverting spending
from IT security and is causing data to be less secure. ! Senior executives estimate that, on average, their organizations saved $19 million last year
as a result of data protection efforts. This is an increase from $16 million in 2009. The study reveals that in some areas of data protection senior executives are in touch with the threats to sensitive information, such as the use of mobile devices. In other areas, such as cloud computing, many senior executives do not acknowledge the increase in data protection risks that may be created. In addition, there are other indications that data protection is not a strategic imperative. Specifically, measures used to justify spending on data protection are after-the-fact,

Sponsored by IBM Ponemon Institute© Private & Confidential Survey Page
2
such as reductions in the cost of a data breach, rather than focusing justification on the serious impact of the theft or loss of valuable information assets.

Sponsored by IBM Ponemon Institute© Private & Confidential Survey Page
3
Part 2. Key Findings The following are what we believe to be the major findings in this study. We organized these findings according to six major themes that emerged: responsibility and accountability, perceived threats to sensitive and confidential information, perceived value of a data protection program, measuring the value of data protection, budgets and characteristics of organizations using cloud computing. The complete audited findings from this study are presented in the Appendix to this report, including a special analysis showing differences between organizations that are using cloud computing and those that have yet to use public, private and or hybrid cloud computing resources. Responsibility & Accountability Data protection responsibility most often resides within IT, and not within the privacy function. The majority (75 percent) of respondents say their organizations have one person responsible for data protection as shown in Bar Chart 1. This is a slight decrease from 2009 when 79 percent said this was the case. Bar Chart 1: Percentage of organizations with one person responsible for data protection
Typically the individuals most responsible for data protection are the chief information security officers (CISO) and chief information officers (CIO). This is understandable given the investments organizations are making in security technologies for data protection purposes.
75%
19%
6%
79%
21%
0% 0%
10%
20%
30%
40%
50%
60%
70%
80%
90%
Yes No Not sure
FY 2012 FY 2009

Sponsored by IBM Ponemon Institute© Private & Confidential Survey Page
4
Bar Chart 2 indicates the percentage of organizations that say their chief privacy officer (CPO) is most responsible for overall data protection has declined from 27 percent to 15 percent. Other executives most often selected as being responsible include the general counsel, cross-functional committees and chief marketing officers (not shown in the chart). Bar Chart 2: The person most responsible for an enterprise’s data protection efforts
Threats to Sensitive & Confidential Information Confidence in the ability to stop a data breach has declined. Ninety percent of organizations in this study had a data breach. It is not surprising that senior executives surveyed lack confidence in their organizations’ ability to stop a data breach. As shown in Bar Chart 3, only 8 percent are very confident their organizations will not suffer a data breach. This is a decline from 12 percent in the 2009 study. Almost half (48 percent) of the executives are concerned that more data breaches will occur, an increase from 41 percent in 2009. Bar Chart 3: Confidence in the ability to stop future data breaches
8% 9%
15%
31%
36%
13%
1%
27% 30%
27%
0%
5%
10%
15%
20%
25%
30%
35%
40%
CSO Other CPO CIO CISO
FY 2012 FY 2009

Sponsored by IBM Ponemon Institute© Private & Confidential Survey Page
5
It is interesting to note that concerns about cyber attacks have not increased. As shown in Bar Chart 4, 40 percent of senior executives say that in the past 12 months cyber criminals have rarely or never attacked their organization. This is similar to the last study when 39 percent say attacks happened rarely or never. Bar Chart 4: Frequency of cyber attacks in the past 12 months
Senior executives are most concerned about protecting non-financial, business confidential information. In 2009, senior executives were most concerned about protecting business customer information. In this year’s study, non-financial, business confidential information is considered most critical to the organization’s operations. As shown in Bar Chart 5, this information is the most difficult to secure. Often residing outside of traditional databases and data structures, a typical business or government organization stores many thousands of files containing sensitive non-financial data in shared folders on file servers
8%
23% 21%
48%
12%
24% 23%
41%
0%
10%
20%
30%
40%
50%
60%
Very confident Confident Somewhat confident Not confident
FY 2012 FY 2009
25%
20%
15%
35%
5%
31%
20%
10%
33%
6%
0%
5%
10%
15%
20%
25%
30%
35%
40%
Hourly or more often
Daily Weekly Rarely (less than one week)
Never
FY 2012 FY 2009

Sponsored by IBM Ponemon Institute© Private & Confidential Survey Page
6
and NAS devices. Examples of this unstructured data include electronic spreadsheets, PowerPoint and Word documents, audio files, videos, blueprints, software source code, instant messages, Web pages and so forth. Bar Chart 5 also reveals the increasing difficulty in securing intellectual property, an increase from 10 percent of respondents in 2009 to 36 percent in 2012. Information not considered as difficult to secure are: business customer information and customer or consumer information. We believe this is due to senior executives’ belief that compliance with Sarbanes-Oxley has succeeded in improving organizations’ safeguarding of financial data.

Sponsored by IBM Ponemon Institute© Private & Confidential Survey Page
7
Bar Chart 5: Types of data most difficult to secure (Two choices permitted)
Negligence and missing devices are the greatest threats to sensitive data. Employees and other insiders that are careless with data and the mobile devices entrusted to their care pose the greatest risks as shown in Bar Chart 6. Bar Chart 6: The source of greatest risk to sensitive data (Two choices permitted)
5%
15%
33%
36%
36%
45%
6%
16%
53%
51%
10%
38%
0% 10% 20% 30% 40% 50% 60%
Employee information
Financial, business confidential information
Customer or consumer information
Business customer information
intellectual property
Non-financial, business confidential information
FY 2009
FY 2012
11%
12%
13%
13%
16%
25%
28%
31%
43%
0% 5% 10% 15% 20% 25% 30% 35% 40% 45% 50%
Insecure disposal
Malicious insiders
Virus or malware
Mobile workforce
Web-based attack
Internet/social media
Insecure third party
Lost or stolen device
Negligent insiders

Sponsored by IBM Ponemon Institute© Private & Confidential Survey Page
8
Senior executives concur that mobile devices pose a risk. The majority (58 percent) of respondents say they are very concerned or concerned about the security of mobile devices used by employees and contractors. As shown in Bar Chart 7, 65 percent of senior executives believe mobile devices are becoming the primary computing platform for employees in their organizations and 67 percent view the risk of software on mobile devices differently from enterprise software. Bar Chart 7: Perceptions about the use of mobile devices in the workplace
Data continues to be at risk from insecure applications. As shown in Bar Chart 8, while the majority of organizations believe that they have a process for ensuring data security is built into new applications, 39 percent say security features are built in during the launch or post-launch phase and 33 percent do not know when security is addressed in development. Bar Chart 8: The phase of the development lifecycle when organizations build in security (More than one choice permitted)
65%
13%
22%
67%
12%
21%
0%
10%
20%
30%
40%
50%
60%
70%
80%
Yes No Unsure
Are mobile devices becoming the primary computing platform for employees?
Is the risk of software on mobile devices different from enterprise software?

Sponsored by IBM Ponemon Institute© Private & Confidential Survey Page
9
21%
35%
20% 19%
33%
0%
5%
10%
15%
20%
25%
30%
35%
40%
Design phase Development phase
Launch phase Post-launch phase Don’t know

Sponsored by IBM Ponemon Institute© Private & Confidential Survey Page
10
The Value of Data Protection What organizational goals are dependent upon good data protection practices? As shown in Bar Chart 9, despite the fact that ensuring regulatory and legal compliance is the top rated organizational goal dependent upon good data protection practices, it has decreased significantly from 2009 (a difference of 14 percent). Increasing or maintaining marketplace reputation and brand is the number two goal but also has decreased significantly from 58 percent. Goals that increased are preserving customer trust, safeguarding the infrastructure and enhancing information value. Bar Chart 9: Organizational goals that are dependent upon good data protection efforts (Two choices permitted)
5%
19%
33%
40%
50%
51%
18%
9%
15%
28%
58%
65%
0% 10% 20% 30% 40% 50% 60% 70%
Ensuring vendor compliance
Enhancing information value
Safeguarding infrastructure
Preserving customer trust
Protecting reputation
Ensuring regulatory compliance
FY 2009 FY 2012

Sponsored by IBM Ponemon Institute© Private & Confidential Survey Page
11
The most highly rated purpose of an enterprise data protection program is to stop the risk of a data breach. According to Bar Chart 10, the importance of stopping the risk of a data breach has increased from two-thirds in 2009 to roughly three quarters of respondents. Another highly ranked value is the improvement of information flows about key stakeholders, but that value decreased by more than 10 percent since the 2009 study. A slight increase was realized for the value of reducing operational inefficiencies by creating more efficient uses of data and improving the relevant information about customers and employees across national borders. Bar Chart 10: The value of a coherent and comprehensive data protection program (Strongly agree and agree responses combined)
As shown in Bar Chart 11, senior executives estimate that, on average, their organizations saved $19 million last year as a result of its data protection efforts. This is an increase from $16 million in 2009, while the data protection budget responses for the next 12 months show a flat or slightly declining investment (presented in Bar Chart 17). Bar Chart 11: Cost savings or revenue improvements as a result of data protection efforts this year. (extrapolated average of $19 million)
41%
47%
52%
53%
55%
73%
39%
56%
64%
51%
66%
67%
0% 10% 20% 30% 40% 50% 60% 70% 80%
Improves the flow of relevant information across national borders
Decreases risk of regulatory action and lawsuits
Increases brand or marketplace image
Reduces operational inefficiencies by creating more efficient uses of data
Improves information flows about customers, employees and others
Reduces or mitigates the risk of data loss or theft
FY 2009 FY 2012

Sponsored by IBM Ponemon Institute© Private & Confidential Survey Page
12
Measurements Measurements used to justify spending on data protection programs are most often after-the-fact and not proactive such as preventing customer turnover in the event of a data breach. As shown in Bar Chart 12, reduction in the costs associated with data breaches is the metric most used for justifying data protection expenditures but is not the preferred measure. Specifically, 56 percent say it is reduction in data breach recovery costs and 55 percent say it is reduction in fines and legal defense costs. Customer turnover and income protection are least used, 6 and 8 percent respectively. Bar Chart 12. Measures used to justify spending on data protection (More than one choice permitted)
0%
28%
37%
21%
10%
4% 2%
29%
43%
18%
7% 2%
0% 5%
10% 15% 20% 25% 30% 35% 40% 45%
Less than $2 million
$2 to $10 million $10 to $20 million
$20 to $30 million
$30 to $40 million
More than $55 million
FY 2012 FY 2009
!"#
$"#
%&"#
%!"#
&%"#
&'"#
(("#
(!"#
)"# %)"# &)"# ')"# *)"# ()"# !)"#
+,-./012#.,23/412#
#536/01#72/.168/3#
536219-:3;#.<1#49=,1#/>#6,-./012#:3>/2098/3#
?:3:0:@:3;#A/2B7=961#:31C6:136:1-#
536219-:3;#217,.98/3#
D2/.1683;#:3.1==16.,9=#72/71281-#
E1F,6:3;#=1;9=#F1>13-1#6/-.#
E1F,6:3;#F9.9#G2196<#6/-.-#

Sponsored by IBM Ponemon Institute© Private & Confidential Survey Page
13
Sixty percent of senior executives in this study believe they should be using asset protection, including the protection of intellectual properties as a metric. In fact this increased from 41 percent in the 2009 study. This is followed by asset performance, such as increasing the value of customer information. Using stock value as a metric increased from 3 percent to 15 percent. Bar Chart 13: Measures that should be used to justify spending on data protection (More than one choice permitted)
15%
30%
35%
45%
48%
52%
60%
3%
30%
32%
38%
48%
41%
0% 10% 20% 30% 40% 50% 60% 70%
Stock value
Reduction in data breach recovery costs
Reduction in fines and legal defense cost
Reputation management
Minimization of downtime and workplace inefficiency *
Asset performance, such as increasing the value of customer information
Asset protection, including the protection of intellectual properties
* FY 2009 survey did not contain this choice
FY 2009 FY 2012

Sponsored by IBM Ponemon Institute© Private & Confidential Survey Page
14
Cloud Computing Cloud users have different perceptions about data protection in their organizations. In our analysis, we thought it would be interesting to examine the different perceptions senior executives have about data protection if their organizations use public, private and/or hybrid cloud computing resources. The majority of organizations in this study (70 percent) have embraced the cloud. As shown in Bar Chart 14, these respondents are more likely to say that it has not changed data protection risk in their organizations (41 percent of cloud users vs. 21 percent of non-users) or that it has actually decreased data protection risk (14 percent vs. 7 percent). Bar Chart 14: Cloud users perceptions about data protection risks
23%
14%
41%
22%
56%
7%
21% 15%
0%
10%
20%
30%
40%
50%
60%
Increased data protection risk
Decreased data protection risk
No change on data protection risk
Unsure
Cloud Non-users

Sponsored by IBM Ponemon Institute© Private & Confidential Survey Page
15
We asked respondents to state their agreement to a series of attributes about the importance of a coherent and comprehensive enterprise data protection plan. We then analyzed the differences between cloud and non-cloud users. According to Bar Chart 15, cloud users in our study are more confident in their organization’s ability to avoid a data breach. They are more likely to see cloud computing as enabling the pursuit of new global business opportunities and increasing the quality and accuracy of information. Bar Chart 15: Different perceptions about the benefits of a comprehensive data protection program: cloud vs. non-cloud users (strongly agree and agree responses combined)
*&"#
(&"#
*$"#
(!"#
!%"#
%'"#
%H"#
%I"#
!$"#
&I"#
'&"#
'$"#
*'"#
*$"#
&'"#
'*"#
*("#
H("#
)"# %)"# &)"# ')"# *)"# ()"# !)"# H)"# $)"#
5072/41-#>/209=#;/41239361#/>#F9.9#72/.168/3#7/=:6:1-#
536219-1-#6,-./012#.2,-.#93F#F16219-1-#6,-./012#6<,23#
5072/41-#.<1#J/A#/>#21=1493.#:3>/2098/3#9G/,.#6,-./012-#93F#107=/K11-#962/--#398/39=#
G/2F12-#
L16219-1-#2:-B#/>#21;,=9./2K#968/3M#N31-#93F#=9A-,:.-#
536219-1-#G293F#/2#092B1.7=961#:09;1#
E1F,61-#.<1#6/-.#/>#F,1#F:=:;1361#:3#012;12-#O#96P,:-:8/3-#
536219-1-#.<1#P,9=:.K#93F#966,296K#/>#:3>/2098/3#
Q39G=1-#.<1#7,2-,:.#/>#31A#;=/G9=#G,-:31--#/77/2.,3:81-#
E1F,61-#/2#0:8;9.1-#.<1#2:-B#/>#F9.9#=/--#/2#.<1R#S:T1TM#F9.9#G2196<U#
+=/,F# V/3W,-12-#

Sponsored by IBM Ponemon Institute© Private & Confidential Survey Page
16
We calculated the extrapolated average of how much of the current data protection budget is allocated to securing data located or processed in the cloud. According to the results presented in Bar Chart 16, the average is 11 percent. Bar Chart 16: Percentage of the present data protection budget dedicated to securing data located or processed in cloud environments
Budgets & Spending Senior executives are divided as to whether their organization’s data protection budget is sufficient. On average, organizations plan to spend $3.65 million on data protection in the next 12 months and this is nearly unchanged from the previous study ($3.70 million). Fifty percent of respondents would like to see this amount increase on average about 34 percent. Fifty-five percent of this budget is spent on technologies such as application security, DLP and encryption. Bar Chart 17: Data Protection Budget for the next 12 months (000’s omitted)
11%
56%
24%
8%
1% 0%
10%
20%
30%
40%
50%
60%
Less than 5% 5% to 10% 10% to 20% 20% to 30% 30% to 40%
$3,651
$3,702
$3,620
$3,630
$3,640
$3,650
$3,660
$3,670
$3,680
$3,690
$3,700
$3,710
FY 2012 FY 2009

Sponsored by IBM Ponemon Institute© Private & Confidential Survey Page
17
More organizations blame spending on compliance initiatives for diverting resources from other security initiatives. In 2009, only 8 percent of respondents said spending on compliance initiatives this was a problem. This year the percentage increased to 36 percent. Fifty-eight percent say this is putting the organization at risk. Data breach notification laws, PCI and Sarbanes Oxley are the regulations most organizations in the study cited. Bar Chart 18: Spending on compliance diverts resources from other security initiatives (yes responses)
36%
58%
8%
50%
0%
10%
20%
30%
40%
50%
60%
70%
Spending on compliance initiatives is diverting resources from other security
initiatives
This is causing our data to be less secure
FY 2012
FY 2009

Sponsored by IBM Ponemon Institute© Private & Confidential Survey Page
18
Part 3. Conclusion Do senior executives see the importance of data protection? While the answer is yes, it is qualified. Based on survey results, the following are the key perceptions of senior executives surveyed: ! There is increasing risk from the expansion in use of mobile devices and the fact that they are
becoming the primary computing platform in the workplace. ! There is an acknowledged need to safeguard the critical infrastructure, and to protect
unstructured data and intellectual property. ! They recognize that customer trust and loyalty is dependent upon good data protection
practices.
Areas that should have a higher priority among senior executives include the following: ! The importance of consistent and well understood processes to secure applications in the
design phase to prevent future data breaches. ! An assessment about how the move to the cloud may be affecting data protection risks. ! The costs and risks of continued use of after-the-fact measures to determine the value of
data protection. ! A better understanding of the risks posed by cyber criminals. In this study, many senior
executives believe cyber attacks are considered to occur rarely or never. Understanding the perceptions senior executives have about data protection is helpful to those in organizations who must make the business case for investing in people, process and technologies to prevent the loss or theft of sensitive and confidential information.

Sponsored by IBM Ponemon Institute© Private & Confidential Survey Page
19
Part 5. Methods This study was conducted over a two-month period concluding in December 2011. CEOs and other very senior executives were recruited to participate in this study.1 The final survey sample consisted of 265 executives who work various industry sectors. Table 1 Representative (judgmental) sample FY 2012 FY 2009 Initial US executive panel 9,062 9,776 Revised US executive panel 4,312 4,980 Final US executive panel 3,019 2,893 Final sample 265 213 Response 2.9% 2.2% Table 2 Approximate position level of respondents FY 2012 FY 2009 Chief executive (CEO) 44 30 Chief operating officer (COO) 34 22 Division presidents, GMs & EVPs 103 89 CIO 33 27 Other C-level executives 50 45 Total 264 213
Pie Chart 1 reports the sample distribution by industry classification. As shown, the largest segments include financial services (17%), retail (12%), technology and software (10%) and industrial (10%). Pie Chart 1. Sample distribution by Industry segments
1 By design, C-level respondents who were not CEOs were no more than two steps away from the CEO or Chairman level in their organizations.
17%
12%
10%
10% 9%
8%
7%
6%
4%
4%
4% 3%
3% 3% Financial services
Retailing
Industrial
Technology & software
Hospitality & leisure
Healthcare
Professional services
Consumer products
Services
Communications
Transportation
Education

Sponsored by IBM Ponemon Institute© Private & Confidential Survey Page
20
Table 3 reports the organization’s worldwide headcount, showing that 22 percent have more than 5,000 employees. Table 3 Worldwide headcount FY 2012 FY 2009* Less than 50 14% 15% 50 to 500 20% 18% 500 to 1,000 20% 19% 1,001 to 5,000 24% 26% 5,001 to 25,000 16% 15% 25,001 to 75,000 5% 6% More than 75,000 1% 1% Total 100% 100%
*FY 2009 data were recalculated to fit the revised question. Table 4 reports the geographic footprint of participating organizations. Table 4 Operating locations FY 2012 FY 2009 United States 100% 100% Canada 63% 61% EMEA 65% 63% APJ 51% 57% LATAM 48% 42% Total 327% 323%
Table 5 reports the frequency of companies that are publicly traded on NYSE, NASDAQ, or other exchanges. Table 5 Is your company publicly traded? FY 2012 FY 2009 Yes, NYSE 15% 16% Yes, NASDAQ 21% 20% Yes, overseas exchange 5% 5% Yes, other minor exchange 6% 5% No 53% 54% Total 100% 100%

Sponsored by IBM Ponemon Institute© Private & Confidential Survey Page
21
Please contact [email protected] or call us at 800.887.3118 if you have any questions.
Ponemon Institute
Advancing Responsible Information Management Ponemon Institute is dedicated to independent research and education that advances responsible information and privacy management practices within business and government. Our mission is to conduct high quality, empirical studies on critical issues affecting the management and security of sensitive information about people and organizations.
As a member of the Council of American Survey Research Organizations (CASRO), we uphold strict data confidentiality, privacy and ethical research standards. We do not collect any personally identifiable information from individuals (or organization identifiable information in our business research). Furthermore, we have strict quality standards to ensure that subjects are not asked extraneous, irrelevant or improper questions.

Sponsored by IBM Ponemon Institute© Private & Confidential Survey Page
22
Appendix: Detailed Survey Results
Part 1. Awareness about your organization’s data protection efforts. Frequencies Q1. Does your organization have a data protection and privacy program or initiative? FY 2012 FY 2009 Yes 255 205 No (stop) 5 2 Not sure (stop) 5 6 Total 265 213
Remainder of the survey results are presented in a percentage frequency format Q2a. Is there one person responsible for the overall data protection effort within your enterprise? FY 2012 FY 2009 Yes 75% 79% No 19% 21% Not sure 6% 0% Total 100% 100% Q2b. Who is most responsible for the overall data protection effort within your enterprise? FY 2012 FY 2009 Chief information officer (CIO) 31% 30% Chief information security officer (CISO) 36% 27% Chief privacy officer (CPO) 15% 27% Chief security officer (CSO) 8% 13% Data protection officer (DPO) 0% 2% Other 9% 1% Not sure 1% 0% Total 100% 100%
Q2c. What is the organizational level that best describes the position level of your organization’s data protection leader? FY 2012 FY 2009 SVP/Executive 0% 2% Vice President 12% 15% Executive Director 17% 16% Director 26% 25% Manager 31% 30% Associate/Staff 14% 11% Other 0% 1% Total 100% 100% Q2d. Is this a full time position? FY 2012 FY 2009 Yes 68% 73% No 28% 27% Not sure 4% 0% Total 100% 100%

Sponsored by IBM Ponemon Institute© Private & Confidential Survey Page
23
Q2e. Who else in your organization is responsible for data protection? Please check the other executives within your organization who are responsible for data protection. FY 2012 FY 2009 Chief Financial Officer 23% 11% General Counsel 65% 62% Chief Information Officer 50% 51% Chief Information Security Officer 26% Compliance Leader or Officer 35% 43% Chief Marketing Officer 40% 29% Human Resources VP 38% 36% Chief Security Officer 11% 16% Chief Risk Officer 30% 22% Cross-functional committee 52% 54% Other 5% 0% Not sure 6% 5% Total 381% 329% Q3. What types of data are most critical to your organization’s operations? Please rank order the following list from 1 = the most critical information to 6 = your least critical information. FY 2012 FY 2009 Customer or consumer information 3.40 2.86 Business customer information 2.87 2.21 Employee information 4.09 3.66 Financial, business confidential information 2.89 3.21 Non-financial, business confidential information 2.30 3.75 Intellectual property 2.49 2.30 Average 3.01 3.00 Q4. What types of data do you believe are most difficult to secure within your organization? Please check the top two choices. FY 2012 FY 2009 Customer or consumer information 33% 53% Business customer information 36% 51% Employee information 5% 6% Financial, business confidential information 15% 16% Non-financial, business confidential information 45% 38% intellectual property 36% 10% Other data (please specify) 3% 0% Total 173% 174% Q5a. Has your company ever experienced a data breach (defined as the loss of any sensitive or confidential information)? FY 2012 FY 2009 Yes 90% 82% No 10% 18% Total 100% 100% Q5b. How confident are you that your organization will not suffer a data breach in the next 12 months? FY 2012 FY 2009 Very confident 8% 12% Confident 23% 24% Somewhat confident 21% 23% Not confident 48% 41% Total 100% 100%

Sponsored by IBM Ponemon Institute© Private & Confidential Survey Page
24
Q6. In the last 12 months, how often has your organization’s data been attacked by cyber criminals? FY 2012 FY 2009 Hourly or more often 25% 31% Daily 20% 20% Weekly 15% 10% Rarely (less than one week) 35% 33% Never 5% 6% Total 100% 100% Q7. What is the source of greatest risk to your sensitive data? Please select only two responses. FY 2012 FY 2009 Negligent insiders 43% Malicious insiders 12% 6% Virus or malware attacks 13% Exposed via Internet/social media 25% 7% Exposed via insecure third party including cloud providers 28% Hacker/cyber criminal attacks 16% 12% Insecure disposal of hard/soft files 11% 22% Lost or stolen mobile devices including smartphones, tablets and others 31% 25% Mobility of the workforce 13% Other 1% 0% Don’t know 2% Total 195% Q8. How concerned is your organization about the security of mobile devices used by employees and contractors? FY 2012 Very concerned 23% Concerned 35% Somewhat concerned 18% Not concerned 15% Unsure 9% Total 100% Q9. Does your organization view the risk of software on mobile devices differently from enterprise software? FY 2012 Yes 65% No 13% Unsure 22% Total 100% Q10. In your opinion, are mobile devices becoming the primary computing platform for employees in your organization. FY 2012 Yes 67% No 12% Unsure 21% Total 100% Q11a. Does your organization use public, private and/or hybrid cloud computing resources? FY 2012 Yes 70% No 17% Unsure 13% Total 100%

Sponsored by IBM Ponemon Institute© Private & Confidential Survey Page
25
Q11b. How has the use of cloud resources affected data protection risks within your organization? FY 2012 Increased data protection risk 33% Decreased data protection risk 12% No change on data protection risk 35% Unsure 20% Total 100% Q12. In your opinion, would the use of cloud resources compromise your organization’s ability to meet regulatory mandates for privacy and data protection around the globe? FY 2012 Yes 34% No 40% Unsure 26% Total 100% Q13. Please select from the following list of organizational goals that are dependent upon good data protection efforts? Please select only two choices. FY 2012 FY 2009 Decreasing employee turnover 0% 2% Enhancing the value of information assets 19% 9% Ensuring business partner or vendor compliance 5% 18% Ensuring regulatory and legal compliance 51% 65% Increasing customer trust and loyalty 40% 28% Increasing or maintaining marketplace reputation and brand 50% 58% Safeguarding critical infrastructure 33% 15% Other 0% 0% Total 198% 197%
Very important & important Q14. Based on the organizational goals listed above, how important is collaboration between data protection and other business functions within your organization? FY 2012 FY 2009 Legal 67% 71% Information technology 67% 60% Privacy office 43% 59% Finance & accounting 55% 56% Risk Management 56% 52% Records management 25% 51% Information security 62% 50% Security 46% 50% Compliance 52% 48% Public relations 26% 45% Internal audit 30% 44% Human resources 28% 39% Marketing & communications 46% 34% Procurement 20% 29% Government or public affairs 25% 23% Logistics 9% 10% Sales 18% 2% Other 0% 0% Total 675% 724%

Sponsored by IBM Ponemon Institute© Private & Confidential Survey Page
26
Very important & important Q15. Following are typical business activities for organizational data protection efforts. Please rate the importance of each action. FY 2012 FY 2009 Developing a data protection strategy for the organization 64% 75% Training employees, temporary employees and contractors 60% 71% Reducing potential security flaws within business-critical applications 65% 70% Establishing and managing a crisis management, disaster management, and business continuity plan 54% 66% Identifying and responding to data breach (loss or theft) 64% 65% Conducting due diligence on transactions and relationships that involve the sharing of personal and confidential information 45% 64% Protecting personal or confidential information shared with vendors, business partners and other third parties 44% 57% Ensuring record retention requirements are met 35% 56% Monitoring new legal and regulatory requirements 56% 56% Preventing cyber and malicious insider attacks 47% 54% Conducting data vulnerability or privacy impact assessments for new products 38% 48% Auditing business processes for compliance with data protection and privacy policies 29% 47% Mapping data flows and conducting a data inventory 25% 46% Implementing customer access and redress programs 32% 43% Deploying enabling data protection technologies 45% 42% Creating policies and SOPs for the handling and use of personal information 25% 41% Complying with employee data protection and privacy laws 26% 39% Analyzing data collection, use and sharing 24% 39% Complying with marketing data protection and privacy laws 46% 37% Implementing employee access and redress programs 26% 35% Responding to e-discovery requests 33% 29% Performing background checks on employees, temporary employees and contractors 26% 18% Safeguarding information in cloud environments 46% Securing employee and contractor mobile devices including apps 52% Securing the existing (legacy) applications in your organization 49% Average 42% 50% Q16. Does your organization have a process for ensuring data security is built into new applications? FY 2012 Yes, a standardized process 25% Yes, a non-standardized process 26% No 35% Don’t know 14% Total 100% Q17. Where in the application development lifecycle does your organization build in security features? (Please check all that apply.) FY 2012 Design phase 21% Development phase 35% Launch phase 20% Post-launch phase 19% Don’t know 33% Total 128%

Sponsored by IBM Ponemon Institute© Private & Confidential Survey Page
27
Part 2. About your organization’s data protection efforts Strongly agree & agree Q18. Does a coherent and comprehensive enterprise data protection program increase your organization’s value? Please rate your level of agreement. FY 2012 FY 2009 Reduces or mitigates the risk of data loss or theft (i.e., data breach). 73% 67% Improves information flows about people such as consumers, customers, business partners and other stakeholders. 55% 66% Increases brand or marketplace image. 52% 64% Decreases risk of regulatory action, fines and lawsuits. 47% 56% Reduces operational inefficiencies by creating more efficient uses of data. 53% 51% Increases customer trust and decreases customer churn. 38% 45% Improves formal governance of data protection policies. 33% 40% Improves the flow of relevant information about customers and employees across national borders. 41% 39% Increases the quality and accuracy of information. 29% 38% Improves IT processes because of a better data governance structure. 37% 38% Increases our suppliers’ accountability to our data protection and privacy policies. 26% 37% Enables the pursuit of new global business opportunities. 37% 36% Reduces the cost of due diligence in mergers & acquisitions. 20% 32% Reduces potential risks under e-discovery laws. 18% 25% Increases employee trust and decreases employee churn. 9% 13% Average 38% 43%
Q19. Please rate each value proposition based on importance to your organization. FY 2012 FY 2009 Decreases risk of regulatory action, fines and lawsuits. 44% 55% Enables the pursuit of new global business opportunities. 46% 36% Improves formal governance of data protection policies. 43% 41% Improves information flows about people such as targeted consumers, customers, business partners and other stakeholders. 70% 65% Improves IT processes because of a better data governance structure. 41% 37% Improves the flow of relevant information about customers and employees across national borders. 42% 37% Increases brand or marketplace image. 65% 62% Increases customer trust and decreases customer churn. 49% 45% Increases employee trust and decreases employee churn. 9% 13% Increases our suppliers’ accountability to our data protection and privacy policies. 33% 35% Increases the quality and accuracy of information. 31% 37% Reduces operational inefficiencies by creating more efficient uses of data. 68% 52% Reduces or mitigates the risk of data loss or theft (i.e., data breach). 69% 48% Reduces potential risks under e-discovery laws. 28% 24% Reduces the cost of due diligence in mergers & acquisitions. 19% 32% Average 44% 41%

Sponsored by IBM Ponemon Institute© Private & Confidential Survey Page
28
Part 3. Measures for success Q20. What objective measures are used to justify spending on data protection within your organization? Please choose all that apply. FY 2012 Income protection 8% Asset performance, such as increasing the value of customer information 12% Asset protection, including the protection of intellectual properties 23% Customer turnover 6% Employee turnover 0% Income performance, such as a more effective marketing campaign 11% Minimization of downtime and workplace inefficiency 16% Reduction in data breach recovery costs 56% Reduction in fines and legal defense cost 55% Reputation management 21% Stock value 0% Don’t know 0% Total 208% Q21. What objective measures should be used to justify spending on data protection efforts within your organization? Please choose all that apply. FY 2012 FY 2009 Income protection 8% 11% Asset performance, such as increasing the value of customer information 52% 48% Asset protection, including the protection of intellectual properties 60% 41% Customer turnover 12% 15% Employee turnover 2% 1% Income performance, such as a more effective marketing campaign 15% 13% Minimization of downtime and workplace inefficiency 48% Reduction in data breach recovery costs 30% 30% Reduction in fines and legal defense cost 35% 32% Reputation management 45% 38% Stock value 15% 3% Other 0% 0% Don’t know 0% 0% Total 322% 232% Q22. Please state whether or not each one of the following objective measures is being used to justify your organization’s data protection efforts today. FY 2012 FY 2009 Asset performance, such as increasing the value of customer information 7% 8% Asset protection, including the protection of intellectual properties 21% 15% Customer turnover 9% 19% Employee turnover 0% 0% Income performance, such as a more effective marketing campaign 23% 16% Income protection 5% 3% Minimization of downtime and workplace inefficiency 26% Reduction in data breach recovery costs 54% 41% Reduction in fines and legal defense cost 42% 35% Reputation management 18% 11% Stock Value 3% 4% Average 19% 15%

Sponsored by IBM Ponemon Institute© Private & Confidential Survey Page
29
Q23a. Approximately (gut feel is okay), what is the dollar range that best describes your organization’s budget for data protection next year (12 months from now)? FY 2012 FY 2009 Less than $100,000 5% 6% Between $100,000 to $200,000 8% 9% Between $300,000 to $400,000 2% 3% Between $500,000 to $1 million 16% 21% Between $2 million to $3 million 29% 27% Between $4 million to $5 million 25% 21% Between $5 million to $10 million 11% 6% Between $10 to $20 million 2% 3% Between $30 to $40 million 1% 3% Between $50 to $60 million 1% 1% More than $60 million 0% 0% Total 100% 100% Extrapolated value $3,651 $3,702 Q23b. Is the budget for data protection adequate? FY 2012 FY 2009 Yes 50% 56% No 50% 44% Unsure 0% 0% Total 100% 100% Q23c. If no, how much would you like to see it increased? FY 2012 FY 2009 More than 50% 20% 14% Between 40 and 50% 18% 17% Between 30 and 40% 23% 18% Between 20 and 30% 22% 14% Between 10 and 20% 14% 21% Less than 10% 3% 15% Total 100% 100% Extrapolated percentage 34% 30% Q24a. Is spending on compliance initiatives diverting resources from other security initiatives? FY 2012 FY 2009 Yes 36% 8% No 43% 64% Unsure 21% 28% Total 100% 100%
Q24b. If yes, is this causing your data to be less secure? FY 2012 FY 2009 Yes 58% 50% No 31% 43% Unsure 11% 7% Total 100% 100%

Sponsored by IBM Ponemon Institute© Private & Confidential Survey Page
30
Q25. Approximately (gut feel is okay), what percentage of the present data protection budget is dedicated to such technology solutions as application security, DLP and encryption? FY 2012 FY 2009 Less than 5% 0% 0% Between 5% to 10% 0% 0% Between 10% to 20% 2% 3% Between 20% to 30% 8% 5% Between 30% to 40% 11% 10% Between 40% to 50% 23% 25% Between 50% to 60% 20% 20% Between 60% to 70% 11% 12% Between 70% to 80% 9% 11% Between 80% to 90% 10% 9% More than 90% 6% 5% Total 100% 100% Extrapolated percentage 55% 56% Q26. Approximately (gut feel is okay), what percentage of the present data protection budget is dedicated to securing data located or processed in cloud environments? FY 2012 Less than 5% 11% Between 5% to 10% 56% Between 10% to 20% 24% Between 20% to 30% 8% Between 30% to 40% 1% Between 40% to 50% 0% Between 50% to 60% 0% Between 60% to 70% 0% Between 70% to 80% 0% Between 80% to 90% 0% More than 90% 0% Total 100% Extrapolated percentage 11%
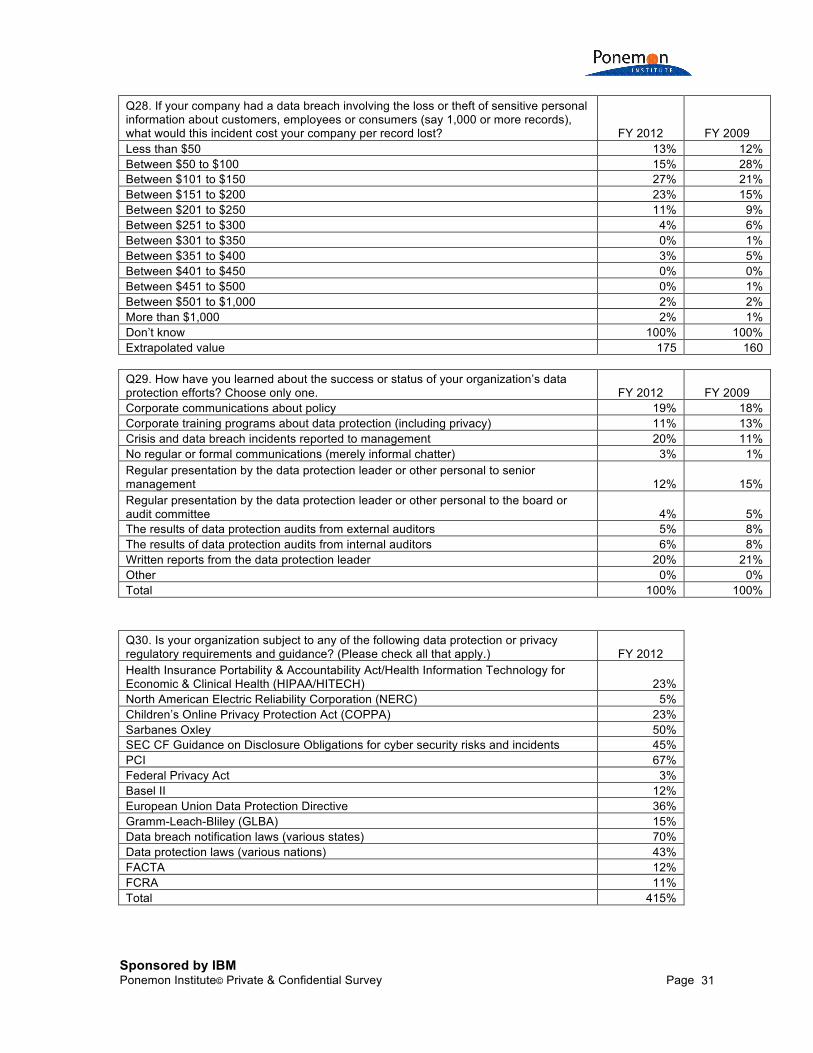
Q27. Approximately (gut feel is okay), what is the dollar range that best describes your organization’s cost savings or revenue improvements as a result of data protection efforts this year? FY 2012 FY 2009 Less than $1 million 0% 0% Between $1 to 2 million 0% 2% Between $2 to $5 million 13% 12% Between $5 to $10 million 15% 16% Between $10 to $15 million 19% 22% Between $15 to $20 million 18% 20% Between $20 to $25 million 13% 12% Between $25 to $30 million 8% 6% Between $35 to $40 million 6% 5% Between $45 to $50 million 4% 2% Between $55 to $60 million 3% 2% More than $60 million 1% 0% Total 100% 100% Extrapolated value 19 million 16 million
Sponsored by IBM Ponemon Institute© Private & Confidential Survey Page
31
Q28. If your company had a data breach involving the loss or theft of sensitive personal information about customers, employees or consumers (say 1,000 or more records), what would this incident cost your company per record lost? FY 2012 FY 2009 Less than $50 13% 12% Between $50 to $100 15% 28% Between $101 to $150 27% 21% Between $151 to $200 23% 15% Between $201 to $250 11% 9% Between $251 to $300 4% 6% Between $301 to $350 0% 1% Between $351 to $400 3% 5% Between $401 to $450 0% 0% Between $451 to $500 0% 1% Between $501 to $1,000 2% 2% More than $1,000 2% 1% Don’t know 100% 100% Extrapolated value 175 160 Q29. How have you learned about the success or status of your organization’s data protection efforts? Choose only one. FY 2012 FY 2009 Corporate communications about policy 19% 18% Corporate training programs about data protection (including privacy) 11% 13% Crisis and data breach incidents reported to management 20% 11% No regular or formal communications (merely informal chatter) 3% 1% Regular presentation by the data protection leader or other personal to senior management 12% 15% Regular presentation by the data protection leader or other personal to the board or audit committee 4% 5% The results of data protection audits from external auditors 5% 8% The results of data protection audits from internal auditors 6% 8% Written reports from the data protection leader 20% 21% Other 0% 0% Total 100% 100%
Q30. Is your organization subject to any of the following data protection or privacy regulatory requirements and guidance? (Please check all that apply.) FY 2012 Health Insurance Portability & Accountability Act/Health Information Technology for Economic & Clinical Health (HIPAA/HITECH) 23% North American Electric Reliability Corporation (NERC) 5% Children’s Online Privacy Protection Act (COPPA) 23% Sarbanes Oxley 50% SEC CF Guidance on Disclosure Obligations for cyber security risks and incidents 45% PCI 67% Federal Privacy Act 3% Basel II 12% European Union Data Protection Directive 36% Gramm-Leach-Bliley (GLBA) 15% Data breach notification laws (various states) 70% Data protection laws (various nations) 43% FACTA 12% FCRA 11% Total 415%

Sponsored by IBM Ponemon Institute© Private & Confidential Survey Page
32
Part 4. Your position and other organizational characteristics Q32. In your organization, how many reporting layers or levels are there between the data protection leader and the CEO (or highest ranking executive)? FY 2012 FY 2009 I am the CEO 18% 14% One level (direct report) 48% 46% Two levels 25% 30% Three levels 9% 10% Four levels 0% 0% Five levels 0% 0% Total 100% 100% Q33a. Total business experience 32.56 29.28 Q33b. Total years in the current position 7.09 4.11 Q34. Gender FY 2012 FY 2009 Female 49% 53% Male 51% 47% Total 100% 100% Q35. Industry FY 2012 FY 2009 Consumer products 6% 5% Education 3% 4% Energy 3% 3% Financial services 17% 17% Healthcare 8% 8% Hospitality & leisure 9% 8% Industrial 10% 9% Pharmaceuticals 3% 4% Professional services 7% 7% Retailing 12% 10% Services 4% 6% Technology & software 10% 11% Communications 4% 6% Transportation 4% 3% Total 100% 100% Q36. Geographic footprint FY 2012 FY 2009 United States 100% 100% Canada 63% 61% EMEA 65% 63% APJ 51% 57% LATAM 48% 42% Total 327% 323% Q37. What is the worldwide headcount of your organization? FY 2012 FY 2009* Less than 50 14% 15% 50 to 500 people 20% 18% 500 to 1,000 people 20% 19% 1,001 to 5,000 people 24% 26% 5,001 to 25,000 people 16% 15% 25,001 to 75,000 people 5% 6% More than 75,000 people 1% 1%

Sponsored by IBM Ponemon Institute© Private & Confidential Survey Page
33
Total 100% 100% *FY 2009 data were recalculated to fit the revised question. Q38. Is your company publicly traded? FY 2012 FY 2009 Yes, NYSE 15% 16% Yes, NASDAQ 21% 20% Yes, overseas exchange 5% 5% Yes, other minor exchange 6% 5% No 53% 54% Total 100% 100% Q39. Removed for respondent confidentiality reasons.

Sponsored by IBM Ponemon Institute© Private & Confidential Survey Page
34
Cloud Cross-tabulated Data
Representative sample FY 2012 Cloud users Non-users
Initial US executive panel 9,062 Revised US executive panel 4,312 Final US executive panel 3,019 Final sample 265 185 80 Response 2.9% Q11a. Does your organization use public, private and/or hybrid cloud computing resources? FY 2012
Cloud users Non-users
Yes 70% 70% 0% No 17% 0% 17% Unsure 13% 0% 13% Total 100% 70% 30% Q2a. Is there one person responsible for the overall data protection effort within your enterprise? FY 2012
Cloud users Non-users Difference
Yes 75% 70% 87% -17% No 19% 25% 5% 20% Not sure 6% 5% 8% -3% Total 100% 100% 100% 0% Q5b. How confident are you that your organization will not suffer a data breach in the next 12 months? FY 2012
Cloud users Non-users Difference
Very confident 8% 11% 1% 10% Confident 23% 27% 14% 13% Somewhat confident 21% 21% 21% 0% Not confident 48% 41% 64% -23% Total 100% 100% 100% Q7. What is the source of greatest risk to your sensitive data? Please select only two responses. FY 2012
Cloud users Non-users Difference
Hacker/cyber criminal attacks 16% 18% 11% 7% Mobility of the workforce 13% 15% 8% 7% Virus or malware attacks 13% 14% 11% 3% Other 1% 2% 0% 2% Exposed via Internet/social media 25% 25% 25% 0% Don’t know 2% 2% 2% 0% Malicious insiders 12% 11% 14% -3% Insecure disposal of hard/soft files 11% 10% 13% -3% Lost or stolen mobile devices including smartphones, tablets and others 31% 29% 36% -7% Negligent insiders 43% 40% 50% -10% Exposed via insecure third party including cloud providers 28% 24% 37% -13% Total 195% 190% 208% -18%

Sponsored by IBM Ponemon Institute© Private & Confidential Survey Page
35
Q13. Please select from the following list of organizational goals that are dependent upon good data protection efforts? Please select only two choices. FY 2012
Cloud users Non-users Difference
Ensuring business partner or vendor compliance 5% 6% 3% 3% Enhancing the value of information assets 19% 20% 17% 3% Decreasing employee turnover 0% 0% 0% 0% Other 0% 0% 0% 0% Increasing customer trust and loyalty 40% 35% 52% -17% Safeguarding critical infrastructure 33% 27% 47% -20% Ensuring regulatory and legal compliance 51% 44% 67% -23% Increasing or maintaining marketplace reputation and brand 50% 43% 66% -23% Total 198% 175% 251% -76% Very important & important Q14. Based on the organizational goals listed above, how important is collaboration between data protection and other business functions within your organization? FY 2012
Cloud users Non-users Difference
Sales 18% 25% 2% 23% Procurement 20% 22% 15% 7% Human resources 28% 30% 23% 7% Logistics 9% 10% 7% 3% Public relations 26% 27% 24% 3% Security 46% 46% 46% 0% Marketing & communications 46% 46% 46% 0% Other 0% 0% 0% 0% Internal audit 30% 29% 32% -3% Government or public affairs 25% 24% 27% -3% Legal 67% 65% 72% -7% Privacy office 43% 41% 48% -7% Compliance 52% 48% 61% -13% Finance & accounting 55% 50% 67% -17% Information security 62% 55% 78% -23% Records management 25% 18% 41% -23% Information technology 67% 60% 83% -23% Risk Management 56% 49% 72% -23% Total 675% 645% 744% -99%
Sponsored by IBM Ponemon Institute© Private & Confidential Survey Page
36
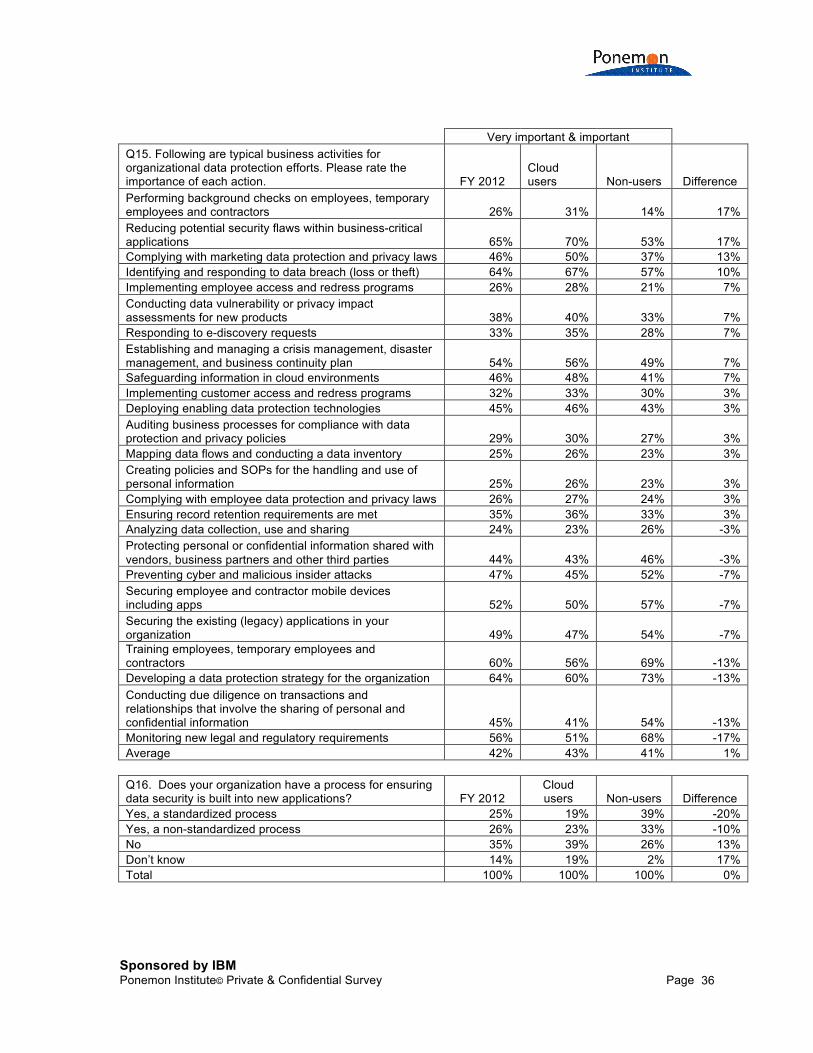
Very important & important Q15. Following are typical business activities for organizational data protection efforts. Please rate the importance of each action. FY 2012
Cloud users Non-users Difference
Performing background checks on employees, temporary employees and contractors 26% 31% 14% 17% Reducing potential security flaws within business-critical applications 65% 70% 53% 17% Complying with marketing data protection and privacy laws 46% 50% 37% 13% Identifying and responding to data breach (loss or theft) 64% 67% 57% 10% Implementing employee access and redress programs 26% 28% 21% 7% Conducting data vulnerability or privacy impact assessments for new products 38% 40% 33% 7% Responding to e-discovery requests 33% 35% 28% 7% Establishing and managing a crisis management, disaster management, and business continuity plan 54% 56% 49% 7% Safeguarding information in cloud environments 46% 48% 41% 7% Implementing customer access and redress programs 32% 33% 30% 3% Deploying enabling data protection technologies 45% 46% 43% 3% Auditing business processes for compliance with data protection and privacy policies 29% 30% 27% 3% Mapping data flows and conducting a data inventory 25% 26% 23% 3% Creating policies and SOPs for the handling and use of personal information 25% 26% 23% 3% Complying with employee data protection and privacy laws 26% 27% 24% 3% Ensuring record retention requirements are met 35% 36% 33% 3% Analyzing data collection, use and sharing 24% 23% 26% -3% Protecting personal or confidential information shared with vendors, business partners and other third parties 44% 43% 46% -3% Preventing cyber and malicious insider attacks 47% 45% 52% -7% Securing employee and contractor mobile devices including apps 52% 50% 57% -7% Securing the existing (legacy) applications in your organization 49% 47% 54% -7% Training employees, temporary employees and contractors 60% 56% 69% -13% Developing a data protection strategy for the organization 64% 60% 73% -13% Conducting due diligence on transactions and relationships that involve the sharing of personal and confidential information 45% 41% 54% -13% Monitoring new legal and regulatory requirements 56% 51% 68% -17% Average 42% 43% 41% 1% Q16. Does your organization have a process for ensuring data security is built into new applications? FY 2012
Cloud users Non-users Difference
Yes, a standardized process 25% 19% 39% -20% Yes, a non-standardized process 26% 23% 33% -10% No 35% 39% 26% 13% Don’t know 14% 19% 2% 17% Total 100% 100% 100% 0%
Sponsored by IBM Ponemon Institute© Private & Confidential Survey Page
37
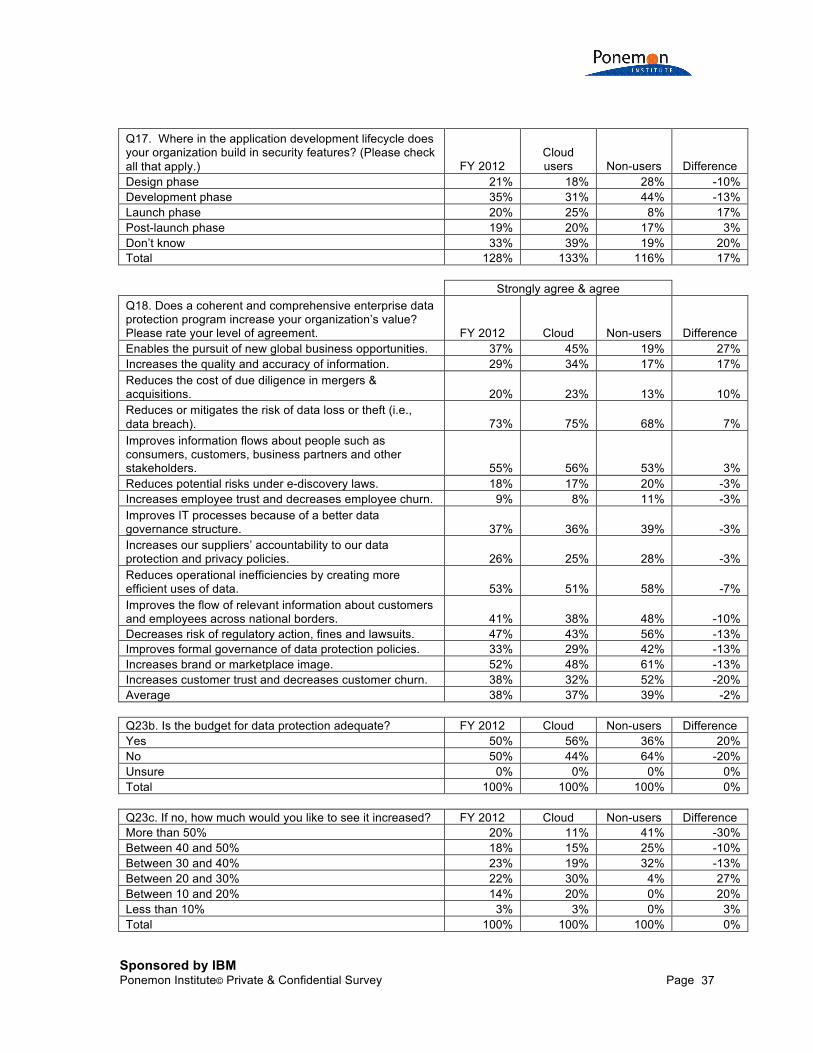
Q17. Where in the application development lifecycle does your organization build in security features? (Please check all that apply.) FY 2012
Cloud users Non-users Difference
Design phase 21% 18% 28% -10% Development phase 35% 31% 44% -13% Launch phase 20% 25% 8% 17% Post-launch phase 19% 20% 17% 3% Don’t know 33% 39% 19% 20% Total 128% 133% 116% 17% Strongly agree & agree Q18. Does a coherent and comprehensive enterprise data protection program increase your organization’s value? Please rate your level of agreement. FY 2012 Cloud Non-users Difference Enables the pursuit of new global business opportunities. 37% 45% 19% 27% Increases the quality and accuracy of information. 29% 34% 17% 17% Reduces the cost of due diligence in mergers & acquisitions. 20% 23% 13% 10% Reduces or mitigates the risk of data loss or theft (i.e., data breach). 73% 75% 68% 7% Improves information flows about people such as consumers, customers, business partners and other stakeholders. 55% 56% 53% 3% Reduces potential risks under e-discovery laws. 18% 17% 20% -3% Increases employee trust and decreases employee churn. 9% 8% 11% -3% Improves IT processes because of a better data governance structure. 37% 36% 39% -3% Increases our suppliers’ accountability to our data protection and privacy policies. 26% 25% 28% -3% Reduces operational inefficiencies by creating more efficient uses of data. 53% 51% 58% -7% Improves the flow of relevant information about customers and employees across national borders. 41% 38% 48% -10% Decreases risk of regulatory action, fines and lawsuits. 47% 43% 56% -13% Improves formal governance of data protection policies. 33% 29% 42% -13% Increases brand or marketplace image. 52% 48% 61% -13% Increases customer trust and decreases customer churn. 38% 32% 52% -20% Average 38% 37% 39% -2% Q23b. Is the budget for data protection adequate? FY 2012 Cloud Non-users Difference Yes 50% 56% 36% 20% No 50% 44% 64% -20% Unsure 0% 0% 0% 0% Total 100% 100% 100% 0% Q23c. If no, how much would you like to see it increased? FY 2012 Cloud Non-users Difference More than 50% 20% 11% 41% -30% Between 40 and 50% 18% 15% 25% -10% Between 30 and 40% 23% 19% 32% -13% Between 20 and 30% 22% 30% 4% 27% Between 10 and 20% 14% 20% 0% 20% Less than 10% 3% 3% 0% 3% Total 100% 100% 100% 0%

Sponsored by IBM Ponemon Institute© Private & Confidential Survey Page
38
Extrapolated percentage 34% 28% 40% -12% Q30. Is your organization subject to any of the following data protection or privacy regulatory requirements and guidance? (Please check all that apply.) FY 2012 Cloud Non-users Difference Data protection laws (various nations) 43% 46% 36% 10% Federal Privacy Act 3% 6% -4% 10% Children’s Online Privacy Protection Act (COPPA) 23% 25% 18% 7% Data breach notification laws (various states) 70% 72% 65% 7% FCRA 11% 12% 9% 3% North American Electric Reliability Corporation (NERC) 5% 6% 3% 3% SEC CF Guidance on Disclosure Obligations for cyber security risks and incidents 45% 45% 45% 0% Basel II 12% 12% 12% 0% Gramm-Leach-Bliley (GLBA) 15% 15% 15% 0% FACTA 12% 11% 14% -3% PCI 67% 64% 74% -10% Health Insurance Portability & Accountability Act/Health Information Technology for Economic & Clinical Health (HIPAA/HITECH) 23% 19% 32% -13% Sarbanes Oxley 50% 45% 62% -17% European Union Data Protection Directive 36% 30% 50% -20% Total 415% 408% 431% -23% Q11b. How has the use of cloud resources affected (or might affect) data protection risks within your organization? FY 2012 Cloud Non-users Increased data protection risk 33% 23% 56% Decreased data protection risk 12% 14% 7% No change on data protection risk 35% 41% 21% Unsure 20% 22% 15% Total 100% 100% 100% Q11b. How has the use of cloud resources affected (or might affect) data protection risks within your organization? Cloud Non-users FY 2012 Increased data protection risk 23% 56% 33% Decreased data protection risk 14% 7% 12% No change on data protection risk 41% 21% 35% Unsure 22% 15% 20% Total 100% 100% 100% Q11a. Does your organization use public, private and/or hybrid cloud computing resources? FY 2012
Cloud users Non-users
Yes 70% 70% 0% No 17% 0% 17% Unsure 13% 0% 13% Total 100% 70% 30%

Sponsored by IBM Ponemon Institute© Private & Confidential Survey Page
39
Q18. Does a coherent and comprehensive enterprise data protection program increase your organization’s value? Please rate your level of agreement. Cloud FY 2012 Non-users Difference Increases employee trust and decreases employee churn. 8% 9% 11% -3% Reduces potential risks under e-discovery laws. 17% 18% 20% -3% Reduces the cost of due diligence in mergers & acquisitions. 23% 20% 13% 10% Increases our suppliers’ accountability to our data protection and privacy policies. 25% 26% 28% -3% Improves formal governance of data protection policies. 29% 33% 42% -13% Increases customer trust and decreases customer churn. 32% 38% 52% -20% Increases the quality and accuracy of information. 34% 29% 17% 17% Improves IT processes because of a better data governance structure. 36% 37% 39% -3% Improves the flow of relevant information about customers and employees across national borders. 38% 41% 48% -10% Decreases risk of regulatory action, fines and lawsuits. 43% 47% 56% -13% Enables the pursuit of new global business opportunities. 45% 37% 19% 27% Increases brand or marketplace image. 48% 52% 61% -13% Reduces operational inefficiencies by creating more efficient uses of data. 51% 53% 58% -7% Improves information flows about people such as consumers, customers, business partners and other stakeholders. 56% 55% 53% 3% Reduces or mitigates the risk of data loss or theft (i.e., data breach). 75% 73% 68% 7% Average 37% 38% 39% -2% Strongly agree & agree Q18. Does a coherent and comprehensive enterprise data protection program increase your organization’s value? Please rate your level of agreement. Cloud Non-users Difference FY 2012 Enables the pursuit of new global business opportunities. 45% 19% 27% 37% Increases the quality and accuracy of information. 34% 17% 17% 29% Reduces the cost of due diligence in mergers & acquisitions. 23% 13% 10% 20% Reduces or mitigates the risk of data loss or theft (i.e., data breach). 75% 68% 7% 73% Reduces operational inefficiencies by creating more efficient uses of data. 51% 58% -7% 53% Improves the flow of relevant information about customers and employees across national borders. 38% 48% -10% 41% Decreases risk of regulatory action, fines and lawsuits. 43% 56% -13% 47% Improves formal governance of data protection policies. 29% 42% -13% 33% Increases brand or marketplace image. 48% 61% -13% 52% Increases customer trust and decreases customer churn. 32% 52% -20% 38% Average 37% 39% -2% 38%