the bulk of the black hole growth since z 1 … · the astrophysical journal, 726:57 (14pp), 2011...
TRANSCRIPT

The Astrophysical Journal, 726:57 (14pp), 2011 January 10 doi:10.1088/0004-637X/726/2/57C© 2011. The American Astronomical Society. All rights reserved. Printed in the U.S.A.
THE BULK OF THE BLACK HOLE GROWTH SINCE z ∼ 1 OCCURS IN A SECULAR UNIVERSE:NO MAJOR MERGER–AGN CONNECTION∗
Mauricio Cisternas1,20
, Knud Jahnke1, Katherine J. Inskip
1, Jeyhan Kartaltepe
2, Anton M. Koekemoer
3,
Thorsten Lisker4, Aday R. Robaina
1,5, Marco Scodeggio
6, Kartik Sheth
7,8, Jonathan R. Trump
9, Rene Andrae
1,
Takamitsu Miyaji10,11
, Elisabeta Lusso12
, Marcella Brusa13
, Peter Capak7, Nico Cappelluti
13, Francesca Civano
14,
Olivier Ilbert15
, Chris D. Impey9, Alexie Leauthaud
16, Simon J. Lilly
17, Mara Salvato
18, Nick Z. Scoville
7,
and Yoshi Taniguchi19
1 Max-Planck-Institut fur Astronomie, Konigstuhl 17, D-69117 Heidelberg, Germany; [email protected] National Optical Astronomy Observatory, 950 North Cherry Avenue, Tucson, AZ 85 721, USA
3 Space Telescope Science Institute, 3700 San Martin Drive, Baltimore, MD 21218, USA4 Astronomisches Rechen-Institut, Zentrum fur Astronomie der Universitat Heidelberg, Monchhofstr. 12-14, D-69120 Heidelberg, Germany
5 Instituto de Ciencias del Cosmos (ICC), Universidad de Barcelona-IEEC, Martı i Franques 1, E-08028 Barcelona, Spain6 IASF-INAF, Via Bassini 15, I-20133 Milano, Italy
7 California Institute of Technology, 1200 East California Boulevard, MC 249-17, Pasadena, CA 91125, USA8 Spitzer Space Center, California Institute of Technology, Pasadena, CA 91125, USA
9 Steward Observatory, University of Arizona, 933 North Cherry Avenue, Tucson, AZ 85721, USA10 Instituto de Astronomıa, Universidad Nacional Autonoma de Mexico, Ensenada, Mexico (P.O. Box 439027, San Diego, CA 92143-9027, USA)11 Center for Astrophysics and Space Sciences, University of California at San Diego, Code 0424, 9500 Gilman Drive, La Jolla, CA 92093, USA
12 INAF-Osservatorio Astronomico di Bologna, Via Ranzani 1, I-40127 Bologna, Italy13 Max-Planck-Institut fur Extraterrestrische Physik, Giessenbachstrasse 1, D-85748 Garching bei Munchen, Germany
14 Harvard Smithsonian Center for Astrophysics, 60 Garden Street, Cambridge, MA 02138, USA15 Laboratoire d’Astrophysique de Marseille, BP 8, Traverse du Siphon, F-13376 Marseille Cedex 12, France
16 LBNL & Berkeley Center for Cosmological Physics, University of California, CA 94720, USA17 Department of Physics, ETH Zurich, CH-8093 Zurich, Switzerland
18 Max-Planck-Institut fur Plasmaphysik, Boltzmanstrasse 2, D-85741 Garching, Germany19 Research Center for Space and Cosmic Evolution, Ehime University, Bunkyo-cho, Matsuyama 790-8577, Japan
Received 2010 September 17; accepted 2010 October 21; published 2010 December 15
ABSTRACT
What is the relevance of major mergers and interactions as triggering mechanisms for active galactic nuclei (AGNs)activity? To answer this long-standing question, we analyze 140 XMM-Newton-selected AGN host galaxies anda matched control sample of 1264 inactive galaxies over z ∼ 0.3–1.0 and M∗ < 1011.7 M� with high-resolutionHubble Space Telescope/Advanced Camera for Surveys imaging from the COSMOS field. The visual analysis oftheir morphologies by 10 independent human classifiers yields a measure of the fraction of distorted morphologiesin the AGN and control samples, i.e., quantifying the signature of recent mergers which might potentially beresponsible for fueling/triggering the AGN. We find that (1) the vast majority (>85%) of the AGN host galaxiesdo not show strong distortions and (2) there is no significant difference in the distortion fractions between activeand inactive galaxies. Our findings provide the best direct evidence that, since z ∼ 1, the bulk of black hole (BH)accretion has not been triggered by major galaxy mergers, therefore arguing that the alternative mechanisms, i.e.,internal secular processes and minor interactions, are the leading triggers for the episodes of major BH growth. Wealso exclude an alternative interpretation of our results: a substantial time lag between merging and the observabilityof the AGN phase could wash out the most significant merging signatures, explaining the lack of enhancementof strong distortions on the AGN hosts. We show that this alternative scenario is unlikely due to (1) recent majormergers being ruled out for the majority of sources due to the high fraction of disk-hosted AGNs, (2) the lack ofa significant X-ray signal in merging inactive galaxies as a signature of a potential buried AGN, and (3) the lowlevels of soft X-ray obscuration for AGNs hosted by interacting galaxies, in contrast to model predictions.
Key words: galaxies: active – galaxies: evolution – galaxies: interactions – quasars: general
Online-only material: color figures
1. INTRODUCTION
There is a general agreement that supermassive black holes(BHs) lie at the centers of nearly all galaxies or at least those
∗ Based on observations with the NASA/ESA Hubble Space Telescope,obtained at the Space Telescope Science Institute, which is operated by AURAInc., under NASA contract NAS 5-26555; the XMM-Newton, an ESA sciencemission with instruments and contributions directly funded by ESA MemberStates and NASA; European Southern Observatory under Large Program175.A-0839; and the Subaru Telescope, which is operated by the NationalAstronomical Observatory of Japan.20 Member of the International Max Planck Research School for Astronomyand Cosmic Physics at the University of Heidelberg (IMPRS-HD), Germany.
with a bulge component. Additionally, strong correlations existbetween the BH mass and various properties of the galacticbulge, including luminosity (Kormendy & Richstone 1995;Magorrian et al. 1998), stellar velocity dispersion (Gebhardtet al. 2000; Ferrarese & Merritt 2000; Tremaine et al. 2002),and stellar mass (Marconi & Hunt 2003; Haring & Rix 2004).While it has been recently proposed that these correlations arejust the product of a statistical convergence of several galaxymergers over cosmic time (Peng 2007; Jahnke & Maccio 2010),these correlations have often been interpreted as the signatureof coupled evolution between the BH and its host galaxy(Kauffmann & Haehnelt 2000; Volonteri et al. 2003; Wyithe &
1

The Astrophysical Journal, 726:57 (14pp), 2011 January 10 Cisternas et al.
Loeb 2003; Granato et al. 2004; Hopkins et al. 2007; Somervilleet al. 2008).
Given that most galaxies are believed to have undergonea quasar phase and that the central BH represents a relic ofthis event (Lynden-Bell 1967; Richstone et al. 1998), the co-evolution picture is naturally very appealing even while someaspects of it remain unclear. It has been suggested that most ofthe mass of the BH is built up during the brightest periods of thisquasar phase (Soltan 1982; Yu & Tremaine 2002). If there is sucha connection between the growth of the BH and its host galaxy,periods of quasar activity should occur alongside the growth ofthe bulge, and the mechanism that triggers the accretion ontoa once quiescent BH, turning it into an active galactic nucleus(AGN), should be tightly linked with the overall evolution ofthe host galaxy. The nature of AGN triggering is therefore ofkey importance for our understanding of galaxy evolution ingeneral.
According to the current paradigm of hierarchical structureformation, major mergers are a crucial element in the assemblyand growth of present-day galaxies (e.g., Kauffmann et al. 1993;Cole et al. 2000; Somerville et al. 2001; Bell et al. 2006; Jogeeet al. 2009; Robaina et al. 2010). A closer look into the behaviorof simulated collisions between galaxies, beginning with thepioneering work of Toomre & Toomre (1972), suggests thatgravitational interactions are an efficient way of transportingmaterial toward the very center of a galaxy. Mergers and stronginteractions can induce substantial gravitational torques on thegas content of a galaxy, depriving it of its angular momentum,leading to inflows and the buildup of huge reservoirs of gas inthe center (Hernquist 1989; Barnes & Hernquist 1991, 1996;Mihos & Hernquist 1996; Springel et al. 2005; Cox et al. 2006,2008; Di Matteo et al. 2007).
From early on, major mergers have been related to obser-vations of powerful nuclear starbursts (Gunn 1979), and con-nections with quasar activity were made soon after. Stockton(1982), in a study of luminous quasars with close companions,suggested that these neighboring galaxies could be survivorsof a strong interaction with the quasar. Further observationalstudies came to support this picture: more cases of quasars withclose companions were found, and post-merger features weredetected in the host galaxies, whenever it was possible to re-solve them (e.g., Heckman et al. 1984; Gehren et al. 1984;Hutchings et al. 1984, 1988; Stockton & Ridgway 1991;Hutchings & Neff 1992). The merger–quasar connection sce-nario gained strength with the discovery of the ultraluminousinfrared galaxies (ULIRGs). More than 95% of these were foundin a merging state, some of them hosting an AGN. This led tothe scenario in which ULIRGs and quasars were part of thesame chain of events (Sanders et al. 1988a, 1988b; Sanders &Mirabel 1996; Surace et al. 1998, 2000; Surace & Sanders 1999;Canalizo & Stockton 2000, 2001).
With the advent of the Hubble Space Telescope (HST), deepimaging of AGN host galaxies at higher redshifts with unprece-dented resolution became possible. Many observational studiesof luminous AGNs found a high rate of merging signatures intheir hosts and detected the presence of very close compan-ions, which before HST could not be resolved (e.g., Bahcallet al. 1997; Canalizo & Stockton 2001; Zakamska et al. 2006;Urrutia et al. 2008). At the same time, deeper imaging of AGNhost galaxies that were initially classified as undisturbed re-vealed post-merger features not previously detected, both fromspace-based (Canalizo et al. 2007; Bennert et al. 2008) andground-based observations (Ramos Almeida et al. 2010).
There is, however, one major caveat for most of the studieslisted above: almost none of them made use of, or had accessto, an appropriate control sample of inactive galaxies; sucha control sample is essential for discerning if the mergerrate is in fact enhanced with respect to the “backgroundlevel,” i.e., the merger rate of inactive galaxies. Only Dunlopet al. (2003) compared their statistically complete sample ofquasars against the quiescent galaxy population, finding nodifference in the structural parameters between samples, as wellas no enhancement in the large-scale disturbances. Even if notexplicitly, this showed a clear divergence from previous studiesregarding the merger–AGN connection scenario and agreed withthe very low frequency of post-merger signatures observed onSeyfert galaxies and low-luminosity AGNs (Malkan et al. 1998;Schade et al. 2000).
A new era of large HST programs now offers the potential forresolving this discrepancy. The imaging of larger, contiguousfields has yielded a large number of objects, making it possi-ble to study AGN hosts at space-based resolution, and at thesame time to compile a control sample of non-active galax-ies. Initial studies using HST imaging by Sanchez et al. (2004)with the Galaxy Evolution from Morphologies and SEDs sur-vey (GEMS; Rix et al. 2004) and by Grogin et al. (2005)with the Great Observatories Origins Deep Survey (GOODS;Giavalisco et al. 2004) found no evidence for an enhancementin merging signatures of AGN hosts over control galaxy sam-ples. If merger activity does not play a major role in AGNtriggering, other methods to produce gas inflows, build up thebulge, and fuel the BH should also be of importance. Alter-nate secular mechanisms—minor interactions, large-scale bars,nuclear bars, colliding clouds, supernova explosions—can alsolead to angular momentum removal and gas inflows from differ-ent scales to the central regions (for reviews, see Kormendy &Kennicutt 2004; Wada 2004; Martini 2004; Jogee 2006). Whilethese processes have usually been related to Seyfert galaxiesand low-luminosity AGNs (e.g., Simkin et al. 1980; Taniguchi1999; Hopkins & Hernquist 2009), they could potentially playa larger role than usually reckoned for more luminous AGNsas well. Although the results from the GEMS and GOODS sur-veys are highly intriguing, the field sizes of ∼0.22 deg2 and∼0.08 deg2, respectively, were still too small for definitive con-clusions to be drawn. A suitably larger sample would be requiredto turn these appealing hints into statements.
In this context, we tackle this long-standing issue by per-forming a comprehensive morphological analysis of a sampleof X-ray-selected AGN host galaxies from the Cosmic Evo-lution Survey (COSMOS; Scoville et al. 2007b), the largestcontiguous area ever imaged with the HST (Scoville et al.2007a; Koekemoer et al. 2007). Our goal is to disentanglethe actual relevance and predominance of major galaxy merg-ers from the other suggested mechanisms for the fueling ofthe BH.
In the past, targeted high-resolution imaging of AGN hostshas only been possible for small samples, while extensiveground-based surveys with large samples have lacked thenecessary resolution to perform detailed morphological studiesat moderate redshifts. Earlier results from the detailed analysisby Gabor et al. (2009), where the morphologies of ∼400AGN host galaxy candidates from the COSMOS field wereparameterized, showed that these had an asymmetry distributionconsistent with that of a control sample of inactive galaxiesand lacked an excess of companions, already suggesting thatmajor interactions were not predominant among AGNs as
2

The Astrophysical Journal, 726:57 (14pp), 2011 January 10 Cisternas et al.
a triggering mechanism. Here we use the largest sample ofoptically confirmed X-ray-selected AGNs ever imaged at HSTresolution from the COSMOS survey and perform a visualinspection of the morphologies of the host galaxies. We opt for avisual analysis of our Galaxies over an automatic classificationsystem because of the inherent problems and incompleteness ofthe latter in identifying mergers, even for some obvious cases, ascautioned by recent studies probing both methods (Jogee et al.2009; Kartaltepe et al. 2010). To establish the relevance of ourfindings, we compare the AGN hosts to a matching sample ofinactive galaxies from the same exact data set.
Throughout this paper, we assume a flat cosmology withH0 = 70 km s−1 Mpc−1, ΩM = 0.3, and ΩΛ = 0.7. Allmagnitudes are given in the AB system unless otherwise stated.
2. DATA SET AND SAMPLE
We will perform our analysis on a complete sample of X-ray-selected optically confirmed type-1 and type-2 AGNs from theCOSMOS field.
The COSMOS survey features the largest contiguous areaever imaged with the HST. The location of the 1.64 deg2 field,close to the celestial equator, allows access from several majorspace- and ground-based observatories, enabling a large multi-wavelength coverage from X-ray to radio from supplementaryobservational projects.
One of the most effective ways of finding AGNs is tomake use of the X-ray emission due to the accreting BH(e.g., Mushotzky 2004). Complete coverage of the wholeCOSMOS field in X-rays was achieved with XMM-Newton(XMM-Newton–COSMOS; Hasinger et al. 2007; Cappellutiet al. 2009) through 55 pointings with a total exposure timeof ∼1.5 Ms. We use the catalog presented in Brusa et al.(2010), which provides the most likely optical and infraredcounterparts to the XMM-Newton sources based on a likelihoodratio technique (see Brusa et al. 2007 for details).
From the X-ray catalog, we draw a parent sample of ∼550sources classified as type-1 AGNs from spectroscopic surveys(Trump et al. 2007, 2009; Lilly et al. 2007) revealing broademission lines and from spectral energy distribution (SED)fitting (Capak et al. 2007; Salvato et al. 2009; Ilbert et al. 2009).We also include a subsample of X-ray-selected type-2 AGNs,based on those used by Gabor et al. (2009) drawn from a parentsample of ∼300 narrow emission line objects (Trump et al.2007, 2009).
In this paper, we analyze the morphological properties ofthe AGN host galaxies. For this, we take advantage of thehigh-resolution imaging of the COSMOS field with the HST.These observations comprise 583 orbits using the AdvancedCamera for Surveys (ACS) with the F814W (broad I-band)filter (Koekemoer et al. 2007). The imaging data feature anoversampled scale of 0.′′03 pixel−1. Although the ACS surveyof the COSMOS field is highly homogeneous, the exact depthachieved is dependent on the angle of the telescope with the Sunat the time of the observations (Leauthaud et al. 2007). Ninety sixout of the 575 pointings were made with an angle smaller thana critical value of 70◦, leading to a slightly shallower image.The limiting surface brightness levels above the backgroundfor the pointings made with an angle with the Sun larger andsmaller than the critical value are ∼23.3 mag arcsec−2 and∼22.9 mag arcsec−2, respectively.
We restrict our sample to the redshift range z ∼ 0.3–1.0.For the majority of our final sample, we used high-confidencespectroscopic redshifts, while for the rest (20%) we used
Figure 1. X-ray luminosity distribution of our sample in the 2–10 keV energyband (solid line). For reference, we also show the distribution of the type-1 AGNsubsample only (dotted line).
photometric redshifts by Salvato et al. (2009). The lower redshiftcut is chosen due to the low number of AGNs below z ∼ 0.3(see Section 3 for further details) and also to avoid working withsaturated sources. The upper limit arises because the F814Wfilter is shifted into rest-frame UV for sources above z ∼ 1.This would mean that we would be specifically looking at thelight from young stars and star formation knots, and thereforeat biased morphologies. At the same time, for the case of thetype-1 AGNs, the bright nucleus would start to dominate due toits blue color, strongly outshining the host and making it nearlyimpossible to resolve.
Given our interest in the morphologies of our sample ofAGN host galaxies, we decided not to consider galaxies fainterthan IF814W = 24. Visual morphological classification of theseobjects would be particularly difficult, and we determined thatno consistent information could be extracted at this magnitude.For the case of the type-1 subsample, we applied this criterionafter the nucleus removal (see Appendix A for details).
This selection yields 83 type-1 and 57 type-2 AGNs. Themedian redshifts of the type-1 and type-2 subsamples are 0.80and 0.67, respectively. The type-2 subsample has a medianapparent IF814W of 20.9, slightly brighter than the type-1subsample with 21.7 (after nucleus removal, see Appendix A)due to the higher median redshift of the latter.
Figure 1 shows the X-ray luminosity distribution of oursources in the 2–10 keV energy band. The values were obtainedmainly from those calculated by Lusso et al. (2010) and arecomplemented with those by Mainieri et al. (2007). The medianof our distribution lies at LX = 1043.5 erg s−1, which meansthat we are probing a reasonably luminous representative AGNsample. For reference, in Figure 1 we also show the X-rayluminosity distribution of the type-1 AGN subsample only,which dominates the overall distribution and has a slightlybrighter median LX (1043.6 erg s−1) than the type-2 subsample(1043.3 erg s−1).
3. METHODOLOGY
In this paper, we analyze the morphologies of a sample ofAGN host galaxies and of a control sample of inactive galaxiesusing high-resolution HST/ACS single I-band images. In thefollowing subsections, we explain how we built the comparison
3

The Astrophysical Journal, 726:57 (14pp), 2011 January 10 Cisternas et al.
sample, the motivation for choosing a visual inspection over anautomatic method, and the classification scheme used.
Analyzing the host galaxies of type-1 AGNs is complex,due to the presence of the bright active nucleus in the images,that, depending on the contrast, can outshine the host galaxyto different extents. We overcome this issue through a two-dimensional decomposition of the AGN and its host galaxy,modeling the bright active nucleus with a point-spread function(PSF) and the host galaxy with a Sersic (1968) profile usingGALFIT (Peng et al. 2002, 2010), and then removing the nuclearcontribution. This process is described in detail in Appendix A.
3.1. Comparison Sample
The large number of galaxies available from the COSMOSHST observations provides us with the unique opportunity ofbuilding a control sample from the same data set that we drawour AGNs from. For our study, we require the control sampleto permit us to elaborate a comparison regarding distortionfeatures. In this respect, the most relevant parameter is thesignal-to-noise ratio (S/N); hence we construct the comparisonsample by selecting inactive galaxies matching each AGN bothin apparent IF814W magnitude and photometric redshift. Thisis both required and sufficient since (1) the S/N determinesthe visibility of the merger signatures and (2) while the stellarmasses might differ slightly (factors of ∼2 at the same distanceand brightness), the mass dependence on the merger rate is notstrong, with only a modest increase for higher masses (Bundyet al. 2009).
Specifically, for each AGN host galaxy we select 10 sim-ilar comparison galaxies from the COSMOS ACS catalog(Leauthaud et al. 2007). Each selected comparison galaxy is re-quired to have an IF814W magnitude within a range of �IF814W =0.1 and a photometric redshift within a range of �z = 0.05. If notenough galaxies were found, the search ranges were increasedby 10%. On average, 1.8 iterations were performed to find therequired number of inactive galaxies for each AGN host. For thecase of the type-1 AGN subsample, the magnitudes of the hostgalaxies after the removal of the active nucleus are used for theselection of the control sample.
With the inactive comparison sample in hand, we removegalaxies that are unlikely to be AGN host galaxy counterparts apriori via an initial visual inspection. Such galaxies include(1) bulgeless disks and irregulars, which would represent alow-mass population, having no corresponding partners on theAGN sample and (2) for the type-1 subsample, edge-on disks,which could in principle hold an AGN but this would be heavilyobscured and therefore not be a type-1.
Finally, the construction of the control sample for the type-1AGNs requires an additional effort. The nucleus removal processusually leaves residuals in the center which certainly affectany blind classification, making the type-1 AGN host galaxiesreadily discernible from the control sample. To resolve thisproblem, we mock up our selected inactive galaxies as AGNby adding a star in the center as a fake active nucleus, as wedescribe in Appendix B. We then apply the same subtractionprocedure as for the original type-1 AGNs, attempting to makethe two samples indistinguishable. As we show in Appendix C,any effects on the selection of the comparison sample due toflux variations caused by the nucleus subtraction process can beneglected.
Our final comparison sample (hereafter CS) consists of 1264inactive galaxies in total. The IF814W and redshift distributionsof the resulting type-1 and type-2 comparison samples are
consistent with being drawn from the same parent distributionas the AGN subsamples, even after the removal of the unlikelycounterparts described above. A Kolmogorov–Smirnov test oneach pair of IF814W and redshift distributions confirms withprobabilities >38% that the AGN and control samples areconsistent among each other (in general <5% is used to showthat two distributions differ).
3.2. Visual Classification
Merger events come in many different flavors due to thelarge parameter space involved (e.g., merger stage, viewingangles, mass ratio, and gas fractions). Sometimes they can beobvious at first sight, but some others can be very subtle, orsimply undetectable at the sensitivity of the observations. Atour redshift range and image resolution, it has been shown thatautomatic classification methods to identify mergers tend tomiss several obvious cases and cannot compete with visualinspection (Jogee et al. 2009; Kartaltepe et al. 2010). On theother hand, when the numbers involved are over the tens ofthousands, visual classification becomes impractical21 and anautomatic approach would be needed. General measurements ofstructural parameters that can be correlated with some physicalprocess have proven to be a good compromise (e.g., Reichardet al. 2009, using the lopsidedness as a tracer of merging andstar formation).
Considering the above, in this paper we opt to identify mergerand interaction signatures visually. The number of objects weare dealing with allows us to do so (∼1400 in total), and theimage quality deserves a detailed case-by-case examination.
These visual studies can be subjective. In our case, theabsolute fraction of merging galaxies measured by visualclassifiers will depend on their own experience and background,and hence it is plausible that they can differ substantially amongeach other. Nevertheless, any personal scale and criteria eachclassifier uses will be applied equally on both samples, activeand inactive galaxies. Therefore, a key quantity in our study willbe, more than the absolute fractions of merging galaxies, thedifference between the merging fractions measured by a givenclassifier. If we instead focus on how each individual classifierperceives one sample compared to the other, by considering thedifferential between the merging fractions of active and inactivegalaxies, this subjectiveness can be accounted for. Furthermore,the consistency of this study is improved by (1) using 10independent human classifiers to add statistical robustness and(2) mixing both samples of active and inactive galaxies so thatthe classification is actually blind and therefore does not favoreither the AGN hosts or the inactive galaxies.
We break the classification down into two parameters.
1. Hubble type. We attempt to state whether the host galaxybelongs to one of the two basic morphological classes: bulgeor disk dominated.
2. Distortion class. We define three classes regarding thedegree of distortion of the galaxy as follows.(a) Dist-0. Galaxies that appear undisturbed, smooth, and/
or symmetric, showing no interaction signatures. Thisalso applies to cases where the small diameter of thegalaxy does not allow a detailed analysis. We payparticular attention to self-induced asymmetries suchas dust lanes or star-forming regions, which are usuallyseen as small clumps in well-resolved spirals.
21 With the notable exception of the citizen-based Galaxy Zoo project (Lintottet al. 2008, http://www.galaxyzoo.org).
4

The Astrophysical Journal, 726:57 (14pp), 2011 January 10 Cisternas et al.
AGN host galaxies Inactive galaxies
Bulg
e-dom
.D
isk-d
om.
Figure 2. Example galaxy images arranged into different morphological classes with 100% agreement between the independent classifiers. The cutouts are 4.′′8 × 4.′′8.Black residuals at the center of some of the galaxies are residuals from the point source removal.
(A color version of this figure is available in the online journal.)
AGN host galaxies Inactive galaxies
Dis
t-0
Dis
t-1
Dis
t-2
Figure 3. Example galaxy images arranged into different distortion classes with 100% agreement between the independent classifiers. The cutouts are 4.′′8 × 4.′′8.Black residuals at the center of some of the galaxies are residuals from the point source removal.
(A color version of this figure is available in the online journal.)
(b) Dist-1. Here we include objects with mild distortions.This could be due to a minor merger, for example, butat the same time could also be because of low S/N.This interaction class is a “gray zone” in which mostof the discrepancies in the classification between the10 people arise.
(c) Dist-2. Strong distortions, potential signs for ongoingor recent mergers. This class mainly includes galaxieswhich have highly disturbed morphologies or showvisible signatures of strong interactions, such as largetidal tails, arcs, debris, etc. Double-nucleus systemsalso fall into this category.
Illustrative examples of the Hubble type and distortion classesare shown in Figures 2 and 3, respectively.
For the visual inspection, the classifiers had access to FITSimages which they could re-scale in order to look for highcontrast and subtle features that may not have shown up at anarbitrary brightness scale.
4. RESULTS
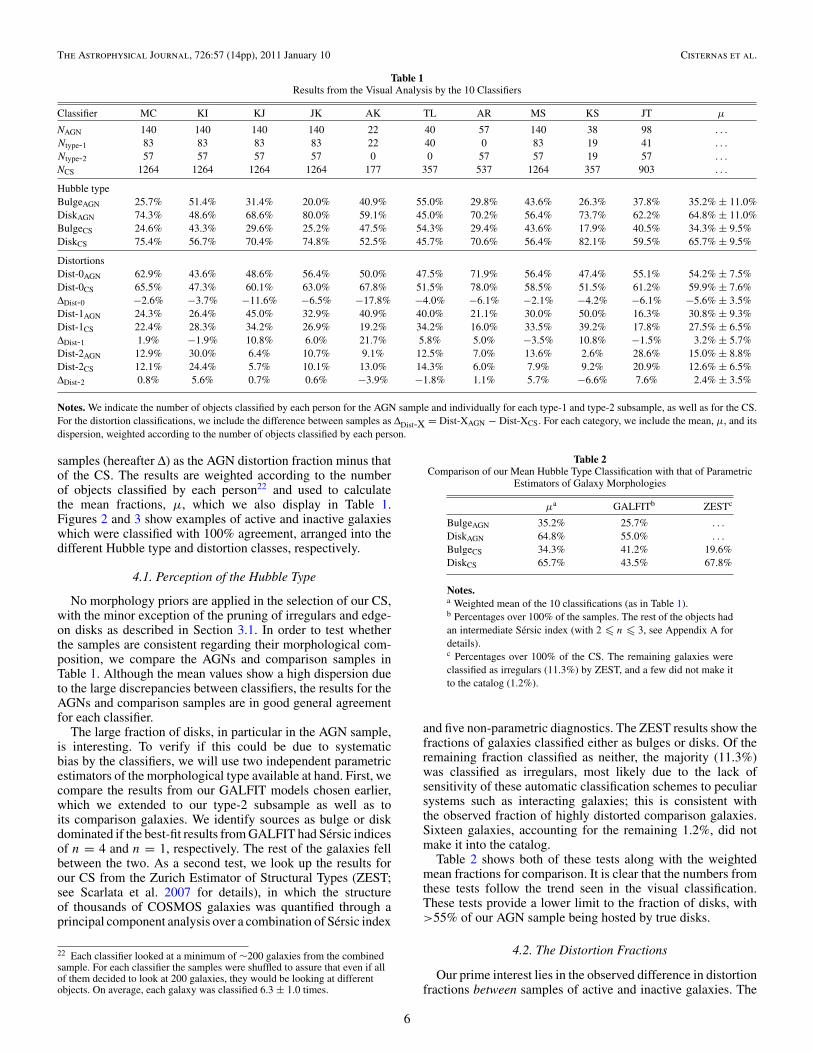
The results from the visual classification by 10 people (MC,KI, KJ, JK, AK, TL, AR, MS, KS, and JT), for both Hubbletype and distortion classes, are shown in Table 1. For thedifferent distortion classes, we show the difference between
5
The Astrophysical Journal, 726:57 (14pp), 2011 January 10 Cisternas et al.
Table 1Results from the Visual Analysis by the 10 Classifiers
Classifier MC KI KJ JK AK TL AR MS KS JT μ
NAGN 140 140 140 140 22 40 57 140 38 98 . . .
Ntype-1 83 83 83 83 22 40 0 83 19 41 . . .
Ntype-2 57 57 57 57 0 0 57 57 19 57 . . .
NCS 1264 1264 1264 1264 177 357 537 1264 357 903 . . .
Hubble typeBulgeAGN 25.7% 51.4% 31.4% 20.0% 40.9% 55.0% 29.8% 43.6% 26.3% 37.8% 35.2% ± 11.0%DiskAGN 74.3% 48.6% 68.6% 80.0% 59.1% 45.0% 70.2% 56.4% 73.7% 62.2% 64.8% ± 11.0%BulgeCS 24.6% 43.3% 29.6% 25.2% 47.5% 54.3% 29.4% 43.6% 17.9% 40.5% 34.3% ± 9.5%DiskCS 75.4% 56.7% 70.4% 74.8% 52.5% 45.7% 70.6% 56.4% 82.1% 59.5% 65.7% ± 9.5%
DistortionsDist-0AGN 62.9% 43.6% 48.6% 56.4% 50.0% 47.5% 71.9% 56.4% 47.4% 55.1% 54.2% ± 7.5%Dist-0CS 65.5% 47.3% 60.1% 63.0% 67.8% 51.5% 78.0% 58.5% 51.5% 61.2% 59.9% ± 7.6%ΔDist-0 −2.6% −3.7% −11.6% −6.5% −17.8% −4.0% −6.1% −2.1% −4.2% −6.1% −5.6% ± 3.5%Dist-1AGN 24.3% 26.4% 45.0% 32.9% 40.9% 40.0% 21.1% 30.0% 50.0% 16.3% 30.8% ± 9.3%Dist-1CS 22.4% 28.3% 34.2% 26.9% 19.2% 34.2% 16.0% 33.5% 39.2% 17.8% 27.5% ± 6.5%ΔDist-1 1.9% −1.9% 10.8% 6.0% 21.7% 5.8% 5.0% −3.5% 10.8% −1.5% 3.2% ± 5.7%Dist-2AGN 12.9% 30.0% 6.4% 10.7% 9.1% 12.5% 7.0% 13.6% 2.6% 28.6% 15.0% ± 8.8%Dist-2CS 12.1% 24.4% 5.7% 10.1% 13.0% 14.3% 6.0% 7.9% 9.2% 20.9% 12.6% ± 6.5%ΔDist-2 0.8% 5.6% 0.7% 0.6% −3.9% −1.8% 1.1% 5.7% −6.6% 7.6% 2.4% ± 3.5%
Notes. We indicate the number of objects classified by each person for the AGN sample and individually for each type-1 and type-2 subsample, as well as for the CS.For the distortion classifications, we include the difference between samples as ΔDist-X = Dist-XAGN − Dist-XCS. For each category, we include the mean, μ, and itsdispersion, weighted according to the number of objects classified by each person.
samples (hereafter Δ) as the AGN distortion fraction minus thatof the CS. The results are weighted according to the numberof objects classified by each person22 and used to calculatethe mean fractions, μ, which we also display in Table 1.Figures 2 and 3 show examples of active and inactive galaxieswhich were classified with 100% agreement, arranged into thedifferent Hubble type and distortion classes, respectively.
4.1. Perception of the Hubble Type
No morphology priors are applied in the selection of our CS,with the minor exception of the pruning of irregulars and edge-on disks as described in Section 3.1. In order to test whetherthe samples are consistent regarding their morphological com-position, we compare the AGNs and comparison samples inTable 1. Although the mean values show a high dispersion dueto the large discrepancies between classifiers, the results for theAGNs and comparison samples are in good general agreementfor each classifier.
The large fraction of disks, in particular in the AGN sample,is interesting. To verify if this could be due to systematicbias by the classifiers, we will use two independent parametricestimators of the morphological type available at hand. First, wecompare the results from our GALFIT models chosen earlier,which we extended to our type-2 subsample as well as toits comparison galaxies. We identify sources as bulge or diskdominated if the best-fit results from GALFIT had Sersic indicesof n = 4 and n = 1, respectively. The rest of the galaxies fellbetween the two. As a second test, we look up the results forour CS from the Zurich Estimator of Structural Types (ZEST;see Scarlata et al. 2007 for details), in which the structureof thousands of COSMOS galaxies was quantified through aprincipal component analysis over a combination of Sersic index
22 Each classifier looked at a minimum of ∼200 galaxies from the combinedsample. For each classifier the samples were shuffled to assure that even if allof them decided to look at 200 galaxies, they would be looking at differentobjects. On average, each galaxy was classified 6.3 ± 1.0 times.
Table 2Comparison of our Mean Hubble Type Classification with that of Parametric
Estimators of Galaxy Morphologies
μa GALFITb ZESTc
BulgeAGN 35.2% 25.7% . . .
DiskAGN 64.8% 55.0% . . .
BulgeCS 34.3% 41.2% 19.6%DiskCS 65.7% 43.5% 67.8%
Notes.a Weighted mean of the 10 classifications (as in Table 1).b Percentages over 100% of the samples. The rest of the objects hadan intermediate Sersic index (with 2 � n � 3, see Appendix A fordetails).c Percentages over 100% of the CS. The remaining galaxies wereclassified as irregulars (11.3%) by ZEST, and a few did not make itto the catalog (1.2%).
and five non-parametric diagnostics. The ZEST results show thefractions of galaxies classified either as bulges or disks. Of theremaining fraction classified as neither, the majority (11.3%)was classified as irregulars, most likely due to the lack ofsensitivity of these automatic classification schemes to peculiarsystems such as interacting galaxies; this is consistent withthe observed fraction of highly distorted comparison galaxies.Sixteen galaxies, accounting for the remaining 1.2%, did notmake it into the catalog.
Table 2 shows both of these tests along with the weightedmean fractions for comparison. It is clear that the numbers fromthese tests follow the trend seen in the visual classification.These tests provide a lower limit to the fraction of disks, with>55% of our AGN sample being hosted by true disks.
4.2. The Distortion Fractions
Our prime interest lies in the observed difference in distortionfractions between samples of active and inactive galaxies. The
6

The Astrophysical Journal, 726:57 (14pp), 2011 January 10 Cisternas et al.
Figure 4. Distributions of the difference in the Monte Carlo sampled distributions of Dist-2 fractions between the AGN and control samples for the 10 classifiers.For each distribution, a deviation from zero difference (dotted line) toward positive values indicates a higher fraction of distorted active galaxies, whereas a deviationtoward negative values shows a higher fraction of distorted inactive galaxies.
absolute values in distortion fractions determined by the 10classifiers are of lesser interest since the internal calibrationfor the three distortion classes differs between the classifyingindividuals. Since any subjectiveness will be applied equallyto both active and inactive samples, using the differences inthe distortion fractions instead of absolute levels removes theperson-to-person calibration differences and allows an unbiasedinterpretation.
Considering that the merging signatures we were looking forcould sometimes be faint and weak, we address the potentialloss of sensitivity to such features due to the slightly shallowerlimiting magnitudes for ∼17% of the pointings (i.e., those withSun angles of <70◦). For each person, we have also carefullyanalyzed the results by dividing their classified sample intosources with Sun angles either side of this critical angle. Wefind that there is no statistically significant difference in thedistortion fractions as a function of Sun angle. In addition, asthe assignment of individual objects to either a deep or shallowfield is effectively random, and given that the AGN distortionfractions are compared directly with those of a CS selectedfrom the same data set (and thus with the same limiting surfacebrightness issues), the overall impact on our results of any biastoward smaller distortion fractions in the shallower fields wouldin any case be negligible.
The objects that fell into the Dist-2 class were those whichpresented the strongest distortions, and hence signatures ofa major interaction, for each individual classifier. As anydifference in recent major merger incidence would show itselfin this class, we will focus on the Dist-2 results here.
4.2.1. Combining 10 Classifications
In Table 1, we have already listed the Dist-2 fractions forall classifiers, their mean values, and also the mean of the
difference in Dist-2 fractions between the AGNs and comparisonsamples. This permits the following initial assessment under theassumption of Gaussian errors: the difference (2.4%) is belowthe uncertainty of 3.5%, and hence it is not significant.
Nevertheless, since the error distribution is in fact not Gaus-sian but follows a binomial distribution (according to the numberof distorted galaxies in a sample of given size), it is importantthat we use the correct combination of results in order to giveanswers to the two main questions: (1) is there a genuine dif-ference between the fractions of strongly distorted AGN hostsand inactive galaxies and (2) with the given sample size, whatdifference in distortion fractions between samples can we actu-ally rule out at a given confidence level—in this case we chose95%. The first question asks whether the given data set shows anenhanced AGN distortion fraction or not. The second questionprobes the discriminative power of this sample and allows usto gauge the actual importance of a null result in question (1),since a decreasing sample size means an increasing uncertaintyin the distortion fractions and hence small samples have nearzero discriminative power.
Using the correct binomial error statistics for the distortionfractions of AGNs and inactive galaxies, we compute foreach classifier the probability distribution for the differenceΔDist-2. This is done in the following way: (1) individually foreach classifier, we Monte Carlo sample their pair of Dist-2binomial probability distributions for the AGNs and comparisonsamples separately, (2) we compute the difference between theserandomly sampled values, (3) we repeat this process one milliontimes for each classifier which yields 10 distributions for ΔDist-2,(4) we normalize these probability distributions by the Dist-2CSvalues measured by each person as shown in Table 1, in thisway removing any bias applied by each classifier’s personalscale (Figure 4), and (5) now in “differential” space, where we
7

The Astrophysical Journal, 726:57 (14pp), 2011 January 10 Cisternas et al.
Figure 5. Combined posterior probability distribution of the difference of highlydistorted galaxies between the AGN and control sample for the 10 classifiers.The central 68% confidence level is marked with vertical dashed lines, whichshows that the histogram is consistent with zero difference (dotted line), rulingout any significant enhancement of merging signatures on our sample of AGNhosts with respect to the comparison sample of inactive galaxies.
are insensitive to between-person scatter, we combine these 10distributions by co-adding their histograms, weighted by thesize of the sample each person classified.23
The resulting probability distribution is shown in Figure 5.The histogram is fully consistent with zero difference, asindicated by the central 68% confidence interval denoted bythe vertical dashed lines estimated by the areas at both ends,encompassing 16% each. This confirms the simple analysis fromabove: our study shows no significant difference between thefractions of strong distortions of AGNs and inactive galaxies.Regarding the discriminative power of our sample, in Figure 6we show the cumulative distribution of the Dist-2AGN fractionfrom Figure 5. The distribution shows that with 95% confidencethe distortion fraction of AGNs is in any case not larger than theinactive distortion fraction by a factor of 1.9, when consideredrelative to the mean distortion level found by the 10 classifiers(12.6%). Hence, the vast majority of AGN host galaxies at z < 1with the given luminosities do not show signatures of havingexperienced a recent major merger.
4.2.2. Mass Dependency
Even if there is no overall difference between the fractions ofhighly distorted AGNs and inactive galaxies, it is still interestingto look at the situation in mass space and investigate thepossibility that an enhancement of the AGN merger fractioncould be hidden because we consider the sample as a whole,regardless of stellar mass. Major merging is a key element inthe assembly and evolution of massive galaxies (e.g., Bell et al.2006; Lin et al. 2008; Bundy et al. 2009; van der Wel et al.2009; Robaina et al. 2010), and in order to test if the fraction ofhighly distorted AGN host galaxies is significantly enhanced atthe massive end (higher than ∼1010.5 M�), we have estimatedstellar masses for our samples of active and inactive galaxies.We use the calibration from Bell & de Jong (2001) based onthe Chabrier initial mass function. By obtaining the V-bandluminosities
LV = 10−0.4(V −4.82) (1)
23 This represents a combined Bayesian posterior probability distribution withsample sizes as individual priors.
Figure 6. Cumulative distribution of the simulated Dist-2AGN fractions, showingthe 68% and 95% confidence levels with the dashed lines. As mentioned in thetext, this confirms with a 95% confidence that the highly distorted AGN fractioncan not be larger than 24.08%.
and assuming a common mass-to-light ratio from the rest-frame(B − V ) color, we derive stellar masses in solar units:
M∗ = 10−0.728+1.305(B−V ) × LV (2)
with all magnitudes in Vega zero point.For the inactive galaxies and the type-2 subsample, we obtain
rest-frame B and V from the photometric catalog of Ilbert et al.(2010). For the type-1 AGN subsample, however, we cannotuse that information because it includes the contribution fromthe luminous AGN. Therefore, we obtain the rest-frame V-bandluminosities from the observed IF814W after the nucleus removalprocess and estimate the color term by computing the linearregression over the rest-frame (B − V ) colors as a function ofredshift for the type-2 AGN. This yields the relation
(B − V )Vega = 0.136 z + 0.541. (3)
The combined differences of highly distorted galaxies for twobins of stellar mass (109.3–1010.5 M� and 1010.5–1011.7 M�) areshown in Figure 7. For both samples, the ratio of galaxies occu-pying the massive bin is roughly 2:1 relative to the less massiveone; hence we are dealing with very massive galaxies. Evenif for the galaxies with stellar masses higher than ∼1010.5 M�there is a modest enhancement in the distortion fraction of theAGN hosts over the control sample (Figure 7, bottom panel), itis again within the 68% confidence interval, i.e., it is not sta-tistically significant. Therefore, it cannot be considered as anempirical proof of an enhancement at the massive end.
5. DISCUSSION
From a detailed analysis of the results of our visual classifi-cation, we showed that the fractions of heavily distorted activeand inactive galaxies are consistent within the central 68% confi-dence interval and that the Dist-2 fraction of AGN host galaxiesis less than twice that of the inactive galaxies at a 95% signif-icance level, as shown in Figures 5 and 6, respectively. Puttingthese findings in context, provided that the duration of mergersignatures and the visibility of the AGN phase overlap with eachother, this indicates that there is no evidence that major mergingplays a key role in the triggering of AGN activity in our sample.But what about the possible alternative scenario in which, in
8

The Astrophysical Journal, 726:57 (14pp), 2011 January 10 Cisternas et al.
Figure 7. Combined differences in distortions of intermediate (109.3 <
M∗/M� < 1010.5; top panel) and massive (1010.5 � M∗/M� < 1011.7; bottompanel) galaxies are shown. In both cases, the central 68% confidence levels(dashed lines) are consistent with zero (dotted line).
spite of a causal connection between merging and AGN trigger-ing, we do not detect an enhancement of merger signatures inthe AGN population due to a significant time lag between theinteraction and the start of the AGN phase? Below we addressthis possible alternative interpretation with some simple testsand discuss the implications of our results.
5.1. Alternative Interpretation: Time Lag Between Mergingand the Observability of the AGN Phase
Appealing simulations of mergers between gas-rich galaxiesstate that the peak of star formation and quasar activity will occurduring the final stages of the interaction, close to coalescence,within a more relaxed than distorted bulge-like remnant (DiMatteo et al. 2005; Springel et al. 2005). In these models, duringthe first passage only modest starbursts are triggered and nomajor BH accretion occurs, and therefore the galaxies wouldnot be detected as AGNs. Furthermore, ad hoc models thatinclude obscuration in galaxy mergers (Hopkins et al. 2005b)predict that, beginning from the early stages of the interaction,the AGN is “buried” for ∼90% of its lifetime by large columndensities, only revealing itself toward the end of the merger.However, all these models work with sub-grid prescriptions ofBH accretion and fail to spatially resolve the actual accretionprocess by several orders of magnitude.
If there is indeed a substantial time lag after merging priorto the AGN activity becoming detectable, then the strongmerging signatures we attempt to find could have already beenwashed out. Moreover, if AGNs are obscured as the interactinggalaxies coalesce, there could be a “contamination” populationof undetected strong BH activity occurring within our controlgalaxies undergoing a major merger. Finally, a third issue relatedto the obscuration plus time lag scenario is that the observedinteractions that are occurring on a fraction (∼15%) of ourAGN host galaxies should be unrelated to the detected BHaccretion—under the assumption of a large time lag we wouldnot expect to see strong merging signatures.
5.1.1. AGN Hosted by Disks: Not a Relic from a Major Merger
In the preceding text, we raised a possible alternative expla-nation for our results: that most major mergers could be missedbecause the time lag between merging and the observed AGN
episode could be substantial, washing out the signatures that theHST/ACS resolution allows us to detect.
Models can provide us with some clues about the observabil-ity timescales during an interaction. For example, simulationsof major mergers by Lotz et al. (2008) quantified that the strongsignatures could still be detected 0.7 Gyr after the merger, by de-grading their snapshots to the resolution of HST z ∼ 1 imaging.Thus, in order to explain the observed zero distortion enhance-ment, a lag of at least 0.7 Gyr between coalescence and thevisible phase of the AGN would be required for all galaxies.24
It is, however, not straightforward to rely on these studies todiscard the time lag issue; given the large number of parametersinvolved in determining how long a merger signature will re-main visible, it is plausible that several late-stage mergers couldhave been missed. Although a merger between gas-rich galaxiescan leave spectacular features for a long time, viewed from thewrong orientation they can be completely unnoticeable.
While it is difficult to assess the relevance for the timescaleissue of major mergers being overlooked, we can be reasonablyconfident that the remnant will not look like a disk. Spheroidaland bulge-dominated galaxies are usually said to be formedas a result of major mergers (e.g., Toomre 1977; Barnes &Hernquist 1996; Cox et al. 2006). However, it has also beenstated that disks can survive some major mergers, especiallyif the progenitors are gas-rich (e.g., Barnes & Hernquist 1996;Springel & Hernquist 2005; Hopkins et al. 2009): nonethelessthese kinds of merger remnants have been argued to not leadto a large bulge growth and significant BH fueling (Hopkins &Hernquist 2009). Likewise, it has been argued that some gas-rich mergers can lead to the regrowth of the disk (Hopkins et al.2009; Bundy et al. 2010). Even so, the timescales involved forsuch a process can be as much as an order of magnitude largerthan the typical quasar lifetime of 1–100 Myr (e.g., Porcianiet al. 2004; Hopkins et al. 2005b; Shen et al. 2007).
For the significant fraction of AGNs hosted by disks foundfrom our classification, we could safely say that the mecha-nism responsible for triggering those AGNs was not a pastmajor merger, suggesting also that since z ∼ 1 alternative fu-eling methods seem to play a larger role than usually expected.Georgakakis et al. (2009), from a sample of X-ray-selectedAGNs, compared the luminosity function of their disk-hostedAGNs against the analytic model of the X-ray AGN luminos-ity function for a stochastic accretion mode by Hopkins &Hernquist (2006). They showed that the model can reproduce theobservations, but at the same time the overall number densityof the observed disks was underpredicted, especially at highX-ray luminosities. On our sample of 140 AGNs, 18 sourceshave LX � 1044 erg s−1, from which 10 of their host galaxieswere classified as disk dominated with an agreement �80%.This suggests that alternative BH fueling methods (i.e., thosethat do not destroy the disk) are not only more common in theoverall AGN population at z < 1, but also much more efficientthan the existing models predict.
5.1.2. No Veiled X-ray Activity in Merging Galaxies
The aforementioned models leave the possibility that wecould be missing an important fraction of AGNs due to gas
24 For example, see Schawinski et al. (2010) who make an extensive case forthe time lag scenario. They propose an all-merger-driven AGN phase with atime lag of ∼500 Myr for their sample of early-type galaxies at z ∼ 0.05. Evenif their result is mainly based on the interpretation of their data as a causalsequence of events (and is subject to alternative explanations), they cautionthat their particular sample only accounts for a very small fraction (∼10%) ofthe overall AGN population found in the local universe.
9

The Astrophysical Journal, 726:57 (14pp), 2011 January 10 Cisternas et al.
Figure 8. Stacked Chandra images of 45 inactive galaxies likely to beundergoing a major interaction, on the soft 0.5–2 keV (left) and hard 2–8 keV(right) energy bands, showing the average radii of the stacked sources as whitecircles. The cutouts are 12′′ × 12′′.(A color version of this figure is available in the online journal.)
and dust obscuration when a gas-rich major merger is takingplace. Even though obscured AGNs can still be detected throughtheir hard X-ray emission (Hopkins et al. 2005a), it is possiblethat less luminous and highly obscured AGNs lie below thedetection threshold used to build the X-ray catalogs (Treisteret al. 2004). The X-ray properties of such obscured objectshave been successfully studied in the literature by the meansof a stacking analysis of X-ray data (e.g., Daddi et al. 2007;Fiore et al. 2009). If obscured AGNs are being missed, theyshould be preferentially found in merging galaxies. Therefore,in order to test this scenario and search for this potentially buriedX-ray activity, we stack all the inactive galaxies regardedas highly distorted. Eighty-seven inactive galaxies fulfill oursimultaneous criteria of being individually classified as eitherDist-1 or Dist-2 with an agreement of �75% and classified asDist-2 with an agreement �65%.
For this analysis, we take advantage of the higher sensitivity ofthe Chandra observations of the COSMOS field (C-COSMOS;Elvis et al. 2009), compared with the XMM-Newton data. Eventhough Chandra covered only half of the field (∼0.9 deg2), ithas a flux limit three times below the XMM-Newton sensitiv-ity, which makes the tradeoff in smaller coverage absolutelyjustifiable considering that we want to detect possible X-raysources below the XMM-Newton–COSMOS catalog sensitivitythreshold.
For the stacking of the X-ray data, we used the CSTACKtool25 developed by one of the authors (T.M.), which includes adetailed bootstrapping error analysis through 500 realizations.Because the stacking is made from multiple observations, weconsider the counts within a radius varying according to theoff-axis angle, corresponding to 90% of the encircled counts.We stacked the 45 objects that lie within the C-COSMOS area,after excluding one object that was close to an X-ray source.We found an excess of soft 0.5–2 keV and hard 2–8 keV countrates from the source region at modest levels of 2.2σ and 2.4σ ,respectively. Figure 8 shows the results of the stacking in thetwo energy bands, with the average radii of 3.′′4 and 3.′′7 forcomparison, within which no source is noticeable above thebackground level.
The lack of any obvious source after the stacking suggeststhat this moderate excess could be in part due to the expectedemission from star-forming galaxies and also from extended
25 http://cstack.ucsd.edu.
source emission (e.g., from a galaxy group). The possibility thata few sources dominate the overall count rate is unlikely since(1) the shape of the count rate distribution is that of a unimodalGaussian and (2) no outliers are present. Therefore, it is doubtfulthat we are missing a significant fraction of accreting BHshidden within the population of inactive galaxies undergoinginteractions.
5.1.3. No Enhanced Soft X-ray Absorption in MergingAGN Host Galaxies
As mentioned before, AGN obscuration due to the surround-ing gas and dust during a major merger would affect mainly thesoft X-ray energy band, while the hard band would remain unob-scured. If we observe an AGN hosted by a merging galaxy, andthis interaction was responsible for the BH activity, we wouldexpect to observe a hard X-ray spectrum from this source. Totrace the obscuration level of our interacting AGN host galaxies,we compute their X-ray hardness ratio (HR). The HR is definedas
HR = (H − S)/(H + S), (4)
where H and S stand for the hard (2–10 keV) and soft(0.5–2 keV) counts, respectively. At our redshift range, it isstill safe to say that the HR values lower than −0.2 correspondto an unabsorbed, soft spectrum (Hasinger 2008).
From our visual analysis, we have 13 AGN host galaxiesregarded as highly distorted with high agreement accordingto the criteria used before. By computing the HR for theseobjects, we find that, contrary to what models predict, all ofthese particular sources present soft X-ray spectra. All of themhave HR values �−0.2, with a mean of −0.53, which shows alow attenuation in the soft band.
It has been argued, however, that the HR diagnostic is rathercrude in terms of predicting obscuration, and indeed, brightCompton-thick AGNs can feature soft X-ray spectra due tophotoionized gas (Levenson et al. 2006). Even so, this is onlyvalid when the AGN is not observed directly, and we can easilyestablish that at least for the type-1 subsample this would notthe case and that we are certainly looking at active, accretingBHs. Looking only at the seven type-1 objects from these likelymerging galaxies, we find that the average HR is −0.56 whichindeed suggests a low level of obscuration.
One possible interpretation is that these interactions are notrelated to the observed AGN episode and that are instead onlychance encounters. Dissipationless or gas-poor mergers couldaccount for the lack of obscuration, but then it is unlikely thatany strong merging signatures and substantial accretion ontothe central BH would take place directly due to these kinds ofevents. Pierce et al. (2007) found the same result for X-ray-selected AGNs hosted by interacting galaxies, suggesting thatthe observed interactions were not responsible for the fueling ofthose accreting BHs.
From another perspective, however, the models men-tioned earlier are limited by the proposed picture of themerger–ULIRG–feedback–quasar timeline (e.g., Sanders et al.1988a, 1988b; Hopkins et al. 2008), which is already regardedas oversimplified. The AGN phase is said to happen after coa-lescence, but observations of large samples of ULIRGs, all ofthem undergoing interactions, have found a significant scatterin the trends of AGN contribution, accretion rate, and dust ob-scuration with merging state (Veilleux et al. 2009). Some ofthese have even been found to be dominated by the AGN inpre-merging state. Chaotic behavior during a merger event canlead to various unpredictable episodes of starburst and nuclear
10

The Astrophysical Journal, 726:57 (14pp), 2011 January 10 Cisternas et al.
activity. Such episodic behavior can start much earlier than thefinal coalescence and can be responsible for different periodsof gas inflows, obscuration, and visibility, therefore explainingan already unobscured merger-induced AGN still early duringthe interaction, as traced by the soft spectra observed in ourinteracting active galaxies. This conclusion, at the same time,contradicts the alternative time lag scenario.
5.2. Major Merging: Not the Most Relevant Mechanism
Our analysis has demonstrated that the scenario in whichmergers are responsible for triggering AGN activity after a sig-nificant time lag is unlikely. The high fraction of disks, the lackof a hidden significant AGN signal in merging inactive galax-ies, and the missing soft X-ray obscuration of interacting AGNhosts all appear to rule out this model as a possible explanationof our results. The absence of any further evidence in supportof this scenario leads us to the only remaining possible inter-pretation of our results: active galaxies are involved in majormergers no more frequently than inactive galaxies, and merg-ers have not played a leading role in AGN triggering for thelast 7.5 Gyr. Our results agree with the few recent studies thathave used a control sample (Dunlop et al. 2003; Grogin et al.2003, 2005; Pierce et al. 2007; Gabor et al. 2009; Reichardet al. 2009; Tal et al. 2009, and also with recent results from theE-CDFS by Bohm et al. 2010), in the sense that the morpholo-gies of the AGN host galaxies are not unusual and do not showa preference for merging systems. Of the studies mentionedearlier which supported a merger–AGN connection, many onlyprovided circumstantial evidence for such a link, without anycontrol sample comparisons.
The lack of enhancement on merging signatures for AGNhosts with respect to the background level indicates that thereis no causal connection between merging and AGN triggeringup to z ∼ 1 and M∗ ∼ 1011.7 M�, the galaxies dominatingBH growth at these redshifts. It is still a plausible scenario thatmajor mergers could be responsible for some of the brightestquasars; we do not intend to neglect this possibility, but in thecontext of a clean, large X-ray-selected population of AGNs,it is certainly not the most relevant mechanism. The largefraction of AGNs hosted by disk-dominated galaxies showsthat alternative mechanisms, i.e., stochastic processes and minormergers dominate, for this sample of objects.
The merger–starburst connection has also been widely studiedfrom the same perspective. Both mechanisms share the needfor enough cold gas to be brought to the central regions ofthe galaxy, so it is worth mentioning analogous conclusionsfrom the recent literature: (1) indeed, major mergers can triggerstrong starbursts (e.g., Mihos & Hernquist 1996; Springel 2000),but (2) not always, as seen in models (Di Matteo et al. 2007)and observations (Bergvall et al. 2003), and (3) its overallcontribution is relatively modest (Di Matteo et al. 2008; Jogeeet al. 2009), with no more than 10% of star formation in massivegalaxies being triggered by major mergers at z ∼ 0.6 (Robainaet al. 2009).
Different studies (e.g., Ballantyne et al. 2006; Hasinger 2008;Li et al. 2010) have converged on proposing the followingscenario: the major merger-driven evolution dominates earlyin the universe, producing the bulk of the brightest quasars atz = 2–3. Around z ∼ 1, however, a different evolutionarymechanism takes over, with secular processes becoming themain triggers for the BH activity and growth. While ouranalysis cannot be performed at higher redshifts with the currentobservational data set, our results appear to fit this picture.
Nevertheless, the overall relevance of major merging, evenin the early universe, has yet to be determined. Other recentstudies suggest that secular processes play a much larger role:observations of massive star-forming galaxies at z ∼ 2 haveshown that their buildup has been dominated by cold rapidaccretion and secular processes (Genzel et al. 2008), withoutthe need of major mergers. It has been stated on the basisof dark matter simulations that the likely number of majormergers is insufficient to account for the transformation of star-forming turbulent disks at z = 2 into ellipticals at z = 0 (Genelet al. 2008). A broader view of the accretion history of darkmatter halos by Genel et al. (2010) quantified that ∼60% of thedark matter in a given halo is contributed by mergers, withonly ∼20% being major mergers. Instead, the rest (∼40%)of the dark matter would be accreted smoothly. This alsoagrees with recent work using smooth particle hydrodynamicsimulations, stating that galaxies have acquired most of theirbaryonic mass through the cold mode of accretion (Keres et al.2005, 2009). Furthermore, merger-free models have shown thatisolated galaxies can reproduce the quasar duty cycles betweenz = 1 and 3 and feed their BHs with the recycled gas fromevolving stars (Ciotti & Ostriker 2007) and even reproduce theobserved scaling relations (Lusso & Ciotti 2010). Overall, thesestudies have shown that secular evolution can be highly relevant,also at the redshifts at which the peak of quasar activity occurs.
6. CONCLUSIONS
In this work, we performed a consistent visual analysison the HST-based morphologies of a sample of 140 X-ray-selected AGN host galaxies over z ∼ 0.3–1.0 and M∗ <1011.7 M� and compared them with a matched control sampleof inactive galaxies under the same conditions. Our goal was tosearch for the presence of any significant connection betweenmajor merging and BH fueling as suggested by models andobservational tests. In summary:
1. From our visual analysis, ∼85% of our AGN host galaxiesshow no strong distortions on their morphologies. Com-parison with the control sample shows that the distortionfractions are equal within the 68% central confidence level.Given our sample size, we can state that at a 95% confi-dence level the highly distorted fraction of AGN hosts isless than 1.9 times that of the inactive galaxies. Mergersand interactions involving AGN hosts are not dominant andoccur no more frequently than for inactive galaxies.
2. Over 55% of the AGNs from our sample are hosted by disk-dominated galaxies, implying a triggering mechanism thatwould not destroy the disk, i.e., not a major merger. Thisalso indicates that it is unlikely that we could be missingmajor mergers due to strong distortions having already beenwashed out over a large time lag prior to the ignition ofthe AGN. The presence of an important fraction of disk-dominated hosts on the AGNs brighter than LX > 1044 ergs−1 suggests that secular fueling mechanisms can be highlyefficient as well.
3. Through a detailed stacking analysis of the X-ray data ofour inactive galaxies undergoing mergers, we did not findan underlying X-ray signal indicating the presence of asubstantial population of obscured AGNs.
4. Looking at the hardness of the X-ray emission of ourAGN hosts that are clearly undergoing an interaction, wefound soft X-ray spectra in all of them, contradicting theexpected obscuration in this band predicted by models.
11

The Astrophysical Journal, 726:57 (14pp), 2011 January 10 Cisternas et al.
This can be either because the observed interactions arenot responsible for the BH fueling or the unpredictableoutput of a merger event allows many accretion phases aswell as an unobscured AGN, even during such early stages.
Our work explicitly suggests that, at least for the last 7.5 Gyr,major merging has not been the most relevant mechanism inthe triggering of typical AGNs, and that the bulk of the BHaccretion occurs through internal secular processes and minorinteractions. The alternative interpretation of a time lag betweenmerger trigger and AGN onset is unlikely due to the zeroenhancement of the distortion fraction, the high incidence ofdisks, and the absence of a significant X-ray signal in merginginactive galaxies as a potential buried AGN population.
M.C. thanks G. De Rosa for productive discussions, C. M.Urry for useful comments, and the anonymous referee for prac-tical suggestions. M.C., K.J., and K.I. are supported throughthe Emmy Noether Programme of the German Science Founda-tion (DFG). T.M. acknowledges support by CONACyT Apoyo83564 and UNAM-DGAPA PAPIIT IN110209.
Facilities: CXO, VLT:Melipal (VIMOS), HST (ACS),Magellan:Baade (IMACS), XMM, Subaru (SuprimeCam)
APPENDIX A
AGN–HOST GALAXY DECOMPOSITION
The light distributions of the type-1 AGNs are clearly domi-nated by the bright active nucleus, and because we want to ana-lyze the morphologies of their host galaxies, accurate removal ofthe nuclear source is of vital importance. This is done through arigorous two-dimensional parametric fitting with GALFIT, withwhich we reduce each system down to a two-component model:a PSF to represent the AGN and a Sersic light profile accountingfor the host galaxy. After subtraction of the modeled PSF, weare left with the host galaxy emission plus some residuals. Pre-vious simulations have shown that, at our resolution and S/N,it is sufficient with a single-component model to account forthe host galaxy rather than a more complex, multi-componentone (Sanchez et al. 2004; Simmons & Urry 2008). Regardingdouble-nucleus sources, which could need a dedicated mod-eling, we found only one object in our sample. This is alsoconsistent with the visual inspection by Civano et al. (2010) ofC-COSMOS sources. We checked for this particular source (Fig-ure 3, bottom left), for which our method removes the brightestof the two nuclei. The other point source is significantly fainterand does not dominate the overall galaxy brightness, hence notrequiring a more complex decomposition.
An appropriate initial guess of the parameters is recom-mended to get a faster and converging model with GALFIT.We opt to run Source Extractor (Bertin & Arnouts 1996) on ourcutouts to generate, in a fast and automatic way, rough estimatesof the free parameters of the Sersic profile, such as coordinateswithin the image, observed magnitude, axis ratio b/a, half-lightradius Re, and position angle.
To ensure a reliable decomposition, we take particular carethat the host galaxy is modeled with the least possible unneces-sary flux transfer between the PSF and the Sersic profile, whichwould result in either an oversubtraction or undersubtraction.We perform several GALFIT runs on each object with threedifferent choices for the Sersic index n: we fix it to an n = 1exponential profile (Freeman 1970), to an n = 4 de Vaucouleurs(1948) profile, and also leave it a as free parameter for GALFITto decide. To choose the right model, we need our best fit to
be reasonable in terms of the resulting parameters. We requireour host galaxy model: (1) not to be too concentrated or tooshallow, meaning a half-light radius between 2.5 pixels <Re <100 pixels, (2) not to diverge to extreme elongations, there-fore to have b/a > 0.5, and (3) to have its Sersic index within0.5 < n < 8 for the free n case. We interpret that if the valuesrun away from these boundaries, GALFIT did not manage tomodel the underlying galaxy but instead could be accountingfor uncertainties in the PSF.
The model with the least χ2 is chosen between those thatcomply with the above criteria. If the model with the free Sersicindex is chosen among the three cases, we reassign the index andmodel it as follows: (1) if n < 2 then n = 1, (2) if 2 � n � 3then n = 2.5, and (3) if n > 3 then n = 4.
A key aspect of the AGN–host galaxy decomposition is thechoice of an accurate PSF, both for modeling the AGN itselfand for deconvolving the host galaxy light distribution. Eventhough the space-based HST provides extremely precise PSFs,instrumental effects are still important. The position of the targetwithin the detector and the temporal variability along differentorbits can lead to discrepancies between the PSFs from theobservations and the ones used for the analysis. This yieldssystematic errors in the image decomposition which can becritical for very bright AGNs. The COSMOS survey providesus with the opportunity to minimize these spatial and temporaleffects by using stellar PSFs from stars observed under the sameconditions as our targets. For each object, we build specific PSFsby averaging the nearest ∼30 stars in the same manner as othersimilar studies with large HST coverage (Jahnke et al. 2004;Sanchez et al. 2004). The rms error from the creation of eachPSF is propagated to the intrinsic variance of the AGN; theuncertainty of the object being fitted is required by GALFIT inorder to converge to a minimum normalized χ2.
APPENDIX B
CREATING MOCK AGN HOSTS
For our type-1 AGN subsample, we build a special compari-son sample of simulated AGN hosts by adding stars as fake nu-clei to our inactive galaxies. To remain true to the characteristicblue colors of the AGNs, we perform an initial selection of starsfrom the COSMOS ACS archive by placing color cuts in (B − V)< 0.75 and (V − R) < 0.95. For each of the control galaxies, welook for stars that match the contrast level between the fluxes ofthe host and nucleus (H/N) of the corresponding AGN. With amatching star found, we simply add it over the centroid of thegalaxy.
We then apply the same point-source removal procedure asfor the original type-1 sources. PSFs are created exactly asbefore, and the light contributions of the star and the underlyinggalaxy are separated using GALFIT. With the exception ofthree unsuccessful fits, we are left with 727 simulated nucleus-subtracted AGN host galaxies that will serve as an appropriatecomparison sample for our type-1 AGN hosts.
APPENDIX C
TESTING THE RELIABILITY OF THE IMAGEDECOMPOSITION
The creation of a sample of simulated nucleus-subtractedhosts from a starting point of real galaxies and stars gives usthe opportunity to check the impact of our point-source removaltechnique and to see whether this technique is biased. How
12

The Astrophysical Journal, 726:57 (14pp), 2011 January 10 Cisternas et al.
Figure 9. Difference in the observed magnitudes (IF814W) of the comparison galaxies before (in) and after (out) the point source addition/subtraction. The left-handpanel plots this difference against the initial magnitude and the right-hand panel against the host to nucleus flux ratio, H/N. The 1σ deviation away from the mean is0.23 mag, indicated by the shaded area centered at 0.03 mag.
significant are the residuals? We have performed photometry onthe control galaxies before and after the addition/subtractionof the fake nucleus. If a large magnitude offset were to befound, we would have had to consider reselecting our controlsample, because we would inevitably be comparing active andinactive galaxies with different observed magnitudes. We findthat, on average, the galaxies are fainter by 0.03 mag after thesubtraction, with a 1σ deviation of 0.23 mag. Figure 9 showsthe difference between the initial and recovered magnitudesfor the hosts as a function of the initial magnitudes and H/Nratio for our control galaxies. There is no obvious correlationbetween the offset and the initial magnitudes of the galaxies, butas expected the recovered values tend to be less exact for morecompact galaxies and brighter active nuclei.
These results show that this technique is trustworthy, and theoffset found can be considered negligible and does not affectour choice of a comparison sample.
REFERENCES
Bahcall, J. N., Kirhakos, S., Saxe, D. H., & Schneider, D. P. 1997, ApJ, 479,642
Ballantyne, D. R., Everett, J. E., & Murray, N. 2006, ApJ, 639, 740Barnes, J. E., & Hernquist, L. E. 1991, ApJ, 370, L65Barnes, J. E., & Hernquist, L. 1996, ApJ, 471, 115Bell, E. F., & de Jong, R. S. 2001, ApJ, 550, 212Bell, E. F., Phleps, S., Somerville, R. S., Wolf, C., Borch, A., & Meisenheimer,
K. 2006, ApJ, 652, 270Bennert, N., Canalizo, G., Jungwiert, B., Stockton, A., Schweizer, F., Peng,
C. Y., & Lacy, M. 2008, ApJ, 677, 846Bergvall, N., Laurikainen, E., & Aalto, S. 2003, A&A, 405, 31Bertin, E., & Arnouts, S. 1996, A&AS, 117, 393Bohm, A., et al. 2010, A&A, submittedBrusa, M., et al. 2007, ApJS, 172, 353Brusa, M., et al. 2010, ApJ, 716, 348Bundy, K., Fukugita, M., Ellis, R. S., Targett, T. A., Belli, S., & Kodama, T.
2009, ApJ, 697, 1369Bundy, K., et al. 2010, ApJ, 719, 1969Canalizo, G., Bennert, N., Jungwiert, B., Stockton, A., Schweizer, F., Lacy, M.,
& Peng, C. 2007, ApJ, 669, 801Canalizo, G., & Stockton, A. 2000, AJ, 120, 1750Canalizo, G., & Stockton, A. 2001, ApJ, 555, 719Capak, P., et al. 2007, ApJS, 172, 99Cappelluti, N., et al. 2009, A&A, 497, 635Ciotti, L., & Ostriker, J. P. 2007, ApJ, 665, 1038Civano, F., et al. 2010, ApJ, 717, 209Cole, S., Lacey, C. G., Baugh, C. M., & Frenk, C. S. 2000, MNRAS, 319, 168Cox, T. J., Jonsson, P., Primack, J. R., & Somerville, R. S. 2006, MNRAS, 373,
1013Cox, T. J., Jonsson, P., Somerville, R. S., Primack, J. R., & Dekel, A.
2008, MNRAS, 384, 386Daddi, E., et al. 2007, ApJ, 670, 173de Vaucouleurs, G. 1948, Ann. Astrophys., 11, 247
Di Matteo, P., Bournaud, F., Martig, M., Combes, F., Melchior, A., & Semelin,B. 2008, A&A, 492, 31
Di Matteo, P., Combes, F., Melchior, A., & Semelin, B. 2007, A&A, 468, 61Di Matteo, T., Springel, V., & Hernquist, L. 2005, Nature, 433, 604Dunlop, J. S., McLure, R. J., Kukula, M. J., Baum, S. A., O’Dea, C. P., &
Hughes, D. H. 2003, MNRAS, 340, 1095Elvis, M., et al. 2009, ApJS, 184, 158Ferrarese, L., & Merritt, D. 2000, ApJ, 539, L9Fiore, F., et al. 2009, ApJ, 693, 447Freeman, K. C. 1970, ApJ, 160, 811Gabor, J. M., et al. 2009, ApJ, 691, 705Gebhardt, K., et al. 2000, ApJ, 539, L13Gehren, T., Fried, J., Wehinger, P. A., & Wyckoff, S. 1984, ApJ, 278, 11Genel, S., Bouche, N., Naab, T., Sternberg, A., & Genzel, R. 2010, ApJ, 719,
229Genel, S., et al. 2008, ApJ, 688, 789Genzel, R., et al. 2008, ApJ, 687, 59Georgakakis, A., et al. 2009, MNRAS, 397, 623Giavalisco, M., et al. 2004, ApJ, 600, L93Granato, G. L., De Zotti, G., Silva, L., Bressan, A., & Danese, L. 2004, ApJ,
600, 580Grogin, N. A., et al. 2003, ApJ, 595, 685Grogin, N. A., et al. 2005, ApJ, 627, L97Gunn, J. E. 1979, in Active Galactic Nuclei, ed. C. Hazard & S. Mitton
(Cambridge: Cambridge Univ. Press), 213Haring, N., & Rix, H. 2004, ApJ, 604, L89Hasinger, G. 2008, A&A, 490, 905Hasinger, G., et al. 2007, ApJS, 172, 29Heckman, T. M., Bothun, G. D., Balick, B., & Smith, E. P. 1984, AJ, 89, 958Hernquist, L. 1989, Nature, 340, 687Hopkins, P. F., Cox, T. J., Younger, J. D., & Hernquist, L. 2009, ApJ, 691, 1168Hopkins, P. F., & Hernquist, L. 2006, ApJS, 166, 1Hopkins, P. F., & Hernquist, L. 2009, ApJ, 694, 599Hopkins, P. F., Hernquist, L., Cox, T. J., Di Matteo, T., Martini, P., Robertson,
B., & Springel, V. 2005a, ApJ, 630, 705Hopkins, P. F., Hernquist, L., Cox, T. J., & Keres, D. 2008, ApJS, 175, 356Hopkins, P. F., Hernquist, L., Cox, T. J., Robertson, B., & Krause, E. 2007, ApJ,
669, 45Hopkins, P. F., Hernquist, L., Martini, P., Cox, T. J., Robertson, B., Di Matteo,
T., & Springel, V. 2005b, ApJ, 625, L71Hutchings, J. B., Crampton, D., Campbell, B., Duncan, D., & Glendenning, B.
1984, ApJS, 55, 319Hutchings, J. B., Johnson, I., & Pyke, R. 1988, ApJS, 66, 361Hutchings, J. B., & Neff, S. G. 1992, AJ, 104, 1Ilbert, O., et al. 2009, ApJ, 690, 1236Ilbert, O., et al. 2010, ApJ, 709, 644Jahnke, K., & Maccio, A. 2010, ApJ, submitted (arXiv:1006.0482)Jahnke, K., et al. 2004, ApJ, 614, 568Jogee, S. 2006, in Physics of Active Galactic Nuclei at all Scales, ed. D. Alloin
(Lecture Notes in Physics, Vol. 693; Berlin: Springer), 143Jogee, S., et al. 2009, ApJ, 697, 1971Kartaltepe, J. S., et al. 2010, ApJ, 721, 98Kauffmann, G., & Haehnelt, M. 2000, MNRAS, 311, 576Kauffmann, G., White, S. D. M., & Guiderdoni, B. 1993, MNRAS, 264, 201Keres, D., Katz, N., Fardal, M., Dave, R., & Weinberg, D. H. 2009, MNRAS,
395, 160Keres, D., Katz, N., Weinberg, D. H., & Dave, R. 2005, MNRAS, 363, 2
13

The Astrophysical Journal, 726:57 (14pp), 2011 January 10 Cisternas et al.
Koekemoer, A. M., et al. 2007, ApJS, 172, 196Kormendy, J., & Kennicutt, R. C., Jr. 2004, ARA&A, 42, 603Kormendy, J., & Richstone, D. 1995, ARA&A, 33, 581Leauthaud, A., et al. 2007, ApJS, 172, 219Levenson, N. A., Heckman, T. M., Krolik, J. H., Weaver, K. A., & Zycki, P. T.
2006, ApJ, 648, 111Lilly, S. J., et al. 2007, ApJS, 172, 70Lin, L., et al. 2008, ApJ, 681, 232Lintott, C. J., et al. 2008, MNRAS, 389, 1179Li, Y., Wang, J., Yuan, Y., Hu, C., & Zhang, S. 2010, ApJ, 710, 878Lotz, J. M., Jonsson, P., Cox, T. J., & Primack, J. R. 2008, MNRAS, 391,
1137Lusso, E., & Ciotti, L. 2010, A&A, in press (arXiv:1009.5292)Lusso, E., et al. 2010, A&A, 512, A34Lynden-Bell, D. 1967, MNRAS, 136, 101Magorrian, J., et al. 1998, AJ, 115, 2285Mainieri, V., et al. 2007, ApJS, 172, 368Malkan, M. A., Gorjian, V., & Tam, R. 1998, ApJS, 117, 25Marconi, A., & Hunt, L. K. 2003, ApJ, 589, L21Martini, P. 2004, in IAU Symp. 222, The Interplay Among Black Holes, Stars
and ISM in Galactic Nuclei, ed. T. Storchi-Bergmann, L. C. Ho, & H. R.Schmitt (Cambridge: Cambridge Univ. Press), 235
Mihos, J. C., & Hernquist, L. 1996, ApJ, 464, 641Mushotzky, R. 2004, in Astrophys. Space Sci. Libr. 308, Supermassive Black
Holes in the Distant Universe, ed. A. J. Barger (Dordrecht: Kluwer), 53Peng, C. Y. 2007, ApJ, 671, 1098Peng, C. Y., Ho, L. C., Impey, C. D., & Rix, H. 2010, AJ, 139, 2097Peng, C. Y., Ho, L. C., Impey, C. D., & Rix, H.-W. 2002, AJ, 124, 266Pierce, C. M., et al. 2007, ApJ, 660, L19Porciani, C., Magliocchetti, M., & Norberg, P. 2004, MNRAS, 355, 1010Ramos Almeida, C., Tadhunter, C. N., Inskip, K. J., Morganti, R., Holt, J., &
Dicken, D. 2010, MNRAS, in press (arXiv:1008.2683)Reichard, T. A., Heckman, T. M., Rudnick, G., Brinchmann, J., Kauffmann, G.,
& Wild, V. 2009, ApJ, 691, 1005Richstone, D., et al. 1998, Nature, 395, A14Rix, H., et al. 2004, ApJS, 152, 163Robaina, A. R., Bell, E. F., van der Wel, A., Somerville, R. S., Skelton,
R. E., McIntosh, D. H., Meisenheimer, K., & Wolf, C. 2010, ApJ, 719,844
Robaina, A. R., et al. 2009, ApJ, 704, 324Salvato, M., et al. 2009, ApJ, 690, 1250Sanchez, S. F., et al. 2004, ApJ, 614, 586Sanders, D. B., & Mirabel, I. F. 1996, ARA&A, 34, 749Sanders, D. B., Soifer, B. T., Elias, J. H., Madore, B. F., Matthews, K.,
Neugebauer, G., & Scoville, N. Z. 1988a, ApJ, 325, 74
Sanders, D. B., Soifer, B. T., Elias, J. H., Neugebauer, G., & Matthews, K.1988b, ApJ, 328, L35
Scarlata, C., et al. 2007, ApJS, 172, 406Schade, D. J., Boyle, B. J., & Letawsky, M. 2000, MNRAS, 315, 498Schawinski, K., Dowlin, N., Thomas, D., Urry, C. M., & Edmondson, E.
2010, ApJ, 714, L108Scoville, N., et al. 2007a, ApJS, 172, 38Scoville, N., et al. 2007b, ApJS, 172, 1Sersic, J. L. 1968, Atlas de Galaxias Australes (Cordoba, Argentina: Observa-
torio Astronomico)Shen, Y., et al. 2007, AJ, 133, 2222Simkin, S. M., Su, H. J., & Schwarz, M. P. 1980, ApJ, 237, 404Simmons, B. D., & Urry, C. M. 2008, ApJ, 683, 644Soltan, A. 1982, MNRAS, 200, 115Somerville, R. S., Hopkins, P. F., Cox, T. J., Robertson, B. E., & Hernquist, L.
2008, MNRAS, 391, 481Somerville, R. S., Primack, J. R., & Faber, S. M. 2001, MNRAS, 320, 504Springel, V. 2000, MNRAS, 312, 859Springel, V., Di Matteo, T., & Hernquist, L. 2005, MNRAS, 361, 776Springel, V., & Hernquist, L. 2005, ApJ, 622, L9Stockton, A. 1982, ApJ, 257, 33Stockton, A., & Ridgway, S. E. 1991, AJ, 102, 488Surace, J. A., & Sanders, D. B. 1999, ApJ, 512, 162Surace, J. A., Sanders, D. B., & Evans, A. S. 2000, ApJ, 529, 170Surace, J. A., Sanders, D. B., Vacca, W. D., Veilleux, S., & Mazzarella, J. M.
1998, ApJ, 492, 116Tal, T., van Dokkum, P. G., Nelan, J., & Bezanson, R. 2009, AJ, 138, 1417Taniguchi, Y. 1999, ApJ, 524, 65Toomre, A. 1977, in Evolution of Galaxies and Stellar Populations, ed. B. M.
Tinsley & R. B. Larson (New Haven, CT: Yale Univ. Obs.), 401Toomre, A., & Toomre, J. 1972, ApJ, 178, 623Treister, E., et al. 2004, ApJ, 616, 123Tremaine, S., et al. 2002, ApJ, 574, 740Trump, J. R., et al. 2007, ApJS, 172, 383Trump, J. R., et al. 2009, ApJ, 696, 1195Urrutia, T., Lacy, M., & Becker, R. H. 2008, ApJ, 674, 80van der Wel, A., Rix, H., Holden, B. P., Bell, E. F., & Robaina, A. R. 2009, ApJ,
706, L120Veilleux, S., et al. 2009, ApJS, 182, 628Volonteri, M., Haardt, F., & Madau, P. 2003, ApJ, 582, 559Wada, K. 2004, in Coevolution of Black Holes and Galaxies, ed. L. C. Ho
(Cambridge: Cambridge Univ. Press), 186Wyithe, J. S. B., & Loeb, A. 2003, ApJ, 595, 614Yu, Q., & Tremaine, S. 2002, MNRAS, 335, 965Zakamska, N. L., et al. 2006, AJ, 132, 1496
14