the bulk hydraulic conductivity and storativity of
TRANSCRIPT

Retrospective Theses and Dissertations Iowa State University Capstones, Theses andDissertations
1-1-1991
The bulk hydraulic conductivity and storativity ofWisconsin age unoxidized till in Central IowaScott Dennis DicksonIowa State University
Follow this and additional works at: https://lib.dr.iastate.edu/rtd
Part of the Agriculture Commons
This Thesis is brought to you for free and open access by the Iowa State University Capstones, Theses and Dissertations at Iowa State University DigitalRepository. It has been accepted for inclusion in Retrospective Theses and Dissertations by an authorized administrator of Iowa State University DigitalRepository. For more information, please contact [email protected].
Recommended CitationDickson, Scott Dennis, "The bulk hydraulic conductivity and storativity of Wisconsin age unoxidized till in Central Iowa" (1991).Retrospective Theses and Dissertations. 17601.https://lib.dr.iastate.edu/rtd/17601

I
The bulk hydraulic conductivity and storativlty of Wisconsin age
unoxidized till in Central Iowa
A Thesis Submitted to the
Graduate Faculty in Partial Fulfillment of the
Requirements for the Degree of
MASTER OF SCIENCE
Department: Civil & Construction Engineering Interdepartment Major: Water Resources
/99/ £?<T4,/ Scott Dennis Dickson
by
c• /
Approved:
Signatures have been redacted for privacy
Iowa State University Ames, Iowa
1991

11
TABLE OF CONTENTS
Page
INTRODUCTION AND OBJECTIVES 1
LITERATURE REVIEW 3
Field Site Literature 6
MATERIALS AND METHODS 11
Field Site 11
Well Construction and Development 13
Pump Test Procedures 18
Pump Test 1 Performance 18
Pump Test 2 Performance 19
Pump Test Analysis Methods 25
Theis solution 25
Superposition 27
Partially penetrating wells 29
Pumping Test Results 30
Bail Tests 35
Performance 35
Analysis methods 36
Results 39
SUMMARY AND DISCUSSION 48

111
RECOMMENDATION FOR FURTHER RESEARCH 51
REFERENCES 52
ACKNOWLEDGEMENTS 55

iv
LIST OF FIGURES
Figure 1. Location of well field 5
Figure 2. Plan view of the well layout
Figure 3. Vertical cross-section of wells IW-1 and MW-1
Figure 4. . Vertical cross-section of well SW-1
Figure 5. Pump test 1 pumping rate curve
Figure 6. Pump test 1 MW-1 drawdown response and recovery
Figure 7. Pump test 2 pumping rate curve
Figure 8. Pump test 2 MW-1 drawdown response and recovery
Figure 9. Pump test 1 drawdown in MW-1 vs. time and least squares fit
Figure 10. Pump test 2 drawdown in MW-1 vs. time and least squares fit
Figure 11. IW-1 predevelopment bail test recovery vs. time and least squares fit
Figure 12. MW-1 predevelopment bail test recovery vs. time and least squares fit
Figure 13. IW-1 bail test recovery vs. time and least squares fit
Figure 14. MW-1 bail test recovery vs. time and least squares fit
Figure 15. IW-1 bail test recovery vs. time and least
Page
12
14
15
17
20
21
23
24
32
33
41
42
43
44
45
V
squares fit
Figure 16. MW-1 ball test recovery vs. time and least squares fit
46

INTRODUCTION AND OBJECTIVES
Much of Iowa Is covered with multiple layers of glacial material from
the four most recent glacial periods of the Pleistocene epoch (Anderson,
1983). Glaciers have deposited poorly sorted tills interspersed with sorted
and stratified glacial outwash materials. Some sorting occurred where
meltwaters deposited sediment, resulting In sand and gravel lenses. The
mass of Ice that overlaid the till would determine the amount of
compression of the deposits. The hydraulic properties of glacial tills are
different as a result of the deposltlonal environment and the mineralology of
the parent material. Since deposition, weathering processes and vegetation
have altered the uppermost layer of the till producing the oxidized layer.
Below this oxidized till lies a very dense unoxidized till.
Structural features, such as fractures, and deposltlonal features such
as sand Inclusions In tills alter the hydraulic properties, enhancing the
capability of groundwater flow which may Increase the potential for
contaminant migration. The variability of flow regime in glacial tills has
implications for environmental assessment, waste disposal, wetland
management, and agricultural practices. Landfills releasing leachate,
underground leaking storage tanks releasing hydrocarbons, chemical spills,
and agricultural fertilizers and pesticides are common problems that affect
groundwater quality. Many of these problems occur In the dense unoxidized
till where little field research has been done to show bulk hydraulic
conductivity and storatlvlty.

2
The selection of suitable sites for waste disposal facilities Is based
upon hydrogeological studies. Hydraulic conductivity is the parameter
describing a material's ability to transmit water and Is a function of the
porous medium and the fluid flowing through It. Hydraulic conductivity
values based on laboratory tests may severely underestimate the
contaminant migration rates (Goodall and Quigley, 1977). More detailed
information on the spatial variability of hydraulic conductivity will be
useful In determining groundwater flow patterns affecting groundwater
monitoring, contaminant migration, predicting rates and direction of
movement, and determining the most suitable remedial action. With the
multitude of new regulations affecting groundwater remediation, field
measurements of hydraulic conductivity will become Increasingly Important
in order to more accurately determine rates of contaminant migration.
The objectives of this research are to obtain reliable In-sltu data for
the determination of hydrological characteristics of the Wisconsin aged
unoxidized glacial till and to determine If a constant-head pumping test Is a
suitable method for finding the bulk hydraulic conductivity and storatlvlty
of the till. This will be accomplished by comparing results from the
pumping tests and ball tests with previous studies on the site and with
studies from similar North American till research. The constant-head
pumping test was selected due to the extremely low pumping rates possible
in unoxidized till. Ball tests were performed for comparison of values with
the pumping test results.

3
LITERATURE REVIEW
Very little work has been done with In-sltu hydraulic testing of
unoxidized glacial tills to determine hydraulic conductivity and storatlvlty.
Tills are generally believed to have low hydraulic conductivities which
retard the vertical movement of water, although fractures produce
secondary permeabilities which are much higher than the till matrix
(Hendry, 1988). Grlsak and Cherry (1975) believe the most 11kely cause of
fracturing of till Is crustal extension that has occurred during the post¬
glacial uplift. Most hydologlcal research on glacial tills has consisted of
laboratory permeameter tests which tend to produce hydraulic
conductivities 10 to 1000 times lower than that of field measurements
(Herzog et al., 1989). Keller, Van Der Kamp, and Cherry (1985) found bulk
permeability exceeded matrix permeability by two orders of magnitude In
unoxidized glacial till In Saskatchewan, Canada. This large difference may
be attributed to the lack of fractures or discontinuous sand lenses
encountered In the small laboratory samples. Keller, Van Der Kamp, and
Cherry (1988) found that the presence of secondary conductive features Is
responsible for the higher values of hydraulic conductivity for slug tests
when compared to laboratory permeameter tests in unoxidized till. This
study also revealed that, as the well screen length Increases, the slug test
hydraulic conductivity exhibits less variability and the values tend to be
closer to the true bulk hydraulic conductivity. Grlsak and Cherry (1975)
found evidence that fractures that are open and Interconnected control the
bulk hydraulic conductivity of the glacial till in Manitoba, Canada. Ruland,

4
Cherry, and Feenstra (1991) suggest that vertical bore holes, because of the
Increase in fracture spacing with depth, may miss Intersecting enough
fractures to accurately determine the number of vertical fractures In deeper
clay tills. D'Astous et al. (1988) found that larger diameter wells and
angled drilling both have a higher probability of intersecting vertical
fractures, allowing measurement of of a bulk hydraulic conductivity that Is
In the range expected for fracture flow In glacial till.
Piezometers may not accurately reflect true contaminant concentration
In glacial till If the bore hole has not Intersected the higher permeability
fractures which are the primary paths of flow. D'Astous et al. (1988)
observed a smear zone In the bore hole caused by the spiralling action of the
auger resulting In occluded fractures at the bore-hole periphery. This will
substantially reduce the hydraulic pathways which makes well development
a critical step before field testing to determine hydraulic parameters. It
was noted that during a period of drought, clay units with fractures drained
more rapidly than blocks of clay matrix. Fluctuations In water levels due to
the growing season evapotransplratlon Is much more pronounced In fractured
clays than In unfractured clays. This Is a result of the low permeability
deposits inhibiting water movement even with a considerable hydraulic
gradient (Ruland, Cherry, and Feenstra, 1991).
Cravens and Ruedislll (1987) determined that oxidized till is recharged
through root holes and discharges primarily through evapotransplratlon
rather than to the underlying unoxidized till. Fracture frequency and the
degree of interconnectedness decreases with depth which causes hydraulic
conductivity values to decrease with depth below the ground surface

5
(Ruland, Cherry, and Feenstra, 1991). The reduction of hydraulic
conductivity with depth Is also attributed to overburden pressure (Prudlc,
1982). Grlsak and Cherry (1975) found evidence that suggests
Interconnected fractures In till, rather than Intergranular pore network,
control the bulk hydraulic conductivity. Fractures In tills have been found at
depths of 15 meters (50 ft) In southeastern Manitoba (Grlsak and Cherry,
1975).
Hendry (1982) observed sand layers and streaks In both the weathered
and unweathered till zones of the Interior Plains Region of southern Alberta,
Canada. Ground-water velocity In the downward direction Is approximately
2-6 meters/1000 years while the lateral movement is approximately 9
meters/1000 years. The low lateral value Is attributed to the relatively
flat surflclal topography. Field tests In South Dakota tills revealed no
significant migration of water between the oxidized and unoxidized tills
(Cravens and Ruedlslll, 1987). In some regions of North America where
deposits of glacial till are thin, fractures may penetrate the entire unit
allowing groundwater flow through the fractures to the underlying aquifers
(Ruland, Cherry, and Feenstra, 1991). Hydraulic conductivities determined
from field tests in unoxidized tills In Canada range from 1.8 X 10⁻⁶ - 6.3 X
10~9 cm/s. Studies of Illinois and Wisconsin unoxidized tills range from 3.2
X 10-5 - 8.4 X 10"8 cm/s. Results from selected studies can be found In
Table 1.
Glacial tills of the St. Clair Basin of Ontario, Canada are comprised of
40-60% clay, 30-40% silt, and 5-10% sand (Desaulnlers, Cherry, and Fritz,
1981). Hendry (1988) found oxidized and unoxidized tills had similar

6
textures and matrix hydraulic conductivities In studies In Ontario, Canada.
Bradbury (1991) found that the larger scale measurements gave higher
values of hydraulic conductivity. Significant deposltlonal environment
changes over a short distance can severely alter the hydraulic conductivity,
therefore field measurements to determine permeability should be on the
same scale as the field problem (Bradbury, 1991). Particle size distribution
produced widely varying results when used to estimate hydraulic
conductivity. However, investigators often base sampling and testing
methods on economic factors which may not produce the most accurate
estimates of hydrological parameters (Bradbury and Muldoon, 1990).
Field Site Literature
Table 2 summarizes the hydraulic conductivity tests of the till at the
study site, and Identifies the reported value, the type of test used to
determine hydraulic conductivity, and the Investigator. Lutenegger (1989)
reports finding no indication of fractures at depths below 4 meters (13 ft)
in the massive gray till which Is unoxidized and unleached. In field tests by
Jones, Raafl, and Tsai (1990) In the oxidized till, the average hydraulic
conductivity was 2.0 x 10~4 cm/s and the specific yield was 0.04.
Lutenegger (1990) found that hydraulic conductivity ranging In values from 2
x 10~8 cm/s to 5.3 x 10~8cm/s In samples taken at 6 meters (20 ft),
decreased as confining pressure Increased.
With higher levels of confining stress, micro-cracks may seal and
porosity may be reduced due to consolidation. In trlaxlal permeability tests,

7
Table 1. Reported hydraulic conductivity values of glacial till
Hydraulic conductivity (cm/s)
Depth (m)
Test Location Investigator
0.8-4.0X 10"8 9.5 slug Ontario, Canada Ruland, Cherry, & Feenstra
1.8-2.2 x 10⁻⁸ 11.2 slug Saskatchewan, Canada
Keller, Van Der Kamp, & Cherry
3.9-8.4X 10"8 n.g. slug Wllsonvllle, Illinois
Herzog, et al.
8.5 x 10"7 n.g. recovery Vandalla till Herzog, et al.
6.3 x 10⁻⁷- 3.2 X 10⁻⁵
n.g. slug Eastern Wisconsin
Bradbury &Muldoon
1.6 x 10⁻⁸ 11.6 slug Sarnia, Ontario Canada
Goodall & Quigley
2-7X 10⁻⁵ n.g. slug Sarnia, Ontario Canada
D'Astous
6.13 x 10⁻⁹ n.g. slug Manitoba, Canada
Orlsak & Cherry
6 X 10"8 n.g. slug New York Prudic
4.27 X 10⁻⁷ n.g. slug South Dakota Cravens & Ruedlslll
3.9 X 10⁻⁷ (V) 8.8 lab Eastern Iowa Lutenegger
8.0 X 10"9 (V) n.g. lab Eastern Iowa Lutenegger
9.8 X 10⁻⁹ (H) n.g. lab Eastern Iowa Lutenegger

8
Handy and Wang (1990) found that lateral stresses are many times higher
than the present overburden pressures, some of which were high enough to
effectively close vertical fractures.
Lutenegger (1989) believes that below 9 meters (30 ft), hydraulic
conductivity is nearly unchanged with an average value of 1.7 x 10⁻⁸ cm/s.
Lutenegger (1989) also found very little difference In measured values of
vertical and horizontal values. Tsai (1991) determined that the average
hydraulic conductivity of the oxidized till at field 5 to be 5 x 10⁻⁴ cm/s. At
a depth from 9-18 meters (30-60 ft) the mean hydraulic conductivity from
recovery tests was found to be 1.8 x 10⁻⁶ cm/s (Everts, et al., 1990).
Estimates of hydraulic conductivity based on DMT dissipation tests show
values of approximately 1 x 10⁻⁶ cm/s while flexible-wall hydraulic
conductivity tests showed 1 x 10⁻⁷ cm/s. Shelby tube cores taken at 11.5
meters (38 ft) depth were lab tested for saturated hydraulic conductivity by
Lutenegger (1989) revealing average values of 444 x 10-7 cm/s to 2.94 x
10~6 cm/s. Through recovery tests, Kanwar et al. (1989) found the
geometric mean hydraulic conductivity to be 4.1 x 10⁻⁶ cm/s with a range
from 4.8 x 10⁻⁷ cm/s to 1.5 x 10~4 cm/s. Using two-foot screens, Kanwar
et al. (1989) obtained hydraulic conductivity values of 5.3 x 10⁻⁷ cm/s at
10.5 meters (35 ft) depth and 9.9 x 10⁻⁷ cm/s at 12 meters (40 ft) depth.
Shorter screens tend to produce lower hydraulic conductivity values
since they are more likely to miss fractures and sand Inclusions. From 9.5-
13.7 meters (31 to 45 ft) below the ground surface, the geometric mean
hydraulic conductivity of the unoxidized till Is 1.2 x 10~6 cm/s (Kanwar,
1989). Lutenegger (1989) found very little anisotrophy In the hydraulic

9
conductivity values as the horizontal flow generally gave the same results
as the vertical flow. In Trlaxlal permeability tests, Handy and Wang (1990)
found the hydraulic conductivity of the unweathered till ranged from 1x10"
8 cm/s to 1 x 10⁻⁷ cm/s.
In trlaxlal compression tests conducted at this site by Lutenegger
(1990), at depths of 9 meters (30 ft) In the unoxidized till, the % water *
13.9%, and the porosity = 26.6%. Lutenegger (1989) reported an average
porosity of 27% for the unoxidized till and 30-40% for the overlying
oxidized till. Tsai (1991) determined the bulk densities of the oxidized till
and the unoxidized till to be 1.84 g/cm3 and 1.91 g/cm3 respectively for
this site. The till Is classified as a sandy loam close to loam with average
percentages of particle size: clay = 10.7%, silt = 31.8%, sand = 54.1%, and
gravel = 3.5% (Tsai, 1991). Lutenegger (1989) reported the bulk weight
measurements of the oxidized till was 1.85 g/cc and 1.95 g/cc for the
unoxidized till, and water content ranged from 13-15% for the unoxidized
till and 15-23% for the oxidized till. Recharge estimates for the unoxidized
till at a depth of 6-12 meters (20-40 ft) averaged 2 cm over a 14 month
period (Everts et al. 1990).

10
Table 2. Reported hydraulic conductivity values at the test site.
Hydraulic conductivity (cm/s)
Depth (m)
Test Investigator
2 - 5x 10⁻⁸ 6 confining stress Lutenegger
1.7 x 10⁻⁸ 9 flexible wall Lutenegger
5 x 10-*(ox1d) 2 pump Tsai
1 x 10"7 n.g. flexible wall Everts et al.
1 x 10"8 9-18 DMT dissipation Everts et al.
4.44 X 10"7- 2.94 x 10⁻⁸
11.5 laboratory Lutenegger
4.1 X 10⁻⁸ n.g. recovery Kanwar et al.
5.3-9.9 X 10⁻⁷ 11 recovery Kanwar et al.
1.2 X 10⁻⁸ 11.5 recovery Kanwar et al.
1 X 10⁻⁸ - 1 X 10⁻⁷
n.g. trlaxlal permeability Handy & Wang
(n.g. = not given)

MATERIALS AND METHODS
Field Site
The field test site Is located at the Iowa State University
Agronomy/Agricultural Engineering Research Center 8 miles west of Ames
and one-half mile south of US Highway 30 (SE1 /4 of NW1/4 of Section 8,
T.83N, R.25W; Boone County, Iowa). Figure 1 shows the location of test field
5 referenced to U. S. Hwy. 30 and other site features. The site has a surface
cover of short grass and has approximately a 3% grade sloping to the west-
southwest (WSW). The uppermost till unit was deposited as a basal till by
the Cary Lobe of the Wisconsin glacier approximately 13000 to 14000 years
before present. There Is a shallow layer of soil 0.6 meters (2 ft) covering
the oxidized till which Is underlain by a thicker bed of unoxidized till.
The oxidized till Is a yellow brown to yellow tan layer approximately
3 meters (10 ft) thick overlying the unoxidized till which Is a poorly sorted
dense gray till approximately 19 meters (63 ft) thick with a variety of
particle sizes. Monitoring of wells In the unconfined oxidized till performed
by Tsai (1991) Indicates the water table gradient closely resembles the
surface drainage which Is to the WSW. Piezometers screened at 6 to 7.5
meters (20-25 ft) show ground water head contours that also Indicate flow
toward the WSW (Everts, et al.,1990). The potentiometrlc head of the wells
In the unoxidized till is very close to the water table level, although there Is
a slight downward head gradient. A set of shallow tile drainage lines are
located on either side of the site but it was not anticipated that they would
interfere with the pumping tests.

12
6 MILES
Figure 1. Location of Well Field 5

13
Well Construction and Development
Bore holes for wells IW-1 and MW-1 were machine augered using 21.6
cm (8.5 Inch) diameter hollow-stem augers without the addition of any
drilling fluids. A plan view of the monitoring well layout Is shown In figure
2. Great resistance was encountered while drilling beyond 7.5 meters (25
ft) Into the dense unoxidized till. Drilling from 9 to 12 meters (30 to 40 ft)
depth required approximately the same amount of time as drilling the first 9
meters (30 ft). Two bore holes were abandoned, one at 3 meters (10 ft)
depth and another at 6 meters (20 ft) depth as a result of a bore hole
collapse. The abandoned holes were filled with bentonite and capped off
with augered dense till to prevent Interference with the active wells.
Wells IW-1 and MW-1 were constructed of 5.08 cm (2 Inch) diameter
schedule 40 PVC pipe commercially slotted at 25.4 mm (0.01 Inch) and
threaded. Figure 3 shows a vertical cross-section of the site depicting the
construction details for wells IW-1 & MW-1 and till contacts. The 3 meter
(10 ft) sections of risers and screen were threaded together using rubber 0-
rlngs to prevent leakage. The well screen and casing and gravel pack were
set within the hollow stem auger In the bore hole to prevent a collapse of
the hole. Pea gravel was placed from the bottom of the 21.6 cm (8.5 inch)
bore hole to 0.15 meters (0.5 ft) above the top of the screen. Powdered
bentonite was placed atop the gravel pack In the annular space for 6 meters
(20 ft) to prevent water from Infiltrating from the overlying unoxidized till.
The remainder of the bore hole was filled with dense till which had been
14
N SURFACE GRADIENT & WATER TABLE GRADIENT
IW-1 MW-1
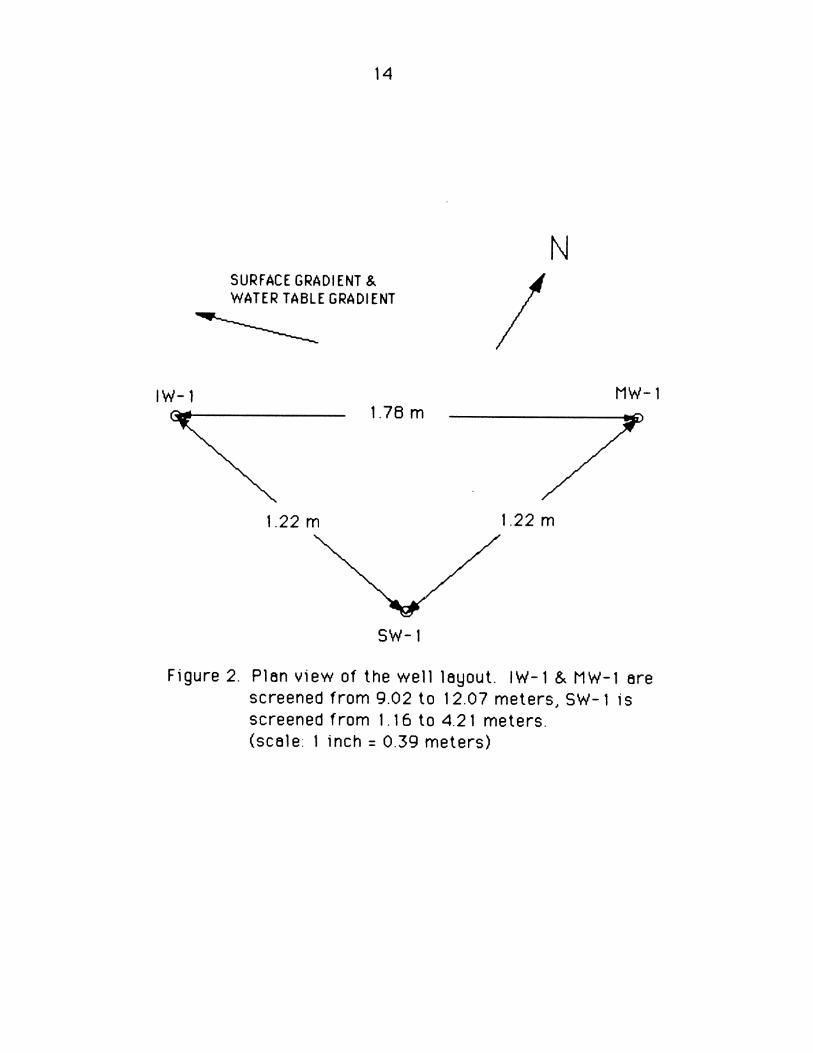
Figure 2. Plan view of the well layout. IW-1 & MW-1 are screened from 9.02 to 12.07 meters, SW-1 is screened from 1.16 to 4.21 meters. (scale: 1 inch = 0.39 meters)

15
GROUND SURFACE -MN- 5.08 cm WELL CASING
TOP SOIL
OXIDIZED TILL
9.0 m RISER
UNOXIDIZED TILL
3.05 m SCREEN
c
60 cm CEMENT GROUT
2.1 m FILL (unoxidized till)
6.1 m BENTONITE SEAL
3.2 m GRAVEL PACK
14- 21.6 cm BORE HOLE
Figure 3. Vertical cross-section of wells IW-1 and MW-1
(not to scale)

16
augered up from drilling and was finished off with a 10 cm (4 Inch) diameter
PVC casing encased In 0.6 meters (2 ft) of concrete which was mounded up
to prevent surface water from pooling near the wellhead. MW-1 Is 1.78
meters (5.84 ft) east (upgradlent) from IW-1. Both wells were 12.07 meters
(39.6 ft) deep and are screened for 3.05 meters (10 ft) from 9.02 to 12.07
meters (29.6-39.6 ft) below ground surface, partially penetrating the
unoxidized till.
Prior to pump test *2 a 8.9 cm (3.5 Inch) bore hole was hand augered
and a 4.2 meter (13.8 ft) shallow well (SW-1) was Installed equidistant 1.22
meters (4 feet) south from MW-1 and IW-1, thus forming a triangle a (see
Figure 2). A 2.54 cm (1 Inch) diameter commercially screened and threaded
PVC was used with the screen placement from 1.2-4.2 meters (3.8-13.8 ft)
below the surface. Monitoring well SW-1 was set primarily through the
unconfined aquifer In the oxidized till and slightly Into the unoxidized till.
A filter pack of pea gravel was placed from 9.5 to 4.2 meters (3.1-13.8 ft)
below the surface. Powdered bentonite and cement were used to seal off the
remainder of the well to prevent the Infiltration of surface water. Figure 4
shows the construction details of monitoring well SW-1.
All three wells were developed by two methods: 1) pumping manually
with a foot valve and 5/8 Inch I.D. High Density Polyethylene tubing until
empty, and 2) alternately pumping the well dry with a peristaltic pump then
adding water and air pressure. This purge and surge action was undertaken
to remove fine particles from the gravel pack and to alleviate the problem of
sidewall smearing by the augers which may have sealed off fractures and
sand lenses. Generally the water level in the shallow well SW-1 was 1.4

17
Figure4. Vertical cross-section of well SW-1 (not to scale)
18
meters (4.5 ft) and the potentlometrlc head In deep wells IW-1 & MW-1 was
1.59 meters (5.21 ft) below the ground surface.
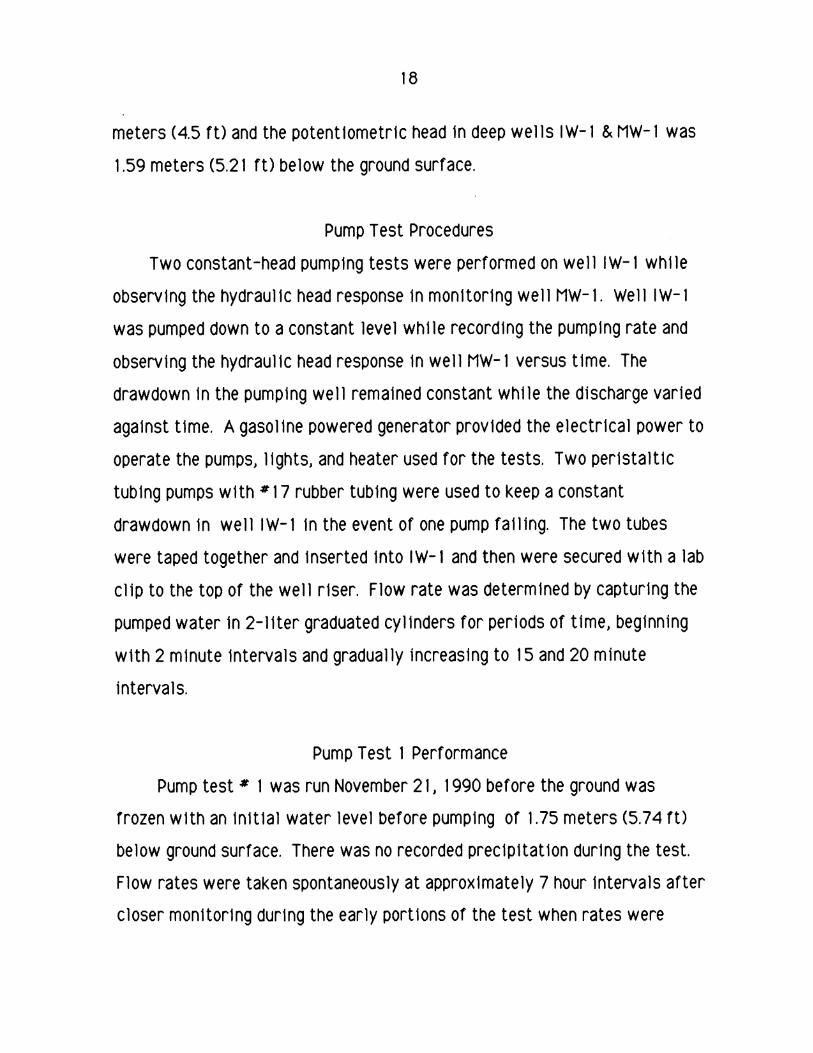
Pump Test Procedures
Two constant-head pumping tests were performed on well IW-1 while
observing the hydraulic head response In monitoring well MW-1. Well IW-1
was pumped down to a constant level while recording the pumping rate and
observing the hydraulic head response In well MW-1 versus time. The
drawdown In the pumping well remained constant while the discharge varied
against time. A gasoline powered generator provided the electrical power to
operate the pumps, lights, and heater used for the tests. Two peristaltic
tubing pumps with # 17 rubber tubing were used to keep a constant
drawdown In well IW-1 In the event of one pump falling. The two tubes
were taped together and inserted Into IW-1 and then were secured with a lab
clip to the top of the well riser. Flow rate was determined by capturing the
pumped water In 2-11ter graduated cylinders for periods of time, beginning
with 2 minute Intervals and gradually Increasing to 15 and 20 minute
Intervals.
Pump Test 1 Performance
Pump test * 1 was run November 21, 1990 before the ground was
frozen with an initial water level before pumping of 1.75 meters (5.74 ft)
below ground surface. There was no recorded precipitation during the test.
Flow rates were taken spontaneously at approximately 7 hour Intervals after
closer monitoring during the early portions of the test when rates were

19
rapidly changing. The constant head pumping test was performed on well
IW-1 for a period of 98 hours (4.08 days), reducing the water level from 1.75
meters (5.74 ft) to 5.72 meters (18.76 ft) below ground level for a
drawdown of 3.97 meters (13.02 ft). The hydraulic head response In
monitoring well MW-1 was observed during the pumping test. A one-hour
electrical failure during pump test *1 did not significantly affect the
drawdown response In the monitoring well. The average pumping rate was
26.59 ml/mln. Figure 5 shows the flowrate versus time for IW-1 In pump
test 1. The monitoring well MW-1 drawdown and recovery curve Is shown In
Figure 6.
Pump Test 2 Performance
Pump test *2 pumping began at 8:21 AM on January 10,1990 and ran for
a period of 123.8 hours (5.16 days). A heated 4 X 6 foot metal shed was
placed over the three wells to facilitate pumping and monitoring through
adverse winter conditions. The pump test was started while there was a
heavy snowcover over the site 5 field. Dally temperatures ranged from a
daytime high of 22 degrees F to overnight lows down to 5 degrees F
throughout the testing period. The Initial water level in IW-1 was 1.47
meters (4.83 ft) from the ground surface. Pumping at a rate of 850 to 900
ml/mln., while drawing primarily from storage, the level In the pumping
well

20
PUMP TEST 1
time since start of pumping (hrs)
Figure 5. Pump test 1 pumping rate versus time

21
PUMP TEST 1
Figure 6. Pump test 1 MW-1 drawdown response and recovery

22
IW-1 was lowered from 1.47 meters (4.83 ft) to 5.87 meters (19.25 ft), for
a drawdown of 4.41 meters (14.47 ft), In approximately 16 minutes. Figure
7 shows the flowrate versus time for IW-1 In pump test 2.
The flow rate quickly dropped off to 140 ml/mln. at 30 minutes and 93
ml/ min. at 1 hour Into the test. Later In pump test 2 when flow rates were
much lower, pumped water was captured In a 5 gallon plastic bottle for
periods up to 8 hours. This pumped water was then carefully measured In a
2 liter graduated cylinder and the total pumping time was noted to obtain an
average flow rate over the period. The average pumping rate over the test
was 26.30 ml/mln.
Thirty five minutes Into pump test *2, monitoring well MW-1, which Is
located 1.78 meters (5.84 ft) from pumping well IW-1 showed a head drop of
.305 cm (0.01 ft). After 5 hours the drop In head was 8.84 cm (0.29 feet),
and there was a 30.5 cm (1.00 ft) drop after 13.5 hours. By the end of the
pump test (123 hours) MW-1 had a head reduction of 1.04 meters (3.41 ft).
Figure 8 shows the drawdown response and recovery of well MW-1 for pump
test 2.
SW-1 was monitored for any changes In head which would Indicate that
some recharge of the unoxidized till was occurring from the overlying
unconfined oxidized till. There was no significant drop In the water level of
SW-1 during the pump test. The slight variations In water levels were
attributed to natural fluctuations In the water table. It Is doubtful that a
pumping test with extremely low flow rates could Induce a head change In
the overlying unconfined aquifer which has a hydraulic conductivity two
orders of magnitude higher.

23
PUMP TEST 2
Figure 7. Pump test 2 pumping rate versus time

24
PUMP TEST 2
Figure 8. Pump test 2 MW-1 drawdown response and recovery

At 14 hours and 15 minutes Into the test a small amount of pumped
water was lost due to a split that formed In the tubing on the discharge side
of the pump. This also occurred at 25 hours and 36 minutes Into the test.
An application of duct tape effectively sealed the splits and two older
Masterflex pumps were Installed to replace the quick release models In
order to prevent further splitting. While a small amount of pumped water
was lost for measuring, IW-1 remained pumped down to 19.3 feet during the
entire test. The flow rates of pump test *2 were adjusted for the short
period where pumped water was leaking from splits In the tubing. In the
early portion of the pump tests the volume of water stored In the well
casing was subtracted from the pumped volume to determine the true flow
rate from the aquifer.
Pump Test Analysis Methods
Theis solution
The confined aquifer flow equation was solved by C. V. Theis In 1935
with existing solutions used to solve heat flow equations (Fetter, 1988).
The governing equation for radial flow in a homogeneous and Isotropic
confined aquifer Is:

26
with the boundary conditions:
s(r,t) = 0 for all r, t = 0 (2)
s(r, t) = 0 for t > 0, r - oo (3)
lim(2nrT||) *Q or
(4)
The solution Thels developed Is:
Q s = 4TTT
W(u) (5)
where the argument u Is:
r2 Sc u= 4Tt
CO
f e~u
W(u) = J u ~ du
(6)
(7)
where t = time since pumping started, s = the drawdown, r = the radial
distance from the pumping well to the observation well, T = the coefficient

27
of transmlsslblllty of the aquifer, and Sc = the coefficient of storage of the
aquifer.
The Thels solution requires the following assumptions:
1. the aquifer is homogeneous and isotropic and has Infinite areal extent
2. the aquifer Is confined by Impermeable layers top and bottom
3. the pumping well fully penetrates the aquifer and pumps at a constant
rate
4 no water is stored In the wells
5. the pumping well is considered to have an Infinitesimal diameter
Super position
Super-position was used to account for the changes in pumping rate
during the constant-head pumping test. Using discrete changes In the
pumping rate, the theoretical drawdown (Bear, 1979) Is estimated from
super-position of the Theis solution by:
st(r, t, T, Sc) - ^.X(Qi-Ot-) } (8)
tn-1 i t i tn
where W() Is the Theis well function, Qj Is the pumping rate from time tl-i
to ti, with Qo ■ 0.
Pumping flowrate measurements were divided Into discrete time
Intervals where the flowrate was treated as a constant during each time

28
interval using the average flowrate over the time Intervals. The time
Intervals were selected so that the actual changes In the pumping rate over
the time Interval were small. Time Intervals In the early portion of the test
were shorter, due to the rapidly changing pumping rate, and gradually
become longer later In the test.
A least squares fitting method was used to determine transmissivity
and storage coefficient with the super-position Thels solution. By assigning
a set of T and Sc to the super-position Thels solution, a theoretical
drawdown curve can be produced. The best fit Is obtained by using the least
squares method to determine the target T and Sc whose values minimize the
sum of squared differences between the observed and predicted drawdown
generated by the super-position Thels solution. The least squares objective
is,
n minimize F(T, Sc) = 2(so(n, tj) - st(n, tj, T,Sc))2 (9)
1=1
where so Is the observed drawdown, st Is the theoretical drawdown predicted
by the super-position Thels solution, and n Is the number of data points. A
FORTRAN program using a generic least squares routine was used to solve
the least squares problem. A subroutine In the program computes the
difference between the measured values of the functions and the predicted
values of the functions for particular values of the parameters; the values
of fj(T, Sc). The subroutine solves the least squares minimization using a

29
modified Levenberg-Marquardt algorithm, calling the problem specific
subroutine to compute function values and first derivatives.
Partially penetrating wells
To examine whether the horizontal flow assumption of the Thels
solution was reasonable, the transmissivity and storatlvlty were also
estimated with the use of the type curve for nonleaky isotropic confined
aquifers with partially penetrating wells and constant discharge (Walton,
1970). The governing equation for partially penetrating wells (Walton, 1970)
includes both vertical and horizontal flow:
d2s_ldSc d^s Scds dr2 " r dr =dz2= T dt U0)
where z is the vertical elevation above the arbitrary datum.
The time-drawdown data from each pump test was plotted on
logarithmic paper and superimposed over the appropriate type given. For
this purpose the unoxidized confined aquifer was estimated to be 142
meters (46.5 ft) thick with the wells screened through its center. Average
pumping rate for each test was used in place of constant discharge (Q). A
rather close fit was found for both pump test curves and the match points
were obtained giving 1/u and W(u, r/m, y) values. Transmissivity and
storativity were estimated by applying these values to the following
equations:

30
S = Q . „ r , T w^-y) (ID
u = r2 Sc
Tt (12)
where s = drawdown (cm), r = distance from pumping well to monitoring
well (cm), Q - discharge (ml/m), t - time since pumping started (min), T =
coefficient of transmissibilty (cm2/s), Sc = coefficient of storage fraction,
m = aquifer thickness (cm), md * distance from top of aquifer to top of
screen (cm), and y = “r*1. ’ 1 m
Pumping Test Results
It was anticipated that drawing down the water level in well IW-1 for a
period of time would create some response in a nearby well screened at the
same depth. Ruland, Cherry, and Feenstra (1991) determined that strong
hydraulic heads can develop without a significant amount of water being
drawn from unfractured clay due to the capillary effects which holds water
in the small pore spaces. The data gathered from pump tests 1 & 2 were
analyzed with a Theis solution computer program provided by Jones (1990)
ignoring vertical flow, to estimate the bulk storativity and transmissivity
of the aquitard. The transmissivities obtained from the Theis solution were
converted to hydraulic conductivity (K=T/b) assuming horizontal flow using
an aquifer thickness of 3.2 meters (10.5 ft), which is the length of the
gravel pack.

31
Different portions of the drawdown data were analyzed to determine If
one portion of the data substantially changed the results. These included the
full test, from 6 hours into the test to the end, and the first one-half of the
test. Data from the full test and from 6 hours into the test to the end were
also evaluated using average flow. Results are listed In Table 3. Using all
the time data, Figures 9 and 10 show the measured response and the Thels
solution least squares fit to the drawdown In MW-1 for pumping tests 1 and
2, respectively.
Eliminating the first 6 hours of the test data did not substantially
change the hydraulic conductivity or storativlty values. Evaluating the
entire data set with a changing pumping rate for pump test ^ 1 showed a
transmissivity of 4.14 x 10'2 cm2/s, a hydraulic conductivity of 2.16 x 10~6
cm/s and a storativlty value of 1.23 x 10⁻⁵cm_1. The entire data set for
pump test *2 gave a transmissivity of 3.14 x 10~2 cm2/mi'n, a hydraulic
conductivity of 1.64 x 10⁻⁶ cm/sec, and a storativlty of 1.01 x 10“5cm_1.
Analyzing the pump test data with the partially penetrating type curve
method produced an estimate of transmissivity of 1.80 x 10⁻³ cm2/s for
pump test 1 and 1.46 x 10~3 cm2/s for pump test 2. This yields hydraulic
conductivity values of 1.27 x 10~6 cm/s and 1.03 x 10⁻⁶ cm/s respectively
as shown In Table 3. Coefficients of storage estimates were 4.89 x 10'3 for
test 1 and 3.55 x 10~3 for test 2 giving storatlvltles of 3.45 x 10⁻⁶ cm-1
and 2.51 x 10"6 cm-1 respectively. These hydraulic conductivities are only
slightly lower than those estimated by the Thels solution using average flow

32
PUMP TEST 1
■*— measured drawdown least squares fit
Figure 9. Pump test 1 drawdown In MW-1 vs. time and Thels solution least squares fit

33
PUMP TEST2
measured drawdown least squares fit
Figure 10. Pump test 2 drawdown In MW-1 vs. time and Theis solution least squares fit

34
rate. The partially penetrating type curve estimates which are shown in
Table 3 are very supportive of the Thels solution results.
The bulk hydraulic conductivity values obtained from these pump tests
were generally 1 to 2 orders of magnitude higher than those reported In
unoxidized tills In Canada and South Dakota as reported by Goodall and
Quigley (1977) and Cravens and Ruedlslll (1987) and shown In Table 1.
Table 3. Bulk hydraulic conductivity and storativlty results from pump tests.
PORTION OF PUMP TEST 1 PUMP TEST 2
DATA ANALYZED K (cm/s) STORATIVITY K (cm/s)
STORATIVITY (cm-1) (cm-1)
Full test 2.16E-6 1.23E-5 1.64E-6 1.0 IE-5
6 hours to end
2.14E-6 1.24E-5 1.62E-6 1.0 IE-5
First half 2.28E-6 1.26E-5 1.46E-6 9.96E-6
Average flow full test
3.67E-6 7.68E-6 2.72E-6 5.64E-6
Average flow 6 hours to end
3.66E-6 7.68E-6 2.73E-6 5.64E-6
Partially penetrating well type curve
1.27E-6 3.45E-6 1.03E-6 2.5 IE-6

35
Ball Tests
Performance
Three ball tests were performed on wells IW-1 and MW-1 to estimate
hydraulic conductivity for comparison with values obtained from pumping
tests. Hydraulic conductivities were determined using the method of
Hvorslev (1951) which Involves rapidly lowering the hydraulic head and
monitoring the rate of recovery In the wells. After the water level has been
rapidly lowered, an equal amount of water will eventually flow Into the well
until the water level In the well reestablishes equilibrium with the
potentlometrlc head of the aquifer.
The first ball tests were performed on October 21, 1990 before the
wells were developed. With a peristaltic pump, the water level In IW-1 was
lowered from 1.61 to 6.09 meters (5.27- 20 ft) below ground surface and
MW-1 was lowered from 1.72 to 6.49 meters (5.63 -21.3 ft) below ground
surface.
The second set of ball tests were performed on November 4, 1990 after
the wells had been developed. Water levels were lowered manually with a
nylon tube and ball valve. IW-1 was lowered from 1.69 to 8.90 meters
(5.53-29.2 ft) and MW-1 was lowered from 1.64 to 9.24 meters (5.38-30.3
ft). For ball test numbers 1 & 2, recovery was monitored manually with an
electric water depth Indicator and was recorded against time at specific
Intervals.
The third ball tests on MW-1 and IW-1 were performed on February 10
and 18, 1991 respectively. The water was pumped down to 6.54 meters

36
(21.45 ft) manually with a nylon tube and ball valve. Recovery was
monitored with a pressure transducer and recorded on a data logger. Water
levels were periodically read manually with an electric water depth
indicator to calibrate the millivolt readings of the data logger.
Analysis methods
Hvorslev (1951) developed a method of measuring hydrostatic pressure
and determining permeability of observation wells using a time lag theory
(Cedergren, 1989). To analyze a ball or slug test where water Is either
flowing Into or out of a well, the flow q Is expressed as:
where F = a factor that Is determined by the size and shape of the well
Intake, h = the active head, z = the distance from the reference level to the
water level In the well In the transient state. It Is assumed that friction
losses In the well can be neglected and the volume of flow during time dt Is:
where A = the cross-sectional area of the well. Substituting the expression
for q In (13) Into (14) results in:
q = Fkh = Fk(z-y) (13)
q dt = A dy (14)
(15)

37
V = Ah Is the volume of flow necessary to equalize the pressure
difference. When the original rate of flow q = Fkh Is maintained, a basic
time lag T Is required for equalization of the pressure difference.
Therefore,
the the basic differential equation for the hydrostatic time lag Is:
V Ah A q = Fkh = Fk
(16)
and dy dt z-y= T
(17)
After lowering the head in a well and recording the recovering head at
different time intervals, a plot Is made of time on an arithmetic scale and
head ratio (h/h0) on log scale. When the head ratio = 0.37, this Is the basic
time lag. When the equalization ratio (1- h/h0) is 0.90, It corresponds to a
time lag of 2.3 times the basic time lag. To corresponds to h * 0.37h0 by:
loge(^>-loge(o3^)-loge2.7-I.O (18)
If a steady rate of flow q and a constant head h0 are maintained:
k q
Fhc (19)
38
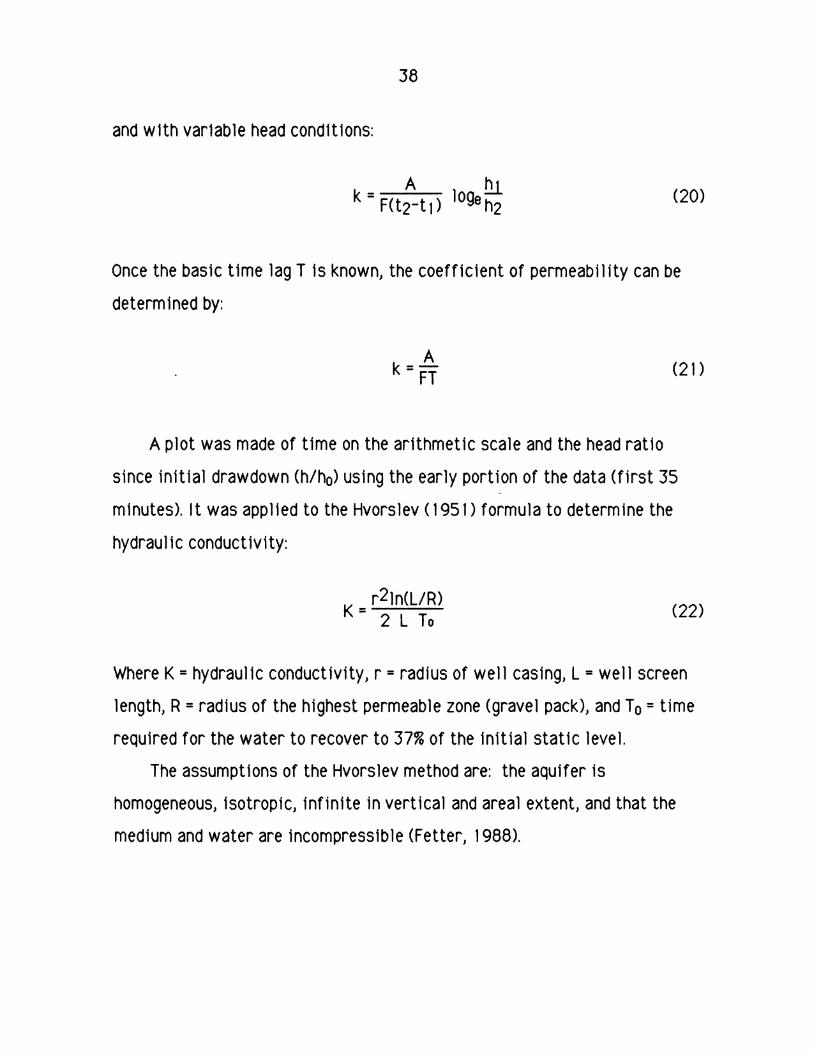
and with variable head conditions:
k = FoFtT> lofchi (:
Once the basic time lag T Is known, the coefficient of permeability can be
determined by:
k = pj: (21)
A plot was made of time on the arithmetic scale and the head ratio
since initial drawdown (h/h0) using the early portion of the data (first 35
minutes). It was applied to the Hvorslev (1951) formula to determine the
hydraulic conductivity:
„ r^lnd/R) K " 2 L To (22)
Where K = hydraulic conductivity, r = radius of well casing, L = well screen
length, R « radius of the highest permeable zone (gravel pack), and T0 = time
required for the water to recover to 37% of the Initial static level.
The assumptions of the Hvorslev method are: the aquifer is
homogeneous, Isotropic, infinite in vertical and areal extent, and that the
medium and water are incompressible (Fetter, 1988).

39
Results
While a ball test provides Information only for a small area surrounding
the well, It does provide some values for comparison with pump test results.
Figures 9-14 show recovery vs. time with least squares fit to determine T0
for all three ball tests on wells MW-1 and IW-1.
Results from the three ball tests proved to be very consistent as the
mean hydraulic conductivity for the three tests on IW-1 was 7.29 x 10⁻⁶
cm/sec. and 1.47 x 10⁻⁶ cm/sec. for MW-1 (see Table 4). Pump test
permeability values fell between the Individual well ball test values.
Hydraulic conductivity values estimated with recovery tests by Everts et al.
(1990) at comparable depths to MW-1 and IW-1 at the same study site are
shown In Table 5. These values are 2 to 3 orders of magnitude lower than
those estimated from the pump tests and ball tests In this study. There are
two possible differences that may have caused this large disparity. First,
wells MW-1 and IW-1 were augereddry, while the Everts et al. (1990) wells
were Installed with the use of drilling fluids. Fractures may have been
sealed by the fine particles circulated In the drilling fluids. In addition, the
screen lengths In the Everts et al. (1990) study were only 0.61 meters (2 ft)
compared to the 3.05 meters (10 ft) screen length of MW-1 and IW-1 used In
the present study. The longer screens would have a higher probability of
Intersecting hydraulically significant fractures.
The more rapid recovery of IW-1 compared to MW-1 In all the ball tests
Is probably due to a higher number of fractures or sand lenses In the vicinity
of the screen of IW-1. These values are within a reasonable range for
hydraulic conductivities for unoxidized till and concur with the pump test

40
results for this site. Laboratory derived hydraulic conductivity values
performed by Lutenegger (1990) and Handy and Wang (1990) tend to be lower,
by one to two orders of magnitude, than these In-sltu field test values.

frac
tio
n o
f to
tal
bai
ldo
wn
41
BAIL TEST IW-1 (predevelopment) 10/21/90
time (min)
Figure 11. IW-1 predevelopment ball test recovery vs. time and least squares fit

frac
tion
of
tota
l b
aild
ow
n
42
BAIL TEST MW-1 (predevelopment) 10/21/90
Figure 12. MW-1 predevelopment ball test recovery vs. time and least squares fit

frac
tio
n o
f to
tal
bai
ldo
wn
43
BAIL TEST IW-1 11/4/90
time (min)
Figure 13. IW-1 ball test recovery vs. time and least squares fit

frac
tio
n o
f to
tal
bai
ldo
wn
44
BAIL TEST MW-1 11/4/90
Figure 14. MW-1 bail test recovery vs. time and least squares fit

frac
tio
n o
f to
tal
bai
ldo
wn
45
BAIL TEST IW-1 2/18/91
Figure 15. IW-1 ball test recovery vs. time and least squares fit

frac
tio
n o
f to
tal
bai
ldo
wn
46
BAIL TEST MW-1 2/10/91
Figure 16. MW-1 bail test recovery vs. time and least squares fit

47
Table 4. Results of ball tests
Date Well static level (m)
ball-down level (m)
hydraulic conductivity cm/s
10-21-90 IW-1 1.61 '6.10 6.96 X 10⁻⁸
11-4-90 IW-1 1.69 8.90 7.58 X 10⁻⁸
2-18-91 IW-1 1.50 6.46 7.34 X 10"8
10-21-90 MW-1 1.72 6.49 1.82 X 10⁻⁸
11-4-90 MW-1 1.64 9.24 1.28 X 10⁻⁸
2-10-90 MW-1 1.55 6.54 1.32 X 10⁻⁸
*IW-1 & MW -1 are 12.07 meters (39.6 ft) deep, screened from 9.02 to 12.07
meters (29.6-39.6 ft) In the unoxidized till.
Table 5. Hydraulic conductivities of earlier slug tests performed at the study site.
Hydraulic conductivity (cm/s)
Depth (m) Test Investigator
1.55 x 10"8 8.8 recovery Everts et al.
3.88 x 10⁻⁹ 10.0 recovery Everts et al.
4.55 x 10⁻⁹ 11.8 recovery Everts et al.
3.12 x 10⁻⁸ 12.0 recovery Everts et al.

48
SUMMARY AND DISCUSSION
The pumping tests were deemed successful as the level of response In
the nearby monitoring well was much greater than anticipated considering
the extremely low pumping rate. These constant-head pumping tests
performed In the Wisconsin-aged unoxidized glacial till of Central Iowa
produced higher hydraulic conductivity values than laboratory test methods
on similar material. Pump test *\ estimated a transmissivity of 4.14 x10~2
cm2/s, a hydraulic conductivity of 2.16 x 10'6 cm/s, and a storatlvity value
of 1.23 x 10⁻⁵cm-1 (Table 3). Grlsak and Cherry (1975) reported a
storatlvity of unoxidized till In Manitoba of 9.91 x 10⁻⁵ cm-1 which is very
close to the pump test values found in this study. The results from pump
test *2 gave a transmissivity of 3.14 x 1O-2 cm2/m1n, a hydraulic
conductivity of 1.64 x 10⁻⁶ cm/sec, and a storatlvity of 1.01 x lO"5crrrT
A summary of the pump test and ball test results are listed in Table 6.
These permeability values are 1 to 2 orders of magnitude higher than most
slug tests done on similar tills in Canada (Grlsak and Cherry, 1975), New
York(Prud1c, 1982), and Illinois (Herzog, 1989) as shown In Table 1.
The low hydraulic conductivity values of Canadian tills compared to
those of Central Iowa may be due In part to climatic factors In Canada such
as the shorter growing season and lower annual rainfall. Precipitation and
vegetation play an important role in the weathering process, therefore an
area receiving more rain may exhibit a more rapid weathering of Its soils.

49
Table 6. Summary of pump test and ball test results In wells IW-1 and M-1
with mid-screen 10.55 m depth
Date Well Hydraulic conductivity (cm/s)
Storativlty (cm-1) Test
10-21-90 IW-1 6.96 x 10⁻⁶ n.a. bail
11-4-90 IW-1 7.58 x 10⁻⁶ n.a. bail
2-18-91 IW-1 7.34 x 10⁻⁶ n.a. bail
10-21-90 MW-1 1.82x10⁻⁶ n.a. bail
11-4-90 MW-1 1.28 x 10⁻⁶ n.a. bail
2-10-90 MW-1 1.32 X 10⁻⁶ n.a. bail
11-21-90 IW-1 & MW-1 2.16 x 10"6 1.23 x 10⁻⁵ pump
1-10-90 IW-1 & MW-1 1.64 X 10⁻⁶ 1.01 x 10⁻⁵ pump
(n.a. = not applicable)
The disparity between laboratory values (Lutenegger, 1990) and the
field values from this pump test Is most likely due to the absence of sand
lenses and fractures In the smaller laboratory sample units. One possible
cause for the lower hydraulic conductivity values from the recovery tests
performed by Kanwar et al. (1989) at this site Is due to the use of short
screens (61 cm), which were only 20% of the length of pump test wells IW-1
and MW-1.

50
Although samples noted during drilling revealed a heterogeneous aquifer
material, the Thels method of aquifer analysis appeared to give reasonable
approximations of hydraulic conductivities and storatlvlty. The use of
suitable portions of the drawdown data minimized differences from the
assumptions. Pumping In very low permeability materials such as this
unoxidized till, results In a small radius of Influence. Differences between
hydraulic conductivity values and storatlvlty values of this site and others
reviewed are related to: the deposltlonal environment of the continental
glacier, the mass of the Ice atop the sediments, and the mineralogy of the
sediments. Glacial tills of Canada and the northern U.S.A. tend to have higher
levels of clay and silt than the tills of central Iowa which would explain the
higher bulk hydraulic conductivity at this site.
The hydraulic conductivity values obtained from the pumping tests and
bail tests are higher than other findings for unoxidized till at this depth.
This difference may possibly be due to the high sand and low clay content
and the possibility of the presence of fractures at field site 5. Since no
fractures have been reported In the unoxidized till at the depth of these test
wells, the most likely factors causing higher values of permeability are:
small sand Inclusions, the low clay content of the till, and the possibility
that micro-fractures have gone undetected at the site.
Ball tests were In close agreement with the pumping tests, producing
similar values of hydraulic conductivity. The use of In-sltu testing for low
permeability glacial tills through pumping tests and ball tests gives much
more realistic values of the bulk hydraulic characteristics of the glacial till
than laboratory tests.

51
RECOMMENDATION FOR FURTHER RESEARCH
The use of shelby tube samples for laboratory permeameter tests to
supplement the pumping test and slug test data could give some indication
whether there are secondary features affecting the bulk hydraulic
conductivity. A larger nest of wells screened at various depths In the
unoxidized till would allow for more comprehensive testing of the aqultard's
characteristics. Introducing a tracer to a central well In a long-term test
could reveal Important flow patterns through the dense till. Tritium tests,
which are effective for dating water less than 30 years old (Bradbury,
1991), may be applicable In the shallower portions of the unoxidized till to
determine the recharge and flow characteristics. The unconfined aquifer In
the oxidized till responds rapidly to a substantial rain event. Running a
constant head pumping test in the unoxidized till over a period of time that
Includes a rain event may be of value by showing some communication
between the two tills units.

52
REFERENCES
Anderson, W. I. Geology of Iowa: Over Two Billion Years of Change. Iowa
State University Press, Ames, Iowa, 1983.
Bear, J. Hydraulics of Groundwater. McGraw-Hill Book Company, New York,
1979
Bradbury, K. R. "Tritium as an Indicator of Ground-Water Age In Central
Wisconsin.” Ground Water, Vol. 29, No. 3 (1991): 398-404.
Bradbury, K. R. and M. A. Muldoon. "Hydraulic Conductivity Determinations in
Unlithifled Glacial and Fluvial Materials." Ground Water and Vadose Zone
Monitoring, American Society for Testing and Materials, Philadelphia,
(1990): 138-151.
Cedergren, H. R. Seepage. Drainage, and Flow Nets. John Wiley & Sons, New
York, 1989.
Cravens, S. J. and L. C. Ruedisili. "Water Movement in Till of East-Central
South Dakota" Ground Water, Vol. 25, No. 5 (1987): 555-561.
D’Astous, A. Y., W. W. Ruland, J. R. G. Bruce, J. A. Cherry, and R. W. GiIlham.
"Fracture Effects in the Shallow Groundwater Zone in Weathered Sarnia-
area Clay." Canada Geotech. Journal, Vol. 26 (1989): 43-56.
Desaulniers, D. E., J. A. Cherry, and P. Fritz. "Origin, Age and Movement of
Pore Water in Argillaceous Quaternary Deposits at Four Sites in
Southwestern Ontario." Journal of Hydrology, Vol. 50 (1981): 231 -257.
Everts, C. J., R. S Kanwar, B. P. Mohanty, P. Singh, and J. L. Baker. "Site
Description, Hydraulic Conductivity, Groundwater Recharge, And Water
Quality Monitoring In subsurface Drainage And In Aquitard Materials."
Aqultard Hydrology Project Annual Progress Report 1989-1990, Submitted
to the Iowa Department of Natural Resources Geologic Survey Bureau, 1990.
Fetter, C. W. Applied Hydrogeology. Merrill Publishing Company, Columbus,
Ohio, 1988.

53
Goodall, D. C. and R. M. Quigley. "Pollutant Migration from Two Sanitary Landfill Sites Near Sarnia, Ontario." Canadian Geotechnical Journal, No. 14 (1977): 223-236.
Grisak, G. E. and J. A Cherry. "Hydrologic Characteristics and Response of Fractured Till and Clay confining a Shallow Aquifer." Canada Geotech. Journal, Vol. 12, No. 23 (1975): 23-43.
Handy, R. L., and H. Y. Wang. "Geotechnical Evaluation of Glacial Till Properties." Aquitard Hydrology Project Annual Progress Report 1989-1990, Submitted to the Iowa Department of Natural Resources Geologic Survey Bureau, 1990.
Hendry, M. J. "Hydraulic Conductivity of a Glacial Till in Alberta." Ground Water, Vol. 20, No. 2 (1982): 162-169.
Hendry, M. J. "Hydrogeology of Clay Till In a Prairie Region of Canada." Ground Water, Vol. 26, No. 5 (1988): 607-614.
Herzog, B. L., R. A. Griffin, C. J. Stohr, L. R. Follmer, W. J. Morse, and W. J. Su. "Investigation of Failure Mechanisms and Migration of Organic Chemicals at Wilsonville, Illinois." Ground Water Monitor Review, Spring (1989): 82-89.
Hvorslev, M. J. "Time Lag and Soil Permeability in Groundwater Observations." U. 5. Army Corps of Engineers Waterway Experiment Station Bulletin 36, 1951.
Jones, L., A. Raaii, and C. Tsai. "Groundwater Flow and Chemical Transport in Oxidized Till." Aquitard Hydrology Project Annual Progress Report 1989- 1990, Submitted to the Iowa Department of Natural Resources Geologic Survey Bureau, 1990.
Jones, L. Personal communication. Assistant Professor of Civil Engineering, Iowa State University, Ames, Iowa, 1991.
Kanwar, R. S., J. L. Baker, R. Horton, R. L. Handy, L. Jones, and A. Lutenegger. "Aquitard Hydrology Project Ames Research Site Annual Progress Report 1988-1989." Submitted to Iowa Dept, of Natural Resources Geologic Survey Bureau, 1989.

54
Kanwar, R. S., C. J. Everts, B. P. Mohanty, and J. L. Baker. "Determination of Hydraulic Conductivity and Water Quality Monitoring in Aquitard Materials." Aquitard Hydrology Project Ames Research Site Annual Progress Report 1988-1989, Submitted to Iowa Dept, of Natural Resources Geologic Survey Bureau, 1989.
Keller, C. K., G. Van Der Kamp, and J. A. Cherry. "Fracture Permeability and Groundwater Flow in Clayey Till near Saskatoon, Saskatchewan." Canada Geotech. Journal, Vol. 23 (1986): 229-240.
Keller, C. K., G. Van Der Kamp, and J. A. Cherry. "Hydrogeology of Two Saskatchewan Tills, I. Fractures, Bulk Permeability, and Spatial Variability of Downward Flow." Journal of Hydrology, Vol. 101 (1988): 97-121.
Lutenegger, A. J. “Geotechnical Site Investigation IGSB-Ames Research Site." Aquitard Hydrology Project Annual Progress Report 1988-1989, Submitted to the Iowa Department of Natural Resources Geologic Survey Bureau, 1989.
Lutenegger, A. J., "Geotechnical/Hydrologic Studies of Glacial Tills.” Aquitard Hydrology Project Annual Progress Report 1989-1990, Submitted to the Iowa Department of Natural Resources Geologic Survey Bureau, 1990.
Prudic, D. E. "Hydraulic Conductivity of a Fine-Grained Till, Cattaraugus County, New York." Ground Water, Vol. 20, No. 2 (1982): 194-204.
Ruland, W. W., J. A. Cherry, and S. Feenstra. "The Depth of Fractures and Active Ground-Water Flow in a Clayey Till Plain in Southwestern Ontario." Ground Water, Vol. 29, No. 3 (1991): 405-417.
Tsai, C. T. "Constant Head Pumping Tests in Oxidized Glacial Till." Unpublished M. S. Thesis, Iowa State University, Ames, Iowa, 1990.
Walton, W. C. Groundwater Resource Evaluation. McGraw-Hill Book Company, New York, 1970.

55
ACKNOWLEDGEMENTS
I would like to thank to Dr. LaDon Jones for placing me on the ISU
Leaking Underground Storage Tank Project and for his interest and expertise
guiding me through this project (especially for taking the midnight shift
monitoring the pumping test through a winter night). I also express my
great appreciation to Chin Ta Tsai and Tim Buelow, whose generous help
made this project possible. Thanks to Dr. A1 Austin and Dr. Robert Horton, Jr.
for serving on my committee.