the bric effect - u.s. chamber of commerce bric effect jim o’neill managing director head of...
TRANSCRIPT

Goldman Sachs Global Economics, Commodities and Strategy Research 2010 1
The BRIC Effect
Jim O’NeillManaging Director Head of Global Economics, Commodities and Strategy Research
March 29 2010

Goldman Sachs Global Economics, Commodities and Strategy Research 2010 2
GDP Forecasts
Source: GS Global ECS Research
GS Consensus* GS Consensus*USA 0.4 -2.4 2.6 3.1 2.4 3.0Japan -1.2 -5.2 2.2 1.9 1.7 1.6Euroland 0.5 -4.0 1.2 1.1 1.9 1.5UK 0.6 -4.9 1.7 1.4 3.4 2.3Europe 0.8 -3.9 1.4 1.2 2.3 1.8China 9.6 8.7 11.4 9.9 10.0 9.1India 6.7 6.6 8.2 8.2 8.7 7.9Brazil 5.1 -0.1 6.4 5.3 5.0 4.6Russia 5.6 -7.9 4.5 3.9 5.5 4.6BRICs 7.9 5.1 9.4 8.4 8.8 8.0Advanced Economies 0.5 -3.1 2.3 2.4 2.5 2.5
World 2.8 -0.7 4.6 4.3 4.7 4.3* Consensus Economics March 2010
% yoy 2008 20092010 2011

Goldman Sachs Global Economics, Commodities and Strategy Research 2010 3
Domestic Demand Forecasts (%)
% yoy 2008 2009 (f) 2010 (f) 2011 (f)
USA -0.7 -3.4 2.3 1.9Japan -1.3 -4.0 1.5 1.3Euroland 0.6 -3.4 0.3 1.2UK 0.1 -5.3 1.2 2.5China 9.0 13.0 12.4 9.9India 4.8 4.9 7.6 9.7BRICs 8.1 7.0 9.8 9.3
Advanced Economies 0.2 -3.4 1.9 2.0
World 2.6 -0.4 4.4 4.4
Source: GS Global ECS Research

Goldman Sachs Global Economics, Commodities and Strategy Research 2010 4
Change in US$ Size of GDP from 2000 to 2009
0500
100015002000250030003500400045005000
US$bn
Source: IMF, GS Global ECS Research*2000 GDP was adjusted for the updated 2003 re-base of the series.

Goldman Sachs Global Economics, Commodities and Strategy Research 2010 5
Inflation Forecasts
Source: GS Global ECS Research
GS Consensus* GS Consensus*
USA 3.8 -0.3 1.9 2.2 0.5 1.9Japan 1.4 -1.4 -1.0 -1.1 -0.5 -0.3Euroland 3.3 0.3 1.0 1.1 1.6 1.4UK 3.6 2.2 2.5 2.6 1.4 1.7Europe 3.5 0.8 1.4 1.4 1.7 1.5China 5.9 -0.7 3.5 3.2 2.8 3.3India 8.4 3.4 5.0 3.3 5.5 6.6Brazil 5.7 4.9 5.1 4.6 5.4 4.7Russia 14.1 11.7 5.3 7.1 6.6 6.9BRICs 7.5 2.2 4.2 3.8 4.0 4.6Advanced Economies 3.4 0.2 1.5 1.6 1.2 1.6
World 5.4 1.6 2.9 2.9 2.7 3.1* Consensus Economics March 2010
% yoy 2008 20092010 2011

Goldman Sachs Global Economics, Commodities and Strategy Research 2010 6
‘Crisis’ Indicator
-2
-1
0
1
2
3
4
5
6
90 92 94 96 98 00 02 04 06 08 10
Index
GS FSI (Financial Stress Index
Source: GS Global ECS Research
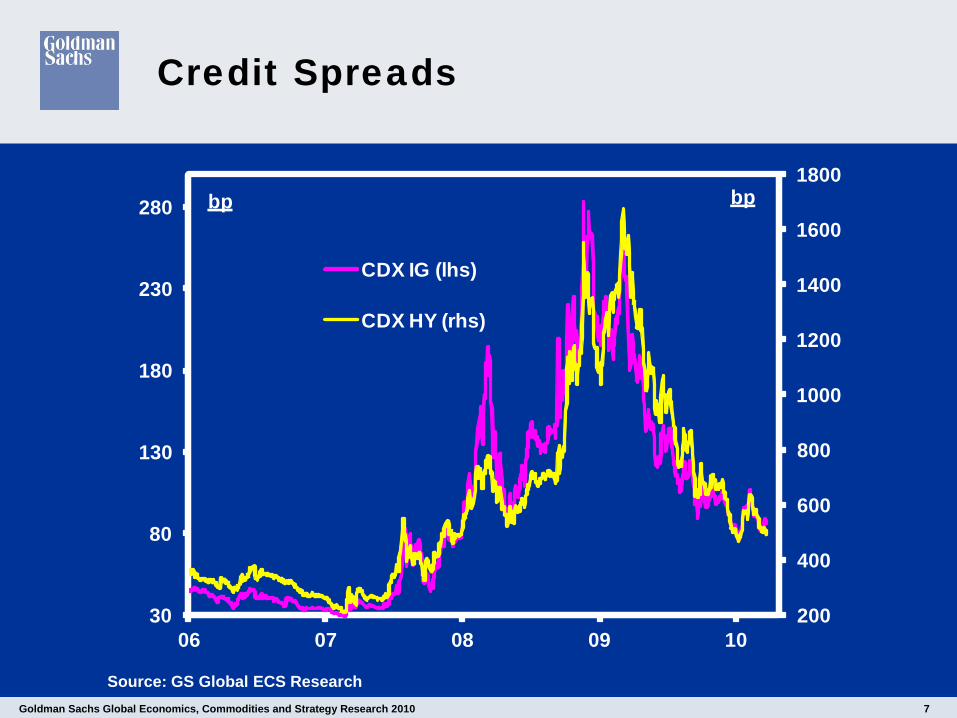
Goldman Sachs Global Economics, Commodities and Strategy Research 2010 7
Credit Spreads
200
400
600
800
1000
1200
1400
1600
1800
30
80
130
180
230
280
06 07 08 09 10
bpbp
CDX IG (lhs)
CDX HY (rhs)
Source: GS Global ECS Research
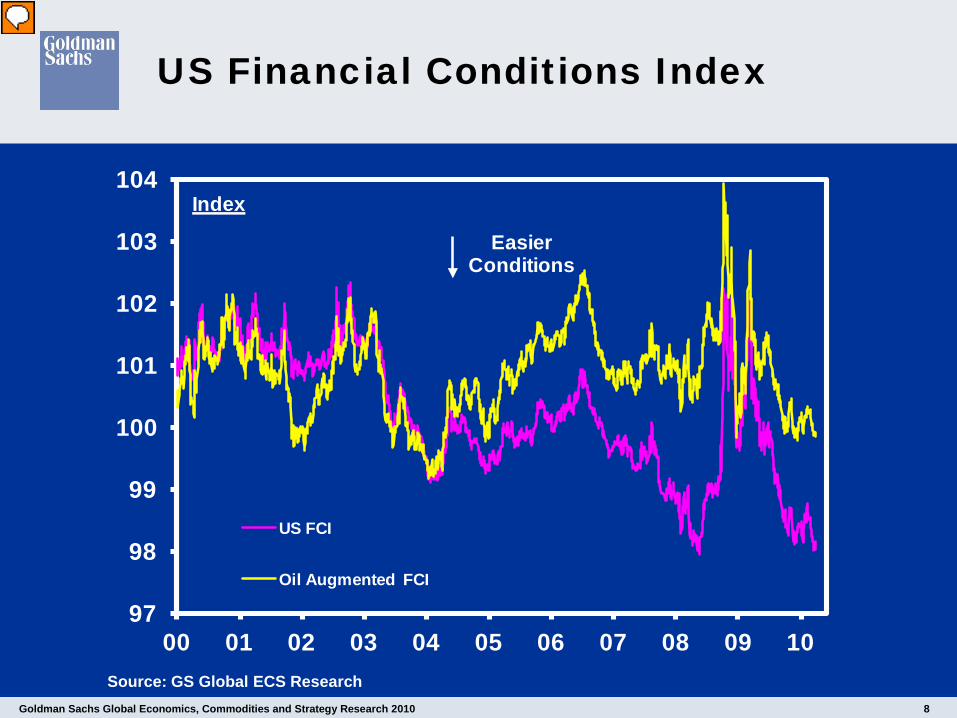
Goldman Sachs Global Economics, Commodities and Strategy Research 2010 8
US Financial Conditions Index
Source: GS Global ECS Research
97
98
99
100
101
102
103
104
00 01 02 03 04 05 06 07 08 09 10
Index
US FCI
Oil Augmented FCI
Easier Conditions
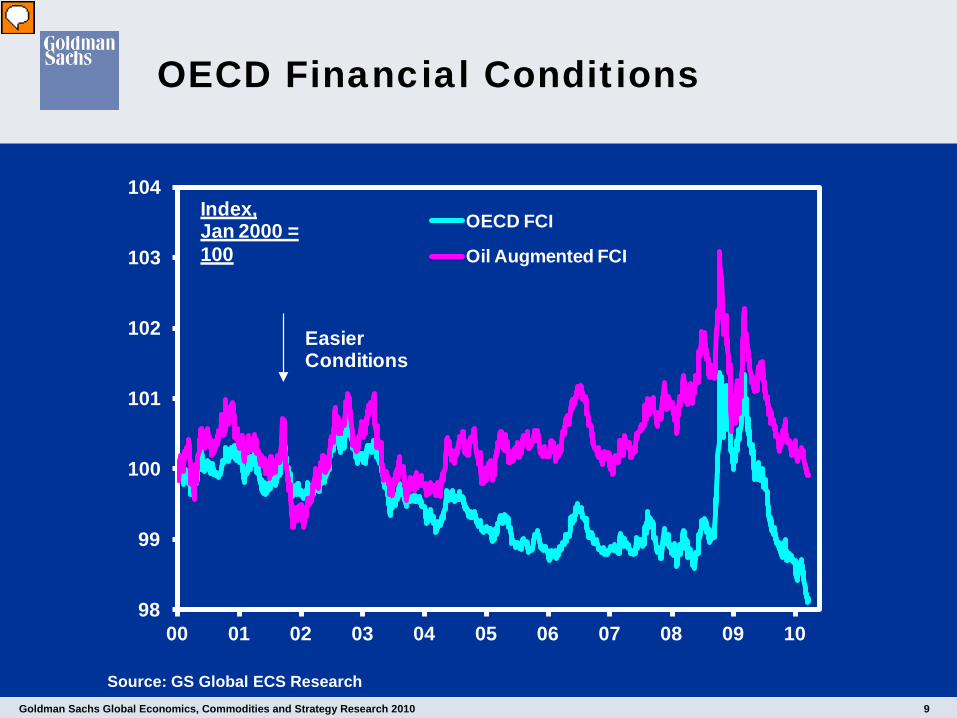
Goldman Sachs Global Economics, Commodities and Strategy Research 2010 9
OECD Financial Conditions
Source: GS Global ECS Research
98
99
100
101
102
103
104
00 01 02 03 04 05 06 07 08 09 10
Index, Jan 2000 = 100
OECD FCI
Oil Augmented FCI
Easier Conditions

Goldman Sachs Global Economics, Commodities and Strategy Research 2010 10
UK Financial Conditions Index
Source: GS Global ECS Research
92
93
94
95
96
97
98
99
100
101
102
98 99 00 01 02 03 04 05 06 07 08 09 10
Index
UK FCI
Easier Conditions
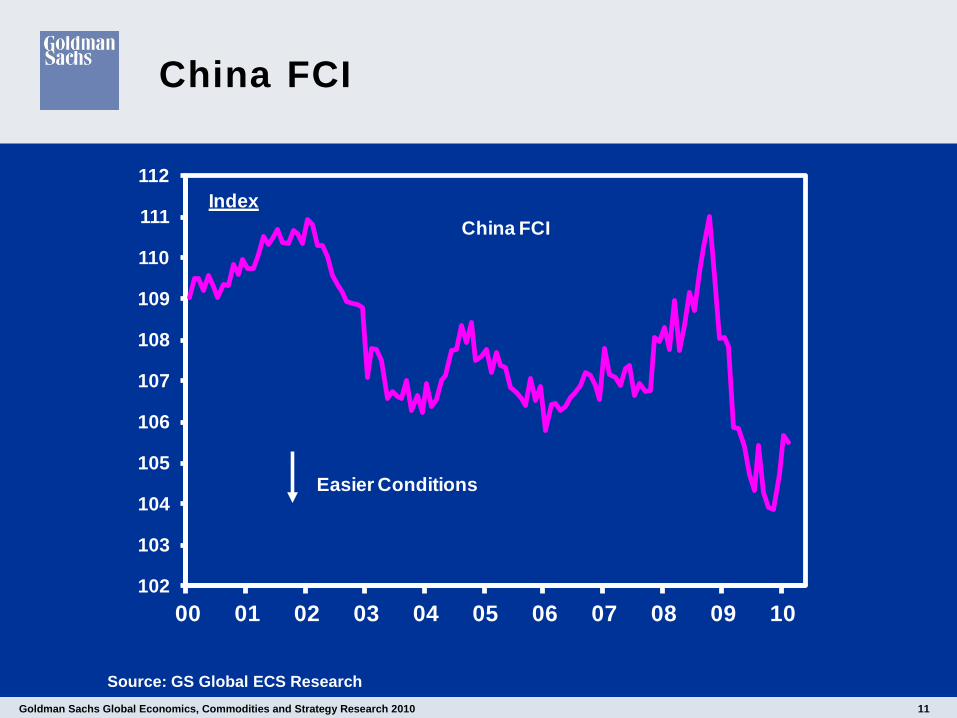
Goldman Sachs Global Economics, Commodities and Strategy Research 2010 11
China FCI
Source: GS Global ECS Research
102
103
104
105
106
107
108
109
110
111
112
00 01 02 03 04 05 06 07 08 09 10
Index
Easier Conditions
China FCI

Goldman Sachs Global Economics, Commodities and Strategy Research 2010 12
GLI vs IP
Source: GS Global ECS Research
-20
-16
-12
-8
-4
0
4
8
98 99 00 01 02 03 04 05 06 07 08 09 10
% yoy
GLI
G7 IP
Goldman Sachs Global Economics, Commodities and Strategy Research 2010 13
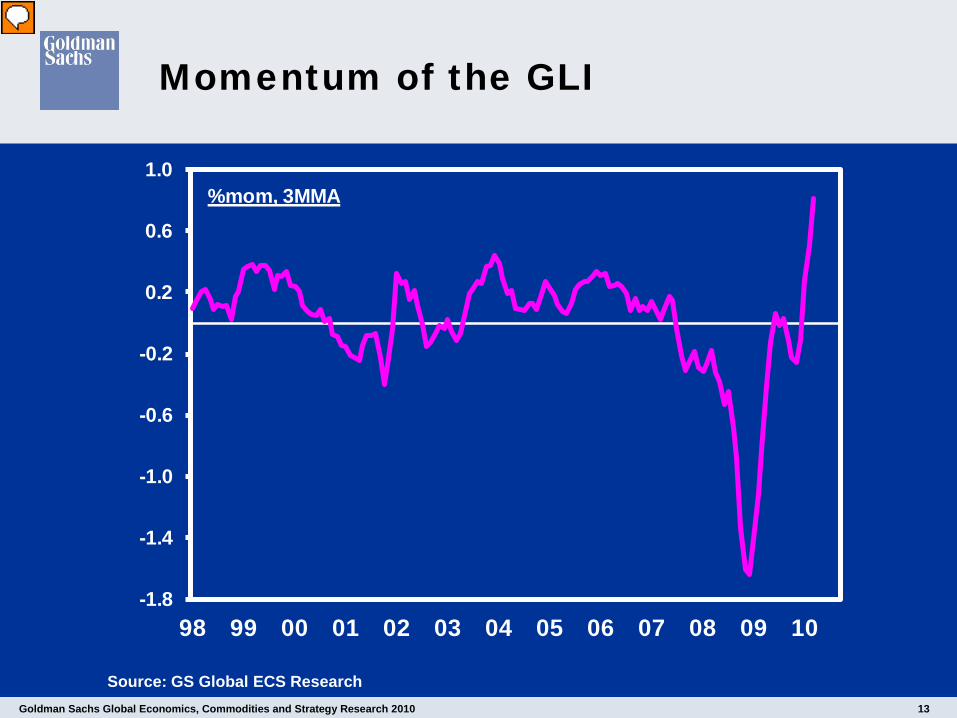
Momentum of the GLI
Source: GS Global ECS Research
-1.8
-1.4
-1.0
-0.6
-0.2
0.2
0.6
1.0
98 99 00 01 02 03 04 05 06 07 08 09 10
%mom, 3MMA

Goldman Sachs Global Economics, Commodities and Strategy Research 2010 14
Monthly Direction of GLI Components
Source: GS Global ECS Research
UpBusiness Confidence Aggregate
GS Australian Dollar Trade Weighted IndexS&P GS Industrial Metals Index
US Initial Jobless ClaimsFlat
Belgian Manufacturing Survey
Japan IP Inventory/Sales Ratio
US Durable Goods Inventory/Shipments RatioDown
Consumer Confidence AggregateISM New Orders Less Inventories
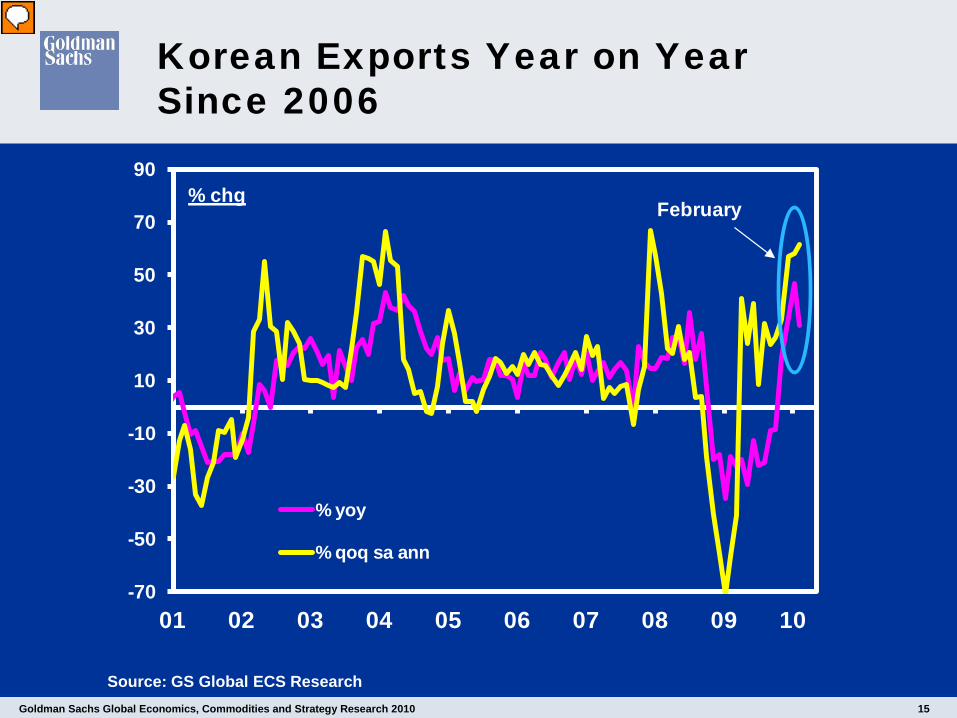
Korean Exports
Goldman Sachs Global Economics, Commodities and Strategy Research 2010 15
Korean Exports Year on Year Since 2006
Source: GS Global ECS Research
-70
-50
-30
-10
10
30
50
70
90
01 02 03 04 05 06 07 08 09 10
% yoy
% qoq sa ann
% chgFebruary
Goldman Sachs Global Economics, Commodities and Strategy Research 2010 16
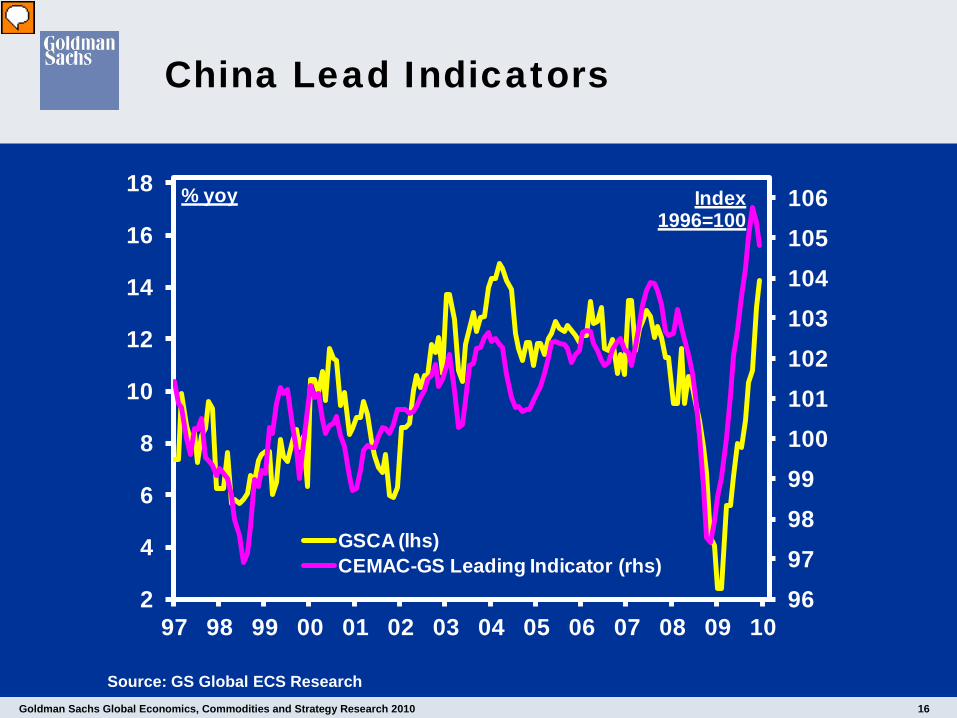
China Lead Indicators
Source: GS Global ECS Research
96979899100101102103104105106
2
4
6
8
10
12
14
16
18
97 98 99 00 01 02 03 04 05 06 07 08 09 10
Index1996=100
% yoy
GSCA (lhs)CEMAC-GS Leading Indicator (rhs)
Goldman Sachs Global Economics, Commodities and Strategy Research 2010 17
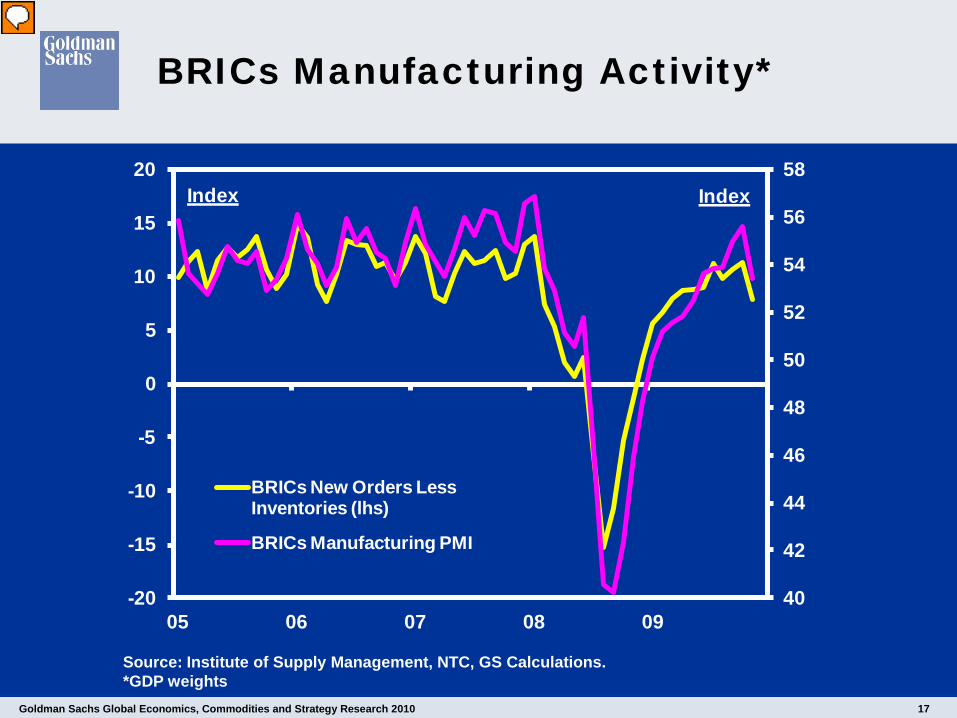
BRICs Manufacturing Activity*
Source: Institute of Supply Management, NTC, GS Calculations.*GDP weights
40
42
44
46
48
50
52
54
56
58
-20
-15
-10
-5
0
5
10
15
20
05 06 07 08 09
IndexIndex
BRICs New Orders Less Inventories (lhs)
BRICs Manufacturing PMI
Goldman Sachs Global Economics, Commodities and Strategy Research 2010 18
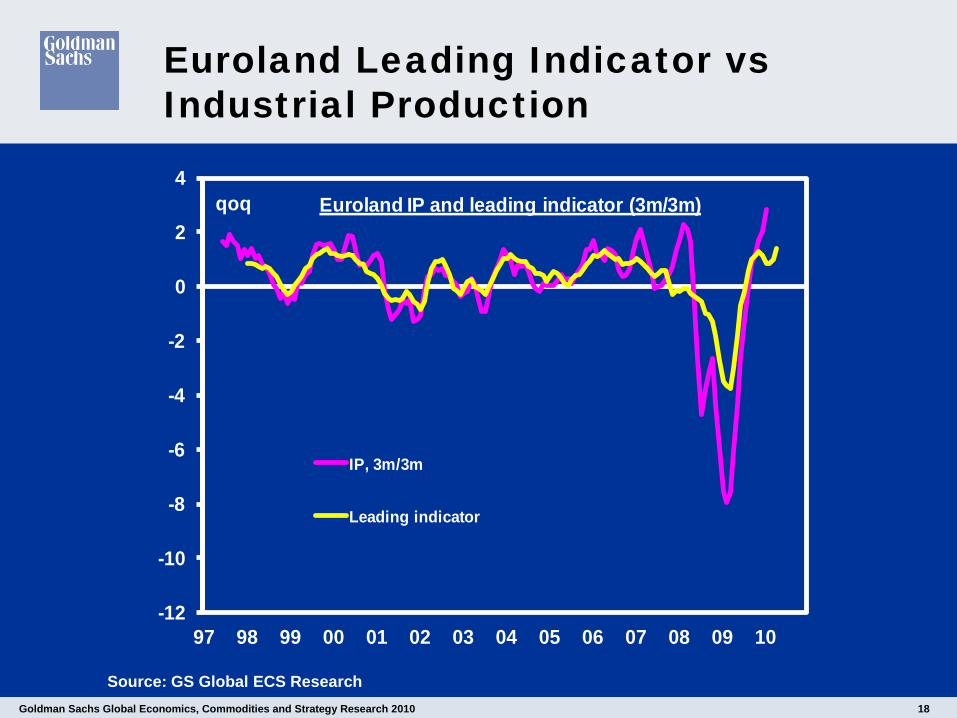
Euroland Leading Indicator vs Industrial Production
Source: GS Global ECS Research
-12
-10
-8
-6
-4
-2
0
2
4
97 98 99 00 01 02 03 04 05 06 07 08 09 10
qoq
IP, 3m/3m
Leading indicator
Euroland IP and leading indicator (3m/3m)

Goldman Sachs Global Economics, Commodities and Strategy Research 2010 19
UK Services PMI
Source: GS Global ECS Research
35
40
45
50
55
60
65
97 98 99 00 01 02 03 04 05 06 07 08 09 10
Index
UK Services PMI
Goldman Sachs Global Economics, Commodities and Strategy Research 2010 20
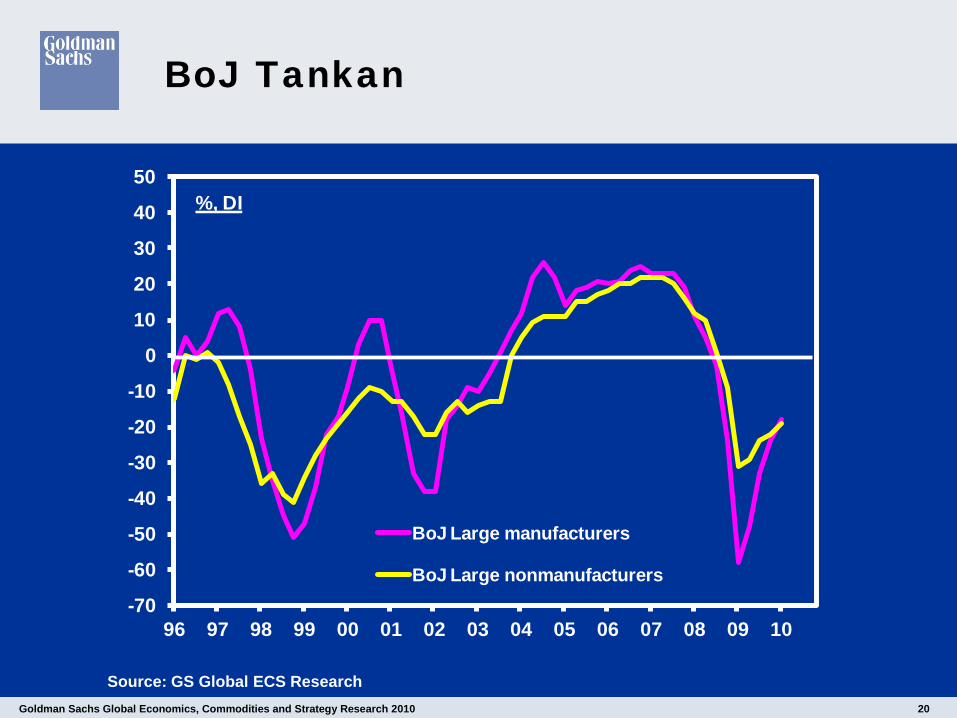
BoJ Tankan
Source: GS Global ECS Research
-70
-60
-50
-40
-30
-20
-10
0
10
20
30
40
50
96 97 98 99 00 01 02 03 04 05 06 07 08 09 10
%, DI
BoJ Large manufacturers
BoJ Large nonmanufacturers

Goldman Sachs Global Economics, Commodities and Strategy Research 2010 21
Relative Manufacturing Production
Source: GS Global ECS Research
60
70
80
90
100
110
120
06 07 08 09 10
indexJan06=100
Germany
Japan
Korea
Taiwan

Goldman Sachs Global Economics, Commodities and Strategy Research 2010 22
US House Prices vs Income
3.0
4.0
5.0
6.0
7.0
8.0
9.02.5
3.0
3.5
4.0
4.5
93 94 95 96 97 98 99 00 01 02 03 04 05 06 07 08 09 10
House Price/Income Ratio* (left)Mortgage Rate (right, inverted)
Percent
* S.a. median home price divided by median family income.Source: Department of Commerce. FRB. NAR.
Ratio

Goldman Sachs Global Economics, Commodities and Strategy Research 2010 23
Share of Private Consumption in US GDP
Source: GS Global ECS Research
65
66
67
68
69
70
71
72
90 92 94 96 98 00 02 04 06 08 10
% GDP

Goldman Sachs Global Economics, Commodities and Strategy Research 2010 24
US Export and Import Growth
Source: GS Global ECS Research
-30
-25
-20
-15
-10
-5
0
5
10
15
20
93 94 95 96 97 98 99 00 01 02 03 04 05 06 07 08 09 10
3M MA,% yoy
Exports
Non-oil Imports
Goldman Sachs Global Economics, Commodities and Strategy Research 2010 25
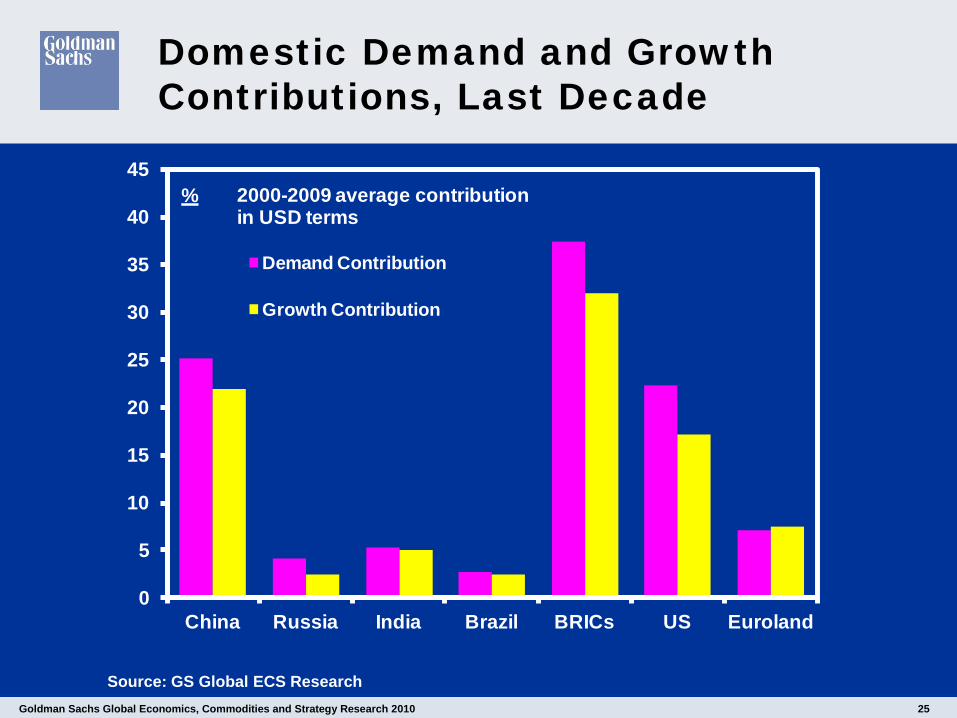
Domestic Demand and Growth Contributions, Last Decade
Source: GS Global ECS Research
0
5
10
15
20
25
30
35
40
45
China Russia India Brazil BRICs US Euroland
%
Demand Contribution
Growth Contribution
2000-2009 average contribution in USD terms

Goldman Sachs Global Economics, Commodities and Strategy Research 2010 26
Retail Sales US and BRICs
Source: GS Global ECS Research
-12
-8
-4
0
4
8
12
16
20
24
28
32
36
04 05 06 07 08 09 10
%yoy
USA Brazil BRICsRussia China India*
* Private final consumption

Goldman Sachs Global Economics, Commodities and Strategy Research 2010 27
Recent Trend in Real Retail Sales
Source: GS Global ECS Research
-60
-40
-20
0
20
40
60
80
Jan-07 Jul-07 Jan-08 Jul-08 Jan-09 Jul-09 Jan-10
USD Billion Jan 2007
U.S.
China
Change in Real Retail Sales Since Jan 2007

Goldman Sachs Global Economics, Commodities and Strategy Research 2010 28
Real Retail Sales in Developed vs EM
-60
-40
-20
0
20
40
60
80
100
120
140
Jan-07 Jul-07 Jan-08 Jul-08 Jan-09 Jul-09 Jan-10
Bil$ WorldAdvancedEmerging
Source: National Sources, GS Global ECS Research.
Change in Real Retail Sales Since Jan 2007

Goldman Sachs Global Economics, Commodities and Strategy Research 2010 29
Chinese Export and Import Growth
Source: GS Global ECS Research
-40
-20
0
20
40
60
80
05 06 07 08 09 10
%yoy, 3MMA
Total Exports
Total Imports
Non-Commodity Imports
Goldman Sachs Global Economics, Commodities and Strategy Research 2010 30
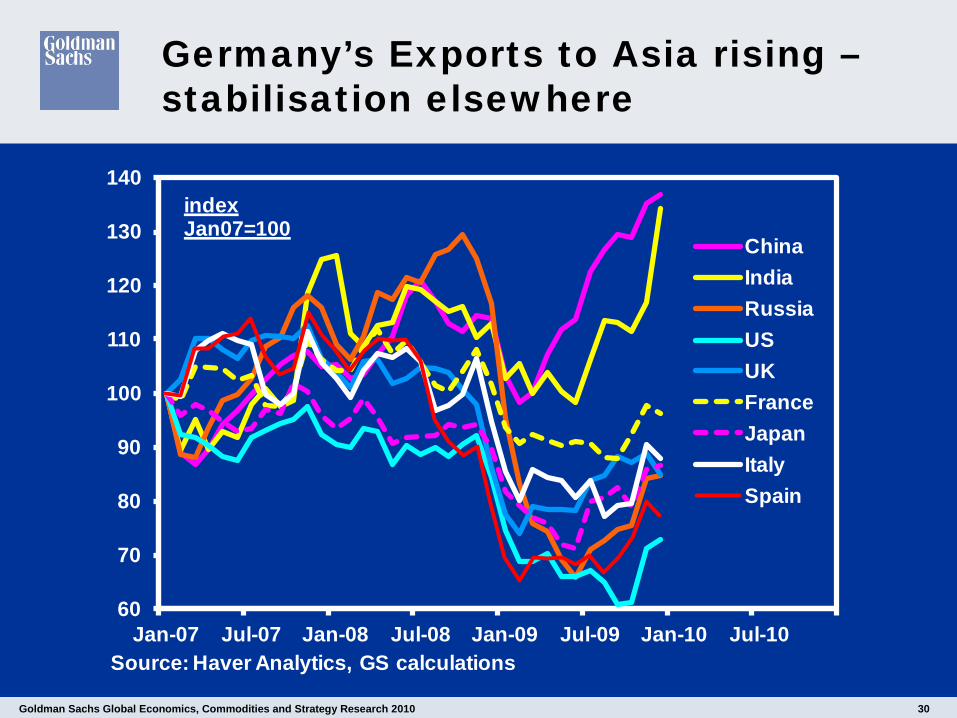
Germany’s Exports to Asia rising –stabilisation elsewhere
60
70
80
90
100
110
120
130
140
Jan-07 Jul-07 Jan-08 Jul-08 Jan-09 Jul-09 Jan-10 Jul-10
indexJan07=100
Source: Haver Analytics, GS calculations
ChinaIndiaRussiaUSUKFranceJapanItalySpain
Goldman Sachs Global Economics, Commodities and Strategy Research 2010 31
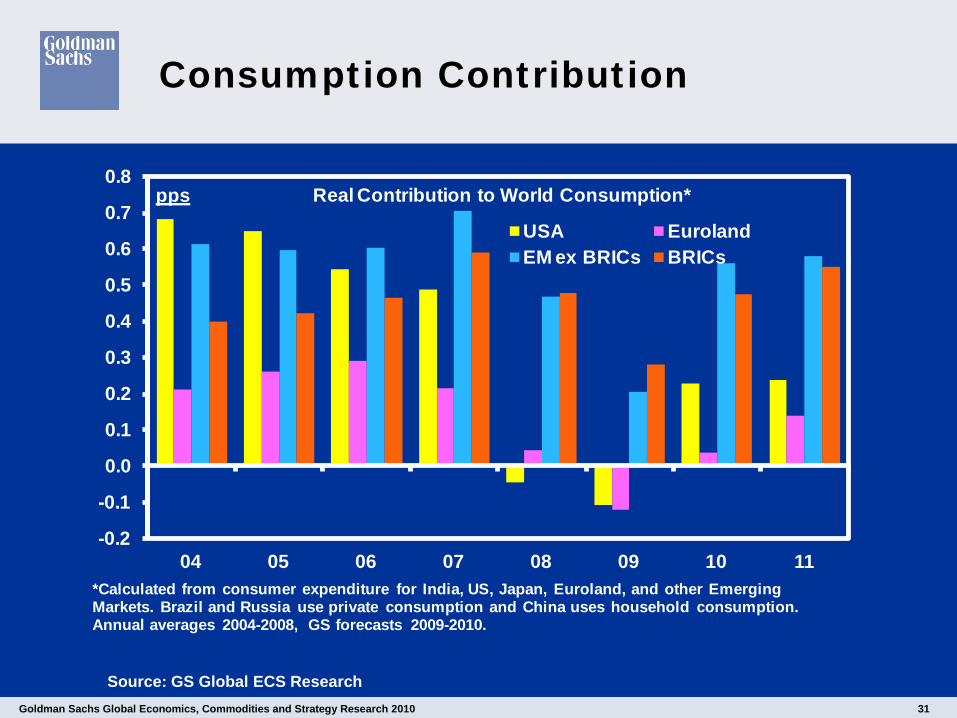
Consumption Contribution
Source: GS Global ECS Research
-0.2
-0.1
0.0
0.1
0.2
0.3
0.4
0.5
0.6
0.7
0.8
04 05 06 07 08 09 10 11
pps
USA EurolandEM ex BRICs BRICs
Real Contribution to World Consumption*
*Calculated from consumer expenditure for India, US, Japan, Euroland, and other Emerging Markets. Brazil and Russia use private consumption and China uses household consumption. Annual averages 2004-2008, GS forecasts 2009-2010.

Goldman Sachs Global Economics, Commodities and Strategy Research 2010 32
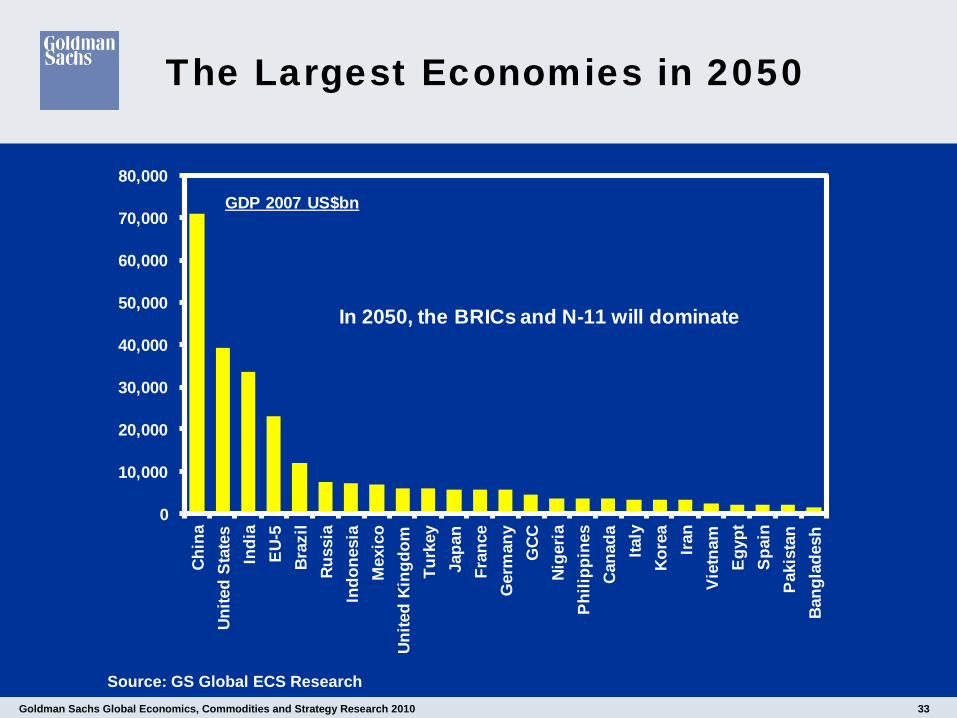
The Largest Economies in 2050
Source: GS Global ECS Research
0
10,000
20,000
30,000
40,000
50,000
60,000
70,000
80,000GDP 2007 US$bn
Goldman Sachs Global Economics, Commodities and Strategy Research 2010 33
The Largest Economies in 2050
Source: GS Global ECS Research
0
10,000
20,000
30,000
40,000
50,000
60,000
70,000
80,000Ch
ina
Unite
d St
ates
Indi
aEU
-5Br
azil
Russ
iaIn
done
sia
Mex
ico
Unite
d Ki
ngdo
mTu
rkey
Japa
nFr
ance
Ger
man
yG
CCNi
geria
Phili
ppin
esCa
nada
Italy
Kore
aIra
nVi
etna
mEg
ypt
Spai
nPa
kist
anBa
ngla
desh
GDP 2007 US$bn
In 2050, the BRICs and N-11 will dominate
Goldman Sachs Global Economics, Commodities and Strategy Research 2010 34
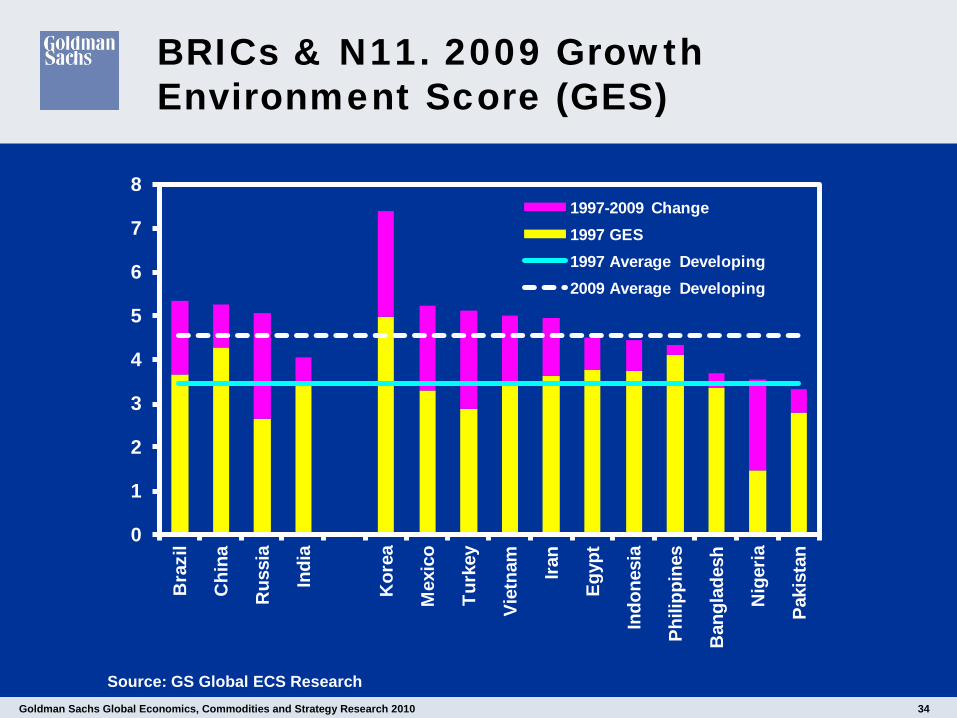
BRICs & N11. 2009 Growth Environment Score (GES)
Source: GS Global ECS Research
0
1
2
3
4
5
6
7
8B
razi
l
Chi
na
Rus
sia
Indi
a
Kor
ea
Mex
ico
Turk
ey
Viet
nam
Iran
Egyp
t
Indo
nesi
a
Phili
ppin
es
Ban
glad
esh
Nig
eria
Paki
stan
1997-2009 Change1997 GES1997 Average Developing2009 Average Developing

Goldman Sachs Global Economics, Commodities and Strategy Research 2010 35
GES Scores for BRICs vs Korea
Source: GS Global ECS Research
Brazil China India Russia KoreaTotal 5.3 5.2 4.0 5.1 7.4
Rule of Law 4.4 4.3 5.2 3.2 6.6Corruption 4.9 4.1 4.3 3.0 5.9Political Stability 4.8 4.4 3.0 3.8 5.8Lifeexp 7.5 7.6 5.9 6.5 8.8Inflation 8.6 8.5 7.9 6.5 8.8External Debt 8.5 9.1 8.4 7.6 ..GovtDebt 4.0 4.8 0.0 7.1 5.6GFCF 3.8 8.0 6.9 4.4 5.9Schooling 7.4 6.2 4.2 6.9 9.7Openness 2.2 4.0 3.1 2.2 5.0Computers 2.1 0.8 0.4 1.8 7.7Mobiles 6.4 4.2 2.1 10.0 9.0Internet 4.7 2.2 1.0 2.8 10.0

Goldman Sachs Global Economics, Commodities and Strategy Research 2010 36
Maplecroft Risk Indices
Dynamic Structural
BRICsBrazil 6.2 6.0Russia 2.5 5.8India 3.9 3.1China 5.4 3.5N11Bangladesh 3.1 1.7Egypt 4.9 4.3Indonesia 4.1 3.6Iran 1.9 4.0Mexico 6.5 6.1Nigeria 2.4 2.1Pakistan 2.2 1.3Philippines 3.8 4.3South Korea 8.3 8.9Turkey 6.0 5.9Vietnam 5.5 3.9USA 8.9 8.9Germany 9.2 9.2Luxembourg 9.7 9.5Source: Maplecroft

Goldman Sachs Global Economics, Commodities and Strategy Research 2010 37
Each Country’s Share of Euroland GDP
0
5
10
15
20
25
30G
erm
any
Fran
ce
Italy
Spai
n
Net
herla
nds
Bel
gium
Aus
tria
Gre
ece
Finl
and
Irela
nd
Portu
gal
Slov
akia
Luxe
mbo
urg
Slov
enia
Cyp
rus
Mal
ta
% Euroland GDP
Country's Share of Euroland GDP (2009)

Goldman Sachs Global Economics, Commodities and Strategy Research 2010 38
Cyclically Adjusted Budget Deficit (%GDP)**
Gross general government debt (% of GDP)***
Germany* -1.9 76.3France -7.0 77.8Italy -3.5 114.9Spain -10.0 55.2Netherlands -3.2 61.5Belgium -4.6 97.9Austria -3.3 67.6Greece -12.6 113.4Finland -0.5 39.6Ireland -9.6 64.5Portugal -6.6 76.6Slovakia -6.0 34.7*Countries listed according to their share of Euroland GDP.**Source: European Commission***Source: Eurostat, GS estimates.
Euroland Budget Deficit and Government Debt
Goldman Sachs Global Economics, Commodities and Strategy Research 2010 39
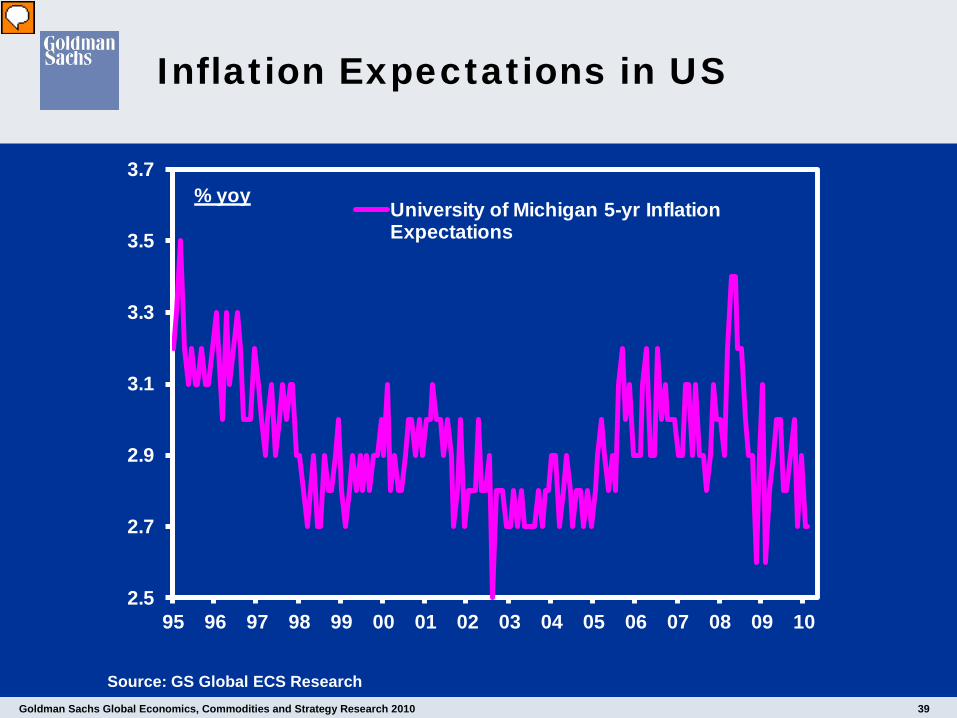
Inflation Expectations in US
Source: GS Global ECS Research
2.5
2.7
2.9
3.1
3.3
3.5
3.7
95 96 97 98 99 00 01 02 03 04 05 06 07 08 09 10
% yoyUniversity of Michigan 5-yr Inflation Expectations
Goldman Sachs Global Economics, Commodities and Strategy Research 2010 40
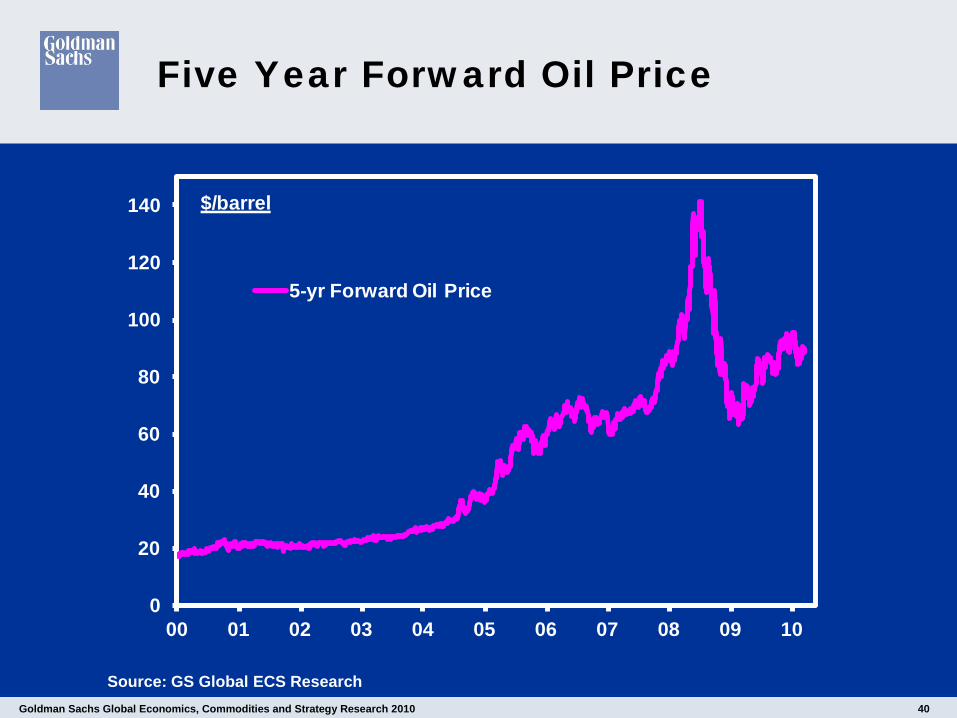
Five Year Forward Oil Price
Source: GS Global ECS Research
0
20
40
60
80
100
120
140
00 01 02 03 04 05 06 07 08 09 10
$/barrel
5-yr Forward Oil Price

Goldman Sachs Global Economics, Commodities and Strategy Research 2010 41
GSDEER Estimates for Major Countries
Spot* GSDEER Q1-2010
% Deviation from GSDEER
5-Yr Forecast
EUR/$ 1.33 1.22 10 1.20
$/Yen 91.90 105.52 15 108.12
£/$ 1.49 1.59 -6.6 1.55
$/CNY 6.82 6.84 0.3 5.85
$/CAD 1.03 1.15 11.8 1.16
AUD/$ 0.91 0.79 14.3 0.79
$/KRW 1138 1274 12.0 975
$ TWI 210.8 232.1 -10.1 -
*as of 24 March 2010
Source: GS Global ECS Research
Goldman Sachs Global Economics, Commodities and Strategy Research 2010 42
US BBoP vs Current Account
Source: GS Global ECS Research
-7.0
-6.0
-5.0
-4.0
-3.0
-2.0
-1.0
0.0
1.0
2.0
95 96 97 98 99 00 01 02 03 04 05 06 07 08 09 10
% of GDP4qtr avg
Current AccountBBoP
Goldman Sachs Global Economics, Commodities and Strategy Research 2010 43
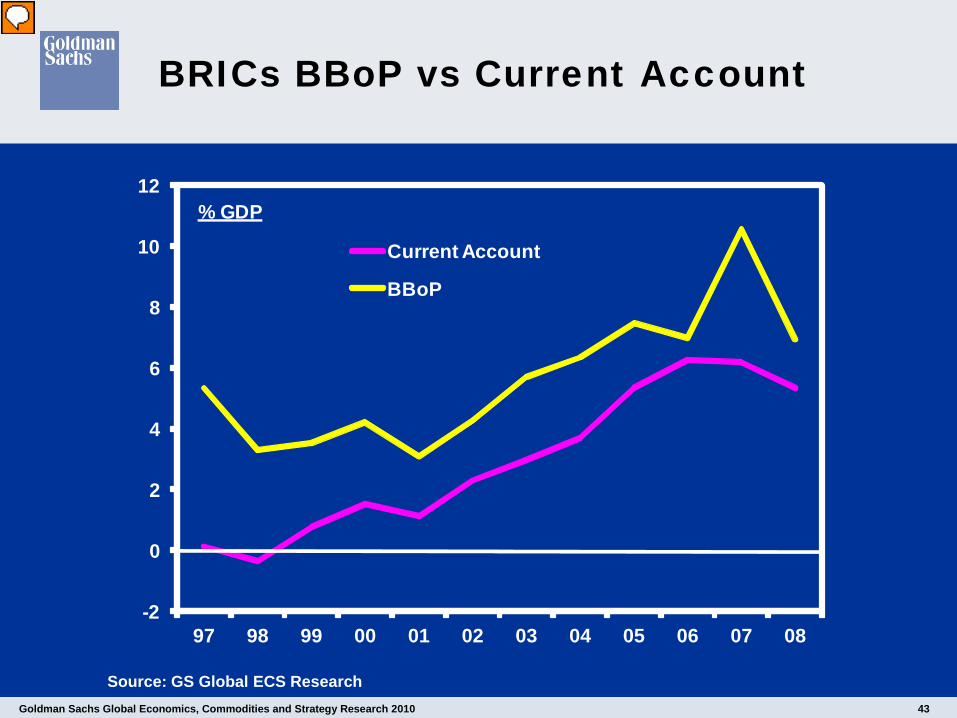
BRICs BBoP vs Current Account
-2
0
2
4
6
8
10
12
97 98 99 00 01 02 03 04 05 06 07 08
% GDP
Current Account
BBoP
Source: GS Global ECS Research

Goldman Sachs Global Economics, Commodities and Strategy Research 2010 44
Euroland: BBoP vs Current Account
Source: GS Global ECS Research
-5
-4
-3
-2
-1
0
1
2
3
4
5
98 99 00 01 02 03 04 05 06 07 08 09 10
BBoP
Current Account
% of GDP12-Month Mov. Avg.

Goldman Sachs Global Economics, Commodities and Strategy Research 2010 45
Japan: BBoP vs Current Account
Source: GS Global ECS Research
-10
-8
-6
-4
-2
0
2
4
6
8
95 96 97 98 99 00 01 02 03 04 05 06 07 08 09 10
% of GDP, 12MMA
BBoP
Current Account
Goldman Sachs Global Economics, Commodities and Strategy Research 2010 46
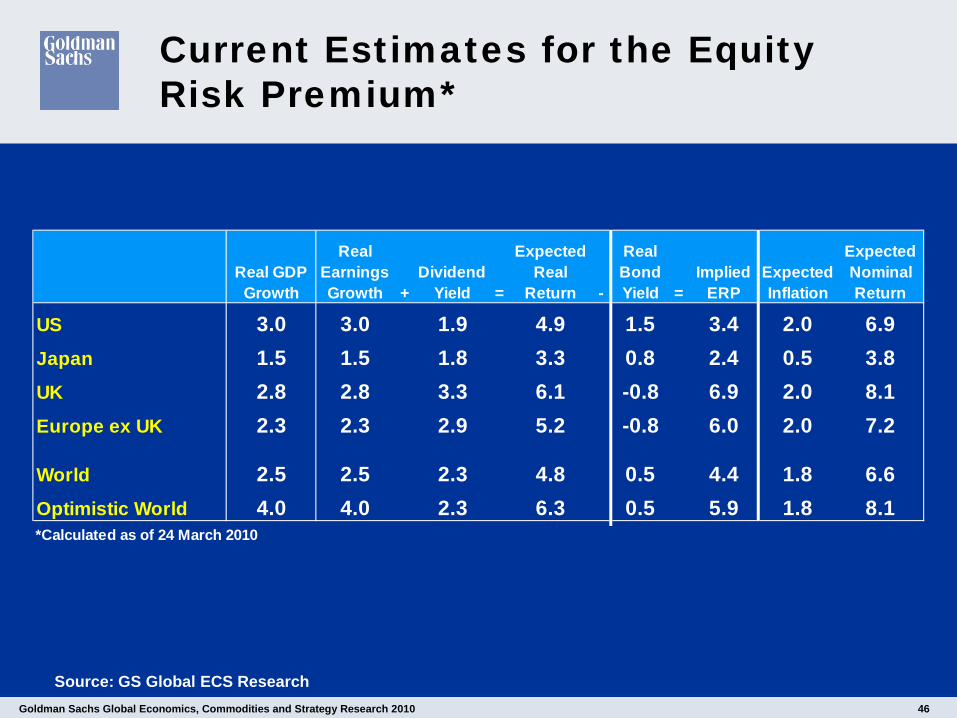
Current Estimates for the Equity Risk Premium*
Source: GS Global ECS Research
Real GDP Growth
Real Earnings Growth +
Dividend Yield =
Expected Real
Return -
Real Bond Yield =
Implied ERP
Expected Inflation
Expected Nominal Return
US 3.0 3.0 1.9 4.9 1.5 3.4 2.0 6.9Japan 1.5 1.5 1.8 3.3 0.8 2.4 0.5 3.8UK 2.8 2.8 3.3 6.1 -0.8 6.9 2.0 8.1Europe ex UK 2.3 2.3 2.9 5.2 -0.8 6.0 2.0 7.2
World 2.5 2.5 2.3 4.8 0.5 4.4 1.8 6.6Optimistic World 4.0 4.0 2.3 6.3 0.5 5.9 1.8 8.1*Calculated as of 24 March 2010

Goldman Sachs Global Economics, Commodities and Strategy Research 2010 47
Trend in Forward P/Es
Source: GS Global ECS Research
0
5
10
15
20
25
30
35
06 06 07 08 08 09 10
12mth forward PE
United States JapanChina IndiaEurope RussiaBrazil

Goldman Sachs Global Economics, Commodities and Strategy Research 2010 48
Interest Rate Forecasts
Source: GS Global ECS Research
3-month horizon 6-month horizon 12-month horizon
Current* Forward Forecast Forward Forecast Forward ForecastUS 3M 0.3 0.4 0.3 0.6 0.3 1.2 0.3
10Y 3.9 4.0 3.5 4.2 3.3 4.5 3.5Canada 3M 0.5 0.6 0.4 1.1 0.4 1.9 1.2
10Y 3.5 3.7 3.5 3.8 3.5 4.0 3.8Australia 3M 4.4 4.7 4.7 5.1 4.8 5.5 5.4
10Y 5.7 5.8 5.3 5.8 5.5 5.9 6.0Japan 3M 0.4 0.2 0.4 0.3 0.4 0.3 0.4
10Y 1.3 1.4 1.5 1.5 1.5 1.6 1.8Euroland 3M 0.6 0.7 0.8 0.9 1.0 1.4 1.5
10Y 3.1 3.1 3.3 3.2 3.3 3.3 3.4UK 3M 0.7 0.7 0.8 0.9 1.3 1.5 2.4
10Y 4.0 4.1 4.0 4.2 4.0 4.5 4.3Sweden 3M 0.5 0.7 0.5 1.1 1.0 1.8 2.5
10Y 3.0 3.1 3.3 3.2 3.4 3.4 3.8Switzerland 3M 0.3 0.3 0.3 0.4 0.5 1.2 1.0
10Y 1.8 1.9 2.0 1.9 2.1 2.1 2.3Close 24 March 10

Goldman Sachs Global Economics, Commodities and Strategy Research 2010 49
Foreign Exchange Forecasts
3-months 6-months 12-months
Current* Forward Forecast Forward Forecast Forward Forecast
EUR/$ 1.33 1.33 1.45 1.33 1.45 1.33 1.35$/¥ 92.1 92.0 92.0 92.0 94.0 91.6 98.0EUR/¥ 122.8 122.8 133.4 122.7 136.3 122.2 132.3EUR/CHF 1.43 1.43 1.44 1.43 1.42 1.42 1.40CHF/¥ 85.91 85.93 92.64 85.94 95.99 85.83 94.50$/CHF 1.07 1.07 0.99 1.07 0.98 1.07 1.04EUR/£ 0.90 0.90 0.87 0.90 0.84 0.90 0.84£/$ 1.49 1.49 1.67 1.49 1.73 1.49 1.61£/¥ 137.1 137.0 153.3 136.8 162.3 136.2 157.5£/CHF 1.60 1.59 1.66 1.59 1.69 1.59 1.67EUR/NOK 8.04 8.08 8.00 8.11 7.90 8.18 7.80EUR/SEK 9.69 9.69 9.60 9.69 9.40 9.71 9.00A$/$ 0.91 0.90 0.95 0.89 0.95 0.87 0.90NZ$/$ 0.70 0.70 0.74 0.69 0.74 0.68 0.70$/C$ 1.02 1.02 1.00 1.03 1.00 1.03 1.08$/CNY 6.83 6.80 6.83 6.76 6.83 6.68 6.49
* Close 24 March 10
Source: GS Global ECS Research

Goldman Sachs Global Economics, Commodities and Strategy Research 2010 50
Top Trades for 2010
Source: GS Global ECS Research
Trade Entry Level Target
1. Short S&P 500 Dec10/Dec11 Forward Starting Variance Swap 28.20 21.00
2. Long Russian Equities (RDXUSD) 1645.9 2050
3. Long GBP/NZD 2.29 2.60
4. Pay UK Rates vs. Receiving AUD Rates via 1-yr Forward 2-yr Swaps -268.5bp -150bp
5. Pay 2y Rates in Turkey 8.77% 12.00%
6. Long Credit Protection on Spain, Short Credit Protection on Ireland 70.2bp 20bp
7. Long 'Growth' FX Current 103.5 111.8
8. Long PLN/JPY 32.1 37.5
Goldman Sachs Global Economics, Commodities and Strategy Research 2010 51
Disclaimer
I, Jim O’Neill hereby certify that all of the views expressed in this report accurately reflect personal views, which have not been influenced by considerations of the firm’s business or client relationships.
Global product; distributing entities
The Global Investment Research Division of Goldman Sachs produces and distributes research products for clients of Goldman Sachs, and pursuant to certain contractual arrangements, on a global basis. Analysts based inGoldman Sachs off ices around the w orld produce equity research on industries and companies, and research on macroeconomics, currencies, commodities and portfolio strategy. This research is disseminated in Australiaby Goldman Sachs JBWere Pty Ltd (ABN 21 006 797 897) on behalf of Goldman Sachs; in Canada by Goldman Sachs & Co. regarding Canadian equities and by Goldman Sachs & Co. (all other research); in Hong Kong byGoldman Sachs (Asia) L.L.C.; in India by Goldman Sachs (India) Securities Private Ltd.; in Japan by Goldman Sachs Japan Co., Ltd.; in the Republic of Korea by Goldman Sachs (Asia) L.L.C., Seoul Branch; in New Zealand byGoldman Sachs JBWere (NZ) Limited on behalf of Goldman Sachs; in Russia by OOO Goldman Sachs; in Singapore by Goldman Sachs (Singapore) Pte. (Company Number: 198602165W); and in the United States of Americaby Goldman Sachs & Co. Goldman Sachs International has approved this research in connection w ith its distribution in the United Kingdom and European Union.
European Union: Goldman Sachs International, authorised and regulated by the Financial Services Authority, has approved this research in connection w ith its distribution in the European Union and United Kingdom;Goldman, Sachs & Co. oHG, regulated by the Bundesanstalt für Finanzdienstleistungsaufsicht, may also distribute research in Germany.
General disclosuresThis research is for our clients only. Other than disclosures relating to Goldman Sachs, this research is based on current public information that w e consider reliable, but w e do not represent it is accurate or complete, and itshould not be relied on as such. We seek to update our research as appropriate, but various regulations may prevent us from doing so. Other than certain industry reports published on a periodic basis, the large majority ofreports are published at irregular intervals as appropriate in the analyst's judgment.
Goldman Sachs conducts a global full-service, integrated investment banking, investment management, and brokerage business. We have investment banking and other business relationships w ith a substantial percentage ofthe companies covered by our Global Investment Research Division. SIPC: Goldman, Sachs & Co., the United States broker dealer, is a member of SIPC (http://w w w .sipc.org).
Our salespeople, traders, and other professionals may provide oral or w ritten market commentary or trading strategies to our clients and our proprietary trading desks that reflect opinions that are contrary to the opinionsexpressed in this research. Our asset management area, our proprietary trading desks and investing businesses may make investment decisions that are inconsistent w ith the recommendations or view s expressed in thisresearch.
We and our aff iliates, off icers, directors, and employees, excluding equity and credit analysts, w ill from time to time have long or short positions in, act as principal in, and buy or sell, the securities or derivatives, if any,referred to in this research. This research is not an offer to sell or the solicitation of an offer to buy any security in any jurisdiction w here such an offer or solicitation w ould be illegal. It does not constitute a personal recommendation or take into accountthe particular investment objectives, f inancial situations, or needs of individual clients. Clients should consider w hether any advice or recommendation in this research is suitable for their particular circumstances and, ifappropriate, seek professional advice, including tax advice. The price and value of investments referred to in this research and the income from them may fluctuate. Past performance is not a guide to future performance,future returns are not guaranteed, and a loss of original capital may occur. Fluctuations in exchange rates could have adverse effects on the value or price of, or income derived from, certain investments.
Certain transactions, including those involving futures, options, and other derivatives, give rise to substantial risk and are not suitable for all investors. Investors should review current options disclosure documents w hich areavailable from Goldman Sachs sales representatives or at http://w w w .theocc.com/publications/risks/riskchap1.jsp. Transactions cost may be signif icant in option strategies calling for multiple purchase and sales of optionssuch as spreads. Supporting documentation w ill be supplied upon request.
All research reports are disseminated and available to all clients simultaneously through electronic publication to our internal client w ebsites. Not all research content is redistributed to our clients or available to third-partyaggregators, nor is Goldman Sachs responsible for the redistribution of our research by third party aggregators. For all research available on a particular stock, please contact your sales representative or go tow w w .360.gs.com
Disclosure information is also available at http://w w w .gs.com/research/hedge.html or from Research Compliance, 200 West Street, New York, NY 10282.
No part of this material may be (i) copied, photocopied or duplicated in any form by any means or (ii) redistributed without the prior written consent of The Goldman Sachs Group, Inc.
© Copyright 2010, The Goldman Sachs Group, Inc. All Rights Reserved.